


Exploring Suitable Urban Plant Structures for Carbon-Sink Capacities


Abstract
1. Introduction
2. Literature Review
3. Methodology
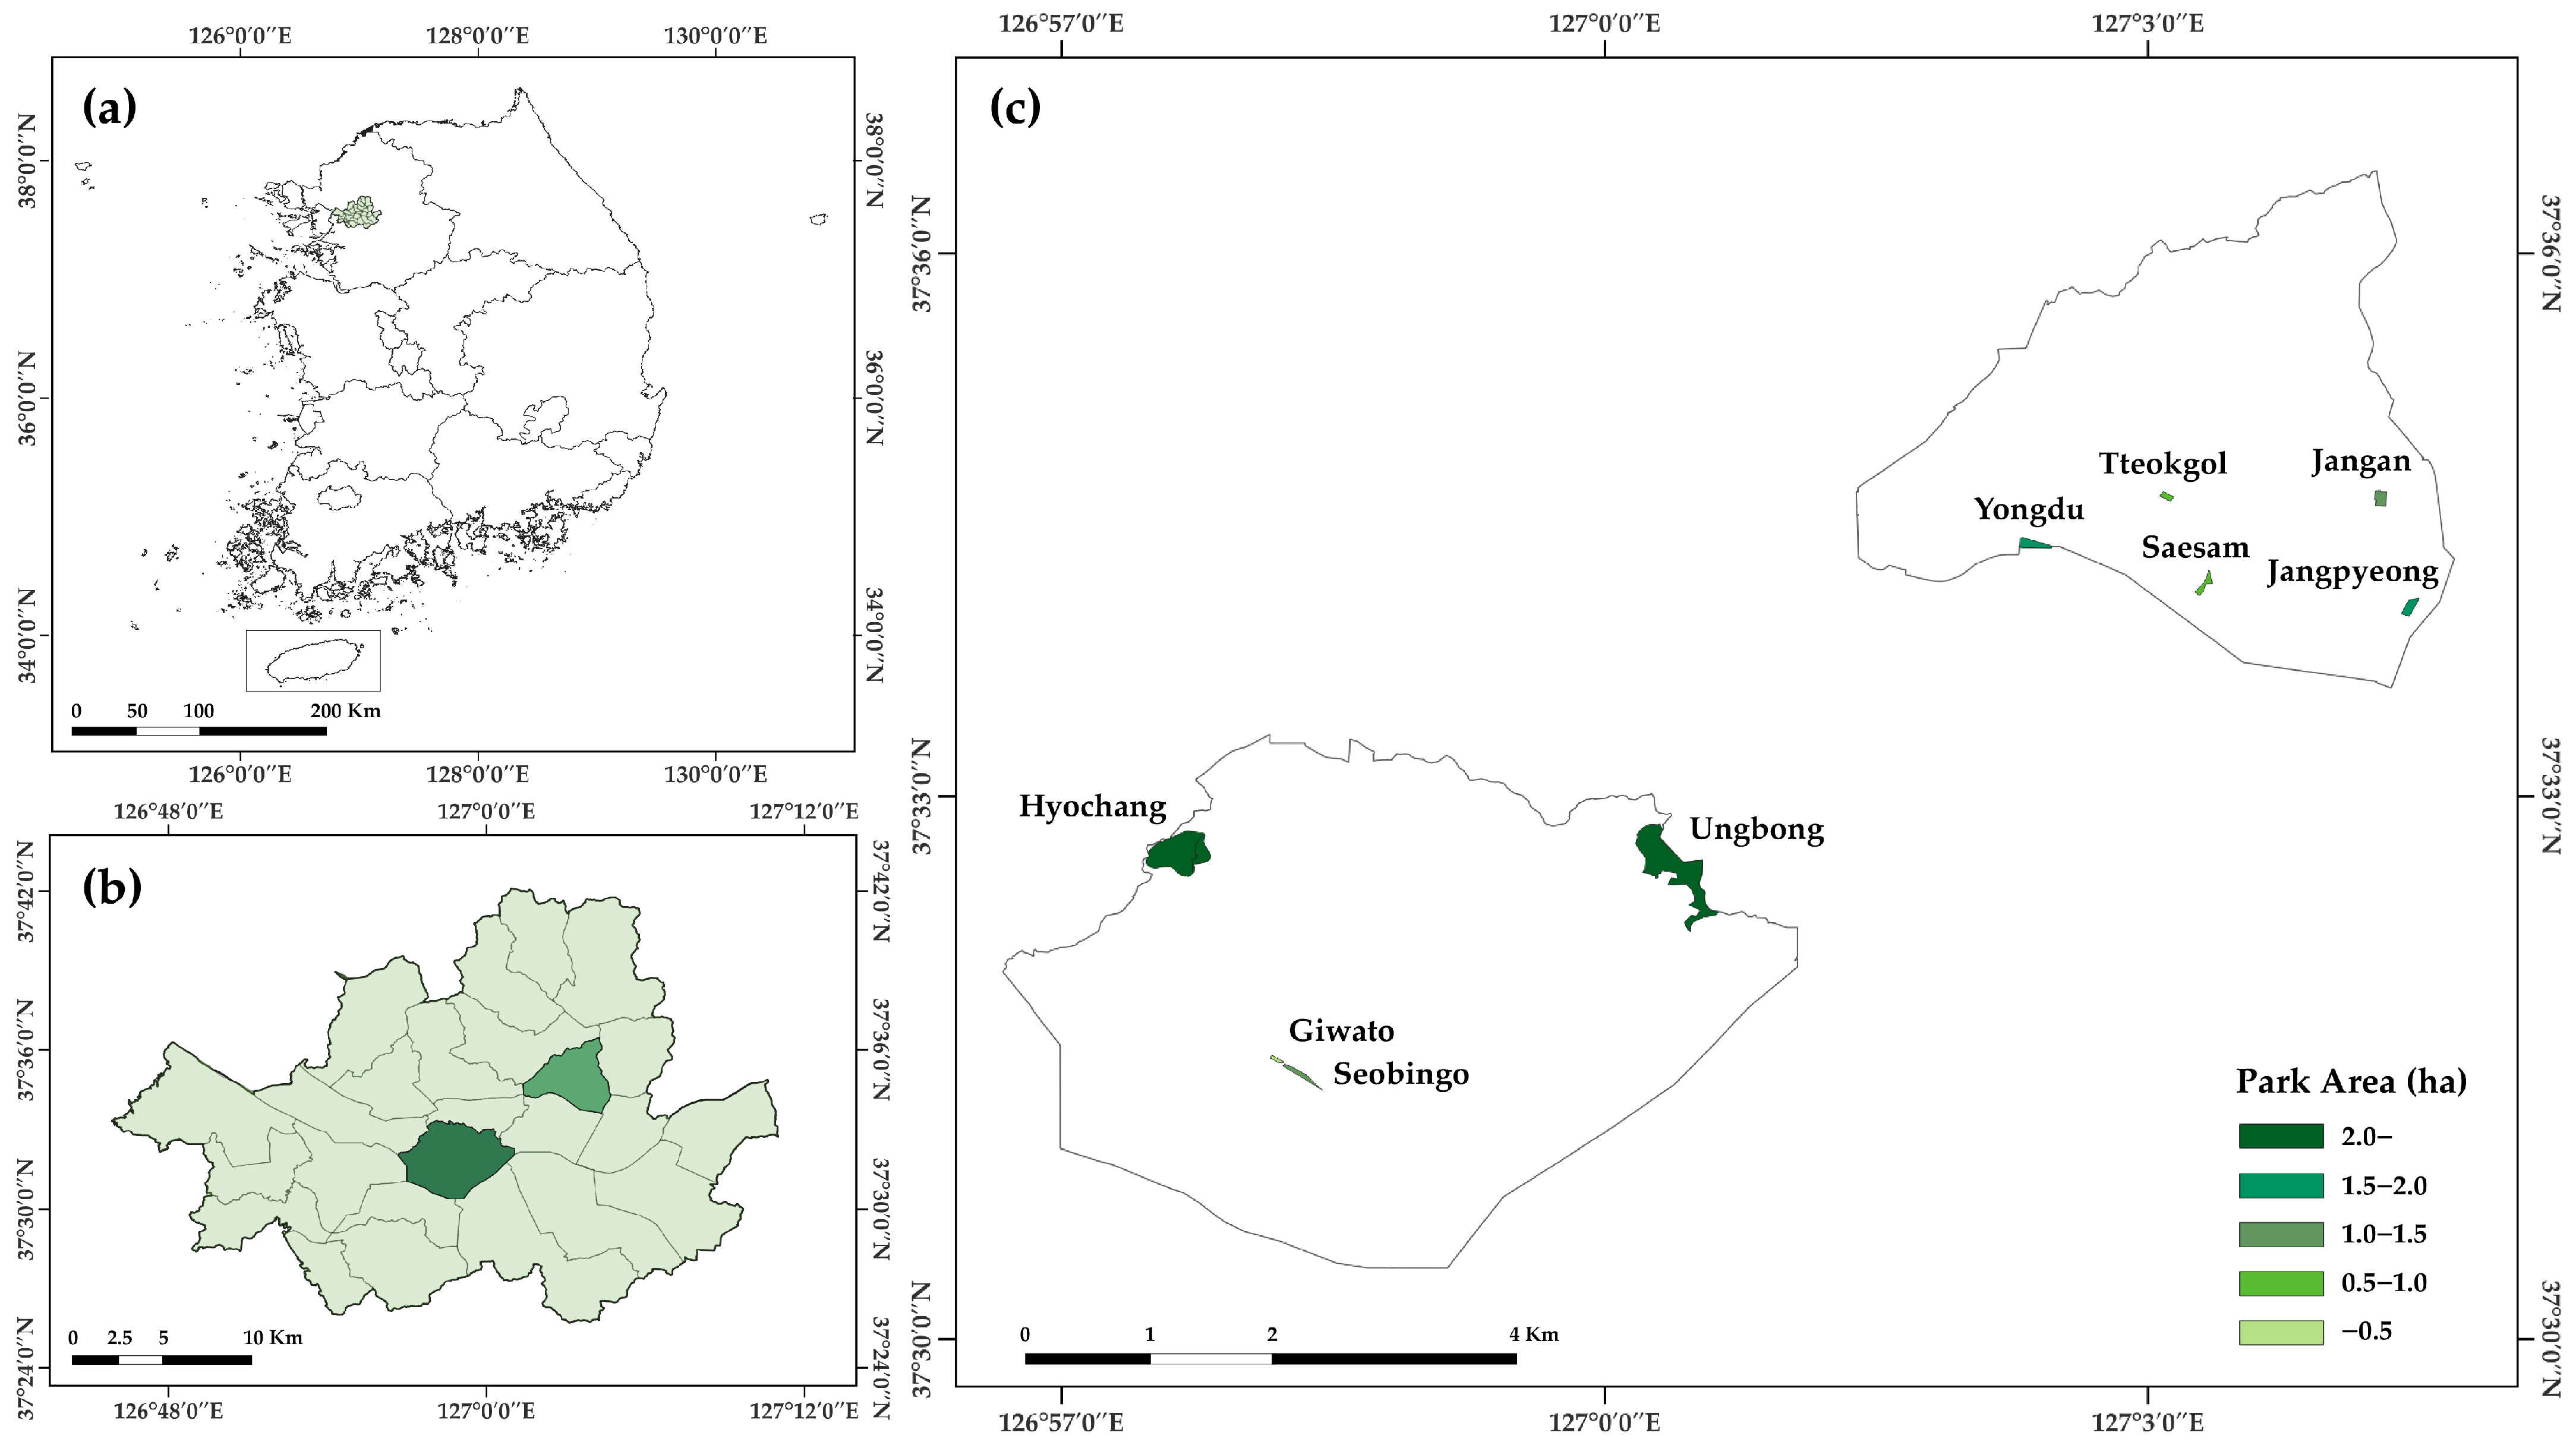
3.1. Study Areas
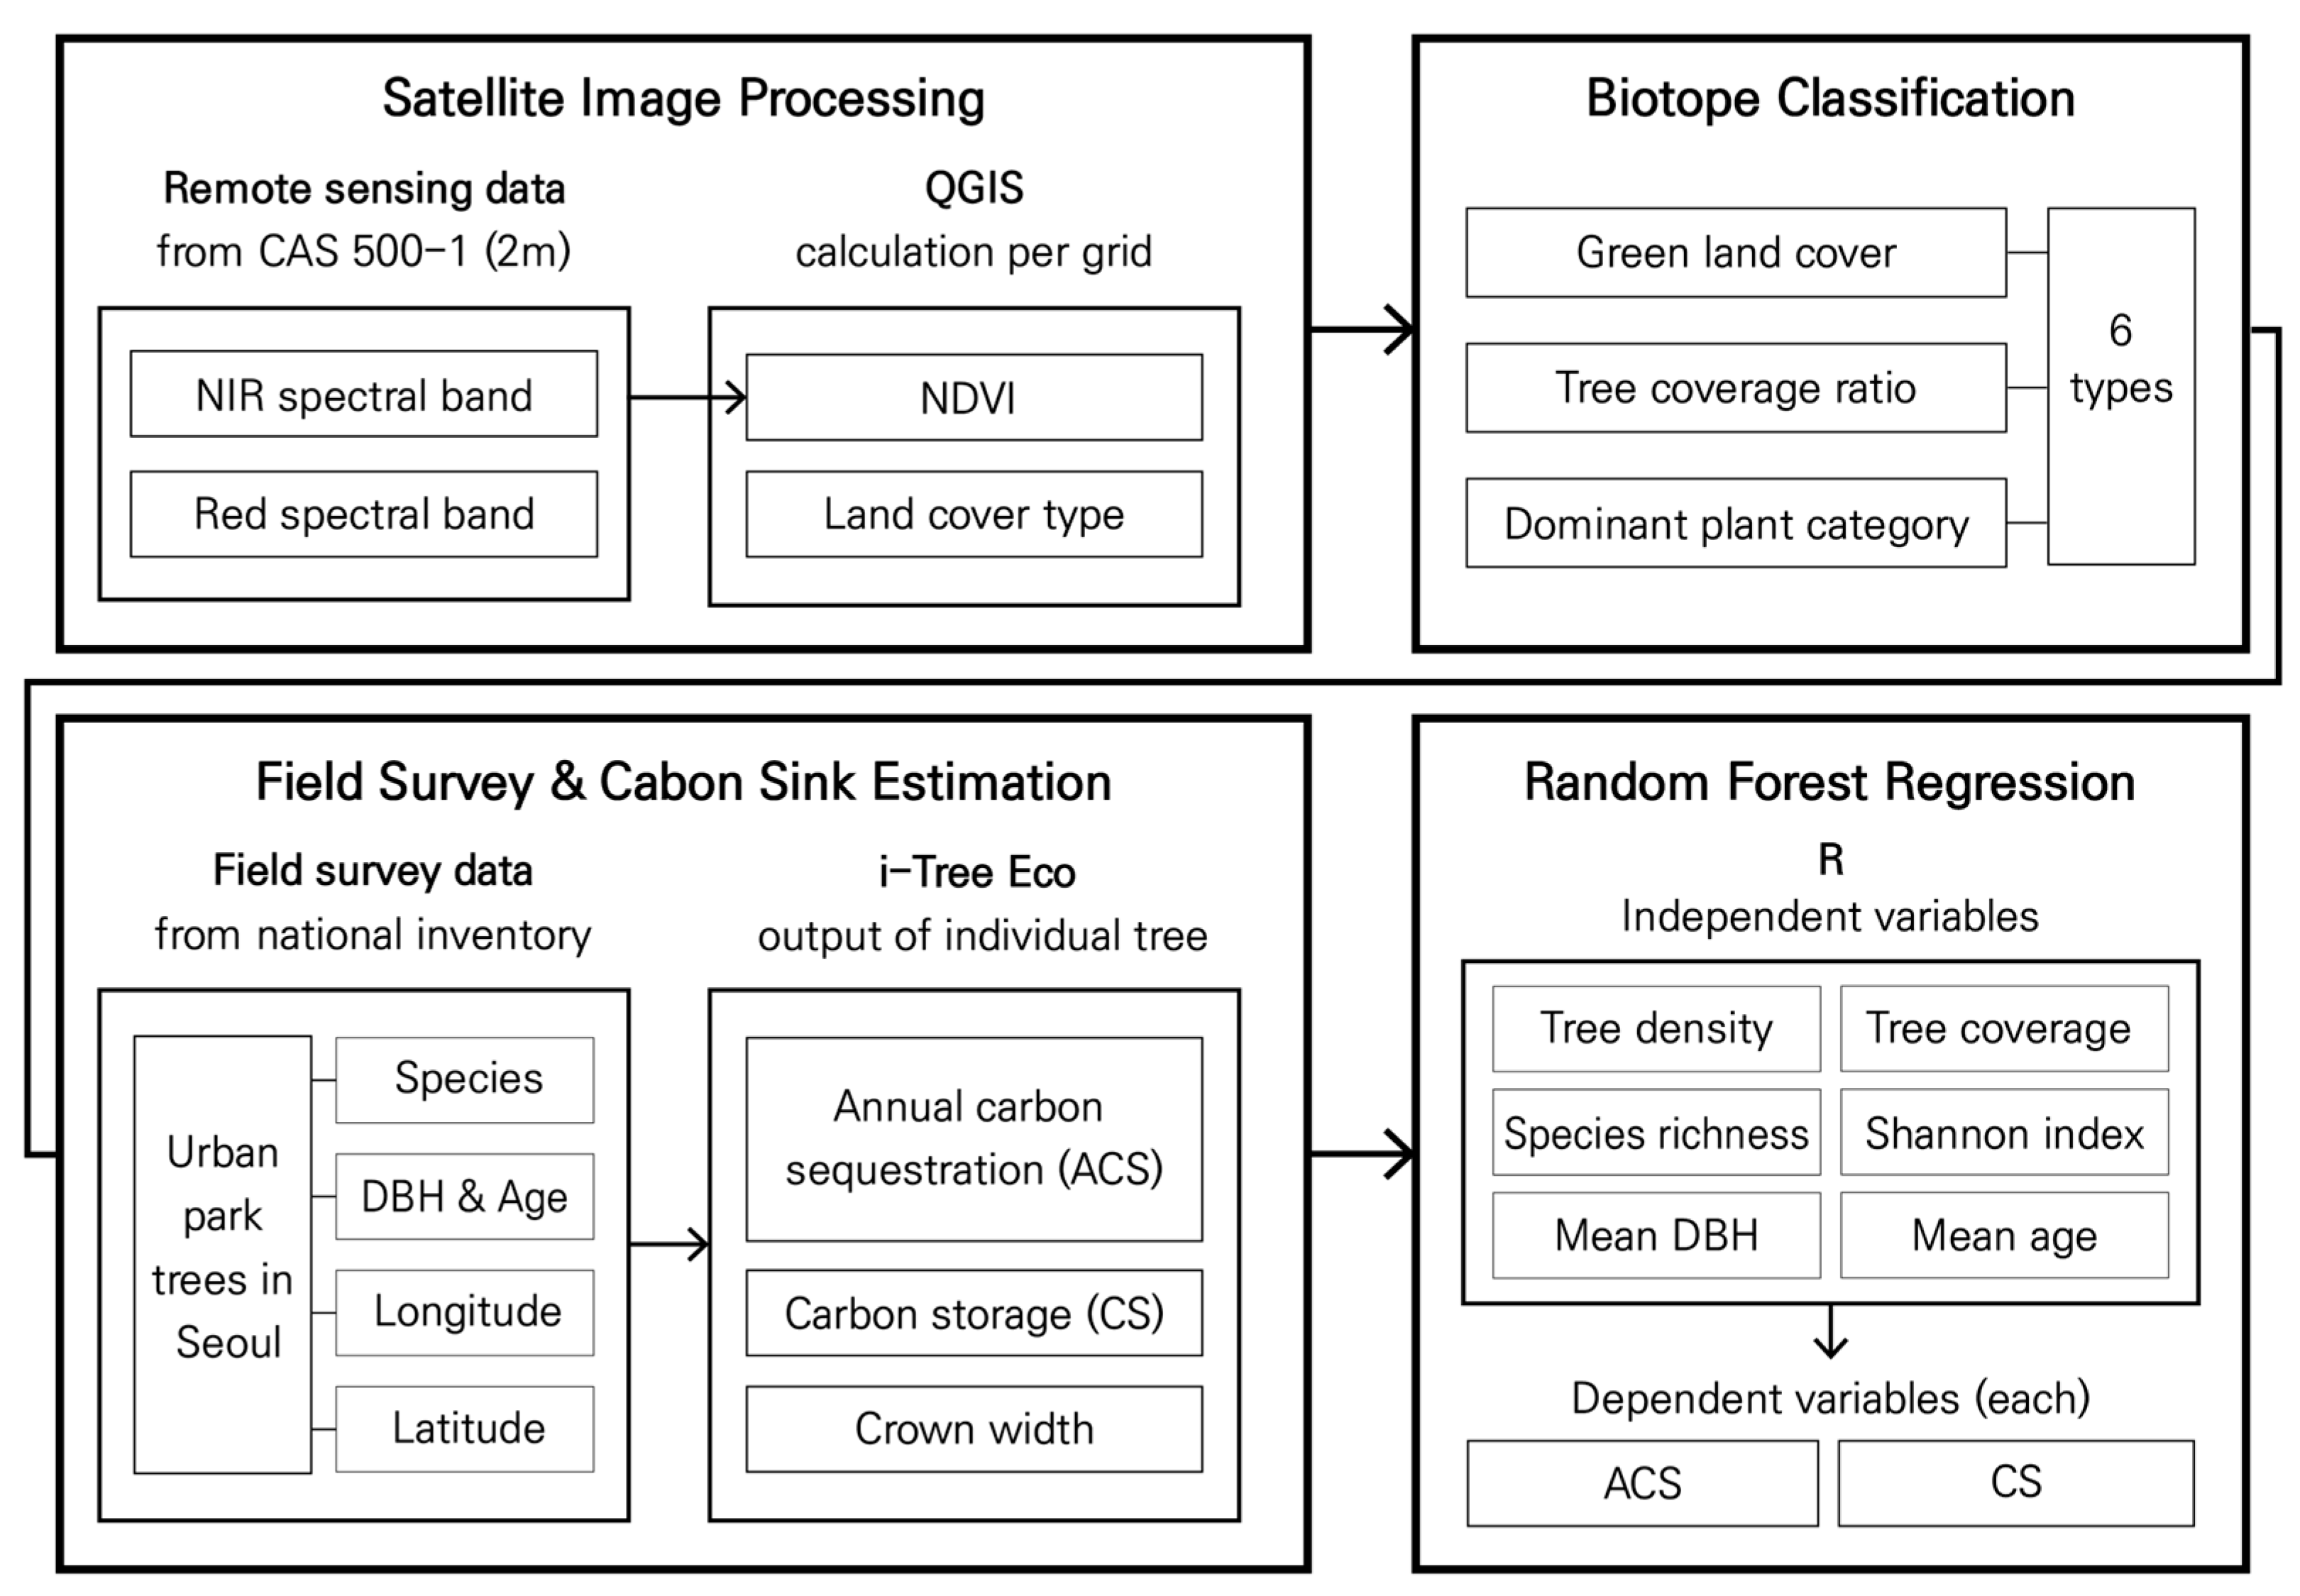
3.2. Satellite Image Processing and Biotope Classification
3.3. Field Survey and Carbon-Sink Estimation
3.4. Random Forest Regression
3.5. Research Workflow
4. Results
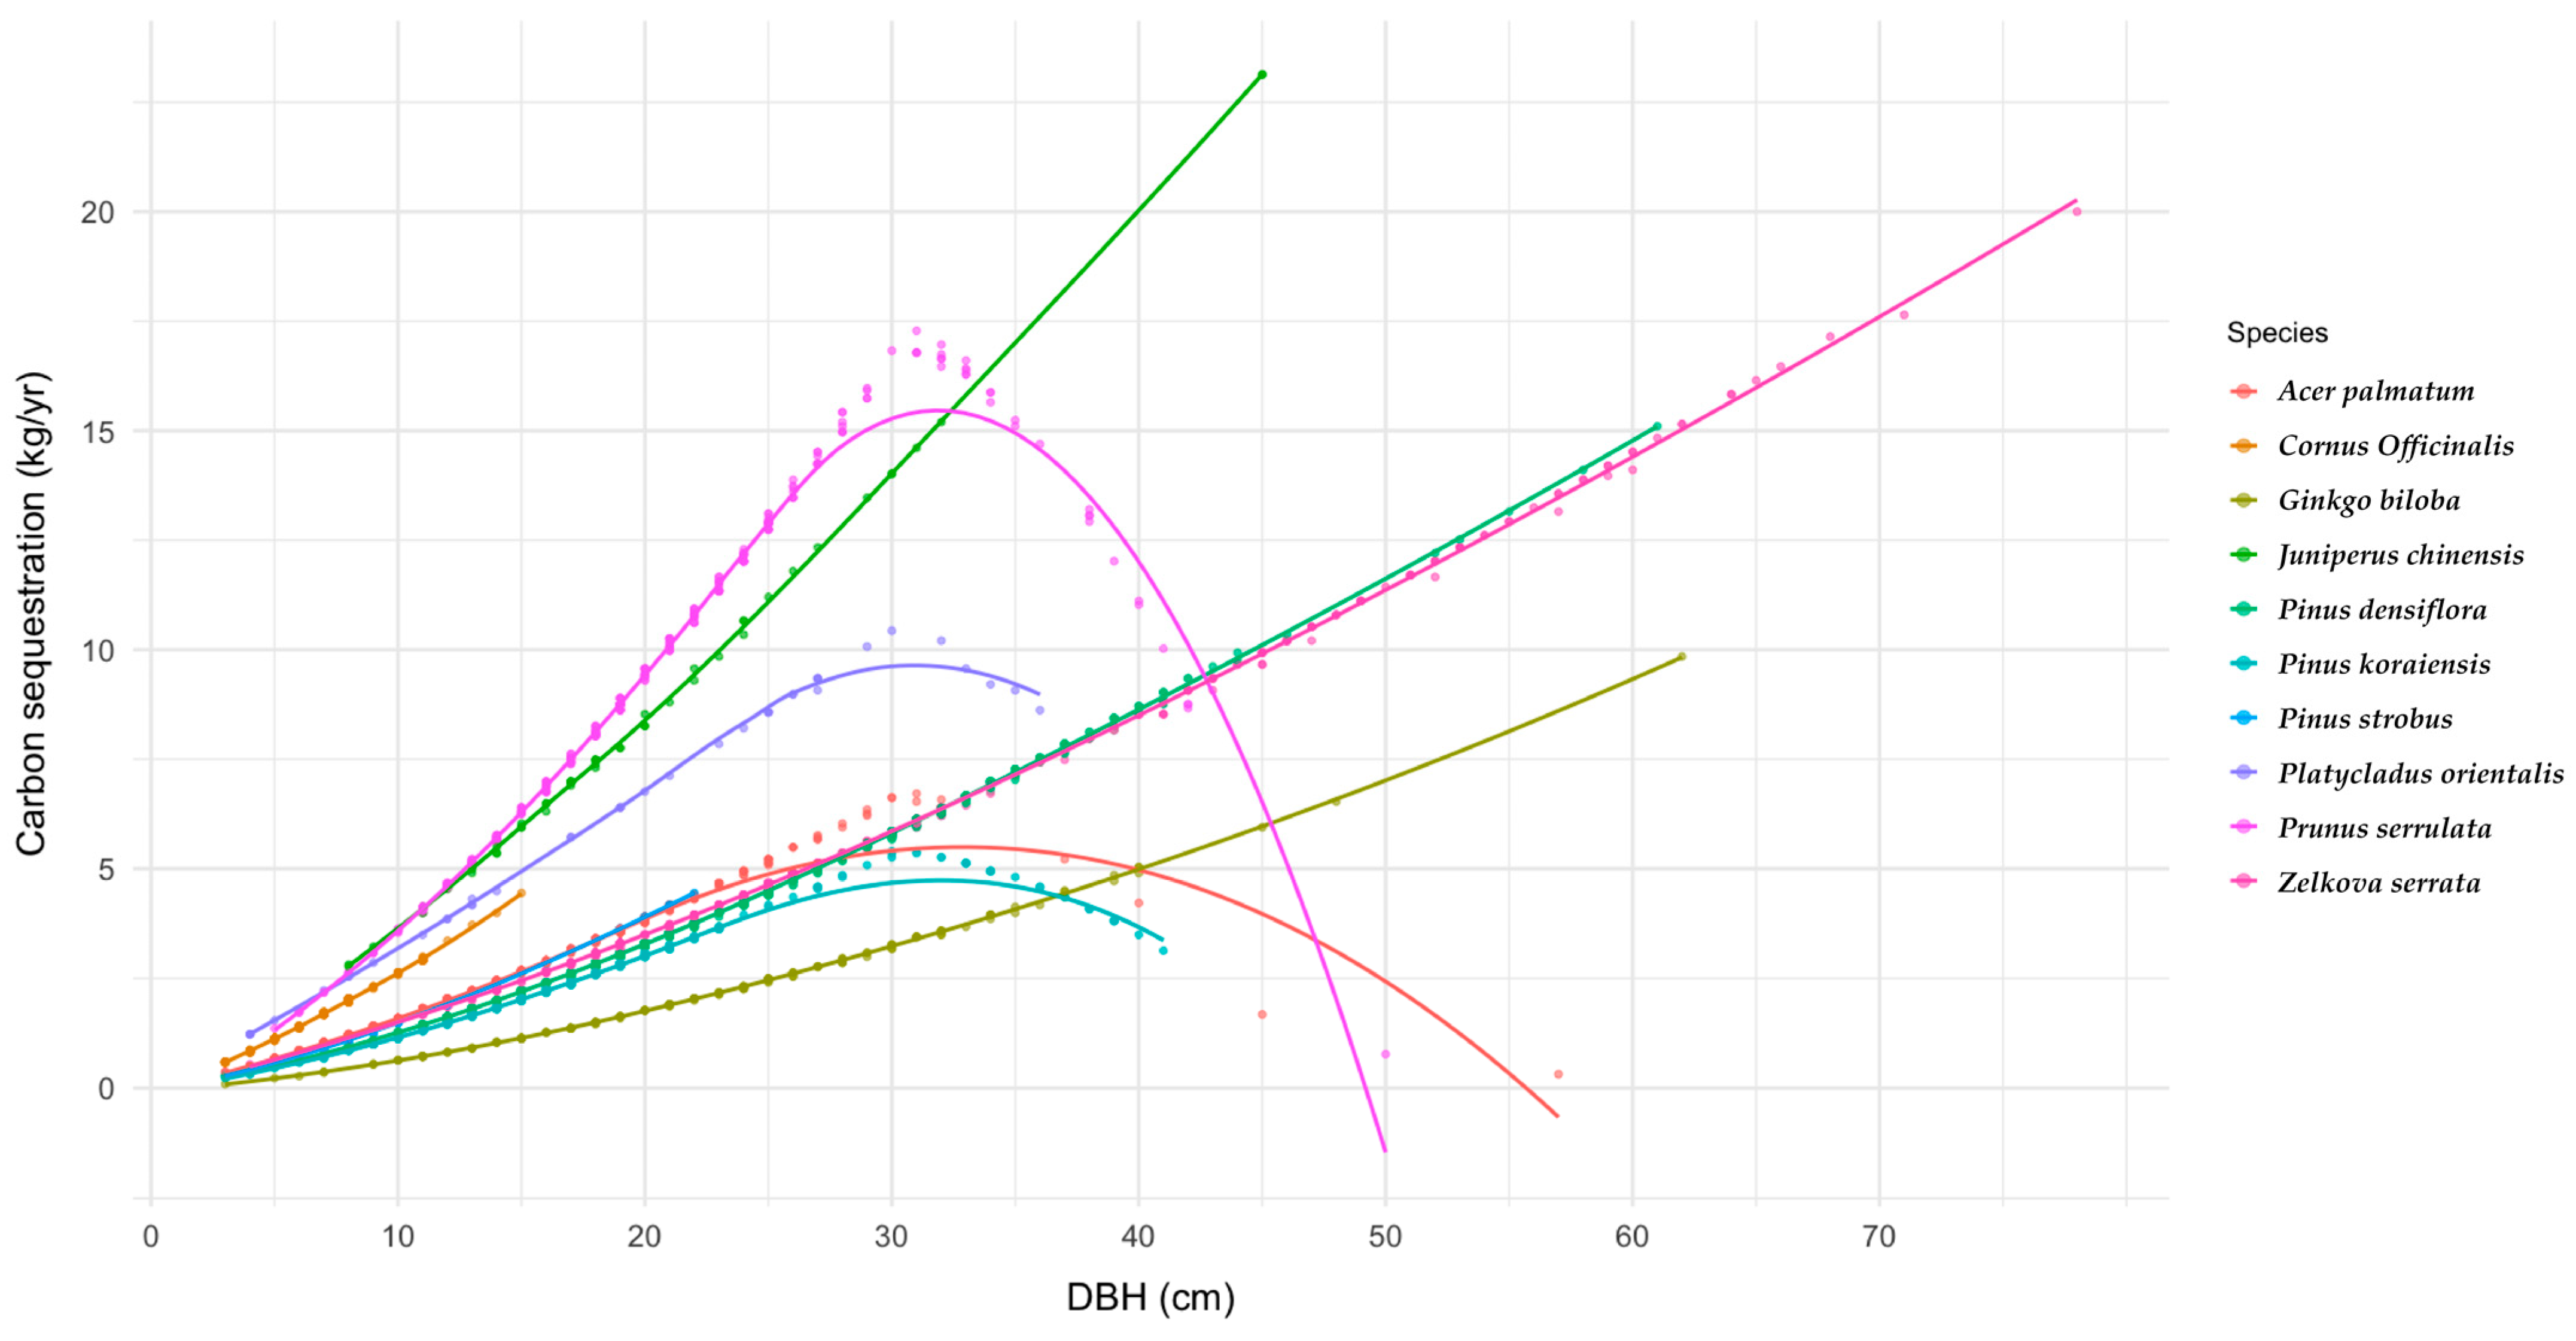
4.1. Carbon-Sink Efficiency by Species
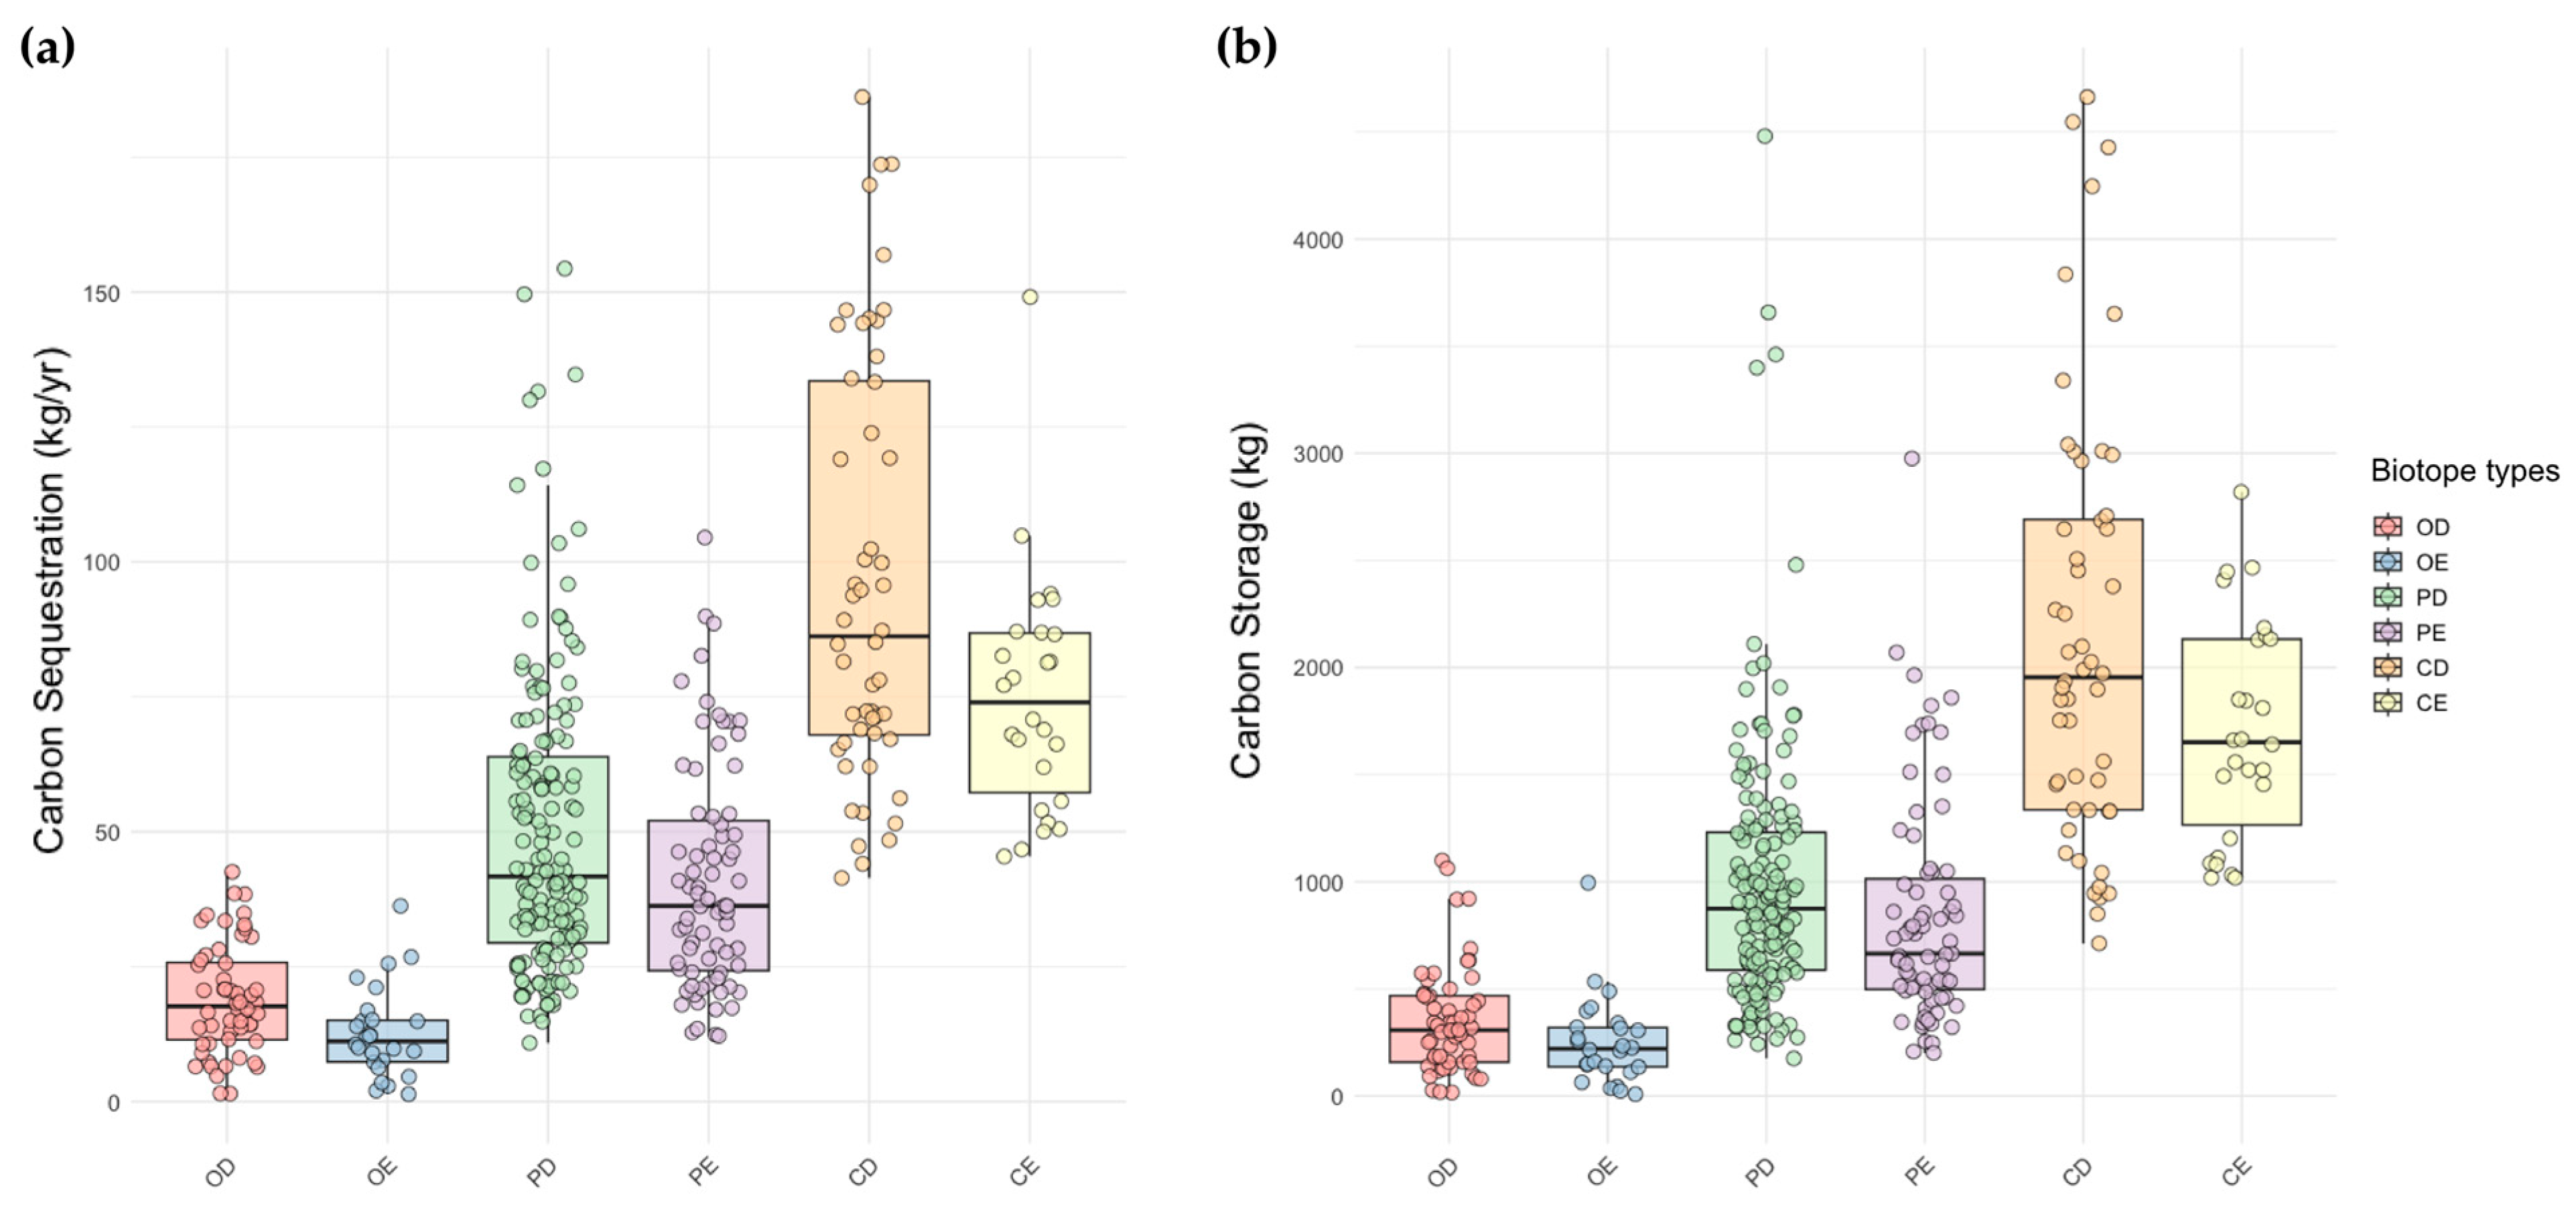
4.2. Carbon-Sink Efficiency by Biotopes
5. Discussion
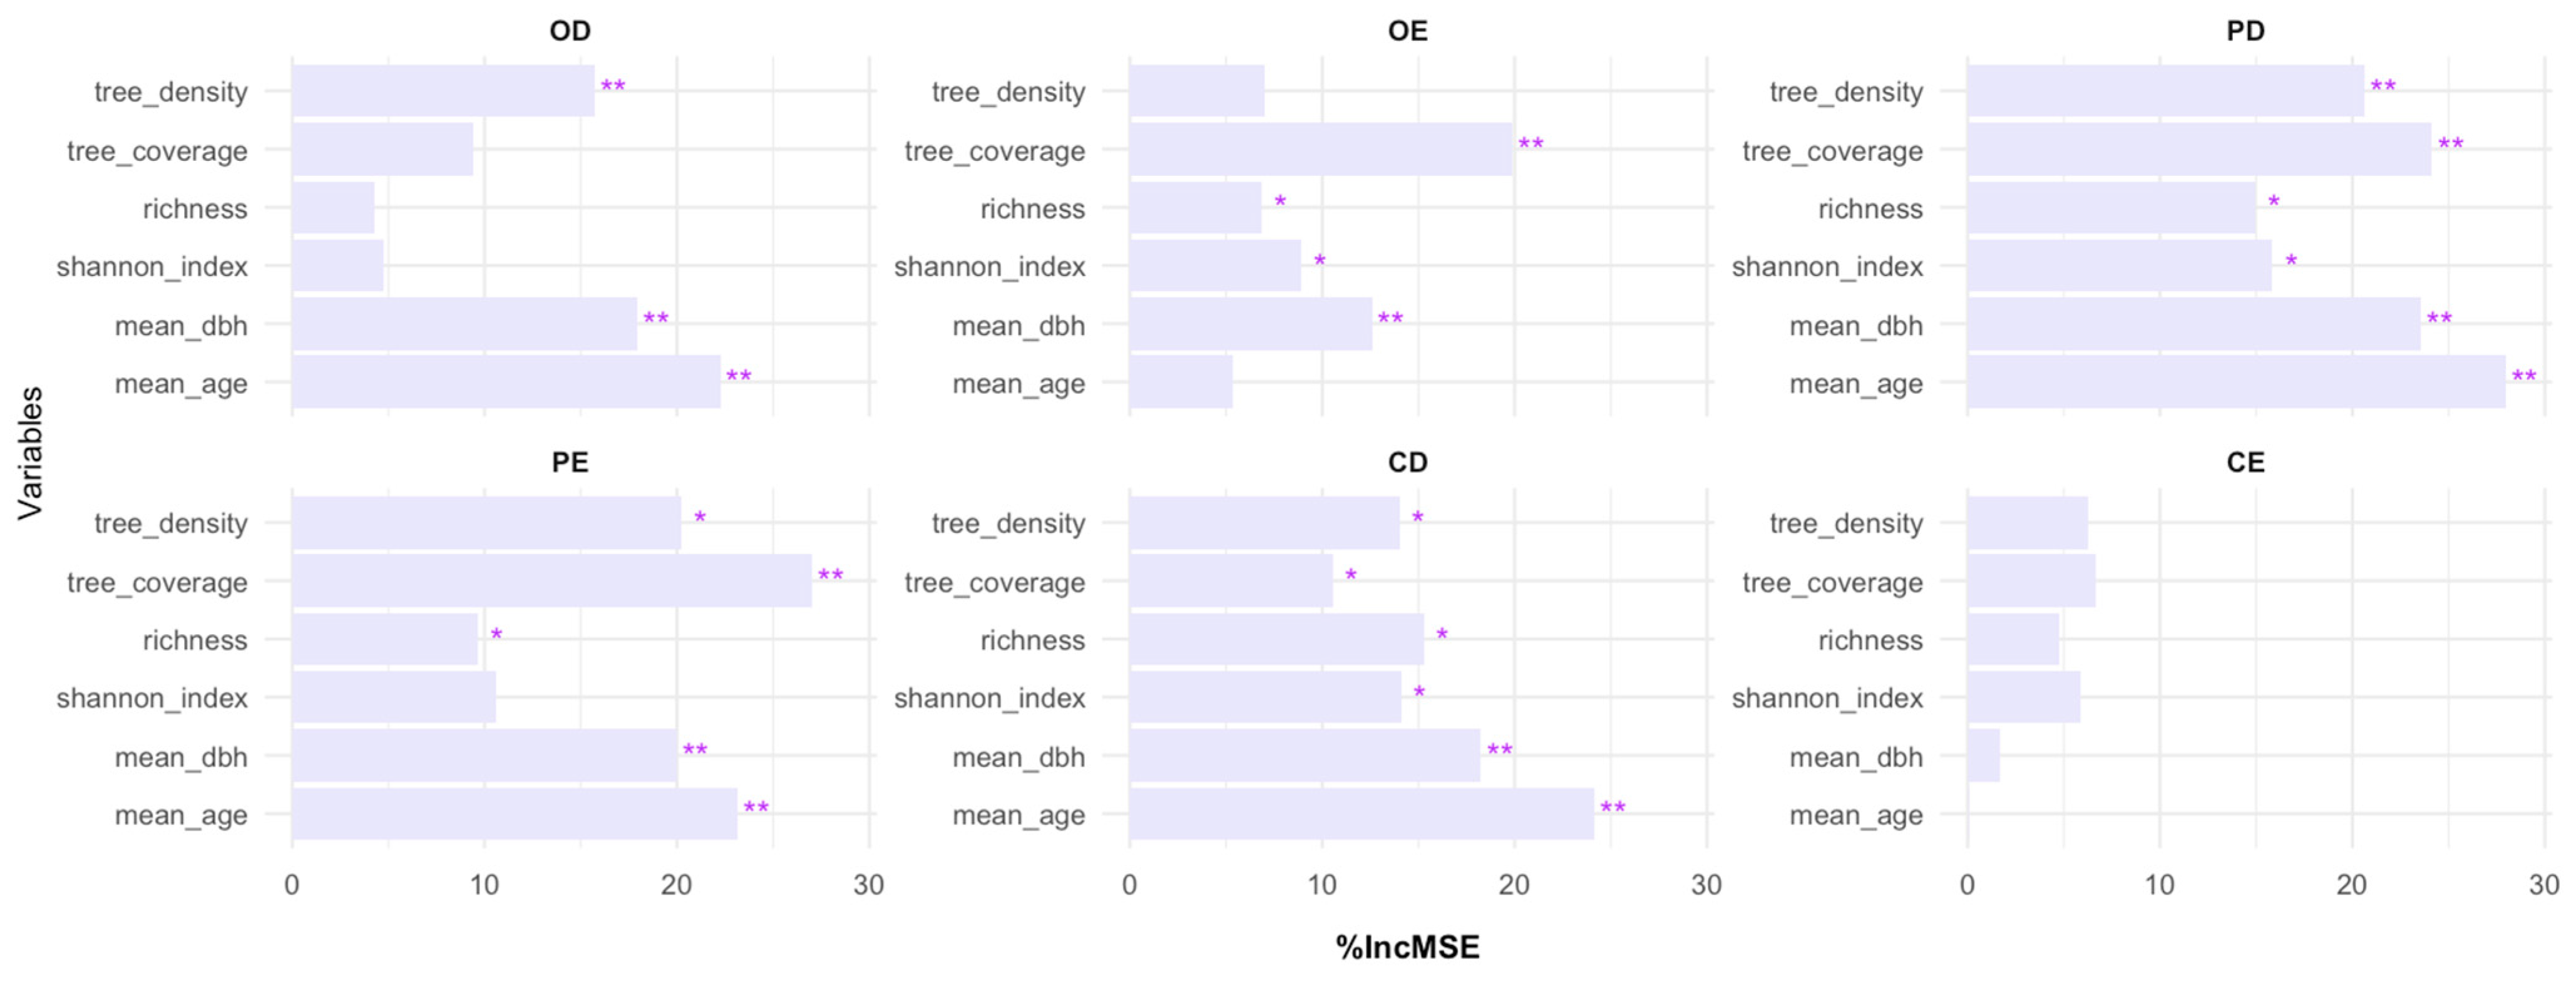
5.1. Hierarchy of Environmental Variables
5.2. Tree Species Selection Based on ACS
5.3. Planting Design Strategy for Carbon Efficiency
5.4. UGS Carbon-Sink Estimation Method
5.5. Limitations of the Study
6. Conclusions
Author Contributions
Funding
Data Availability Statement
Acknowledgments
Conflicts of Interest
Abbreviations
| ACS | Annual Carbon Sequestration |
| CE | Closed and Evergreen-Dominant Space |
| CD | Closed and Deciduous-Dominant Space |
| CS | Carbon Storage |
| DBH | Diameter at Breast Height |
| NDVI | Normalized Difference Vegetation Index |
| OE | Open and Evergreen-Dominant Space |
| OD | Open and Deciduous-Dominant Space |
| PD | Partly Open and Deciduous-Dominant Space |
| PE | Partly Open and Evergreen-Dominant Space |
| RF | Random Forest |
| RFR | Random Forest Regression |
| UGS | Urban Green Space |
References
- Nowak, D.J.; Crane, D.E. Carbon Storage and Sequestration by Urban Trees in the USA. Environ. Pollut. 2002, 116, 381–389. [Google Scholar] [CrossRef] [PubMed]
- Tigges, J.; Churkina, G.; Lakes, T. Modeling Above-Ground Carbon Storage: A Remote Sensing Approach to Derive Individual Tree Species Information in Urban Settings. Urban Ecosyst. 2017, 20, 97–111. [Google Scholar] [CrossRef]
- Liu, C.; Li, X. Carbon Storage and Sequestration by Urban Forests in Shenyang, China. Urban For. Urban Green. 2012, 11, 121–128. [Google Scholar] [CrossRef]
- Lal, R.; Follett, R.F.; Kimble, J.M. Achieving Soil Carbon Sequestration in the United States: A Challenge to the Policy Makers. Soil. Sci. 2003, 168, 827. [Google Scholar] [CrossRef]
- Golubiewski, N.E. Urbanization Increases Grassland Carbon Pools: Effects of Landscaping in Colorado’s Front Range. Ecol. Appl. 2006, 16, 555–571. [Google Scholar] [CrossRef]
- Martin, R.M.; Wigand, C.; Oczkowski, A.; Hanson, A.; Balogh, S.; Branoff, B.; Santos, E.; Huertas, E. Greenhouse Gas Fluxes of Mangrove Soils and Adjacent Coastal Waters in an Urban, Subtropical Estuary. Wetlands 2020, 40, 1469–1480. [Google Scholar] [CrossRef]
- Zhang, W.; Ma, J.; Liu, M.; Li, C. Impact of Urban Expansion on Forest Carbon Sequestration: A Study in Northeastern China. Pol. J. Environ. Stud. 2019, 29, 451–461. [Google Scholar] [CrossRef]
- Othman, R. The Influence of Urban Park Green Spaces, Plant Material Specifications and Spatial Design Organization and Pattern towards Carbon Sequestration Rate. Appl. Ecol. Env. Res. 2019, 17, 8079–8088. [Google Scholar] [CrossRef]
- Zhao, D.; Cai, J.; Xu, Y.; Liu, Y.; Yao, M. Carbon Sinks in Urban Public Green Spaces under Carbon Neutrality: A Bibliometric Analysis and Systematic Literature Review. Urban For. Urban Green. 2023, 86, 128037. [Google Scholar] [CrossRef]
- Nowak, D.J.; Greenfield, E.J.; Hoehn, R.E.; Lapoint, E. Carbon Storage and Sequestration by Trees in Urban and Community Areas of the United States. Environ. Pollut. 2013, 178, 229–236. [Google Scholar] [CrossRef]
- Lee, J.; Yoon, T.K.; Han, S.; Kim, S.; Yi, M.J.; Park, G.S.; Kim, C.; Son, Y.M.; Kim, R.; Son, Y. Estimating the Carbon Dynamics of South Korean Forests from 1954 to 2012. Biogeosciences 2014, 11, 4637–4650. [Google Scholar] [CrossRef]
- Lee, S.; Lee, S.; Shin, J.; Yim, J.; Kang, J. Assessing the Carbon Storage of Soil and Litter from National Forest Inventory Data in South Korea. Forests 2020, 11, 1318. [Google Scholar] [CrossRef]
- Jo, H.-K.; Ahn, T.-W. Carbon Storage and Uptake by Deciduous Tree Species for Urban Landscape. J. Korean Inst. Landsc. Archit. 2012, 40, 160–168. [Google Scholar] [CrossRef]
- Jo, H.-K.; Kim, J.-Y.; Park, H.-M. Carbon Storage and Uptake by Evergreen Trees for Urban Landscape—For Pinus densiflora and Pinus koraiensis. Korean J. Environ. Ecol. 2013, 27, 571–578. [Google Scholar] [CrossRef]
- Jo, H.-K.; Kim, J.-Y.; Park, H.-M. Carbon Reduction Effects of Urban Landscape Trees and Development of Quantitative Models—For Five Native Species. J. Korean Inst. Landsc. Archit. 2014, 42, 13–21. [Google Scholar] [CrossRef]
- Zhao, D.; Cai, J.; Shen, S.; Liu, Q.; Lan, Y. Nature-Based Solutions: Assessing the Carbon Sink Potential and Influencing Factors of Urban Park Plant Communities in the Temperate Monsoon Climate Zone. Sci. Total Environ. 2024, 950, 175347. [Google Scholar] [CrossRef]
- Dong, L.; Wang, Y.; Ai, L.; Cheng, X.; Luo, Y. A Review of Research Methods for Accounting Urban Green Space Carbon Sinks and Exploration of New Approaches. Front. Environ. Sci. 2024, 12, 1350185. [Google Scholar] [CrossRef]
- Li, N.; Deng, L.; Yan, G.; Cao, M.; Cui, Y. Estimation for Refined Carbon Storage of Urban Green Space and Minimum Spatial Mapping Scale in a Plain City of China. Remote Sens. 2024, 16, 217. [Google Scholar] [CrossRef]
- Shin, Y.; Kim, S.; Lee, S.-W.; An, K. Identifying the Planning Priorities for Green Infrastructure within Urban Environments Using Analytic Hierarchy Process. Sustainability 2020, 12, 5468. [Google Scholar] [CrossRef]
- Simon, S.M.; Glaum, P.; Valdovinos, F.S. Interpreting Random Forest Analysis of Ecological Models to Move from Prediction to Explanation. Sci. Rep. 2023, 13, 3881. [Google Scholar] [CrossRef]
- Bae, J.; Ryu, Y. Land Use and Land Cover Changes Explain Spatial and Temporal Variations of the Soil Organic Carbon Stocks in a Constructed Urban Park. Landsc. Urban Plan. 2015, 136, 57–67. [Google Scholar] [CrossRef]
- Forman, R.T.T. Land Mosaics: The Ecology of Landscapes and Regions; Cambridge University Press: Cambridge, UK, 1995; ISBN 978-0-521-47980-6. [Google Scholar]
- Freeman, C.; Buck, O. Development of an Ecological Mapping Methodology for Urban Areas in New Zealand. Landsc. Urban Plan. 2003, 63, 161–173. [Google Scholar] [CrossRef]
- Qiu, L.; Gao, T.; Gunnarsson, A.; Hammer, M.; von Bothmer, R. A Methodological Study of Biotope Mapping in Nature Conservation. Urban For. Urban Green. 2010, 9, 161–166. [Google Scholar] [CrossRef]
- Wang, Y.; Chang, Q.; Li, X. Promoting Sustainable Carbon Sequestration of Plants in Urban Greenspace by Planting Design: A Case Study in Parks of Beijing. Urban For. Urban Green. 2021, 64, 127291. [Google Scholar] [CrossRef]
- Breiman, L. Random Forests. Mach. Learn. 2001, 45, 5–32. [Google Scholar] [CrossRef]
- Shi, Y.; Xu, L.; Zhou, Y.; Ji, B.; Zhou, G.; Fang, H.; Yin, J.; Deng, X. Quantifying Driving Factors of Vegetation Carbon Stocks of Moso Bamboo Forests Using Machine Learning Algorithm Combined with Structural Equation Model. For. Ecol. Manag. 2018, 429, 406–413. [Google Scholar] [CrossRef]
- Cutler, D.R.; Edwards, T.C.; Beard, K.H.; Cutler, A.; Hess, K.T.; Gibson, J.; Lawler, J.J. Random Forests for Classification in Ecology. Ecology 2007, 88, 2783–2792. [Google Scholar] [CrossRef]
- Degenhardt, F.; Seifert, S.; Szymczak, S. Evaluation of Variable Selection Methods for Random Forests and Omics Data Sets. Brief. Bioinform. 2019, 20, 492–503. [Google Scholar] [CrossRef]
- Wang, Z.; Zhao, Z.; Wang, C. Random Forest Analysis of Factors Affecting Urban Carbon Emissions in Cities within the Yangtze River Economic Belt. PLoS ONE 2021, 16, e0252337. [Google Scholar] [CrossRef]
- Zhang, G.; Du, C.; Ge, S. Key Factors Affecting Carbon-Saving Intensity and Efficiency Based on the Structure of Green Space. Land 2024, 13, 1297. [Google Scholar] [CrossRef]
- Ye, L.; Zhao, S.; Yang, H.; Chuai, X.; Zhai, L. Urban Land Use Simulation and Carbon-Related Driving Factors Analysis Based on RF-CA in Shanghai, China. Ecol. Indic. 2024, 166, 112555. [Google Scholar] [CrossRef]
- Encyclopedia of Korean Culture. Available online: https://encykorea.aks.ac.kr (accessed on 22 March 2025).
- Kim, W.-J.; Woo, S.-Y.; Yoon, C.-R.; Kwak, M.-J. Evaluation of the Reduction Effect of Particulte Matter Through Green Infrastructure and Its Expansion Plans; The Seoul Institute: Seoul, Republic of Korea, 2019. [Google Scholar]
- Lee, S.-W.; Hwang, S.-J.; Lee, S.-B.; Hwang, H.-S.; Sung, H.-C. Landscape Ecological Approach to the Relationships of Land Use Patterns in Watersheds to Water Quality Characteristics. Landsc. Urban Plan. 2009, 92, 80–89. [Google Scholar] [CrossRef]
- Hutyra, L.R.; Yoon, B.; Alberti, M. Terrestrial Carbon Stocks across a Gradient of Urbanization: A Study of the Seattle, WA Region. Glob. Change Biol. 2011, 17, 783–797. [Google Scholar] [CrossRef]
- Sun, Y.; Xie, S.; Zhao, S. Valuing Urban Green Spaces in Mitigating Climate Change: A City-Wide Estimate of Aboveground Carbon Stored in Urban Green Spaces of China’s Capital. Glob. Change Biol. 2019, 25, 1717–1732. [Google Scholar] [CrossRef]
- National Geographic Information Institute. Available online: https://map.ngii.go.kr (accessed on 14 February 2025).
- Tucker, C.J. Red and Photographic Infrared Linear Combinations for Monitoring Vegetation. Remote Sens. Environ. 1979, 8, 127–150. [Google Scholar] [CrossRef]
- Starke, B.W.; Simonds, J.O. Landscape Architecture: A Manual of Environmental Planning and Design, 5th ed.; McGraw-Hill Education: New York, NY, USA, 2013. [Google Scholar]
- Smith, L.; Primack, R.B.; Zipf, L.; Pardo, S.; Gallinat, A.S.; Panchen, Z.A. Leaf Longevity in Temperate Evergreen Species Is Related to Phylogeny and Leaf Size. Oecologia 2019, 191, 483–491. [Google Scholar] [CrossRef]
- Kim, J.; Kang, Y.; Kim, D.; Son, S.; Kim, E.J. Carbon Storage and Sequestration Analysis by Urban Park Grid Using I-Tree Eco and Drone-Based Modeling. Forests 2024, 15, 683. [Google Scholar] [CrossRef]
- Public Data Portal. Available online: https://www.data.go.kr (accessed on 14 February 2025).
- Jo, H.-K.; McPherson, G.E. Carbon Storage and Flux in Urban Residential Greenspace. J. Environ. Manag. 1995, 45, 109–133. [Google Scholar] [CrossRef]
- Davies, Z.G.; Edmondson, J.L.; Heinemeyer, A.; Leake, J.R.; Gaston, K.J. Mapping an urban ecosystem service: Quantifying above-ground carbon storage at a city-wide scale. J. Appl. Ecol. 2011, 48, 1125–1134. [Google Scholar] [CrossRef]
- Nicese, F.P.; Colangelo, G.; Comolli, R.; Azzini, L.; Lucchetti, S.; Marziliano, P.A.; Sanesi, G. Estimating CO2 Balance through the Life Cycle Assessment Prism: A Case—Study in an Urban Park. Urban For. Urban Green. 2021, 57, 126869. [Google Scholar] [CrossRef]
- Moon, T.; Kim, M.; Chon, J. Adaptive Green Space Management Strategies for Sustainable Carbon Sink Parks. Urban For. Urban Green. 2024, 94, 128236. [Google Scholar] [CrossRef]
- Nowak, D.J. Understanding i-Tree: 2023 Summary of Programs and Methods; General Technical Report NRS-200-2023; plus 14 appendixes; U.S. Department of Agriculture, Forest Service, Northern Research Station: Madison, WI, USA, 2024; p. 103. [Google Scholar]
- Saunders, S.M.; Dade, E.; Van Niel, K. An Urban Forest Effects (UFORE) Model Study of the Integrated Effects of Vegetation on Local Air Pollution in the Western Suburbs of Perth, WA. In Proceedings of the 19th International Congress on Modelling and Simulation (MODSIM2011), Perth, Australia, 12–16 December 2011; Modelling and Simulation Society of Australia and New Zealand Inc.: Perth, Australia, 2011. [Google Scholar]
- Kim, G.; Coseo, P. Urban Park Systems to Support Sustainability: The Role of Urban Park Systems in Hot Arid Urban Climates. Forests 2018, 9, 439. [Google Scholar] [CrossRef]
- Singkran, N. Evaluating Urban Park Ecosystem Services and Modeling Improvement Scenarios. Heliyon 2023, 9, e22002. [Google Scholar] [CrossRef]
- Zhang, X.; Huang, H.; Tu, K.; Li, R.; Zhang, X.; Wang, P.; Li, Y.; Yang, Q.; Acerman, A.C.; Guo, N.; et al. Effects of Plant Community Structural Characteristics on Carbon Sequestration in Urban Green Spaces. Sci. Rep. 2024, 14, 7382. [Google Scholar] [CrossRef] [PubMed]
- Park, S.; Zhang, P.; Ali, Z. Landscape Architecture Solutions to Biodiversity Loss: Research Study; American Society of Landscape Architects Fund: Washington, DC, USA, 2024. [Google Scholar]
- Oksanen, J.; Simpson, G.L.; Blanchet, F.G.; Kindt, R.; Legendre, P.; Minchin, P.R.; O’Hara, R.B.; Solymos, P.; Stevens, M.H.H.; Szoecs, E.; et al. Vegan: Community Ecology Package v2.6-10. Available online: https://github.com/vegandevs/vegan (accessed on 14 February 2025).
- Archer, E. rfPermute: Estimate Permutation p-Values for Random Forest Importance Metrics v2.5.2. Available online: https://github.com/EricArcher/rfPermute (accessed on 14 February 2025).
- Tian, Q.; Zhang, X.; Yi, H.; Li, Y.; Xu, X.; He, J.; He, L. Plant Diversity Drives Soil Carbon Sequestration: Evidence from 150 Years of Vegetation Restoration in the Temperate Zone. Front. Plant Sci. 2023, 14, 1191704. [Google Scholar] [CrossRef]
- Jo, H. Impacts of Urban Greenspace on Offsetting Carbon Emissions for Middle Korea. J. Environ. Manag. 2002, 64, 115–126. [Google Scholar] [CrossRef]
- Nowak, D.J.; Stevens, J.C.; Sisinni, S.M.; Luley, C.J. Effects of Urban Tree Management and Species Selection on Atmospheric Carbon Dioxide. Arboric. Urban For. 2002, 28, 113–122. [Google Scholar] [CrossRef]
- Ariluoma, M.; Kinnunen, A.; Lampinen, J.; Hautamäki, R.; Ottelin, J. Optimizing the Co-Benefits of Biodiversity and Carbon Sinks in Urban Residential Yards. Front. Sustain. Cities 2024, 6, 1327614. [Google Scholar] [CrossRef]
- Weiskopf, S.R.; Isbell, F.; Arce-Plata, M.I.; Di Marco, M.; Harfoot, M.; Johnson, J.; Lerman, S.B.; Miller, B.W.; Morelli, T.L.; Mori, A.S.; et al. Biodiversity Loss Reduces Global Terrestrial Carbon Storage. Nat. Commun. 2024, 15, 4354. [Google Scholar] [CrossRef]
- Hand, K.L.; Doick, K.J.; Moss, J.L. Ecosystem Services Delivery by Large Stature Urban Trees; Research Report; Forest Research: Edinburgh, UK, 2019; i–iv, pp. 1–24. [Google Scholar]
- Anderson-Teixeira, K.J.; Herrmann, V.; Rollinson, C.R.; Gonzalez, B.; Gonzalez-Akre, E.B.; Pederson, N.; Alexander, M.R.; Allen, C.D.; Alfaro-Sánchez, R.; Awada, T.; et al. Joint Effects of Climate, Tree Size, and Year on Annual Tree Growth Derived from Tree-ring Records of Ten Globally Distributed Forests. Glob. Change Biol. 2022, 28, 245–266. [Google Scholar] [CrossRef]
- Sax, D.; Manson, C.; Nesbitt, L. Governing for Diversity: An Exploration of Practitioners’ Urban Forest Preferences and Implications for Equitable Governance. Front. Sustain. Cities 2020, 2, 572572. [Google Scholar] [CrossRef]
- Liu, H.; Zhang, J.; Wang, Z. Assessing and Optimizing the Potential for Climate Change Mitigation and Carbon Sequestration in Urban Residential Green Spaces: Energizing Sustainable Cities. Front. Environ. Sci. 2025, 13, 1519297. [Google Scholar] [CrossRef]
- Xu, W.; Zhang, B.; Xu, Q.; Gao, D.; Zuo, H.; Ren, R.; Diao, K.; Chen, Z. Enhanced Carbon Storage in Mixed Coniferous and Broadleaf Forest Compared to Pure Forest in the North Subtropical–Warm Temperate Transition Zone of China. Forests 2024, 15, 1520. [Google Scholar] [CrossRef]
- Yoon, T.K.; Park, C.-W.; Lee, S.J.; Ko, S.; Kim, K.N.; Son, Y.; Lee, K.H.; Oh, S.; Lee, W.-K.; Son, Y. Allometric Equations for Estimating the Aboveground Volume of Five Common Urban Street Tree Species in Daegu, Korea. Urban For. Urban Green. 2013, 12, 344–349. [Google Scholar] [CrossRef]
- Havu, M.; Kulmala, L.; Kolari, P.; Vesala, T.; Riikonen, A.; Järvi, L. Carbon Sequestration Potential of Street Tree Plantings in Helsinki. Biogeosciences 2022, 19, 2121–2143. [Google Scholar] [CrossRef]
- Intasen, M.; Hauer, R.J.; Werner, L.P.; Larsen, E. Urban Forest Assessment in Bangkok, Thailand. J. Sustain. For. 2017, 36, 148–163. [Google Scholar] [CrossRef]
- Jayasooriya, V.M.; Ng, A.W.M.; Muthukumaran, S.; Perera, B.J.C. Green Infrastructure Practices for Improvement of Urban Air Quality. Urban For. Urban Green. 2017, 21, 34–47. [Google Scholar] [CrossRef]
- McPherson, E.G.; Peper, P.J. Urban Tree Growth Modeling. Arboric. Urban For. (AUF) 2012, 38, 172–180. [Google Scholar] [CrossRef]
- Kauffman, N.; Hill, K. Climate Change, Adaptation Planning and Institutional Integration: A Literature Review and Framework. Sustainability 2021, 13, 10708. [Google Scholar] [CrossRef]
- Lee, H.; Seo, B.; Cord, A.F.; Volk, M.; Lautenbach, S. Using Crowdsourced Images to Study Selected Cultural Ecosystem Services and Their Relationships with Species Richness and Carbon Sequestration. Ecosyst. Serv. 2022, 54, 101411. [Google Scholar] [CrossRef]
- Kim, Y.; Newman, G. Advancing Scenario Planning through Integrating Urban Growth Prediction with Future Flood Risk Models. Comput. Environ. Urban Syst. 2020, 82, 101498. [Google Scholar] [CrossRef] [PubMed]


| Region | Park ID | Area (m2) | Land Cover Accuracy (%) |
|---|---|---|---|
| Dongdaemun-gu | Jangan | 14,744.8 | 89.0 |
| Jangpyeong | 15,698.4 | 90.0 | |
| Saesam | 8910.1 | 82.0 | |
| Tteokgol | 5282.7 | 75.0 | |
| Yongdu | 17,182.0 | 76.0 | |
| Yongsan-gu | Giwato | 2225.0 | 88.0 |
| Hyochang | 171,277.0 | 79.0 | |
| Seobingo | 11,879.0 | 96.0 | |
| Ungbong | 187,834.0 | 82.0 | |
| Total | 84.1 | ||
| Tree Coverage | Dominant Plant Category | Biotope Types |
|---|---|---|
| Open | Deciduous trees | Open and Deciduous-dominant space (OD) |
| Open | Evergreen trees | Open and Evergreen-dominant space (OE) |
| Partly open | Deciduous trees | Partly open and Deciduous-dominant space (PD) |
| Partly open | Evergreen trees | Partly open and Evergreen-dominant space (PE) |
| Closed | Deciduous trees | Closed and Deciduous-dominant space (CD) |
| Closed | Evergreen trees | Closed and Evergreen-dominant space (CE) |
| Biotope Types | Number of Biotopes | Number of Trees |
|---|---|---|
| Open and Deciduous-dominant space (OD) | 56 | 278 |
| Open and Evergreen-dominant space (OE) | 26 | 90 |
| Partly open and Deciduous-dominant space (PD) | 160 | 1878 |
| Partly open and Evergreen-dominant space (PE) | 75 | 825 |
| Closed and Deciduous-dominant space (CD) | 52 | 1037 |
| Closed and Evergreen-dominant space (CE) | 26 | 481 |
| Total | 395 | 4589 |
Disclaimer/Publisher’s Note: The statements, opinions and data contained in all publications are solely those of the individual author(s) and contributor(s) and not of MDPI and/or the editor(s). MDPI and/or the editor(s) disclaim responsibility for any injury to people or property resulting from any ideas, methods, instructions or products referred to in the content. |
© 2025 by the authors. Licensee MDPI, Basel, Switzerland. This article is an open access article distributed under the terms and conditions of the Creative Commons Attribution (CC BY) license (https://creativecommons.org/licenses/by/4.0/).
Share and Cite
Eom, H.; Shin, Y.; Lee, S.-W.; An, K. Exploring Suitable Urban Plant Structures for Carbon-Sink Capacities. Land 2025, 14, 849. https://doi.org/10.3390/land14040849
Eom H, Shin Y, Lee S-W, An K. Exploring Suitable Urban Plant Structures for Carbon-Sink Capacities. Land. 2025; 14(4):849. https://doi.org/10.3390/land14040849
Chicago/Turabian StyleEom, Hyeseon, Yeeun Shin, Sang-Woo Lee, and Kyungjin An. 2025. "Exploring Suitable Urban Plant Structures for Carbon-Sink Capacities" Land 14, no. 4: 849. https://doi.org/10.3390/land14040849
APA StyleEom, H., Shin, Y., Lee, S.-W., & An, K. (2025). Exploring Suitable Urban Plant Structures for Carbon-Sink Capacities. Land, 14(4), 849. https://doi.org/10.3390/land14040849