Article

Impacts of Water and Sediment Fluxes into the Sea on Spatiotemporal Evolution of Coastal Zone in the Yellow River Delta

1
State Key Joint Laboratory of Environmental Simulation and Pollution Control, School of Environment, Beijing Normal University, Beijing 100875, China
2
Key Laboratory of Ecosystem Network Observation and Modelling, Institute of Geographic Sciences and Natural Resources Research, Chinese Academy of Sciences, Beijing 100101, China
3
Agricultural Information Institute, Chinese Academy of Agricultural Sciences, Beijing 100081, China
*
Author to whom correspondence should be addressed.
Land 2025, 14(4), 834; https://doi.org/10.3390/land14040834
Submission received: 10 March 2025 / Revised: 1 April 2025 / Accepted: 8 April 2025 / Published: 11 April 2025
(This article belongs to the Section Land Use, Impact Assessment and Sustainability)

Abstract

:
Water and sediment fluxes into the sea are the basis for the stability of the ecological pattern of the Yellow River Delta (YRD). As a Ramsar wetland of international importance, the YRD is facing the huge ecological risk of land degradation due to changes in water–sediment fluxes into the sea. In this study, we investigated the spatiotemporal dynamics of the coastline and subaerial delta using annual remote sensing images and revealed more detailed and clear relationships between water–sediment fluxes into the sea and the YRD evolution, including the whole delta and its subregions (e.g., the Qingshuigou and Diaokou regions) from 1976 to 2022. Our results showed that the mean yearly water and sediment fluxes during the study period amounted to 210.50 × 10⁸ m3 yr−1 and 367.81 Mt yr−1, respectively. There was an abrupt change in water and sediment fluxes into the sea in 1999, and both decreased significantly from 1976 to 1999, whereas the water discharge has significantly increased and the sediment flux has stabilized since around 2000. The delta area evolutions of the whole YRD and the Qingshuigou region can be characterized by three stages: a rapid growth stage (1976–1993), a rapid retreat stage (1993–2002), and a gradual recovery stage (2002–2022). The area in the Diaokou region displayed a continuous decreasing trend from 1976 to 2022. The regression analysis indicated that the relationships between cumulative sediment flux and cumulative land accretion area presented spatiotemporal differentiation. The cumulative land accretion area increased with the cumulative sediment flux in the whole YRD and its subregions from 1976 to 1992, decreased with the cumulative sediment flux in the YRD from 1993 to 2002, except for the northeast of Qingshuigou, and then expanded with the cumulative sediment flux in the YRD from 2003 to 2022, except for the southeast of Qingshuigou.

1. Introduction

River deltas are unique ecosystems on the surface of the earth, which have obvious differences from other ecosystems in their formation, development, and spatiotemporal evolution [1]. Due to their distinctive ecosystem structure and biogeochemical cycle, river deltas provide valuable ecosystem services, such as coastal protection, water purification, and pollutant degradation [2,3]. However, under the multiple stresses from climate change and anthropogenic activities, river deltas are subjected to a variety of changes, with the most significant being the reduction in the water and sediment fluxes into the sea [4]. The large-scale construction of dams, reservoirs, and water diversions in the river basins have directly affected the water and sediment fluxes, especially since the mid-to-late 20th century [5,6,7]. Water and sediment serve as the primary transport materials within river systems, form the fundamental components of river delta landforms, and play a controlling role in the structural patterns of deltas [8]. Recent research has indicated notable alterations in the water discharge and sediment flux of 24% and 40% of the world’s major rivers, respectively [4]. Reduced water–sediment fluxes into the sea have led to the shrinking of most deltas worldwide, including the Mississippi [9], Nile [10], Mekong [11], Ebro [12], and Yangtze River deltas [13]. Therefore, the variations in water–sediment fluxes and their impacts on delta evolution attract the widespread attention of earth and environmental scientists around the world.
The Yellow River Delta (YRD) is an important wetland bird habitat, biodiversity hotspot, and wetland blue carbon storage area on a global scale, and it has crucial ecological functions, such as water purification, flood control, and biodiversity conservation. In view of its important ecological value, the YRD was designated for inclusion in the International Important Wetland List in 2013 [14]. The YRD is also the key ecological barrier in economic development and provides an essential ecological foundation. Due to the shallow water depth in the Bohai Sea, the tides and waves are small, making the YRD a typical weak tide river estuary zone. The water–sediment fluxes into the sea have largely controlled the formation, development, and evolution of the YRD [15]. The Yellow River is a world-famous river with a high suspended sediment content [16]. However, under the multiple stresses of intensified anthropogenic disturbances and climate change, the hydrological and sedimentary regimes of the Yellow River entering the sea have recently undergone a new change from “less water and more sediment” to “less water and less sediment” [17,18]. The decrease in the water–sediment fluxes into the sea has disrupted their equilibrium within the YRD. In addition, the short land accretion period and the extremely unstable muddy coastal topography have caused the YRD to be in a constantly changing state, which poses great challenges to its protection and development. A thorough and timely examination of the evolutionary trajectory of the YRD can enhance our understanding of the development and transitional processes of the coastal system.
Previous studies dealing with the water–sediment fluxes and changing delta mainly focused on three aspects. The first is the artificial water–sediment release through the dam-oriented water–sediment regulation scheme (WSRS) after 2002, which increased water and sediment fluxes into the sea [19,20]. The second is the change in sediment composition, which indicates that the sediment is becoming coarser from the source of the river channel, resulting in greater resistance to wave erosion in the tidal flats [16,21]. The third is the change in the subaerial deltaic area or coastline, which neglects the importance of the sediment flux in assessing deltaic change [22,23,24]. Although there have been some studies examining the relationships between the water–sediment fluxes and the development of the YRD [25,26], these studies have either concentrated solely on the spatial evolution of the Qingshuigou region [27,28], or have focused on changes every few years while lacking some details about evolution characteristics [29,30]. Therefore, there are still knowledge gaps as to more detailed and clear relationships between the water–sediment fluxes into the sea and the YRD evolution, including the whole delta and its subregions (e.g., the Qingshuigou and Diaokou regions).
As the YRD serves as a significant case study for examining the evolution of large river deltas under multiple stresses within the basin, this study emphasized the quantitative contribution of the water–sediment fluxes into the sea on the evolution of the whole YRD and its subregions in different periods from 1976 to 2022. The aims were to (1) investigate the phase changes in the water–sediment fluxes into the sea using the Mann–Kendall test and double mass curve method, (2) examine the spatial and temporal evolution of coastline and subaerial area in the whole YRD and its subregions in detail through annual remote sensing images, and (3) establish quantitative relationships between the water–sediment fluxes into the sea and the delta area in different periods. This study offers valuable information for effectively managing the balance of water and sediment in the basin to maintain a healthy estuary wetland ecosystem in the YRD.

2. Materials and Methods
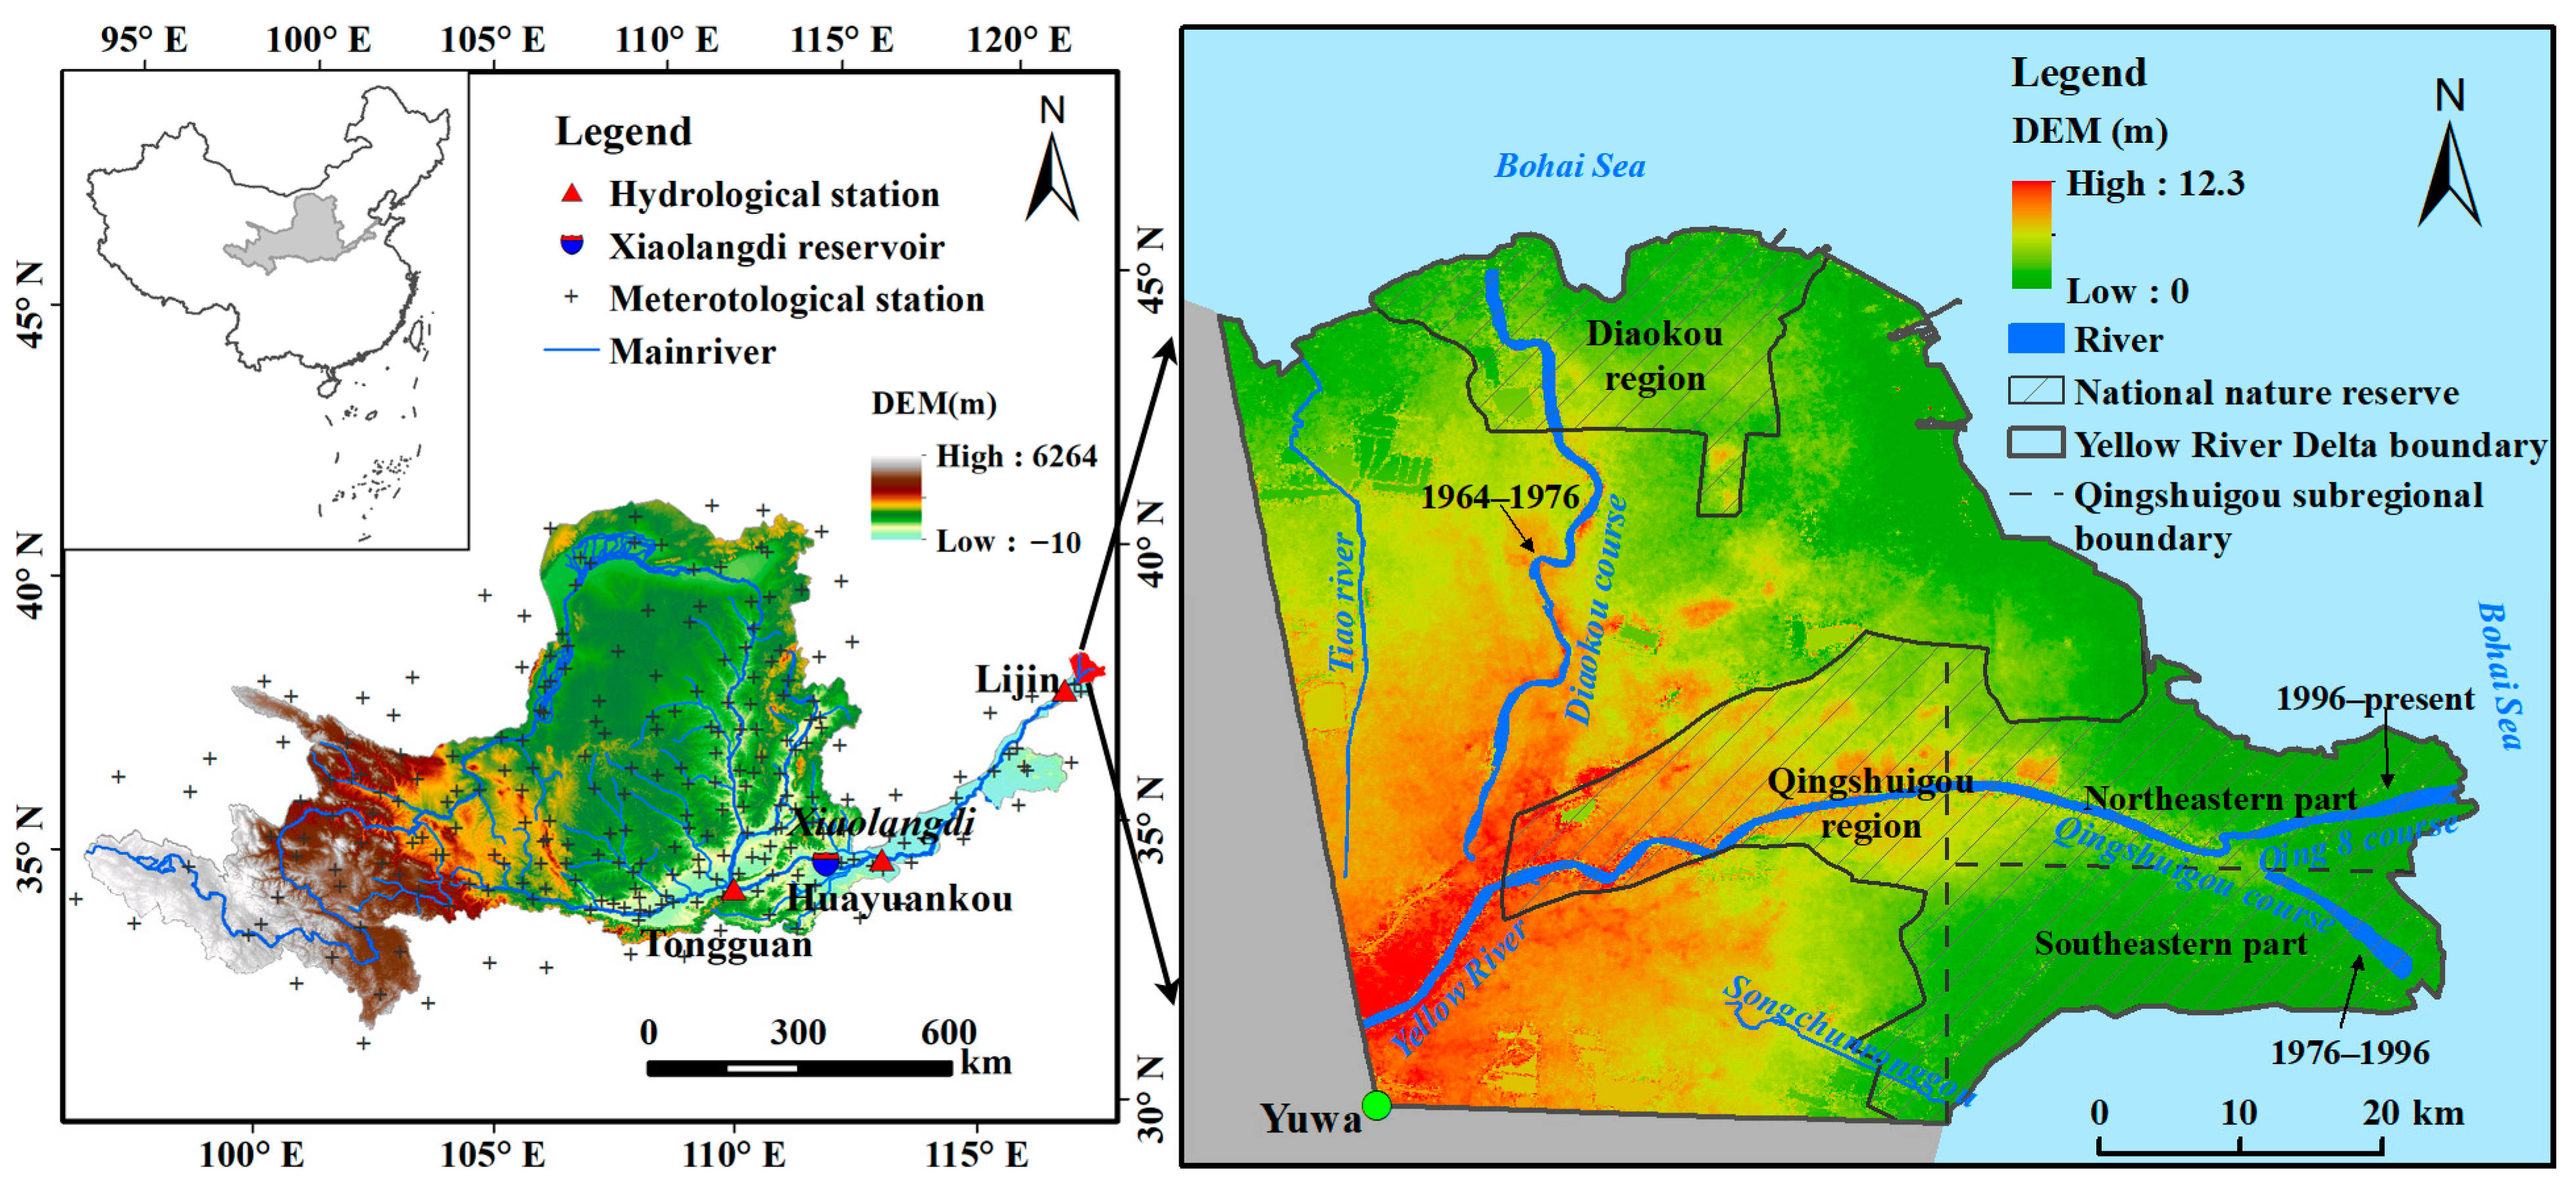
2.1. Study Area

The YRD is located at the mouth of the Yellow River in the northeastern region of Shandong Province, China. Historically, the tail channel of the Yellow River has experienced frequent changes, and the position of the estuary has constantly shifted. According to different time periods, the YRD can be divided into the ancient YRD (before 1855), the recent YRD (1855–1934), and the modern YRD (after 1934) [31]. The modern YRD takes Yuwa, Dongying city as the apex, extending from the Tiao River in the west part and stretching to the estuary of the Songchunronggou River (Figure 1). Two large artificial diversions have been implemented in the main river channel over the last 50 years. In May 1976, the north-oriented Diaokou course was abandoned and diverted artificially to the southeast-oriented Qingshuigou course. In August 1996, the primary waterway was shifted from the southeast-oriented Qingshuigou course to the northeast-oriented Qing 8 course to facilitate the Xintan and Kendong Oilfields from offshore to onshore operations [25]. Since then, the main channel has remained relatively stable, except for some minor changes.
The YRD exhibits a warm temperate monsoon climate, featuring an average yearly precipitation of 590.9 mm and an average yearly temperature of 12.1 °C. The majority of the precipitation occurs during the summer months, comprising 70% of the overall annual precipitation [32]. The main tidal type in the YRD is irregular semidiurnal tides, with a mean high-tide range of 1.0–1.8 m and a mean low-tide range of −0.5–0.2 m relative to the Yellow Sea Datum. The coastal dynamic environment near the YRD exhibits relatively low energy. The wave patterns are primarily dominated by the wind-generated waves, with the prevailing wave direction being northeast (NE) (frequency: 10.3%). The NE direction also corresponds to the strongest waves (maximum H1/10 wave height: 3.1 m). This area is infrequently impacted by summer typhoons, and the sea surface wave heights typically remain below 0.5 m [23]. Thus, the effects of the tides and waves are relatively small near the delta [33]. The primary composition of sediment consists predominantly of suspended sediment, which is deposited at the estuary and forms the youngest and largest wetland ecosystem in China. Due to the important role of the estuary wetland ecosystem in protecting biodiversity, the government has established national nature reserves in the Diaokou and Qingshuigou regions (Figure 1). In this study, we further divided the Qingshuigou region into the western, southeastern, and northeastern parts. Among them, the southeastern part is dominated by the Qingshuigou course, and the northeastern part is dominated by the Qing 8 course (Figure 1).

2.2. Data Sources

The annual water–sediment fluxes at selected hydrological stations from 1976 to 2022 were collected from the hydrological yearbook. In this study, the annual water discharge (flux, Q) is the volume of water passing through the selected hydrological stations in one year. The annual sediment flux (QSS) refers to the amount of suspended sediment that passes through the selected hydrological stations in one year, and it is calculated by multiplying the mean annual suspended sediment concentration (CSS) by the annual water discharge (Q), i.e., QSS = CSS × Q [4]. The weather data (e.g., precipitation and temperature) in the Yellow River Basin were from 239 meteorological stations, which were provided by the China Meteorological Data Center (http://data.cma.cn/ (accessed on 22 February 2024)). Considering the satellite data continuity, image acquisition span, and spatiotemporal resolution, images from Landsat sensors were used for the period from 1976 to 2022, including Multispectral Scanner (MSS) images with a spatial resolution of 80 m and Thematic Mapper (TM), Enhanced Thematic Mapper (ETM+), and Operational Land Imager (OLI) data with a spatial resolution of 30 m. A total of 47 scenes were obtained around the YRD from the United States Geological Survey (https://earthexplorer.usgs.gov/ (accessed on 13 November 2023)). In view of the critical impact of cloud cover during the flood season, the selected time series for the Landsat images were mainly concentrated from September to November (Table 1). Geometric correction was performed for each image by selecting 25 ground control points and establishing a first-order polynomial transform algorithm between the image and these control points. All images were resampled at a 30 m spatial resolution and were transformed into a unified projected coordinate system.

2.3. Trend and Change Point Detection

The Mann–Kendall trend test is a bootstrap-based nonparametric method [34]. It has been extensively employed for the purpose of detecting the trend in hydrological and meteorological data series [4]. This method has no requirements on the distribution of original data and is undisturbed by a few outliers. It was applied to identify trends in the non-normally distributed datasets, such as water discharge, sediment flux, and precipitation. The double mass curve method was adopted to identify the points of abrupt changes in the water discharge and sediment flux by analyzing the relationship between the annual precipitation and these variables [35].

2.4. Extraction of Coastlines

The general high-tide line is defined as the average boundary on land inundated by high tides during a non-extreme high-tide event, and it denotes the typical demarcation between land and sea. It is situated between the middle and high tidal flat zones. Distinguished by varying material compositions and submersion durations, the middle and high tidal flats exhibit distinct spectral features in satellite imagery, facilitating the straightforward identification of the general high-tide line [36]. Leveraging its simplicity, ease of application, and reasonable precision, the general high-tide line approach was employed as a representation of the coastline in this study.
In addition, the coastlines were extracted from Landsat images using a thorough visual interpretation of the YRD from 1976 to 2022. The human interpretation method is widely used to extract coastlines due to its high accuracy [36]. In the process of the manual digitization, we set the display scale at 1:3000 for the images and ensured that the coastlines were consistently extracted by the same individual. Furthermore, we divided the coastlines into natural coastlines and artificial coastlines in the YRD. The former are mainly composed of tidal flats and are formed by the interaction between land and sea, whereas the latter consist of artificial constructions such as wharfs, seawalls, docks, revetments, and asphalt roads, and the geometry is relatively regular. The interpretation results were validated using high-resolution images obtained from Google Earth and Sentinel-2 as references.

2.5. Assessing the YRD Evolution

The spatiotemporal evolutions of coastline and land area were analyzed in different regions, including the whole YRD and the Qingshuigou and Diaokou regions (Figure 1). These regions should extend to the sea and are bounded by the coastlines. Subsequently, the land area and coastline length of the corresponding region could be obtained with the ArcGIS 10.2 platform. In this study, the coastline length refers to the total length of the continuous curve formed by the vectorized trajectory of the coastline extracted from remote sensing imagery in a planar projection, reflecting the natural morphology and spatial complexity of the coastal zone. The spatiotemporal characteristics of the coastline length and land area were explored from 1976 to 2022.
The standard deviational ellipse was employed to elucidate the dynamic trajectory of the land distribution and the extent of the dispersion in different regions [37]. This approach effectively captures the comprehensive attributes of the spatial distribution of the research object and is widely used in geographical analysis. The dimensions of the ellipse indicate the level of concentration of geographical elements. The primary and secondary trends of the data distribution within a two-dimensional space are represented by the long and short axes. The axis length represents the dispersion of the elements in the corresponding directions. The centroid of the ellipse denotes the central point of the elements and it is generally used to reflect the evolution trajectories of long-time-series data. To implement the standard deviational ellipse, we split our region of interest up into regular 1 km × 1 km grids to accurately reveal the evolution characteristics of YRD. The gravity center was calculated as follows:
S D E x = i = 1 n ( x i X ¯ ) 2 n S D E y = i = 1 n ( y i Y ¯ ) 2 n
where S D E x and S D E y denote the longitudinal and latitudinal coordinates of the centroid, respectively; x i and y i represent the coordinates of the grid i ; X ¯ and Y ¯ represent the mean center of the grids; and n represents the total number of grids.

3. Results

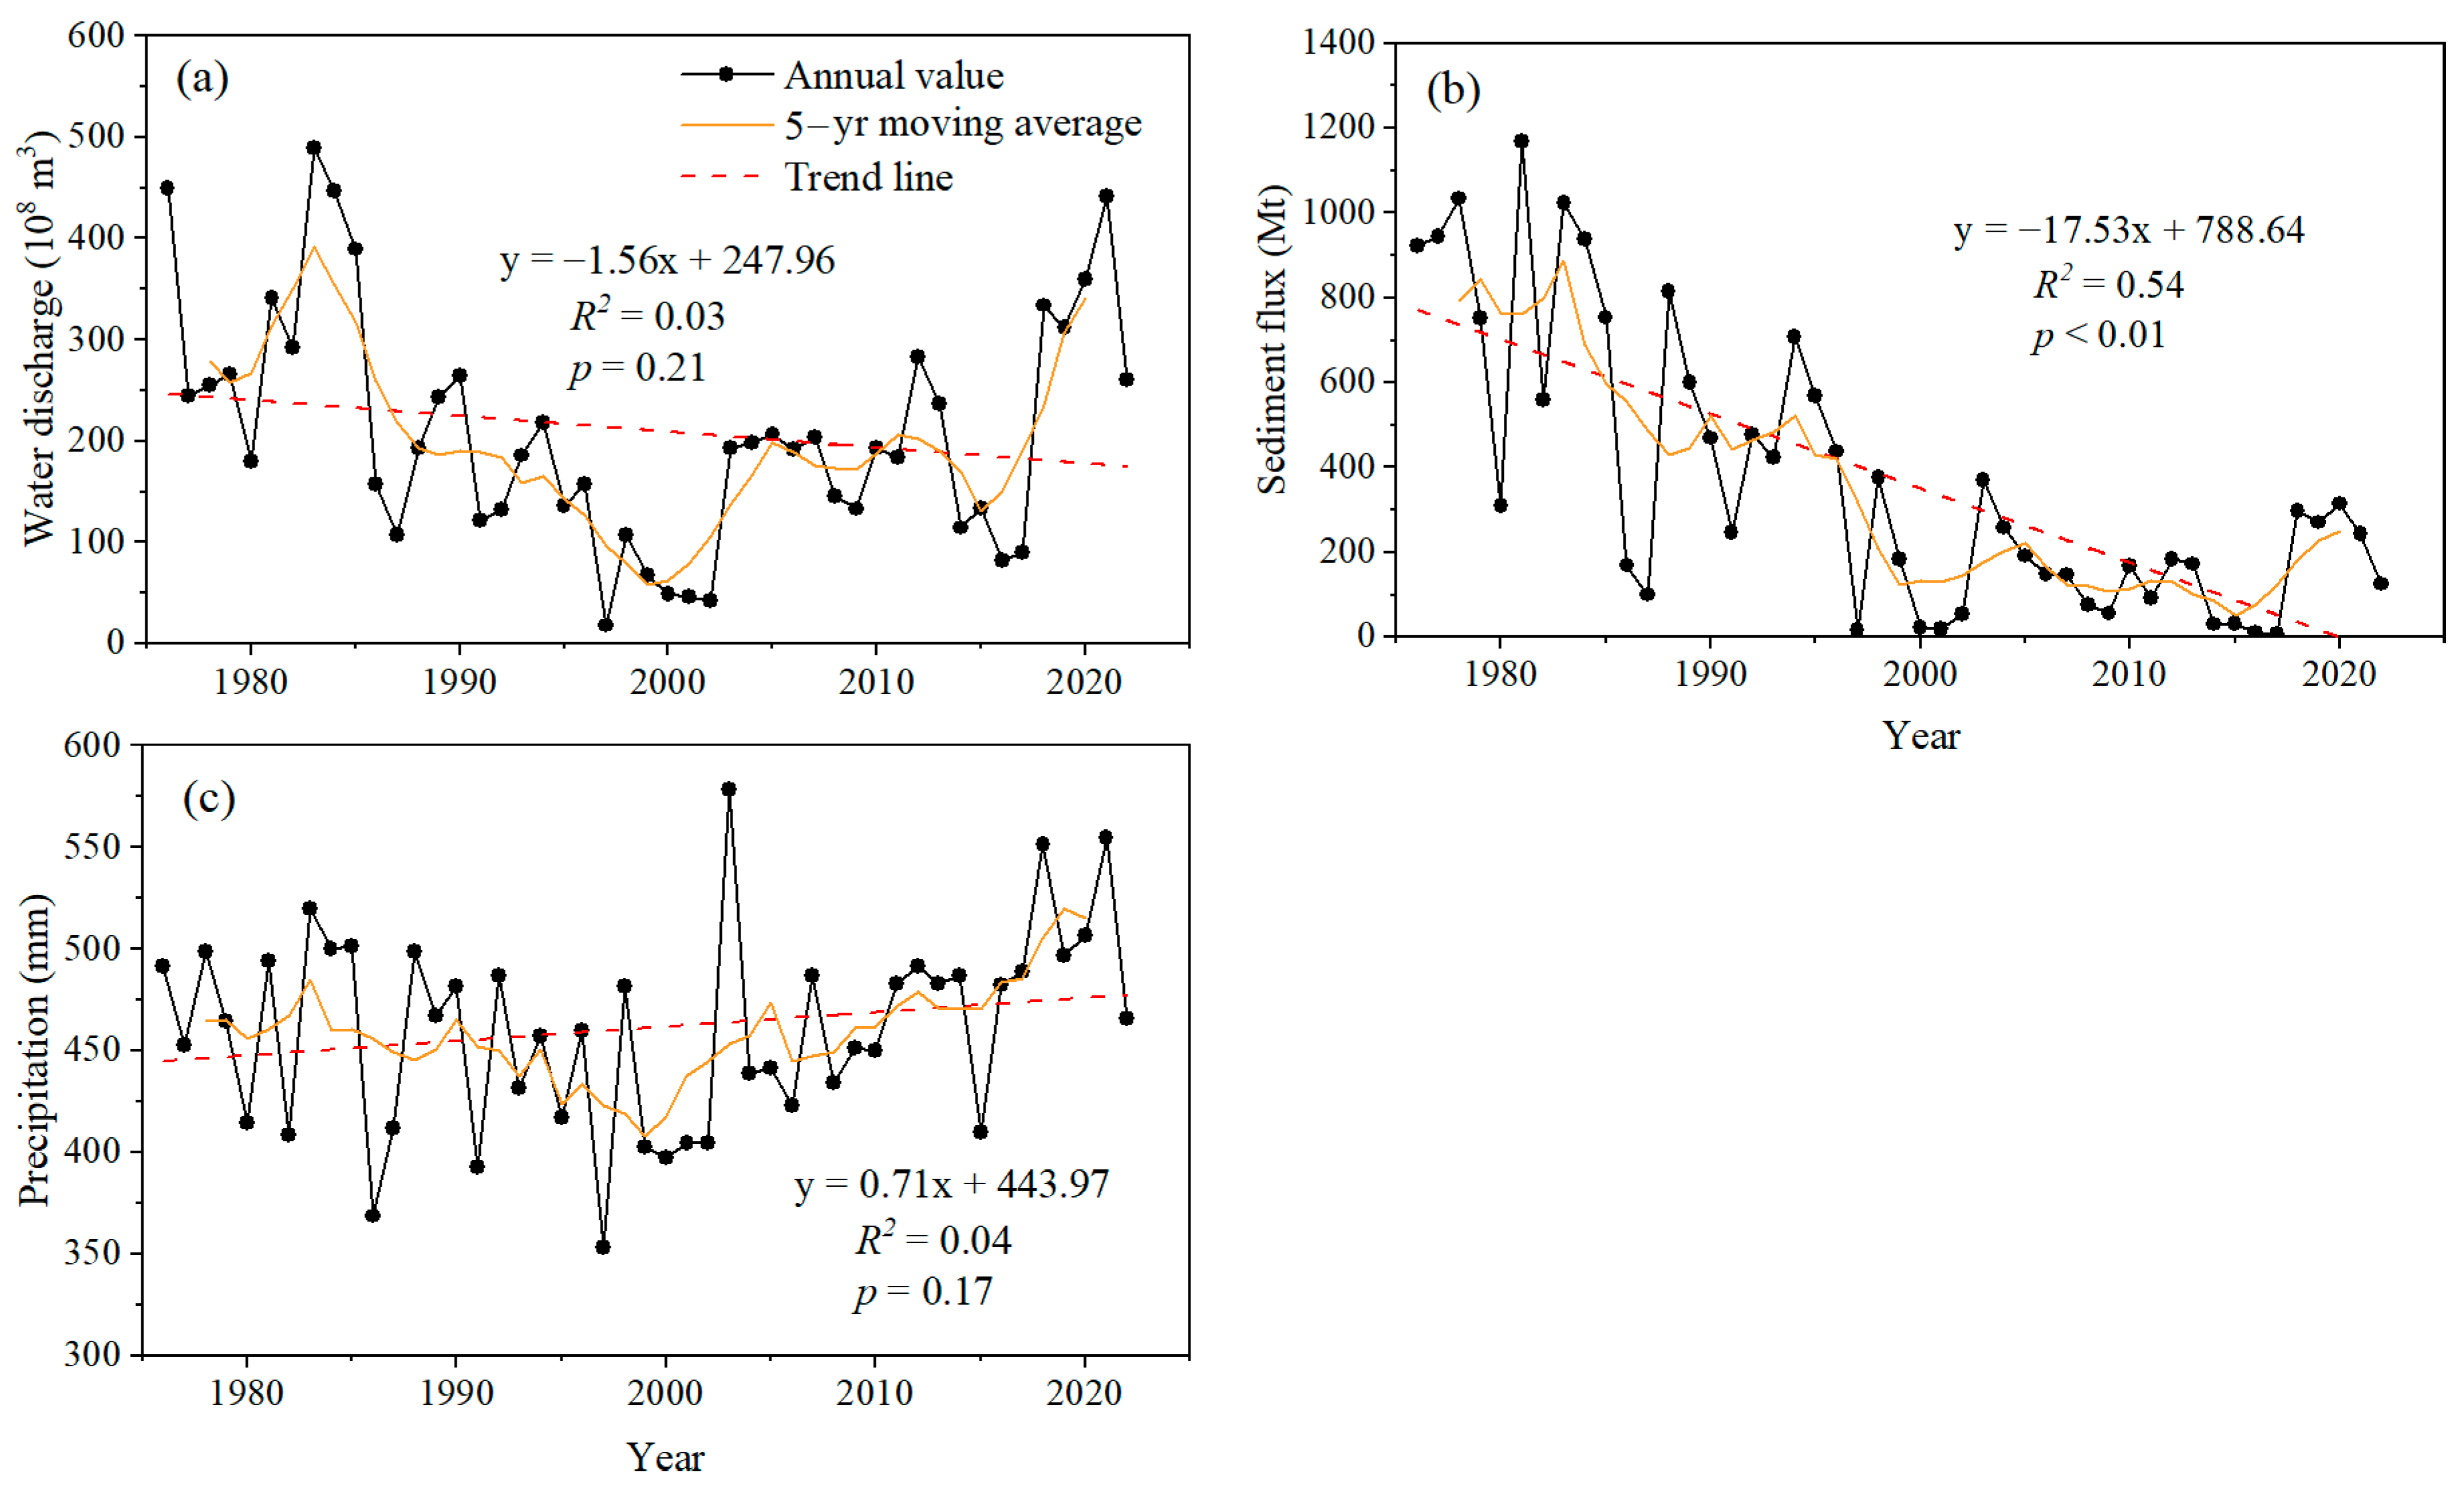
3.1. Variations in Water and Sediment Fluxes

The Lijin hydrological station, located about 100 km upstream from the mouth of the Yellow River, serves as the final hydrological station for monitoring water and sediment fluxes into the Bohai Sea. In agreement with previous studies [16,25], we considered the water and sediment fluxes measured at the Lijin hydrological station as representative of the water–sediment fluxes into the sea. From 1976 to 2022, the annual average water and sediment fluxes were about 210.50 × 10⁸ m3 yr−1 and 367.81 Mt yr−1, respectively. As shown in Table 2, the annual water discharge presented a noticeable but not statistically significant decline (p > 0.05), and the annual sediment flux experienced a significant decrease (p < 0.01). Figure 2 shows the annual and 5-year moving averages of the water–sediment fluxes and precipitation from 1976 to 2022. The variation trends exhibit similarity with those of the Mann–Kendall test. On average, the change rates of the water discharge, sediment flux, and precipitation were −1.56 × 10⁸ m3 yr−1, −17.53 Mt yr−1, and 0.71 mm yr−1, respectively.
The phase characteristics of the changes in the water–sediment fluxes were determined using the double mass curve method. Figure 3 shows the relationship between the cumulative water discharge and cumulative precipitation, as well as that between the cumulative sediment flux and cumulative precipitation. It is apparent that there is one abrupt fall in water–sediment fluxes around the year 1999. The regression slope of the water discharge decreased from 0.51 to 0.41, and the regression slope of the sediment flux decreased from 1.25 to 0.29 from the first period (1976–1999) to the second period (2000–2022). We further conducted a more detailed examination of the water–sediment changes in the sub-periods (Table 3). The annual water discharge significantly decreased from 1976 to 1999 (p < 0.01), and the average annual water discharge was 227.52 × 10⁸ m3. Nevertheless, it significantly increased from 2000 to 2022 (p < 0.01), and the average annual value was 192.74 × 10⁸ m3. The sediment flux also demonstrated a significant downward trend from 1976 to 1999 (p < 0.01), and a non-significant upward trend from 2000 to 2022 (p > 0.05). The average annual sediment flux was 440.27 × 10⁸ m3 greater in the first period than that in the second period.

3.2. Spatiotemporal Evolution of YRD

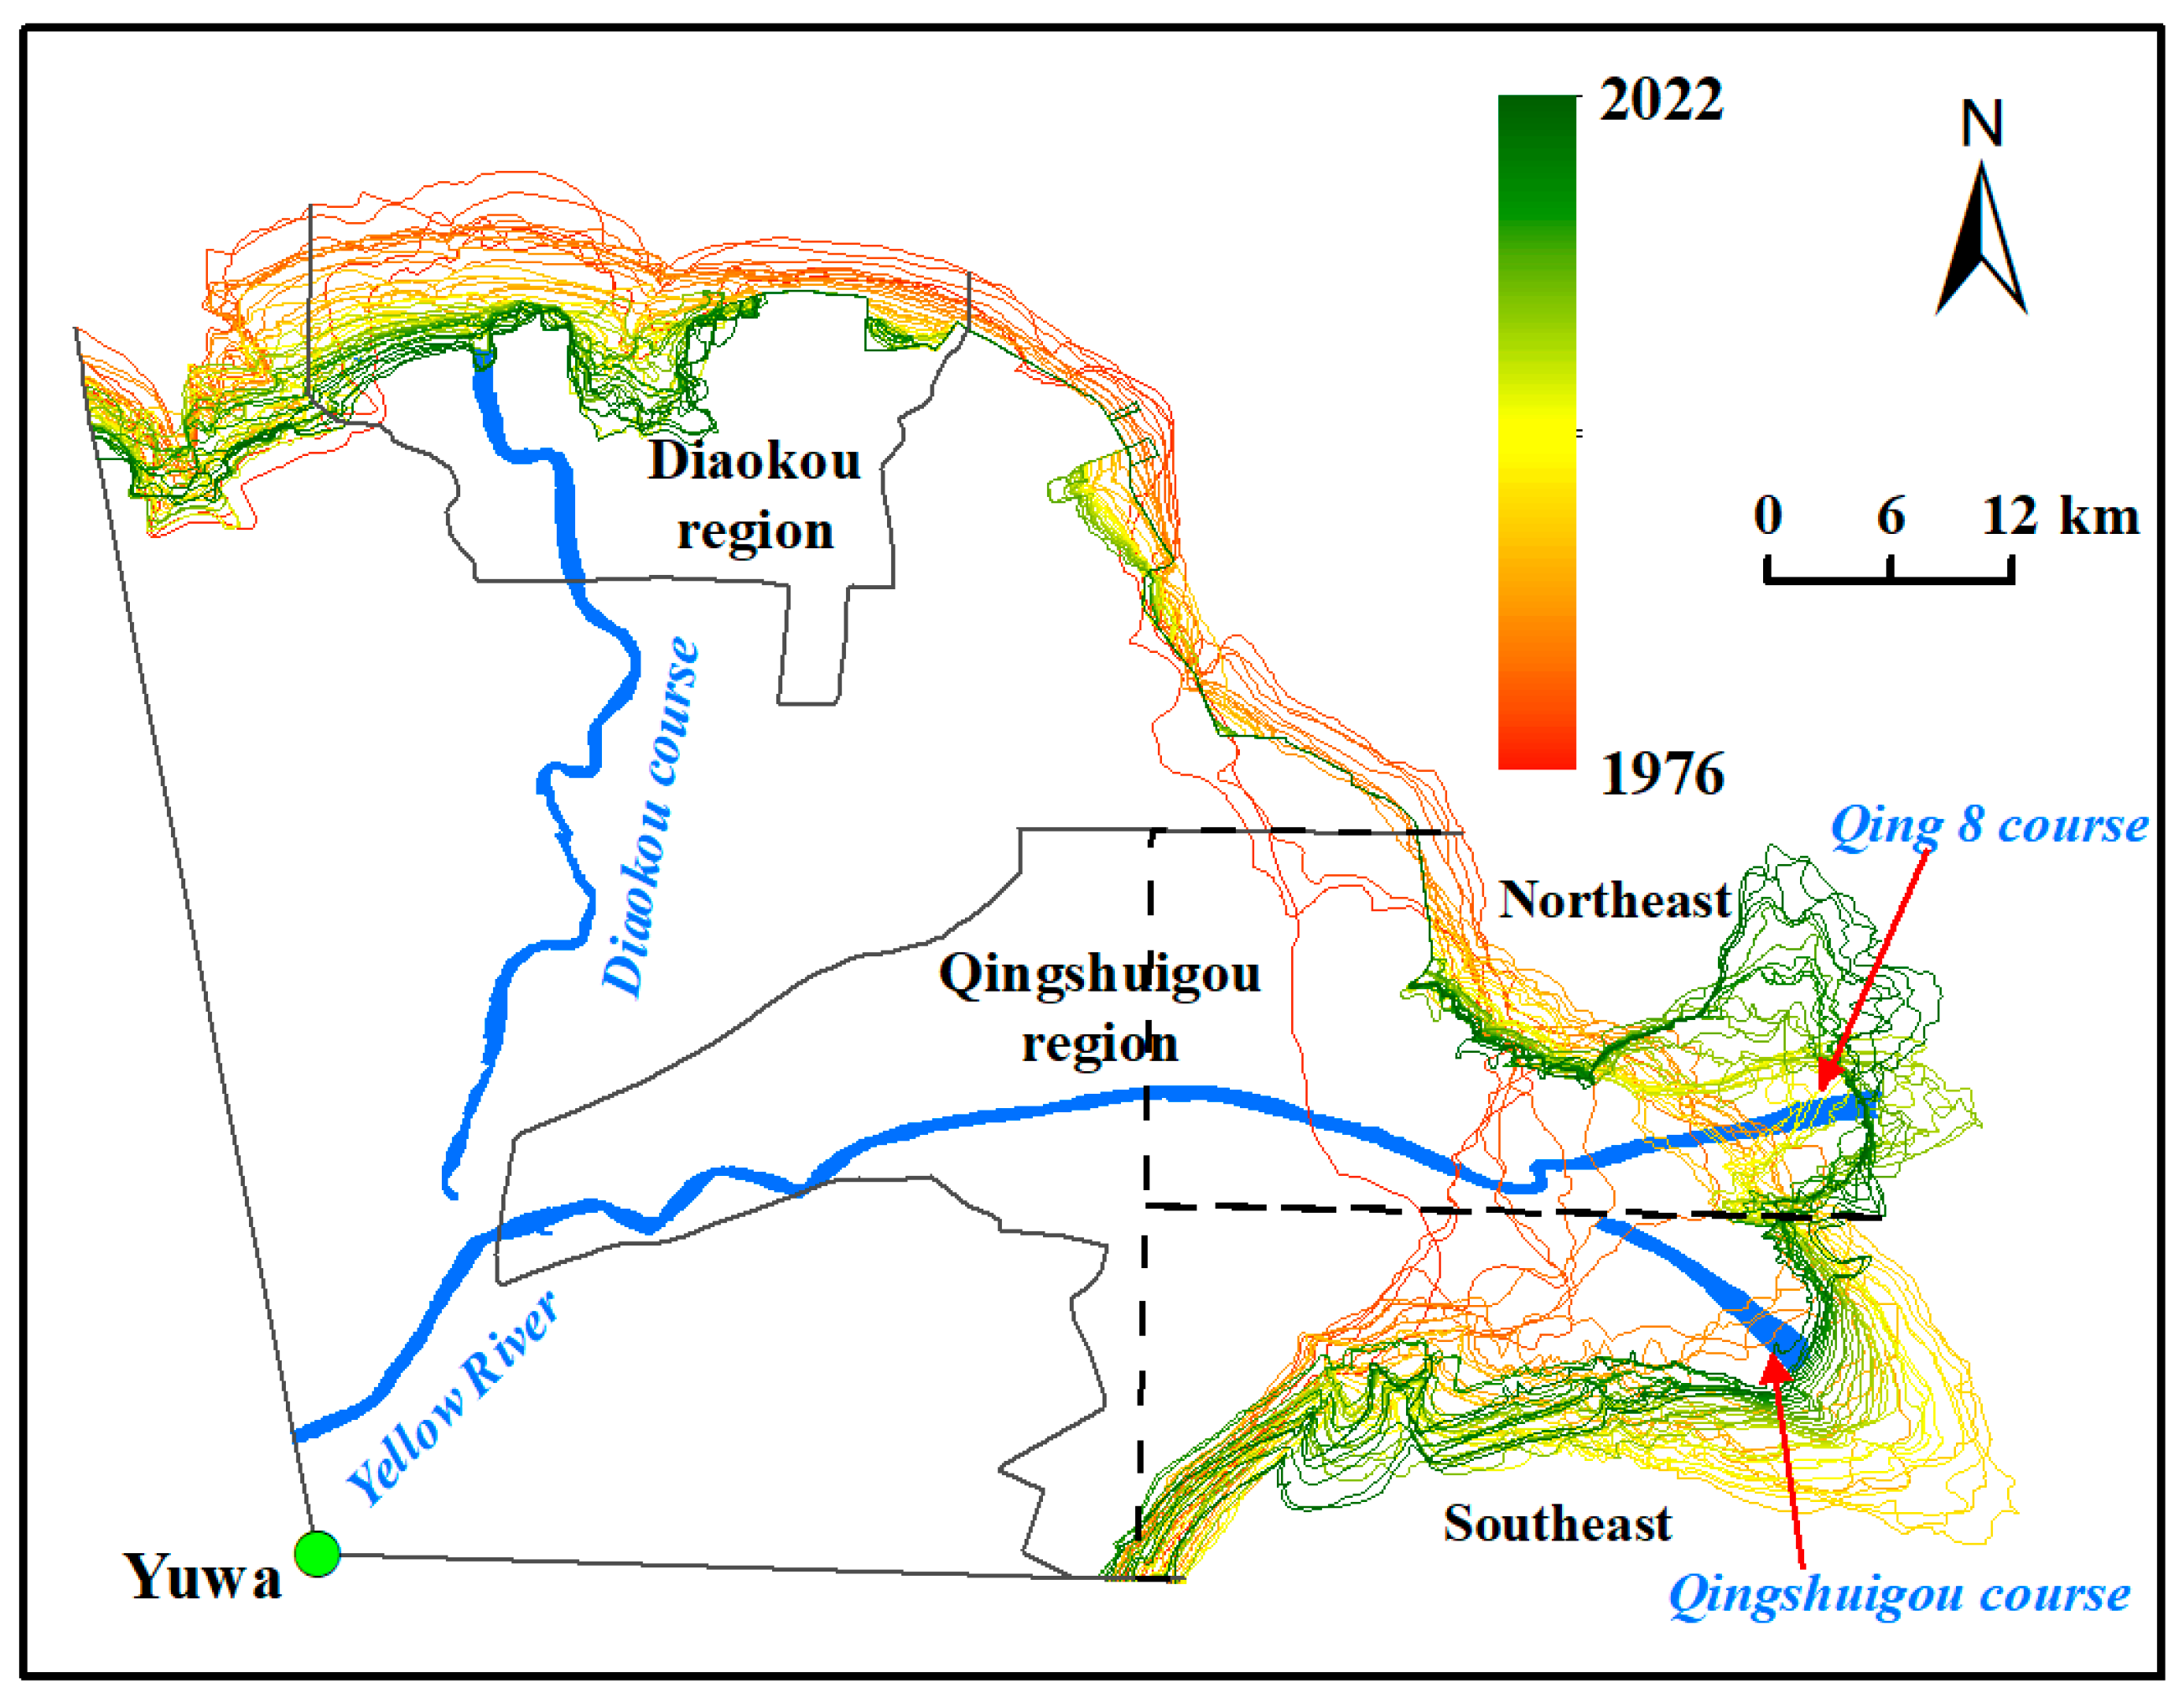
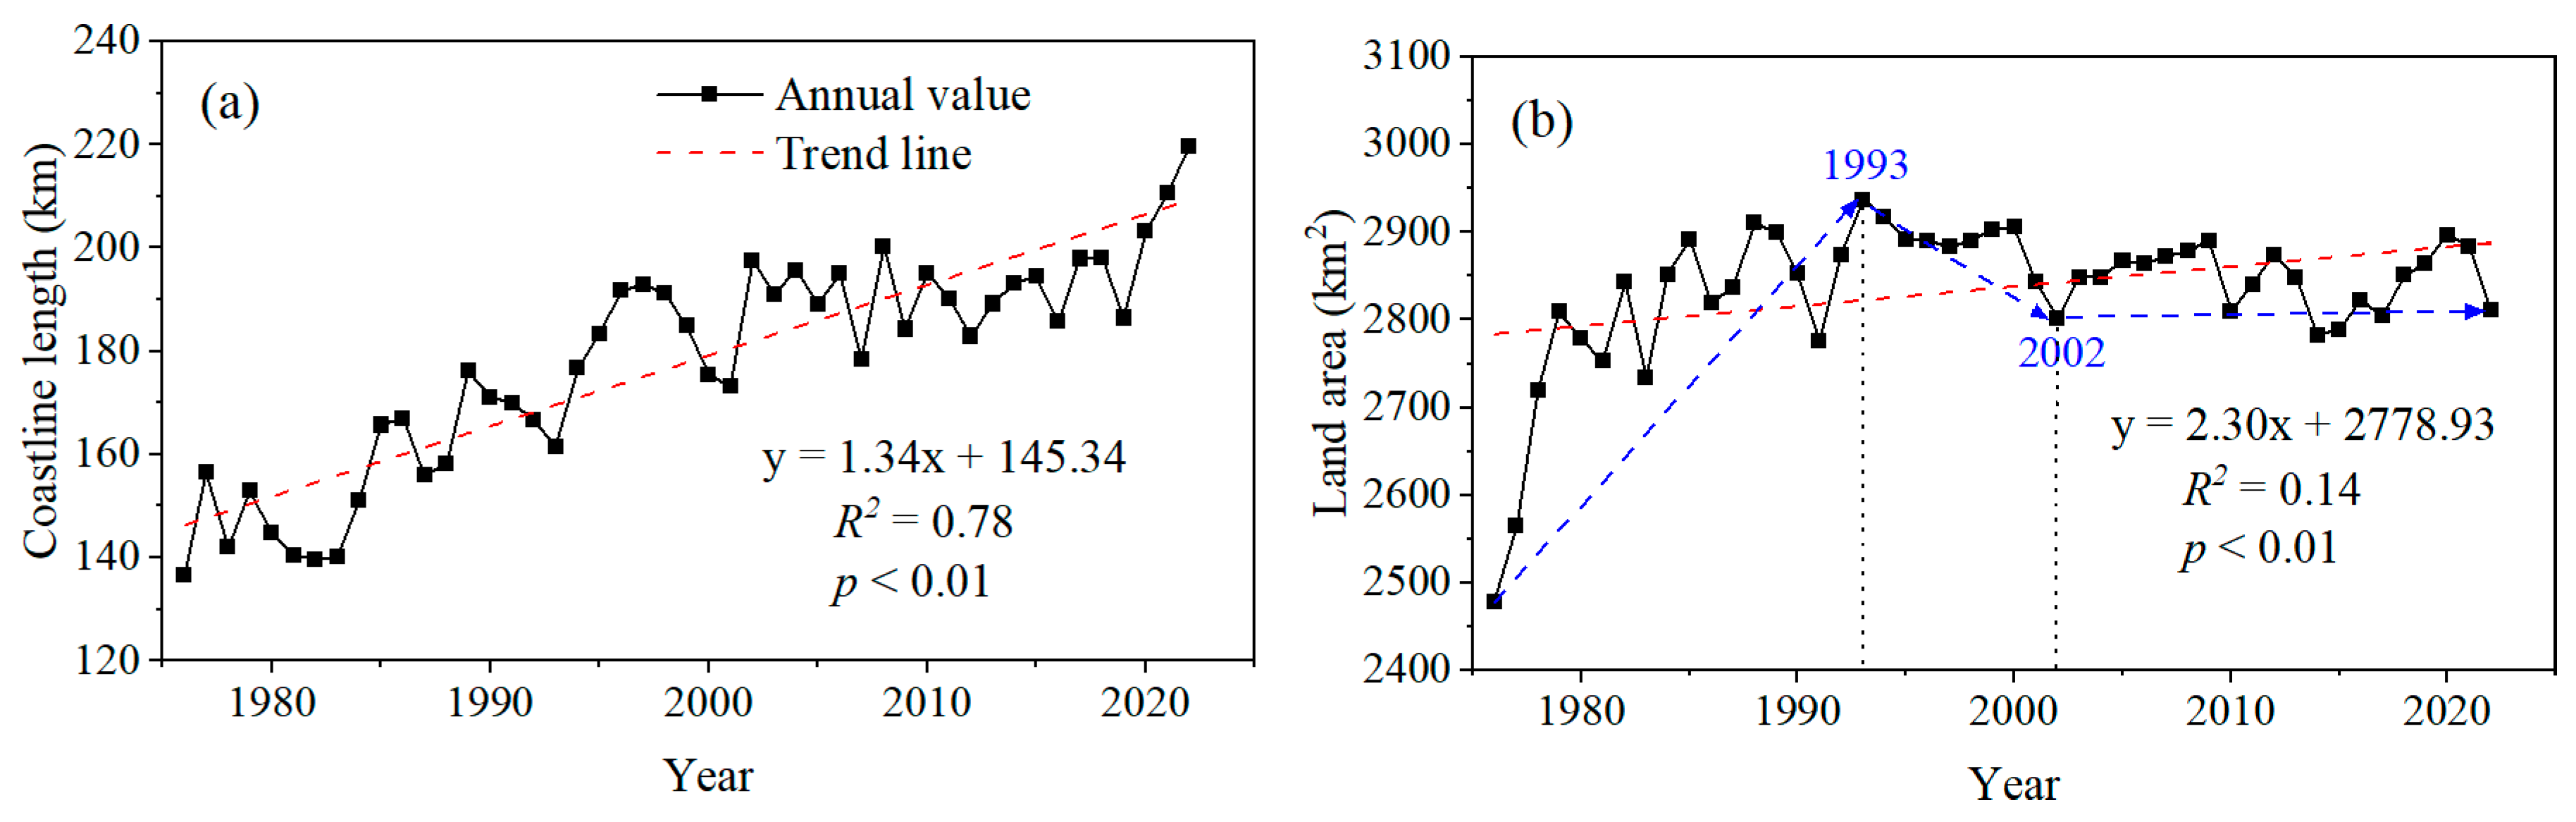
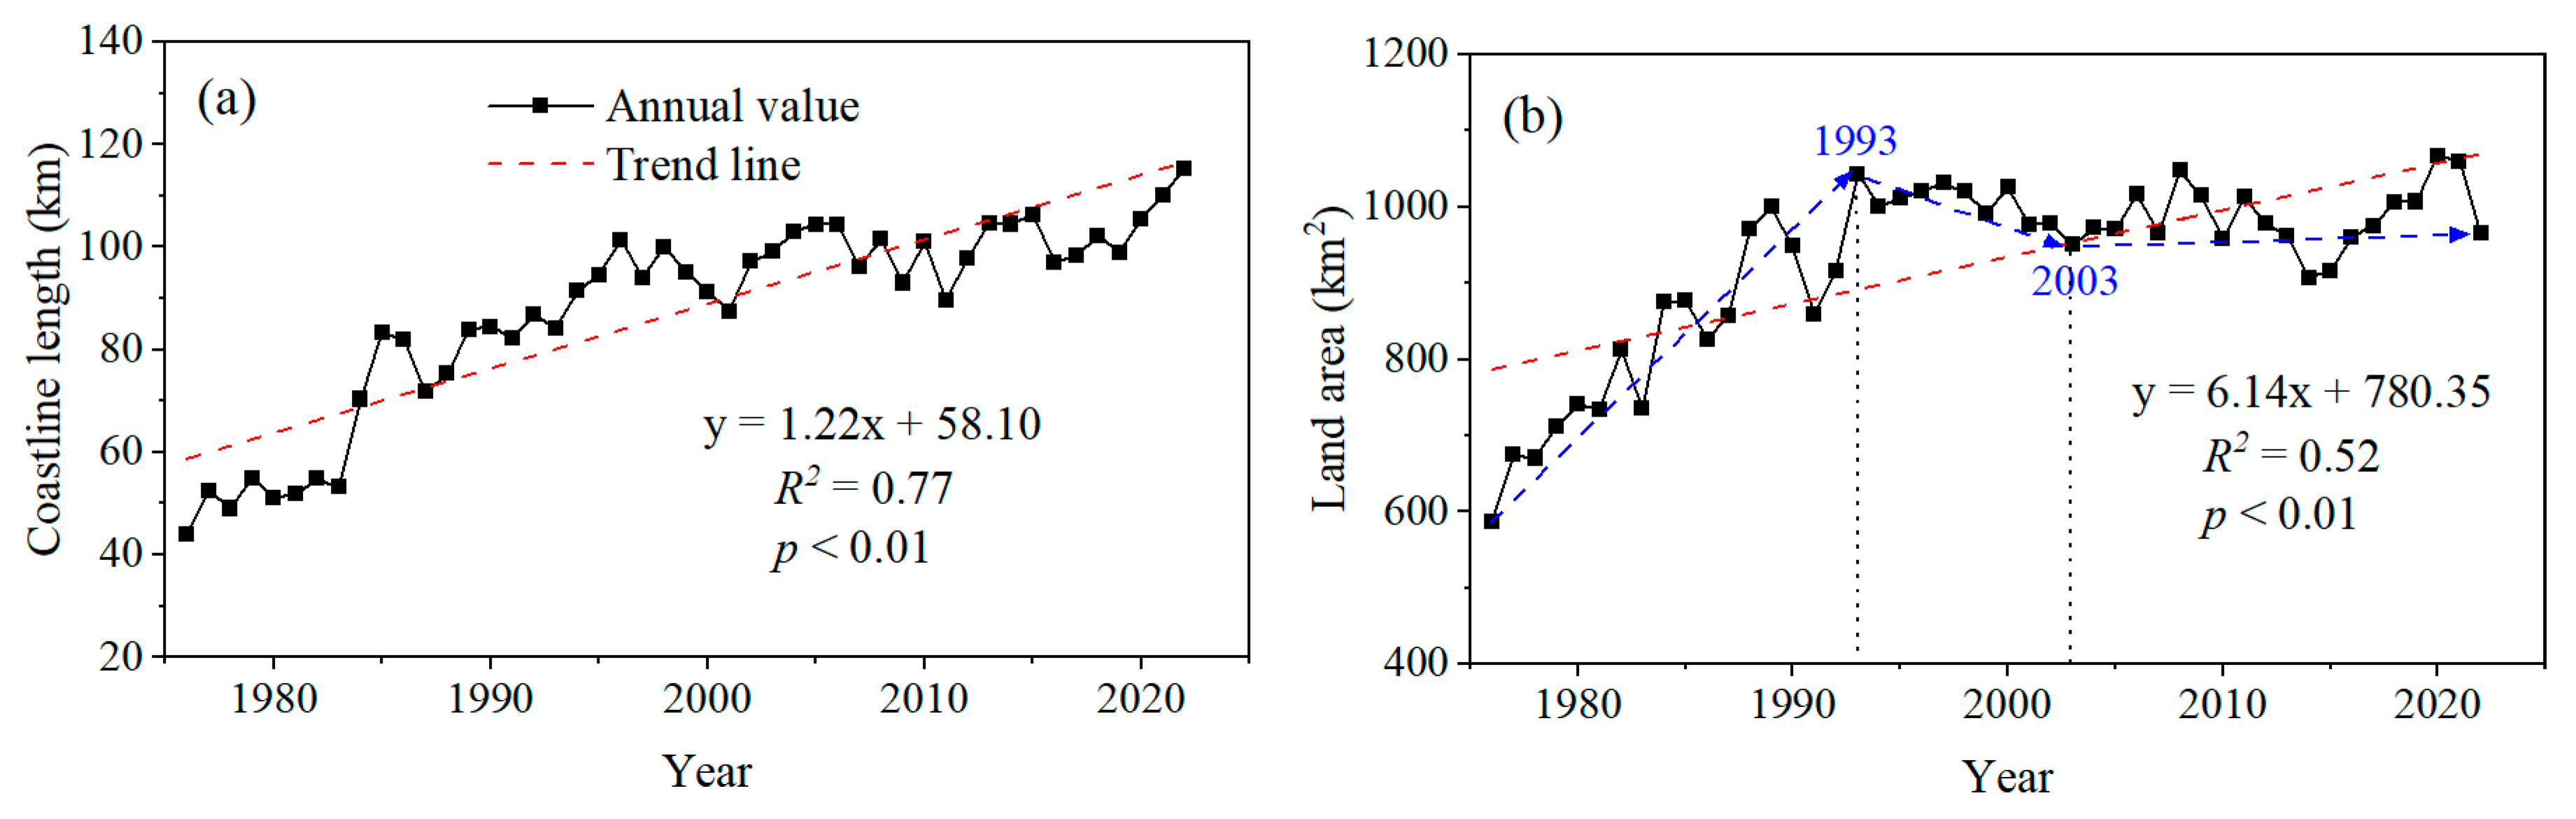
3.2.1. Overall Evolution of YRD

The spatial coastline evolutions in the Diaokou and Qingshuigou regions were remarkably different (Figure 4). Specifically, a landward movement of the coastline in the Diaokou region was observed, and its changing shape displayed three stages: curved outward, gradually flattened, and curved inward. In contrast, a general seaward movement of the coastline was observed in the Qingshuigou region, with the orientation of the coastline extension displaying variability during different periods. From 1976 to 1996, the coastline mainly extended towards the southeast direction. From 1996 to 2022, the coastline started to retreat in the southeast direction and gradually shifted to extend towards the northeast direction.
Both the coastline length and land area in the whole YRD showed increasing patterns, with significant average growth rates for the total period of investigation (Figure 5). The total coastline length increased by about 83.02 km from 1976 to 2022, with an average growth rate of 1.34 km yr−1. Concurrently, there was an increase in the land area of approximately 331.55 km2, demonstrating an average growth rate of 2.30 km2 yr−1. The area evolution can be divided into three phases: a rapid growth phase (1976–1993), a retreat phase (1993–2002), and a stable phase (2002–2022), with average change rates of 16.63 km2 yr−1, −9.84 km2 yr−1, and −0.28 km2 yr−1, respectively.

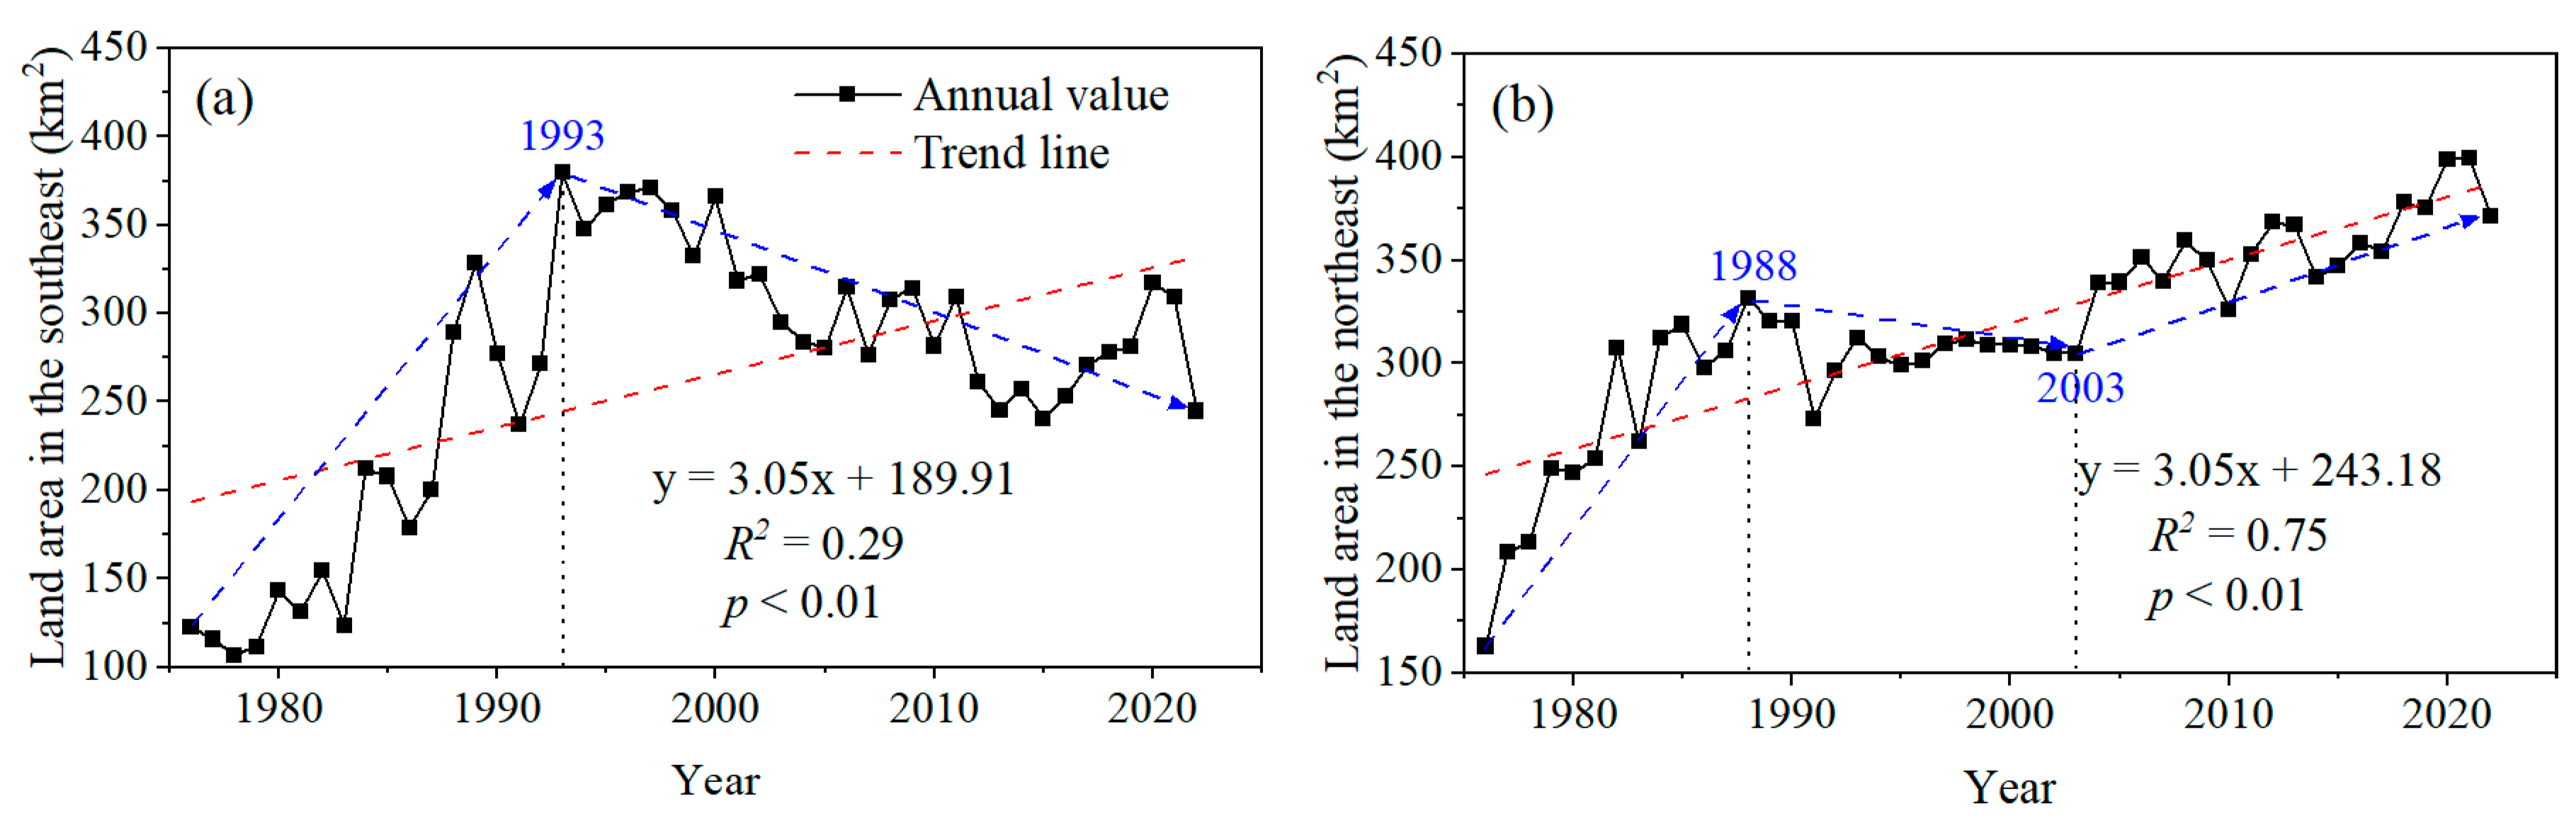
3.2.2. Evolution of the Qingshuigou Region

In the Qingshuigou region, the coastline length fluctuated and increased by about 71.28 km during the study period, with an average growth rate of about 1.22 km yr−1 (Figure 6). The land area increased by approximately 378.47 km2 in 2022 compared with that in 1976, demonstrating an average yearly growth rate of 6.14 km2 yr−1. Furthermore, the area evolution can also be divided into three stages: a rapid growth stage from 1976 to 1993 with an average growth rate of 21.61 km2 yr−1, a retreat stage from 1993 to 2003 with an average decline rate of −6.22 km2 yr−1, and a recovery stage from 2003 to 2022 with an average growth rate of 1.46 km2 yr−1.
There have been expansions of approximately 121.95 km2 in the southeast and 208.21 km2 in the northeast of the Qingshuigou region (Figure 7). However, the yearly changes in the land area within the southeastern region exhibit notable distinctions compared to those observed in the northeastern region. From 1976 to 1993, the area in the southeastern region showed a steady increase when it reached the peak value of 379.55 km2; then, a rapid decrease occurred from 1993 to 2022 with a decline rate of −3.70 km2 yr−1. In comparison to the annual fluctuations in the area in the southeastern region, the annual area in the northeastern region demonstrated three stages: a rapid growth stage from 1976 to 1988 with an average growth rate of 12.01 km2 yr−1, a retreat stage from 1988 to 2003 with an average decline rate of −0.45 km2 yr−1, and a recovery stage from 2003 to 2022 with an average growth rate of 3.01 km2 yr−1.

3.2.3. Evolution of the Diaokou Region

Compared with the Qingshuigou region, the trends of the annual coastline length and land area were not consistent in the Diaokou region. As shown in Figure 8, from 1976 to 2022, the Diaokou coastline experienced a steady expansion over time, with an average annual growth rate of 0.34 km yr−1, while the land area decreased at an average rate of −3.15 km2 yr−1. Furthermore, two stages of evolution in the land area of the Diaokou region were identified: a rapid retreat stage from 1976 to 1999 and a slow retreat stage from 1999 to 2022, with average decline rates of −5.76 km2 yr−1 and −1.69 km2 yr−1, respectively.

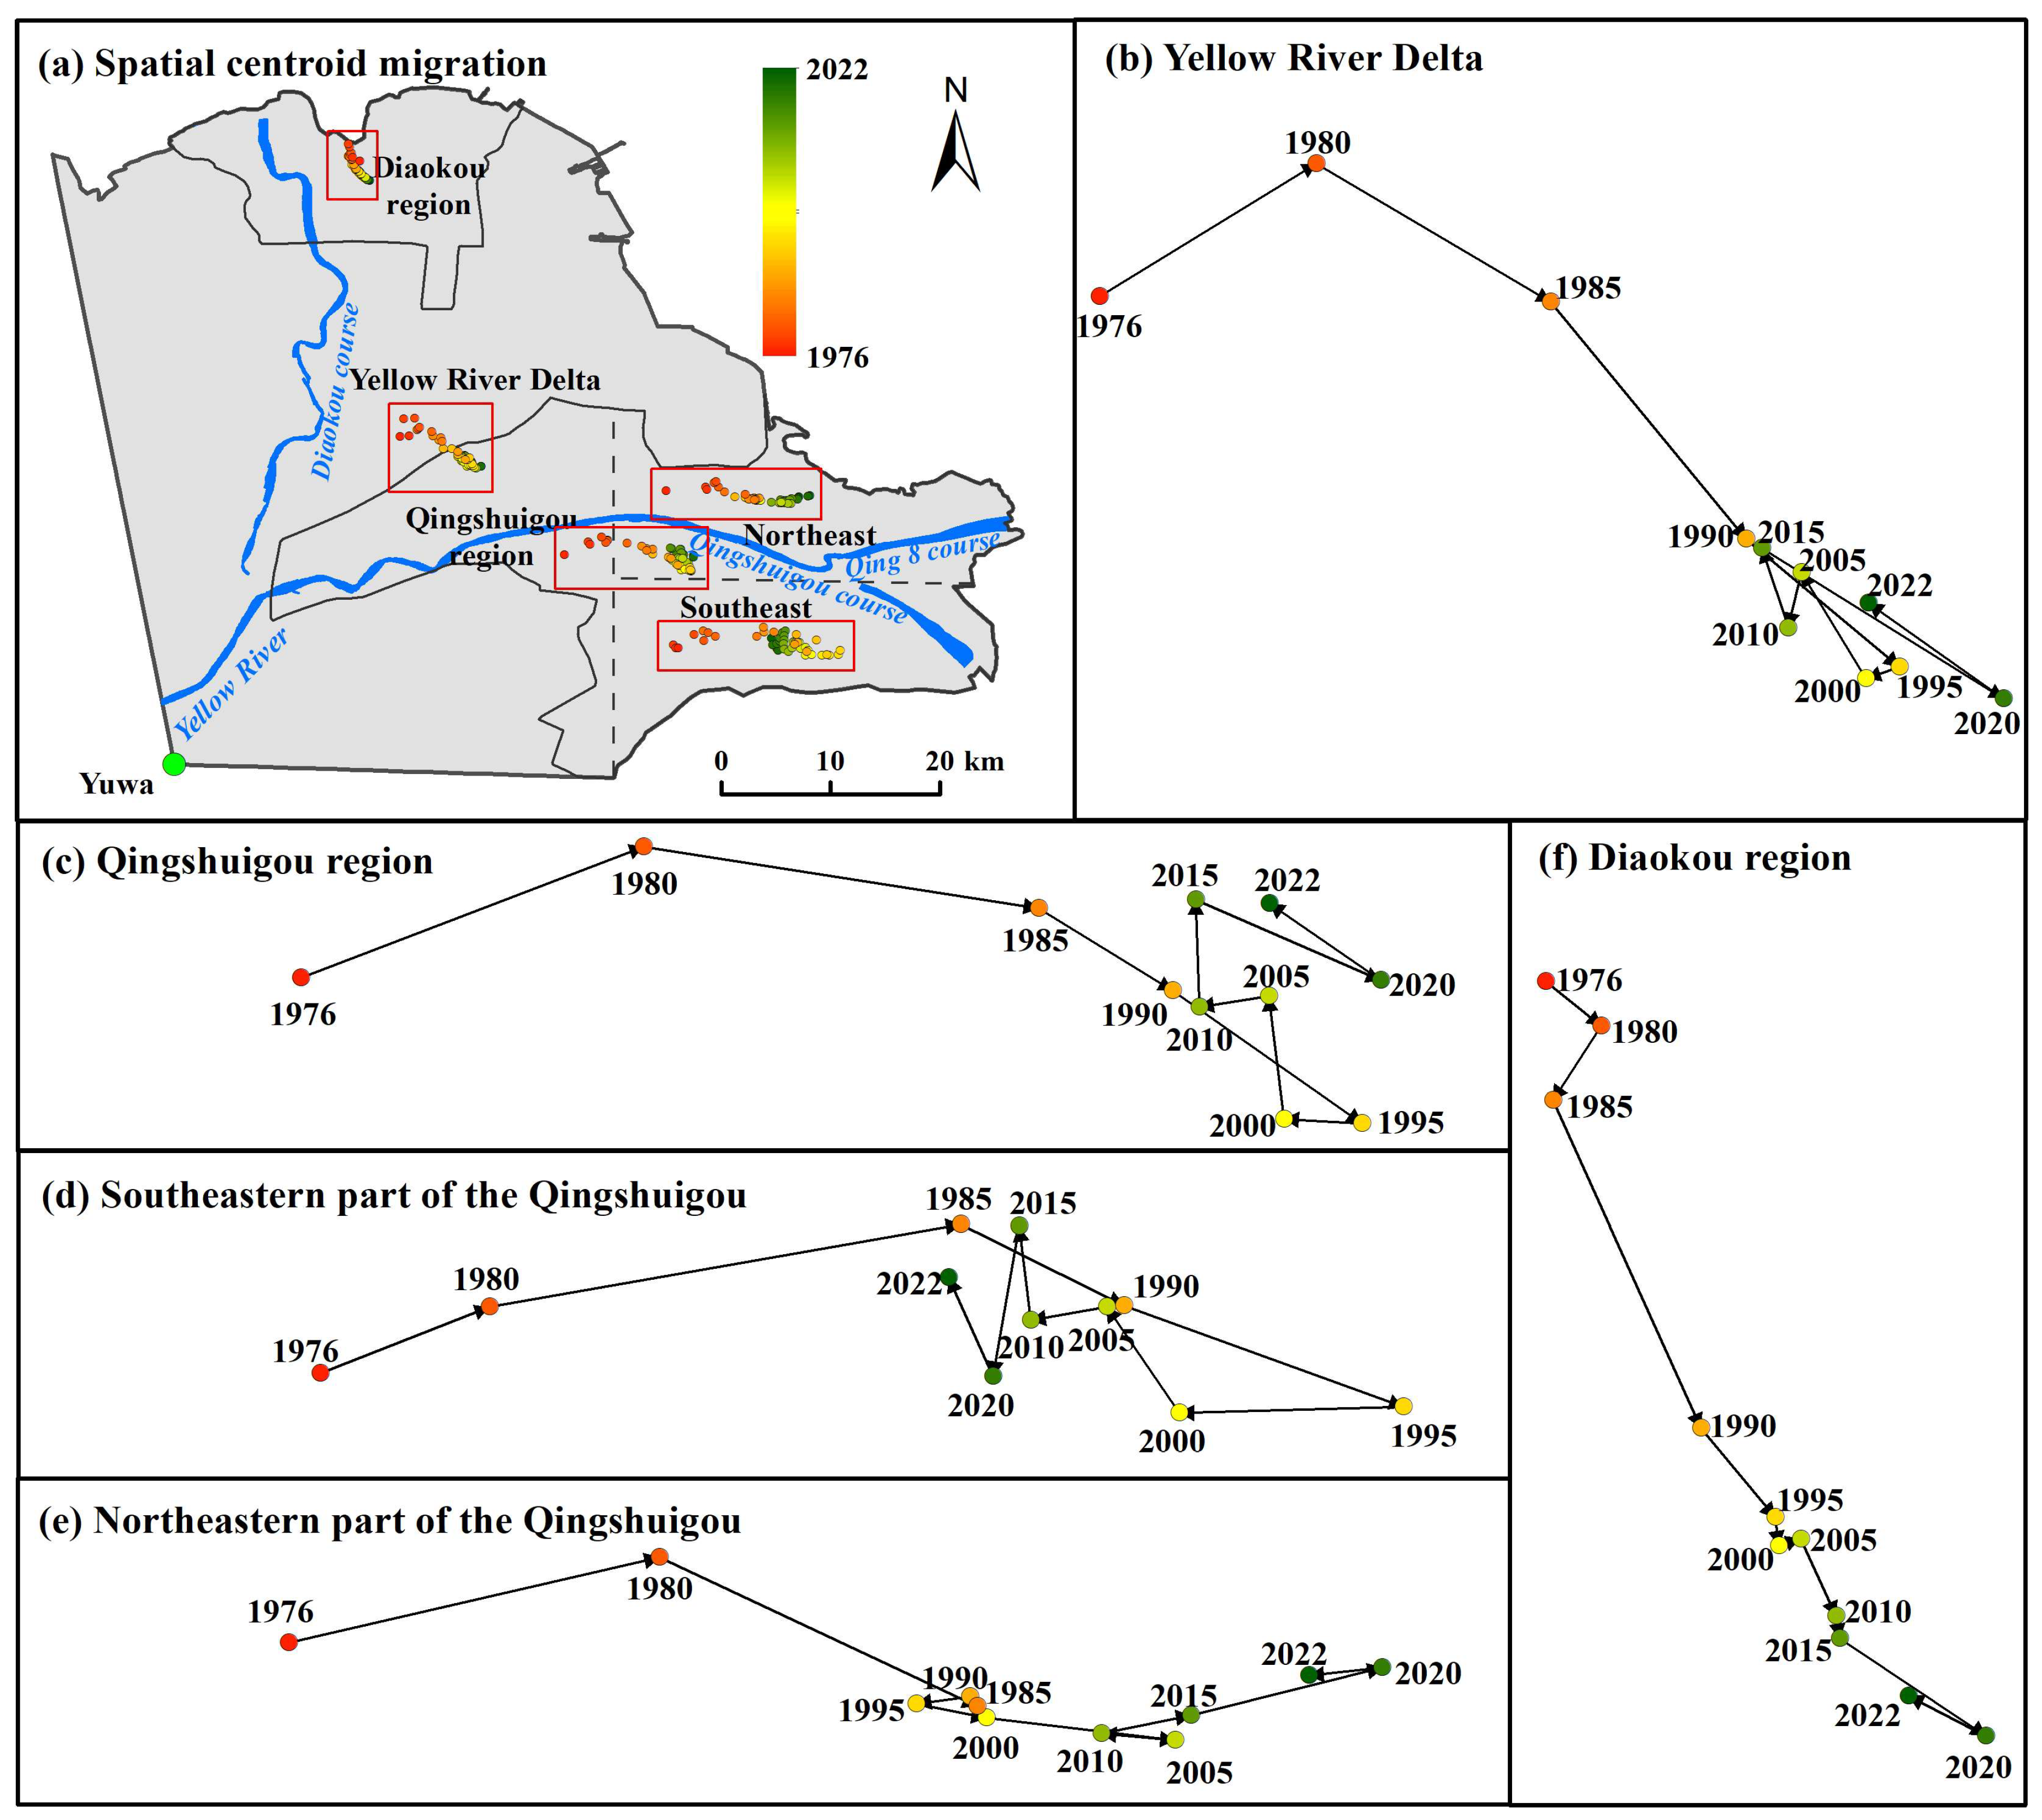
3.2.4. Migration of the Gravity Center

The distribution and migration of the gravity center of land were further examined in the YRD and its subregions. As shown in Figure 9, the land gravity center movement exhibited substantial variations across different regions from 1976 to 2022. The gravity center of land in the whole YRD moved from northwest to southeast overall (Figure 9b). The land centroid in the Qingshuigou region first moved from northwest to southeast and then from south to north (Figure 9c). The migration of the gravity center in the southeast of the Qingshuigou region was remarkably different from that in the northeast. In the southeast of the Qingshuigou, the land gravity center migration exhibited obvious stage characteristics (Figure 9d). It first moved to the northeast from 1976 to 1985, then moved to the southeast from 1985 to 1995, and then moved to the northwest from 1995 to 2022 (Figure 9d). The gravity center of the land in the northeastern region first moved to the northeast from 1976 to 1980, then moved to the southeast from 1980 to 2005, and then moved again to the northeast from 2010 to 2022 (Figure 9e). The land centroid in the Diaokou region mainly moved to the southeast over the study period (Figure 9f).

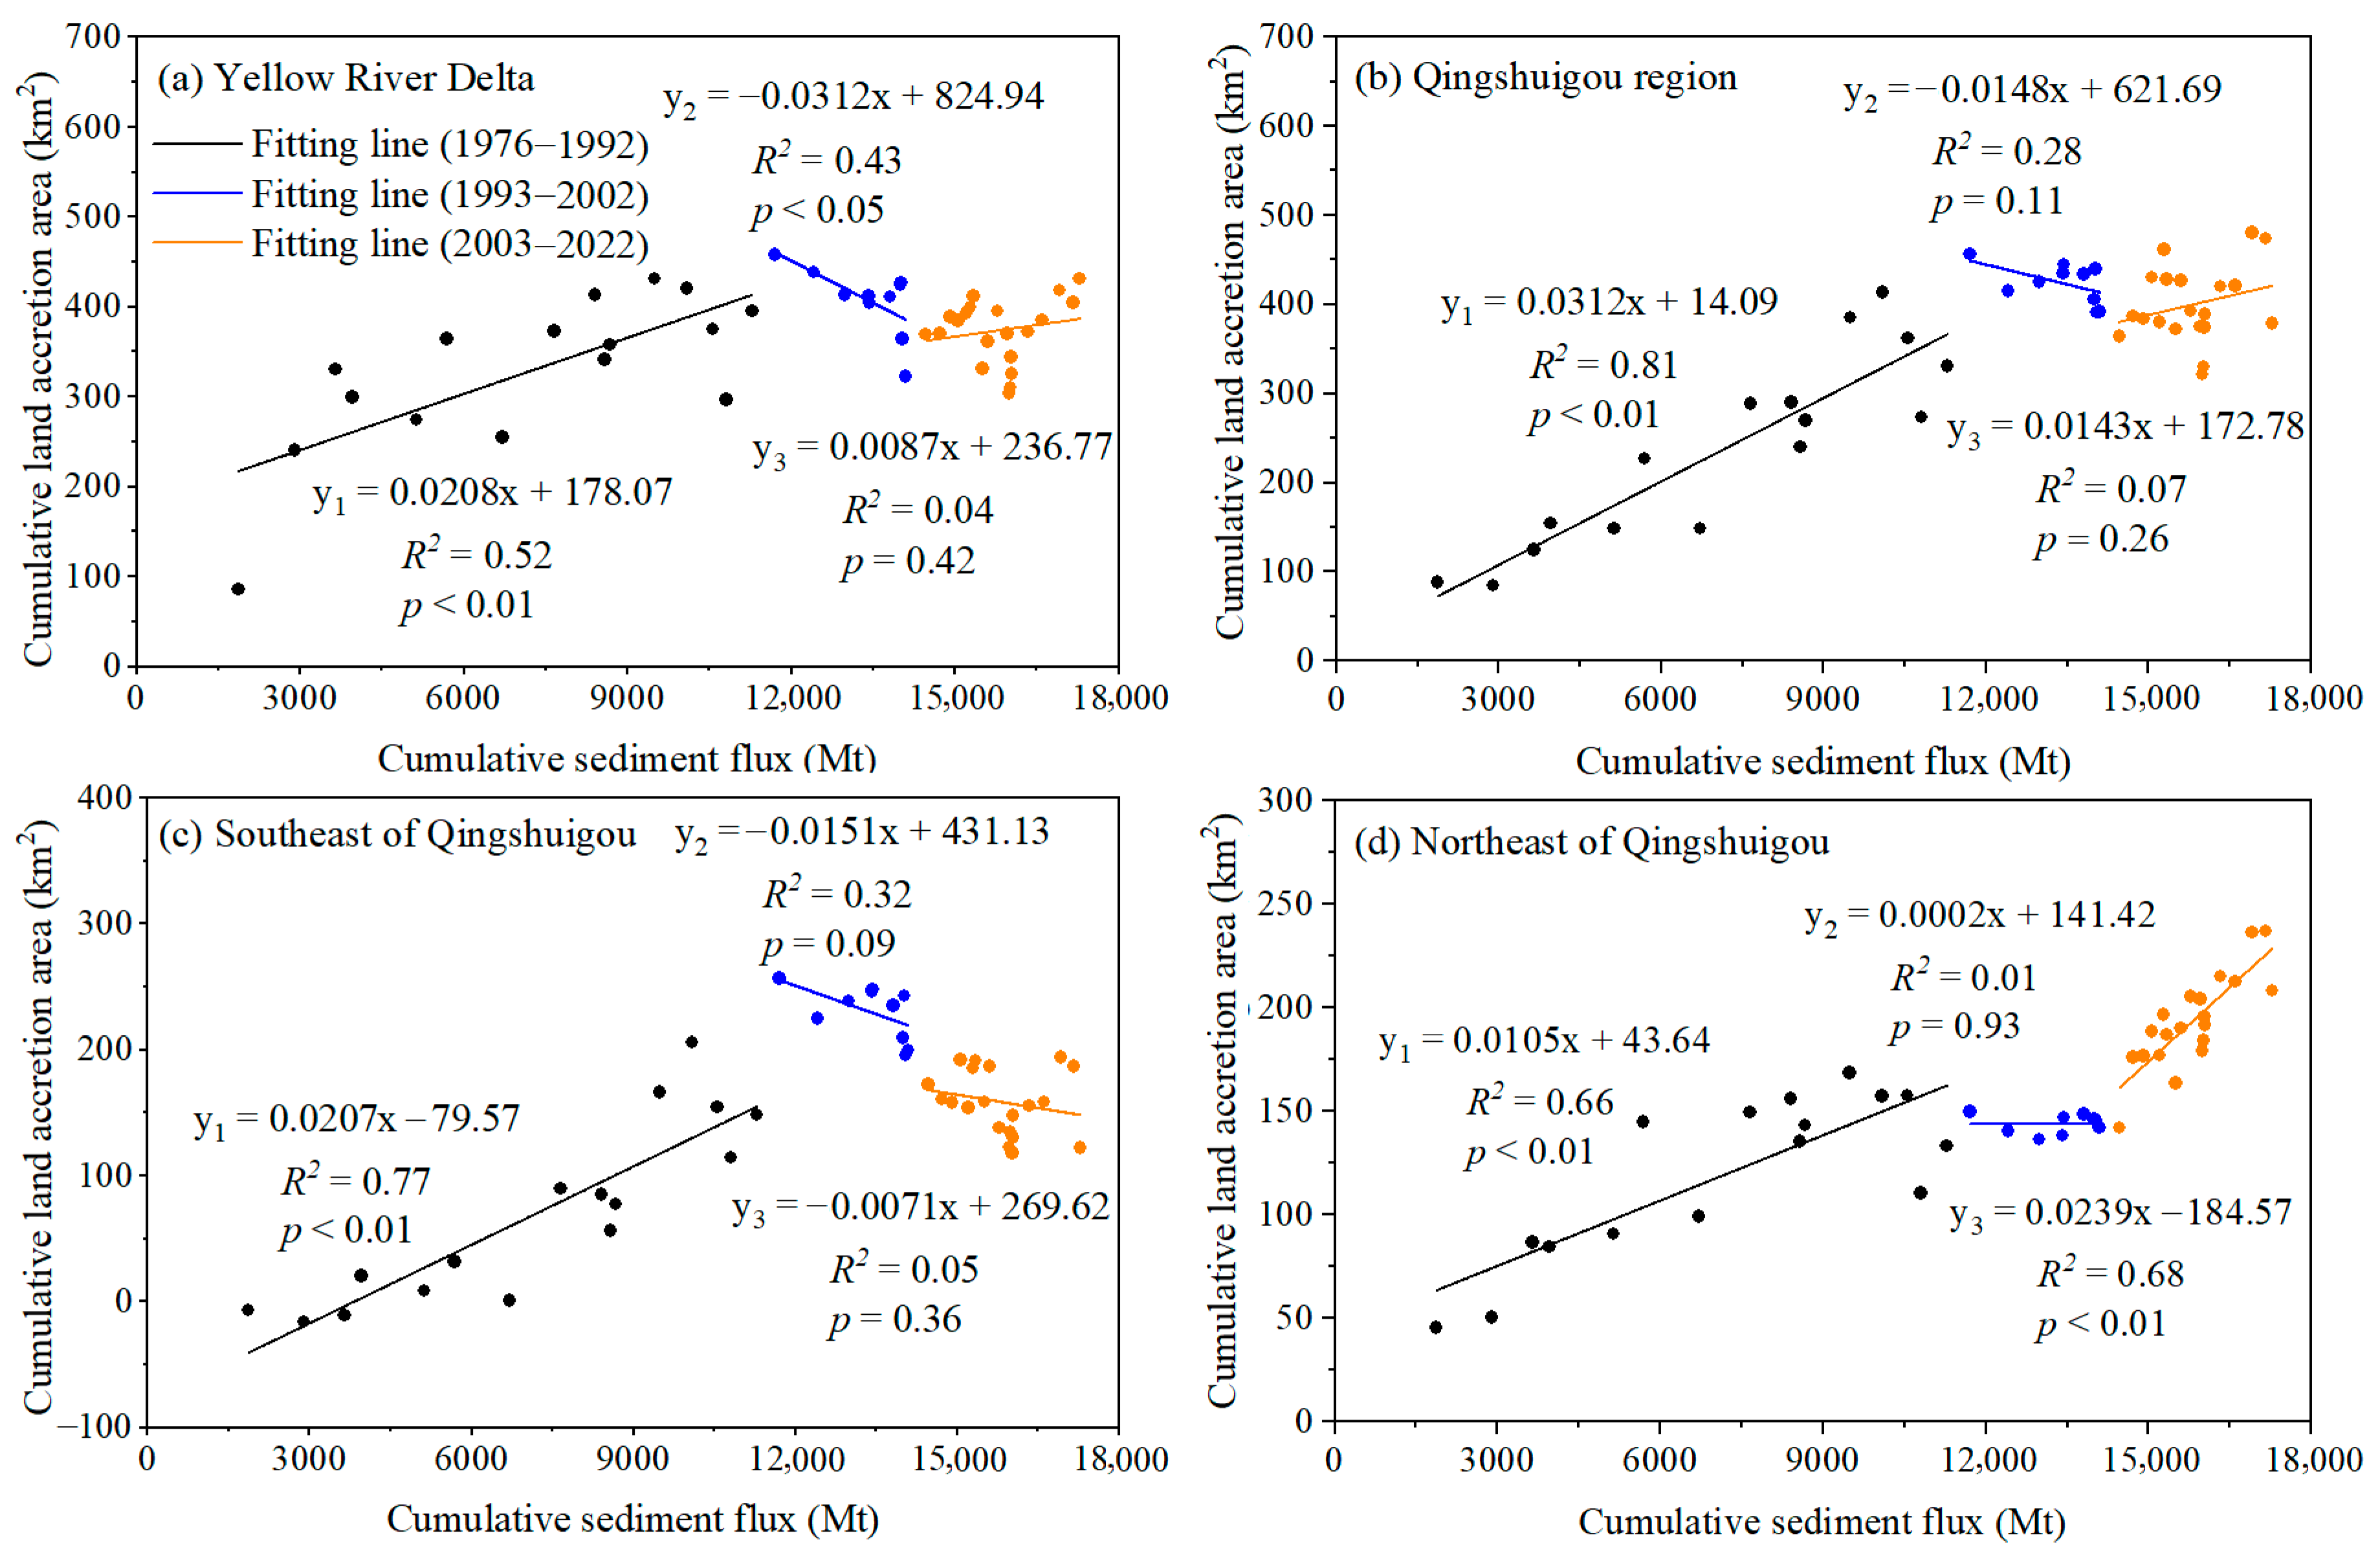
3.3. Quantitative Relationship Between YRD Evolution and Sediment Flux

There was a significant positive correlation between the cumulative annual sediment flux and cumulative annual water discharge (R2 = 0.99, p < 0.01) (Figure S1). Thus, this study primarily investigated the relationship between the cumulative annual sediment flux and cumulative annual land accretion area. Considering the severe cutoff from 1992 to 1999 in the Yellow River and the Xiaolangdi reservoir operation in 2002, we carried out the regression analysis over three phases: 1976–1992 (P1), 1993–2002 (P2), and 2003–2022 (P3) (Figure 10). The regression analysis revealed that the evolution of the YRD has predominantly been impacted by the sediment flux. For the whole YRD, the cumulative land accretion area during P1 increased significantly with the cumulative sediment flux (p < 0.01), whereas the cumulative land accretion area during P2 shrunk. In P3, the land accretion area gradually recovered with the increase in the cumulative sediment flux (Figure 10a). The relationship between the accumulative land accretion area and accumulative sediment flux in the Qingshuigou region was similar to that in the whole YRD (Figure 10b). A comparison of the two subregions in the Qingshuigou region during P1 shows that the cumulative land accretion area significantly increased with the cumulative sediment flux, whereas during P2 and P3, the relationship between the two showed opposite trends in the two subregions (Figure 10c,d), which may be linked to the artificial channel diversion in 1996.

4. Discussion

4.1. Staged Changes in Water–Sediment Fluxes

The Yellow River Basin is susceptible to the strength of the monsoon. Before 2000, most of the basin suffered from severe droughts due to the weakening of the monsoon strength [38]. At the same time, the annual average precipitation decreased (Figure 2c), and the annual average temperature increased due to global warming (Figure S2). Rising temperatures exacerbated evaporation, leading to further reductions in the runoff [39]. Human activities have also had a considerable influence on the decrease in water–sediment fluxes. The basin has been undergoing significant population expansion and economic advancement, leading to continuous increases in human water consumption for industrial, agricultural, and domestic purposes [40]. The use of unreasonable irrigation methods on arable land has resulted in water resource waste. From the 1970s to the 1990s, soil conservation engineering measures, including terrace farming and check dam construction, played a significant role in decreasing the sediment flux in this region [41]. For example, the terraced area in the 12 tributary catchments that contribute the most to the Yellow River’s sediment flux increased from 2% in 1979 to 7% in 1999 [15]. Consequently, due to reduced precipitation and heightened human activities, the Yellow River experienced many no-flow events in the 1990s, especially in 1997, when a severe drought occurred in the Yellow River and no-flow event lasted for 226 days (Figure S3).
Since 2000, there have been no additional no-flow events in the Yellow River. In contrast to the first phase, the water discharge displayed an increasing trend, whereas the sediment flux consistently maintained low levels (Figure 2). This behavior was primarily attributed to the Xiaolangdi reservoir implementation in 2002. By working together with Xiaolangdi and other reservoirs, the Yellow River Conservancy Commission (YRCC) effectively managed the discharge of water and sediment into the downstream areas of the Yellow River [42]. These regulation measures typically lasted one month a year and produced significant effects on the sediment flux into the sea. Moreover, large-scale vegetation restoration policies, such as the Grain for Green Program (GFGP) and the Natural Forest Conservation Program (NFCP), have also reduced soil losses since the 2000s [43]. The preceding analysis suggests that the impact of human activities on the water discharge and sediment flux is becoming increasingly significant.

4.2. Evolution Pattern of the Yellow River Delta

In this study, we utilized remote sensing imagery to uncover the annual variations in the coastline length and land area across the whole YRD region and its subregions. It was found that the coastline length of the whole YRD exhibited an increasing trend from 1976 to 2022, whereas the land area experienced three distinct stages: a rapid growth stage from 1976 to 1993, a rapid decrease stage from 1993 to 2002, and a gradual recovery stage from 2002 to 2022 (Figure 5). The rapid area growth in the first stage was mainly related to the change in the estuary location from the Diaokou course to the Qingshuigou course in May 1976 [25]. From 1976 to 1993, the new delta lobe in the Qingshuigou region began to develop rapidly. For the second decrease stage, the Yellow River Basin experienced severe droughts and intense human activities (e.g., terrace and check-dam construction) [15]. Moreover, the escalation of water and sediment diversion for industrial and agricultural purposes along the Yellow River also played an important role in diminishing sediment transportation. Thus, the coastal erosion became dominant from 1993 to 2002, and the land area tended to decrease. For the third recovery stage, the unified operation of water and sediment began to implement, resulting in an increase in sediment flux. However, the implementation of soil conservation strategies in the middle Yellow River has demonstrated ongoing effectiveness in the mitigation of soil erosion, leading to a notable reduction in the overall sediment flux entering the river system at its origin (Figure S4). Furthermore, the water and sediment adjustment projects have led to a rapid influx of sediment into the sea, and it is expected that the sediment within the reservoir will gradually diminish as these adjustments continue to be made [44]. In recent years, the coarse sediment density of the estuary flowing into the sea has diminished, accompanied by an increase in the fine particle proportion, resulting in the creation of a plume flow that moves within the upper stratum of the sea [15]. This plume flow now serves as the primary mode of transporting sediment from the Yellow River into the sea. The sediment transport dynamics of the plume flow are significantly more intense compared to previous heavy flow events, primarily due to the impact of runoff and tides. Consequently, the land-forming processes associated with the plume flow are characterized by increased complexity and difficulty. At the same time, the delta lobe in the southeast of Qingshuigou is strongly eroded by ocean dynamics such as waves and currents. Overall, the sedimentation in the YRD has been slightly greater than the erosion since 2002, and the land-forming area is still in the slow increase stage, which is basically consistent with previous studies [45].
According to the analysis, it was also observed that the changes in the land area in the Qingshuigou region significantly diverged from those observed in the Diaokou region. The evolution of the land area in the Qingshuigou region was similar to that of the whole YRD; that is, the area of Qingshuigou first increased from 1976 to 1993 and then decreased from 1993 to 2003. Subsequently, it attained a state of relative equilibrium of sedimentation and erosion from 2003 onwards. In contrast, the Diaokou area had a progressive decreasing trend from 1976 to 2022 (Figure 8), which was mainly related to the artificial channel diversion from the Diaokou course to the Qingshuigou course in 1976 [36]. Similarly, a further artificial channel diversion in 1996 significantly affected the area changes in different subregions of the Qingshuigou region (Figure 7). The frequent no-flow events and the operation of the Xiaolangdi reservoir also had important influences on the land changes in different subregions of the Qingshuigou region.
Further analysis revealed that the change in the water and sediment fluxes into the sea also affected the movement of the land gravity center (Figure 9). The Qingshuigou region has gained more water and sediment fluxes since the waterway diversion in 1976; thus, the land gravity center of this area has moved rapidly from inland to the sea. Due to the recent decrease in the water–sediment fluxes, the movement of the land gravity center has moved slowly in the Qingshuigou region. In contrast, the land gravity center in the Diaokou region has moved inland because there is no supply of water and sediment fluxes.

4.3. Relationship Between Sediment Flux and Land Accretion Area

The sediment flux into the sea serves as the main driving factor for the creation of the YRD [46]. The relationship between the cumulative sediment flux and cumulative land accretion area was explored in detail, presenting spatiotemporal differentiation in the YRD from 1976 to 2022 (Figure 10). Considering the impacts of the severe cutoff from 1992 to 1999 and the Xiaolangdi reservoir operation in 2002 on the sediment flux, this study conducted regression analysis for the three periods: 1976–1992 (P1), 1993–2002 (P2), and 2003–2022 (P3).
From 1976 to 1992, the cumulative land accretion area increased significantly with the cumulative sediment flux in the YRD (Figure 10). In this early stage of the diversion from the Diaokou course to the Qingshuigou course, the water and sediment were sufficient, and the estuary region was wide and shallow, which accelerated the deposition of sediment in land formations [47,48]. In this period, although the Diaokou land area obviously receded under the combined effects of waves and tides, the YRD as a whole was still in a state of sedimentation rather than erosion.
From 1993 to 2002, the cumulative land accretion area shrank with the cumulative sediment flux in the YRD, except for the northeast of Qingshuigou (Figure 10). The Yellow River Basin encountered increasingly severe droughts and a decrease in sediment inflow to the river in this period [49]. In addition, human activities, including the artificial diversions, soil conservation measures, dam and reservoir construction, and increasing water extraction, also produced strong effects on the sediment transport in the lower Yellow River so that the land area erosion exceeded the sediment deposition.
From 2003 to 2022, the cumulative land accretion area expanded with the cumulative sediment flux in the YRD, except for the southeast of Qingshuigou region (Figure 10). The Xiaolangdi reservoir began operating in this period and was combined with upstream reservoirs (e.g., the Longyangxia and Liujiaxia reservoirs) to implement unified water and sediment regulation, which increased the sediment flux [50]. Thus, the water–sediment regulation has supported the growth of the delta.

4.4. Implications and Limitations

This study demonstrated that the YRD evolution is primarily shaped by the water–sediment fluxes into the sea, a process that is significantly influenced by climate change and human interventions across the whole basin. Against the background of less water and less sediment, the delta’s future is not optimistic. Specifically, the current estuary of the YRD is generally able to maintain a fairly consistent rate of land accretion. However, in the long term, the sediment flux entering the Yellow River has been significantly reduced at its source due to soil conservation measures such as dam and reservoir construction. The volume of sediment that can be dredged through water and sediment regulation projects in the reservoir areas continues to decline, whereas increasing water and sediment diversion for industrial and agricultural use along the river course has exacerbated reductions in both the sediment flux into the sea and the sediment–water ratio. Additionally, the northern Diaokou coastal segments and the abandoned flow course lobes in the southeast are undergoing continuous erosion and retreat under marine dynamics. Concurrently, the sedimentation process in the Qing 8 course of the current flow path is gradually slowing down. As a result, the overall land area of the delta is projected to decrease in the future. Thus, it is essential to conduct a comprehensive study on the basin–estuary continuum, balance the impact of reduced sediment production in the middle Yellow River and sediment interception by the Xiaolangdi reservoir on the evolution of the coastal land, and shift the sediment management of small watersheds in the middle Yellow River to the overall coordination of the whole basin. Soil and water conservation measures should give priority to terrace construction and conservation tillage as source control measures. Furthermore, water and sediment regulation should properly increase the sediment flux into the sea, and artificial water and sediment replenishment for the Diaokou and Qingshuigou courses is necessary to maintain healthy estuarine wetlands and support the sustainable development of the whole YRD.
Considering the important influence of the water–sediment fluxes into the sea on the coastal sedimentation during the flood season, we mainly selected remote sensing images after the flood season to extract the coastline for the current year. However, due to the influence of clouds, when there were no available images after the flood season, only images from other time periods could be selected. In addition, the evolutions of the coastline and land area in the YRD have been affected by a variety of natural and human activities. For example, large-scale coastal reclamations were conducted to facilitate oilfield development and aquaculture [51], and the length of the artificial coastline rapidly increased (Figure S5), partially impacting the correlation between the land area of the YRD and the sediment flux.

5. Conclusions

This study investigated the changes in water and sediment fluxes from the Yellow River into the sea and their detailed impacts on delta evolution from 1976 to 2022. There was a significant downward trend in sediment flux into the sea but a non-significant downward trend in water discharge from 1976 to 2022. Furthermore, two distinct stages were identified in the water and sediment fluxes into the sea: both decreased significantly from 1976 to 1999, whereas they increased or stabilized from 2000 onwards. The YRD evolution was characterized by spatial and temporal heterogeneity. The land area in the whole YRD and the Qingshuigou region exhibited three stages: a rapid growth stage (1976–1993), a rapid retreat stage (1993–2002), and a gradual recovery stage (2002–2022). However, the land area in the Diaokou region had a decreasing trend from 1976 to 2022, which was linked to the artificial channel diversion from the Diaokou course to the Qingshuigou course in 1976.
The regression analysis indicated that the relationships between the cumulative sediment flux into the sea and the cumulative land accretion area presented spatiotemporal differentiation in the YRD from 1976 to 2022. From 1976 to 1992, the cumulative land accretion area increased significantly with the cumulative sediment flux in the whole YRD. From 1993 to 2002, the cumulative land accretion area shrunk with the cumulative sediment flux in the YRD, except for the northeast of Qingshuigou. From 2003 to 2022, the cumulative land accretion area expanded with the cumulative sediment flux in the YRD, except for the southeast of Qingshuigou. This study provides a more detailed and clear understanding of the relationships between water–sediment fluxes into the sea and the evolution of the whole delta and its subregions in different periods. The results provide a scientific reference for flow channels management and coastal wetland protection in the YRD.

Supplementary Materials

The following supporting information can be downloaded at: https://www.mdpi.com/article/10.3390/land14040834/s1, Figure S1: Relationship between the cumulative sediment flux and cumulative water discharge from 1976 to 2022; Figure S2: Annual variations in temperature in the Yellow River Basin from 1976 to 2022; Figure S3: The cutoff days at the Lijin hydrological station of the Yellow River from 1976 to 2022; Figure S4: Annual variations in (a) water discharge and (b) sediment flux at the Tongguan and Huayuankou hydrological stations from 1976 to 2022; Figure S5: Natural and artificial coastline length in the Yellow River Delta from 1976 to 2022.

Author Contributions

Methodology, B.Y.; data curation, C.W.; writing—original draft preparation, B.Y.; investigation, Z.Z.; funding acquisition, B.Y. and Z.Z.; writing—review and editing, B.Y., C.W., and Z.Z. All authors have read and agreed to the published version of the manuscript.

Funding

This work was supported by the National Natural Science Foundation of China (Grant No. 42007413) and the 2024 Youth Enlightenment Program Project of the Institute of Agricultural Information, Chinese Academy of Agricultural Sciences (Grant No. JBYW-AII-2024-48).

Data Availability Statement

The raw data supporting the conclusions of this article will be made available by the authors on request.

Conflicts of Interest

The authors declare no conflicts of interest.

References

  1. Elsey-Quirk, T.; Graham, S.A.; Mendelssohn, I.A.; Snedden, G.; Day, J.W.; Twilley, R.R.; Shaffer, G.; Sharp, L.A.; Pahl, J.; Lane, R.R. Mississippi river sediment diversions and coastal wetland sustainability: Synthesis of responses to freshwater, sediment, and nutrient inputs. Estuar. Coast. Shelf Sci. 2019, 221, 170–183. [Google Scholar] [CrossRef]
  2. Giosan, L.; Syvitski, J.; Constantinescu, S.; Day, J. Climate change: Protect the world’s deltas. Nature 2014, 516, 31–33. [Google Scholar] [CrossRef] [PubMed]
  3. Schuerch, M.; Spencer, T.; Temmerman, S.; Kirwan, M.L.; Wolff, C.; Lincke, D.; McOwen, C.J.; Pickering, M.D.; Reef, R.; Vafeidis, A.T.; et al. Future response of global coastal wetlands to sea-level rise. Nature 2018, 561, 231–234. [Google Scholar] [CrossRef]
  4. Li, L.; Ni, J.; Chang, F.; Yue, Y.; Frolova, N.; Magritsky, D.; Borthwick, A.G.L.; Ciais, P.; Wang, Y.; Zheng, C.; et al. Global trends in water and sediment fluxes of the world’s large rivers. Sci. Bull. 2020, 65, 62–69. [Google Scholar] [CrossRef] [PubMed]
  5. Bussi, G.; Darby, S.E.; Whitehead, P.G.; Jin, L.; Dadson, S.J.; Voepel, H.E.; Vasilopoulos, G.; Hackney, C.R.; Hutton, C.; Berchoux, T.; et al. Impact of dams and climate change on suspended sediment flux to the Mekong delta. Sci. Total Environ. 2021, 755, 142468. [Google Scholar] [CrossRef]
  6. Yin, S.; Gao, G.; Ran, L.; Lu, X.; Fu, B. Spatiotemporal variations of sediment discharge and in-reach sediment budget in the Yellow River from the headwater to the delta. Water Resour. Res. 2021, 57, e2021WR030130. [Google Scholar] [CrossRef]
  7. Lämmle, L.; Perez Filho, A.; Donadio, C.; Arienzo, M.; Ferrara, L.; Santos, C.d.J.; Souza, A.O. Anthropogenic pressure on hydrographic basin and coastal erosion in the delta of Paraíba do Sul River, Southeast Brazil. J. Mar. Sci. Eng. 2022, 10, 1585. [Google Scholar] [CrossRef]
  8. Molina, R.; Manno, G.; Villar, A.C.d.; Jigena-Antelo, B.; Muñoz-Pérez, J.J.; Cooper, J.A.G.; Pranzini, E.; Anfuso, G. The effects of anthropic structures on coastline morphology: A case study from the Málaga Coast (Spain). J. Mar. Sci. Eng. 2025, 13, 319. [Google Scholar] [CrossRef]
  9. Edmonds, D.A.; Toby, S.C.; Siverd, C.G.; Twilley, R.; Bentley, S.J.; Hagen, S.; Xu, K. Land loss due to human-altered sediment budget in the Mississippi River Delta. Nat. Sustain. 2023, 6, 644–651. [Google Scholar] [CrossRef]
  10. El Banna, M.M.; Frihy, O.E. Human-induced changes in the geomorphology of the northeastern coast of the Nile delta, Egypt. Geomorphology 2009, 107, 72–78. [Google Scholar] [CrossRef]
  11. Li, X.; Liu, J.P.; Saito, Y.; Nguyen, V.L. Recent evolution of the Mekong Delta and the impacts of dams. Earth Sci. Rev. 2017, 175, 1–17. [Google Scholar] [CrossRef]
  12. Vericat, D.; Batalla, R.J. Sediment transport in a large impounded river: The lower Ebro, NE Iberian Peninsula. Geomorphology 2006, 79, 72–92. [Google Scholar] [CrossRef]
  13. Luo, J.; Dai, Z.; Wang, J.; Lou, Y.; Zhou, X.; Tang, R. Effects of human-induced riverine sediment transfer on deposition–erosion in the South Passage of the Changjiang (Yangtze) delta. J. Hydrol. 2023, 622, 129714. [Google Scholar] [CrossRef]
  14. Yu, B.; Zang, Y.; Wu, C.; Zhao, Z. Spatiotemporal dynamics of wetlands and their future multi-scenario simulation in the Yellow River Delta, China. J. Environ. Manag. 2024, 353, 120193. [Google Scholar] [CrossRef]
  15. Wang, S.; Fu, B.; Piao, S.; Lü, Y.; Ciais, P.; Feng, X.; Wang, Y. Reduced sediment transport in the Yellow River due to anthropogenic changes. Nat. Geosci. 2016, 9, 38–41. [Google Scholar] [CrossRef]
  16. Wang, H.; Bi, N.; Saito, Y.; Wang, Y.; Sun, X.; Zhang, J.; Yang, Z. Recent changes in sediment delivery by the Huanghe (Yellow River) to the sea: Causes and environmental implications in its estuary. J. Hydrol. 2010, 391, 302–313. [Google Scholar] [CrossRef]
  17. Wang, H.; Yang, Z.; Saito, Y.; Liu, J.P.; Sun, X.; Wang, Y. Stepwise decreases of the Huanghe (Yellow River) sediment load (1950–2005): Impacts of climate change and human activities. Glob. Planet. Change 2007, 57, 331–354. [Google Scholar] [CrossRef]
  18. Ji, H.; Chen, S.; Pan, S.; Xu, C.; Jiang, C.; Fan, Y. Morphological variability of the active Yellow River mouth under the new regime of riverine delivery. J. Hydrol. 2018, 564, 329–341. [Google Scholar] [CrossRef]
  19. Wang, H.; Wu, X.; Bi, N.; Syvitski, J.; Saito, Y. Impacts of the dam-orientated water-sediment regulation scheme on the lower reaches and delta of the Yellow River (Huanghe): A review. Glob. Planet. Change 2017, 157, 93–113. [Google Scholar] [CrossRef]
  20. Yi, Y.; Wang, X.; Liu, Q.; Zhang, J.; Yi, Q. Influence of water–sediment regulation scheme on accretion and erosion in a river delta: A case study of the Yellow River Delta, China. Estuaries Coasts 2022, 45, 1879–1887. [Google Scholar] [CrossRef]
  21. Meng, L.; Wang, L.; Wang, Q.; Zhao, J.; Zhang, G.; Zhan, C.; Liu, X.; Cui, B.; Zeng, L. Geochemical characteristics of the modern Yellow River Delta sediments and their response to evolution of the sedimentary environment. Front. Mar. Sci. 2024, 11, 1370336. [Google Scholar] [CrossRef]
  22. Sun, Z.; Niu, X. Variation tendency of coastline under natural and anthropogenic disturbance around the abandoned Yellow River Delta in 1984-2019. Remote Sens. 2021, 13, 3391. [Google Scholar] [CrossRef]
  23. Bi, N.; Wang, H.; Wu, X.; Saito, Y.; Xu, C.; Yang, Z. Phase change in evolution of the modern Huanghe (Yellow River) Delta: Process, pattern, and mechanisms. Mar. Geol. 2021, 437, 106516. [Google Scholar] [CrossRef]
  24. Liu, Z.; Xu, N.; Wang, J. Satellite-observed evolution dynamics of the Yellow River Delta in 1984-2018. IEEE J. Sel. Top. Appl. Earth Obs. Remote Sens. 2020, 13, 6044–6050. [Google Scholar] [CrossRef]
  25. Kong, D.; Miao, C.; Borthwick, A.G.; Duan, Q.; Liu, H.; Sun, Q.; Ye, A.; Di, Z.; Gong, W. Evolution of the Yellow River Delta and its relationship with runoff and sediment load from 1983 to 2011. J. Hydrol. 2015, 520, 157–167. [Google Scholar] [CrossRef]
  26. Zhou, Y.; Huang, H.Q.; Nanson, G.C.; Huang, C.; Liu, G. Progradation of the Yellow (Huanghe) River delta in response to the implementation of a basin-scale water regulation program. Geomorphology 2015, 243, 65–74. [Google Scholar] [CrossRef]
  27. Cui, B.L.; Li, X.Y. Coastline change of the Yellow River estuary and its response to the sediment and runoff (1976–2005). Geomorphology 2011, 127, 32–40. [Google Scholar] [CrossRef]
  28. Wu, X.; Bi, N.; Xu, J.; Nittrouer, J.A.; Yang, Z.; Saito, Y.; Wang, H. Stepwise morphological evolution of the active Yellow River (Huanghe) delta lobe (1976–2013): Dominant roles of riverine discharge and sediment grain size. Geomorphology 2017, 292, 115–127. [Google Scholar] [CrossRef]
  29. Li, S.N.; Wang, G.X.; Deng, W.; Hu, Y.M.; Hu, W.W. Influence of hydrology process on wetland landscape pattern: A case study in the Yellow River Delta. Ecol. Eng. 2009, 35, 1719–1726. [Google Scholar] [CrossRef]
  30. Zhu, Q.; Li, P.; Li, Z.; Pu, S.; Wu, X.; Bi, N.; Wang, H. Spatiotemporal changes of coastline over the Yellow River Delta in the previous 40 years with optical and SAR remote sensing. Remote Sens. 2021, 13, 1940. [Google Scholar] [CrossRef]
  31. Chu, Z.X.; Sun, X.G.; Zhai, S.K.; Xu, K.H. Changing pattern of accretion/erosion of the modern Yellow River (Huanghe) subaerial delta, China: Based on remote sensing images. Mar. Geol. 2006, 227, 13–30. [Google Scholar] [CrossRef]
  32. Cui, B.; He, Q.; An, Y. Community structure and abiotic determinants of salt marsh plant zonation vary across topographic gradients. Estuaries Coasts 2011, 34, 459–469. [Google Scholar] [CrossRef]
  33. Ning, Z.; Cui, B.; Chen, C.; Xie, T.; Gao, W.; Zhang, Y.; Zhu, Z.; Shao, D.; Li, D.; Bai, J. Tidal channel meanders serve as stepping-stones to facilitate cordgrass landward spread by creating invasion windows. Ecol. Appl. 2023, 34, e2813. [Google Scholar] [CrossRef] [PubMed]
  34. Mann, H.B. Nonparametric tests against trend. Econometrica 1945, 13, 245–259. [Google Scholar] [CrossRef]
  35. Hassan, M.A.; Church, M.; Yan, Y.; Slaymaker, O. Spatial and temporal variation of in-reach suspended sediment dynamics along the mainstem of Changjiang (Yangtze River), China. Water Resour. Res. 2010, 46, W11551. [Google Scholar] [CrossRef]
  36. Li, C.; Zhu, L.; Dai, Z.; Wu, Z. Study on spatiotemporal evolution of the Yellow River Delta coastline from 1976 to 2020. Remote Sens. 2021, 13, 4789. [Google Scholar] [CrossRef]
  37. Lefever, D.W. Measuring geographic concentration by means of the standard deviational ellipse. Am. J. Sociol. 1926, 32, 88–94. [Google Scholar] [CrossRef]
  38. Wang, F.; Wang, Z.; Yang, H.; Zhao, Y. Study of the temporal and spatial patterns of drought in the Yellow River basin based on SPEI. Sci. China Earth Sci. 2018, 61, 1098–1111. [Google Scholar] [CrossRef]
  39. Gardner, L.R. Assessing the effect of climate change on mean annual runoff. J. Hydrol. 2009, 379, 351–359. [Google Scholar] [CrossRef]
  40. Zhao, Q.; Tian, G.; Jing, X.; Hu, H. Impact of economic development and environmental regulations on greywater footprint loads in the Yellow River Basin in China. Ecol. Ind. 2023, 154, 110586. [Google Scholar] [CrossRef]
  41. Liu, Y.; Song, H.; An, Z.; Sun, C.; Trouet, V.; Cai, Q.; Liu, R.; Leavitt, S.W.; Song, Y.; Li, Q.; et al. Recent anthropogenic curtailing of Yellow River runoff and sediment load is unprecedented over the past 500 y. Proc. Natl. Acad. Sci. USA 2020, 117, 18251–18257. [Google Scholar] [CrossRef] [PubMed]
  42. Xu, B.; Yang, D.; Burnett, W.C.; Ran, X.; Yu, Z.; Gao, M.; Diao, S.; Jiang, X. Artificial water sediment regulation scheme influences morphology, hydrodynamics and nutrient behavior in the Yellow River estuary. J. Hydrol. 2016, 539, 102–112. [Google Scholar] [CrossRef]
  43. Liang, W.; Bai, D.; Wang, F.; Fu, B.; Yan, J.; Wang, S.; Yang, Y.; Long, D.; Feng, M. Quantifying the impacts of climate change and ecological restoration on streamflow changes based on a Budyko hydrological model in China’s Loess Plateau. Water Resour. Res. 2015, 51, 6500–6519. [Google Scholar] [CrossRef]
  44. Wu, X.; Bi, N.; Syvitski, J.; Saito, Y.; Xu, J.; Nittrouer, J.A.; Bianchi, T.S.; Yang, Z.; Wang, H. Can reservoir regulation along the Yellow River be a sustainable way to save a sinking delta? Earth’s Future 2020, 8, e2020EF001587. [Google Scholar] [CrossRef]
  45. Yu, J.; Fu, Y.; Li, Y.; Han, G.; Wang, Y.; Zhou, D.; Meixner, F.X. Effects of water discharge and sediment load on evolution of modern Yellow River Delta, China, over the period from 1976 to 2009. Biogeosciences 2011, 8, 2427–2435. [Google Scholar] [CrossRef]
  46. Ji, H.; Chen, S.; Pan, S.; Xu, C.; Tian, Y.; Li, P.; Liu, Q.; Chen, L. Fluvial sediment source to sink transfer at the Yellow River Delta: Quantifications, causes, and environmental impacts. J. Hydrol. 2022, 608, 127622. [Google Scholar] [CrossRef]
  47. Zhang, L.; Xing, H.; Li, P.; Ma, P.; Shi, H. Analysis of the evolution of the Yellow River Delta coastline and the response of the tidal current field. Front. Mar. Sci. 2023, 10, 1232060. [Google Scholar] [CrossRef]
  48. Shi, H.; Ma, P.; Sun, J.; Zhao, S.; Ma, R.; Li, L.; Zhan, C.; Liang, H. Study on the response mechanism of the Yellow River delta region to the cold wave process. Front. Mar. Sci. 2024, 11, 1430823. [Google Scholar] [CrossRef]
  49. Wang, Y.; Wang, S.; Zhao, W.; Liu, Y. The increasing contribution of potential evapotranspiration to severe droughts in the Yellow River basin. J. Hydrol. 2022, 605, 127310. [Google Scholar] [CrossRef]
  50. Xia, X.; Dong, J.; Wang, M.; Xie, H.; Xia, N.; Li, H.; Zhang, X.; Mou, X.; Wen, J.; Bao, Y. Effect of water-sediment regulation of the Xiaolangdi reservoir on the concentrations, characteristics, and fluxes of suspended sediment and organic carbon in the Yellow River. Sci. Total Environ. 2016, 571, 487–497. [Google Scholar] [CrossRef]
  51. Xie, C.; Cui, B.; Xie, T.; Yu, S.; Liu, Z.; Chen, C.; Ning, Z.; Wang, Q.; Zou, Y.; Shao, X. Hydrological connectivity dynamics of tidal flat systems impacted by severe reclamation in the Yellow River Delta. Sci. Total Environ. 2020, 739, 139860. [Google Scholar] [CrossRef] [PubMed]
Figure 1. Location of the modern Yellow River Delta and its current flow paths into the sea.
Land 14 00834 g001
Figure 2. Annual variations in (a) water discharge and (b) sediment flux at the Lijin hydrological station and (c) annual average precipitation in the Yellow River Basin from 1976 to 2022.
Land 14 00834 g002
Figure 3. Relationships between (a) the cumulative precipitation and cumulative water discharge and (b) the cumulative precipitation and cumulative sediment flux from 1976 to 2022.
Land 14 00834 g003
Figure 4. The dynamics of the coastline in the Yellow River Delta from 1976 to 2022.
Land 14 00834 g004
Figure 5. Variations in the (a) coastline length and (b) land area of the Yellow River Delta from 1976 to 2022.
Land 14 00834 g005
Figure 6. Variations in the (a) coastline length and (b) land area of the Qingshuigou region from 1976 to 2022.
Land 14 00834 g006
Figure 7. Area changes in the (a) southeastern and (b) northeastern regions of Qingshuigou from 1976 to 2022.
Land 14 00834 g007
Figure 8. Variations in the (a) coastline length and (b) land area of the Diaokou region from 1976 to 2022.
Land 14 00834 g008
Figure 9. Spatial migration of the gravity center of the land from 1976 to 2022.
Land 14 00834 g009
Figure 10. Relationship between cumulative sediment flux and cumulative land accretion area in different regions and periods.
Land 14 00834 g010
Table 1. Landsat images used in this study.
IDImage DateSensor TypeBandsResolution (m)IDImage DateSensor TypeBandsResolution (m)
11976.08.31MSS480252000.10.17TM730
21977.10.01MSS480262001.10.12ETM+830
31978.07.07MSS480272002.09.29ETM+830
41979.10.18MSS480282003.10.26TM730
51980.07.14MSS480292004.09.10TM730
61981.06.12MSS480302005.10.15TM730
71982.02.01MSS480312006.10.02TM730
81983.07.07MSS480322007.06.15TM730
91984.07.17TM730332008.10.07TM730
101985.11.25TM730342009.08.23TM730
111986.06.05TM730352010.09.11TM730
121987.06.08TM730362011.09.22ETM+830
131988.12.03TM730372012.11.27ETM+830
141989.11.20TM730382013.09.03OLI930
151990.06.16TM730392014.10.24OLI930
161991.10.09TM730402015.10.27OLI930
171992.09.25TM730412016.10.13OLI930
181993.10.30TM730422017.09.30OLI930
191994.09.15TM730432018.10.19OLI930
201995.09.18TM730442019.08.19OLI930
211996.08.19TM730452020.10.24OLI930
221997.10.09TM730462021.11.12OLI930
231998.09.10TM730472022.09.28OLI930
241999.08.28TM730
Table 2. Trends of annual water discharge and sediment flux at the Lijin hydrological station and annual average precipitation in the Yellow River Basin from 1976 to 2022.
VariableZmann-kendallSignificance Test
Water discharge−1.16p > 0.05
Sediment flux−4.97p < 0.01
Precipitation1.19p > 0.05
Table 3. Statistics of annual water and sediment fluxes at two time periods.
VariablePeriodMaximumMinimumMeanZmann-kendal
Annual water discharge1976–1999489.29 (1983)17.86 (1997)227.52−3.40 **
2000–2022441.10 (2021)41.90 (2002)192.742.38 **
Annual sediment flux1976–19991169.27 (1981)15.38 (1997)583.26−3.10 **
2000–2022369.00 (2003)7.70 (2017)142.990.53
** indicates the significance at p < 0.01 level.
Disclaimer/Publisher’s Note: The statements, opinions and data contained in all publications are solely those of the individual author(s) and contributor(s) and not of MDPI and/or the editor(s). MDPI and/or the editor(s) disclaim responsibility for any injury to people or property resulting from any ideas, methods, instructions or products referred to in the content.

