Article

Monitoring of Soil Salinization and Analysis of Driving Factors in the Oasis Zone of South Xinjiang

1
College of Resources and Environment, Xinjiang Agricultural University, Urumqi 830052, China
2
Xinjiang Engineering Technology Research Center of Soil Big Data, Urumqi 830052, China
3
Institute of Western Agriculture, CAAS, Changji 831100, China
*
Author to whom correspondence should be addressed.
Land 2025, 14(4), 803; https://doi.org/10.3390/land14040803
Submission received: 17 March 2025 / Revised: 6 April 2025 / Accepted: 7 April 2025 / Published: 8 April 2025

Abstract

:
Soil salinization significantly jeopardizes agricultural productivity and ecological stability in southern Xinjiang’s oasis regions, highlighting the urgent need to examine its spatial–temporal trends and driving mechanisms for improved resource management. Utilizing soil salinity measurements collected in 2010 and 2023, the current research applied multiple environmental variables processed via the Google Earth Engine (GEE) platform to evaluate the predictive capability of four machine learning algorithms—random forest (RF), Gradient Boosting Decision Tree (GBDT), Classification and Regression Tree (CART), and Support Vector Machine (SVM)—for accurate large-scale salinity mapping. Subsequently, a piecewise structural equation model (piecewiseSEM) was employed to quantitatively analyze the driving factors of soil salinization. Correlation analysis revealed seven critical variables—Red, NDSI, kNDVI, SDI, ET, elevation, and SM—as the most influential among the 41 environmental factors assessed for their impact on soil salinity. The performance evaluation ranked the models as follows: RF > GBDT > SVM > CART, with RF achieving the highest predictive accuracy (R2 = 0.756, RMSE = 2.265 g·kg−1, MAE = 1.468 g·kg−1). Between 2010 and 2023, soil salinization severity in the region exhibited a slight overall decrease; however, the extent of this reduction was relatively modest. The proportion of moderately and severely salinized areas declined, accompanied by reduced spatial variability, whereas the extent of mildly salinized soils increased markedly. These findings imply that soil salinity primarily experiences internal redistribution within the surface layers, with limited downward leaching. Evapotranspiration (ET) and soil moisture (SM) were identified as the dominant drivers affecting salinity dynamics during both periods, with the influence of SM becoming more pronounced over time. This trend highlights that in conditions of limited natural variability, human-induced irrigation practices have emerged as the primary regulator of soil salinity levels. The findings of this study provide novel methodologies and data support for the monitoring and prevention of soil salinization in arid regions.

1. Introduction

Currently, soil salinization is an increasingly severe global issue and has become a major challenge restricting sustainable agricultural development and ecological environmental improvement [1]. Soil salinization not only deteriorates soil structure and fertility but also directly inhibits crop growth and yield, thereby threatening food security and regional economic development [2,3]. In arid and semi-arid environments, soil salinization is exacerbated by a combination of limited precipitation, elevated evapotranspiration, shallow groundwater levels, and high concentrations of soluble salts [4]. Southern Xinjiang, located in the south portion of China’s Xinjiang Uygur Autonomous Region, is characterized by a quintessentially arid climate [5]. The interaction of its distinct geographical and climatic attributes, together with emerging trends such as regional warming, increased humidity, and evolving irrigation regimes, has contributed to the escalating prominence of soil salinization in the area. This phenomenon has led to persistent land degradation and poses considerable challenges to the sustainable advancement of local agricultural production [6,7]. Therefore, conducting an in-depth investigation into soil salinization in this region is of critical importance.
Most conventional studies have relied on field sampling combined with laboratory analyses to determine soil salinity. However, these approaches typically require substantial investments of labor, resources, and time and frequently suffer from uneven spatial distributions of sampling points [8,9]. Therefore, determining how to efficiently monitor soil salinity over large areas using more advanced techniques has become a crucial issue in soil salinization research. Conventional soil mapping methods typically derive the spatial distribution of soil salinity from measured soil salinity data through spatial interpolation based on geostatistical methods [10,11,12]. Nevertheless, the accuracy of spatial interpolation methods is directly influenced by sampling density; insufficient sampling points may fail to accurately reflect the spatial variability of soil salinity [13,14]. Numerous studies have demonstrated that remote sensing inversion techniques effectively leverage spectral information from remotely sensed imagery in combination with ground-truth measurements to predict soil salinity [15,16,17,18]. Remote sensing-based data inversion significantly enhances the accuracy and efficiency of monitoring efforts, enabling researchers to accurately obtain spatial distribution information of soil salinization over extensive geographic areas [19,20,21].
In recent years, rapid advancements in machine learning have significantly promoted progress in digital soil mapping methods, providing reliable predictive tools for soil salinization assessment [22,23]. These advanced methods enable efficient and accurate mapping of soil properties, addressing the shortcomings associated with conventional mapping techniques. Previous studies have employed machine learning methods such as RF, SVM, and GBDT for soil salinity inversion, achieving high-quality results with these selected models [24,25,26,27]. However, the accuracy of inversion results depends not only on the selected model but is also closely related to the environmental variables used as input. Some studies have indicated that using single spectral indices often has limitations; thus, methods such as variable selection, feature combination, and nonlinear modeling are necessary to more accurately represent soil salinity distribution [28,29,30]. Most studies have optimized spectral indices through selection processes or utilized high-order feature indices to circumvent issues of model complexity and collinearity, thereby enhancing inversion performance [31,32]. Currently, commonly applied methods for selecting feature variables include correlation analysis, grey relational analysis, and random forest importance assessment [33,34,35], among which correlation analysis and random forest importance assessment have received widespread recognition [36].
The driving factors of soil salinization are relatively complex, involving both natural factors and human activities. Although numerous studies have focused on analyzing the influencing factors of soil salinization in the Yellow River Delta and certain areas within Xinjiang [37,38], systematic investigations of the driving mechanisms of soil salinization in the oasis region of southern Xinjiang remain limited. Previous studies have applied geographically weighted regression (GWR) and geographic detector methods to identify driving factors of soil salinity in this region, yet they did not thoroughly examine the combined effects of multiple factors, such as climate change, human activities, and geographical conditions, on the salinization process [39,40]. Piecewise structural equation modeling (piecewiseSEM) has been widely employed to elucidate driving mechanisms underlying complex ecological processes [41]. This model can construct causal relationship networks, clearly demonstrating direct and indirect interactions among variables, thus providing greater clarity in ecological and environmental research [42]. Therefore, employing piecewiseSEM to investigate the driving factors of soil salinization could offer more precise guidance and data-driven support for salinization mitigation in the oasis region of southern Xinjiang.
For the Southern Xinjiang region of China, the research using machine learning combined with remote sensing inversion techniques is still relatively insufficient and mostly focused on the local scope [43,44], and the exploration of the dynamic changes in the driving factors also needs to be deepened. Therefore, by integrating multi-source remote sensing data and advanced machine learning algorithms, it is anticipated that the spatiotemporal distribution characteristics of soil salinization can be captured more accurately at a regional scale. Additionally, the comprehensive driving mechanisms of both natural and anthropogenic factors on the evolution process can be elucidated in greater depth. The objectives of this study are: (1) to systematically evaluate and compare the performance and applicability of different models—including RF, GBDT, SVM, and CART—in salinization inversion based on the selected optimal variables; (2) to draw high-precision spatial–temporal distribution maps of the salinization of the surface layer in the Southern Xinjiang Oasis Area, and to deeply analyze its dynamic characteristics; (3) to explore and analyze the impacts and variations in natural factors, terrain attributes, and human activities on the process of soil salinization. Through achieving these objectives, this research not only proposes a novel approach for soil salinity mapping in the region but also provides essential data support for soil salinization research and mitigation strategies in arid regions.

2. Materials and Methods
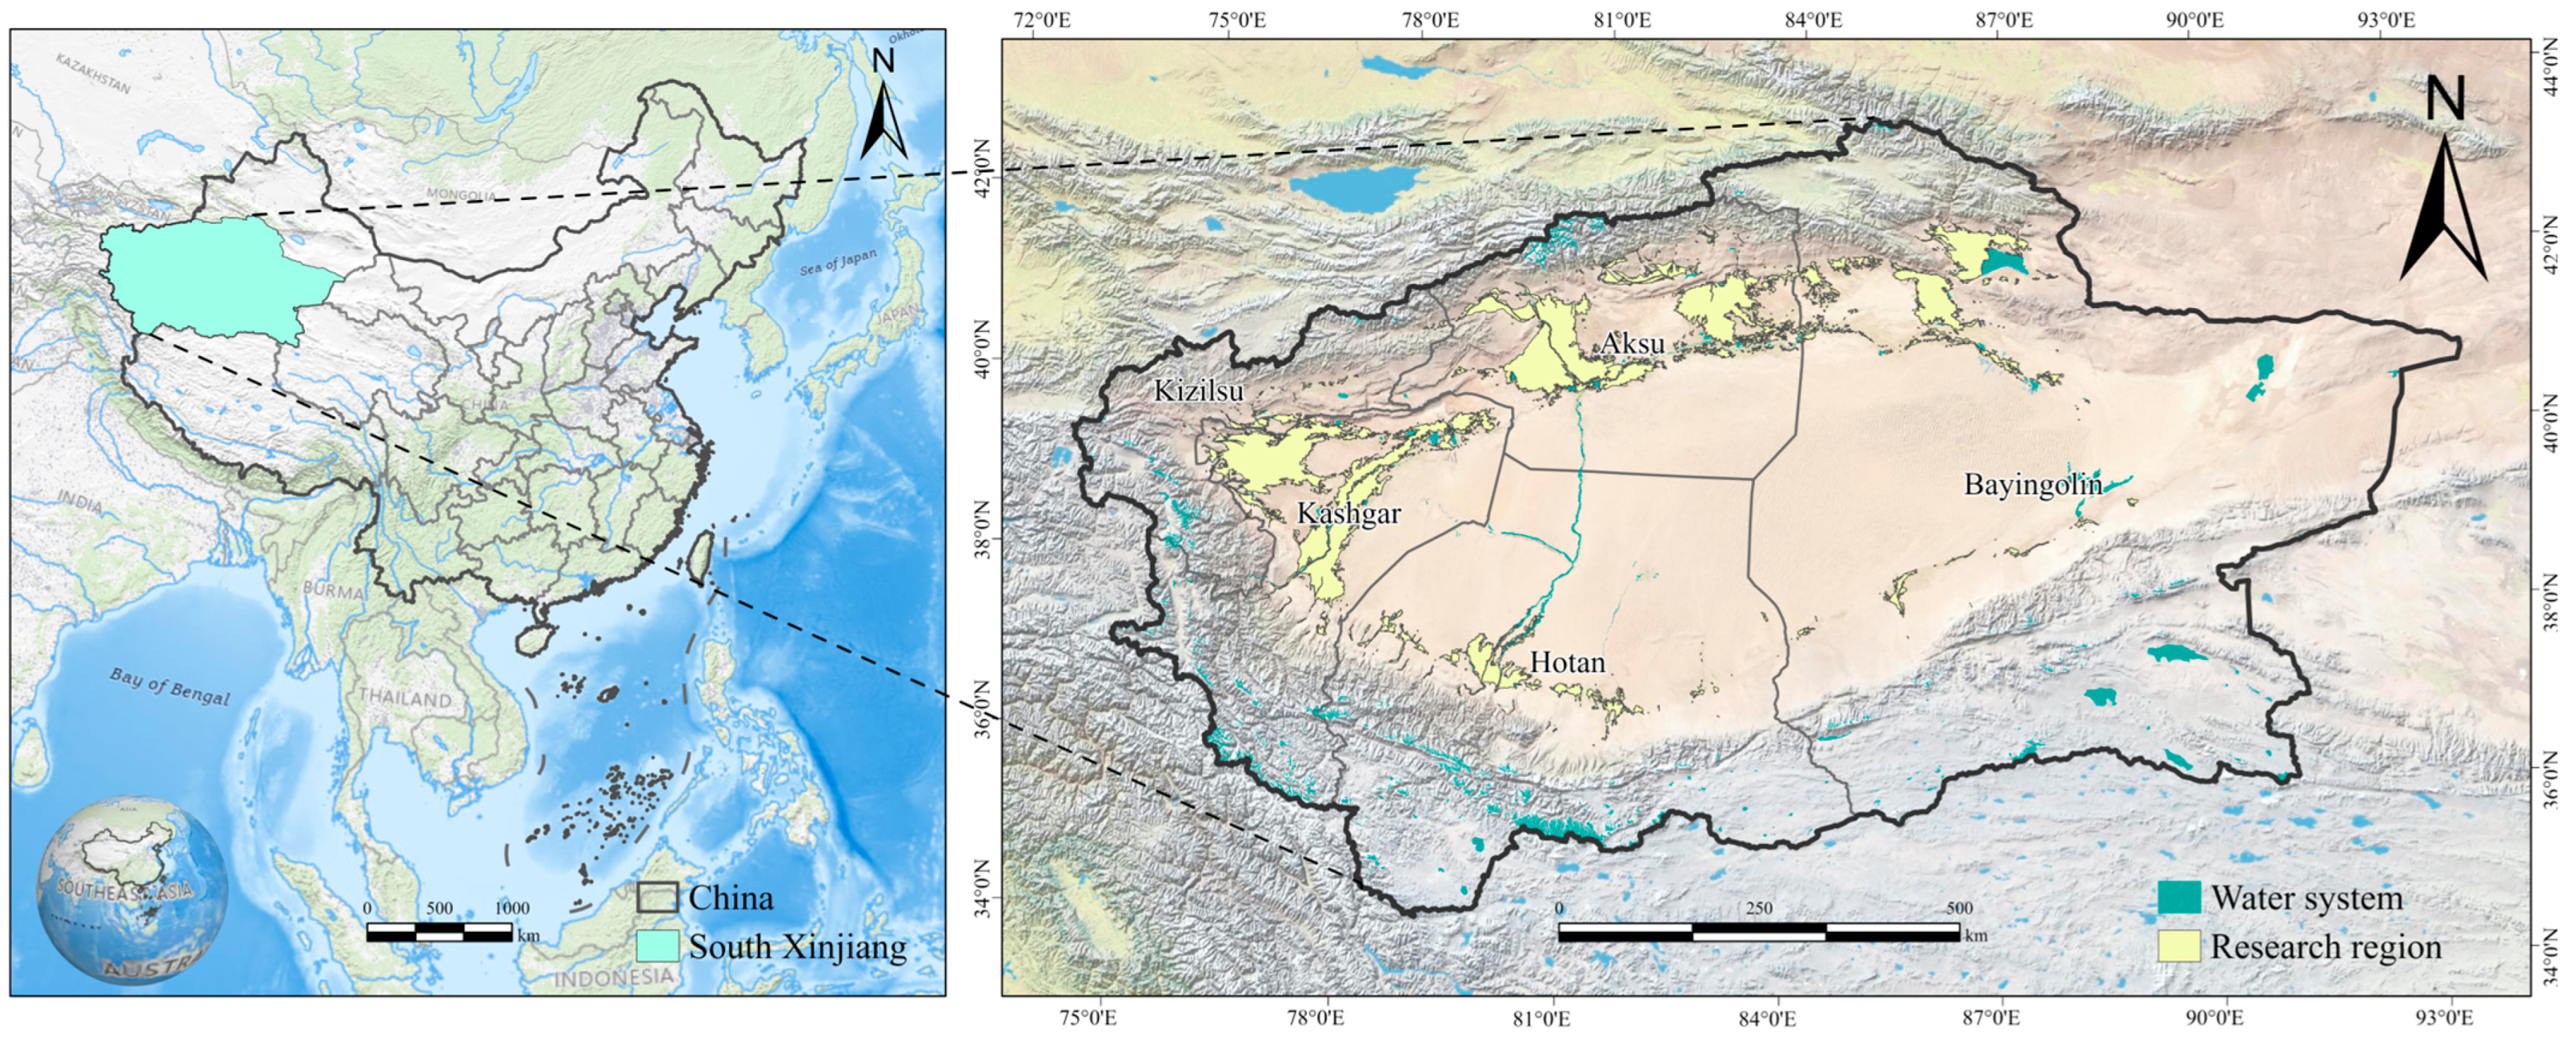
2.1. Study Area

The southern region of Xinjiang, centered around the Tarim Basin, lies south of the Tianshan Mountains within China’s Xinjiang Uygur Autonomous Region, encompassing Kashgar, Hotan, Aksu, Bayinguoleng Mongol Autonomous Prefecture, as well as Kizilsu and Kirgiz Autonomous Prefectures. This area exhibits typical geomorphological features of arid zones, characterized by numerous geological fault zones. It is bounded by the Tianshan, Kunlun, and Arjinshan Mountains, with the Taklamakan Desert—the world’s largest shifting sand desert—occupying its central region [45]. The topography gradually descends from peripheral mountain ranges toward the basin’s central region, creating a distinctive “mountain–oasis–desert” landscape. The climate is highly arid, characterized by annual precipitation below 200 mm and evaporation rates exceeding 2000 mm annually, leading to severe water scarcity. The Tarim River system, supplemented primarily by meltwater from alpine glaciers and snowpack, represents the main water source in the region [46]. Due to harsh environmental conditions, agricultural irrigation practices have gradually transitioned from traditional flood irrigation to more efficient drip irrigation methods. This research targets the oasis areas in southern Xinjiang, situated in low-lying zones adjacent to the Tianshan, Kunlun, and Altun Mountains. Despite their high biological productivity and intense human activities [47], these areas face increasingly severe soil salinization due to irrigation-induced water diversion, prolonged drought conditions, and topographic constraints. This situation poses threats not only to sustainable agricultural development but also to regional ecological stability. Therefore, precisely identifying the spatial patterns and primary factors driving soil salinization will provide critical scientific guidance for developing effective salinity mitigation strategies, optimizing water resource management, and supporting regional sustainability and ecological protection. An overview map of the study area is presented in Figure 1.

2.2. Data Sources and Processing

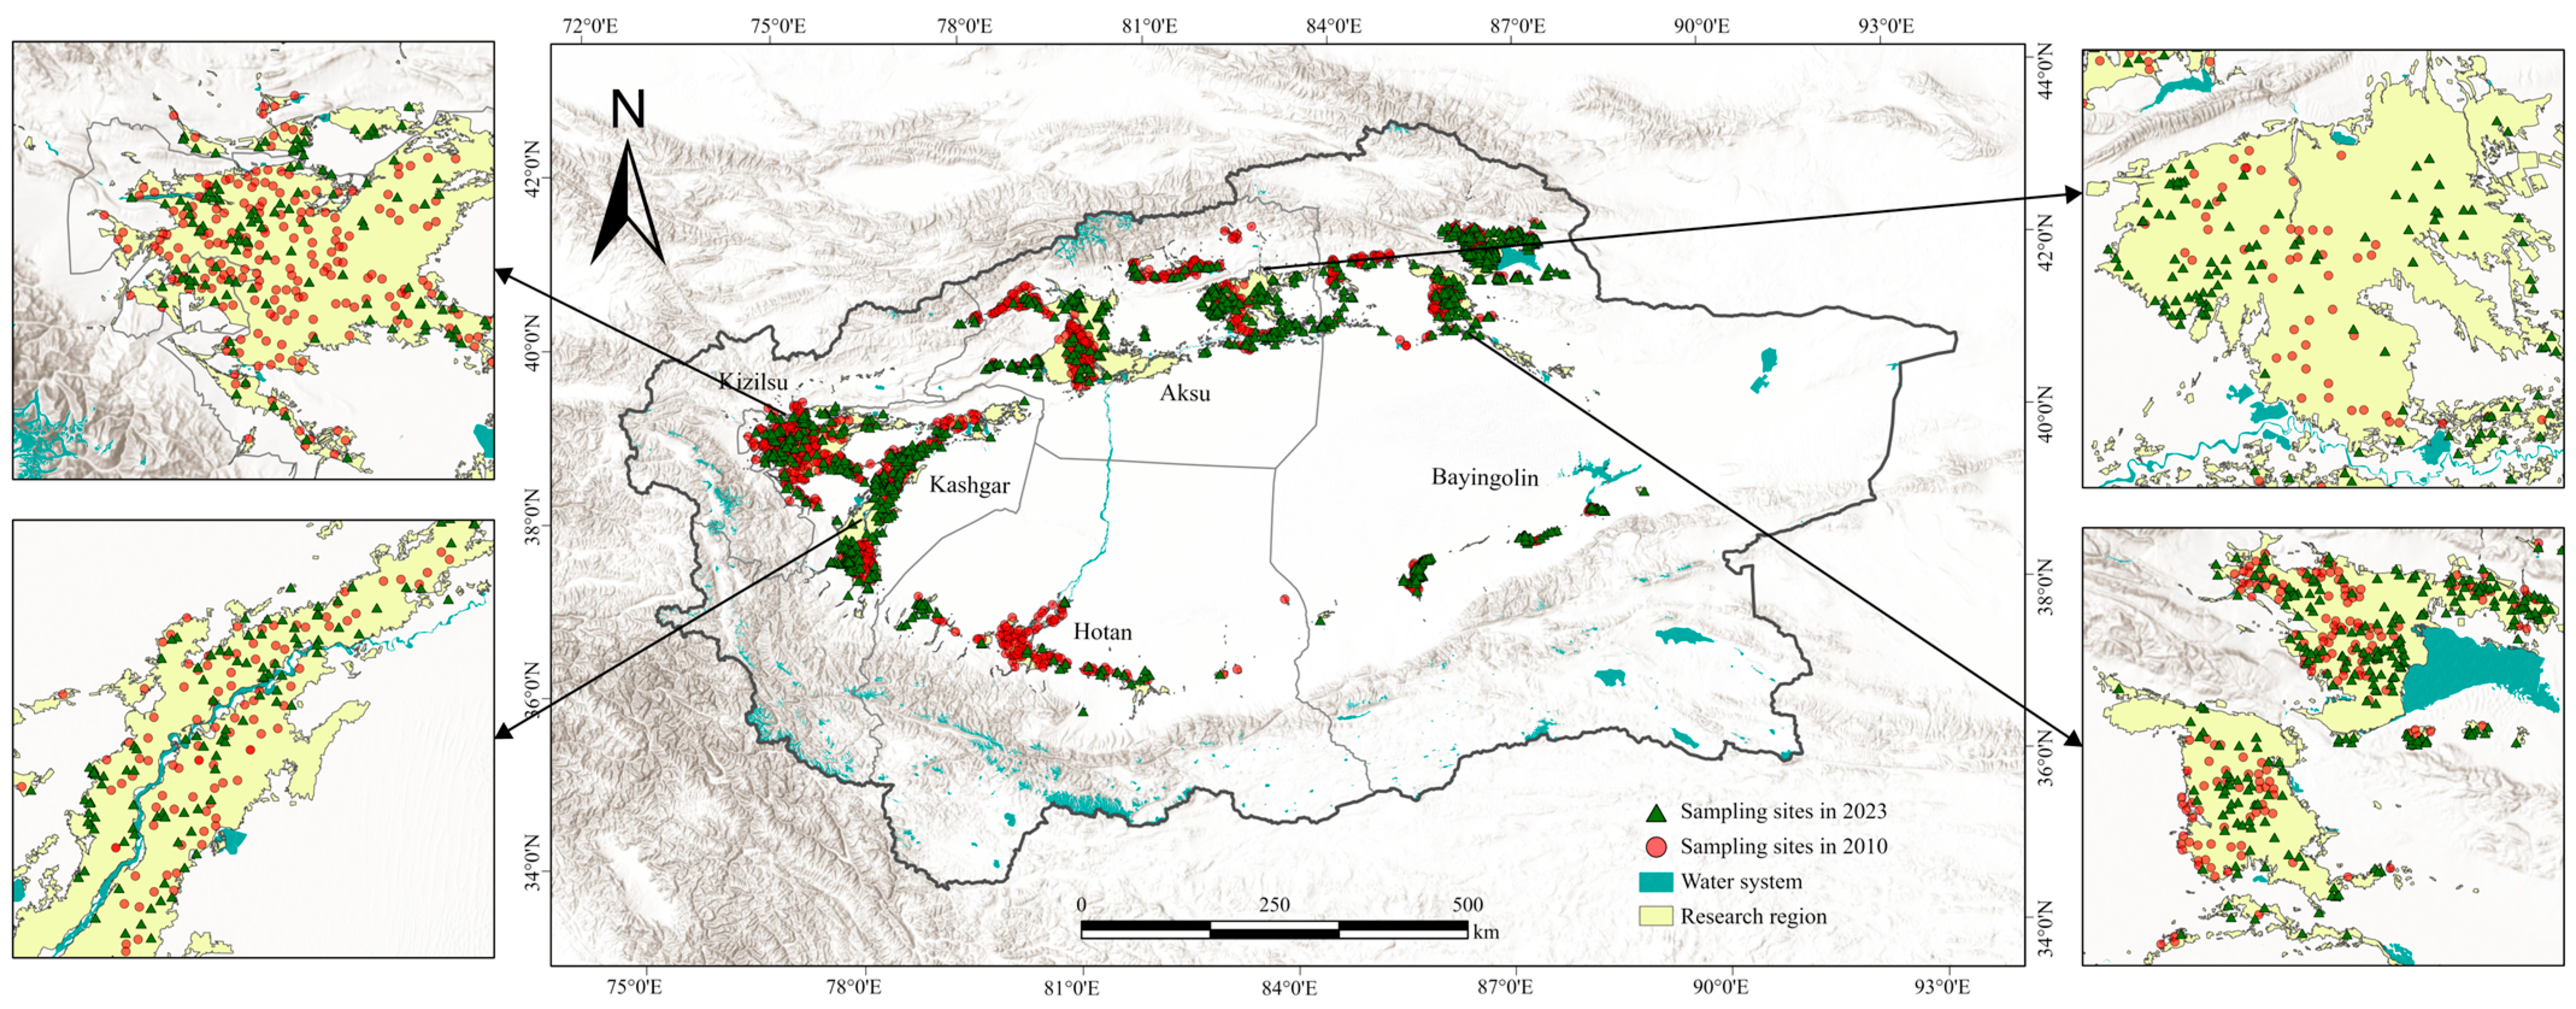
2.2.1. Measured Data

Soil salinity data utilized in the current research were obtained from field sampling conducted between 1 August and 1 November in 2010 and 2023. Given Xinjiang’s extensive geographical area and environmental complexity, it was crucial to ensure both representative sampling and an even spatial distribution of sample sites. Consequently, soil types, vegetation characteristics, and land-use practices were fully integrated into the sampling design process. A systematic 5 km × 5 km grid sampling approach was selected due to its effectiveness in capturing the significant environmental heterogeneity present in extensive areas like Xinjiang, ensuring comprehensive spatial coverage. At each grid location, the quincunx sampling strategy was applied, wherein soil samples from five sub-sampling points within a 30 m × 30 m area were combined to produce a composite sample. Samples of surface soil were collected from a depth of 0–30 cm within each 30 m × 30 m sampling plot. This sampling depth covers the primary rooting zone and cultivation layer, making it highly suitable for assessing the impact of soil salinization on agricultural productivity and vegetation growth in arid regions like southern Xinjiang. During sample collection, surface debris, including straw, roots, and gravel, were removed, and the soil was thoroughly homogenized. The quartering technique was then employed to discard excess soil, ensuring a representative subsample was retained for subsequent analyses. Following collection, soil samples were air-dried in shaded conditions at room temperature until achieving constant weight, then gently ground and sieved through a 2-mm mesh to remove coarse debris such as gravel and plant residues, leaving only the fine soil fraction for analysis. The sieved and dried soil samples were subsequently combined with water at a soil-to-water ratio of 1:5 to prepare aqueous extracts. The extracts underwent solvent evaporation via the dry residue method, and the resulting salts were weighed to quantify the soluble salt content (SSC, g·kg−1). This procedure provided an accurate assessment of the soil salinity levels across the study region. In total, 1033 soil samples were collected in 2010, while 1103 samples were collected in 2023. Figure 2 illustrates the spatial arrangement of sampling locations. In this study, soil salinization levels were classified into five categories according to the classification system established by the Xinjiang Agricultural Technology Manual [48], as shown in Table 1.

2.2.2. Remote Sensing Data

The Landsat satellite series offers broad spatial and temporal coverage, striking a balance between spatial resolution and computational cost for large-scale soil salinity monitoring. Therefore, this study utilized imagery from Landsat 5 (2010) and Landsat 9 (2023) acquired between 1 August and 1 November. The image is first de-clouded. We extracted six key spectral bands: Blue, Green, Red, NIR, SWIR1, and SWIR2. To characterize soil salinization comprehensively, 12 soil salinity indices (SI1–SI10, NDSI, SI-T) were systematically selected. Considering the significant heterogeneity of vegetation cover in the study area, common vegetation indices, including NDVI, EVI, OSAVI, MSAVI, CRSI, GDVI, and DVI, were employed, together with kNDVI, to extend the spectral response dimension. Based on feature-space theory, five integrated index models—Albedo-MSAVI (AM), SI1-NDVI (SDI), SI1-Albedo (ASI), Albedo-SI1 (NAS), and SI1-Albedo-MSAVI (MAS)—were developed and optimized. Because soil salinity is influenced by multiple interacting factors, climatic data (precipitation, evapotranspiration, aridity index), terrain attributes (elevation, slope, aspect), and soil properties (soil moisture and temperature) were comprehensively selected for soil salinization inversion and driving-factor analysis. Additionally, population density and nighttime light data were incorporated to investigate the potential driving mechanisms of human activities on soil salinization. Considering the significant differences in the original spatial resolutions among the selected remote sensing data sources, all datasets were resampled to a uniform spatial resolution of 30 m and subsequently clipped to the study area extent. Detailed information regarding remote sensing data sources and their spatial resolutions is provided in Table 2, while formulas and references for the salinity indices, vegetation indices, and integrated indices are listed in Table 3.

2.2.3. Geospatial Data

In this study, the distance to roads and proximity to rivers are key factors in analyzing the driving forces of soil salinization [66,67,68]. These data were obtained from OpenStreetMap and processed using Euclidean distance analysis in a GIS platform with a spatial resolution of 30 m. The distance to roads serves as a critical indicator of human activity intensity and can be used to assess the potential impact of transportation infrastructure and associated activities on the spatial distribution of soil salinity. Meanwhile, proximity to rivers reflects the influence of water supply and fluvial processes on the migration and accumulation of soil salinity. Incorporating these geographical factors into this study helps comprehensively reveal the formation and evolution mechanisms of soil salinization and provides deeper insights into the critical roles of human activities and natural processes in soil salinity dynamics in arid regions.

2.3. Methods

Utilizing field-measured soil salinity data from 2010 and 2023 for southern Xinjiang and employing remote sensing data processed via Google Earth Engine (GEE), we extracted several key environmental variables and screened the optimal factors from them to construct the RF, GDBT, SVM, and CART models, respectively. After determining the optimal model through an accuracy assessment, the model was used to map the spatial and temporal distribution of soil salinity classes in 2010 and 2023. Finally, based on the segmented structural equation model, the main driving roles of human activities, topographic attributes, and natural environment on salinization were quantitatively analyzed, which provided data support for salinization prevention and sustainable use of land resources in the southern border region. The methodological workflow of this study is illustrated in Figure 3.

2.3.1. Inversion Models

In the present research, four machine learning algorithms—Random Forest (RF), Gradient Boosting Decision Tree (GBDT), Support Vector Machine (SVM), and Classification and Regression Tree (CART)—were applied to develop predictive models for soil salinity. The dataset was partitioned into training and validation subsets using a 7:3 split. Hyperparameter tuning for each model was conducted on the training set using a combination of grid search and five-fold cross-validation, with the coefficient of determination (R2) and root mean square error (RMSE) employed as the primary evaluation metrics [69,70]. The final model, trained on the entire training set using the optimized parameters, was evaluated on an independent validation set to assess its generalization performance. Specifically, RF enhances predictive accuracy by integrating multiple independent decision trees. A range of hyperparameter combinations were tested, with ntree values between 100 and 1000 and mtry values from 1 to 10. The optimal performance was achieved at ntree = 500 and mtry = 5 [71]. GBDT, following an iterative strategy to construct weak learners, was evaluated through various hyperparameter combinations with ntree values from 100 to 1000, shrinkage rates between 0.01 and 0.1, and sampling rates from 0.7 to 0.9. The results indicated that the combination of ntree = 500, shrinkage = 0.05, and samplingRate = 0.8 provided the best balance of capturing nonlinear features and maintaining model stability [72]. SVM constructs an optimal hyperplane based on statistical learning theory. Multiple experiments were conducted with penalty factor C (1, 10, 50, 100) and kernel parameter γ (0.001, 0.01, 0.1). The best performance was observed with C = 10 and γ = 0.01 [73]. CART generates decision rules through recursive partitioning. The hyperparameter minleaf was tested across a range from 1 to 10. Results demonstrated that minleaf = 4 effectively balanced model stability and predictive accuracy [74]. The optimal hyperparameter combinations determined above were then used for final model training. Model generalization performance was validated using the validation set to ensure robustness and reliability in soil salinity inversion.

2.3.2. Model Accuracy Evaluation

To thoroughly assess model performance and reliability in predicting soil salinity, an integrated evaluation was conducted using three metrics: coefficient of determination (R2), root mean square error (RMSE), and mean absolute error (MAE) [75]. Specifically, R2 quantifies how closely predicted values align with observed data, with higher values approaching 1 reflecting enhanced model accuracy. RMSE characterizes the overall prediction error between observed and predicted values, where smaller RMSE values correspond to improved model predictive capability. Meanwhile, MAE indicates the mean absolute difference between observed and predicted results, with lower MAE values representing greater precision in absolute error control. By integrating these three evaluation metrics, the models’ accuracy and robustness can be comprehensively assessed, providing valuable quantitative information for guiding future model enhancements and practical applications.
R 2 = 1 i y ^ i y i 2 i y ¯ i y i 2
R M S E = 1 n i = 1 n y i y ^ i 2
M A E = 1 n i = 1 n y i y ^ i
where y i denotes the measured value of soil salinity, y ^ i denotes the predicted value of soil salinity, y ¯ i denotes the mean value of measured soil salinity, and n denotes the number of sample points.

2.3.3. Piecewise Structural Equation Modeling

To gain deeper insight into the spatial variation mechanisms of soil salinization under the combined influences of diverse environmental factors and human activities, this study employed a piecewiseSEM model to assess both the direct and indirect relationships among key factors and soil salinity. PiecewiseSEM can simultaneously examine causal relationships among multiple variables and quantify each variable’s direct and indirect effects [76]. To refine the model structure, a random forest was first employed to rank the importance of potential driving factors, and those without a significant effect on soil salinization were excluded. Subsequently, the selected key variables were integrated into the piecewiseSEM to further elucidate their specific mechanisms of influence on soil salinization.

3. Results

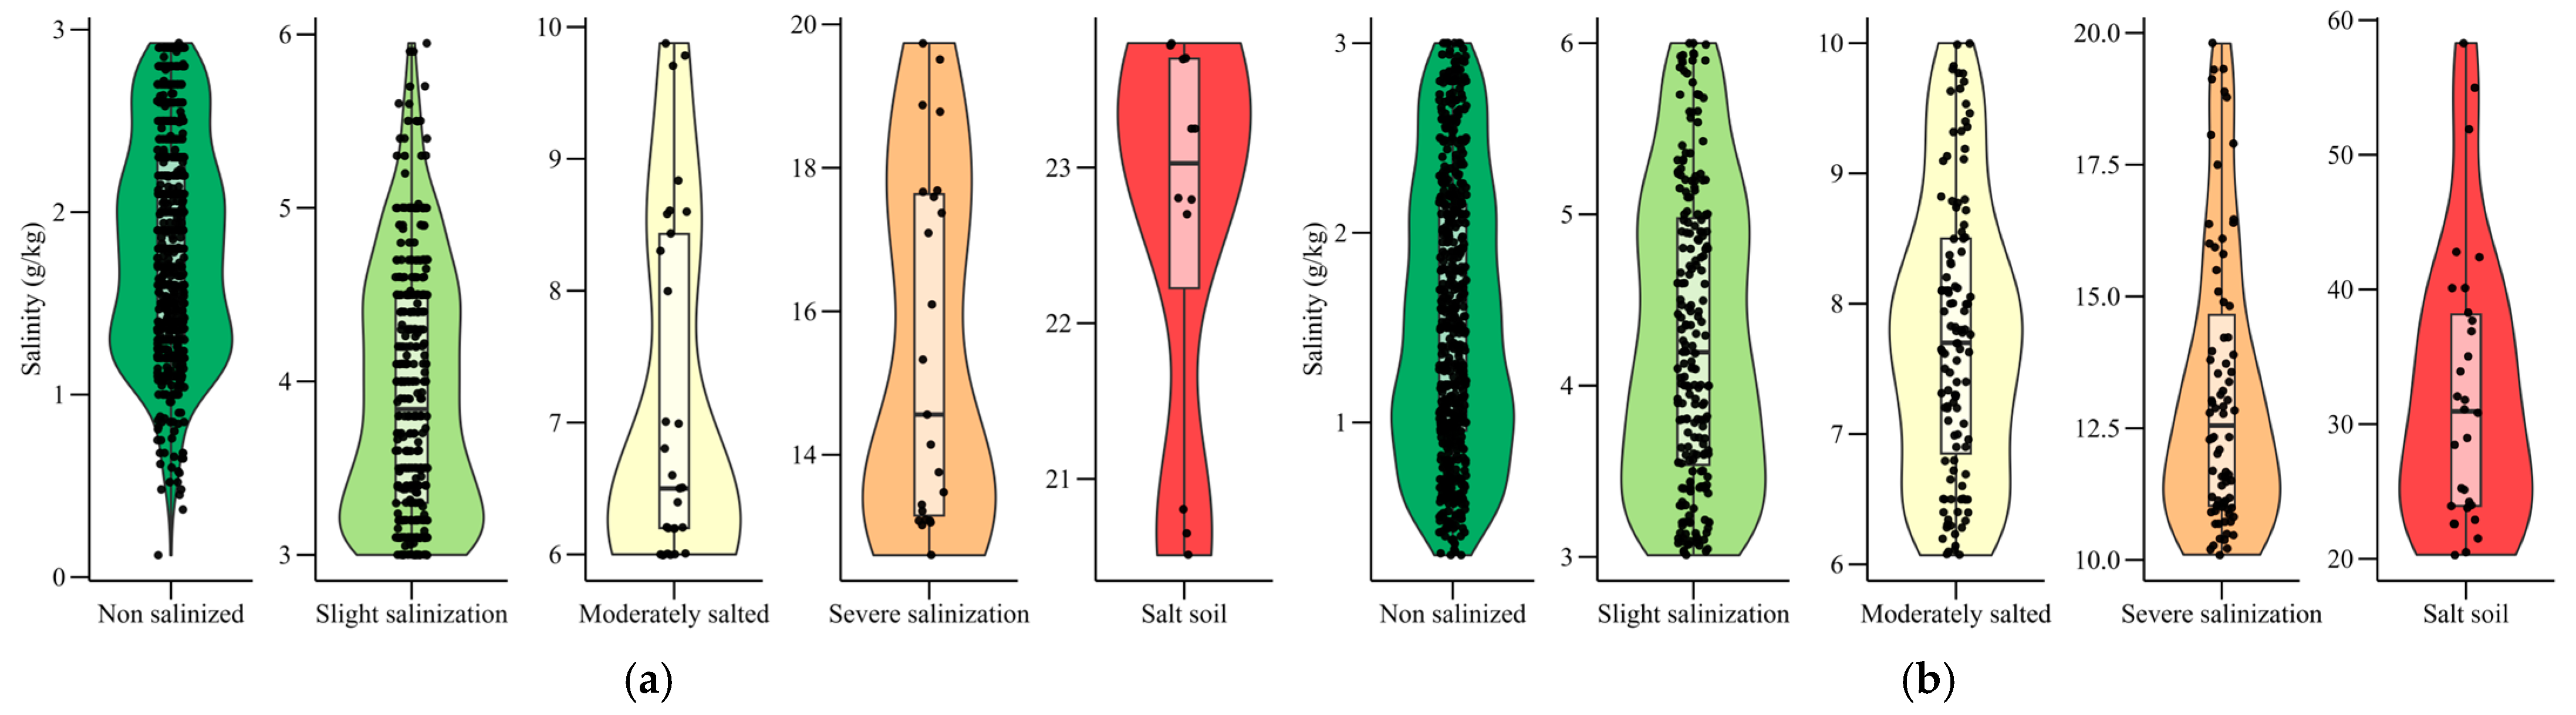
3.1. Statistical Analysis of Measured Data

The sampling results from 2010 and 2023 revealed significant variations in soil salinity characteristics across different salinization levels, as illustrated in Figure 4. Descriptive statistics of soil-soluble salt content (SSC) for 2010 and 2023 are presented in Table 4 and Table 5, respectively. In 2010, the median salinity for non-salinized soils was 1.82 g·kg−1, with a coefficient of variation (CV) of 33.09%, indicating a moderate degree of variability. By 2023, the median salinity decreased to 1.55 g·kg−1, while the CV increased substantially to 47.61%, suggesting greater spatial heterogeneity in salinity distribution. For soils classified as Slight salinization, the median salinity in 2010 was 3.84 g·kg−1 (CV = 18.31%). By 2023, it had slightly risen to 4.20 g·kg−1, accompanied by an increase in CV to 20.34%, reflecting generally stable distribution patterns but a wider range of variation. In moderately salted soils, the median salinity increased from 6.50 g·kg−1 in 2010 to 7.70 g·kg−1 in 2023, whereas the CV dropped from 18.46% to 14.03%, indicating elevated salinity levels alongside reduced variability. By contrast, severely salinized soils exhibited a decline in median salinity from 14.56 g·kg−1 in 2010 to 12.55 g·kg−1 in 2023, with the CV rising from 15.97% to 20.10%, suggesting a pronounced increase in spatial variability. Lastly, in Salt soil, the median salinity rose significantly from 23.03 g·kg−1 in 2010 to 30.95 g·kg−1 in 2023, and the CV escalated from 5.59% to 31.85%, indicating both a marked increase in salinity levels and a broader distribution range. Overall, the CV values of all salinization levels were lower than 100%, indicating the high reliability of the data and providing solid support for subsequent research and practical application.

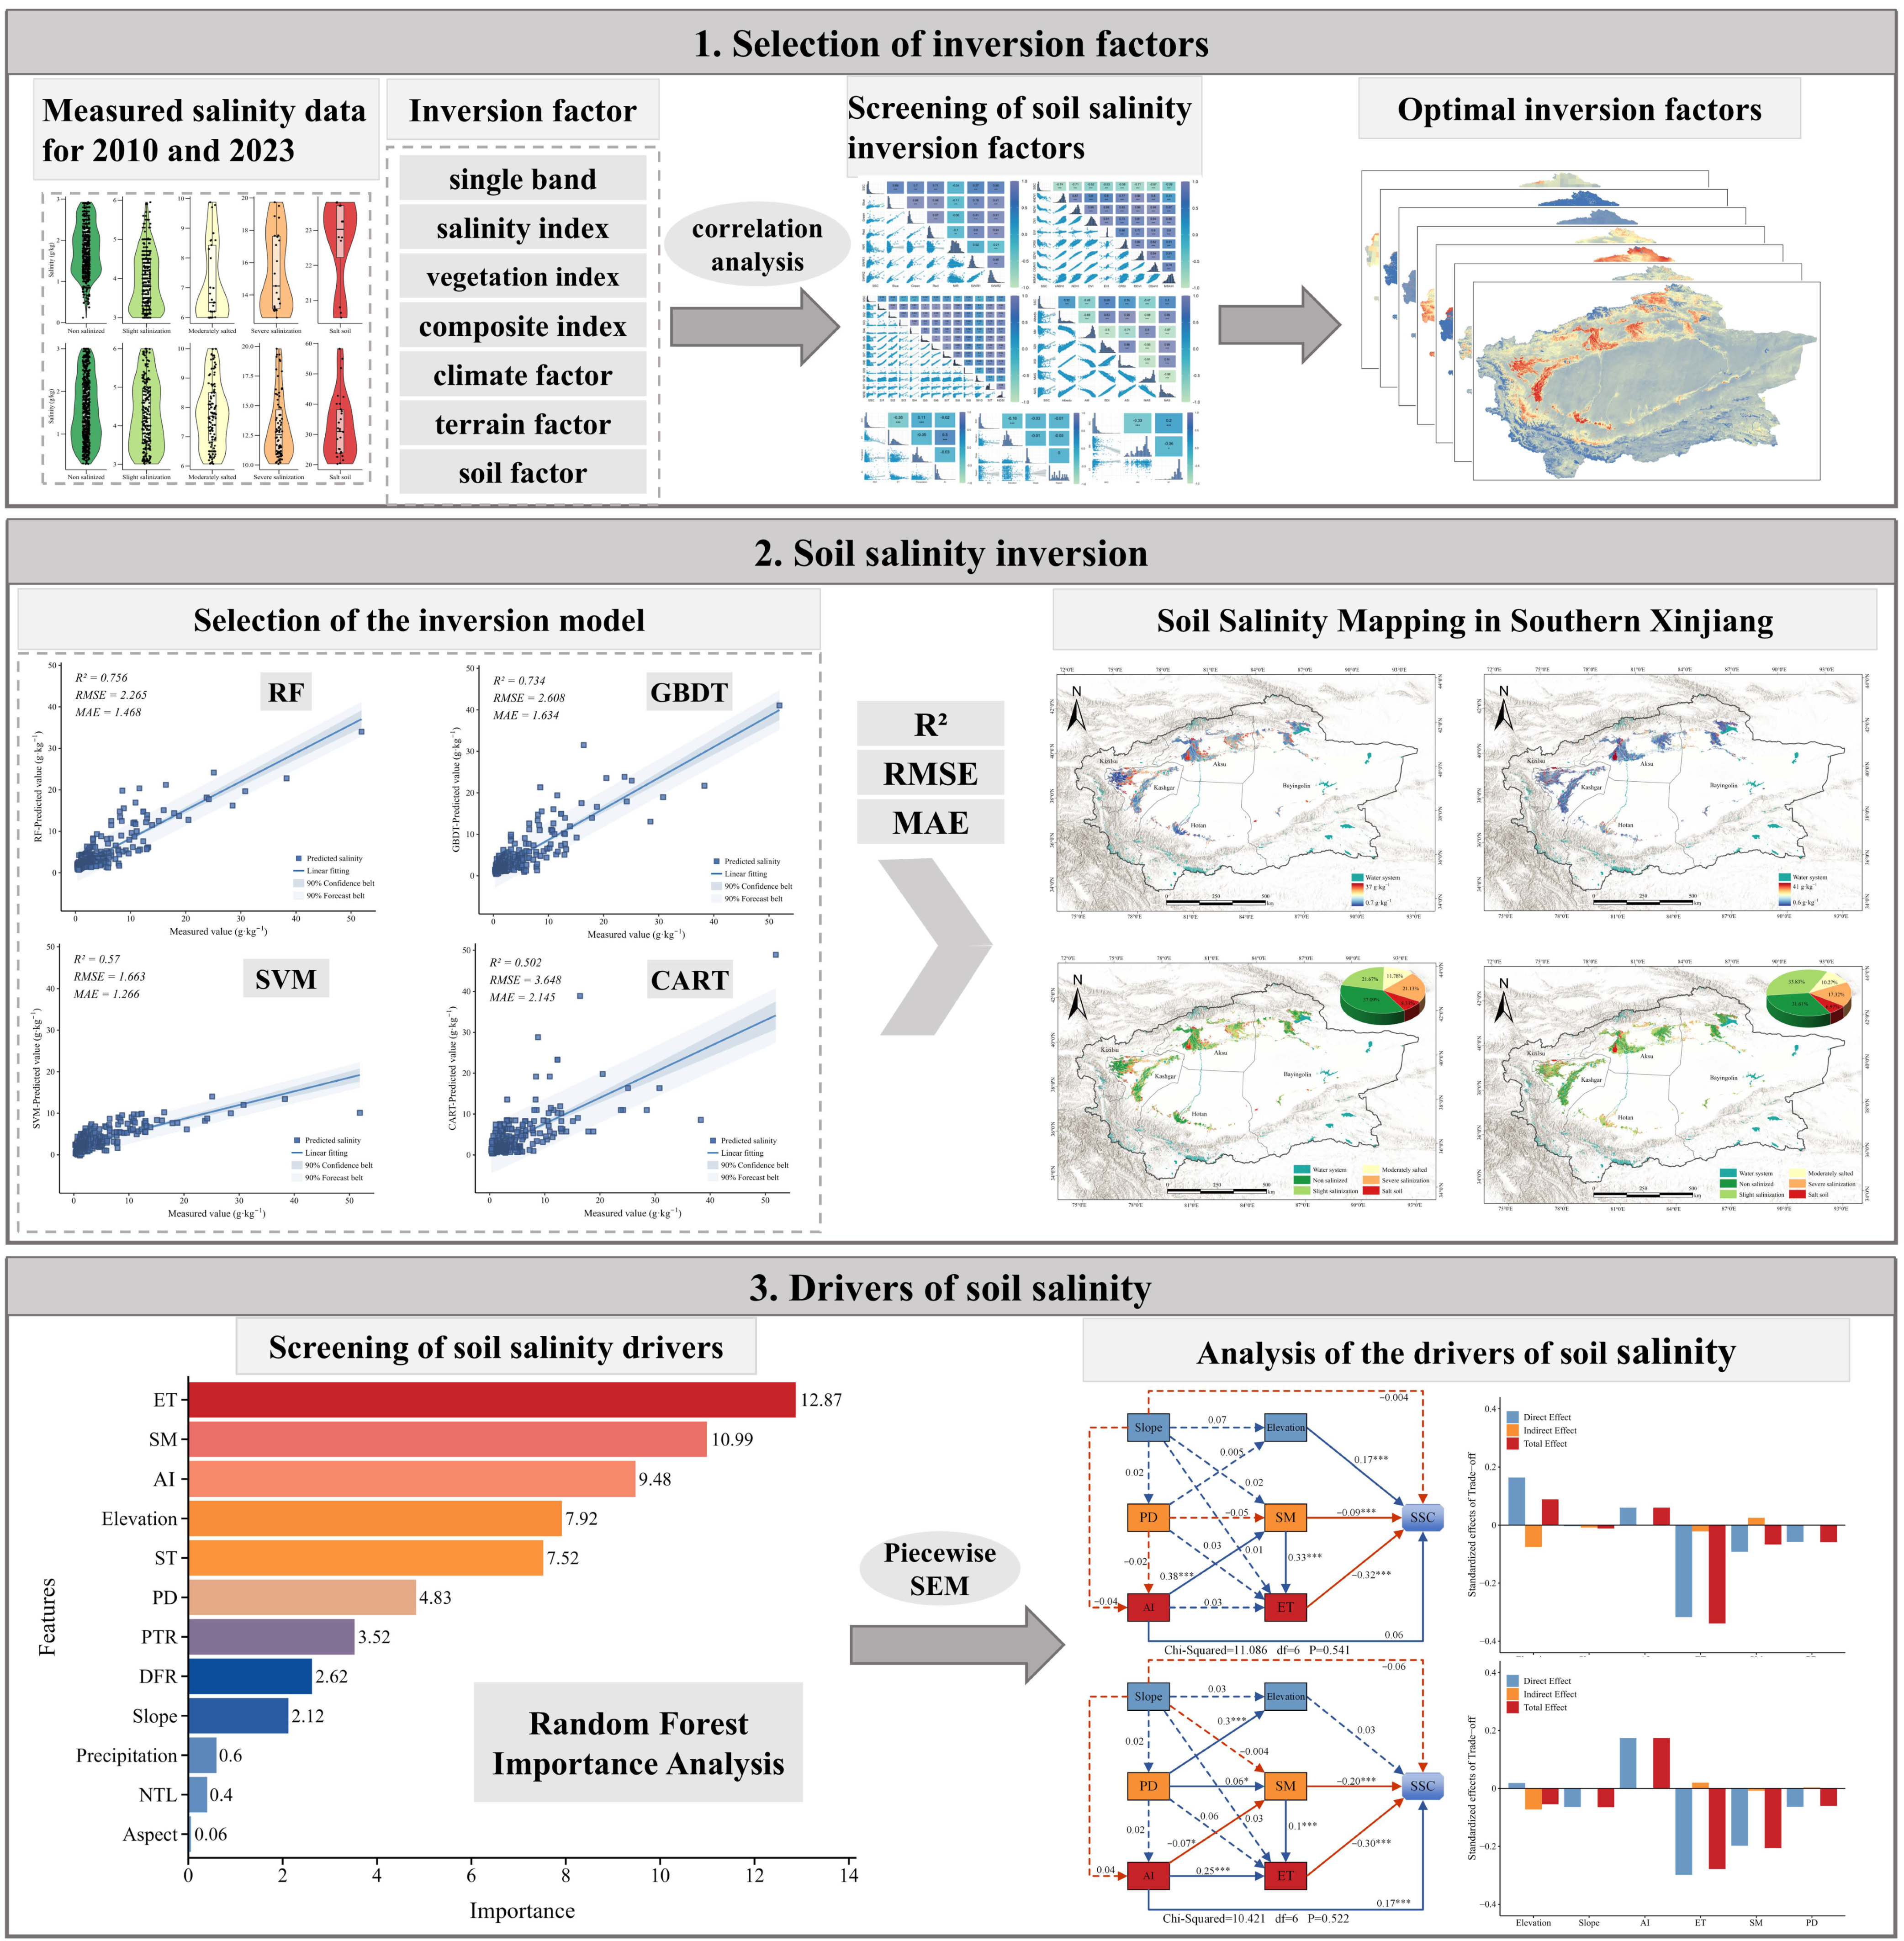
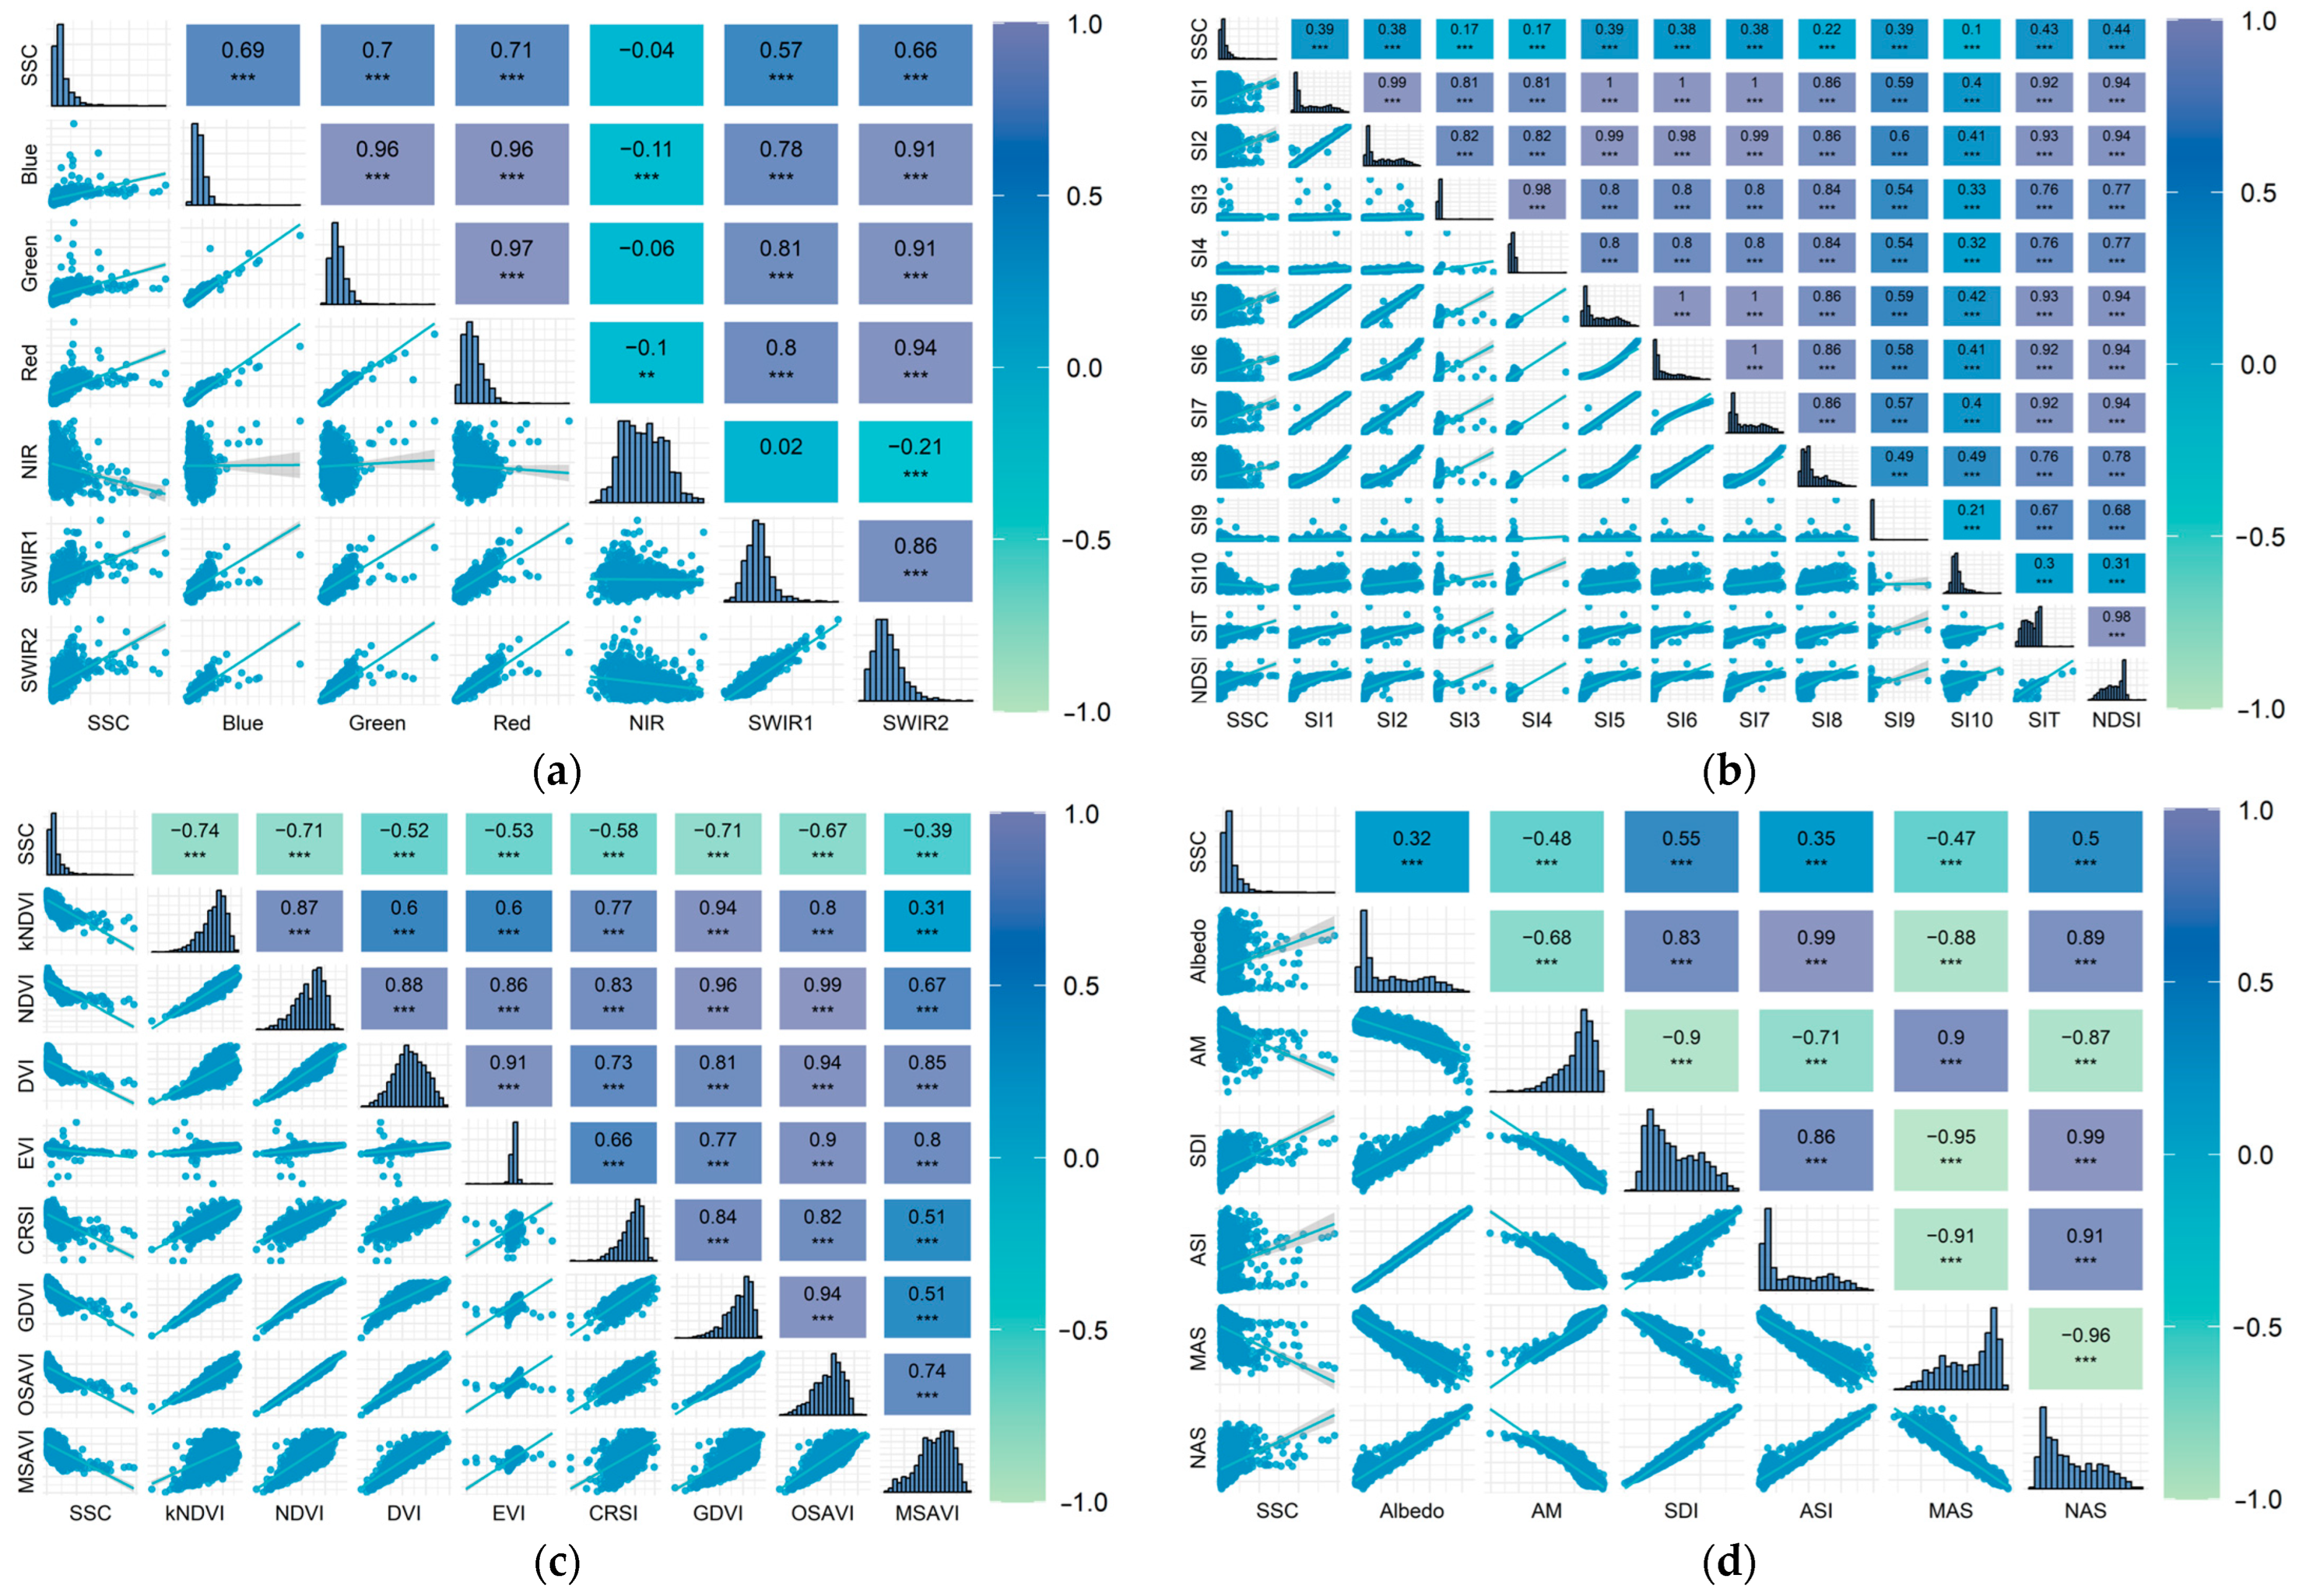
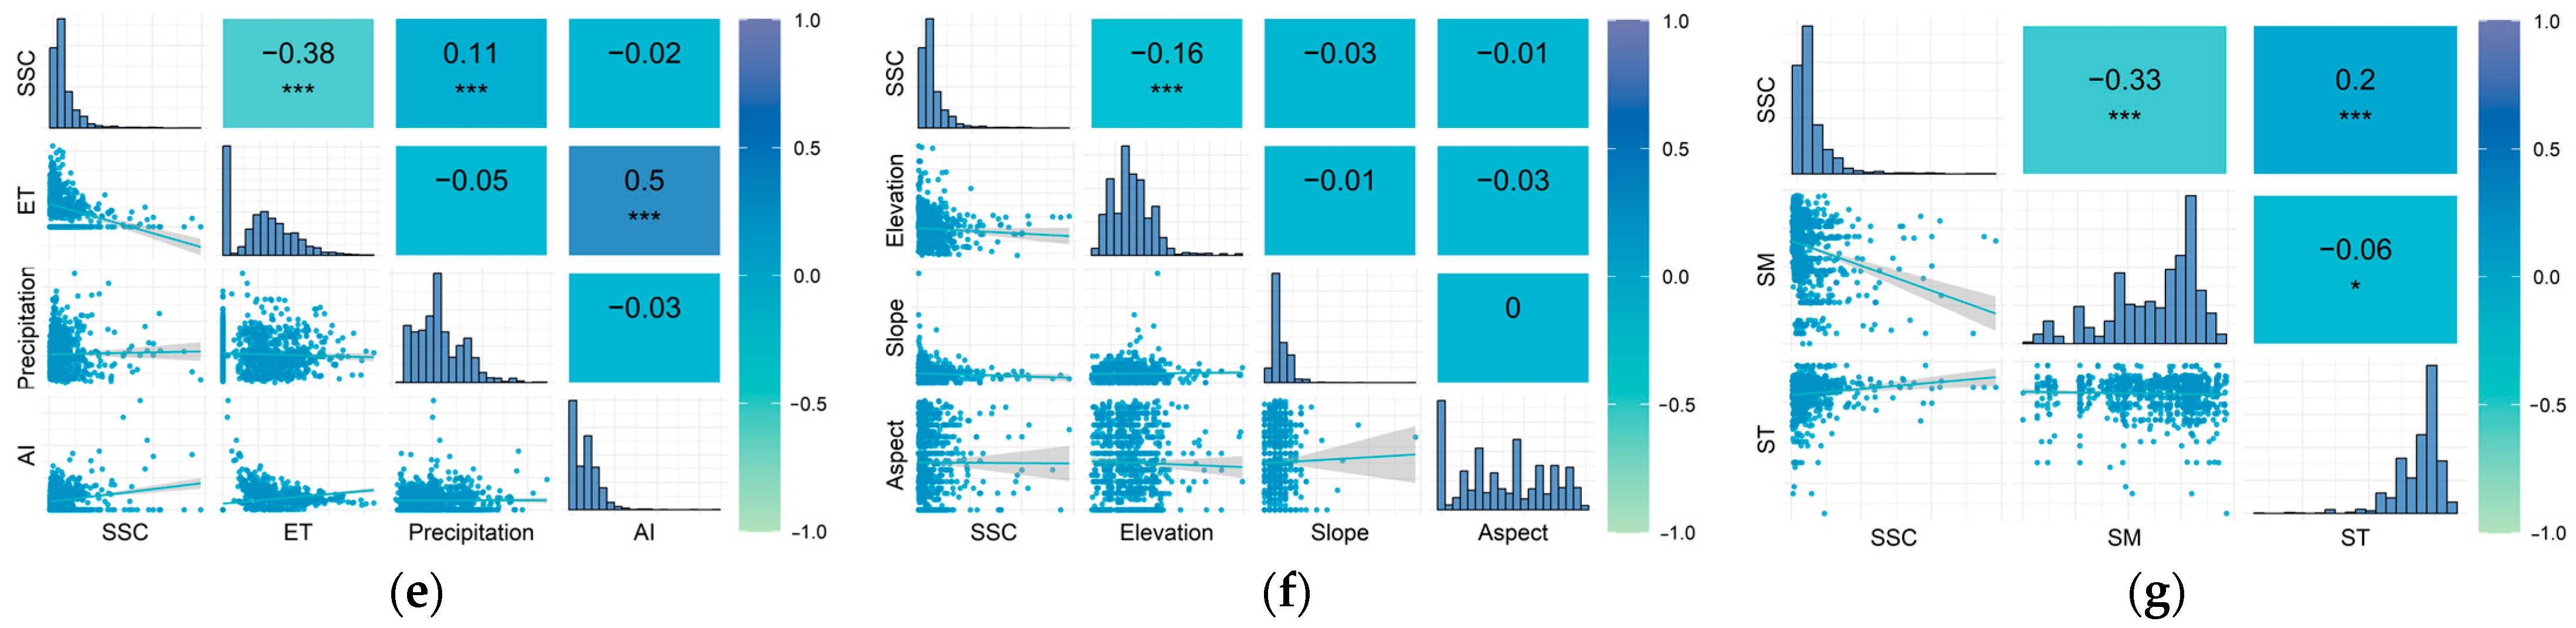
3.2. Screening of Inversion Factors for Soil Salinization

Seven key environmental variables were identified through correlation analysis with field-measured soil salinity data to construct an accurate predictive model for soil salinity in the southern Xinjiang region, as depicted in Figure 5. Initially, correlation analyses were conducted between soil salinity and a comprehensive set of 41 environmental variables. Subsequently, the variables exhibiting the strongest correlations were identified and selected to construct the soil salinity prediction model for southern Xinjiang.
In this study, correlation analysis was conducted, and the statistical significance was evaluated using a t-test. The results indicated that, except NIR showed significant correlation with soil salinity, with the highest correlation coefficient (0.71) in the Red band, but a certain degree of covariance also existed among the bands. Among the salinity indices, NDSI had the highest correlation coefficient (0.44), which also showed covariance among indices. For the vegetation indices, the correlation between kNDVI and soil salinity was the most prominent at −0.74, and covariance also existed among the vegetation indices. For the composite indices, SDI had the strongest correlation with salinity (0.55), and significant covariance was also observed among the six composite indices. Among the climatic factors, evapotranspiration (ET) and precipitation (Precipitation) were significantly correlated with soil salinity, and the correlation coefficient of ET was −0.38. Among the topographic factors, only elevation was correlated with soil salinity. Among the soil factors, soil moisture (SM) had the highest correlation with salinity (−0.33). Based on the above results, Red, NDSI, kNDVI, SDI, ET, elevation, and SM, which have the highest correlation coefficients, were selected as the environmental variables in this study to avoid the interference caused by covariance and to prevent the model from overfitting.

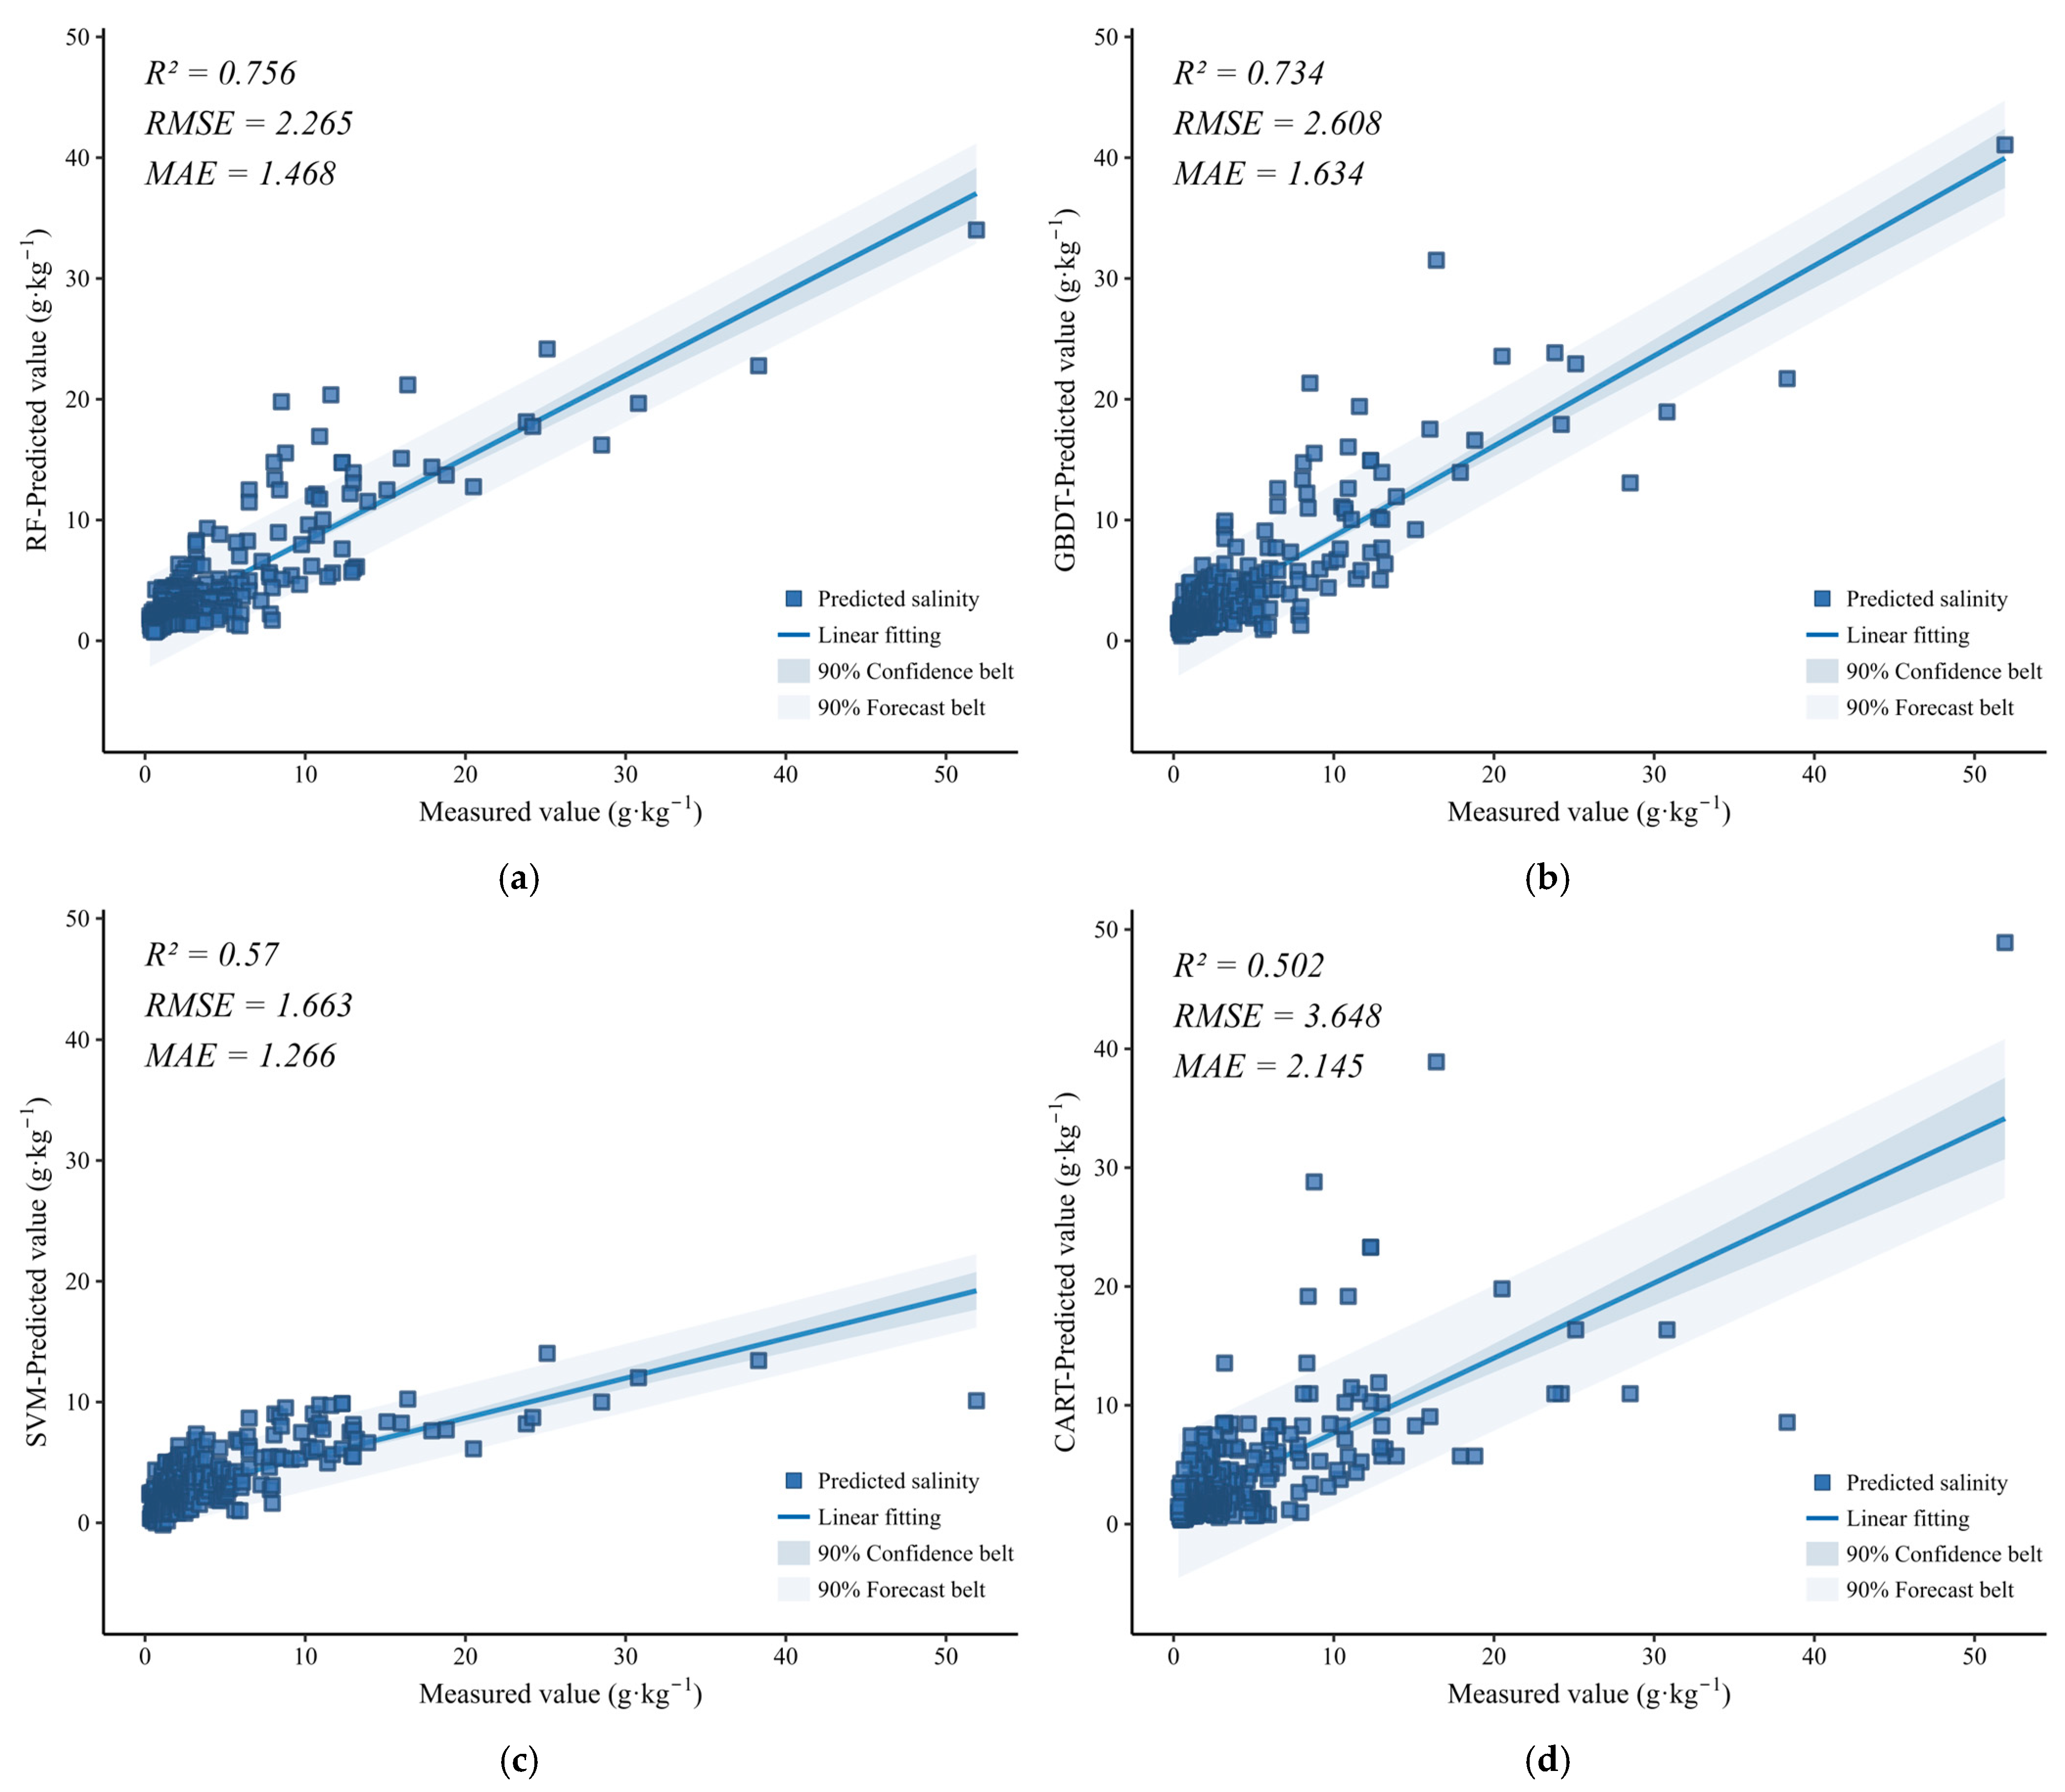
3.3. Model Accuracy Validation and Selection

Drawing upon the soil salinization inversion results for the years 2010 and 2023, this study evaluated the predictive accuracy of multiple machine learning models using root mean square error (RMSE), mean absolute error (MAE), and the coefficient of determination (R2), with detailed results summarized in Table 6 and Figure 6. Among the evaluated models, RF achieved the highest performance, with an R2 value of 0.756, RMSE of 2.265 g·kg−1, and MAE of 1.468 g·kg−1. GBDT ranked second, exhibiting an R2 of 0.734, an RMSE of 2.608 g·kg−1, and an MAE of 1.634 g·kg−1. The SVM showed a comparatively lower R2 of 0.57; however, its RMSE (1.663 g·kg−1) and MAE (1.266 g·kg−1) values were relatively low, indicating that despite its weaker overall predictive fit, it maintained a favorable level of accuracy. In contrast, the CART model exhibited weaker predictive capability, yielding an R2 of only 0.502, an RMSE of 3.648 g·kg−1, and an MAE of 2.145 g·kg−1, underscoring its limited applicability for accurate soil salinity estimation. These findings clearly demonstrate that the RF model provides superior predictive performance for soil salinity, achieving high precision and significantly lower error levels (RMSE and MAE), thus accurately capturing the spatial distribution of surface soil salinity. Consequently, RF was ultimately identified as the optimal predictive tool for assessing the spatiotemporal dynamics of topsoil salinity in the study region for the years 2010 and 2023.

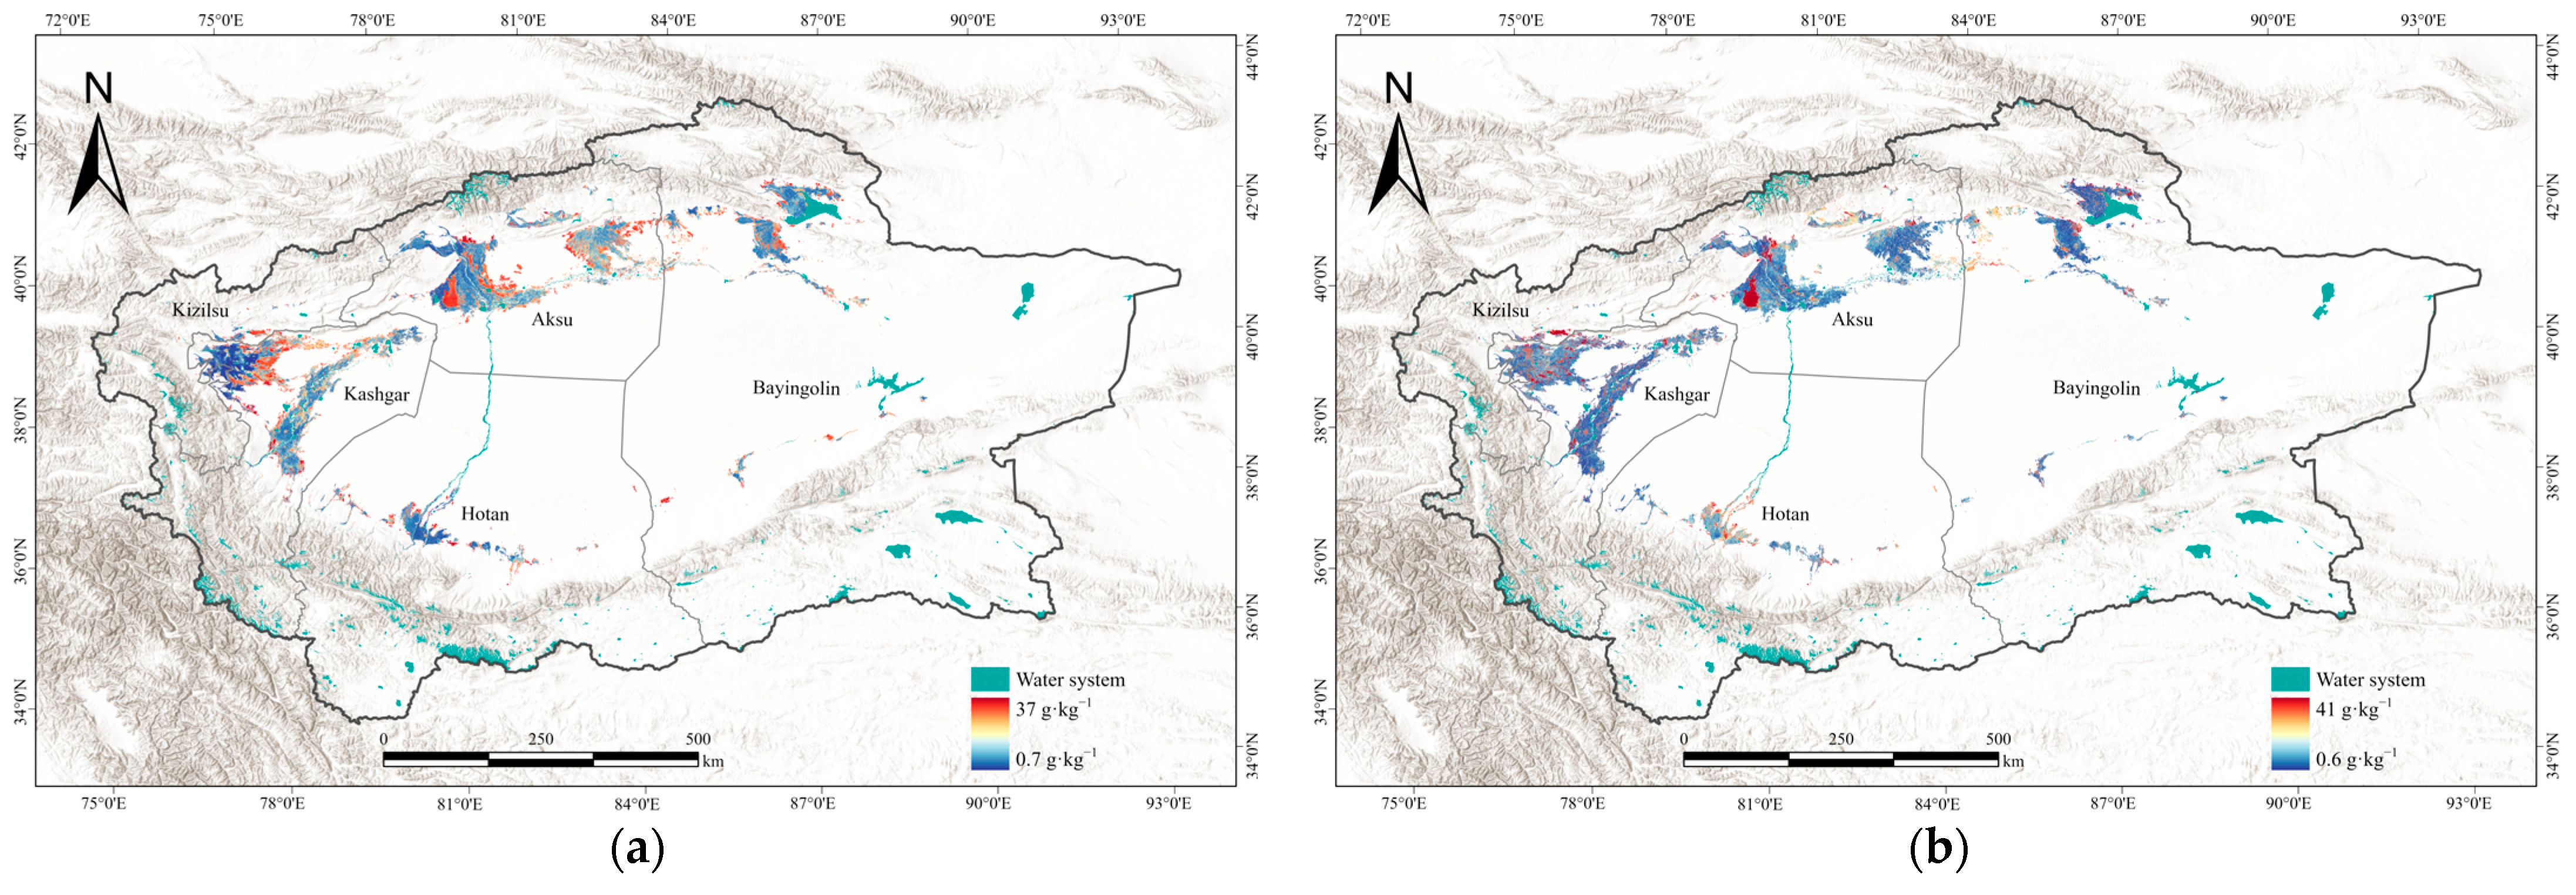
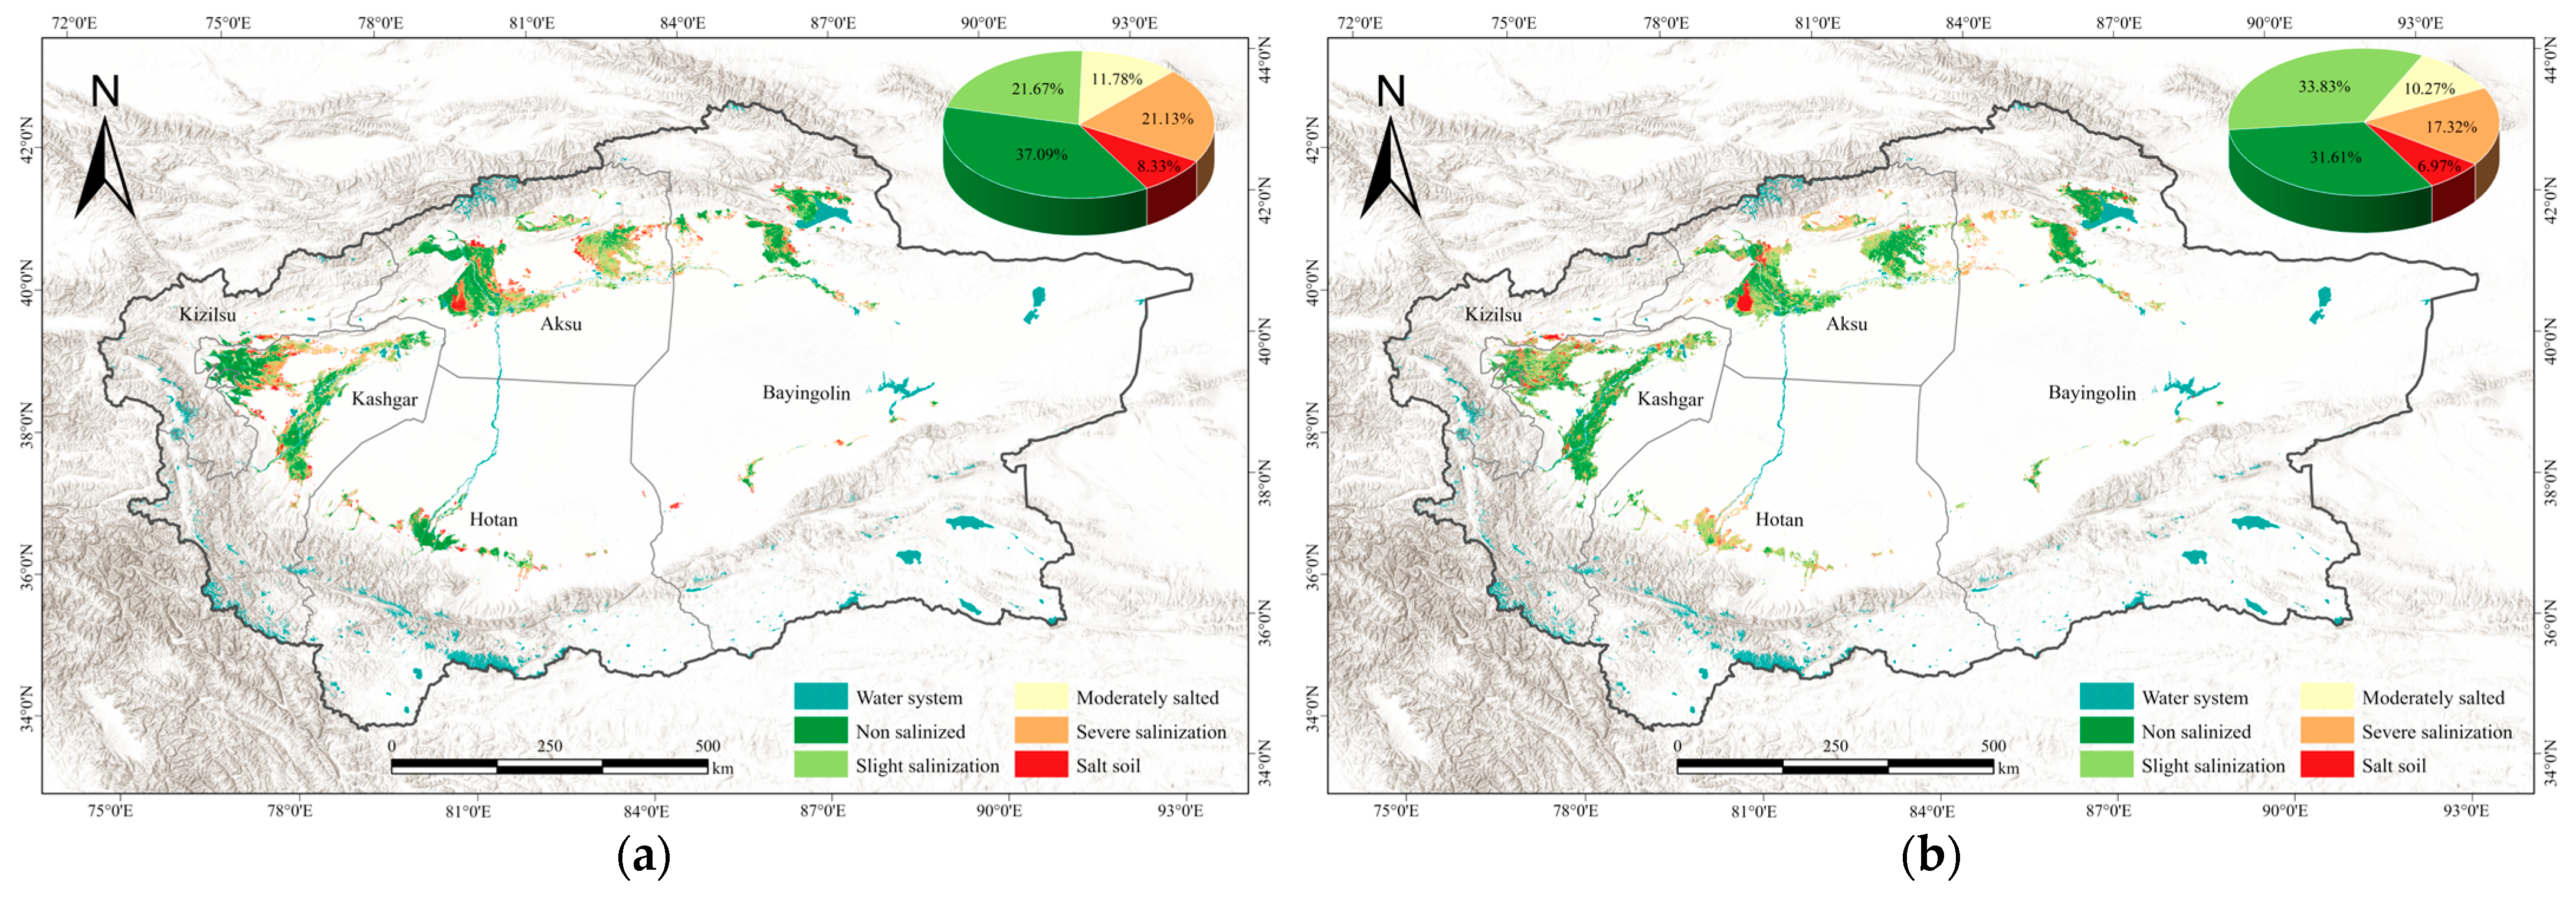
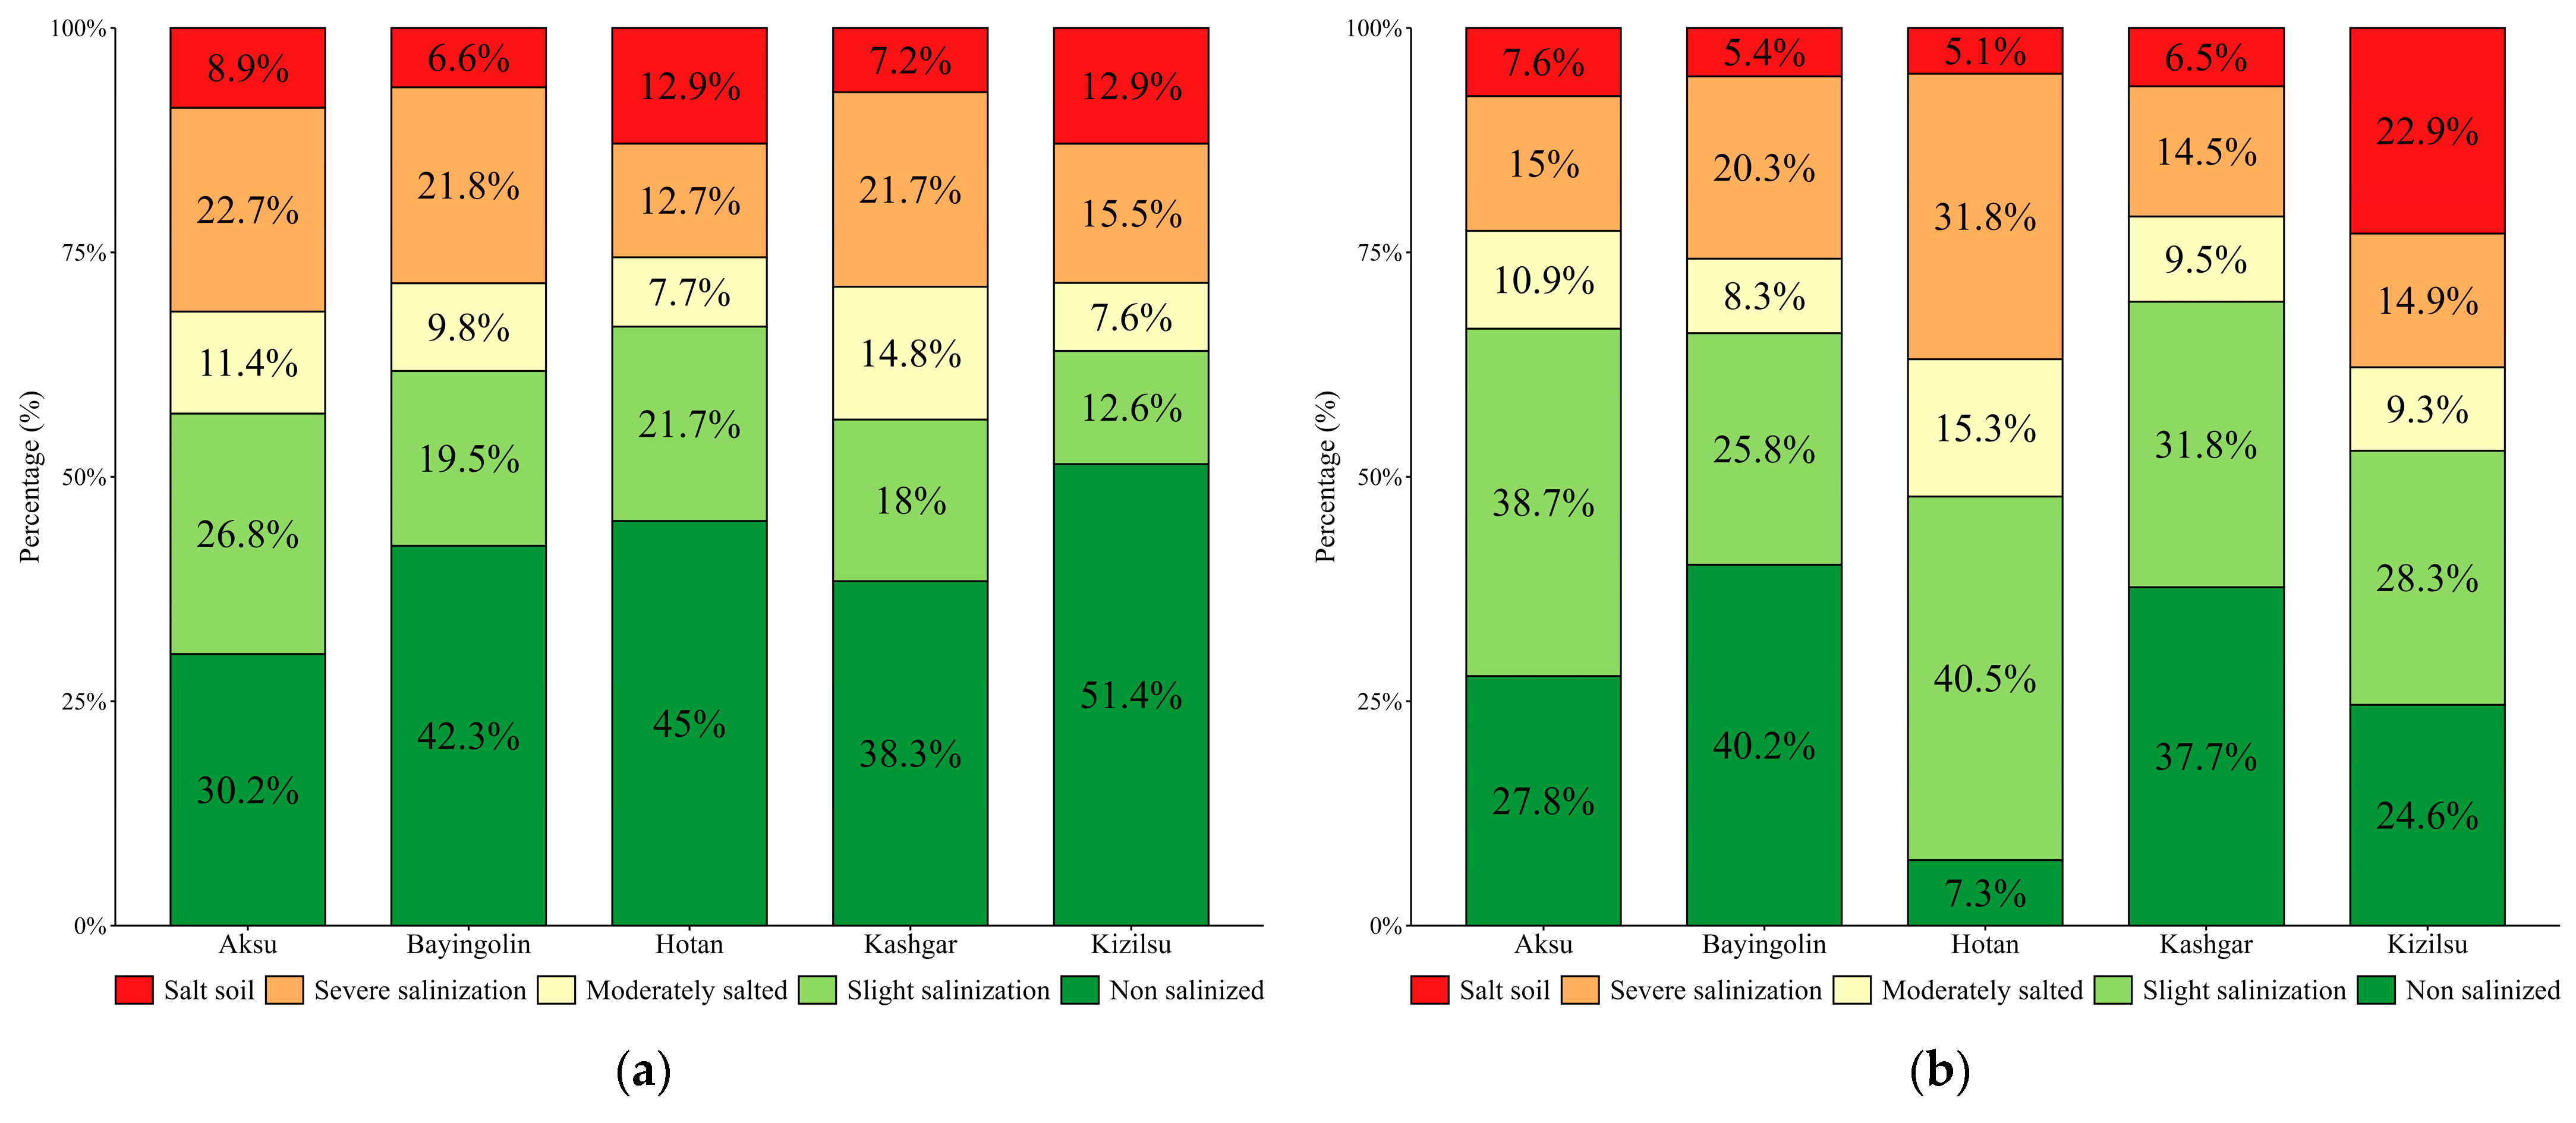
3.4. Analysis of Spatial and Temporal Variations in Soil Salinization

Based on the high-precision inversion results derived from the random forest model, this study conducted a systematic and in-depth analysis of spatiotemporal variations in soil salinity across the oasis regions of southern Xinjiang. Figure 7 and Figure 8 show the distribution of soil salinity content and salinity classes based on the inversion of the random forest model in 2010 and 2023, respectively. Between 2010 and 2023, soil salinity in the oasis regions exhibited significant spatiotemporal differentiation. Mean soil salinity decreased from 7.63 to 7.23 g·kg−1, accompanied by a reduction in standard deviation from 7.28 to 6.91 g·kg−1. The systematic reductions observed in these two parameters indicate not only a general alleviation of soil salinization but also a marked decrease in spatial heterogeneity, suggesting a trend toward a more homogeneous distribution. In terms of salinity categories, the proportion of non-salinized soil decreased from 37.09% to 31.61%, whereas the proportion of slightly salinized soil notably increased from 21.67% to 33.83%. Meanwhile, moderately and severely salinized soils decreased by 1.51% and 3.81%, respectively. The proportion of salt-affected soil also declined from 8.33% to 6.97%. These findings indicate an overall mitigation of soil salinization in the oasis regions of southern Xinjiang, particularly within severely salinized areas. Nevertheless, the increase in slight salinization suggests a potential risk of continued salt accumulation, warranting further attention.
From 2010 to 2023, significant spatiotemporal variations in soil salinization patterns were observed across the five prefectures of the oasis region in southern Xinjiang (Figure 9). The extent of non-salinized land generally decreased, with the most substantial reduction occurring in Hotan (37.7%), followed by Kizilsu (26.8%). Conversely, reductions in Bayingolin, Aksu, and Kashgar were relatively minor (2.1%, 2.4%, and 0.6%, respectively), highlighting the spatial heterogeneity of secondary salinization processes. Regarding salinization severity, slight salinization exhibited widespread expansion across all prefectures, with increases ranging from 9.7% to 18.9%. Aksu and Hotan experienced the most significant expansions, at 11.9% and 18.8%, respectively. The dynamics of moderately salinized soils varied regionally; Bayingolin, Aksu, and Kashgar exhibited decreases of 1.5%, 0.5%, and 5.3%, respectively, whereas Hotan and Kizilsu showed increases of 7.6% and 1.7%. Severely salinized soils decreased by between 1.5% and 7.7% in Bayingolin, Aksu, Kashgar, and Kizilsu; however, Hotan presented a notable contrast with an increase of 19.1%. Additionally, salt-affected soil areas declined in four prefectures, except for Kizilsu, where they increased by 10.0%. Notably, Hotan and Kizilsu have emerged as focal regions for intensifying soil salinization, demonstrating a general shift toward more severe conditions. Compared with regional agricultural management practices, this anomalous trend may be directly associated with the continued reliance on flood irrigation in certain areas. Excessive irrigation has likely resulted in rising groundwater levels and surface salt accumulation, necessitating careful consideration of its long-term impacts.

3.5. Analysis of the Drivers of Soil Salinization

In this study, 12 variables influencing Soil salt content (SSC) were systematically analyzed and categorized into three primary groups: Human activities, topographic attributes, and natural factors. Considering the characteristics of the typical arid zone in the southern border oasis region, soil moisture is primarily influenced by anthropogenic irrigation and is therefore classified under anthropogenic factors, as shown in Table 7. To elucidate the mechanisms through which these factors influence soil salinity changes, this study selected the two most significant variables from each category based on a random forest (RF) importance analysis [77] and constructed a piecewise structural equation model (piecewiseSEM). The optimal parameters for the RF model were determined through cross-validation by testing various combinations of ntree (100–1000) and mtry (1–10), and accuracy was evaluated based on the coefficient of determination (R2). The highest accuracy (R2 = 0.83) was obtained with ntree = 500 and mtry = 2. Variable importance from the RF model is illustrated in Figure 10. The results indicated significant differences in the effects of variables from different categories on SSC. Among the natural factors, ET, with an importance score of 12.87, exerted the most significant influence on salt accumulation and migration, underscoring its critical role in the arid zone. The aridity index, with a score of 9.5, highlighted the substantial regulatory role of the imbalance between evaporation and precipitation in salinity variation. Among the anthropogenic factors, SM had a score of 11.0, signifying the crucial role of anthropogenic irrigation in shaping salinity distribution, while PD, with a score of 4.8, suggested the potential influence of anthropogenic intensity on regional salinity. Among the topographic attributes, elevation, with a score of 7.9, demonstrated the key role of topography in governing water and salt transport pathways, while slope, with a score of 2.1, though having a relatively minor impact, may still influence localized areas by modulating surface runoff. Therefore, ET and AI, SM and PD, and elevation and slope were ultimately selected as the core variables representing natural, anthropogenic, and topographic attributes, respectively, for the construction of a structural equation model. This model provides theoretical support for an in-depth investigation of soil salinity dynamics in arid zones.
Based on the results of the piecewise SEM model (Figure 11 and Figure 12), we found that the factors influencing soil salinity dynamics are changing, driven by the combined effects of natural factors, human activities, and topographic attributes. Regarding natural factors, evapotranspiration (ET) exhibited a significant effect on soil salinity in both years, with impact coefficients of −0.32 and −0.30, respectively. The impact of the aridity index (AI) on soil salinity increased in 2023, with an impact coefficient of 0.17, compared to 0.06 in 2010. This indicates that the relationship between drought severity and soil salinity accumulation became more pronounced in 2023, with intensified drought conditions further promoting salinity accumulation. Regarding human activities, changes in soil moisture (SM) exhibited a negative effect on soil salinity in both 2010 and 2023, with impact coefficients of −0.09 and −0.20, and all were strongly significant with salinity. This suggests that an increase in SM generally helps mitigate salinity accumulation, which is closely related to human irrigation activities. In particular, the influence of SM on salinity variation strengthened in 2023, possibly due to advancements in irrigation technology and improved water resource management. Additionally, SM played a crucial role in affecting ET in 2010, with an impact coefficient of 0.33, indicating that increased SM was a key factor in enhancing ET’s overall effect. Topographic attributes had a subtle influence on soil salinity. In 2010, the impact coefficients of elevation and slope were 0.17 and −0.004, respectively, whereas in 2023, the elevation coefficient decreased to 0.03, and the slope coefficient changed to −0.06. While these coefficients are relatively small, higher elevations may accelerate water evaporation and promote salinity accumulation, whereas lower slopes facilitate water retention, influencing salinity distribution.
The mean changes in surface soil salinity in southern Xinjiang from 2010 to 2023 were relatively stable. This is primarily attributed to the unique geographical location and topographic characteristics of southern Xinjiang, which result in negligible external influx and outflux of soil salinity, with salinity primarily migrating between deeper soil layers and the surface. Among the analyzed driving factors, ET and SM were identified as the most stable and influential in soil salinity migration across different depths. From 2010 to 2023, the mean SM increased from 3.2 kg/m2 to 5.5 kg/m2, an increment of 2.3 kg/m2, representing a substantial increase, while ET increased by only 5.1 mm, from 203.7 mm to 208.8 mm. This suggests that SM significantly enhanced the downward migration of soil salinity, while the effect of ET on upward migration was relatively weak. Ultimately, the coupled effects of ET and SM facilitated the redistribution of soil salinity across different depths in southern Xinjiang by 2023.

4. Discussion

4.1. Selection of Inversion Variables for Soil Salinity

In soil salinization inversion studies, the scientific selection of factors directly determines the accuracy and applicability of the model. Numerous studies have shown that relying solely on a single spectral band or spectral index for salinity inversion in arid regions results in limited accuracy and stability. However, integrating environmental variables such as vegetation indices, salinity indices, topographic factors, and climatic factors can significantly enhance the predictive performance of models [78,79,80]. Current studies typically select the most optimal factors from four categories of environmental variables: spectral indices, topographic factors, soil properties, and climatic factors to optimize the predictive performance of soil salinization models [15,81]. Building upon this foundation, this study further expands the variable categories by selecting seven types of environmental variables: spectral indices, salinity indices, vegetation indices, composite indices, climatic factors, topographic factors, and soil factors. Correlation analysis was employed to evaluate the importance of variables and to identify key variables that are significantly correlated with soil salinity. To mitigate the impact of multicollinearity on the model, only the most correlated indicator was retained for each variable category. Among them, the importance of Red, NDSI, SDI, ET, elevation, and SM has been validated in numerous studies, aligning with existing research findings [80,82,83]. Additionally, this study is the first to identify a significant correlation between kNDVI and soil salinity, demonstrating superior performance compared to commonly used vegetation indices. The multi-source environmental variable inversion framework established in this study enhances the model’s generalization ability, providing technical support for the accurate monitoring of soil salinization in the oasis regions of southern Xinjiang. Furthermore, it offers valuable insights for future modeling and prediction studies on soil salinization in arid regions.

4.2. Evaluation of Inversion Models for Soil Salinization

The accuracy and stability of the model directly influence the effectiveness of soil salinization inversion. Traditional spatial interpolation methods have been widely applied in soil salinization research. However, their capacity to characterize complex nonlinear environmental variables is limited, making them susceptible to prediction biases [84]. In contrast, machine learning models can effectively capture latent relationships among multi-source environmental variables, thereby enhancing predictive accuracy [85]. In this study, four machine learning models, namely RF, GBDT, SVM, and CART, were selected. The models were evaluated by the R2, RMSE, and MAE. The results showed that the R2 of the four machine learning models was greater than 0.5, which demonstrated the feasibility of machine learning in the prediction of soil salinity. The RF model achieved an R2 value of 0.756, an RMSE of 2.265 g·kg−1, and an MAE of 1.468 g·kg−1, exhibiting the highest goodness of fit and the lowest error among all models. This finding aligns with previous studies, which have also demonstrated that RF outperforms other machine learning methods in soil salinity modeling [16,86]. This suggests that the RF model has strong applicability and broad potential for soil salinization inversion. In summary, the RF model was identified as the optimal inversion tool in this study due to its balanced performance, characterized by high R2 and low error. Its advantages extend beyond the precise simulation of soil salinity spatial distribution to the robust analysis of nonlinear relationships among multi-source environmental factors, providing a reliable algorithmic framework for monitoring soil salinization in arid regions.

4.3. Drivers of Soil Salinization Changes in the Oasis of South Xinjiang

Through the assessment of spatial and temporal changes in soil salinity across southern Xinjiang’s oasis region between 2010 and 2023, the present research identified an overall decrease in salinization severity. Specifically, a marked decline was observed in the extent of severely salinized soils, whereas the area categorized as mildly salinized expanded notably. This trend is consistent with findings from other studies on arid regions in southern Xinjiang [87]. This suggests that improvements in water resource management and agricultural irrigation optimization over the past decade have alleviated regional soil salinization risks to some extent. However, this mitigation has not fully resolved soil salinization issues, as certain areas continue to experience persistent soil salt accumulation, particularly in low-lying areas, regions with high groundwater levels, and areas where irrigation management remains suboptimal. The changes in soil salinization are influenced by a combination of climatic, topographic, and anthropogenic factors. Previous studies have indicated that climate change and topographic characteristics are key natural factors driving the dynamics of surface soil salinity [88]. This study further discovered that evapotranspiration (ET) and soil moisture (SM) play crucial roles in soil salt migration. Between 2010 and 2023, soil moisture increased significantly, whereas the rise in evapotranspiration was relatively modest. The slight reduction in soil salinization during this period suggests that soil salts in the study area are only internally redistributed, with insignificant vertical migration. The driving force of soil moisture changed significantly during the study period, suggesting that irrigation water has become a critical factor influencing the spatial distribution of soil salinity. This conclusion aligns with previous studies, underscoring the critical role of optimized irrigation management in mitigating soil salinization [89]. Given the trends in soil salinization across different regions of southern Xinjiang, it remains essential to widely promote efficient irrigation technologies in the area to continuously reduce the risk of soil salt accumulation and enhance the sustainable use of farmland.

4.4. Future Challenges and Perspectives

Although this study has achieved significant progress in the inversion of soil salinization and the analysis of its driving factors within the oasis regions of southern Xinjiang, it still faces several challenges. First, while the research area encompasses all oasis regions in southern Xinjiang, the relatively short time series—consisting of only two observation periods—necessitates the inclusion of more extensive time-series data to comprehensively capture the long-term dynamics of the salinization process. Second, the driving factors of soil salinization are highly complex; in addition to the typical variables already selected, further investigations should incorporate additional potential factors, such as fluctuations in groundwater levels and the impact of various land-use types on salinization. These factors may differ substantially from year to year, and a deeper exploration of their mechanisms will help elucidate the intrinsic patterns of salinization. Furthermore, with continuous advancements in remote sensing technology, employing higher spectral resolution data can enhance inversion accuracy, thereby offering more scientifically grounded and precise decision-making support for soil salinization prevention and control.

5. Conclusions

This study developed an inversion model for soil salinization in the oasis region of southern Xinjiang using four machine learning algorithms on the GEE platform and explored its primary driving factors. The research results show that:
1.
Among the environmental variables such as spectra, vegetation, climate and topography, Red, NDSI, kNDVI, SDI, ET, elevation and SM variables have significant relationships with soil salinity; among the four machine models, their accuracies are ranked as RF > GBDT > SVM > CART, which fully proves the superiority of the RF method in monitoring soil salinity at a large scale range.
2.
Over the past decade, the study area in the oasis region of southern Xinjiang exhibited a general trend of soil salinization mitigation, with a 3.81% reduction in severely salinized areas and a 1.36% decline in saline soil proportion. However, the extent of mildly salinized areas expanded significantly, indicating a redistribution of soil salinity within the region, where both the effectiveness of salinization control and potential risks coexist. Additionally, this study focused exclusively on two specific periods; therefore, future research should incorporate data from additional years to characterize the temporal dynamics of soil salinization.
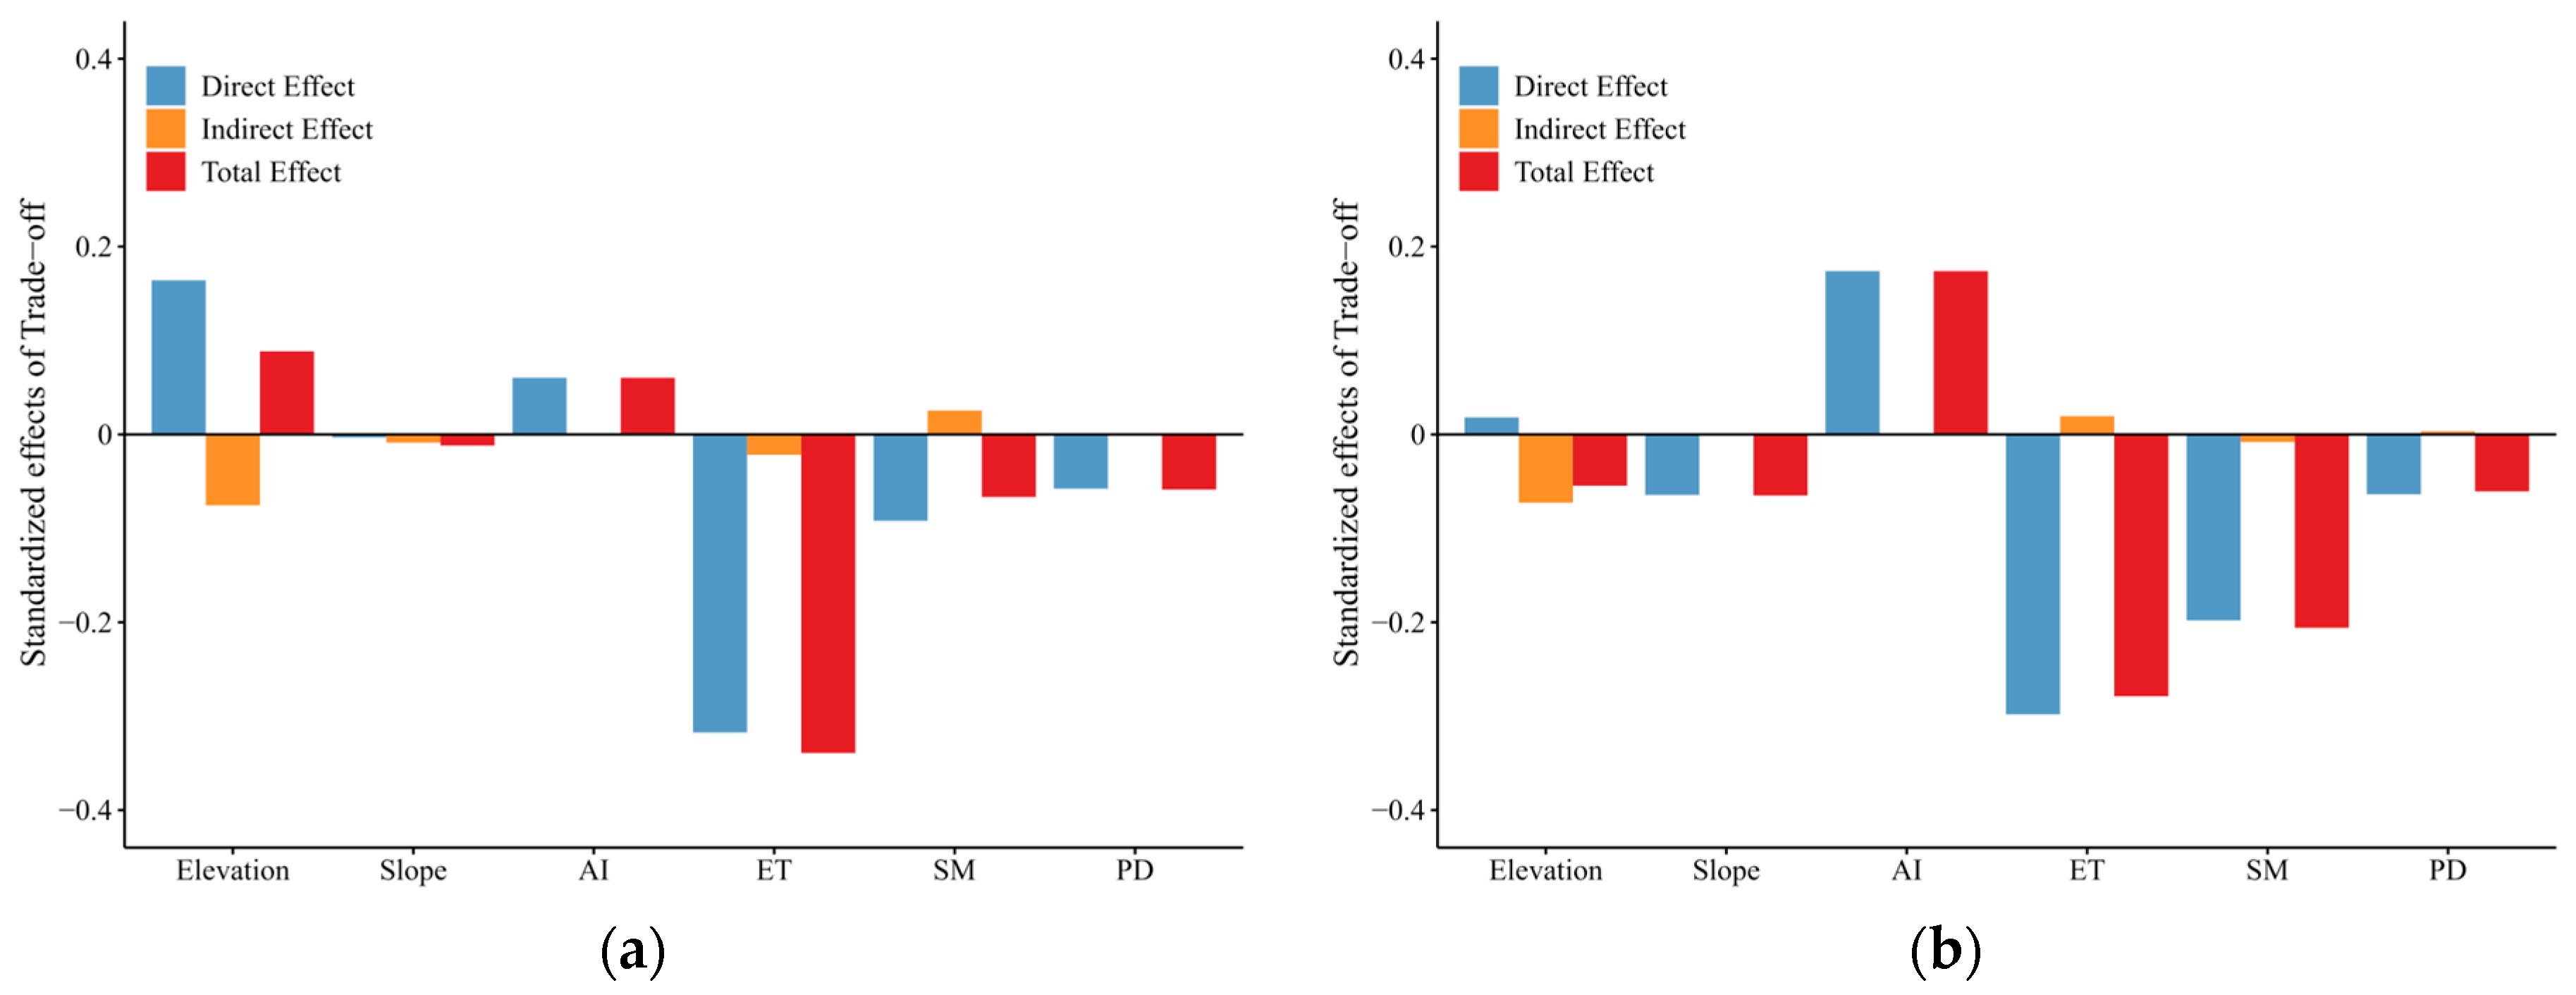
3.
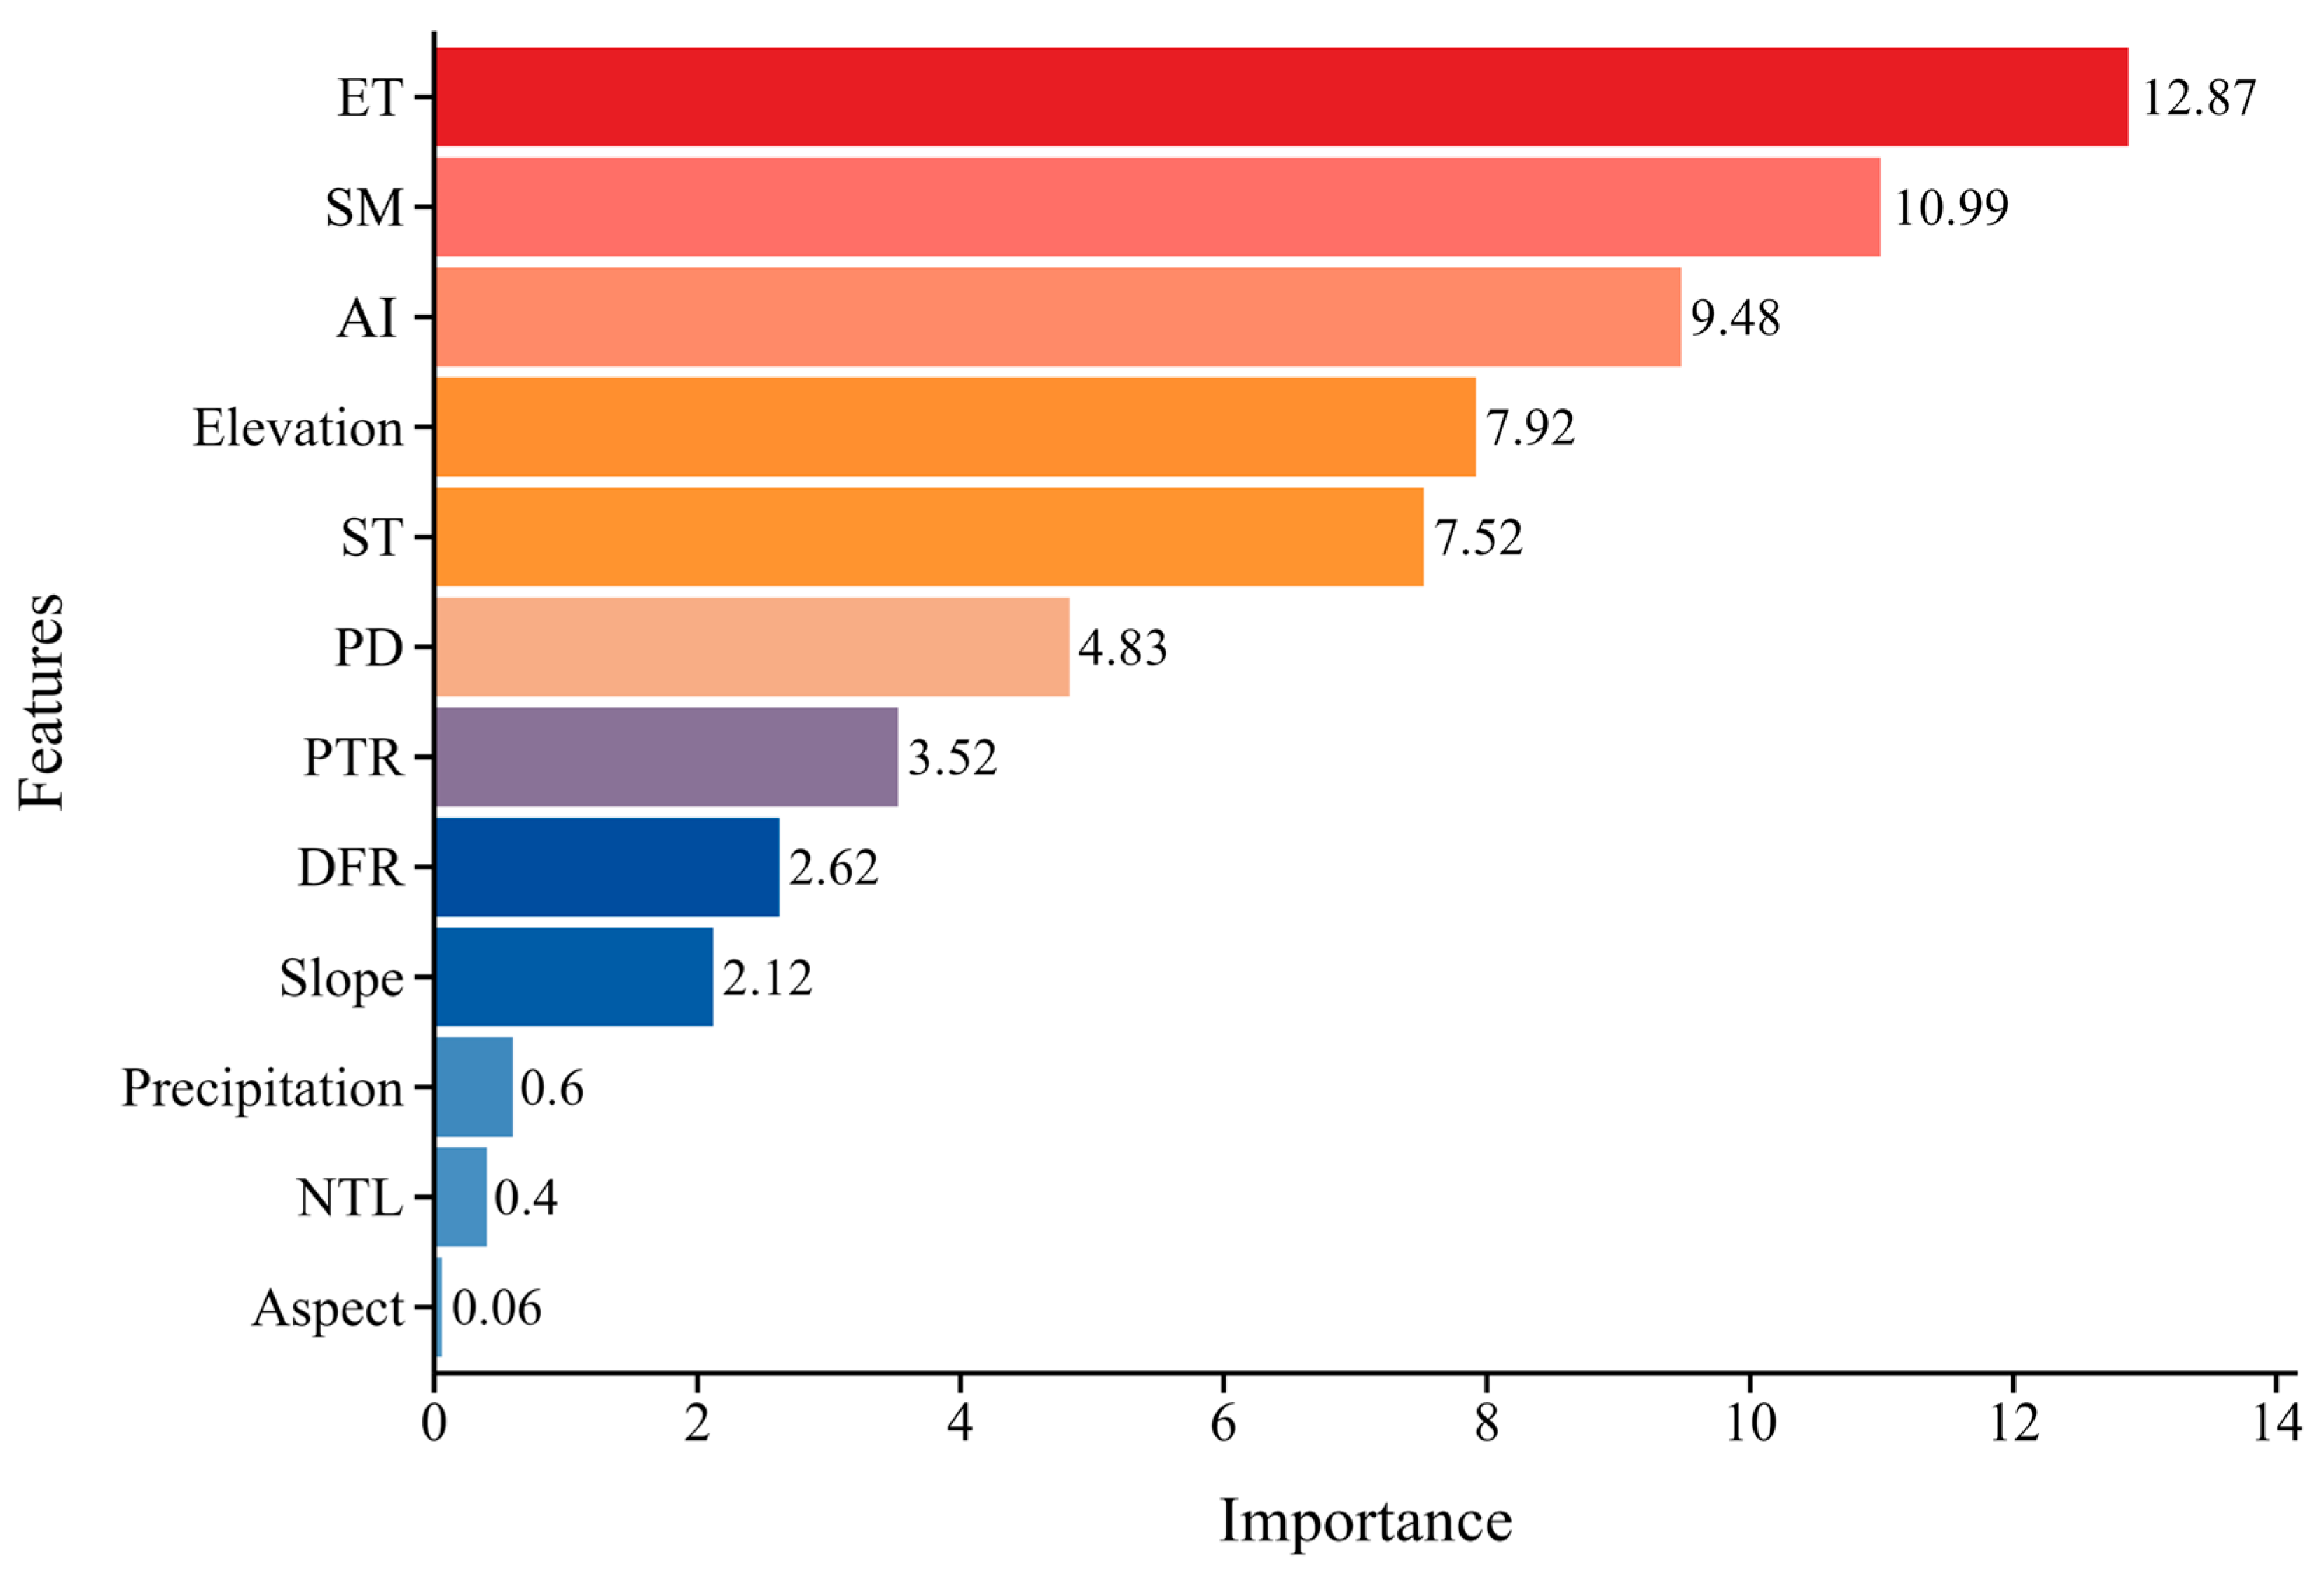
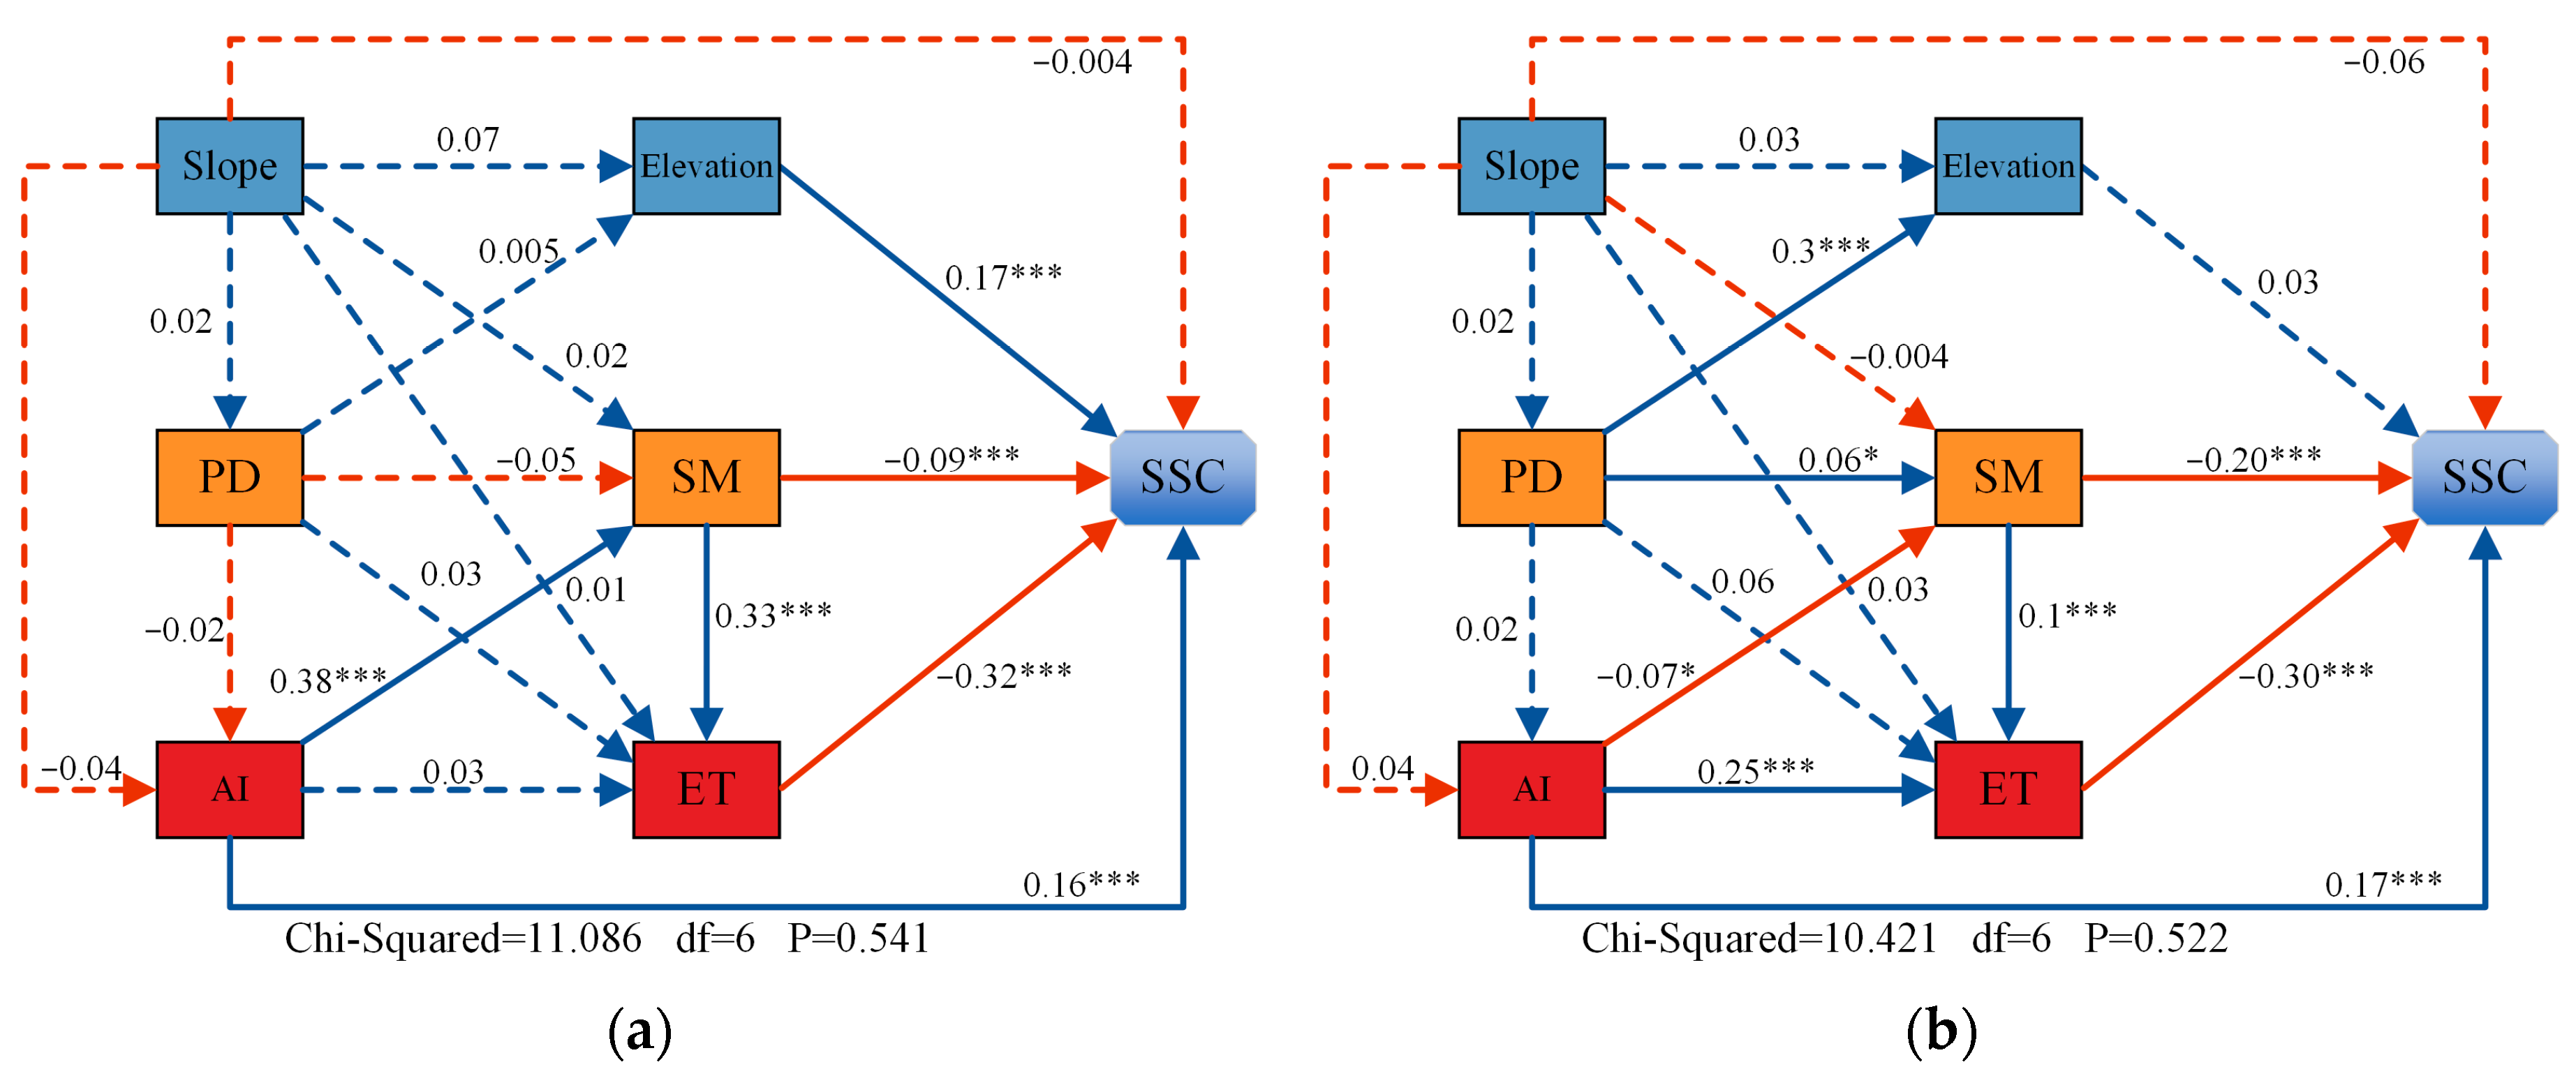
Evapotranspiration (ET) and soil moisture (SM) were identified as the primary driving factors influencing soil salinity dynamics. The impact of SM on soil salinity intensified throughout the study period, suggesting that anthropogenic irrigation has emerged as the dominant factor regulating soil salinity.

Author Contributions

Conceptualization, J.Z. and H.W.; methodology, Y.F.; software, J.Z.; validation, J.Z., M.S. and Y.F.; formal analysis, H.W.; investigation, D.W. and Y.B.; resources, J.X.; data curation, J.Z. and Y.L.; writing—original draft preparation, J.Z.; writing—review and editing, J.Z.; visualization, J.Z.; supervision, J.Z.; project administration, H.W.; funding acquisition, H.W. All authors have read and agreed to the published version of the manuscript.

Funding

Integration and Demonstration of Technical Models for Soil Improvement and Capacity Enhancement in Northwest Saline Soil Area (Project No. 2023YFD1901503).

Data Availability Statement

The data presented in this study are available upon request from the corresponding author.

Conflicts of Interest

The authors declare no conflicts of interest.

References

  1. Singh, A. Soil salinity: A global threat to sustainable development. Soil Use Manag. 2022, 38, 39–67. [Google Scholar]
  2. Basak, N.; Rai, A.K.; Barman, A.; Mandal, S.; Sundha, P.; Bedwal, S.; Kumar, S.; Yadav, R.K.; Sharma, P.C. Salt affected soils: Global perspectives. In Soil Health and Environmental Sustainability: Application of Geospatial Technology; Springer: Berlin/Heidelberg, Germany, 2022; pp. 107–129. [Google Scholar]
  3. Haj-Amor, Z.; Araya, T.; Kim, D.-G.; Bouri, S.; Lee, J.; Ghiloufi, W.; Yang, Y.; Kang, H.; Jhariya, M.K.; Banerjee, A. Soil salinity and its associated effects on soil microorganisms, greenhouse gas emissions, crop yield, biodiversity and desertification: A review. Sci. Total Environ. 2022, 843, 156946. [Google Scholar] [PubMed]
  4. Gang, N.; Gu, F.; Burrill, H.M.; Jianfang, L.; Zhang, J.; Zhang, F. Saline-alkali soil reclamation and utilization in China: Progress and prospects. Front. Agric. Sci. Eng. 2024, 11, 216. [Google Scholar]
  5. Wang, F.; Yang, S.; Wei, Y.; Shi, Q.; Ding, J. Characterizing soil salinity at multiple depth using electromagnetic induction and remote sensing data with random forests: A case study in Tarim River Basin of southern Xinjiang, China. Sci. Total Environ. 2021, 754, 142030. [Google Scholar]
  6. Peng, J.; Biswas, A.; Jiang, Q.; Zhao, R.; Hu, J.; Hu, B.; Shi, Z. Estimating soil salinity from remote sensing and terrain data in southern Xinjiang Province, China. Geoderma 2019, 337, 1309–1319. [Google Scholar] [CrossRef]
  7. Wang, B.; Dong, X.; Wang, Z.; Qin, G. Characterizing spatiotemporal variations of soil salinization and its relationship with eco-hydrological parameters at the Regional Scale in the Kashi Area of Xinjiang, China from 2000 to 2017. Water 2021, 13, 1075. [Google Scholar] [CrossRef]
  8. Dakak, H.; Huang, J.; Zouahri, A.; Douaik, A.; Triantafilis, J. Mapping soil salinity in 3-dimensions using an EM38 and EM4Soil inversion modelling at the reconnaissance scale in central Morocco. Soil Use Manag. 2017, 33, 553–567. [Google Scholar]
  9. Vermeulen, D.; Van Niekerk, A. Machine learning performance for predicting soil salinity using different combinations of geomorphometric covariates. Geoderma 2017, 299, 1–12. [Google Scholar] [CrossRef]
  10. Samiee, M.; Ghazavi, R.; Pakparvar, M.; Vali, A. Mapping spatial variability of soil salinity in a coastal area located in an arid environment using geostatistical and correlation methods based on the satellite data. Desert 2018, 23, 233–242. [Google Scholar]
  11. Li, H.; Webster, R.; Shi, Z. Mapping soil salinity in the Yangtze delta: REML and universal kriging (E-BLUP) revisited. Geoderma 2015, 237, 71–77. [Google Scholar]
  12. Wang, Y.; Deng, C.; Liu, Y.; Niu, Z.; Li, Y. Identifying change in spatial accumulation of soil salinity in an inland river watershed, China. Sci. Total Environ. 2018, 621, 177–185. [Google Scholar] [CrossRef] [PubMed]
  13. Sahbeni, G.; Székely, B. Spatial modeling of soil salinity using kriging interpolation techniques: A study case in the Great Hungarian Plain. Eurasian J. Soil Sci. 2022, 11, 102–112. [Google Scholar] [CrossRef]
  14. Pulatov, A.; Khamidov, A.; Akhmatov, D.; Pulatov, B.; Vasenev, V. Soil salinity mapping by different interpolation methods in Mirzaabad district, Syrdarya Province. IOP Conf. Ser. Mater. Sci. Eng. 2020, 883, 012089. [Google Scholar] [CrossRef]
  15. Jia, P.; Zhang, J.; Liang, Y.; Zhang, S.; Jia, K.; Zhao, X. The inversion of arid-coastal cultivated soil salinity using explainable machine learning and Sentinel-2. Ecol. Indic. 2024, 166, 112364. [Google Scholar] [CrossRef]
  16. Li, Y.; Chang, C.; Wang, Z.; Zhao, G. Upscaling remote sensing inversion and dynamic monitoring of soil salinization in the Yellow River Delta, China. Ecol. Indic. 2023, 148, 110087. [Google Scholar] [CrossRef]
  17. Song, Y.; Gao, M.; Wang, J. Inversion of salinization in multilayer soils and prediction of water demand for salt regulation in coastal region. Agric. Water Manag. 2024, 301, 108970. [Google Scholar] [CrossRef]
  18. Li, Y.; Chang, C.; Wang, Z.; Zhao, G. Remote sensing prediction and characteristic analysis of cultivated land salinization in different seasons and multiple soil layers in the coastal area. Int. J. Appl. Earth Obs. Geoinf. 2022, 111, 102838. [Google Scholar]
  19. Qi, G.; Chang, C.; Yang, W.; Gao, P.; Zhao, G. Soil salinity inversion in coastal corn planting areas by the satellite-UAV-ground integration approach. Remote Sens. 2021, 13, 3100. [Google Scholar] [CrossRef]
  20. Chen, H.; Ma, Y.; Zhu, A.; Wang, Z.; Zhao, G.; Wei, Y. Soil salinity inversion based on differentiated fusion of satellite image and ground spectra. Int. J. Appl. Earth Obs. Geoinf. 2021, 101, 102360. [Google Scholar]
  21. Wang, J.; Ding, J.; Yu, D.; Ma, X.; Zhang, Z.; Ge, X.; Teng, D.; Li, X.; Liang, J.; Lizaga, I. Capability of Sentinel-2 MSI data for monitoring and mapping of soil salinity in dry and wet seasons in the Ebinur Lake region, Xinjiang, China. Geoderma 2019, 353, 172–187. [Google Scholar]
  22. Bandak, S.; Movahedi-Naeini, S.A.; Mehri, S.; Lotfata, A. A longitudinal analysis of soil salinity changes using remotely sensed imageries. Sci. Rep. 2024, 14, 10383. [Google Scholar]
  23. Avdan, U.; Kaplan, G.; Matcı, D.K.; Avdan, Z.Y.; Erdem, F.; Mızık, E.T.; Demirtaş, İ. Soil salinity prediction models constructed by different remote sensors. Phys. Chem. Earth Parts A/B/C 2022, 128, 103230. [Google Scholar]
  24. Rani, A.; Kumar, N.; Sinha, N.K.; Kumar, J. Identification of salt-affected soils using remote sensing data through random forest technique: A case study from India. Arab. J. Geosci. 2022, 15, 381. [Google Scholar] [CrossRef]
  25. Abd Elaziz, A.E.A.; Soliman, K.G.; Abu-Hashim, M.S.; Hamed, E.A.; Metwally, M.S. Enhancing soil salinity prediction in semi-arid regions using machine learning models technology. Int. J. Chem. Biochem. Sci. IJCBS 2023, 24, 565–574. [Google Scholar]
  26. Aksoy, S.; Sertel, E.; Roscher, R.; Tanik, A.; Hamzehpour, N. Assessment of soil salinity using explainable machine learning methods and Landsat 8 images. Int. J. Appl. Earth Obs. Geoinf. 2024, 130, 103879. [Google Scholar]
  27. Wang, S.; Chen, Y.; Wang, M.; Li, J. Performance comparison of machine learning algorithms for estimating the soil salinity of salt-affected soil using field spectral data. Remote Sens. 2019, 11, 2605. [Google Scholar] [CrossRef]
  28. Ma, Y.; Tashpolat, N. Remote Sensing Monitoring of Soil Salinity in Weigan River–Kuqa River Delta Oasis Based on Two-Dimensional Feature Space. Water 2023, 15, 1694. [Google Scholar] [CrossRef]
  29. Guo, B.; Yang, F.; Han, B.; Fan, Y.; Chen, S.; Yang, W.; Jiang, L. A model for the rapid monitoring of soil salinization in the Yellow River Delta using Landsat 8 OLI imagery based on VI-SI feature space. Remote Sens. Lett. 2019, 10, 796–805. [Google Scholar]
  30. Zhou, Y.; Chen, S.; Hu, B.; Ji, W.; Li, S.; Hong, Y.; Xu, H.; Wang, N.; Xue, J.; Zhang, X. Global soil salinity prediction by open soil Vis-NIR spectral library. Remote Sens. 2022, 14, 5627. [Google Scholar] [CrossRef]
  31. Zhao, J.; Zhang, C.; Min, L.; Guo, Z.; Li, N. Retrieval of farmland surface soil moisture based on feature optimization and machine learning. Remote Sens. 2022, 14, 5102. [Google Scholar] [CrossRef]
  32. Verrelst, J.; Malenovský, Z.; Van der Tol, C.; Camps-Valls, G.; Gastellu-Etchegorry, J.-P.; Lewis, P.; North, P.; Moreno, J. Quantifying vegetation biophysical variables from imaging spectroscopy data: A review on retrieval methods. Surv. Geophys. 2019, 40, 589–629. [Google Scholar] [CrossRef]
  33. Ma, H.; Zhao, W.; Duan, W.; Ma, F.; Li, C.; Li, Z. Inversion model of soil salinity in alfalfa covered farmland based on sensitive variable selection and machine learning algorithms. PeerJ 2024, 12, e18186. [Google Scholar] [CrossRef] [PubMed]
  34. Chen, J.; Yao, Z.; Zhang, Z.; Wei, G.; Wang, X.; Han, J. UAV remote sensing inversion of soil salinity in field of sunflower. Trans. Chin. Soc. Agric. Mach. 2020, 51, 178–191. [Google Scholar]
  35. Nguyen, H.D.; Van, C.P.; Nguyen, T.G.; Dang, D.K.; Pham, T.T.N.; Nguyen, Q.-H.; Bui, Q.-T. Soil salinity prediction using hybrid machine learning and remote sensing in Ben Tre province on Vietnam’s Mekong River Delta. Environ. Sci. Pollut. Res. 2023, 30, 74340–74357. [Google Scholar] [CrossRef] [PubMed]
  36. Jiang, X.; Duan, H.; Liao, J.; Guo, P.; Huang, C.; Xue, X. Estimation of soil salinization by machine learning algorithms in different arid regions of northwest China. Remote Sens. 2022, 14, 347. [Google Scholar] [CrossRef]
  37. He, B.; Ding, J.; Huang, W.; Ma, X. Spatiotemporal variation and future predictions of soil salinization in the Werigan–Kuqa river delta oasis of China. Sustainability 2023, 15, 13996. [Google Scholar] [CrossRef]
  38. Bian, L.; Wang, J.; Liu, J.; Han, B. Spatiotemporal changes of soil salinization in the Yellow River Delta of China from 2015 to 2019. Sustainability 2021, 13, 822. [Google Scholar] [CrossRef]
  39. Ding, Y.; Feng, Y.; Chen, K.; Zhang, X. Analysis of spatial and temporal changes in vegetation cover and its drivers in the Aksu River Basin, China. Sci. Rep. 2024, 14, 10165. [Google Scholar] [CrossRef]
  40. Sannigrahi, S.; Zhang, Q.; Pilla, F.; Joshi, P.K.; Basu, B.; Keesstra, S.; Roy, P.; Wang, Y.; Sutton, P.C.; Chakraborti, S. Responses of ecosystem services to natural and anthropogenic forcings: A spatial regression based assessment in the world’s largest mangrove ecosystem. Sci. Total Environ. 2020, 715, 137004. [Google Scholar] [CrossRef]
  41. Liu, X.; Delgado-Baquerizo, M.; Yang, T.; Gao, G.-F.; Shi, Y.; Chu, H. Contrasting patterns for bacteria and archaea in response to salt stress across alpine wetlands of the Tibetan Plateau. Fundam. Res. 2024, in press. [Google Scholar] [CrossRef]
  42. Chen, Y.; Zhang, S.; Wang, Y. Spatial distribution patterns and drivers of above-and below-biomass in Chinese terrestrial ecosystems. Sci. Total Environ. 2024, 944, 173922. [Google Scholar]
  43. Du, D.; He, B.; Luo, X.; Ma, S.; Song, Y.; Yang, W. Spatio-Temporal Variation Analysis of Soil Salinization in the Ougan-Kuqa River Oasis of China. Sustainability 2024, 16, 2706. [Google Scholar] [CrossRef]
  44. Wei, Q.; Nurmemet, I.; Gao, M.; Xie, B. Inversion of soil salinity using multisource remote sensing data and particle swarm machine learning models in Keriya Oasis, northwestern China. Remote Sens. 2022, 14, 512. [Google Scholar] [CrossRef]
  45. Li, X.; Yang, J.; Liu, M.; Liu, G.; Mei, Y. Spatio-temporal changes of soil salinity in arid areas of south Xinjiang using electromagnetic induction. J. Integr. Agric. 2012, 11, 1365–1376. [Google Scholar] [CrossRef]
  46. Huang, Y.; Zhao, Y.; Gong, B.; Yang, J.; Li, Y. Effects of Potential Large-Scale Irrigation on Regional Precipitation in Northwest China. Remote Sens. 2023, 16, 58. [Google Scholar] [CrossRef]
  47. Zhang, J.; Zhang, P.; Deng, X.; Ren, C.; Deng, M.; Wang, S.; Lai, X.; Long, A. Study on the Spatial and Temporal Trends of Ecological Environment Quality and Influencing Factors in Xinjiang Oasis. Remote Sens. 2024, 16, 1980. [Google Scholar] [CrossRef]
  48. Shi, C.; Chao, G.; Bin, X.; Yunxiang, J.; Jinya, L.; Hailong, M.; Fen, Z.; Jian, G.; Xiuchun, Y. Quantitative inversion of soil salinity and analysis of its spatial pattern in agricultural area in Shihezi of Xinjiang. Geogr. Res. 2015, 33, 2135–2144. [Google Scholar]
  49. Allbed, A.; Kumar, L.; Aldakheel, Y.Y. Assessing soil salinity using soil salinity and vegetation indices derived from IKONOS high-spatial resolution imageries: Applications in a date palm dominated region. Geoderma 2014, 230, 1–8. [Google Scholar]
  50. Abbas, A.; Khan, S. Using remote sensing techniques for appraisal of irrigated soil salinity. In Proceedings of the International Congress on Modelling and Simulation (MODSIM), Christchurch, New Zealand, 10–13 December 2007; pp. 2632–2638. [Google Scholar]
  51. Nicolas, H.; Walter, C. Detecting salinity hazards within a semiarid context by means of combining soil and remote-sensing data. Geoderma 2006, 134, 217–230. [Google Scholar]
  52. Khan, N.M.; Rastoskuev, V.V.; Sato, Y.; Shiozawa, S. Assessment of hydrosaline land degradation by using a simple approach of remote sensing indicators. Agric. Water Manag. 2005, 77, 96–109. [Google Scholar]
  53. Al-Khaier, F. Soil Salinity Detection Using Satellite Remote Sensing. Master’s Thesis, International Institute for Geo-Information Science and Earth Observation, University of Twente, Enscheda, The Netherlands, 2003; pp. 1–70. [Google Scholar]
  54. Khan, N.M.; Rastoskuev, V.V.; Shalina, E.V.; Sato, Y. Mapping salt-affected soils using remote sensing indicators-a simple approach with the use of GIS IDRISI. In Proceedings of the 22nd Asian Conference on Remote Sensing, Singapore, 5–9 November 2001. [Google Scholar]
  55. Camps-Valls, G.; Campos-Taberner, M.; Moreno-Martínez, Á.; Walther, S.; Duveiller, G.; Cescatti, A.; Mahecha, M.D.; Muñoz-Marí, J.; García-Haro, F.J.; Guanter, L. A unified vegetation index for quantifying the terrestrial biosphere. Sci. Adv. 2021, 7, eabc7447. [Google Scholar] [CrossRef] [PubMed]
  56. Taghizadeh-Mehrjardi, R.; Minasny, B.; Sarmadian, F.; Malone, B. Digital mapping of soil salinity in Ardakan region, central Iran. Geoderma 2014, 213, 15–28. [Google Scholar] [CrossRef]
  57. Yan, K.; Gao, S.; Chi, H.; Qi, J.; Song, W.; Tong, Y.; Mu, X.; Yan, G. Evaluation of the vegetation-index-based dimidiate pixel model for fractional vegetation cover estimation. IEEE Trans. Geosci. Remote Sens. 2021, 60, 4400514. [Google Scholar] [CrossRef]
  58. Zeng, Y.; Hao, D.; Huete, A.; Dechant, B.; Berry, J.; Chen, J.M.; Joiner, J.; Frankenberg, C.; Bond-Lamberty, B.; Ryu, Y. Optical vegetation indices for monitoring terrestrial ecosystems globally. Nat. Rev. Earth Environ. 2022, 3, 477–493. [Google Scholar] [CrossRef]
  59. Guo, B.; Yang, X.; Yang, M.; Sun, D.; Zhu, W.; Zhu, D.; Wang, J. Mapping soil salinity using a combination of vegetation index time series and single-temporal remote sensing images in the Yellow River Delta, China. Catena 2023, 231, 107313. [Google Scholar] [CrossRef]
  60. Wu, W.; Al-Shafie, W.M.; Mhaimeed, A.S.; Ziadat, F.; Nangia, V.; Payne, W.B. Soil salinity mapping by multiscale remote sensing in Mesopotamia, Iraq. IEEE J. Sel. Top. Appl. Earth Obs. Remote Sens. 2014, 7, 4442–4452. [Google Scholar] [CrossRef]
  61. Fern, R.R.; Foxley, E.A.; Bruno, A.; Morrison, M.L. Suitability of NDVI and OSAVI as estimators of green biomass and coverage in a semi-arid rangeland. Ecol. Indic. 2018, 94, 16–21. [Google Scholar] [CrossRef]
  62. Haboudane, D.; Miller, J.R.; Pattey, E.; Zarco-Tejada, P.J.; Strachan, I.B. Hyperspectral vegetation indices and novel algorithms for predicting green LAI of crop canopies: Modeling and validation in the context of precision agriculture. Remote Sens. Environ. 2004, 90, 337–352. [Google Scholar] [CrossRef]
  63. Wu, Z.; Lei, S.; Bian, Z.; Huang, J.; Zhang, Y. Study of the desertification index based on the albedo-MSAVI feature space for semi-arid steppe region. Environ. Earth Sci. 2019, 78, 232. [Google Scholar] [CrossRef]
  64. Zhang, T.; Wang, L.; Zeng, P.; Wang, T.; Geng, Y.; Wang, H. Soil salinization in the irrigated area of the Manas River basin based on MSAVI-SI feature space. Arid Zone Res 2016, 33, 499–505. [Google Scholar]
  65. Guo, B.; Han, B.; Yang, F.; Fan, Y.; Jiang, L.; Chen, S.; Yang, W.; Gong, R.; Liang, T. Salinization information extraction model based on VI–SI feature space combinations in the Yellow River Delta based on Landsat 8 OLI image. Geomat. Nat. Hazards Risk 2019, 10, 1863–1878. [Google Scholar] [CrossRef]
  66. Zhang, T.-T.; Zhao, B. Impact of anthropogenic land-uses on salinization in the Yellow River Delta, China: Using a new RS-GIS statistical model. Int. Arch. Photogramm. Remote Sens. Spat. Inf. Sci. 2010, 38, 947–952. [Google Scholar]
  67. Shannon, T.P.; Ahler, S.J.; Mathers, A.; Ziter, C.D.; Dugan, H.A. Road salt impact on soil electrical conductivity across an urban landscape. J. Urban Ecol. 2020, 6, juaa006. [Google Scholar] [CrossRef]
  68. Zeng, Y.; Zhao, C.; Shi, F.; Schneider, M.; Lv, G.; Li, Y. Impact of groundwater depth and soil salinity on riparian plant diversity and distribution in an arid area of China. Sci. Rep. 2020, 10, 7272. [Google Scholar] [CrossRef]
  69. Ma, G.; Ding, J.; Han, L.; Zhang, Z.; Ran, S. Digital mapping of soil salinization based on Sentinel-1 and Sentinel-2 data combined with machine learning algorithms. Reg. Sustain. 2021, 2, 177–188. [Google Scholar] [CrossRef]
  70. Xie, L.; Feng, X.; Zhang, C.; Dong, Y.; Huang, J.; Cheng, J. A framework for soil salinity monitoring in coastal wetland reclamation areas based on combined unmanned aerial vehicle (UAV) data and satellite data. Drones 2022, 6, 257. [Google Scholar] [CrossRef]
  71. Dhillon, M.S.; Dahms, T.; Kuebert-Flock, C.; Rummler, T.; Arnault, J.; Steffan-Dewenter, I.; Ullmann, T. Integrating random forest and crop modeling improves the crop yield prediction of winter wheat and oil seed rape. Front. Remote Sens. 2023, 3, 1010978. [Google Scholar] [CrossRef]
  72. Jia, P.; Zhang, J.; He, W.; Hu, Y.; Zeng, R.; Zamanian, K.; Jia, K.; Zhao, X. Combination of hyperspectral and machine learning to invert soil electrical conductivity. Remote Sens. 2022, 14, 2602. [Google Scholar] [CrossRef]
  73. Awad, M. Google Earth Engine (GEE) cloud computing based crop classification using radar, optical images and Support Vector Machine Algorithm (SVM). In Proceedings of the 2021 IEEE 3rd International Multidisciplinary Conference on Engineering Technology (IMCET), Beirut, Lebanon, 8–10 December 2021; pp. 71–76. [Google Scholar]
  74. Lee, S.K. On classification and regression trees for multiple responses and its application. J. Classif. 2006, 23, 123–141. [Google Scholar] [CrossRef]
  75. Zhang, S.; Tian, J.; Lu, X.; Tian, Q. Temporal and spatial dynamics distribution of organic carbon content of surface soil in coastal wetlands of Yancheng, China from 2000 to 2022 based on Landsat images. Catena 2023, 223, 106961. [Google Scholar] [CrossRef]
  76. Gao, X.; Dong, S.; Xu, Y.; Fry, E.L.; Li, Y.; Li, S.; Shen, H.; Xiao, J.; Wu, S.; Yang, M. Plant biomass allocation and driving factors of grassland revegetation in a Qinghai-Tibetan Plateau chronosequence. Land Degrad. Dev. 2021, 32, 1732–1741. [Google Scholar]
  77. Naimi, S.; Ayoubi, S.; Zeraatpisheh, M.; Dematte, J.A.M. Ground observations and environmental covariates integration for mapping of soil salinity: A machine learning-based approach. Remote Sens. 2021, 13, 4825. [Google Scholar] [CrossRef]
  78. Muhetaer, N.; Nurmemet, I.; Abulaiti, A.; Xiao, S.; Zhao, J. A quantifying approach to soil salinity based on a radar feature space model using ALOS PALSAR-2 data. Remote Sens. 2022, 14, 363. [Google Scholar] [CrossRef]
  79. Ma, L.; Ma, F.; Li, J.; Gu, Q.; Yang, S.; Wu, D.; Feng, J.; Ding, J. Characterizing and modeling regional-scale variations in soil salinity in the arid oasis of Tarim Basin, China. Geoderma 2017, 305, 1–11. [Google Scholar]
  80. Wang, Z.; Zhang, F.; Zhang, X.; Chan, N.W.; Ariken, M.; Zhou, X.; Wang, Y. Regional suitability prediction of soil salinization based on remote-sensing derivatives and optimal spectral index. Sci. Total Environ. 2021, 775, 145807. [Google Scholar]
  81. Jia, P.; Zhang, J.; He, W.; Yuan, D.; Hu, Y.; Zamanian, K.; Jia, K.; Zhao, X. Inversion of different cultivated soil types’ salinity using hyperspectral data and machine learning. Remote Sens. 2022, 14, 5639. [Google Scholar] [CrossRef]
  82. Wang, N.; Xue, J.; Peng, J.; Biswas, A.; He, Y.; Shi, Z. Integrating remote sensing and landscape characteristics to estimate soil salinity using machine learning methods: A case study from Southern Xinjiang, China. Remote Sens. 2020, 12, 4118. [Google Scholar] [CrossRef]
  83. Zhang, Y.; Wu, H.; Kang, Y.; Fan, Y.; Wang, S.; Liu, Z.; He, F. Mapping the Soil Salinity Distribution and Analyzing Its Spatial and Temporal Changes in Bachu County, Xinjiang, Based on Google Earth Engine and Machine Learning. Agriculture 2024, 14, 630. [Google Scholar] [CrossRef]
  84. Mehla, M.K.; Kumar, A.; Kumar, S.; Jhorar, R. Soil salinity assessment and mapping using spectral indices and geostatistical techniques-concepts and reviews. In Remote Sensing of Soils; Elsevier: Amsterdam, The Netherlands, 2024; pp. 429–437. [Google Scholar]
  85. Boudibi, S.; Sakaa, B.; Benguega, Z.; Fadlaoui, H.; Othman, T.; Bouzidi, N. Spatial prediction and modeling of soil salinity using simple cokriging, artificial neural networks, and support vector machines in El Outaya plain, Biskra, southeastern Algeria. Acta Geochim. 2021, 40, 390–408. [Google Scholar] [CrossRef]
  86. Zhang, H.; Fu, X.; Zhang, Y.; Qi, Z.; Zhang, H.; Xu, Z. Mapping multi-depth soil salinity using remote sensing-enabled machine learning in the yellow river delta, China. Remote Sens. 2023, 15, 5640. [Google Scholar] [CrossRef]
  87. Ma, S.; He, B.; Xie, B.; Ge, X.; Han, L. Investigation of the spatial and temporal variation of soil salinity using Google Earth Engine: A case study at Werigan–Kuqa Oasis, West China. Sci. Rep. 2023, 13, 2754. [Google Scholar] [CrossRef] [PubMed]
  88. Zhang, W.-T.; Wu, H.-Q.; Gu, H.-B.; Feng, G.-L.; Wang, Z.; Sheng, J.-D. Variability of soil salinity at multiple spatio-temporal scales and the related driving factors in the oasis areas of Xinjiang, China. Pedosphere 2014, 24, 753–762. [Google Scholar] [CrossRef]
  89. Zheng, N.; Guo, M.; Yue, W.; Teng, Y.; Zhai, Y.; Yang, J.; Zuo, R. Evaluating the impact of flood irrigation on spatial variabilities of soil salinity and groundwater quality in an arid irrigated region. Hydrol. Res. 2021, 52, 229–240. [Google Scholar]
Figure 1. Geographical extent of this study.
Land 14 00803 g001
Figure 2. Map of soil salinity sampling sites in 2010 and 2023.
Land 14 00803 g002
Figure 3. The workflow of this study. (* denotes significance level p < 0.05, ** denotes significance level p < 0.01, and *** denotes significance level p < 0.001).
Land 14 00803 g003
Figure 4. Distribution of salinity at the sampling points. (a) 2010; (b) 2023.
Land 14 00803 g004
Figure 5. Correlation between inversion factors and soil salinity. (a) Spectral index; (b) salinity index; (c) vegetation index; (d) composite index; (e) climatic factor; (f) topographic factor; (g) soil factor (* denotes significance level p < 0.05, ** denotes significance level p < 0.01, and *** denotes significance level p < 0.001).
Land 14 00803 g005aLand 14 00803 g005b
Figure 6. Accuracy assessment of the four models. (a) Random Forest; (b) Gradient Boosting; (c) Support Vector Machine; (d) Classification and Regression Tree.
Land 14 00803 g006
Figure 7. Distribution of soil salt content in 2010 and 2023. (a) 2010; (b) 2023.
Land 14 00803 g007
Figure 8. Distribution of soil salinity classes in 2010 and 2023. (a) 2010; (b) 2023.
Land 14 00803 g008
Figure 9. Percentage of area in soil salinity classes in 2010 and 2023 in each of the southern border states. (a) 2010; (b) 2023.
Land 14 00803 g009
Figure 10. Relative contribution of random forest-based drivers to salinity impacts.
Land 14 00803 g010
Figure 11. Analysis of soil salinity formation pathways based on piecewise SEM modelling. (a) 2010; (b) 2023. (The red lines indicate negative impacts, while the blue lines indicate positive impacts. The numbers adjacent to the arrows are the standardized path coefficients. The solid lines represent a significant correlation, * denotes significance level p < 0.05, and *** denotes significance level p < 0.001, whereas the dashed lines indicate lack of significance).
Land 14 00803 g011
Figure 12. Effect of driving factors on soil salinity. (a) 2010; (b) 2023.
Land 14 00803 g012
Table 1. Soil salinity classification criteria.
Degree of Soil SalinizationNon SalinizedSlight SalinizationModerately SaltedSevere SalinizationSalt Soil
Soil salinity
(S, g·kg−1)
0 ≤ S < 33 ≤ S < 66 ≤ S < 1010 ≤ S < 20S ≥ 20
Table 2. Sources and resolution of remotely sensed data.
Factor TypesVariable NameData SourcesSpatial Resolution
Spectral indexBlue, Green, Red, NIR, SWIR1, SWIR2Landsat 5/930 m
Salinity indexSI1, SI2, SI3, SI4, SI5, SI6, SI7, SI8, SI9, SI10, NDSI, SI-TLandsat 5/930 m
Vegetation indexNDVI, EVI, OSAVI, MSAVI, CRSI, GDVI, DVI, kNDVILandsat 5/930 m
Composite indexAlbedo, AM, SDI, ASI, NAS, MASLandsat 5/930 m
Climatic factorEvapotranspiration (ET)MOD16A2GF500 m
PrecipitationCHIRPS Daily 2.0 Final500 m
Aridity Index (AI)TerraClimate0.04°
Soil factorSoil Moisture (SM), Soil Temperature (ST)Global Land Data Assimilation System0.25°
Topographic factorElevation, Slope, AspectSRTM 30   m
Human activitiesPopulation Density (PD)LandScan 1   km
Night Lights (NTL)NCEI 1   km
Table 3. Salinity index, vegetation index, composite index formulae.
Factor TypesVariable NameAbbreviationCalculation FormulaReference
Salinity indexSalinity index 1SI1 B l u e × R [49]
Salinity indexSI-T N / N I R × 100 [49]
Salinity index 2SI2 ( B l u e × R ) / G r e e n [50]
Salinity index 3SI3 ( B l u e R ) / ( B l u e + R ) [50]
Salinity index 4SI4 ( G r e e n × R ) / B l u e [50]
Salinity index 5SI5 ( B l u e × R ) / 2 [50]
Salinity index 6SI6 B l u e / R [51]
Salinity index 7SI7 G r e e n 2 × R 2 + N I R 2 [51]
Salinity index 8SI8 G r e e n × R [52]
Salinity index 9SI9 ( S W I R 1 N I R ) / ( S W I R 1 S W I R 2 ) [53]
Salinity index 10SI10 ( S W I R 1 × S W I R 2 S W I R 2 × S W I R 2 ) / S W I R 1 [53]
Normalized difference salinity indexNDSI R N I R / R + N I R [54]
Vegetation indexkernel normalized difference vegetation indexkNDVI t a n h ( N D V I 2 ) [55]
Normalized difference vegetation indexNDVI ( N I R R ) / ( N I R + R ) [56]
Difference vegetation indexDVI N I R R [57]
Enhanced vegetation indexEVI 2.5 × ( ( N I R R ) / ( N I R + 6 × R 7.5 × B l u e + 1 ) ) [58]
Canopy redness indexCRSI ( ( N I R × R G × B ) / ( N I R × R + G × B ) ) 0.5 [59]
Generalized difference vegetation indexGDVI ( N I R 2 R 2 ) / ( N I R 2 + R 2 ) [60]
Optimized soil-adjusted vegetation indexOSAVI ( 1.16 × ( N I R R ) ) / ( N I R + R + 0.16 ) [61]
Modified soil-adjusted vegetation indexMSAVI 2 N I R + 1 2 N I R + 1 2 8 N I R R / 2 [62]
Composite indexAlbedoAlbedo 0.356 × B l u e + 0.13 × R + 0.373 × N I R + 0.0085 × S W I R 1 + 0.072   × S W I R 2 0.0018 [63]
SI1-NDVISDI S I 1 2 + N D V I 1 2 [64]
Albedo-MSAVIAM 1 A l b e d o 2 + M S A V I 2 [64]
SI1-AlbedoASI A l b e d o 2 + S I 1 2 [64]
Albedo-SI1NAS ( N D V I 1 ) 2 + A l b e d o 2 + S I 2 [64]
SI1-Albedo-MSAVIMAS ( A l b e d o 1 ) 2 + M S A V I 2 + ( S I 1 1 ) 2 [65]
Table 4. Descriptive statistics of soil salt content in 2010 (g·kg−1).
Degree of Soil SalinizationMinMaxMeanSDMedianCV
Non salinized0.122.931.820.601.8033.09
Slight salinization3.005.953.940.723.8418.31
Moderately salted6.009.887.191.336.5018.46
Severe salinization12.6019.7415.482.4714.5615.97
Salt soil20.5123.8022.651.2623.035.59
Table 5. Descriptive statistics of soil salt content in 2023 (g·kg−1).
Degree of Soil SalinizationMinMaxMeanSDMedianCV
Non salinized0.303.001.550.741.5047.61
Slight salinization3.016.004.290.874.2020.34
Moderately salted6.0710.007.751.097.7014.03
Severe salinization10.1019.8013.212.6512.5520.10
Salt soil20.3058.3032.4110.3230.9531.85
Table 6. Accuracy of different models for inversion of salinity in saline soils.
ModelR2RMSE/(g·kg−1)MAE/(g·kg−1)
RF0.7562.2651.468
GBDT0.7342.6081.634
SVM0.5701.6631.266
CART0.5023.6482.145
Table 7. Classification of soil salinity drivers.
Factor TypesVariable Name
Human activities Soil moisture, population density, night lighting, distance from road (DFR)
Topographic attributesElevation, slope, aspect
Natural factorsEvaporation, aridity index, precipitation, soil temperature, proximity to river (PTR)
Disclaimer/Publisher’s Note: The statements, opinions and data contained in all publications are solely those of the individual author(s) and contributor(s) and not of MDPI and/or the editor(s). MDPI and/or the editor(s) disclaim responsibility for any injury to people or property resulting from any ideas, methods, instructions or products referred to in the content.

