Abstract
Cities face growing challenges from climate change, including rising temperatures, extreme rainfall, and intensifying urban heat islands, resulting in significant socio-cultural costs. Urban areas are increasingly vulnerable to food insecurity during disasters, yet the potential of urban agriculture (UA) to address this challenge remains underexplored. This study focuses on Wellington, New Zealand (NZ), a region highly prone to earthquakes, to evaluate the role of UA in enhancing post-disaster food security. The study calculates vegetable self-sufficiency by mapping potential productive land, estimating vegetable yields, and assessing post-disaster food demands across multiple scenarios. Potential productive land was quantified using a reproducible GIS-based method, considering three soil-based UA types: private yards, communal gardens, and urban farms. Due to Wellington’s mountainous topography, slopes and aspects were used to select four land scenarios. Three yield scenarios were estimated using aggregated data from previous studies and cross-checked with local UA and NZ conventional farming data. Food demands were based on NZ’s recommended vegetable intake and three targeted population scenarios: the entire population, displaced populations, and vulnerable populations. Results indicate that potential productive land is primarily evenly distributed in the eastern part within the city boundary, accounting for 0.3% to 1.5% of the total area. Vegetable self-sufficient rates for Wellington through UA range from 3% to 75%, with higher rates for displaced and vulnerable populations. These figures significantly exceed the current self-sufficiency rate estimated in the authors’ preliminary research, indicating Wellington’s considerable potential to enhance post-disaster food security through expanding UA and promoting related initiatives. However, realizing this potential will require stronger policy support, integrating UA with urban planning and disaster preparedness.
1. Introduction
Climate change poses a number of increased disaster scenarios for cities. Urban residents are increasingly vulnerable to extreme weather events such as droughts, heatwaves, and flooding, with climate change expected to further exacerbate these issues [1,2]. In addition, research notes that climate change is expected to increase the likelihood of disasters such as liquefaction and flooding, particularly in coastal areas [3,4]. In addition to the seismic risks to New Zealand (NZ), cities in NZ are susceptible to the projected impacts of climate change, including extreme rainfall, extreme storm events, and urban water security [5,6,7]. The ability of cities to respond to climate change-induced extreme weather events has become a critical global concern [8]. Given the rising risk of disasters like landslides, liquefaction, and seismic activity, understanding the potential role of urban agriculture in enhancing post-disaster food security is crucial.
1.1. Post-Disaster Food Security
As the global population continues to grow, ensuring food self-sufficiency through sustainable food security remains a critical global priority and challenge [9]. Food security has been defined as “when all people, at all times, have physical, social and economic access to sufficient, safe and nutritious food to meet their dietary needs and food preferences for an active and healthy life” [10] (p. 1). Disasters pose a direct threat to food security [11], severely disrupting the food system at every stage, from production and distribution to consumption [12]. Such events can lead to failures in both physical and social food accessibility due to environmental disruptions, reduced food availability from supply chain interruptions, and inadequacies in food suitability stemming from cultural, nutritional, or medical gaps [13].
Disasters causing infrastructure failures further impede access to food [14]. For instance, during the severe weather events in North Island, NZ, in 2023, the town of Wairoa was cut off due to flooding, which forced residents to rely on themselves for food and other essentials [15]. After disasters, the distribution of emergency food can be delayed due to road damage and congestion. Following the 2011 Great East Japan Earthquake, food transported from outside the affected areas often took longer to arrive, causing perishable items to spoil before reaching their destinations [16]. Such delays in emergency assistance underscore the importance of strengthening food security through local food systems [14].
While government-led support is essential for post-disaster food security, household and individual-level food preparedness remains a vital component of disaster resilience [17]. However, both household and external emergency food supplies primarily consist of non-perishable items designed for longevity and convenience, with little consideration for nutritional value or quality [16,17]. Reliance on such food supplies often results in limited food choices that may fail to meet dietary needs or cultural preferences [18].
While emergency provisions are intended for short-term use, studies indicate that affected populations frequently rely on them for mid-term to long-term periods, depending on the severity of disasters [19]. Based on [16], emergency food, such as long-shelf-life stockpiles, can only address immediate needs in the first stage of a disaster. A complete disaster preparedness food strategy must go beyond just providing basic sustenance. This strategy needs to support both mental and physical health while helping people maintain a sense of normalcy during crisis situations.
The above discussion highlights the fragility of the local food system in post-disaster contexts and the limitations of emergency food stockpiling [16,20]. This underscores the need for alternative approaches to build a more resilient food system capable of withstanding future disasters.
1.2. Urban Agriculture
Urban agriculture (UA) offers a potential solution to the challenges mentioned above [21]. Defined as the cultivation of food and other products, along with related activities, within or near urban areas [22], urban and peri-urban agriculture can take various forms. These are generally categorized into four types: home gardening (small-scale gardens that enhance household food security), shared gardening (collectively maintained spaces on public, vacant, or open urban land), commercial farming (intensively managed operations with hired staff), and institutional gardening (multi-purpose farming initiatives on institutional land) [22]. Vegetables and fruits are the primary products of UA due to their higher nutritional value and greater yields compared to staple crops [23,24].
UA has long been regarded as a means to combat food insecurity during crises. During the 1930s Depression and World War II, vegetable gardens thrived in NZ, ensuring a steady supply of fresh vegetables to citizens at affordable prices. In more recent crises, such as the 2020 COVID-19 pandemic, UA played a critical role in providing food and mental support across various countries [25]. For example, during the lockdown in Wuhan, China, the 20,000 hectares of cultivated land within and around the city ensured the accessibility and availability of vegetables for its residents [26].
Alternative food sources like UA can enhance food security during disasters [18]. A disaster preparation food survey revealed that one-third of households identified access to vegetable gardens as a post-disaster food source [17]. Examples from around the world underscore the importance of UA in disaster resilience. In Pakistan, private yards improved nutritional intake for families affected by the 2005 earthquake in North West Frontier Province [27]. In NZ, local community gardens supported affected populations immediately after the 2010 and 2011 Christchurch earthquakes [28]. Similarly, New York City community gardens contributed to food security and served as spaces for healing after Hurricane Sandy in 2012 [29].
Few studies have explored a city’s potential to utilize UA for vegetable production to enhance post-disaster food security despite its widely recognized benefits [19]. The rationale for this study lies in the need for alternative food systems—such as UA—during disasters. To assess how UA may support food security after a disaster, determining the locations and quantities of vegetables a city can produce to meet its food needs is important. This study seeks to address this gap by using Wellington—a city that is vulnerable to natural hazards such as tsunamis, earthquakes, and liquefaction—as a case study, with an emphasis on vegetable cultivation in soil-based agricultural systems. Based on the definition of self-sufficiency as meeting daily food demands through local food production [30], this study defines vegetable self-sufficiency as the extent to which the targeted population’s vegetable needs can be met within urban boundaries. The findings will provide valuable insights into urban planning and disaster preparedness.
1.3. Case Context
Wellington City, the capital of New Zealand (NZ), has a population of 216,200 [31] and encompasses approximately 290 km2 of land [32]. Due to the city’s natural geography and the presence of several fault lines, this city faces significant hazard risks, including earthquakes, liquefaction, tsunamis, and severe weather events [33,34]. The major urban area is primarily located in the eastern region, where the terrain is more even, while the western region is predominantly rural, characterized by mountainous terrain and limited development (Figure 1b) [35].
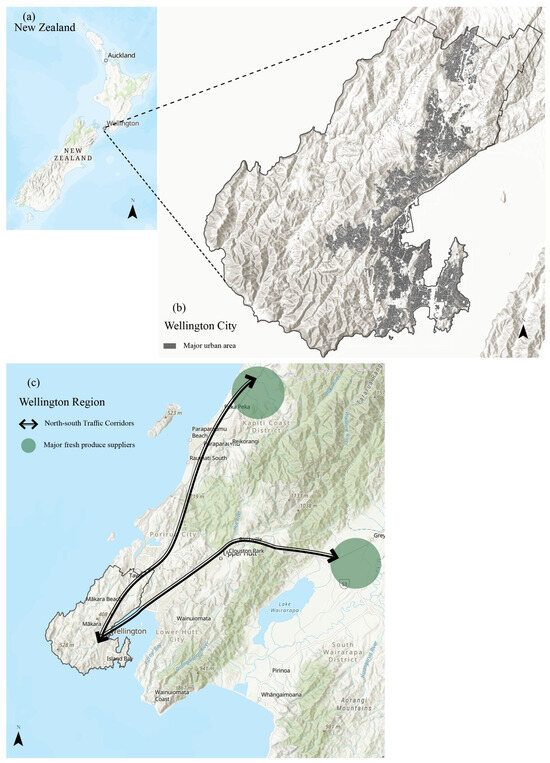
Figure 1.
(a) Map of New Zealand; (b) map of Wellington City: major urban area is in the eastern region; (c) map of Wellington Region (by authors).
The city’s vegetable supply mainly comes from farms to the north (Kapiti Coast) and across the sea to the east (Wairarapa), with distribution heavily dependent on two north-south corridors connecting these regions [36,37,38,39]. However, the city’s geography, bordered by mountains on one side and the sea on the other three, makes its distribution networks susceptible to disruption during natural disasters (Figure 1c) [34,40]. In such circumstances, residents could face severe food shortages during disasters, highlighting the need to rely on local food production to ensure food security [40].
On the other hand, UA has been introduced as part of the sustainable food initiatives promoted by the Wellington City Council (WCC) in 2011 [40], supported by resilient food system guidelines [41]. This promotion has driven the growth of UA in Wellington City, including an expanding network of community gardens [42]. While categorized broadly as “community gardens” by WCC, preliminary research conducted by the authors among the existing community gardens in Wellington identified three distinct UA types: communal gardens, allotments, and urban farms. Beyond community gardens, home gardening, like private yards, has been a longstanding tradition and remains popular in Wellington [43]. Additionally, productive landscapes within urban open spaces have also flourished in the city [44]. It was also observed that vegetables are the primary products of UA in Wellington. Therefore, this study focuses exclusively on vegetable production through UA.
Wellington’s farming-friendly climate supports year-round crop production [36]. However, natural challenges for cultivation include strong winds, insufficient sunlight, and steep slopes, as identified through the preliminary research.
To assess Wellington City’s potential for vegetable production in enhancing food security in the aftermath of disasters, this study addresses the following research questions:
- What is the available land area for vegetable cultivation in Wellington City?
- What is the vegetable productivity in Wellington City, and to what extent can it meet post-disaster vegetable demands?
- What is the potential contribution of UA to post-disaster Wellington?
2. Methods
This study assesses Wellington City’s potential to enhance post-disaster food security through UA by calculating self-sufficient vegetable rates based on three key variables: potential productive land, vegetable yields, and post-disaster demand. High-tech UA, such as rooftop farming, was excluded due to potential vulnerability to structural damage during seismic events [19,45,46]. Instead, this study focused on private yards, communal gardens, and urban farms as practical and disaster-resilient solutions. Here, private yards correspond to home gardening, communal gardens to shared gardening, and urban farms to commercial farming (though not necessarily operated for profit). The methodology consists of four stages, as illustrated in Figure 2.
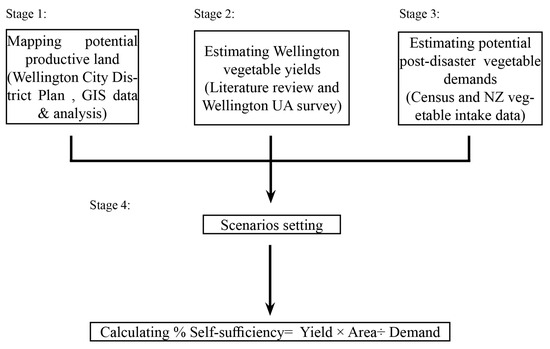
Figure 2.
Study design.
2.1. Mapping Potential Productive Land
A GIS-based (ArcGIS 3.2) approach was used to identify suitable productive land, with data from WCC1, Greater Wellington Regional Council (GW)2, and Land Information New Zealand (LINZ)3, along with non-public data obtained through inquiries to WCC. Slope, aspect, accessibility, hazards, and zoning were the key factors in determining cultivation suitability. Land with steep slopes (>30%), hazardous conditions, or inaccessibility was excluded. The analysis identified potential land for private yards, communal gardens, and urban farms within residential, open-space, recreation, rural, and parts-of-special-purpose zones4 based on a review of farming-permitted zones in the Wellington City District Plan [51].
The methodology for mapping potential productive land consists of three steps (Figure 3).
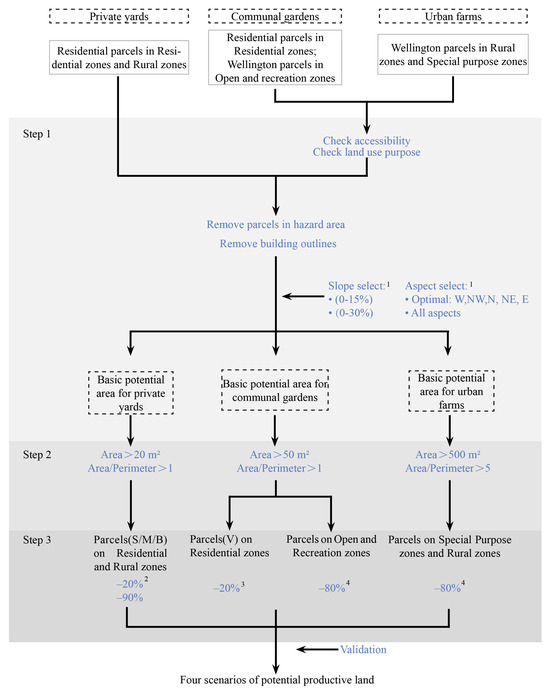
Figure 3.
Process of mapping potential productive areas. (1) Slopes were reclassified based on the following criteria: (a) Slopes < 15% were as ideal for agricultural practices [52,53]. (b) Moreover, 15% < Slopes < 30% were not optimal but still suitable for agricultural activities without requiring significant technical interventions [54]. (c) Slopes > 30% were excluded due to the need for advanced techniques for agricultural purposes [54]. Aspect selection prioritized non-south-facing slopes, as they receive more sunlight and are, therefore, more suitable for farming in New Zealand’s Southern Hemisphere context [54]. (2) For private yards in S, M, and B residential parcels, 20% was reserved for landscaping [51] and 90% for common spaces, including for relaxation, facilities, and paths [55]. (3) For communal gardens in V residential parcels, 80% of the potential area was retained for UA [30]. (4) For communal gardens in open and recreation zones and urban gardens in special-purpose zones and rural zones, 20% of the potential area was designated for cultivation, with the remaining 80% allocated for other purposes such as playgrounds and natural green space, thereby excluded from the potential UA land [56].
Step 1: The input parcel data, excluding roads and highways, was used to clip the corresponding urban zones. For the potential parcels designated for communal gardens and urban farms, existing land-use attributes on the parcel layer were verified and cross-checked with aerial imagery5 to exclude unsuitable areas (e.g., botanical gardens, cemeteries, dams, motorways, and landfills). To address post-disaster food demands, this study prioritized accessible, non-hazardous land near major population centres to ensure easy and safe food access following a disaster. Inaccessible parcels were excluded using road network data and aerial imagery6, while hazard-prone areas, including fault lines, tsunami zones, and liquefaction zones, were also removed.
As discussed in Section 1.3, steep slopes and limited sunlight have been identified as challenges for UA in Wellington due to its mountainous terrain. To address this, slope and aspect analyses were performed using the 2019–2020 1-M digital elevation model (DEM) of Wellington Region to identify land suitable for cultivation. The resulting raster data were clipped with the parcel data for each urban zone to determine the basic potential area for each UA type.
Step 2: To enhance urban land-use efficiency and avoid small, narrow, or fragmented areas, a certain percentage was deducted from the basic potential area in each zone based on review of previous studies (Figure 3) [53,54,56,57,58]:
Step 3: A ratio of each potential productive land was deducted in each scenario to account for possible non-productive spaces (Figure 3).
Finally, to ensure the robustness and accuracy of the mapping process and results, validation was conducted by randomly selecting five parcels in each land subzone and analysing their aerial imagery for visual comparison. After mapping potential productive land using GIS 3.2, the study then estimated potential vegetable yields based on literature and survey data.
2.2. Estimating Vegetable Yields
Due to the lack of any available data on UA yields in Wellington City, the first author (Liu) conducted preliminary research across the existing allotments, communal gardens, and urban farms in the Wellington Region to compile first-hand local UA yield data. However, as most gardeners do not record their harvests, the collected data were insufficient to support this study, with only two participants providing yield information. Due to this limitation, potential food yields were estimated by synthesizing previously published UA studies that included first-hand vegetable yield data supplemented by the data collected by the first author (Table 1). Distinguishing between different UA types is crucial, as variations in farming techniques and labour intensity can influence yields [59]. Thus, the previous studies were categorized by UA types. Conventional farming yields are typically lower than UA yields and, thus, serve as a conservative benchmark [60]. To ensure the synthesized data accurately reflects local conditions, it was cross-validated with estimated conventional farming yields in NZ [61] and early preliminary fieldwork findings, which confirmed its alignment and suitability for this study.

Table 1.
Summary of yields based on literature review and field survey.
2.3. Estimating Post-Disaster Food Demands
Post-disaster demands were affected by two variables: per capita vegetable intake and the targeted population.
Most studies chose from two types of vegetable intake data: recommended intake and actual consumption [23,30,54,56,71,73,74,75,76,77]. This study utilized a recommended vegetable intake of 375 g/day/capita based on NZ government guidelines [78]. This is because actual consumption is often lower than true demand and fails to account for waste and spoilage during food processing [23,30,71,79].
The targeted population included three types of people: the entire population of Wellington City, the estimated displaced population, and vulnerable populations. Displaced population estimates were according to WENIRP projections for major earthquake scenarios7 [80]. Vulnerable populations include the elderly (over 65) and children (under 15), as they are more susceptible to food insecurity due to higher food quality requirements [19,81]. While pregnant and lactating women also have higher food quality needs [82], this study excludes them due to a lack of census data for this group.
2.4. Scenario Settings and Self-Sufficient Rates Calculation
Self-sufficient rate scenarios were developed as a matrix by combining variations in potential productive land, yields, and post-disaster food demands, as discussed in Section 2.1, Section 2.2 and Section 2.3.
For potential productive land, four land-use scenarios were developed based on the slopes and aspects selections in Figure 2.
- Scenario A: Land with slopes < 15% and W (West), NW (Northwest), N (North), NE (Northeast), E (East)-facing aspects.
- Scenario B: Land with slopes < 30% and W, NW, N, NE, E-facing aspects.
- Scenario C: Land with slopes < 15% across all aspects.
- Scenario D: Land with slopes < 30% across all aspects.
Among them, Scenario A represents the optimal and conservative land use conditions for UA, while Scenario D assumes a highly improbable scenario with minimal constraints. The four land scenarios address Research Question 1 and illustrate the varying possibilities for productive land in Wellington.
For yield scenarios, previous studies offered a range of yield data that were influenced by locations, soil types, climate, compost quality, irrigation systems, pest management, and the gardener’s motivation, etc. [56,64,69,75,83]. Thus, three yield scenarios were considered for each UA type, following the methodology of [55] (Table 2):
Table 2.
Estimating vegetable yield scenarios for Wellington City.
As for post-disaster food demand scenarios, they were categorized by the three targeted populations outlined in Section 2.3, which are summarized in Table 3.
Table 3.
Post-disaster food demand scenarios for Wellington City.
Based on the above four productive land patterns and three yield scenarios, a productivity matrix comprising 12 scenarios was developed. A 20% crop refuse rate was applied to the productivity estimates to account for losses during cooking and storage [84]. The 12 productivity scenarios were then combined with the three demand scenarios, resulting in a total of 36 self-sufficiency rate scenarios. This analysis addresses Research Question 2, evaluating Wellington’s capacity to produce food and sustain its population within the city boundary.
3. Results
3.1. Potential UA Land
The potential productive land is primarily concentrated in the eastern part of Wellington City, spanning various urban land types (Figure 4). This concentration is attributed to the area’s built-up land and higher population density. Although Wellington has substantial land in its western rural region, it is unsuitable for agricultural purposes due to its steep slopes. Additionally, considering post-disaster food security, this area is too distant from the population centre and would likely be inaccessible during emergencies. Potential land for private yards and communal gardens is evenly distributed in the eastern region, while potential land for urban farms is predominantly located in the northeast, where more future urban and rural land is available.
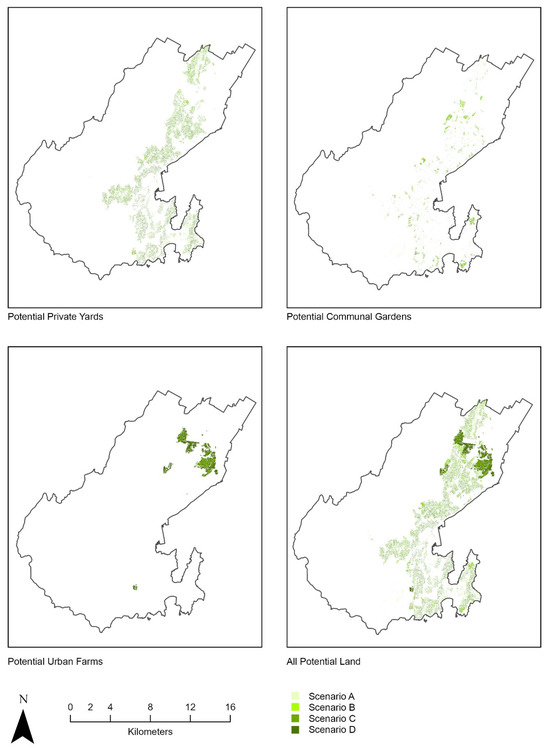
Figure 4.
Mapping of potential UA land in Wellington City: four scenarios were overlapped on the map (before applying ratios in Step 3 from Section 2.1).
In terms of land zone composition, the majority of potential UA land across the four potential land scenarios is located in residential zones, followed by open space and recreation zones and special purpose zones, with rural zones occupying significantly less land. This distribution is because rural zones have comparatively smaller land areas.
Under Scenario D—the highly improbable scenario, where all land with slopes under 30% was considered—the maximum potential productive area was estimated at 4,249,898 m2, comprising 34% private gardens, 42% communal gardens, and 24% urban farms. While Scenario D offers the greatest potential for productive land in Wellington, it may not be entirely realistic in the local context. Although slopes under 30% are considered cultivable, they are less ideal for agriculture compared to slopes under 15% [52,54,85]. Therefore, more feasible UA land options may align with Scenarios A and C, which focus on land with slopes under 15%. Scenario A, the optimal scenario for cultivation and the most conservative scenario in land selection criteria (land under 15% slope without south-facing aspects), identifies 867,803 m2 of potential land, with a composition of 42.5% private yards, 57% communal gardens, and 0.5% urban farms. Scenarios B (excluding south-facing aspects under 30% slopes) and C (including all aspects under 15% slopes) exhibit similar results, with 1,717,136 m2 and 1,958,733 m2, respectively.
3.2. Potential Vegetable Productivity and Post-Disaster Vegetable Self-Sufficient Rate
The 12 productivity scenarios are detailed in Table 4, with the 36 self-sufficient rate scenarios presented in Table 5. To meet the entire population’s vegetable needs, the lowest potential was 3% under the most conservative scenario, SA1, which incorporated minimal land and the lowest yields. This equates to meeting the vegetable demands of 6486 people. Under Scenario SA1, the self-sufficiency rates increased to 9% and 12% for displaced or vulnerable populations during disasters, respectively. In contrast, the highest self-sufficiency rate for the entire population was 75% under SD3, which included the most land and highest yields. Under Scenario C, which focused on all land with slopes under 15% (a more feasible option as discussed in Section 3.1), self-sufficiency in SC1 (lowest yields) for the entire population was 8%, approximately 2.5 times higher than in SA1. Notably, in SB3, SC3, SD2, and SD3, self-sufficiency exceeded 100% for either the displaced or vulnerable population, indicating that all vegetable needs for these groups could be met during disasters.
Table 4.
Productivity scenarios under different land use patterns (scenario A to D) and yields (yield 1–3).
Table 5.
Self-sufficient rates scenarios based on three types of targeted population.
4. Discussion
This study seeks to explore the potential of UA as an alternative food system in Wellington City to support post-disaster vegetable demands. Results demonstrate that Wellington City could provide anywhere from 3% at the minimum to 75% of the entire population’s vegetable demands based on different UA scenarios. During disasters, for the estimated displaced or vulnerable residents, UA could provide even higher self-sufficiency. The subsequent Section 4.1 and Section 4.2 compare these findings with previous studies and examine how they align with Wellington’s current UA capacity. Additionally, Section 4.3 and Section 4.4 discuss the significance of UA for the city’s post-disaster food security and its development prospects, which addresses Research Question 3.
4.1. Wellington City vs. Other Cities
Table 6 compares the current study with previous studies that calculated the potential future self-sufficiency rates for vegetables and/or fruits using soil-based UA. Due to differences in land use, UA types, population density, regional variations, and other factors, these rates are not directly comparable but could be viewed as approximate references. Most studies applied various scenarios based on different yields and land potential (e.g., land types and ratios of uncultivable spaces), resulting in a wide range of self-sufficiency rates. Some report exceptionally high rates, likely due to overly idealized assumptions, such as unrealistically high yields and improbable land selection. Additionally, including rooftop UA can significantly boost self-sufficiency due to its high yields and the extensive rooftop areas available in urban environments [53,55,56]. Notably, only two studies accounted for slopes and aspects [53,54].
Table 6.
Self-sufficient rates comparison.
To ensure accuracy, this study adopted a more conservative approach. First-hand yield data from published studies were cross-validated with preliminary local UA data collected by the author and NZ conventional farming data to avoid unrealistic estimates. Land selection considered zoning, uncultivable spaces, accessibility, hazards, and suitable slopes and aspects, ensuring legal compliance and contextual appropriateness for Wellington. Conservative ratios of uncultivable spaces were incorporated, recognizing that UA cannot replace all other land uses, particularly urban public spaces, which must serve multiple functions. Given that actual vegetable demand is always lower than the recommended intake, the study used recommended figures to adopt a more rigorous approach [54].
Following a more stringent data selection process, the results should be viewed as a reliable estimate, not reflecting the maximum potential for UA in Wellington. These findings fall within a consistent range compared to previous studies. Even under the most conservative Scenario SA1 (with minimal potential land and the lowest yields), 3% of the city’s vegetable demand could be met (Table 5). While this percentage may appear modest, it is comparable to findings from studies in Oakland and Berlin, where the most conservative scenarios yielded self-sufficient rates of 0.6% and 5%, respectively, based on similar land selection criteria [54,55]. For post-disaster vegetable needs, achieving self-sufficiency rates of 9% for the displaced population or 12% for vulnerable groups would significantly benefit the affected people in crisis. This finding aligns with a similar post-disaster study conducted in Nerima Ward (part of Tokyo prefecture), Japan, which reported a nutritional self-sufficiency rate of 11% for displaced populations [19]. Although the Tokyo study focused on current UA capacity for nutritional self-sufficiency—a more challenging metric than self-sufficiency by weight—Wellington’s results are in line with Tokyo’s findings.
In terms of potential productive land, potential land in Scenarios A and D accounts for 0.3% and 1.5% of Wellington’s total area, respectively, while Scenarios B and C each represent 0.6%. In comparison to previous studies, these figures are smaller than the corresponding percentages in Berlin (5% and 1.67%) and Tokyo (3.6%) [55,59]. However, given Wellington’s lower population density (746 people/km2) compared to Berlin (4418 people/km2) and Tokyo (6168 people/km2), it is suggested that Wellington may have a greater capacity to meet its population’s vegetable needs on a per-capita basis, even under the conservative Scenario A [31,32,55,59].
4.2. Potential UA vs. Current UA in Wellington City
The authors’ preliminary research found Wellington’s current vegetable self-sufficient rate for the entire population to be only 0.04%, highlighting its insufficiency in addressing the city’s post-disaster food security needs. This low rate was attributed to the limited land and UA types considered (only community gardens) due to a lack of data on other existing UA types. In contrast, this study estimated self-sufficient rates for the entire population ranging from 3% to 75%. The wide variation stems from differing scenarios of productive land availability and yield assumptions, suggesting that improved land use and growing conditions could enhance self-sufficiency. Even the lowest estimate—3%—far exceeds the current rate of 0.04%. Additionally, this study accounted for a broader spectrum of UA types, offering a more comprehensive assessment of UA’s potential.
If this study had followed the same scope as the preliminary research, considering only the potential of communal gardens8, the most conservative Scenario A1 would result in self-sufficient rates of 1.9% for the entire population, 6% for the displaced population, and 7.4% for the vulnerable population. These figures demonstrate that even within the scope of communal gardens alone, expanding land availability significantly improves Wellington’s vegetable self-sufficiency.
The preliminary research excluded private yards due to a lack of relevant data, whereas this study highlights their significant potential for self-sufficiency. Across the 12 productivity scenarios, the contribution of private yards ranged from 25.74% to 54.16%, demonstrating their potential to notably enhance self-sufficiency. Although the final calculation indicates that potential land for private yards accounts for a relatively smaller proportion than that for communal gardens, before applying the non-cultivable space ratios from Step 3 in Section 2.2, there is more land suitable for private yards than for communal gardens. The ratio of land utilized for UA varies depending on factors such as UA types and garden sizes [64]. This study applied the most conservative ratio for private yards, based on reviewed studies, allocating 20% for landscaping according to the City District Plan [51] and 90% of the land to common spaces [55,56,87,89]. This suggests that, in practice, a larger proportion of residential parcels could potentially be used as private yards, increasing the city’s UA capacity.
The preliminary research indicates that the current community gardens include one urban farm with higher productivity due to intensive labour input. However, this urban farm has limited land due to its location in a densely populated area. Most urban farms operate as commercial ventures and must prioritize profitability [90]. Even for non-profit urban farms, such as this existing example, ensuring their continued operation remains a key concern. This study has proposed potential land for urban farms in special purpose zones and rural zones, offering larger land opportunities while remaining close to surrounding communities.
4.3. The Significance of Urban Agriculture for Post-Disaster Wellington
Currently, Wellington’s disaster preparedness food policy encourages families to store seven days’ worth of food at the household level and promotes food sharing among families and local suppliers at the community level [91]. While food storage is an effective strategy for addressing short-term food insecurity after disasters, it has limitations, as discussed in Section 1.1. In a worst-case scenario, Wellington could face isolation lasting well beyond seven days, and external emergency food supplies might take longer to arrive [80]. Even when the distribution is restored, most emergency food is non-perishable and lower in nutrients, as their primary aim is to restore energy [92]. This suggests that food security is at great risk in the short, middle, and long term.
The self-sufficiency results from this study demonstrate that Wellington has the capacity to meet its population’s vegetable demands, particularly during disasters. In the short term, this capacity could provide the affected population with access to fresh vegetables. In the mid-to-long term, it could ensure balanced diets by offering essential nutrients [19]. Previous studies have emphasized the critical need for multi-nutrient diets during the mid-to-long term, as prolonged reliance on emergency food can lead to health issues, especially among vulnerable groups [19,93]. This study indicates that the self-sufficiency rate for the vulnerable population ranges from 12% to 298%. In four optimistic scenarios (SB3, SC3, SD2, SD3), the vegetable needs of all vulnerable individuals could be fully met, ensuring improved access to diverse and nutritious diets for the entire vulnerable population. Under more realistic conditions, such as Scenario A, 12% to 55% of the vulnerable population would have access to vegetables.
Access to fresh vegetables is not only about ensuring a diverse nutrient intake but also about providing a familiar and acceptable food source [94]. Providing inappropriate or unfamiliar food has been noticed to adversely affect disaster-affected population’s health [92]. Lessons from Japan highlight that emergency food should prioritize both quantity and quality, taking into account the specific needs of recipients [16]. Additionally, locally grown vegetables could serve as a stable food source for the affected population in the long term, who are more vulnerable to food instability due to fluctuations in food prices [92,95].
UA’s benefits go beyond food security; it provides emotional comfort and a sense of normalcy [96]. Evidence suggests that UA, particularly community gardens, plays a vital role in strengthening psychosocial resilience after disasters by encouraging community involvement and fostering emotional well-being [97]. A survey of community gardeners after the Canterbury earthquakes revealed that participants viewed their gardens as opportunities to relieve stress and regain a sense of routine after experiencing earthquakes [96]. Disasters can adversely affect food utilization among affected populations due to stress and trauma [14]. UA spaces offer ideal settings for supporting mental well-being [97], which, in turn, can improve food security by enhancing food utilization. In New York, community gardens played a significant role as multi-functional spaces post-Hurricane Sandy, providing restorative activities that helped individuals rediscover a sense of purpose [29].
The multifunctionality of UA gardens and farms extends beyond providing social and emotional support; they also offer space for various post-disaster needs. As open spaces are often perceived as safer than buildings, UA areas, like other urban public spaces such as playgrounds and parks, can offer shelter space during earthquakes [96,98]. Additionally, community gardens can provide essential emergency resources, such as water and electricity, during crises [96].
The significance of UA to post-disaster Wellington is undeniable; whether the city has recognized and utilized it will be examined in the following section.
4.4. The Potential of Developing UA for Post-Disaster Wellington
Though achieving 100% self-sufficiency through UA is neither practical nor the purpose of this study, the findings highlight the great possibility for Wellington to produce 3–75% of its vegetable supply within its boundary. This is particularly crucial to post-disaster food security, when food accessibility, availability, and affordability are highly disrupted. Beyond food provision, UA offers numerous additional benefits for post-disaster recovery. However, the feasibility of Wellington fully capitalizing on these advantages remains to be explored.
Wellington has long been committed to fostering sustainable food networks through initiatives such as providing land and funding for community gardens, offering sustainable agriculture workshops, and coordinating emergency food distribution during crises [38]. To build a more resilient city in response to inevitable seismic events and rising sea levels, WCC has proposed strategies, including scaling up UA development to ensure local food availability during crises [99]. Despite top-down efforts, Wellington’s UA growth has largely relied on bottom-up, community-driven enthusiasm, as noted in the authors’ preliminary research. This research revealed significant challenges, such as limited spaces and funding. Additionally, the research indicated that the relationships between community gardens and WCC are relatively informal and weak. While this informality allows greater freedom for community gardens, it also limits the support they receive from the council, making it a double-edged sword.
In maximizing the potential of existing UA spaces and adding new farmland, urban planning could play a key role [100]. In Wellington, although more land is needed, the city district plan remains too vague to effectively guide UA development [101]. A review of the district plan revealed that UA initiatives are only explicitly encouraged in a few zones, while the potential for UA in other areas remains unclear [51]. The current study selected land use based on zones identified in the current district plan allowing for UA. If more zones explicitly encourage UA activities, it will expand Wellington’s potential UA land and increase its capacity in a more resilient food system.
On the other hand, WCC has realized the importance of multi-functional community spaces and expressed support for actions on optimizing and redeveloping such spaces [99]. The post-disaster roles of such spaces to secure people’s basic needs, including food, water, and shelter, have been acknowledged, but more actions are needed to make it happen. As discussed in Section 4.3, UA gardens and farms are well-suited to fulfil these roles in Wellington. The idea of converting more urban spaces, especially community spaces, into UA areas and integrating them into disaster preparedness strategies has yet to be included in government policy discussions.
Japan serves as a model for leveraging the multifunctionality of UA by integrating UA policies with urban planning and disaster preparedness strategies. The Japanese government has amended and enacted a series of laws and acts to protect urban farmland from encroachment by urban expansion, creating a landscape of mixed rural and urban land use [102]. Based on this foundation, the government has implemented detailed regulations for the development of urban gardens and farms, enhancing their quality and attracting greater community participation [103]. In Tokyo, a key milestone in safeguarding UA land was the 1991 revision of the Productive Green Land Act, which introduced a 30-year tax incentive for designated productive farmland [104]. Furthermore, protecting and utilizing productive green land has been incorporated into the scope of the Tokyo government’s framework of greenery initiatives plan [105]. In Nerima ward, the local government established a dedicated UA department that supports UA initiatives and encourages UA engagement [19].
In Japan, UA is recognized not only as a source of fresh produce but also as a provider of agricultural experiences and green spaces during normal times and as open spaces that can serve critical disaster response functions during emergencies [106]. Based [107], disaster prevention cooperation farmlands could be designated through voluntary registration by urban farmers with local governments. This allows the use of their farmland for purposes such as evacuation spaces or temporary housing construction during disasters. The Nerima ward government conducts emergency drills involving local urban farms, offering residents an opportunity to get to know nearby UA spaces [19]. Familiarity with local UA gardens and farms is crucial, as highlighted in a study on the Canterbury earthquake [96]. This study found that, although affected individuals needed access to water and electricity, they were unaware that these resources could be accessed from their community gardens. This underscores the importance of including UA in disaster preparedness.
Although both NZ and Japan are disaster-prone countries, they have distinct national contexts. The stable and sustainable development of UA and the ability to leverage its benefits in post-disaster contexts requires policy support tailored to the specific national context [29,103]. This study demonstrates that Wellington has the potential to enhance food security during disasters through UA. However, the government must recognize the potential of UA and its additional benefits in post-disaster situations. What Wellington could learn from the above experience is the government intervention and policy formulation in encouraging UA development and including UA in urban planning and disaster management planning. Preliminary research by the authors revealed an idea proposed by a garden coordinator: developing a network of UA spaces within communities, integrating private yards and community gardens. Community gardens could serve as multifunctional spaces, providing technical support and material resources, such as seeds, to private yards during normal times. During disasters, this network could enhance food accessibility and availability. To further strengthen this UA network idea for disaster resilience, the distribution of community gardens could be aligned with community emergency hubs, which serve as key support centres after disasters. In such assumptions, community gardens could function as coordination centres, not only producing food but also facilitating the collection and distribution of locally available supplies to affected populations. Additionally, these spaces could serve as evacuation sites, offering shelter, water, and food for displaced individuals.
Based on this premise, integrating UA policy with urban planning and disaster preparedness will further promote UA development in Wellington, thereby enhancing post-disaster food security and maximizing complementary benefits.
4.5. Limitations
This study has several limitations.
Yield data were derived from global studies, which may lack accuracy without considering the specific local conditions in Wellington. Despite efforts by the first author to collect yield data from Wellington UA gardens, the sample size was too small to make this study robust. These data and NZ conventional farming data were used as references to validate the aggregated yield data from previous studies, which showed consistency with the reference data.
This study did not account for the specific needs of pregnant and lactating individuals, who are considered a vulnerable population, due to the lack of available data. Future research should address this gap, as understanding their requirements would be highly valuable.
Although slope classification was based on reasonable ranges from previous studies, this classification lacks sufficient precision due to the need to group categories. For instance, slopes of 16% and 29% were grouped into the same category despite the significant differences in agricultural cultivation.
Wellington is a city that strictly conserves urban reserves and open spaces to protect native species and habitats [108]. Although the ratio of uncultivable land was conservatively estimated based on previous studies, the result may not be sufficiently accurate. Additionally, current data on the recreational and leisure use of potential agricultural land is insufficient for precise calculations. Future research should address these limitations to enhance the accuracy of land use assessments.
Although this research has highlighted the potential of UA as a viable strategy for enhancing post-disaster food security in Wellington, its successful implementation necessitates further investigation. This includes a comprehensive analysis of the economic, social, and environmental dimensions in UA, as well as different detailed types of scenarios, including consideration of disaster types, seasonality, disruption duration, and infrastructure availability. Such an approach could form the basis for future research, contributing to the continued development and deeper understanding of this topic.
5. Conclusions
This study evaluated the potential role of UA to enhance post-disaster food security in Wellington City by calculating vegetable self-sufficiency rates based on estimates of food production and post-disaster demand scenarios. Food production was assessed using a GIS-based analysis of potential productive land scenarios and hypothetical vegetable yield scenarios. Post-disaster demand was evaluated using New Zealand’s recommended food intake guidelines and targeted population scenarios.
The results indicated that self-sufficiency rates for all Wellingtonians could range from 3% to 75%, depending on yield assumptions and land-use patterns. If the focus is narrowed to displaced or vulnerable populations—those most likely to experience food insecurity after a disaster—higher self-sufficiency rates could be achieved. The potential productive land accounts for 0.3% to 1.5% of the total Wellington area across different scenarios, with distribution primarily concentrated in the eastern part of the city.
Although preliminary research demonstrated that self-sufficiency is currently not possible, this study highlighted the potential for significant improvement through the expansion of UA land and diversification of UA types, thereby strengthening post-disaster food security. Beyond food production, UA offers additional benefits, such as social and emotional support, as well as providing evacuation spaces during emergencies.
While achieving self-sufficiency does not guarantee food security, it serves as an important cornerstone in evaluating a city’s capacity to meet its food needs. Wellington has the potential to meet its vegetable demands during disasters. However, this potential depends on effective planning and utilization. WCC has proposed developing resilient, multi-purpose open and community spaces for post-disaster use and creating a sustainable food system to ensure food availability during crises [99]. However, integrating these proposals into a single solution-developing UA has not yet been addressed in relevant documents. Drawing inspiration from international examples, Wellington could benefit from integrating UA policies with urban planning and disaster preparedness to fully harness UA’s role in post-disaster scenarios.
Author Contributions
Conceptualization, Y.L., V.C. and F.C.; Methodology, Y.L., V.C. and F.C.; Software, Y.L.; Validation, Y.L.; Formal analysis, Y.L.; Investigation, Y.L.; Resources, Y.L.; Data curation, Y.L.; Writing—original draft, Y.L.; Writing—review & editing, V.C. and F.C.; Supervision, V.C. and F.C. All authors have read and agreed to the published version of the manuscript.
Funding
The authors gratefully acknowledge the financial support provided by Te Kura Waihanga Wellington School of Architecture for this research. The lead author also thanks Te Hiranga Rū QuakeCoRE, a New Zealand Tertiary Education Commission-funded Centre, for providing travel funding that made this work possible.
Data Availability Statement
The original contributions presented in the study are included in the article, further inquiries can be directed to the corresponding author.
Conflicts of Interest
The authors declare no conflicts of interest.
Notes
| 1 | |
| 2 | |
| 3 | |
| 4 | Residential parcels include single-unit (S)—designed for one household, multi-unit (M)—accommodating two or more households, bach (B)—Holiday house, and vacant (V)—undeveloped residential parcels, located in residential zones and rural zones [47,48]. Among them, S, M, and B parcels are considered suitable for private yards, while V parcels are suitable for communal gardens. Although the sport and active recreation zone and the quarry zone are designated as farming-permitted areas, they were excluded from this analysis due to potential soil contamination risks [49,50]. |
| 5 | The aerial imagery for this study was LINZ 0.3-m orthophotography of the Wellington Region, captured in 2021. |
| 6 | To ensure accessibility in rural zones, where many parcels are distant from dense population areas, aerial imagery was used to identify and exclude those far from major population centres or separated by mountains. |
| 7 | It includes commenters, flat dwellers and visitors in the event of an earthquake occurring during working hours. |
| 8 | Although the current community gardens in Wellington include more than just communal gardens, they primarily consist of communal gardens; therefore, only communal gardens are used for calculation here. Since the current yield from communal gardens is similar to that of allotments but lower than urban farms, the results remain robust. |
References
- Huq, S.; Kovats, S.; Reid, H.; Satterthwaite, D. Editorial: Reducing risks to cities from disasters and climate change. Environ. Urban. 2007, 19, 3–15. [Google Scholar] [CrossRef]
- Atta-ur-Rahman; Parvin, G.A.; Shaw, R.; Surjan, A. Cities, Vulnerability, and Climate Change. In Urban Disasters and Resilience in Asia; Elsevier: Amsterdam, The Netherlands, 2016; pp. 35–47. ISBN 978-0-12-802169-9. [Google Scholar]
- Yasuhara, K.; Komine, H.; Murakami, S.; Chen, G.; Mitani, Y.; Duc, D.M. Effects of climate change on geo-disasters in coastal zones and their adaptation. Geotext. Geomembr. 2012, 30, 24–34. [Google Scholar] [CrossRef]
- Bohnhoff, M.; Martínez-Garzón, P.; Ben-Zion, Y. Global Warming Will Increase Earthquake Hazards through Rising Sea Levels and Cascading Effects. Seismol. Res. Lett. 2024, 95, 2571–2576. [Google Scholar] [CrossRef]
- NIWA. Intensity of Cyclones Projected to Increase. 2017. Available online: https://niwa.co.nz/news/intensity-of-cyclones-predicted-to-increase (accessed on 21 February 2025).
- NIWA. Wellington Regional Climate Change Extremes and Implications. Prepared for Greater Wellington Regional Council. 2019. Available online: https://niwa.co.nz/sites/default/files/GWRC%20NIWA%20climate%20extremes%20FINAL2.pdf (accessed on 21 February 2025).
- Ministry for the Environment. National Climate Change Risk Assessment for New Zealand. Main Report = Arotakenga Tūraru mō te Huringa Āhuarangi o Āotearoa. Pūrongo Whakatōpū; Ministry for the Environment: Wellington, New Zealand, 2020. Available online: https://environment.govt.nz/assets/Publications/Files/national-climate-change-risk-assessment-main-report.pdf (accessed on 21 February 2025).
- Dhar, T.K.; Khirfan, L. A multi-scale and multi-dimensional framework for enhancing the resilience of urban form to climate change. Urban Clim. 2017, 19, 72–91. [Google Scholar] [CrossRef]
- Manikas, I.; Ali, B.M.; Sundarakani, B. A systematic literature review of indicators measuring food security. Agric. Food Secur. 2023, 12, 10. [Google Scholar] [CrossRef]
- FAO. World Summit on Food Security. 2009. Available online: https://www.fao.org/fileadmin/templates/wsfs/Summit/Docs/Final_Declaration/WSFS09_Declaration.pdf (accessed on 17 February 2025).
- Peyravi, M.; Marzaleh, M.A.; Khorram-Manesh, A. Food Safety and Security. In Handbook of Disaster and Emergency Management, 2nd ed.; Kompendiet: Gothenburg, Sweden, 2021; pp. 20–29. ISBN 978-91-527-0705-0. [Google Scholar]
- Jones, E.C.; Ong, C.; Haynes, J. Disaster-Related Food Security and Past General Governance Strategies in a Worldwide Sample. Weather Clim. Soc. 2022, 14, 3–18. [Google Scholar] [CrossRef]
- Clay, L. Post-Disaster Food & Nutrition Security: The Disaster Food Security Framework (DFSF); University of Maryland Baltimore County: Catonsville, MA, USA, 2022. [Google Scholar]
- Han, S.; Keeni, M.; Fuyuki, K. The relationship between disaster resilience and household food security in a disaster-prone area in Kumamoto prefecture, Japan. Nat. Hazards 2024, 120, 10119–10140. [Google Scholar] [CrossRef]
- Minister for Emergency Management and Recovery. Report of the Government Inquiry into the Response to the North Island Severe Weather Events. 2024. Available online: https://www.dia.govt.nz/diawebsite.nsf/Files/Government-Inquiry-into-Severe-Weather-Events/$file/Report-of-the-Government-Inquiry-into-the-Response-to-the-North-Island-Severe-Weather-Events.pdf (accessed on 24 January 2024).
- Nakazawa, T.; Beppu, S. Mindset Change from Emergency Food to Disaster Preparation Food to Support Disaster Survivors. Sci. Technol. Trends 2012, 44, 36–54. [Google Scholar]
- Hiatt, E.; Belliard, C.; Lloyd Call, M.A.; Jefferies, L.K.; Kener, M.; Eggett, D.L.; Richards, R. Household Food and Water Emergency Preparedness Practices Across the United States. Disaster Med. Public Health Prep. 2022, 16, 1029–1037. [Google Scholar] [CrossRef]
- Clay, L.A.; Koyratty, N.; Rogus, S.; Colón-Ramos, U.; Hossan, A.; Josephson, A.; Neff, R.; Zack, R.M.; Bliss, S.; Niles, M.T. A Mixed-Methods Approach to the Development of a Disaster Food Security Framework. J. Acad. Nutr. Diet. 2023, 123, S46–S58. [Google Scholar] [CrossRef]
- Sioen, G.; Sekiyama, M.; Terada, T.; Yokohari, M. Post-Disaster Food and Nutrition from Urban Agriculture: A Self-Sufficiency Analysis of Nerima Ward, Tokyo. Int. J. Environ. Res. Public Health 2017, 14, 748. [Google Scholar] [CrossRef] [PubMed]
- Tudor, R.; Welch, C. Social Work, Disaster Policy, and Food Security. In The Routledge International Handbook of Social Work and Disaster Practice; Routledge: London, UK, 2024; pp. 504–515. [Google Scholar] [CrossRef]
- Specht, K.; Siebert, R.; Hartmann, I.; Freisinger, U.B.; Sawicka, M.; Werner, A.; Thomaier, S.; Henckel, D.; Walk, H.; Dierich, A. Urban agriculture of the future: An overview of sustainability aspects of food production in and on buildings. Agric. Hum. Values 2014, 31, 33–51. [Google Scholar] [CrossRef]
- FAO. Urban and Peri-Urban Agriculture Sourcebook–From Production to Food Systems; FAO: Rome, Italy, 2022. [Google Scholar] [CrossRef]
- Martellozzo, F.; Landry, J.-S.; Plouffe, D.; Seufert, V.; Rowhani, P.; Ramankutty, N. Urban agriculture: A global analysis of the space constraint to meet urban vegetable demand. Environ. Res. Lett. 2014, 9, 064025. [Google Scholar] [CrossRef]
- van Veenhuizen, R.; Danso, G. Profitability and Sustainability of Urban and Peri-Urban Agriculture; FAO: Rome, Italy, 2007. [Google Scholar]
- Schoen, V.; Blythe, C.; Caputo, S.; Fox-Kämper, R.; Specht, K.; Fargue-Lelièvre, A.; Cohen, N.; Poniży, L.; Fedeńczak, K. “We Have Been Part of the Response”: The Effects of COVID-19 on Community and Allotment Gardens in the Global North. Front. Sustain. Food Syst. 2021, 5, 732641. [Google Scholar] [CrossRef]
- FAO. Urban Food Systems and COVID-19: The Role of Cities and Local Governments in Responding to the Emergency. Rome 2020. [Google Scholar] [CrossRef]
- Yasmin, T.; Khattak, R.; Ngah, I. Facilitating Earthquake-Affected Rural Women Communities Toward Sustainable Livelihoods and Agriculture. Agroecol. Sustain. Food Syst. 2013, 37, 592–613. [Google Scholar] [CrossRef][Green Version]
- Wesener, A. Growing Resilient Cities Urban Community Gardens and Disaster Recovery after the 2010/11 Canterbury/Christchurch Earthquakes. In Urban Resilience in a Global Context; Transcript Verlag: Bielefeld, Germany, 2020; pp. 77–100. ISBN 978-3-8394-5018-5. [Google Scholar]
- Chan, J.; DuBois, B.; Tidball, K.G. Refuges of local resilience: Community gardens in post-Sandy New York City. Urban For. Urban Green. 2015, 14, 625–635. [Google Scholar] [CrossRef]
- Grewal, S.S.; Grewal, P.S. Can cities become self-reliant in food? Cities 2012, 29, 1–11. [Google Scholar] [CrossRef]
- Stats NZ. Subnational Population Estimates (TA, Subdivision), by Age and Sex, at 30 June 2018–2023 (2023 Boundaries). Available online: https://www.stats.govt.nz/information-releases/subnational-population-estimates-at-30-june-2023/ (accessed on 7 August 2024).
- Stat NZ. Geographic Boundary Viewer. Available online: https://statsnz.maps.arcgis.com/apps/webappviewer/index.html?id=6f49867abe464f86ac7526552fe19787 (accessed on 17 January 2025).
- Lee, Z. Post-Disaster Recovery Efforts in Japan and New Zealand: What worked well? What hasn’t? University of Otago: Dunedin, New Zealand, 2019. Available online: https://ourarchive.otago.ac.nz/bitstream/handle/10523/10200/LeeZheng2019MPlan.pdf?sequence=1&isAllowed=y (accessed on 2 February 2023).
- WREMO. Group Plan 2019–2024. Wellington Region Civil Defence Emergency Management Group. 2019. Available online: https://www.wremo.nz/assets/Library/Strategies-Plans/Group-Plan-2019-2024.pdf (accessed on 25 September 2024).
- Stat NZ. Urban Rural 2025. Available online: https://datafinder.stats.govt.nz/layer/120965-urban-rural-2025/ (accessed on 18 January 2025).
- AECOM NZL. Sustainable Food Opportunities for Wellington; Wellington City Council: Wellington, New Zealand, 2018. [Google Scholar]
- Mowll, R.; Becker, J.S.; Wotherspoon, L.; Stewart, C.; Johnston, D.; Neeley, D.; Rovins, J.; Ripley, S. Infrastructure planning emergency levels of service for the Wellington region, Aotearoa New Zealand—A preliminary framework. Int. J. Disaster Risk Reduct. 2022, 72, 102843. [Google Scholar] [CrossRef]
- WCC. Our City’s Food Future—Background Document; Wellington City Council: Wellington, New Zealand, 2023. [Google Scholar]
- Wellington Regional Growth Framework. Framework Report 2021. 2021. Available online: https://wrgf.co.nz/wp-content/uploads/2021/08/1320-Wellington-Regional-Growth-Framework-Report-JULY-2021-FINAL-LR.pdf (accessed on 18 January 2025).
- Duignan, K. Edible Wellington Snapshot; Wellington City Council: Wellington, New Zealand, 2011. [Google Scholar]
- WCC. Wellington’s Sustainable Food Initiative. Available online: https://wellington.govt.nz/climate-change-sustainability-environment/sustainable-living/sustainable-food-initiative (accessed on 25 September 2024).
- WCC. Our City’s Food Future. 2022. Available online: https://wellington.govt.nz/-/media/environment-and-sustainability/sustainability/files/sustainable-food/food-future-action-plan.pdf?la=en&hash=A3AE8EDDD1AB9733E4C83597662A02D3187D57DA (accessed on 22 January 2025).
- WCC. Five Foodie Gardens to Inspire. Our Wellington. Available online: https://wellington.govt.nz/news-and-events/news-and-information/our-wellington/2022/03/home-food-gardens-to-inspire (accessed on 1 April 2025).
- WCC. Bringing Joy and Inspiration with Our Garden Beds. Our Wellington. Available online: https://wellington.govt.nz/news-and-events/news-and-information/our-wellington/2021/10/garden-beds (accessed on 1 April 2025).
- Abdullah, M.J.; Zhang, Z.; Matsubae, K. Potential for Food Self-Sufficiency Improvements through Indoor and Vertical Farming in the Gulf Cooperation Council: Challenges and Opportunities from the Case of Kuwait. Sustainability 2021, 13, 12553. [Google Scholar] [CrossRef]
- Sanyé-Mengual, E.; Martinez-Blanco, J.; Finkbeiner, M.; Cerdà, M.; Camargo, M.; Ometto, A.R.; Velásquez, L.S.; Villada, G.; Niza, S.; Pina, A.; et al. Urban horticulture in retail parks: Environmental assessment of the potential implementation of rooftop greenhouses in European and South American cities. J. Clean. Prod. 2018, 172, 3081–3091. [Google Scholar] [CrossRef]
- WCC. Appendix 6 Residential Coastal Edge, WCC. 2009. Available online: https://wellington.govt.nz/-/media/your-council/plans-policies-and-bylaws/district-plan/volume02/files/v2residentialapp6.pdf?la=en&hash=4C0E4E1570DDBB788341C34AB71EA96223C30D64 (accessed on 29 March 2025).
- Code for Zoning_Rating Valuations Rules 2008. LINZ. Rating Valuations Rules, 2008. LINZS. 2010. Available online: https://www.linz.govt.nz/sites/default/files/30300-Rating%2520Valuations%2520Rules%25202008-%2520version%2520date%25201%2520October%25202010%2520-%2520LINZS30300_0.pdf (accessed on 12 January 2025).
- Meftaul, M.I.; Venkateswarlu, K.; Dharmarajan, R.; Annamalai, P.; Megharaj, M. Pesticides in the urban environment: A potential threat that knocks at the door. Sci. Total Environ. 2020, 711, 134612. [Google Scholar] [CrossRef] [PubMed]
- Xue, Y.G.; Teng, D.B.; Li, S.C.; Su, M.X. Study on Environmental-Geological Problem and Ecosystem Re-Establishment Countermeasures about Quarry and Damaged Mountain in Peri-Urban. In Proceedings of the 2010 4th International Conference on Bioinformatics and Biomedical Engineering, Chengdu, China, 18–20 June 2010; pp. 1–4. [Google Scholar] [CrossRef]
- WCC. Wellington City 2024 District Plan: Appeals Version. Available online: https://eplan.wellington.govt.nz/proposed/ (accessed on 18 September 2024).
- Lynn, I.H.; Manderson, A.; Page, M.; Harmsworth, G.; Eyles, G.; Douglas, G.; Mackay, A. Land Use Capability Survey Handbook: A New Zealand Handbook for the Classification of Land, 3rd ed.; AgResearch; Landcare Research New Zealand; Institute of Geological and Nuclear Sciences: Hamilton, New Zealand; Lincoln, New Zealand; Lower Hutt, New Zealand, 2009; ISBN 978-0-477-10091-5. [Google Scholar]
- Saha, M.; Eckelman, M.J. Growing fresh fruits and vegetables in an urban landscape: A geospatial assessment of ground level and rooftop urban agriculture potential in Boston, USA. Landsc. Urban Plan. 2017, 165, 130–141. [Google Scholar] [CrossRef]
- McClintock, N.; Cooper, J.; Khandeshi, S. Assessing the potential contribution of vacant land to urban vegetable production and consumption in Oakland, California. Landsc. Urban Plan. 2013, 111, 46–58. [Google Scholar] [CrossRef]
- De Simone, M.; Pradhan, P.; Kropp, J.P.; Rybski, D. A large share of Berlin’s vegetable consumption can be produced within the city. Sustain. Cities Soc. 2023, 91, 104362. [Google Scholar] [CrossRef]
- Lucertini, G.; Di Giustino, G. Urban and Peri-Urban Agriculture as a Tool for Food Security and Climate Change Mitigation and Adaptation: The Case of Mestre. Sustainability 2021, 13, 5999. [Google Scholar] [CrossRef]
- CoDyre, M.; Fraser, E.D.G.; Landman, K. How does your garden grow? An empirical evaluation of the costs and potential of urban gardening. Urban For. Urban Green. 2015, 14, 72–79. [Google Scholar] [CrossRef]
- WCC. Undertanding Wellington City’s District Plan. 2024. Available online: https://wellington.govt.nz/~/media/your-council/plans-policies-and-bylaws/district-plan/understanding-the-district-plan/files/understanding.pdf (accessed on 15 October 2024).
- Sioen, G.; Terada, T.; Sekiyama, M.; Yokohari, M. Resilience with Mixed Agricultural and Urban Land Uses in Tokyo, Japan. Sustainability 2018, 10, 435. [Google Scholar] [CrossRef]
- Hume, I.V.; Summers, D.M.; Cavagnaro, T.R. Self-sufficiency through urban agriculture: Nice idea or plausible reality? Sustain. Cities Soc. 2021, 68, 102770. [Google Scholar] [CrossRef]
- FAOSTAT. Crops and Livestock Products. Available online: https://www.fao.org/faostat/en/#data/QCL (accessed on 15 August 2024).
- Csortan, G.; Ward, J.; Roetman, P. Productivity, resource efficiency and financial savings: An investigation of the current capabilities and potential of South Australian home food gardens. PLoS ONE 2020, 15, e0230232. [Google Scholar] [CrossRef]
- Nicholls, E.; Ely, A.; Birkin, L.; Basu, P.; Goulson, D. The contribution of small-scale food production in urban areas to the sustainable development goals: A review and case study. Sustain. Sci. 2020, 15, 1585–1599. [Google Scholar] [CrossRef]
- Pourias, J.; Duchemin, E.; Aubry, C. Products from Urban Collective Gardens: Food for Thought or for Consumption? Insights from Paris and Montreal. JAFSCD 2015, 1–25. [Google Scholar] [CrossRef]
- Algert, S.J.; Baameur, A.; Renvall, M.J. Vegetable Output and Cost Savings of Community Gardens in San Jose, California. J. Acad. Nutr. Diet. 2014, 114, 1072–1076. [Google Scholar] [CrossRef] [PubMed]
- Conk, S.J.; Porter, C.M. Food Gardeners’ Productivity in Laramie, Wyoming: More Than a Hobby. Am. J. Public Health 2016, 106, 854–856. [Google Scholar] [CrossRef]
- Edmondson, J.L.; Childs, D.Z.; Dobson, M.C.; Gaston, K.J.; Warren, P.H.; Leake, J.R. Feeding a city—Leicester as a case study of the importance of allotments for horticultural production in the UK. Sci. Total Environ. 2019, 705, 135930. [Google Scholar] [CrossRef]
- Gittleman, M.; Jordan, K.; Brelsford, E. Using Citizen Science to Quantify Community Garden Crop Yields. CATE 2012, 5, 1–14. [Google Scholar] [CrossRef]
- Caputo, S.; Schoen, V.; Blythe, C. Productivity and Efficiency of Community Gardens: Case Studies from the UK. Land 2023, 12, 238. [Google Scholar] [CrossRef]
- Tahara, S.; Yokohari, M.; Kurita, H.; Terada, T. A quantitative assessment of agricultural production from allotment gardens. J. Jpn. Inst. Landsc. Archit. 2011, 74, 685–688. [Google Scholar]
- Hara, Y.; Murakami, A.; Tsuchiya, K.; Palijon, A.M.; Yokohari, M. A quantitative assessment of vegetable farming on vacant lots in an urban fringe area in Metro Manila: Can it sustain long-term local vegetable demand? Appl. Geogr. 2013, 41, 195–206. [Google Scholar] [CrossRef]
- Duchemin, E.; Wegmuller, F.; Legault, A.-M. Urban agriculture: Multi-dimensional tools for social development in poor neighbourhoods. Field Actions Sci. Rep. 2009, 1. Available online: http://journals.openedition.org/factsreports/113 (accessed on 4 April 2023).
- Amos, C.; Rahman, A.; Gathenya, J.; Friedler, E.; Karim, F.; Renzaho, A. Roof-Harvested Rainwater Use in Household Agriculture: Contributions to the Sustainable Development Goals. Water 2020, 12, 332. [Google Scholar] [CrossRef]
- Diekmann, L.O.; Gray, L.C.; Baker, G.A. Growing ‘good food’: Urban gardens, culturally acceptable produce and food security. Renew. Agric. Food Syst. 2018, 35, 169–181. [Google Scholar] [CrossRef]
- Glavan, M.; Schmutz, U.; Williams, S.; Corsi, S.; Monaco, F.; Kneafsey, M.; Guzman Rodriguez, P.A.; Čenič-Istenič, M.; Pintar, M. The economic performance of urban gardening in three European cities—Examples from Ljubljana, Milan and London. Urban For. Urban Green. 2018, 36, 100–122. [Google Scholar] [CrossRef]
- Gondhalekar, D.; Ramsauer, T. Nexus City: Operationalizing the urban Water-Energy-Food Nexus for climate change adaptation in Munich, Germany. Urban Clim. 2017, 19, 28–40. [Google Scholar] [CrossRef]
- Shao, Y.; Zhou, Z.; Chen, H.; Zhang, F.; Cui, Y.; Zhou, Z. The potential of urban family vertical farming: A pilot study of Shanghai. Sustain. Prod. Consum. 2022, 34, 586–599. [Google Scholar] [CrossRef]
- Ministry of Health. Eating and Activity Guidelines for New Zealand Adults; Updated 2020; Ministry of Health: Wellington, New Zealand, 2020; ISBN 978-1-990029-53-0. [Google Scholar]
- Hara, Y.; McPhearson, T.; Sampei, Y.; McGrath, B. Assessing urban agriculture potential: A comparative study of Osaka, Japan and New York city, United States. Sustain. Sci. 2018, 13, 937–952. [Google Scholar] [CrossRef]
- 80. Ministry of Civil Defence & Emergency. Wellington Earthquake National Initial Response Plan: Supporting Plan, version 2.0; December 2018; Ministry of Civil Defence & Emergency Management: Wellington, New Zealand, 2018; ISBN 978-0-478-43503-0. [Google Scholar]
- Slater, T.; Birchall, S.J. Growing resilient: The potential of urban agriculture for increasing food security and improving earthquake recovery. Cities 2022, 131, 103930. [Google Scholar] [CrossRef]
- NHMRC. Nutrient Reference Values for Australia and New Zealand; National Health and Medical Research Council: Canberra, Australia, 2006; ISBN 1-86496-243-7.
- Ackerman, K. The Potential for Urban Agriculture in New York City: Growing Capacity, Food Security, and Green Infrastructure. Urban Design Lab, The Earth Institute, Columbia University. 2011. Available online: http://urbandesignlab.columbia.edu/files/2015/04/4_urban_agriculture_nyc.pdf (accessed on 21 March 2024).
- Ghosh, S. Measuring sustainability performance of local food production in home gardens. Local Environ. 2014, 19, 33–55. [Google Scholar] [CrossRef]
- Harris, S.; McDowell, R.W.; Lilburne, L.; Laurenson, S.; Dowling, L.; Guo, J.; Pletnyakov, P.; Beare, M.; Palmer, D. Developing an indicator of productive potential to assess land use suitability in New Zealand. Environ. Sustain. Indic. 2021, 11, 100128. [Google Scholar] [CrossRef]
- Ghosh, S. Urban agriculture potential of home gardens in residential land uses: A case study of regional City of Dubbo, Australia. Land Use Policy 2021, 109, 105686. [Google Scholar] [CrossRef]
- Mcdougall, R.; Rader, R.; Kristiansen, P. Urban agriculture could provide 15% of food supply to Sydney, Australia, under expanded land use scenarios. Land Use Policy 2020, 94, 104554. [Google Scholar] [CrossRef]
- Grafius, D.R.; Edmondson, J.L.; Norton, B.A.; Clark, R.; Mears, M.; Leake, J.R.; Corstanje, R.; Harris, J.A.; Warren, P.H. Estimating food production in an urban landscape. Sci. Rep. 2020, 10, 5141. [Google Scholar] [CrossRef] [PubMed]
- Haberman, D.; Gillies, L.; Canter, A.; Rinner, V.; Pancrazi, L.; Martellozzo, F. The Potential of Urban Agriculture in Montréal: A Quantitative Assessment. IJGI 2014, 3, 1101–1117. [Google Scholar] [CrossRef]
- Monzini, J.; Orsini, F. Understanding Commercial Urban Agriculture—An Overview; FAO: Rome, Italy, 2025. [Google Scholar] [CrossRef]
- WREMO. WREMO—What We Do? Available online: https://wremo.nz/ (accessed on 21 June 2023).
- Tsuboyama-Kasaoka, N.; Purba, M.B. Nutrition and Earthquakes: Experience and Recommendations. Asia Pac. J. Clin. Nutr. 2014, 23, 505–513. [Google Scholar] [CrossRef]
- UNHCR; UNICEF; WFP; WHO. Food and Nutrition Needs in Emergencies. 2002. Available online: https://www.who.int/publications/i/item/food-and-nutrition-needs-in-emergencies (accessed on 6 October 2024).
- Bradford, A.A.; Hoekstra, F.; van Veenhuizen, R. Linking Relief, Rehabilitation and Development: A role for urban agriculture? Urban Agric. Mag. 2009, 21, 8. [Google Scholar]
- FAO. Food, Agriculture and Cities Challenges of Food and Nutrition Security, Agriculture and Ecosystem Management in an Urbanizing World. 2011. Available online: http://www.fao.org/fileadmin/templates/FCIT/PDF/FoodAgriCities_Oct2011.pdf (accessed on 6 January 2023).
- Shimpo, N.; Wesener, A.; McWilliam, W. How community gardens may contribute to community resilience following an earthquake. Urban For. Urban Green. 2019, 38, 124–132. [Google Scholar] [CrossRef]
- Okvat, H.A.; Zautra, A.J. Sowing Seeds of Resilience: Community Gardening in a Post-Disaster Context. In Greening in the Red Zone; Springer: Dordrecht, Netherlands, 2014; Available online: http://link.springer.com/10.1007/978-90-481-9947-1 (accessed on 11 May 2023).
- Wesener, A. Crisis and Green Urban Development: Urban Agriculture and Post-Earthquake Urban Resilience in Christchurch, New Zealand. Presented at the REAL CORP 2023. Ljubljana, Slovenia, 18–20 September 2023. [Google Scholar]
- WCC. Wellington Resilience Strategy. 2017. Available online: https://wellington.govt.nz/your-council/plans-policies-and-bylaws/policies/wellington-resilience-strategy (accessed on 8 February 2024).
- Yokohari, M.; Bolthouse, J. Planning for the slow lane: The need to restore working greenspaces in maturing contexts. Landsc. Urban Plan. 2011, 100, 421–424. [Google Scholar] [CrossRef]
- Hanna, C.; Wallace, P. Planning the urban foodscape: Policy and regulation of urban agriculture in Aotearoa New Zealand. Kōtuitui N. Z. J. Soc. Sci. Online 2022, 17, 313–335. [Google Scholar] [CrossRef]
- Hino, K.; Yamazaki, T.; Iida, A.; Harada, K.; Yokohari, M. Productive urban landscapes contribute to physical activity promotion among Tokyo residents. Landsc. Urban Plan. 2023, 230, 104634. [Google Scholar] [CrossRef]
- Su, C.; Li, S.; Dai, F. Spatial Distribution Pattern and Development Characteristics of Citizen Farm from the Perspective of Metropolitan Area: A Case Study of the Tokyo Metropolitan Area in Japan. Landsc. Archit. 2023, 30, 96–104. [Google Scholar] [CrossRef]
- Satake, A. Urban Farming Trends in Japan Present Limited Opportunities and Challenges for US Agriculture; USDA Foreign Agricultural Service: Washington, DC, USA, 2021.
- Tokyo Metropolitan Government. Tokyo Metropolitan Government Greenery Initiative; Tokyo Metropolitan Government: Tokyo, Japan, 2023.
- MAFF. About Promoting Urban Agriculture and Community Farms. Available online: https://www.maff.go.jp/j/nousin/kouryu/tosi_nougyo/index.html (accessed on 24 January 2025).
- MAFF. About Situation of Urban Agriculture. 2024. Available online: https://www.maff.go.jp/j/nousin/kouryu/tosi_nougyo/t_kuwashiku.html (accessed on 25 January 2025).
- WCC.Suburban Reserves Management Plan. 2015. Available online: https://wellington.govt.nz/your-council/plans-policies-and-bylaws/policies/suburban-reserves-management-plan?utm_source=chatgpt.com (accessed on 26 January 2025).
Disclaimer/Publisher’s Note: The statements, opinions and data contained in all publications are solely those of the individual author(s) and contributor(s) and not of MDPI and/or the editor(s). MDPI and/or the editor(s) disclaim responsibility for any injury to people or property resulting from any ideas, methods, instructions or products referred to in the content. |
© 2025 by the authors. Licensee MDPI, Basel, Switzerland. This article is an open access article distributed under the terms and conditions of the Creative Commons Attribution (CC BY) license (https://creativecommons.org/licenses/by/4.0/).