Article

Optimizing Ecological Management in China: Insights from Chongqing’s Service Projections

1
State Environmental Protection Key Laboratory of Environmental Planning and Policy Simulation, Chinese Academy of Environmental Planning, Beijing 100041, China
2
Center for Rural Environmental Protection, Chinese Academy of Environmental Planning, Beijing 100041, China
3
The Center for Eco-Environmental Accounting, Chinese Academy of Environmental Planning, Beijing 100041, China
4
The Innovation Center for Eco-Environment-Oriented Development, Chinese Academy of Environmental Planning, Beijing 100041, China
5
Chongqing Institute of Eco-Environmental Science, Chongqing 401147, China
*
Authors to whom correspondence should be addressed.
Land 2025, 14(4), 788; https://doi.org/10.3390/land14040788
Submission received: 10 March 2025 / Revised: 31 March 2025 / Accepted: 4 April 2025 / Published: 6 April 2025

Abstract

:
The assessment of ecosystem service (ES) supply–demand relationships is critical for addressing regional sustainable development challenges, yet systematic studies integrating spatial drivers analysis and multiscenario forecasting in rapidly urbanizing mountainous regions remain scarce. This study focuses on Chongqing as a representative case to investigate spatial patterns, driving mechanisms, and future trajectories of ES supply–demand dynamics. Through spatial quantification of four key ES (food provision, water retention, soil conservation, carbon fixation) and statistical analysis of socioeconomic datasets from 2010 to 2020, geographical weighted regression modeling was employed to identify spatially heterogeneous drivers. Long-term projections (2030–2060) were developed using climate–economy integrated scenarios reflecting different global development pathways. The results demonstrate three principal findings: First, while regional ecosystem quality maintains stable with an improved supply–demand ratio (0.260 to 0.320), persistent deficits in carbon fixation capacity require urgent attention. Second, spatial mismatches exhibit intensifying polarization, with expanding deficit zones concentrated in metropolitan cores and their periurban peripheries. Third, thermal-hydrological factors (aridity index, temperature) coupled with land intensification pressures emerge as dominant constraints on ES supply capacity. Scenario projections suggest coordinated climate mitigation and sustainable development strategies could maintain the supply–demand ratio at 0.189 by 2060, outperforming conventional development pathways by 23.5–41.2%. These findings provide spatial decision support frameworks for balancing ecological security and economic growth in mountainous megacities, with methodological implications for cross-scale ES governance in developing regions.

1. Introduction

Ecosystem services (ES), which form a crucial link between ecosystems and socioeconomic systems, are defined as the ecological benefits provided by natural ecosystems to humans [1,2]. The conceptualization of ecosystem services originated with Ehrlich’s seminal work [3], subsequently evolving into multiple classification frameworks. Prominent systems include: The Economics of Ecosystems and Biodiversity (TEEB) paradigm [4]; the International Classification of Ecosystem Services (CICES) developed by the European Environment Agency [5]; the Final Ecosystem Goods and Services (FEGS) framework spearheaded by the US Environmental Protection Agency [6]; and Australia’s National Ecosystem Services Assessment Framework [7]. These standardized approaches reflect regional priorities in ecosystem service valuation and governance. In recent years, China has faced significant environmental degradation driven by rapid development and urban expansion [8,9,10]. The growth of socioeconomic systems has increased the demand for ES, creating a notable imbalance between the supply and demand of these services, particularly in rapidly urbanizing areas [11,12]. This issue is especially pronounced in and around major cities [13]. Such challenges hinder sustainable regional development both directly and indirectly. Identifying key areas with high supply and demand, as well as understanding their interactions, is essential for addressing the challenges of urbanization, mitigating human–land conflicts, and fostering regional sustainability.
Research on the mismatch between ES supply and demand encompasses two primary aspects. The first aspect involves calculating ES supply and demand and analyzing their spatial–temporal patterns. Various methods are employed for these calculations, falling into three broad categories. The most common approach utilizes biophysical models, which select appropriate models based on the principles underlying different ES processes, such as the revised universal soil loss equation (RUSLE), the Riparian water quality model (RWEQ), and the water balance equations [14,15]. Additionally, integrated models like the Integrated Valuation of Ecosystem Services and Tradeoffs (InVEST) and Artificial Intelligence for Environment & Sustainability (ARIES) are also widely used [16]. The second category of methods is expert scoring, which primarily employs an ES scoring matrix to assess the supply and demand of ES across various land use types [17]. The third category involves calculating ES values using equivalence factor tables and adjusting them based on actual conditions [18]. Regarding the research scale, there is an expanding body of literature focusing on the spatial and temporal evolution of the balance between ES supply and demand, encompassing national scale [19,20,21], regional scale [22,23], watershed scale [24,25], city scale [26,27,28], and country scale [29]. The second aspect revolves around the application of ES supply–demand analysis. This area includes the analysis of ES surplus–deficit [30], ecosystem health diagnosis [31], reconstruction of ecological security patterns [32], spatial zoning for land regulation [33], and identification of critical areas with significant ecological value [34]. These applications demonstrate the diverse uses of ES supply–demand analysis in informing decision-making processes and guiding ES management strategies.
Understanding the driving mechanisms behind the supply–demand relationship for ES is essential for the effective management and conservation of regional ecosystems. The interplay of various driving factors significantly shapes regional supply–demand dynamics, with multiple factors typically working together to support the balance of ES. These relationships often exhibit nonlinear characteristics [22,35,36]. Most current studies primarily employ global regression models, such as Factor Geodetector and stepwise regression [37,38,39], the random forest algorithm [40], and principal component analysis [41,42], to quantify the impact of different factors. However, these approaches often overlook the significant spatial heterogeneity among various factors. In reality, the influence of driving factors on outcomes varies markedly across different regions. Thus, considering only the global effects of different factors while neglecting spatial heterogeneity is insufficient. Therefore, quantitatively assessing the spatial heterogeneity effects of climate change and human activities on the balance of ES supply and demand is crucial for developing region-specific protection policies.
Predicting the future ability of ES supply and demand is essential [43,44,45]. The future ability of ES mainly reflects the ability of the ecosystem to maintain the supply and demand of ES under pressures such as climate change, economic transformation, and population growth. This is indeed an important aspect for evaluating the resilience of the ecosystem. Moreover, the supply and demand for ES are closely linked to socioeconomic development modes [46]. Therefore, quantitatively simulating scenarios of changes in ES supply and demand under the dual influences of climate change and human activities will aid in optimizing and balancing economic development with ecological conservation. While many scholars have studied the impacts of various climate change and land use change scenarios on ecosystems, these studies often focus on either the supply side [47,48,49] or the demand side [50,51]. Comprehensive research on ES supply and demand under scenarios that integrate climate change with socioeconomic changes remains underdeveloped.
This investigation systematically addresses three pivotal research questions: (1) What spatial–temporal evolutionary mechanisms govern ecosystem service (ES) supply–demand dynamics in the study area? (2) How can multidimensional impact pathways of natural endowments, socioeconomic development, and spatial heterogeneity on ES supply–demand relationships be quantitatively characterized? (3) What strategic approaches enable synergistic optimization of economic–ecological systems in regional development planning? Chongqing—China’s sole directly administered city in western regions—was selected as the representative case study. Methodologically, a four-dimensional ES evaluation framework was developed integrating key ecosystem service typologies. Spatiotemporal patterns of ES supply–demand dynamics were quantitatively analyzed through triennial assessments (2010, 2015, 2020), complemented by grid-scale mismatch diagnostics. Spatial heterogeneity in natural–anthropogenic drivers was decoupled using geographically weighted regression (GWR) modeling. Scenario-based projections (2030, 2060) were generated through integrated socioeconomic–climate modeling frameworks to evaluate the future ability of ES. These methodological advances establish critical foundations for developing regional ecological security patterns in transitional landscapes.

2. Methodology and Data Sources
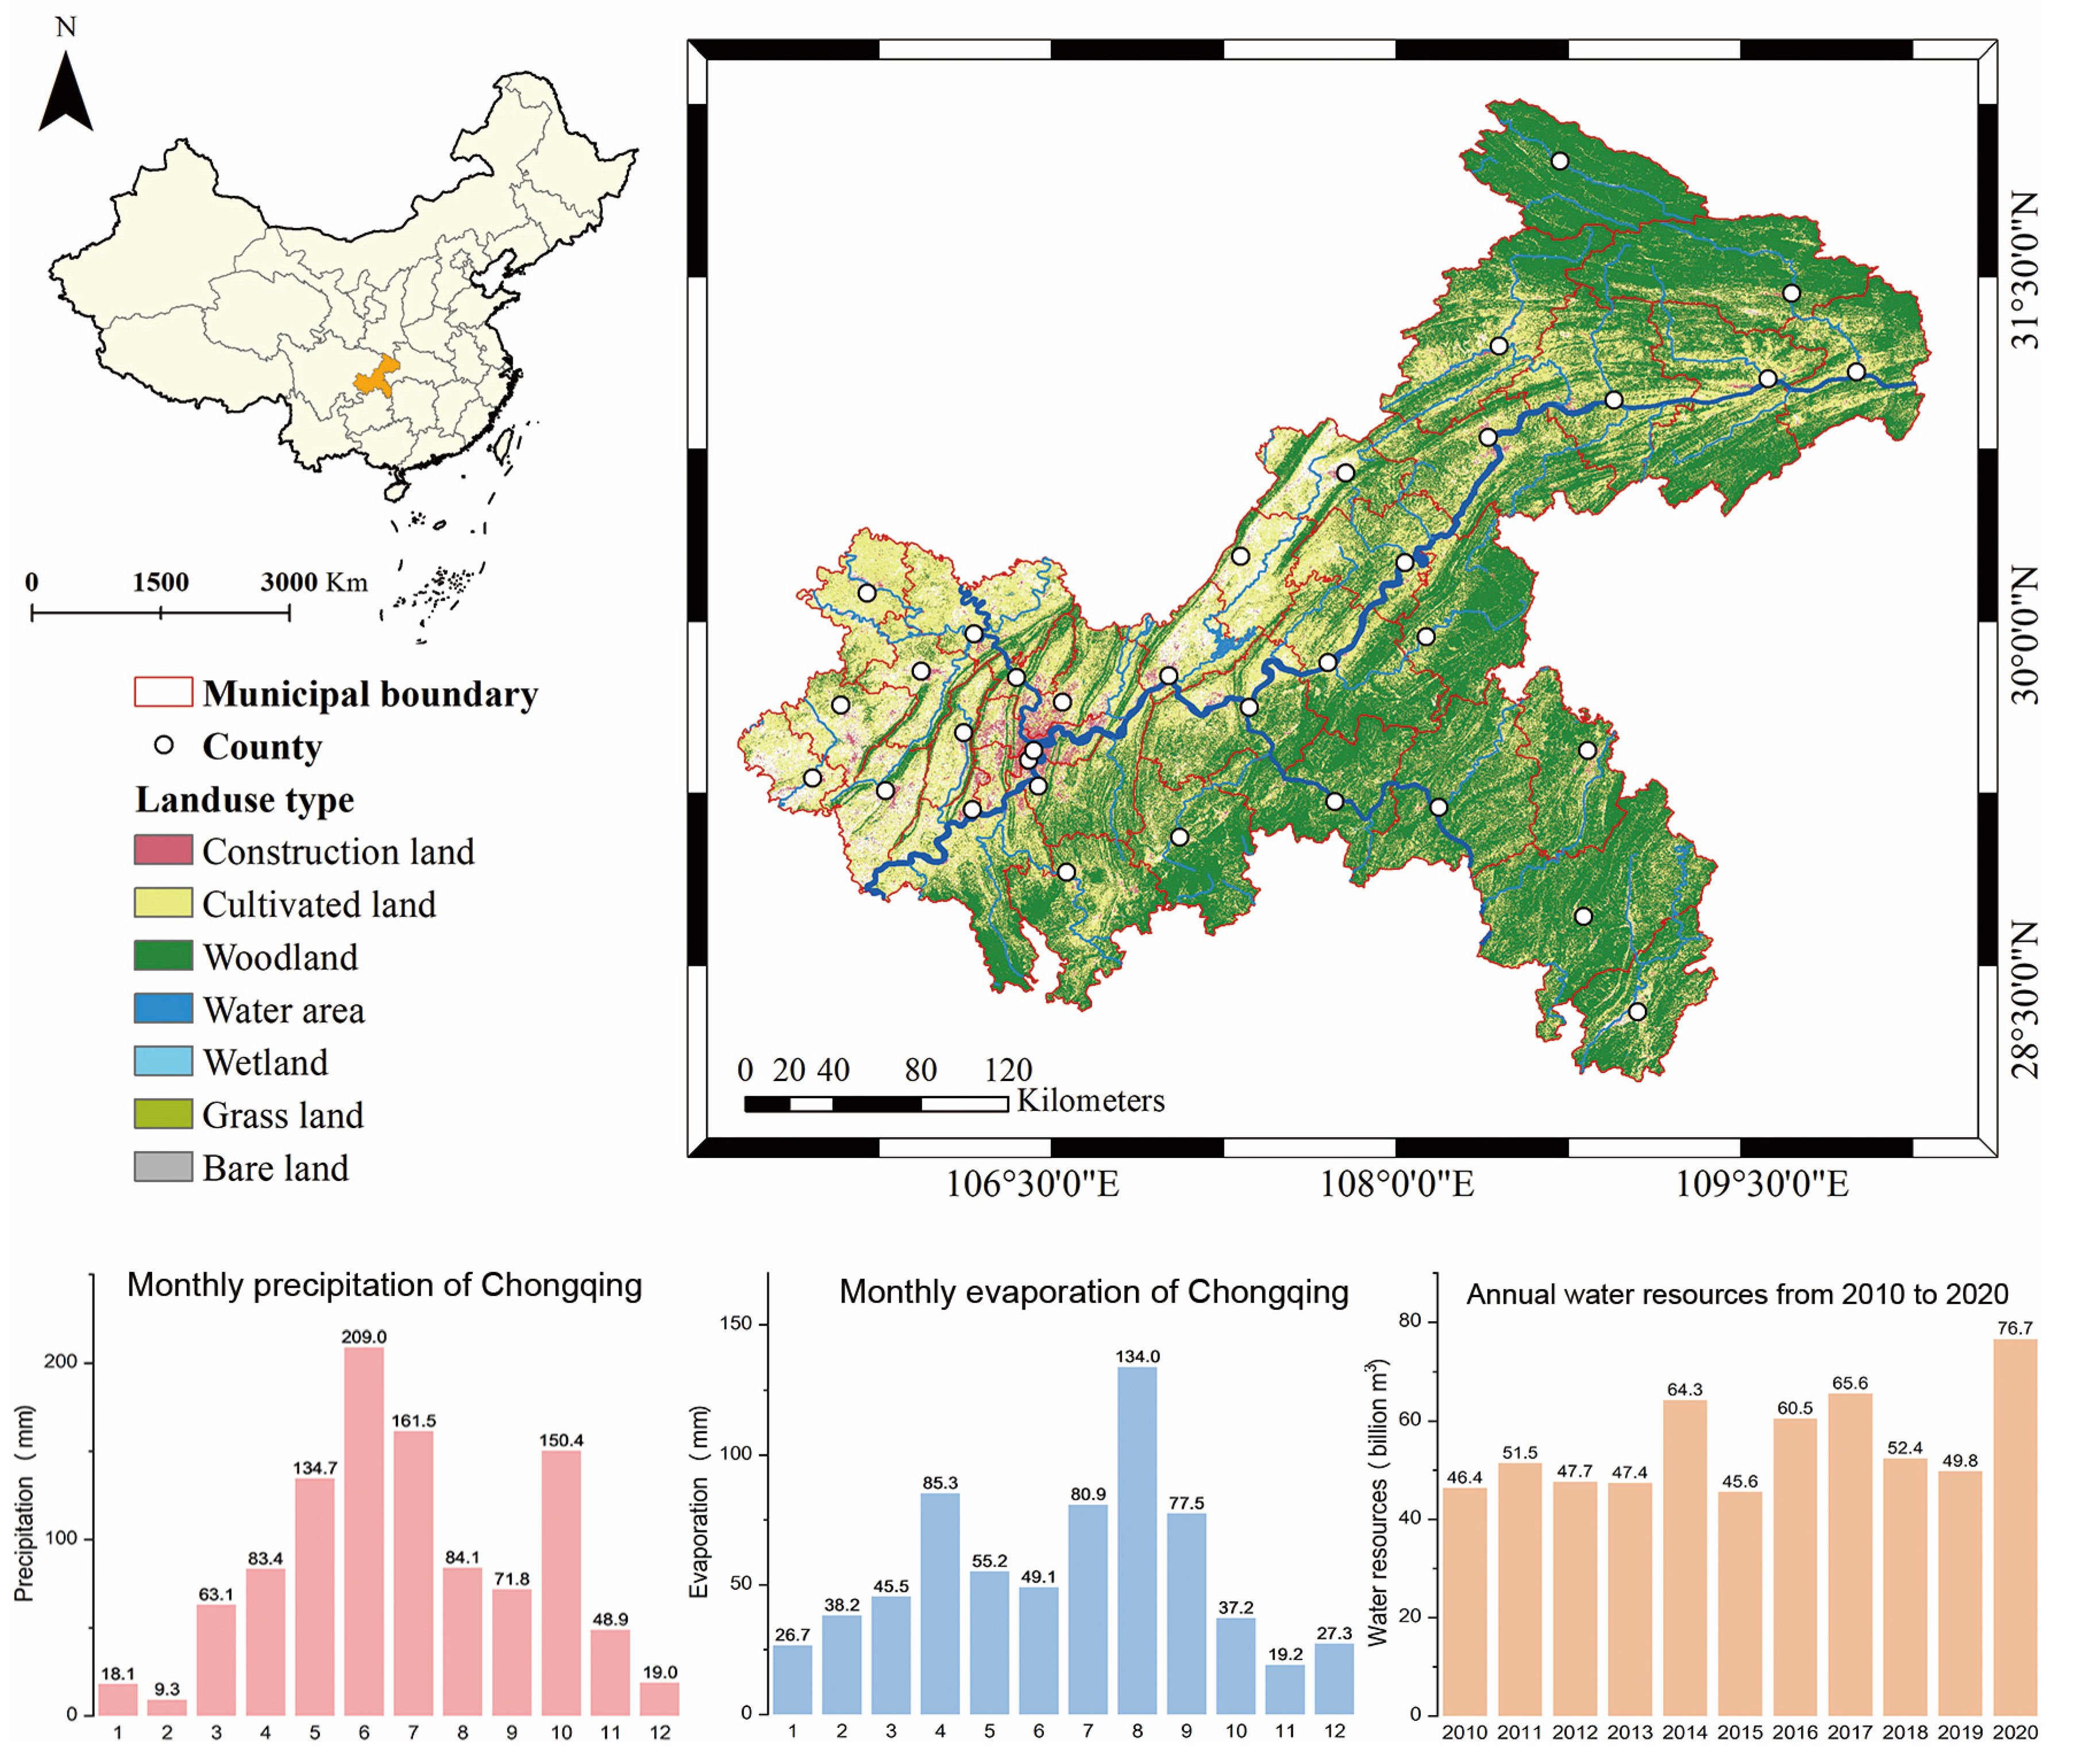
2.1. Study Area

Chongqing, located in the southwest region of China, spans a vast area of 82,400 km2. Nestled within the transitional terrain zone between the second and third steps of China’s topography, Chongqing is characterized as a typical mountainous city, primarily composed of mountains and hills. This metropolitan area is characterized by a subtropical monsoon humid climate, with mean annual precipitation ranging 1000–1450 mm concentrated in May–September (accounting for 70% of total annual volume). Hydrologically, the long-term annual average water surface evaporation exhibits an increasing gradient from western to northeastern sectors (500–1000 mm). The territory’s dense river network, comprising confluences of the Yangtze River, Jialing River, and Wu River, sustains mean annual surface water resources of 55.4 billion m3, equivalent to 672 mm runoff depth. Ecological surveys document 84 nationally protected wild plant species within predominantly subtropical evergreen broad-leaved forests, with the forest coverage rate reaching 55% in 2024. Dominant land use patterns comprise cultivated land (western concentration), forestland (northeastern/southeastern clusters), and grassland, while urban–rural construction land clusters around metropolitan cores and county-level administrative centers.
These resources fulfill a variety of roles, particularly in biodiversity protection, as well as water and soil conservation. The abundant ecological resources of Chongqing contribute significantly to the overall ecological health and balance of the region (see Figure 1).

2.2. Data Source

The data used in this study mainly include geospatial data and socioeconomic data, such as boundary data, elevation data, meteorological data, land use data, soil property data, and statistical data. For the resolution and specific source of each data item, please see Table S1 in the SI for details. Due to the variance in spatial resolution between data, the bilinear interpolation method was adopted in this study to standardize them to 100 m.

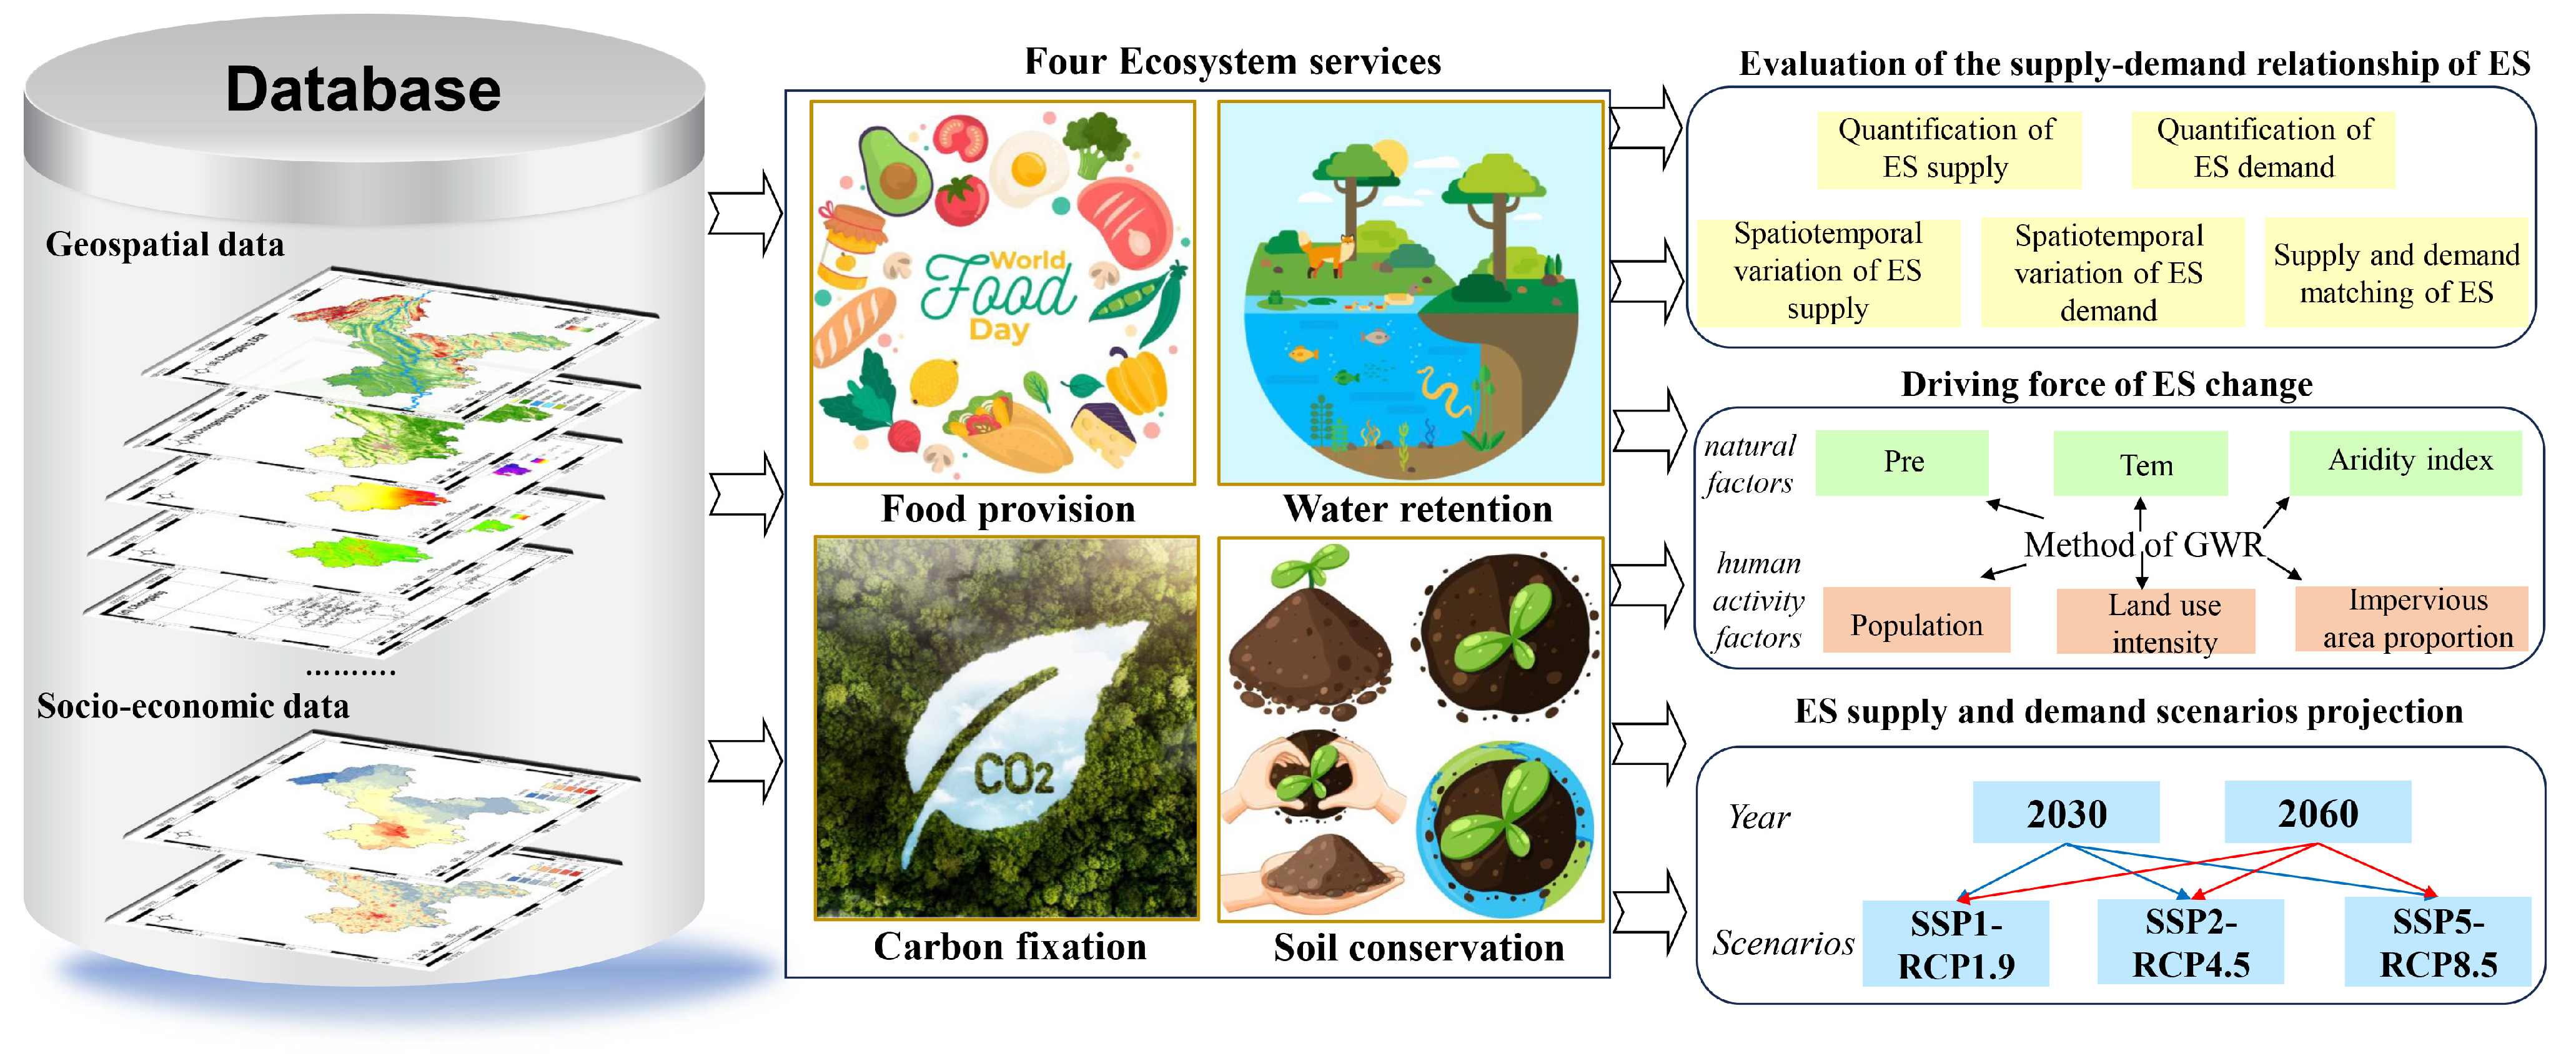
2.3. Research Framework

The research framework is illustrated in Figure 2, outlining the pivotal procedures executed to achieve the research objectives. Firstly, a comprehensive database was established, encompassing geospatial and socioeconomic data for the years 2010, 2015, and 2020. The database, summarized in Table S1, facilitated the amalgamation and scrutiny of relevant information. Secondly, four essential ES—food provision, water retention, carbon fixation, and soil conservation—were selected for evaluation. The supply and demand of these ES were quantitatively assessed to determine their respective breakeven points within the Chongqing region. The supply–demand ratio was utilized as a metric to gauge the balance between ES supply and demand. To explore the influencing mechanisms of ES supply and demand, six factors closely associated with natural and human activities were identified. The geographically weighted regression (GWR) model was employed to analyze the spatially varying impacts of each factor on ES supply and demand in Chongqing. Moreover, to forecast future trends in ES supply and demand, the shared socioeconomic pathways (SSP) and representative concentration pathways (RCP) scenario matrix was used. This enabled predictions for ES supply and demand in 2030 and 2060 under various scenarios, providing valuable insights for future planning and decision-making processes. Ultimately, based on the findings and analysis, recommendations and strategies for effective ecosystem management and sustainable development in Chongqing were devised. These insights are intended to guide decision-makers in promoting the city’s future development while ensuring the preservation and optimal utilization of its ecological resources.

2.4. Assessing ES Supply and Demand

Previous studies have predominantly evaluated ecosystem services (ES) from the supply side, often neglecting the equally crucial demand side, leading to potentially incomplete assessments [52]. For instance, in regions abundant in ES, rapid population growth can result in an ES deficit, jeopardizing regional ecological security [53,54]. Drawing on previous research findings and considering the ecosystem types and regional characteristics of Chongqing, this study selected four ES types(food provision, water retention, carbon fixation, and soil conservation) closely intertwined with human well-being to assess the relationship between ES supply and demand. The prioritization of these ecosystem services stems from Chongqing’s distinct urbanization–ecology nexus. As a megacity undergoing rapid urbanization with over 30 million residents, ensuring food provision security constitutes a fundamental prerequisite for sustainable development. The selection of water retention and carbon fixation reflects Chongqing’s dual ecological roles: serving as the upper Yangtze River’s ecological security barrier and the strategic hinterland of the Three Gorges Reservoir, where hydrological regulation capacities are mission-critical. Furthermore, the significant forest coverage underpins its exceptional carbon sequestration potential, positioning these ES as vital mechanisms for advancing regional carbon neutrality targets, particularly given the escalating climate mitigation imperatives.
(1) Food provision
Food provision was the basic supply service of ES and played an important role in human survival and development. This paper combines the total food production with NDVI data to calculate the supply of food production services on the grid scale. Food production here is characterized by the edible part of various foods.
S f p = j = 1 n ( M j × E P j × A j ) × N D V I i N D V I s u m
where Sfp represents the supply of food provision(kcal), j is the food type, Mj is the output of the jth food, EPj is the proportion of the edible part of the jth food (%), and Aj is the caloric content of the edible part per 100 g of the jth food (kcal/100 g), NDVIi is the normalized difference vegetation index on grid i, and NDVIsum is the comprehensive normalized difference vegetation index of the study area, and n denotes discrete food categories (n = 1, 2, …, 12), encompassing rice, corn, beans, tubers, oil-bearing crops, sugar crops, vegetables, fruits, aquatic products, meat, dairy, and poultry eggs, respectively.
Food production demand was characterized by the product of per capita food consumption and population density.
D f p = i = 1 m j = 1 n ( d j × E P j × A j ) × P i
where Dfp represents the demand of food provision(kcal), dj is the per capita consumption of the jth food, Pi is the population of the ith county, and n represents food types while m serves as integer index for Chongqing’s administrative units (m = 1, 2, …, 38), ensuring comprehensive coverage of municipal districts.
(2) Water retention
Water retention plays a crucial role in ensuring water supply for human industrial and agricultural production and daily life. This study calculated the water retention supply using the water balance equation. The water retention demand was derived from water consumption data for each county obtained from the Chongqing Water Resources Bulletin for the years 2010, 2015, and 2020.
(3) Carbon fixation
The carbon fixation supply is calculated in the same way as the model function in GEP accounting (Section S1 in Supplementary Materials). For the carbon fixation demand, the carbon emission inventory data of Chongqing counties in CEADs were used in this paper. Since the latest data of the database had been updated to 2017, the data of 2020 are temporarily replaced by that of 2017.
(4) Soil conservation
The calculation method of soil conservation supply is the same as that of this function in GEP accounting (Section S1 in Supplementary Materials), which is calculated by using the RUSLE equation. In this paper, the difference between soil erosion and allowable soil loss is used as soil conservation demand [55]
D s c = P S E i A i × A S E I
where the Dsc represents the demand for soil conservation and PSE stands for potential soil erosion of counties in Chongqing. ASEI, which stands for allowable soil erosion intensity as per the Chinese Standards for Classification and Gradation of Soil Erosion, is set at 500 t/km2. Ai represents the area of counties in Chongqing.
(5) ES supply and demand equilibrium relationship
In this study, the ratio of supply to demand of ES was used to describe the supply and demand status of different ES as well as integrated in Chongqing.
E S D R i = S i D i S i + D i C E S D i = 1 m n = 1 m E S D R n
where ESDRi is the ratio of supply to demand of ES at a spatial scale with a value range of (−1, 1), ESDRi < 0 means ES supply is less than demand, which indicates that the self-sustainability of the ecosystem is weak, ESDRi > 0 means supply is greater than demand, which indicates that the self-sustainability of the ecosystem is strong; Si and Di are ES supply and demand at that scale; CESDi is the combined ES supply and demand ratio; m is the number of ES categories, in this paper m = 4.

2.5. Geographically Weighted Regression Model

GWR, an improved spatial linear regression model [56], enables local parameter estimation instead of global estimation seen in traditional regression models and incorporates spatial geographic information of the data. This method applies a spatial weight matrix to the linear regression model, revealing spatial structure differentiation. In this study, the GWR model is employed to investigate the spatial variability of factors influencing ES.
y l = β 0 ( u l , v l ) + k = 1 q β k ( u l , v l ) x l k + ε l
where yl and xlk represents the dependent variable and kth independent variables at location l, (ul, vl) is the spatial geographic coordinate position of the lth sample point, β k (ul, vl) is the kth regression parameter at the lth sample point, and ε l is the error term [57].
Based on the relevant literature and data availability in the study area, this paper selects six factors that may influence ES. These factors include three natural factors: average annual precipitation, average annual temperature, and aridity index. Additionally, three social factors are considered: population density, land use intensity, and proportion of impervious area [58,59].

2.6. Scenario Analysis

Scenarios are valuable tools for describing potential future development changes, enabling the assessment of environmental responses to human activities and the effectiveness of various management approaches. The commonly employed scenario matrix combines climate scenarios with socioeconomic scenarios. Climate scenarios are represented by the RCPs, consisting of seven emission pathways (RCP1.9, RCP2.6, RCP3.4, RCP4.5, RCP6.0, RCP7.0, and RCP8.5) [60]. On the other hand, socioeconomic scenarios are represented by the SSPs [61], which encompass five distinct pathways: SSP1 (sustainability), SSP2 (intermediate pathway), SSP3 (regional competition), SSP4 (inequality), and SSP5 (fossil fuel development). Each SSP scenario can be combined with any RCP scenario to represent a combined scenario. However, it is important to note that each scenario combination has different probabilities of occurring in the real world, with some combinations having higher likelihoods [62,63]. As data availability and the likelihood of realization were considered, three combinations were selected to forecast future ES supply and demand in this study: SSP1–RCP1.9, SSP2–RCP4.5, and SSP5–RCP8.5, whose combinations were deemed suitable for analysis.
The SSP1 scenario depicts a sustainable development-oriented world characterized by relatively low challenges in climate change mitigation and adaptation [61]. RCP1.9 represents a low radiative forcing pathway targeting a 1.9 W m−2 increase by 2100, which assumes global GHG emissions peak followed by accelerated reductions to achieve net-zero emissions. Under the SSP1–RCP1.9 integrated scenario, the successful implementation of coordinated mitigation and adaptation strategies effectively constrains global warming through systematic climate action [64].
The SSP2 scenario represents an intermediate trajectory that balances sustainable development considerations with conventional growth patterns. RCP4.5 constitutes a moderate radiative forcing pathway projecting stabilization at 4.5 W m−2 by 2100, which assumes stabilized GHG emissions through international cooperation and technological advancement, yet with limited emission reduction magnitude [65]. Under the SSP2–RCP4.5 framework, societal responses manifest as incremental climate governance measures—including progressive energy efficiency improvements and partial implementation of climate policies—that moderately decelerate warming trends. However, these moderate decarbonization efforts prove insufficient to achieve substantial emission cuts or fully mitigate climate change impacts.
The SSP5 scenario characterizes a future marked by rapid socioeconomic growth driven by highly competitive market-oriented development [66]. RCP8.5 denotes an unmitigated emission trajectory projecting unabated GHG releases, resulting in persistent radiative forcing amplification reaching 8.5 W m−2 by 2100. Under the SSP5–RCP8.5 integrated pathway, climate governance failure precipitates accelerated anthropogenic warming, triggering cascading climatic perturbations—including intensified extreme weather patterns, accelerated sea-level rise, and ecosystem destabilization—ultimately generating profound biophysical and socioeconomic ramifications.
It is worth mentioning that due to the unavailability of erosive precipitation and NDVI predictions for each scenario at the present time, the analysis of soil conservation is not included in this study. By considering a range of scenario combinations and their associated probabilities, this study contributes to understanding and anticipating the potential future dynamics of ES supply and demand in Chongqing, providing insights for informed decision-making and sustainable management of regional ecosystems.

3. Results

This section may be divided by subheadings. It should provide a concise and precise description of the experimental results, their interpretation, and the experimental conclusions that can be drawn.

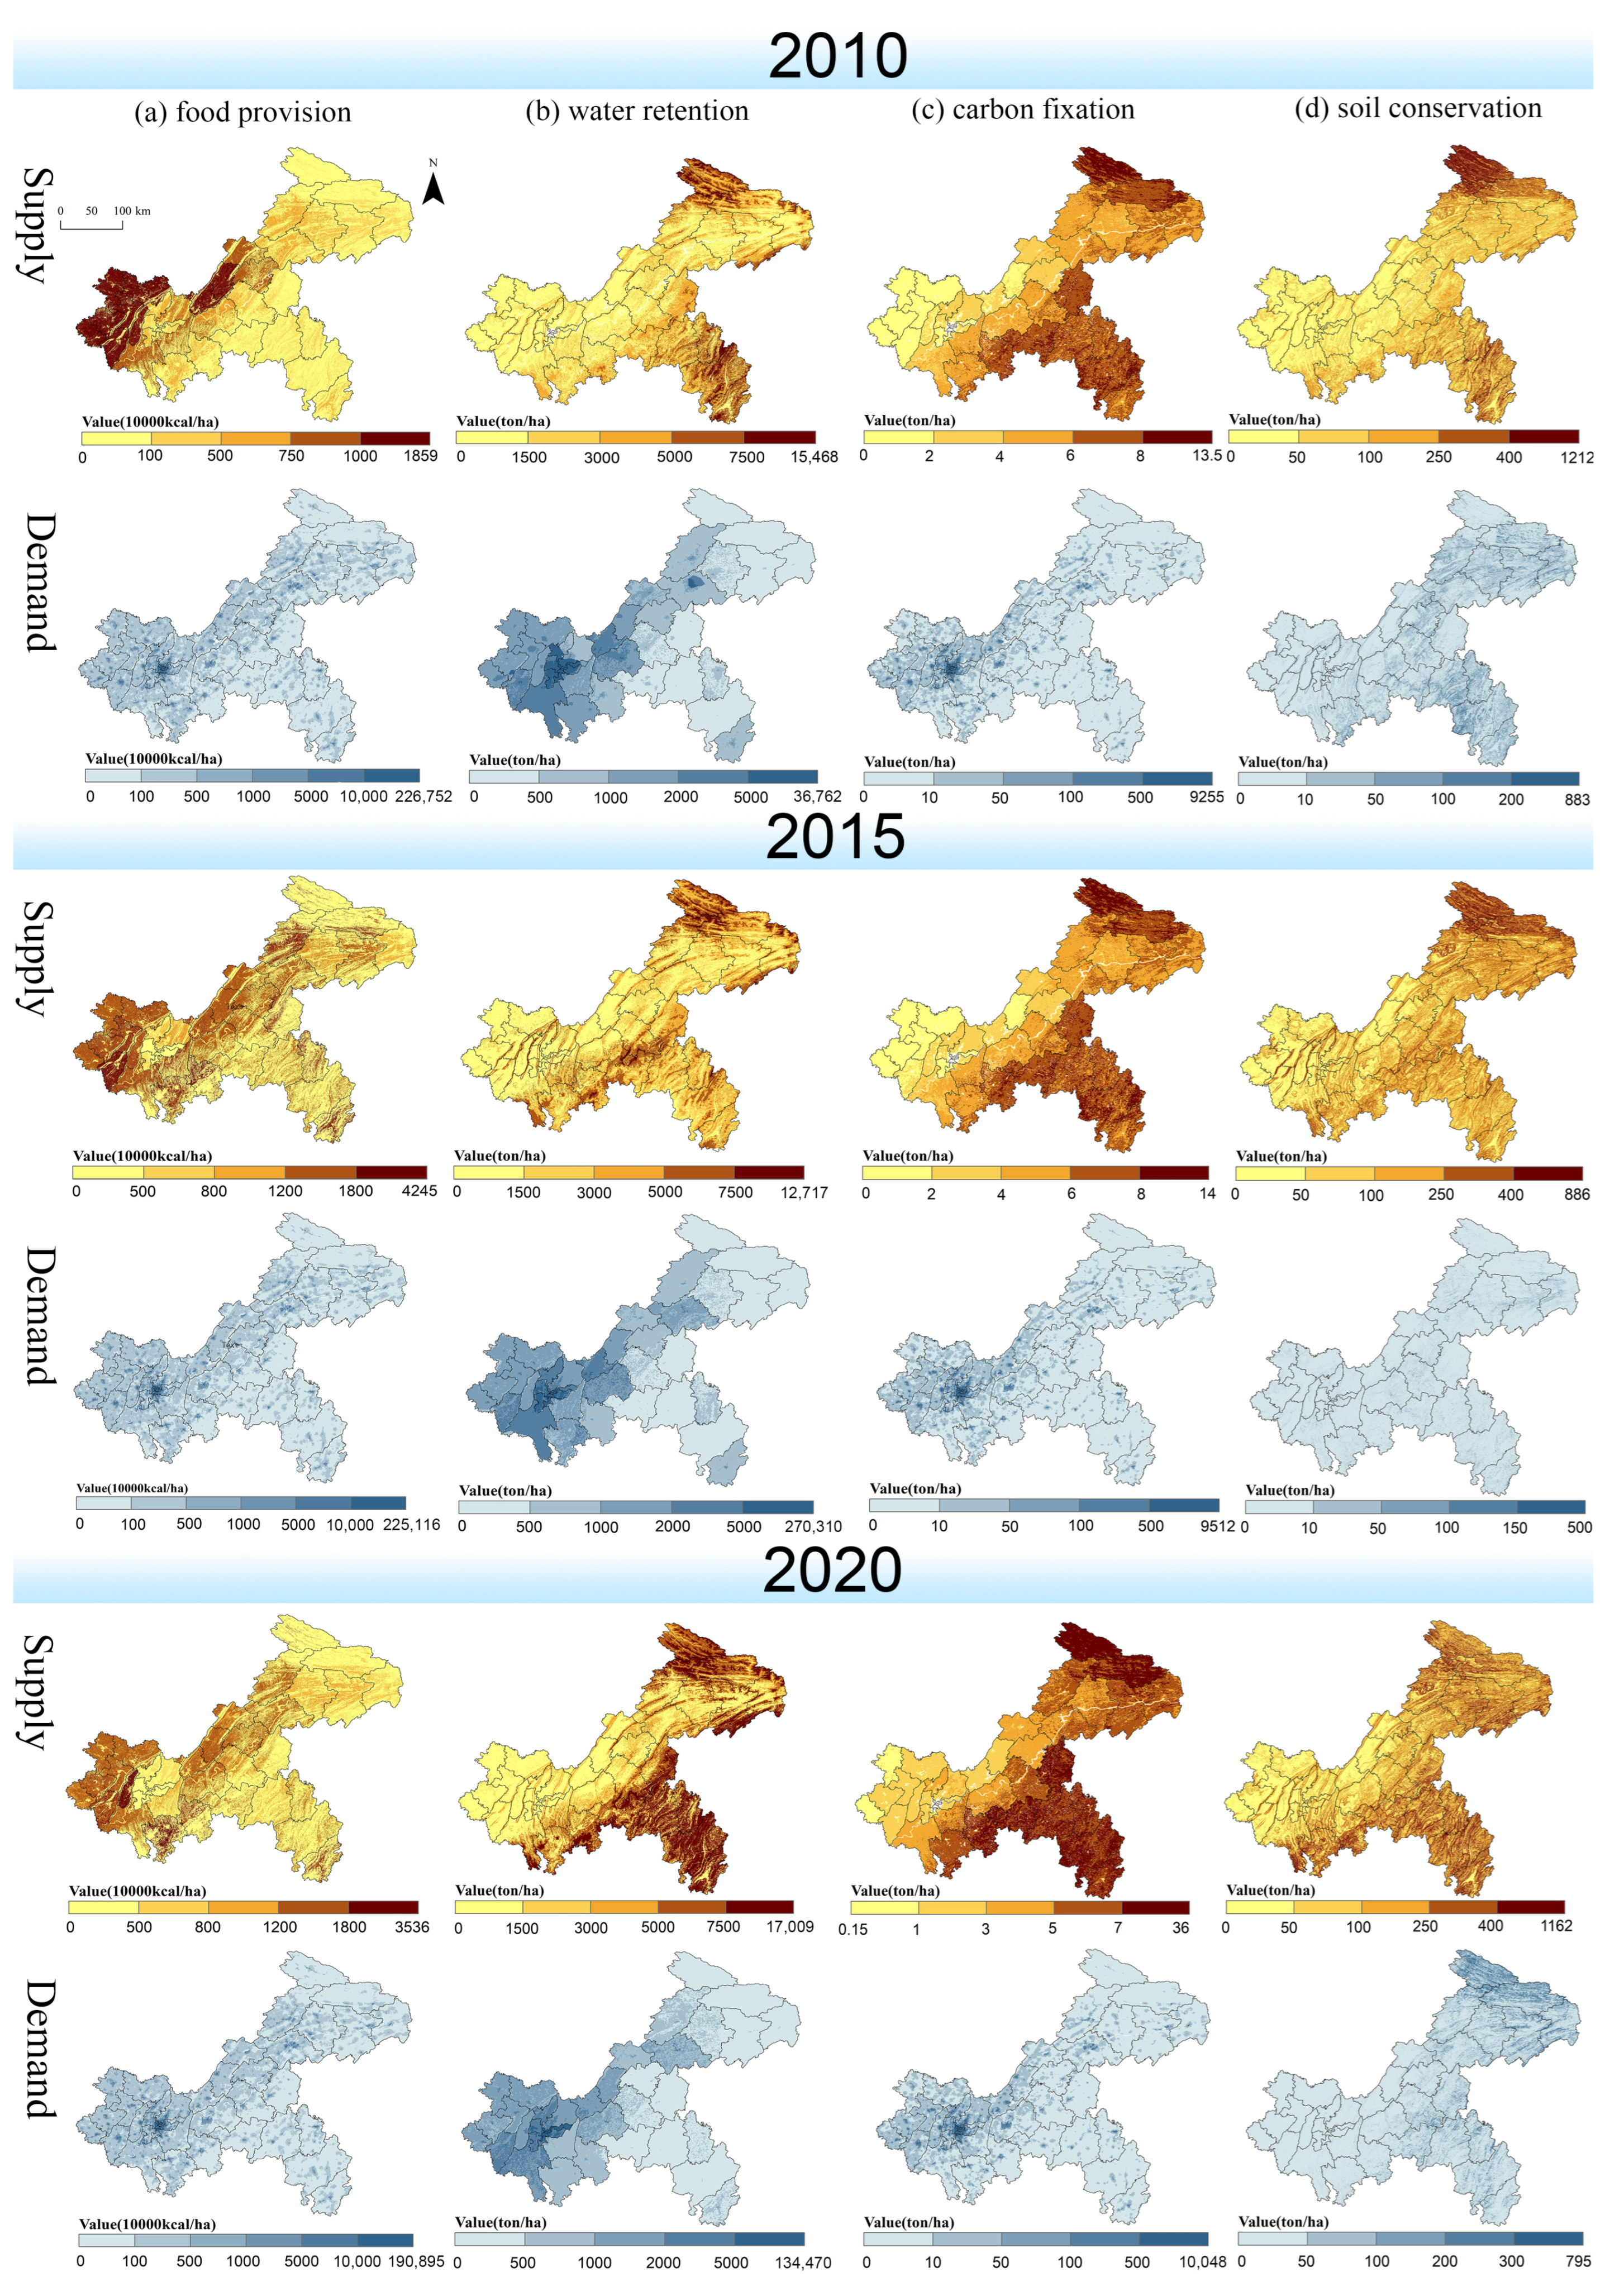
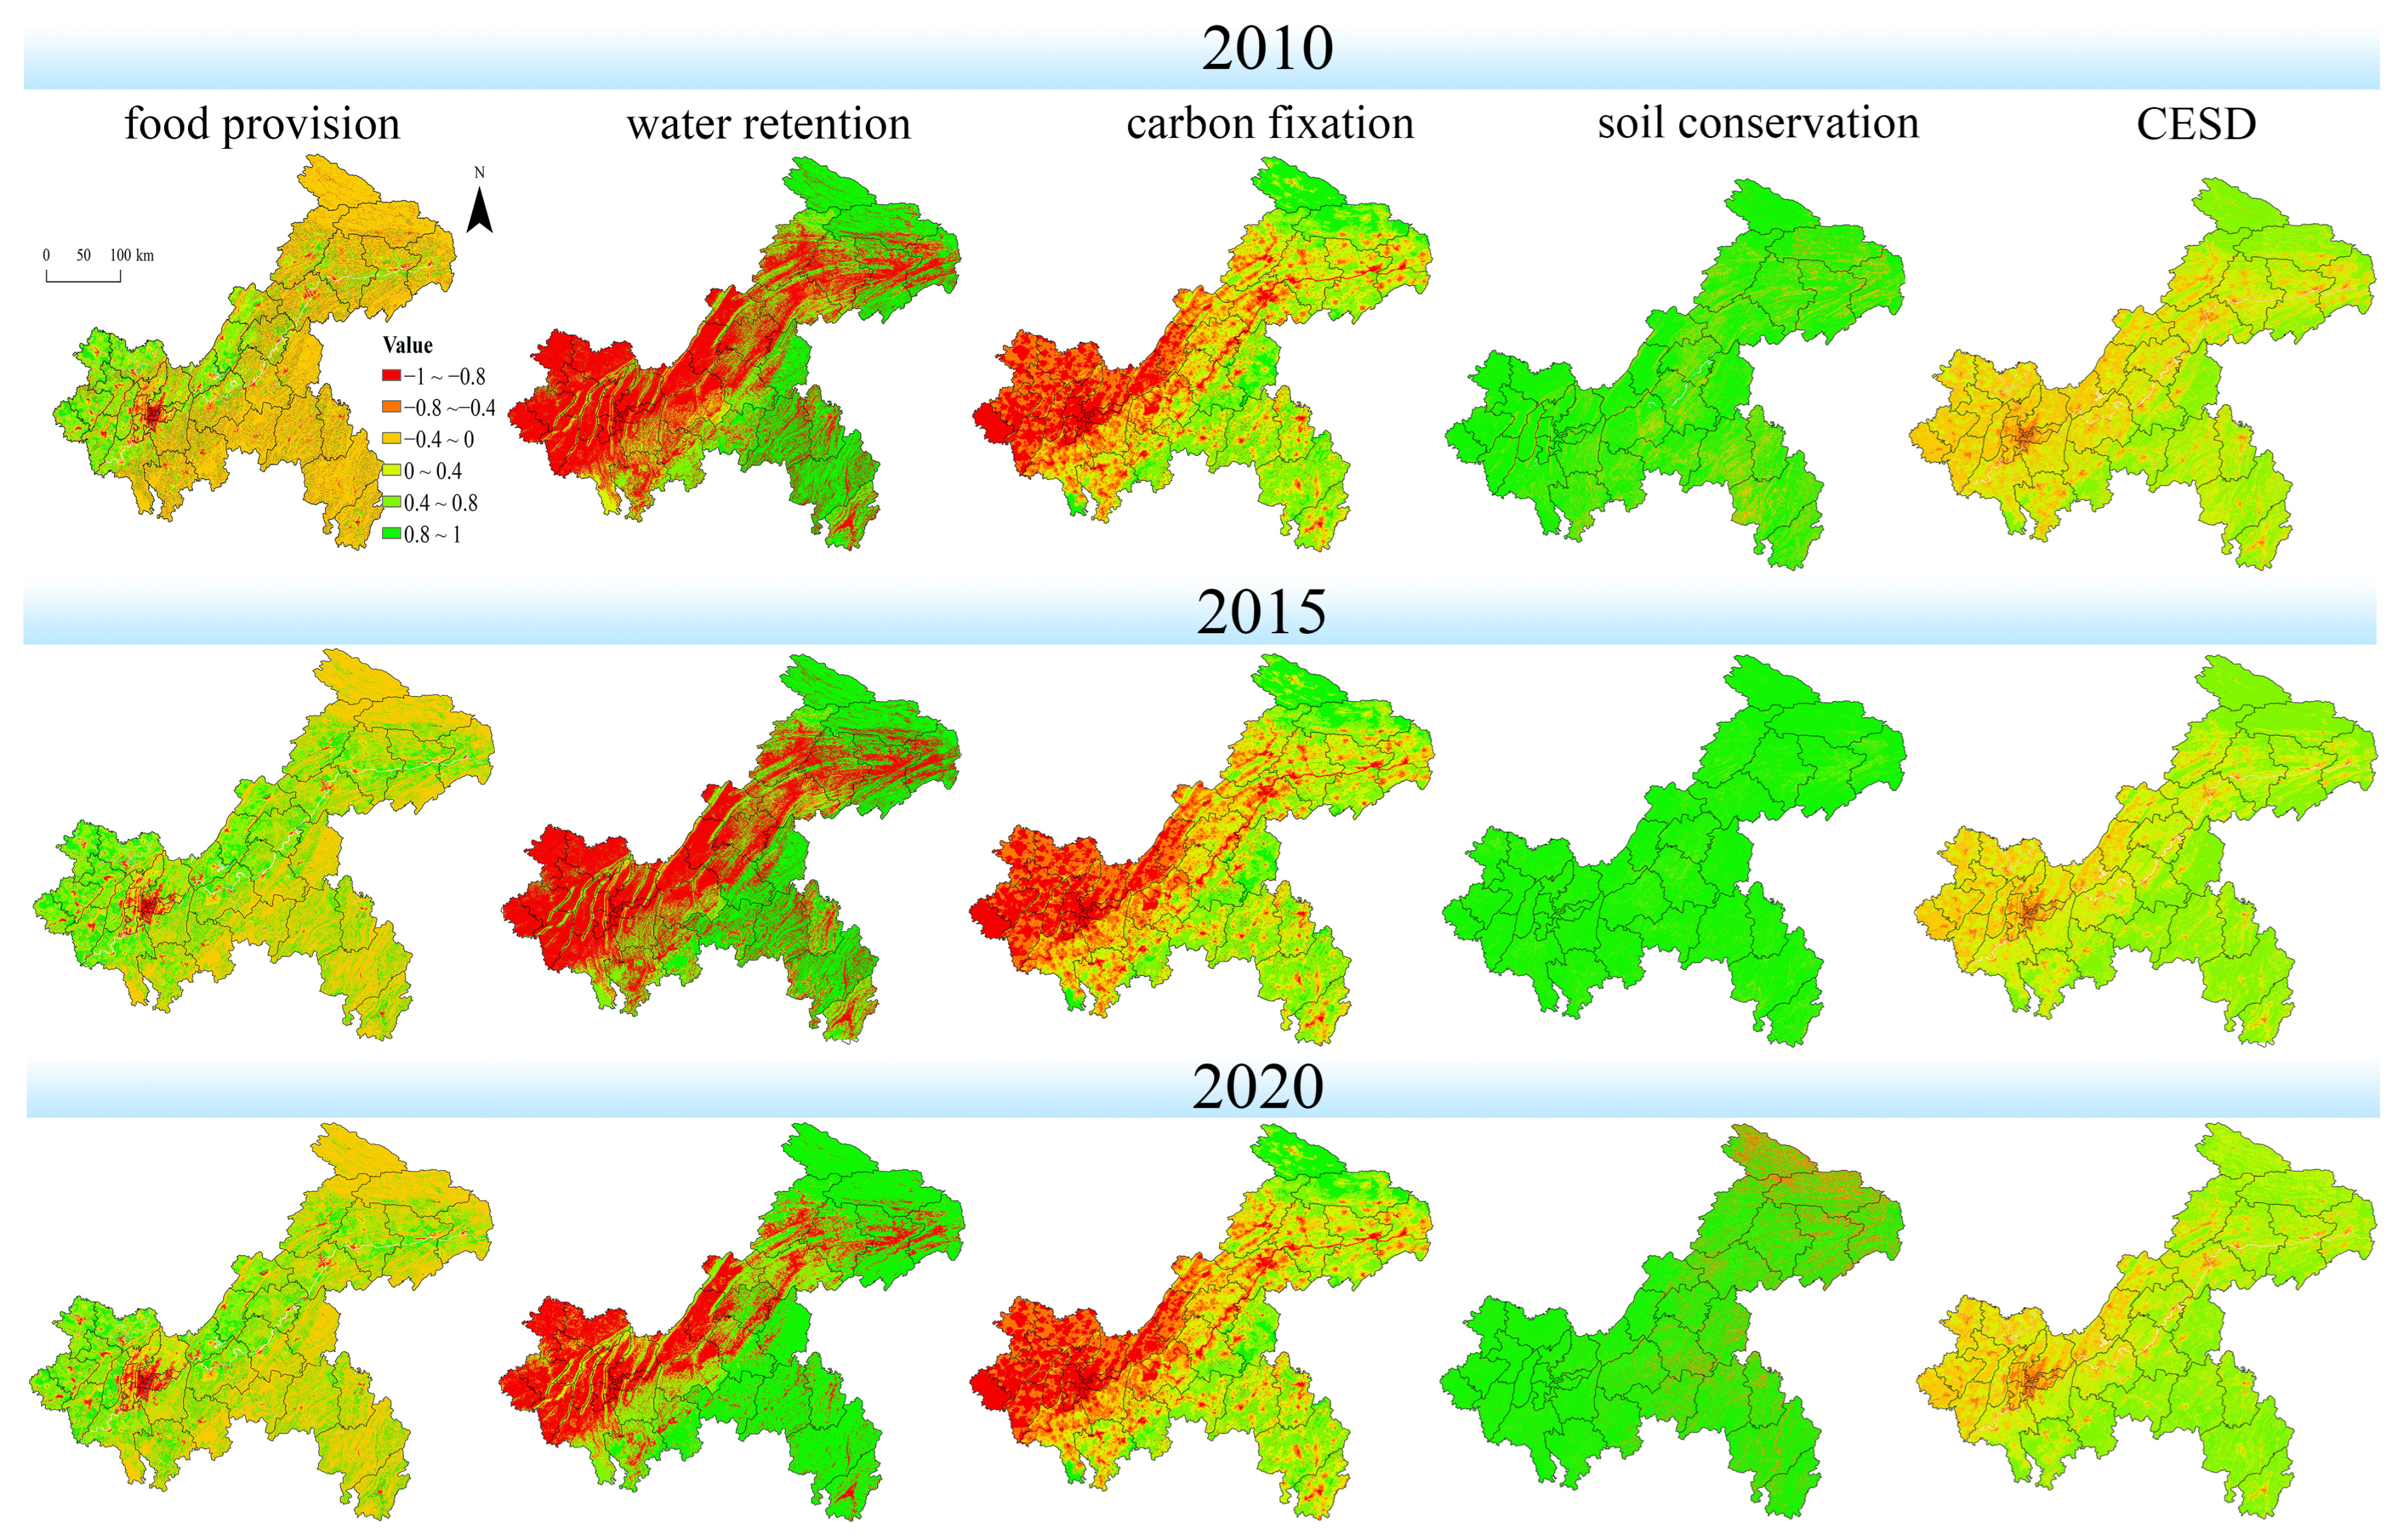
3.1. Changes in ES Supply and Demand Patterns

Table 1 illustrates the supply and demand values of the four ES functions in Chongqing for the years 2010, 2015, and 2020. From the perspective of supply, all four ES exhibited an upward trend, indicating an overall improvement in the regional ecosystem condition of Chongqing over the past decade. It is noted that the water retention increased from 23.39 billion m3 in 2010 to 42.22 billion m3 in 2020, representing a substantial growth of 79.6%. This increase can be primarily attributed to the relatively low precipitation experienced in 2010, with an average annual precipitation of 1058 mm, amounting to only 73% of that recorded in 2020 (1435 mm). Additionally, the supply of soil conservation and food provision rose by 45.6% and 18.7%, respectively, during the same ten-year period. On the demand side, two distinct trends emerged, with soil conservation, food provision, and carbon sequestration displaying an overall upward trajectory. Taking food supply as an example, the demand increased from 24.0 × 10¹² kcal in 2010 to 25.2 × 10¹² kcal, representing a rise of approximately 5%. Despite the gradual decline in per capita food consumption and carbon emissions in recent years, these reductions have not been sufficient to offset the increase in food demand and carbon emissions resulting from population growth. However, in the case of water retention, a consistent decrease was observed, with total water consumption in Chongqing amounting to 65.56 × 10⁸ m3 in 2020, indicating a 24.1% reduction compared to the levels recorded in 2010. Comparing the supply and demand for each ES, it is evident that three out of the four ES functions, with the exception of carbon sequestration, exhibit a pattern where supply exceeds demand.
Both the supply and demand of ES exhibit pronounced spatial heterogeneity in Chongqing (see Figure 3). Regarding the supply side, the spatial distribution patterns of water retention, soil conservation, and carbon fixation demonstrate a high degree of consistency, aligning closely with land use types. Generally, areas dominated by forest land exhibit a high ES supply, whereas regions dominated by agricultural land and impervious strata tend to have lower supply levels. Consequently, areas with elevated ES values are primarily concentrated in northeastern and southeastern Chongqing. These regions are predominantly mountainous, characterized by extensive vegetation cover, and possess relatively low population densities, resulting in limited human-induced impacts. Northeastern and southeastern Chongqing encompass 17 districts, accounting for approximately 65% of the total area of Chongqing. However, they contribute 78.3% of the city’s carbon sequestration, 78.5% of soil conservation, and 84% of water retention. Conversely, concerning food supply, the inverse pattern emerges, with high-value areas primarily located in the western part of Chongqing, particularly in proximity to the main urban area. These areas feature relatively flat terrains suitable for agricultural cultivation. In contrast, low-value areas are situated in the adjacent mountainous and hilly regions in the southeast and northeast of Chongqing. Regarding the demand side, the high-demand region for soil conservation services located in the northeast and southeast areas characterized by substantial soil erosion, the demand for the other three ES directly correlates with human activities. Consequently, the high-demand service areas are concentrated in densely populated regions, such as the central city of Chongqing and central areas of other districts and counties. These areas encompass a total of nine districts. This only accounts for 5.8% of the city’s total area but accounts for 31.8% of the demand for food supply, 22.7% of the demand for water retention, and 39.2% of the demand for carbon fixation.
The average supply–demand ratios for food provision, water retention, carbon fixation, and soil conservation in Chongqing in 2020 were 0.37, 0.73, −0.48, and 0.69, respectively. This indicates that the overall ecosystem provision in Chongqing is capable of adequately meeting the regional demand for ecosystem services. However, there exists a significant spatial imbalance between regional ES supply and demand, with a prevailing deficit observed in numerous areas (see Figure 4). Specifically, regarding food provision service, the supply–demand ratio is relatively lower in the central city, followed by the mountainous areas in the northeast and southeast, while the flat terrain in the western part of Chongqing exhibits a higher ratio. From 2010 to 2020, the overall supply–demand ratio for food provision service in Chongqing increased from 0.31 to 0.39, yet experienced a decrease in localized areas, particularly in the central urban zones. The average value of the food supply–demand ratio in the nine central districts of the city decreased from −0.28 to −0.64. On one hand, the demand for food has risen due to rapid population growth, while on the other hand, the supply has diminished due to the conversion of agricultural land into urban construction land as a consequence of continuous urban expansion. Regarding water retention service, the overall supply–demand ratio in Chongqing is high, indicating that the supply adequately meets the demand. However, certain grids still exhibit a supply shortage compared to demand, primarily in economically developed and densely populated areas, such as the central urban areas and counties. In 2020, 17 out of the 38 counties experienced supply–demand ratios that were below 0. The ecosystem in Chongqing demonstrates notable soil conservation capacity, with every district and county showing a supply of soil conservation service that surpasses demand. Only some raster-based soil conservation values fail to meet the requirements, primarily sporadically distributed in the mountainous areas of northeastern Chongqing. Carbon fixation is the sole ES function exhibiting a supply–demand ratio below 0. From 2010 to 2020, the supply–demand ratio decreased from −0.43 to −0.48, indicating a deteriorating supply–demand relationship. Only six counties experienced supply exceeding demand, all of which were located in the southeastern and northeastern regions. This is primarily attributed to increased energy consumption resulting from population growth and economic development.
From 2010 to 2020, the average CESD value in Chongqing increased from 0.260 to 0.320, indicating a general enhancement in the city’s overall ecosystem service function. The spatial distribution of the CESD shows distinct patterns, characterized by lower values in the central city and western regions and higher values in the northeast and southeast regions, thereby highlighting significant spatial disparities. During the period from 2010 to 2020, approximately 65% of the grid cells’ CESD value demonstrated varying increases, whereas around 35% of the grid cells’ CESD value displayed a decrease. The results revealed that the decline in ES supply and demand was primarily concentrated in the central urban areas, suggesting an ongoing trend of deterioration in these locations. Moreover, the expansion and aggregation of grid cells with CESD values below 0 in the central urban area were observed, with the proportion rising from 55.7% in 2010 to 72.9% in 2020. Conversely, the CESD in the southeastern and northeastern regions of Chongqing increased from 0.49 in 2010 to 0.55 due to ongoing investments in the conservation of ecosystem stability. To assess the temporal changes in CESD quantitatively, we categorized the values into six classes (see Figure 5). The results revealed that between 2010 and 2020, 34.52% of the grid cells shifted to a higher grade, with 15.3% of the grid cells (covering an area of 12,596 km2) transitioning from the moderate category(0~0.4) to the category above (0.4~0.8), and an additional 10.52% (covering an area of 8738 km2) shifting from the slight category(−0.4~0) to the moderate category(0~0.4), thus achieving a transition from a state of supply less than demand to a state of supply more than demand. In contrast, the proportion of grid cells transitioning to lower-level classes accounted for merely 13.38%. The findings indicate a significant improvement in the overall quality of ES supply–demand in Chongqing over the past decade.

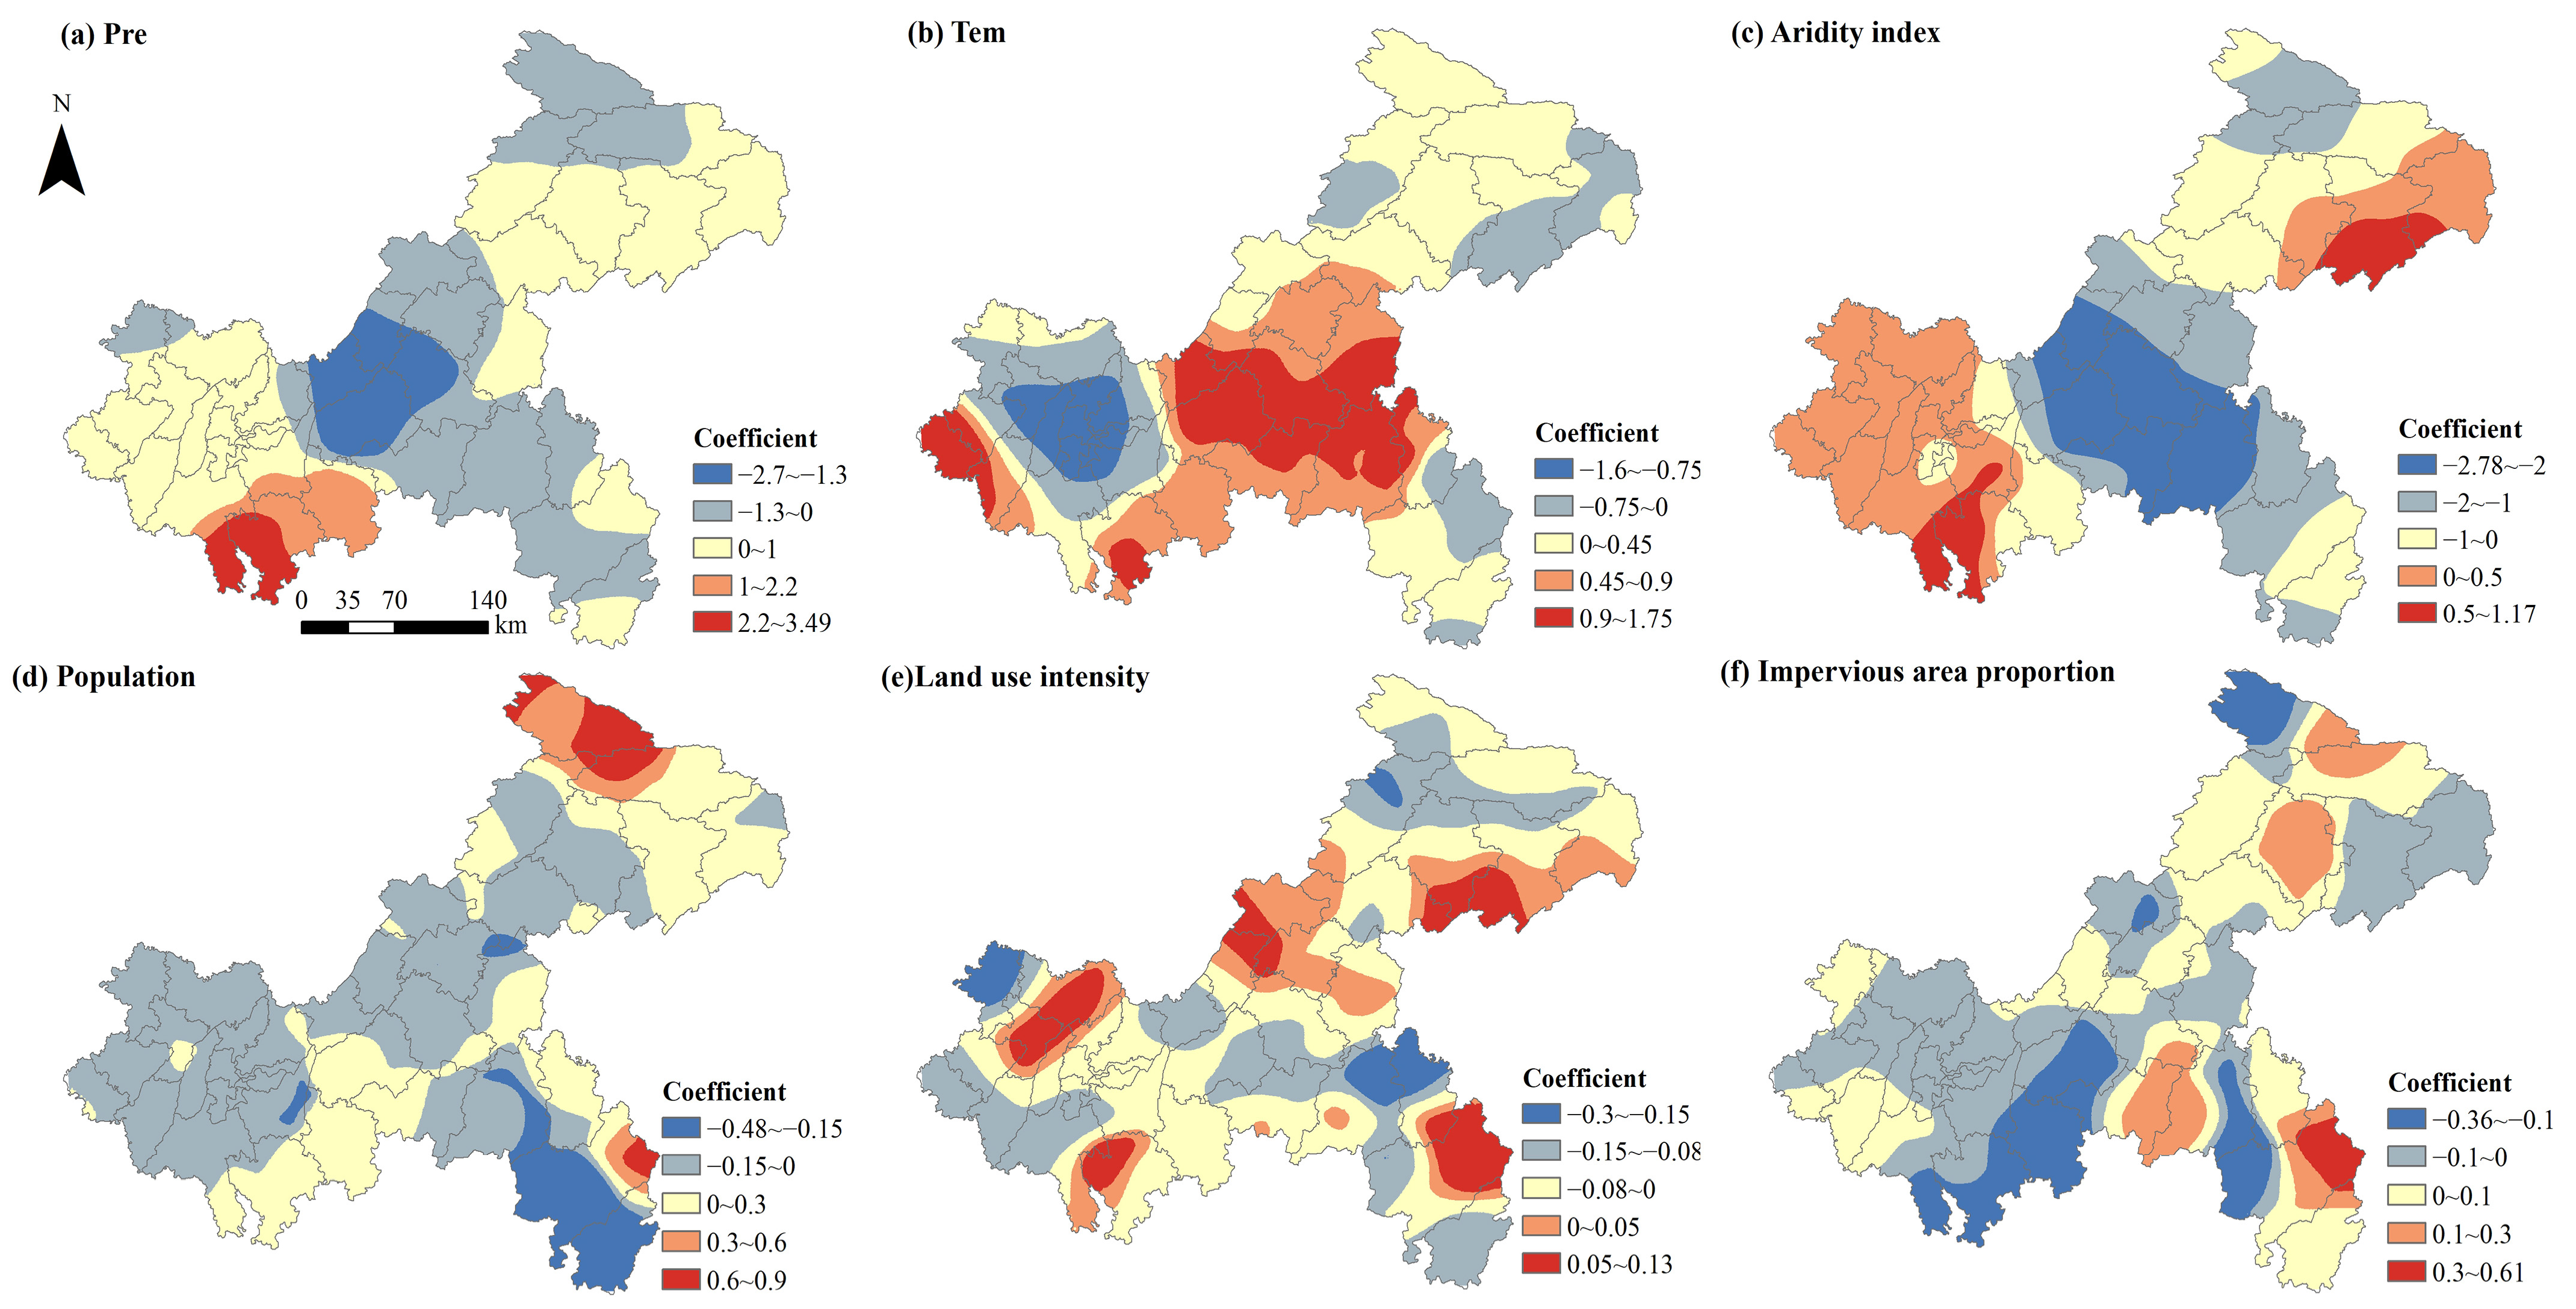
3.2. Driving Forces of ES Changes

In 2020, the local coefficient R2 derived from the GWR model for each subcomponent of ES in Chongqing spanned a range of 0.41 to 0.915. Notably, the local R2 result for the overall ES supply was 0.627, indicating that the selected explanatory variables employed by the GWR model possessed substantial explanatory ability concerning ES supply in Chongqing. The average marginal contributions of each variable to the supply of ES in Chongqing, as indicated by the mean values of the local coefficients presented in Table S10, were ranked based on their contributions in the following order: aridity index, temperature, land use intensity, population, precipitation, and impervious area proportion. It was observed that the mean regression coefficients associated with the aridity index and land use intensity were negative, suggesting a detrimental marginal effect on the supply of ES. On the other hand, the remaining variables demonstrated positive correlations, indicating a constructive impact on the supply of ES. Additionally, the spatial distribution patterns presented in Figure 6 and Figures S4–S7 underscored the significant spatial heterogeneity in the impacts of both climate change and human activities on ES supply in Chongqing for the year 2020. These impacts are multifaceted, exhibiting both positive and negative effects, which underscores the complexity of the interactions between natural and anthropogenic factors.
The mean value of the regression coefficients revealed that the aridity index exhibited the strongest correlation with ES supply, with a coefficient of −0.743. This indicates a significant negative association between ES supply and the aridity index, with approximately 66% of the study area demonstrating this characteristic. Generally, regions characterized by a higher aridity index tend to experience lower levels of precipitation and higher evaporation rates. These conditions are unfavorable for crop and vegetation growth, resulting in reduced crop yields and carbon sequestration capacity. Moreover, the substantial loss of water through evapotranspiration further exacerbates water-related ecosystem challenges. Elevated temperature (Tem) showed a significant positive correlation with overall ES supply, this is consistent with the findings of Pan [58]. In this study, approximately 72% of the area exhibits this relationship. Generally, temperature increases facilitate an extension of the vegetation growing season and enhance photosynthesis, thereby promoting ecosystem recovery [67]. However, there were a few areas, primarily located in the western part of Chongqing city, where increased temperature had a detrimental impact on the total ES supply. This can be attributed to the inhibition of vegetation growth and potential ecosystem degradation when the temperature exceeds the optimal range for vegetation growth. Compared to the climatic factors mentioned above, precipitation (Pre) had a relatively smaller effect on total ES supply, with a coefficient of 0.018. Approximately 55% of the regions experienced an increase in total ES supply due to an increase in precipitation, primarily observed in the northeastern and western regions of Chongqing. Among the three social factors, land use intensity exhibited a more significant correlation with total ES supply, with a regression coefficient of −0.045. Land use intensity values are determined based on land use types, where lower values are associated with forest and grassland, while higher values correspond to agricultural land and urban construction land. As woodlands and grasslands contribute significantly to ES supply, a decrease in land use intensity in approximately 73% of the study area would result in an increase in total ES supply. Numerous studies have indicated that the most direct and substantial impact of human activities on ES is primarily through changes in land use, with rapid urbanization leading to habitat deterioration and a decline in ecosystem structure and function [68,69]. Nevertheless, 27% of the study area displayed a contrasting trend. In these regions, agricultural land predominated as the primary land use type, closely linking ES supply with the provision of food. Consequently, these regions presented relatively higher land use intensity, which was also reflected in a notable degree of ES supply. The effects of population and the proportion of previous areas on total ES supply were relatively small, with regression coefficients of 0.019 and 0.001, respectively.

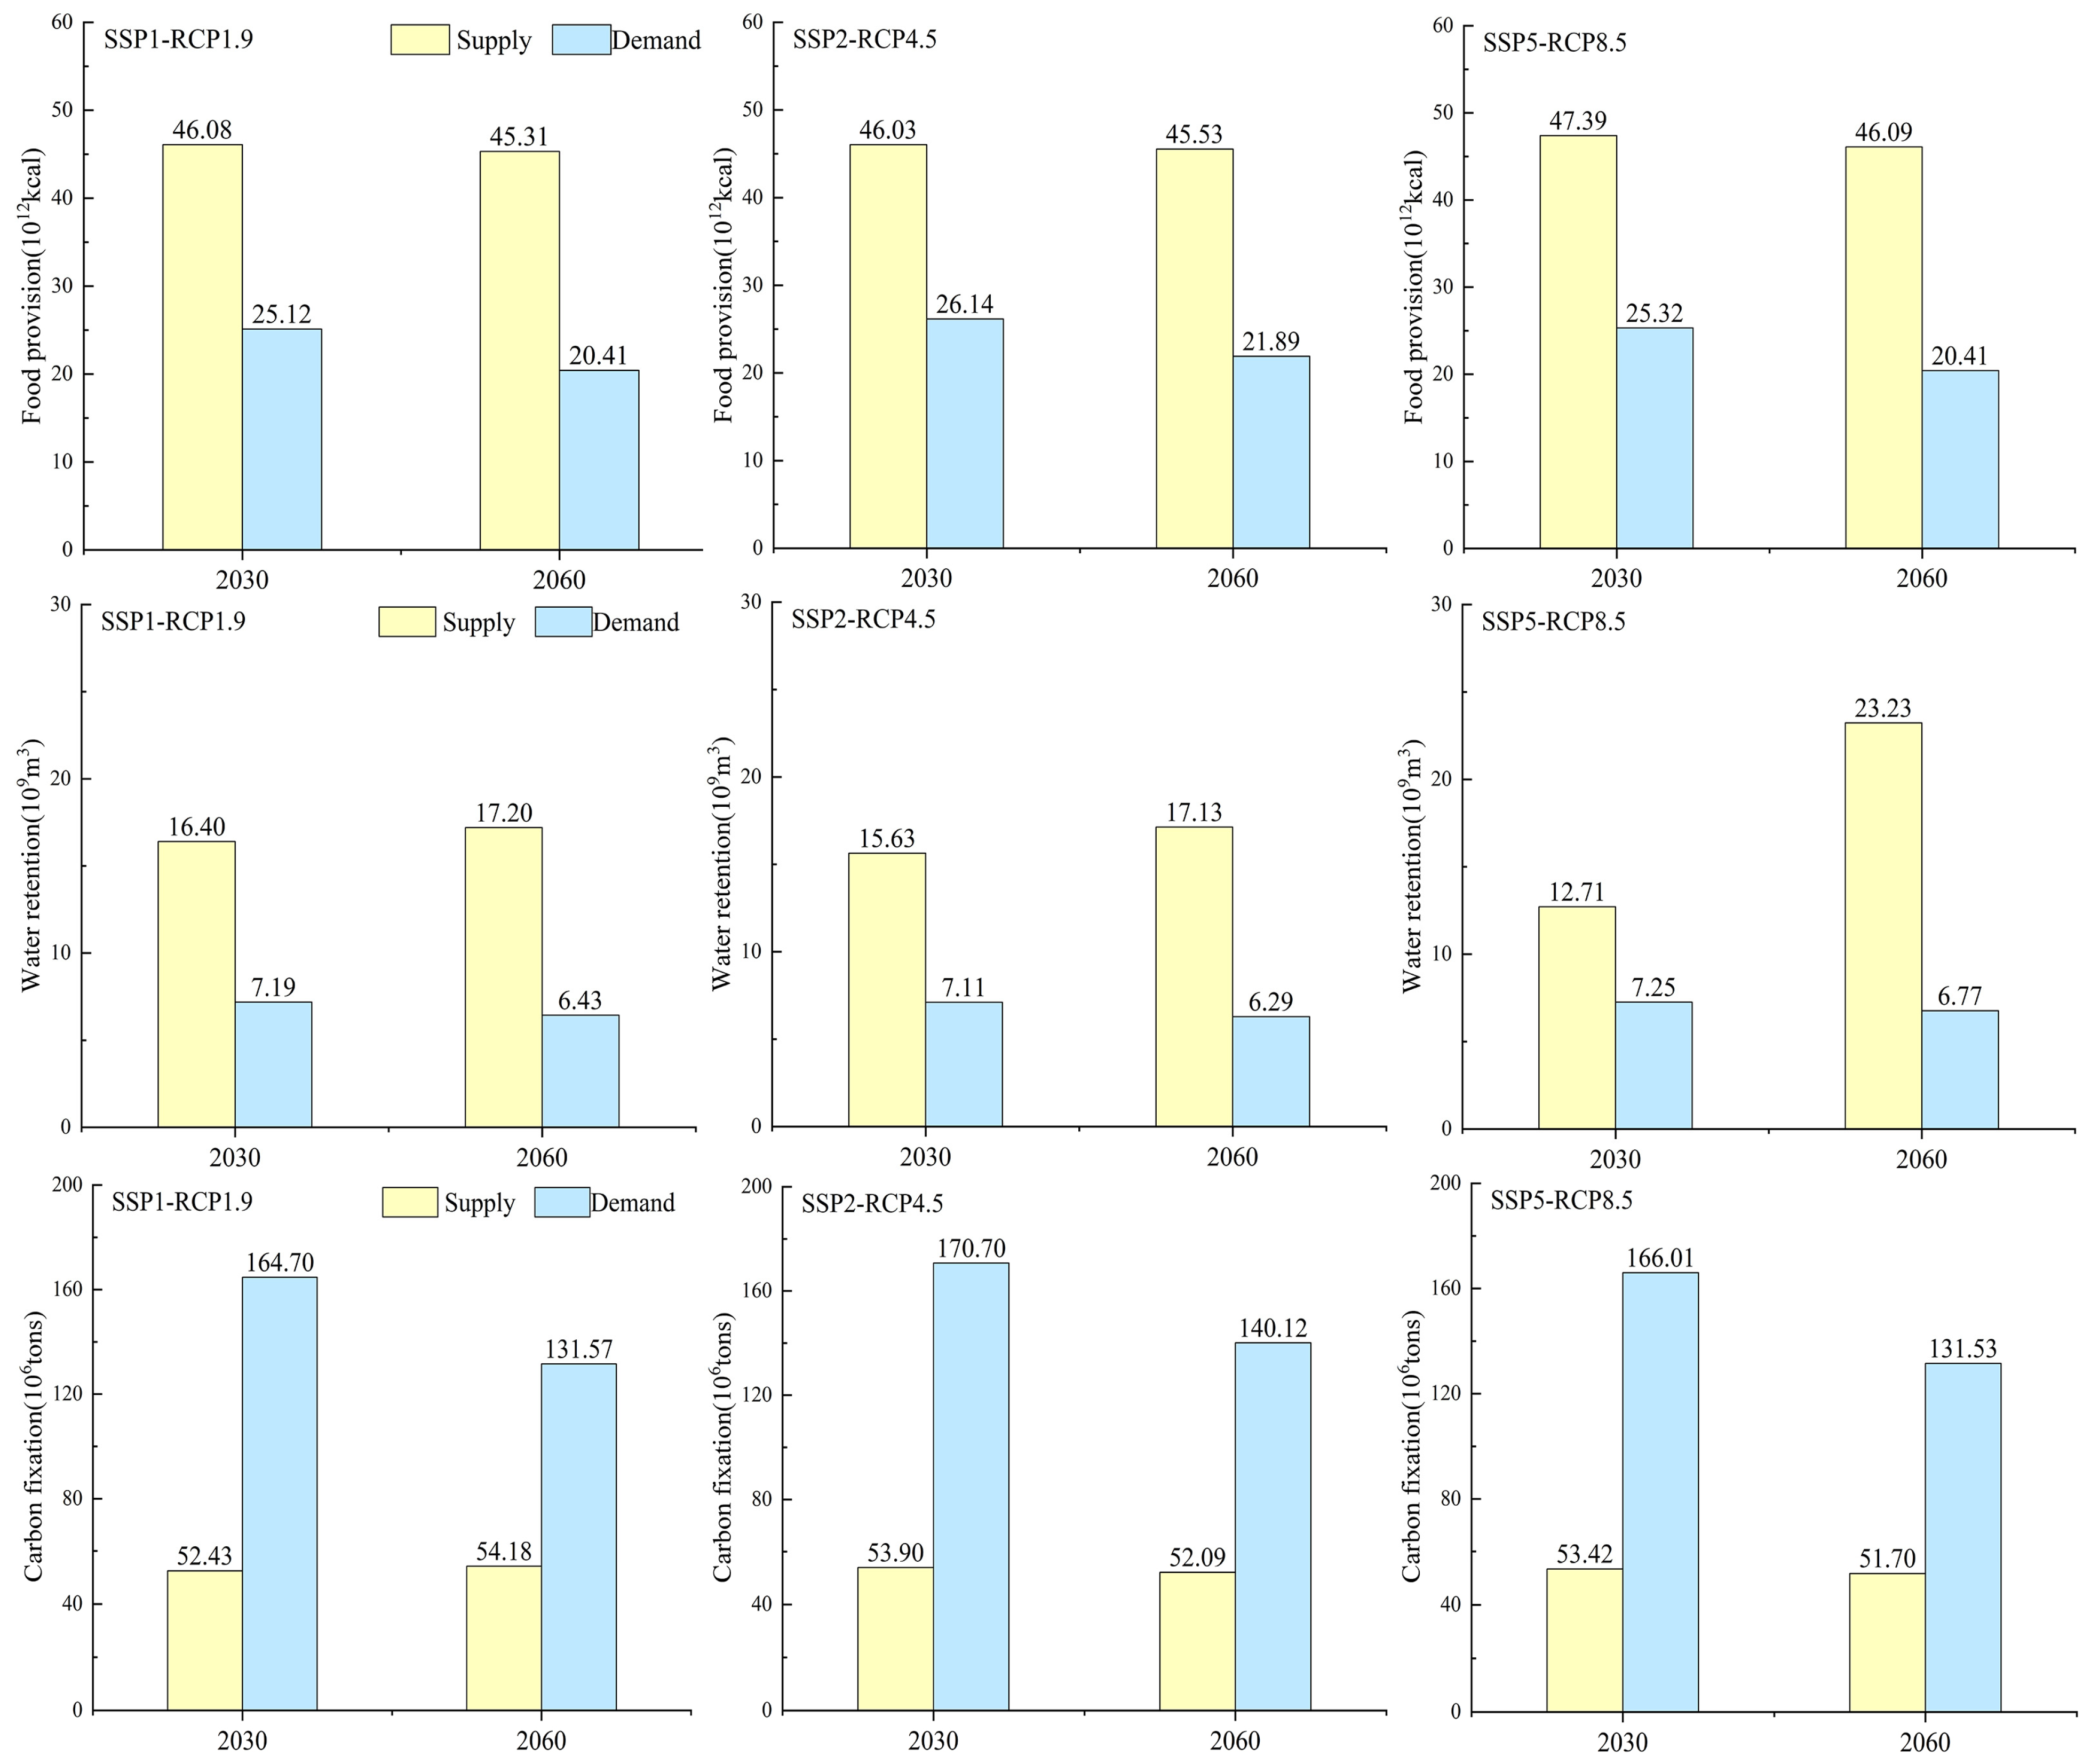
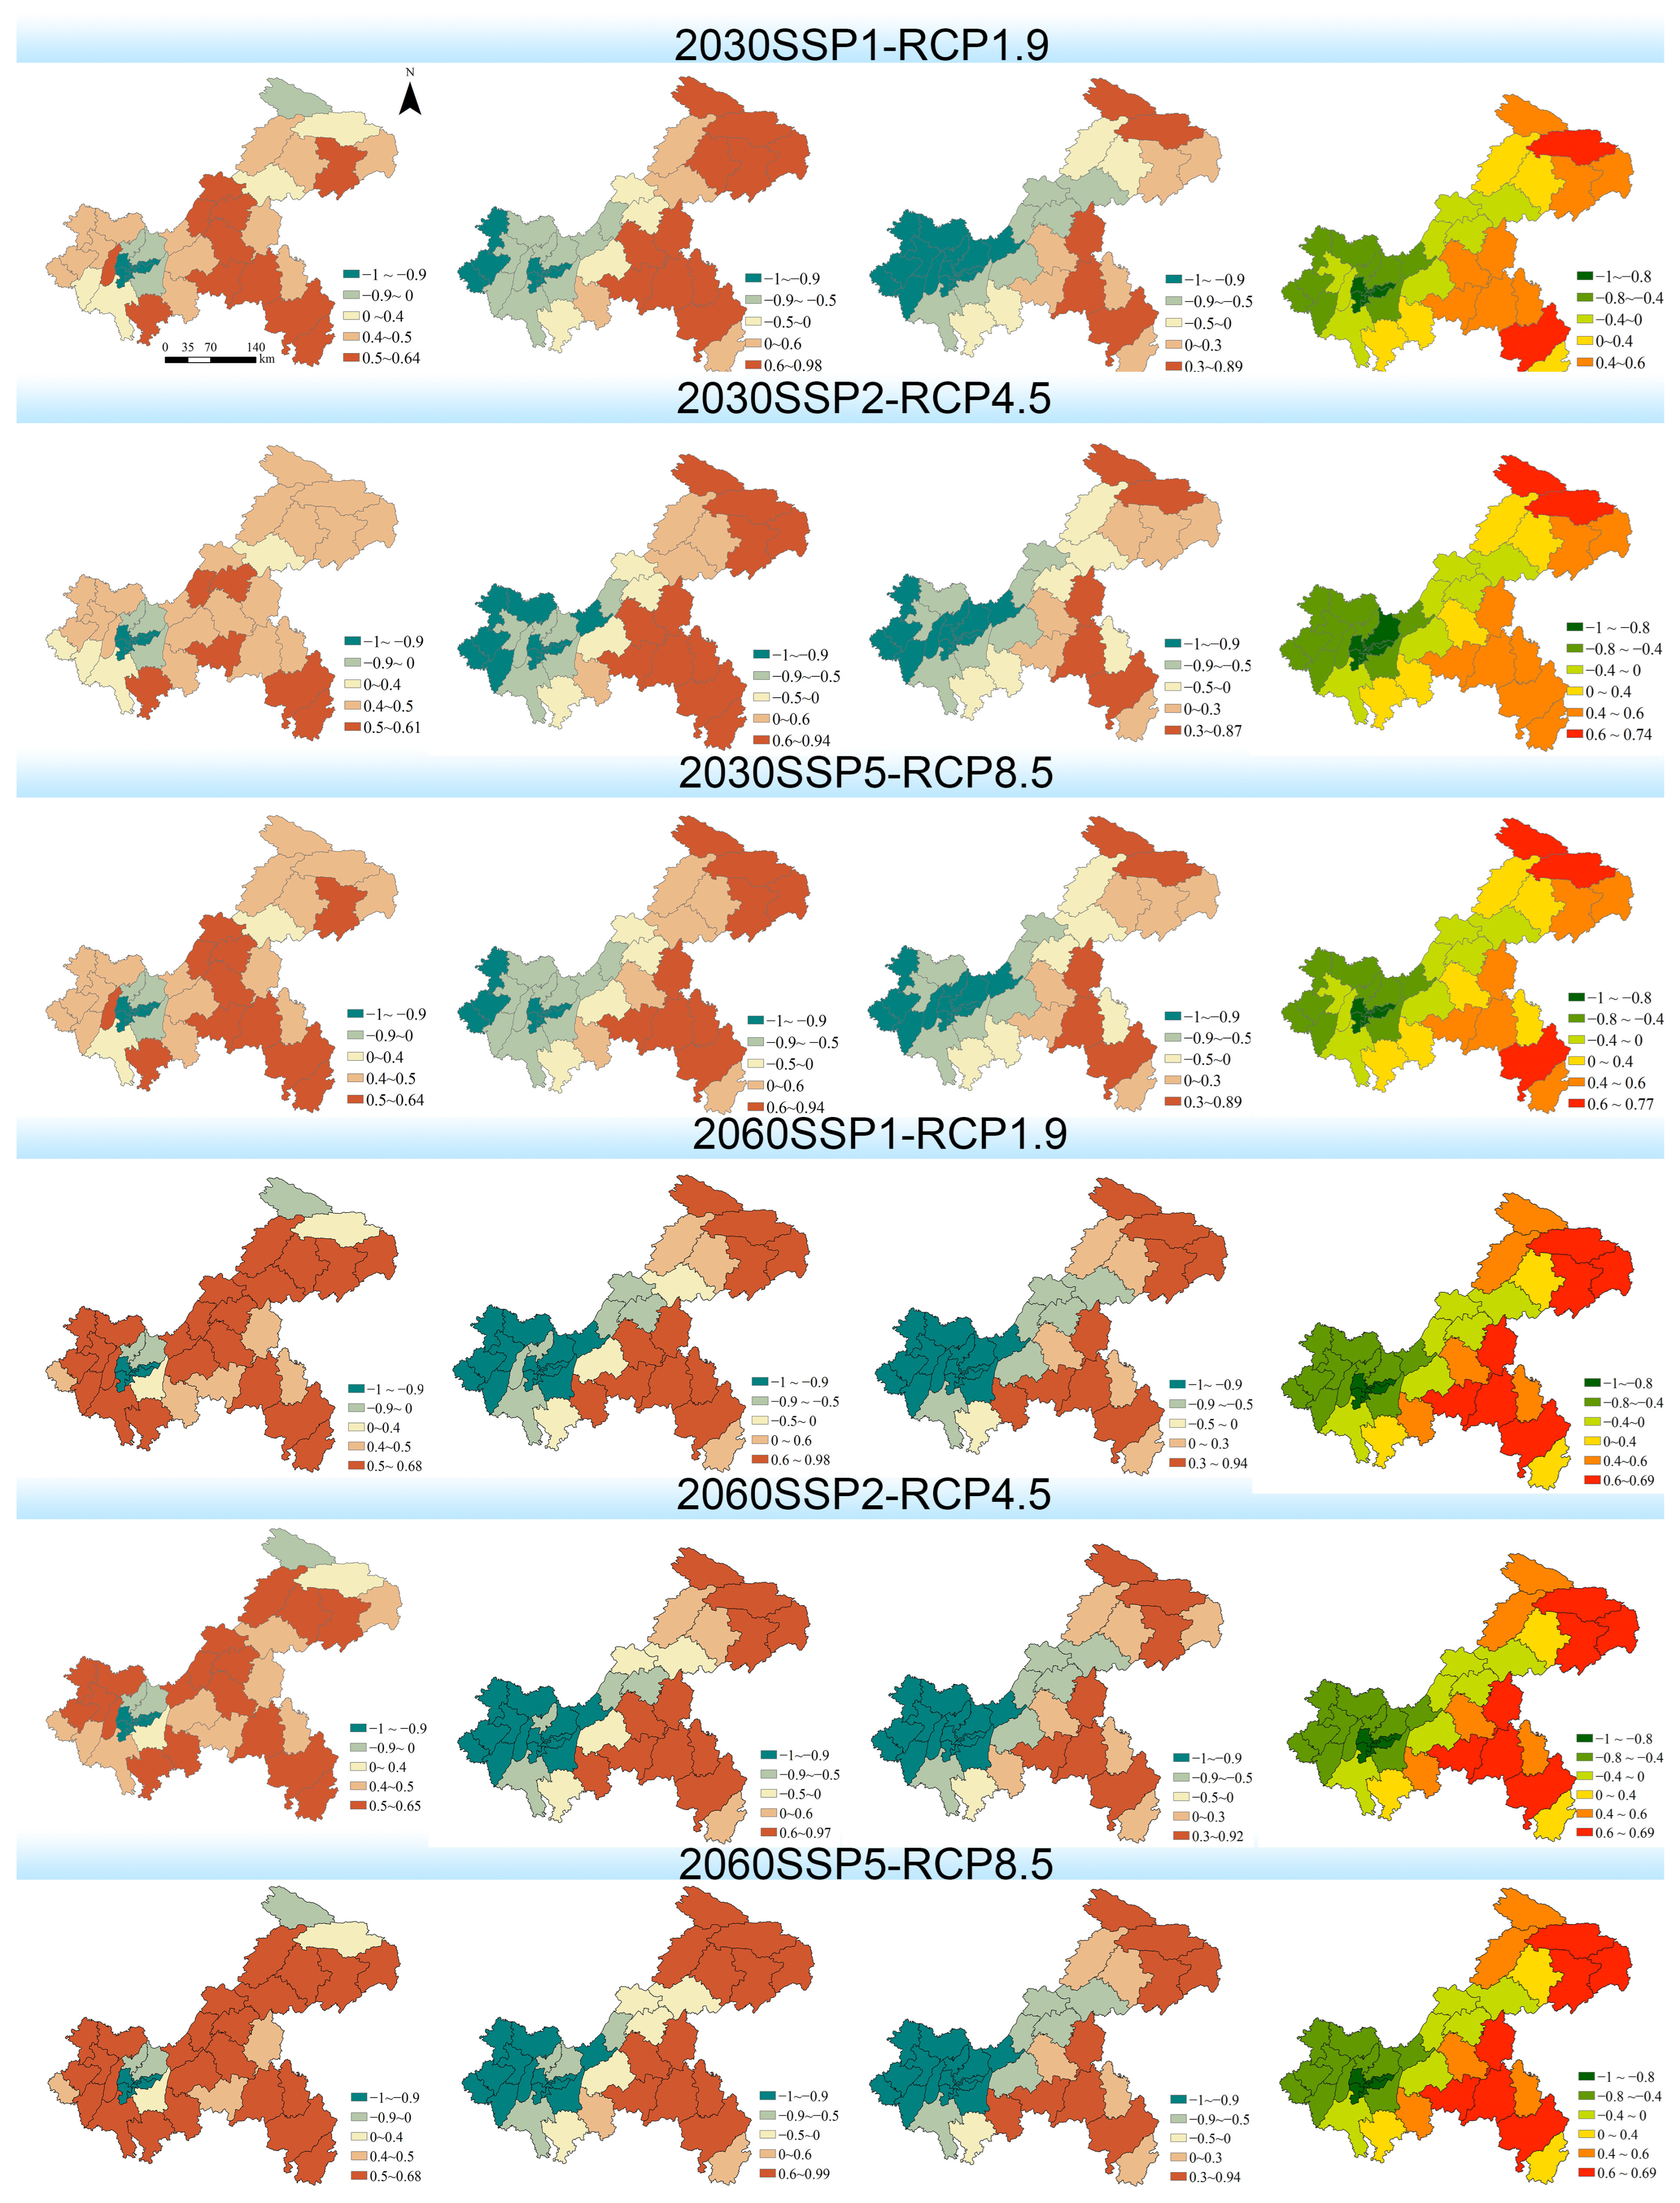
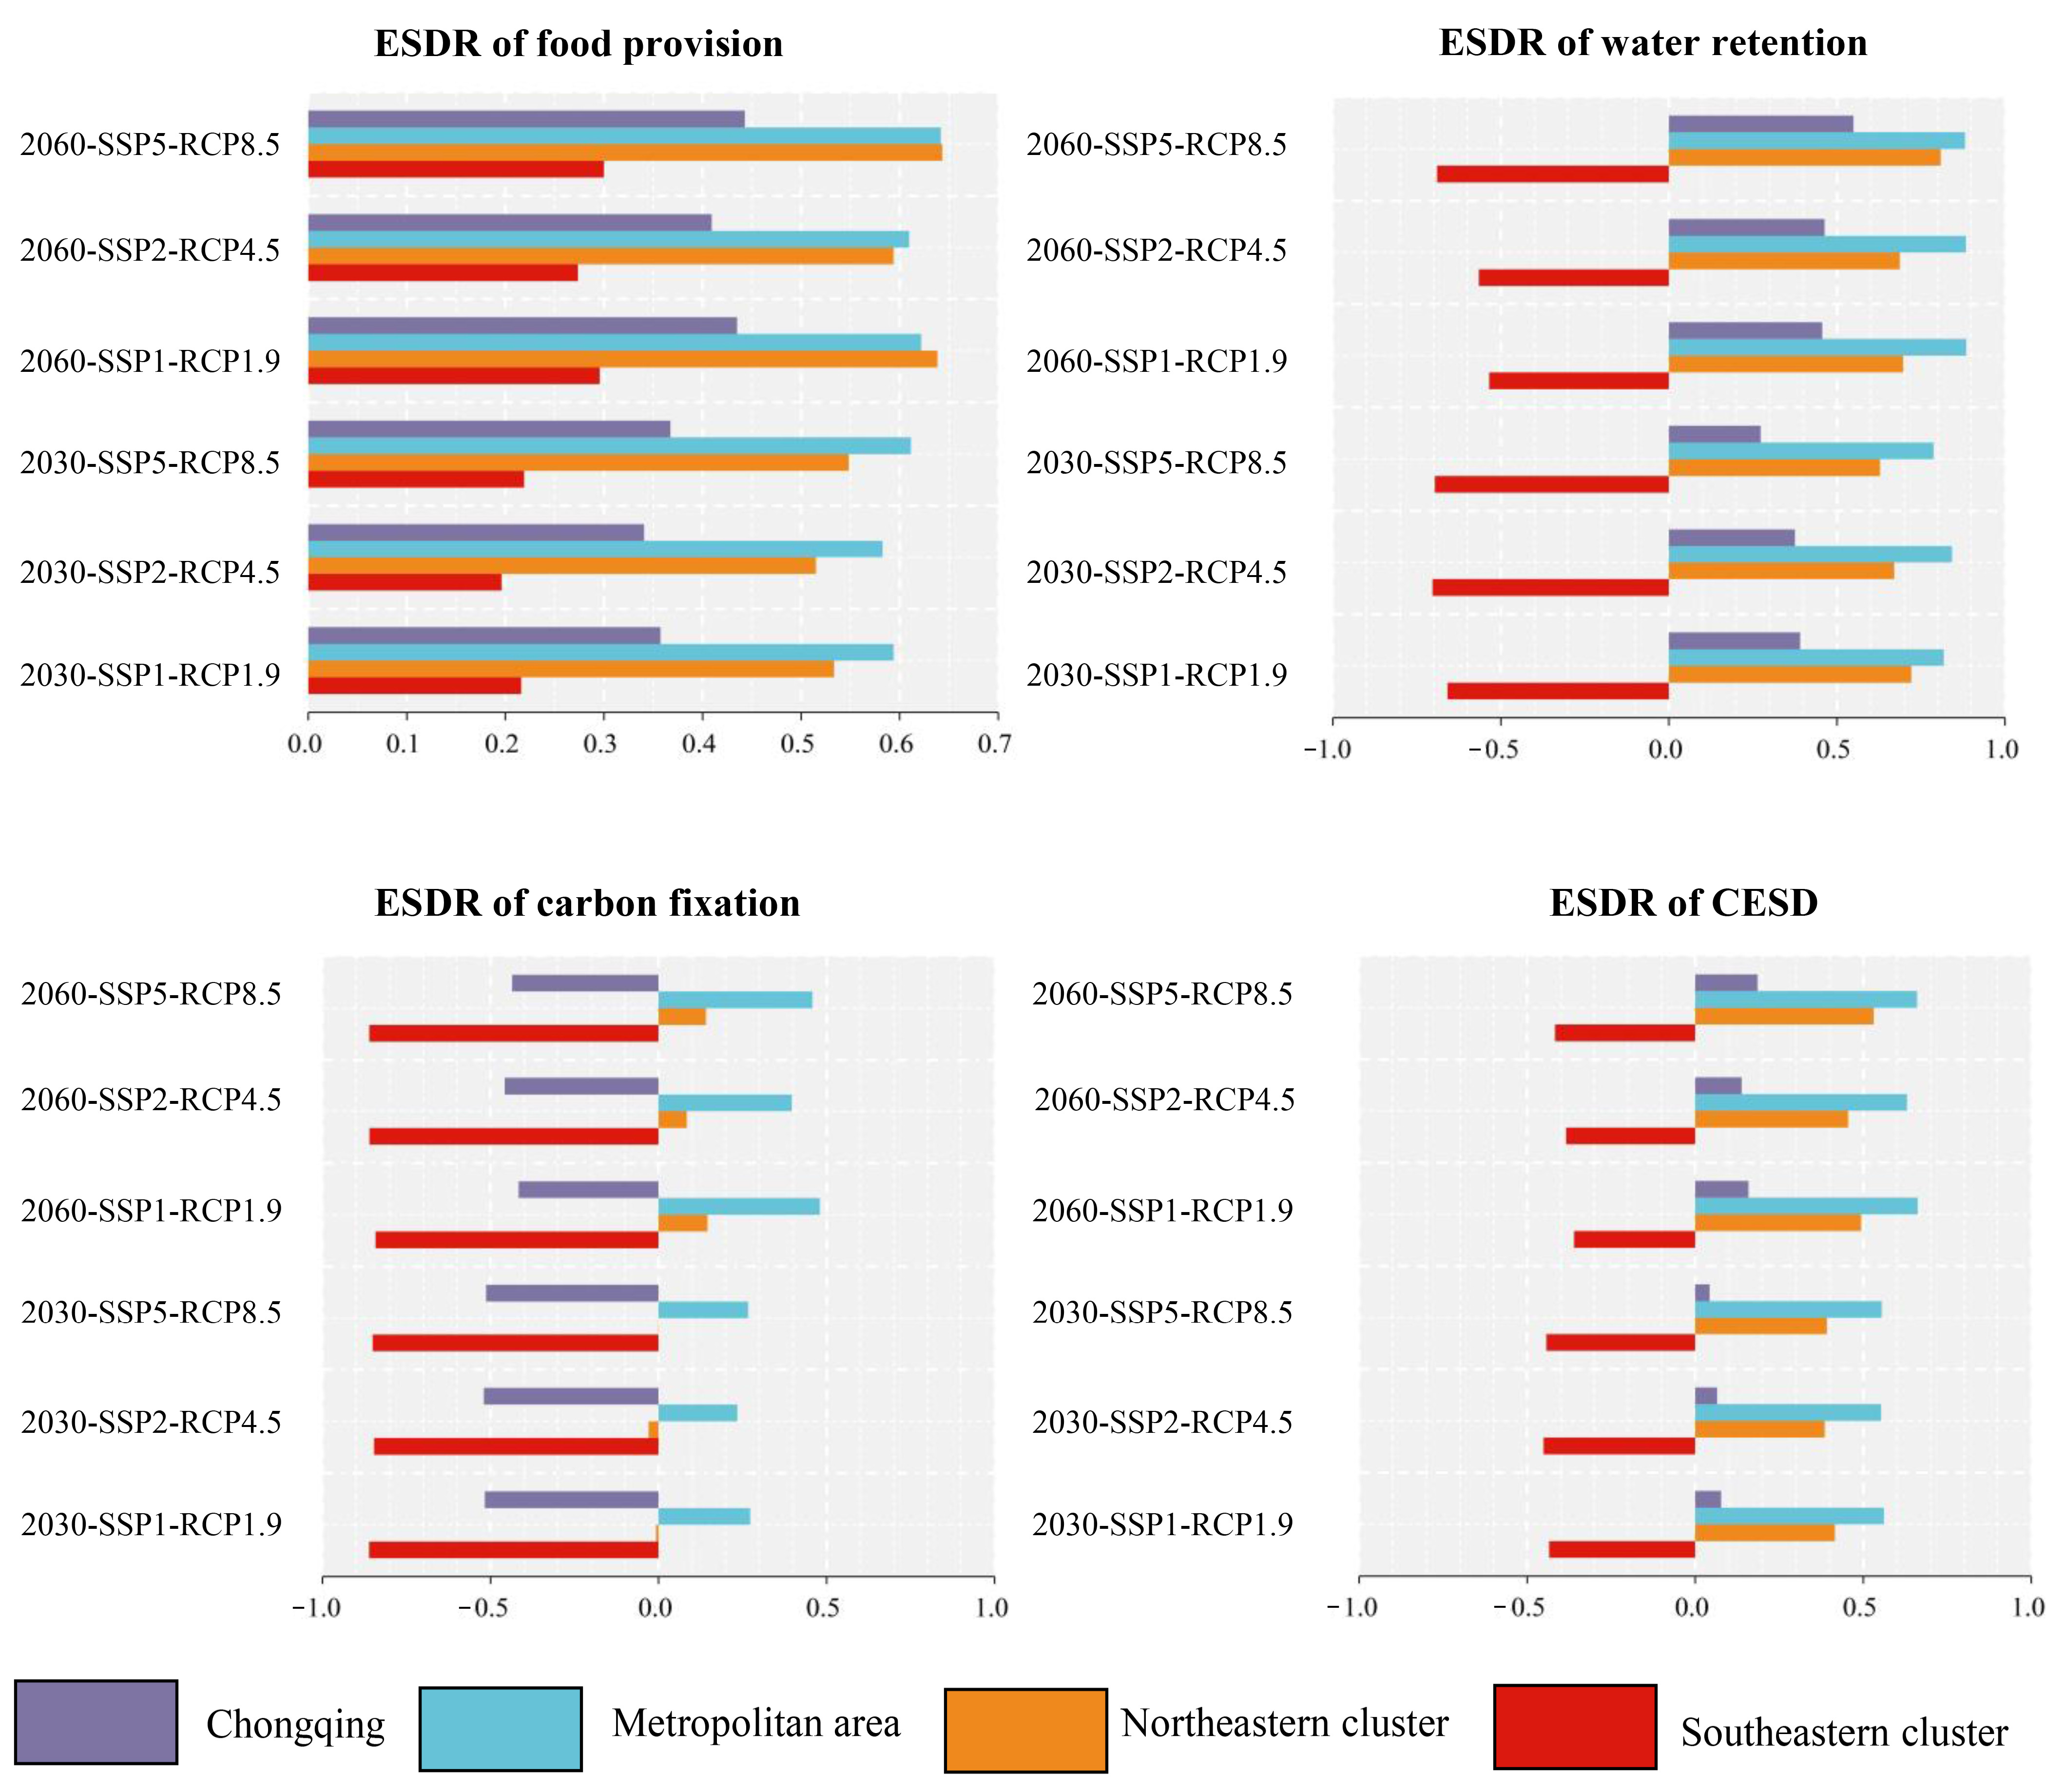
3.3. Projections Under SSP–RCP Scenarios

Figure 7 presents the projected values of supply and demand for food provision, water retention, and carbon fixation services in Chongqing under three scenarios. For the food provision service, the supply and demand forecasts for 2030 and 2060 show minimal differences across all scenarios, with the supply consistently outstripping demand by a considerable margin. The demand for food in 2060 is projected to be approximately 20 × 1012 kcal, which is 20% lower than that in 2030. The reduction is, to a significant extent, linked to China’s population approaching its peak and the anticipated transition into a period of negative population growth in the future. The forecasted results indicate that, under the SSP1 scenario, the population of Chongqing in 2060 (approximately 25 million people) will decrease by 22% compared to the baseline value in 2020. Moreover, the adoption of healthier dietary habits, with a gradual reduction in the consumption of calorie-rich staple foods and meat products and an increase in the consumption of low-calorie foods such as vegetables, fruits, and dairy products, will also contribute to a decrease in overall calorie demand. For the water retention service, the projected supply varies significantly among the different scenarios. Under the SSP5–RCP8.5 scenario, the supply is anticipated to increase by 82.76% from 2030 to 2060, while in the other two scenarios, the increase is only 5% and 10%. This discrepancy arises primarily due to the estimated average annual rainfall in Chongqing reaching 1516 mm in the SSP5–RCP8.5 scenario, which is 1.5 times higher than that in 2015. From the demand perspective, there is minimal variation among the different scenarios, with a slight decrease observed across all the scenarios. This decrease is largely due to the decline in population and the transformation of the industrial structure, which have led to a diminished industrial value added and an enhancement in water use efficiency. For the carbon fixation service, all scenarios forecast that carbon fixation levels will remain below carbon emissions for both 2030 and 2060, necessitating additional measures to achieve the goal of carbon neutrality of Chongqing. From the supply perspective, the carbon fixation quantities are anticipated to hold steady across all scenarios, with land use types being the principal influencers. The projections show that there will be no significant shifts in land use types. From the demand perspective, the reduction in population will lead to a significant decrease in carbon emissions in 2060 compared to 2030 across all scenarios, with a decrease of approximately 20%. However, in every scenario, carbon emissions continue to substantially exceed the capacity of the supply side to mitigate, underscoring the persistent challenge of aligning emissions with carbon fixation efforts.
Figure 8 presents the projected outcomes of the supply–demand ratio for ES in Chongqing for the years 2030 and 2060 under different scenarios. It is noteworthy that compared to other scenarios, the CESD value for the SSP1–RCP1.9 scenario in 2060 is relatively high, standing at 0.189. Conversely, it is observed that the CESD value for the SSP5–RCP8.5 scenario in 2030 is relatively low, standing at 0.037 (Table S11). The spatial distribution of the ES supply–demand ratio reveals that the water retention service and carbon fixation service exhibit similar patterns between 2030 and 2060. The regions with high supply–demand ratios are primarily concentrated in the northeast and southeast areas of Chongqing, gradually decreasing toward the west. Conversely, the central city and western region display low supply–demand ratios due to the prevalence of farmland and construction land as predominant land use types, coupled with high demand stemming from dense population concentrations. Specifically, in the aforementioned regions under the SSP1–RCP1.9 scenario, among the 21 districts and counties, 20 exhibit supply–demand ratios below 0 for water retention and carbon fixation, with the exception of Nanchuan District. These findings are in line with the spatial distribution of CESD.

4. Discussion

4.1. Mismatch in ES Supply and Demand

Being the sole city directly under the central government in western China, Chongqing has actively facilitated the establishment of the “Chengdu-Chongqing Economic Circle”. This initiative is expected to inevitably exert certain influences on the regional ecosystem and environment. Therefore, it becomes imperative to analyze the characteristics of ES supply and demand throughout the process of development. The study’s findings reveal that Chongqing’s ecosystem services overall show a positive trend in supply and demand dynamics, with services like food provision, water retention, and soil conservation consistently having a surplus of supply compared to demand. Nonetheless, it is essential to acknowledge that the supply and demand of ecosystem services in Chongqing are characterized by imbalances, displaying pronounced spatial heterogeneity. Localized regions, particularly the central city and adjacent counties, experience a scarcity of supply compared to demand. These areas are generally characterized by robust economic development and dense population concentrations and, at the same time, concentrate the majority of industrial enterprises in the region, with high consumption of resources such as energy and water as well as high emissions of pollutants and high demand for ES. Therefore, for such areas, on the one hand, the land use structure should be adjusted to balance the allocation of construction land and green space, control the expansion rate of construction land, and, at the same time, establish greenways and parks in the central areas of the cities to increase the vegetation coverage; on the other hand, the industrial structure should be optimized, green development should be advocated for, and the proportion of clean energy in energy consumption should be increased so as to reduce the consumption of energy and carbon emissions. Moreover, effective water-saving measures to improve the efficiency of water consumption should be implemented [70]. On the contrary, the northeastern and southeastern regions of Chongqing exhibit conspicuous patterns of surplus supply. These regions encompass the Three Gorges reservoir area, the Qinba mountainous region, and the Wuling mountainous region. Predominantly characterized by mountainous topography, these areas assume vital ecological functions within China. They serve as the largest freshwater resource reserve and ecological security barrier in the upper reaches of the Yangtze River, while boasting high vegetation coverage. Moreover, these regions bear strategic responsibilities pertaining to regional soil and water conservation, freshwater reserves, the South-to-North Water Diversion Project, and biodiversity protection. These areas remain in a comparatively pristine natural state and exhibit an abundant ES supply. In recent years, there has been a marked rise in human development activities, which has unfortunately contributed to the degradation of ES functions in some regions. As a result, it is imperative to strictly regulate the intensity of human activities, control the pace of urban expansion, restrict the utilization of arable land with steep slopes, and concurrently foster the development of ecological tourism based on natural scenery.
Based on the computational results, Chongqing currently exhibits a food supply–demand surplus in food provisioning services, which presents a potential double-edged trap. On the positive side, this surplus reflects significant improvements in food self-sufficiency: Chongqing’s cereal production reached 7.54 million tons in 2020 compared to 4.28 million tons of consumption, achieving a self-sufficiency rate of 176%, while per capita vegetable availability at 707 kg far exceeds the national average of 588 kg. This enhanced self-sufficiency not only secures basic human subsistence needs but also forms the foundation for improving public well-being and societal stability. Additionally, it strengthens the resilience of agricultural-related industries—Chongqing’s agricultural product processing sector, a key economic pillar, recorded an output value of CNY 340 billion in 2023, with municipal government targets aiming to exceed CNY 500 billion by 2027, relying heavily on the city’s abundant agricultural resources. However, this apparent success masks critical environmental challenges. First, excessive fertilizer application poses serious risks: in 2020, Chongqing’s fertilizer use intensity reached 266 kg/ha, significantly surpassing global averages, with particularly acute over-application in high-value crops like vegetables and fruit trees. Paradoxically, this has not translated into proportional yield increases—instead, declining crop productivity per unit fertilizer input has been observed alongside escalating nonpoint source pollution, eroding marginal economic benefits. Second, Chongqing’s inherently fragile arable land resources compound these issues: sloped farmland exceeding 15° accounts for nearly 40% of total cultivated areas, including 17.3% classified as >25° slopes, with average soil quality ranking below national median levels. This creates significant risks of soil erosion, which is particularly concerning given Chongqing’s location in the core area of the Three Gorges Reservoir Basin, which poses threats to regional ecological security.
Notably, carbon fixation constitutes the sole ecosystem service exhibiting a supply–demand deficit among the four investigated categories. This disparity stems from three interconnected drivers: The first one is energy structure inertia, characterized by coal dominance (39.31 million tons of standard coal, 51.6% of 2020 energy consumption), particularly in thermal power generation (80% electricity mix), resulting in carbon intensity (1.98 tCO2/104 CNY GDP) surpassing ecosystem sequestration rates (0.12 tCO2/ha/yr). The second reason is carbon sink displacement through urbanization, with 1325 km2 of carbon-sequestering lands (forests/grasslands) converted to built-up areas during 2000–2020, equivalent to a 2.76 MtCO2 annual sequestration loss. The third one is carbon sink degradation from artificial afforestation replacing natural forests, given natural forests’ 40-fold superior carbon sequestration capacity compared to plantations, while regenerated forests require several decades to a century to achieve primary forest sequestration levels [71,72]. These anthropogenic pressures have exacerbated climate vulnerabilities, as evidenced by Chongqing’s record-breaking 2024 heat extremes—annual high-temperature days (>35 °C) and consecutive heatwave duration surpassed all records since systematic meteorological observations began in 1961, peaking at 43.6 °C.

4.2. The Impact of Different SSP–RCP Scenario in Future

The SSP–RCP scenario matrix presents various combinations of future development scenarios that encompass distinct climatic and human activity factors. These factors contribute to variations in the supply and demand of ES across different scenarios. In this study, three scenarios were selected according to the probability of its occurrence in China [73,74,75]. The SSP1–RCP1.9 scenario represents a low-forcing scenario, epitomizing an environmentally sustainable development pathway with a focus on green sustainable practices. On the other hand, the SSP2–RCP4.5 scenario represents a compromise pathway characterized by moderate social vulnerability and climate challenges. In stark contrast, the SSP5–RCP8.5 scenario embodies an energy-intensive, fossil-fuel-based economic development trajectory, which consequently faces significant challenges in climate change mitigation. A strong relationship exists between climate change and ES, whereby climate change influences ES through alterations in land use and vegetation cover. China, being the world’s largest carbon emitter, has pledged to reach peak CO2 emissions by 2030 and strive for carbon neutrality by 2060. As illustrated in Figure 9 of this study, the supply–demand ratio for integrated ES is observed to peak in the SSP1–RCP1.9 scenario by the year 2060. Under the conditions of this scenario, the health and balance of Chongqing’s ecosystems are likely to be in a relatively favorable state, which corresponds to the targeted outcomes for future sustainable development. Conversely, the SSP5–RCP8.5 scenario exhibits a relatively low ES supply–demand ratio; thereby, the need for further emphasizing the criticality of mitigating temperature rise is underscored, as doing so is essential for diminishing the potential negative impacts on its ecosystem services.

4.3. Uncertainty Analysis and Future Research Directions

The findings regarding the relationship between ES supply and demand in Chongqing, as well as the future projections, were compared with existing studies, and it was observed that the outcomes of this research align well with previous investigations, thus reinforcing the reliability of this study [73,75,76]. Nevertheless, certain limitations associated with missing data, data accuracy, and parameter settings in the calculations introduce some level of uncertainty to the research results. Firstly, due to constraints in time and resources, this study did not utilize continuous data for calculations but relied on three discrete time points to reflect temporal changes. The accuracy in capturing the trend of changes may be compromised. Secondly, the calculation method employed for the demand side of this study was relatively simplistic, relying on certain assumptions, thereby warranting further enhancement to enhance its precision. Thirdly, the data on per capita carbon emissions for the districts and counties of Chongqing for the year 2020 were not obtained. Instead, this study relied on the most recent available data from 2017, as provided by CEADS. Furthermore, as data pertaining to water use efficiency and carbon emissions per capita under each scenario were not obtained for the projections, it was assumed that these values would remain constant at their 2020 levels. This assumption might have implications for the results. Fourth, the study’s calculation process incorporated various types of geographic data and the resolution of some datasets may have a potential impact on the accuracy of the results. Finally, the SSP–RCP scenarios in the model mainly originate from the Chongqing-related part of the global or China-scale data, and a future social–economic scenario set based on local data of Chongqing has not been constructed yet.
Furthermore, future research trajectories are delineated through synthesizing current limitations and frontier challenges in ES supply–demand studies. Three strategic pathways are proposed: (1) Indicator system expansion: Incorporating nonmaterial services (e.g., cultural tourism) through geospatial flow modeling to quantify service transmission pathways across mountainous–urban interfaces. (2) Multimodel coupling: Developing an integrated CLUE-S (the conversion of land use and its effects at small regional extent) and SWAT (soil and water assessment tool) framework to simulate policy-driven transmission mechanisms of ES cascades under land-use regulatory scenarios. (3) Lifecycle flux analysis: Implementing material flow analysis (MFA) to trace ES trajectories along the “source-transmission-sink” continuum, with emphasis on telecoupling effects between Chongqing’s ecosystem provisioning and downstream Yangtze River Delta urban agglomerations. (4) Establish a set of self-sustainability indexes that take into account the natural recovery cycle of ES and quantify the cross-regional input ratio of ES and the degree of external dependence in each district and county. (5) Establish a socioeconomic scenario prediction model based on the future population, economy, and climate change scenarios in Chongqing and take into account the impacts of short-term extreme events on the supply and demand of ecosystem services (ES) within the model.

5. Conclusions and Policy Implications

ES encompass the direct and indirect benefits that humans derive from ecosystems, serving as a vital link between ecosystems and socioeconomic systems. Investigating the supply and demand of ES and their influencing factors holds practical significance in understanding the interaction between regional ecosystems and socioeconomic systems, identifying ecological issues specific to the region and promoting the sustainable development of regional ecosystems. This study aims to contribute to this research by first developing a model to assess the supply and demand of four representative ES in Chongqing. The spatial distribution characteristics of these ES are revealed through the model. Subsequently, the study explores the spatial heterogeneity of climate change and human activities and their impact on the change in ES supply, utilizing the GWR model. Lastly, the SSP–RCP scenario matrix is employed to predict the changes in ES supply and demand in Chongqing for 2030 and 2060 under different scenarios. The results of our study indicate that (1) both in the current situation and future projections, all four ES in Chongqing, except carbon fixation, exhibit a surplus of supply over demand. Moreover, the supply of ES has continued to increase from 2010 to 2020. The average CESD value in Chongqing increased from 0.260 in 2010 to 0.320 in 2020 and approximately 65% of the grid cells’ CESD value demonstrated varying increases. These findings suggest a favorable overall quality of Chongqing’s ecosystem. (2) However, there are localized areas experiencing a significant oversupply, particularly in proximity to urban centers. In 2020, 72.9% of the area with CESD values was below 0 in the central urban area. This phenomenon primarily arises from the spatial and temporal mismatch between rapid urbanization and ecological construction, driven by population and economic growth. (3) In general, climate change and human activities collectively contribute to changes in ES supply in Chongqing. The aridity index exhibited the strongest correlation with ES supply, with a coefficient of −0.743, followed by temperature and land use intensity. Consequently, it becomes crucial to be vigilant about the adverse impacts of climate extremes in future ecosystem conservation management. Additionally, it is imperative to consider the demand and carrying capacity of ES during the rapid urbanization process and expedite the development of ecosystem services as a supporting measure for rapid urbanization.
Based on the previous analysis of the supply–demand relationship of ecosystem services, driving factors, and scenario projections in Chongqing, the following policy recommendations are put forward to achieve the harmonious integration of ecological protection and economic development in Chongqing.
(1) In order to ensure food supply and reduce the harm to the ecosystem, future strategies should prioritize the following: first of all, technological upgrading to promote smart agriculture systems that enhance fertilizer/pesticide use efficiency; then the establishment of ecological fallow zones; and then the implementation of slope land conversion programs to restore forest cover on steeply graded cropland. These measures would balance agricultural productivity with environmental sustainability, aligning food provisioning goals with long-term ecosystem health objectives.
(2) In response to the supply–demand imbalance of carbon sequestration services in Chongqing, this paper proposes a comprehensive strategy that integrates three interrelated components: implementing near-natural forest transformation in mountainous regions to enhance unit carbon storage capacity while propagating vertical greening technologies in urban built-up areas to expand green space coverage; prioritizing energy structure transformation through scaling up installed capacities of photovoltaic, hydropower, and wind energy facilities to facilitate gradual substitution of coal consumption; and establishing a spatial management framework that designates core carbon sink resource zones with stringent regulatory mechanisms while exploring the implementation of a carbon offset system for construction land development. This integrated approach addresses both supply augmentation and demand reduction in carbon sequestration services through complementary technical, economic, and regulatory interventions.
(3) To address regional ecosystem service (ES) supply–demand mismatches, a tripartite strategy integrating spatial governance, ecological industrialization, and institutional innovation is proposed. For ES deficit zones (urban cores and county centers), spatial governance mechanisms should enforce rigid urban growth boundaries to curb uncontrolled land expansion, coupled with industrial restructuring to regulate energy-water intensive enterprises through emission-water use caps, thereby reducing carbon-water footprints. In northeastern/southeastern ecological function zones, negative list management must prohibit heavy industries, mining, and steep slope farming (>15°), while elevating ecological relocation compensation standards; concurrently, eco-industry transformation should monetize hydrological regulation and carbon sequestration capacities via market-based trading schemes, supported by air-space-ground integrated monitoring networks for real-time ES degradation alerts. Institutionally, a horizontal eco-compensation mechanism should mandate deficit-to-surplus zone fiscal transfers prioritized for natural forest conservation, complemented by embedding ES supply–demand ratios into cadres’ performance appraisal metrics.

Supplementary Materials

The following supporting information can be downloaded at: https://www.mdpi.com/article/10.3390/land14040788/s1. The Supplementary Materials are divided into three parts. The Section S1 introduces the data used in the article and their resolutions; the Section S2 presents the detailed algorithms for the supply and demand of four types of ecosystem services; and the Section S3 shows the calculation results of the supply and demand of ecosystem services in each district and county of Chongqing City for each year. References [77,78,79,80,81,82,83,84,85,86] are cited in Supplementary Materials.

Author Contributions

B.W., W.W. and H.J. designed the study; Y.D. conducted the calculations; Y.D., W.W. and R.X. conducted the analysis; Y.D., B.W. and R.X. drew the figures; Y.D., B.W., H.J. and W.W. wrote the paper. All authors provided critical input to the analyses and to the final version of the manuscript. All authors have read and agreed to the published version of the manuscript.

Funding

This paper is supported by the Chinese Academy of Engineering (2023-HYZD-04), the Chongqing Ecological Environment Bureau Research Project (No. 2023-001), and the Research on Ecology-oriented Development (EOD) and the Development of Ecological Industries (CSTB2022TIAD-GPX0048).

Data Availability Statement

Data are contained within the article and Supplementary Materials.

Acknowledgments

We thank Bo Lei and Guoxia Ma for their constructive comments. We also thank the editors and anonymous reviewers for their valuable comments and suggestions on our paper.

Conflicts of Interest

The authors declare that they have no known competing financial interests or personal relationships that could have appeared to influence the work reported in this paper.

References

  1. Dooley, E.E. Millennium ecosystem assessment. Environ. Health Perspect. 2005, 113, A591. [Google Scholar] [CrossRef]
  2. Costanza, R.; Arge, R.D.; de Groot, R.; Farber, S.; Grasso, M.; Hannon, B.; Limburg, K.; Naeem, S.; Robert, V.; O’Neill, R.D.; et al. The value of the world’s ecosystem services and natural capital (cover story). Nature 1997, 387, 253–260. [Google Scholar] [CrossRef]
  3. Ehrlich, P.; Ehrlich, A. Extinction: The Causes and Consequences of the Disappearance of Species. Q. Rev. Biol. 1981, 40, 82–85. [Google Scholar]
  4. Finlayson, C.M. The Economics of Ecosystems and Biodiversity (TEEB). In The Wetland Book: I: Structure and Function, Management, and Methods; Finlayson, C.M., Everard, M., Irvine, K., McInnes, R.J., Middleton, B.A., van Dam, A.A., Davidson, N.C., Eds.; Springer: Heidelberg, Germany, 2018; pp. 335–339. [Google Scholar]
  5. Maes, J.; Liquete, C.; Teller, A.; Erhard, M.; Paracchini, M.L.; Barredo, J.I.; Grizzetti, B.; Cardoso, A.; Somma, F.; Petersen, J.E.; et al. An indicator framework for assessing ecosystem services in support of the eu biodiversity strategy to 2020. Ecosyst. Serv. 2016, 17, 14–23. [Google Scholar] [CrossRef]
  6. Harwell, M.C.; Jackson, C.A. Synthesis of Two Decades of US EPA’s Ecosystem Services Research to Inform Environmental, Community, and Sustainability Decision Making. Sustainability 2021, 13, 8249. [Google Scholar] [CrossRef]
  7. Cork, S.J.; Shelton, D. The Nature and Value of Australia’s Ecosystem Services: A Framework for Sustainable Environmental Solutions. In Proceedings of the 3rd Queensland Environmental Conference: Sustainable Environmental Solutions for Industry and Government; a Focus of Sound, Practical and Economically Viable Solutions for Industry and Government, Brisbane, QLD, Australia, 1 January 2000; pp. 151–159. [Google Scholar]
  8. Hanes, R.J.; Gopalakrishnan, V.; Bakshi, B.R. Synergies and trade-offs in renewable energy landscapes: Balancing energy production with economics and ecosystem services. Appl. Energy 2017, 199, 25–44. [Google Scholar] [CrossRef]
  9. Ni, Y.C.; Wei, J.X.; Wu, T.; Guo, M.; Han, Q.Y.; Zhang, M.J. Mapping and assessing ecosystem service supply-demand to identify critical areas: A case study of a waterside area in Shanghai metropolitan area. Front. Earth Sci. 2022, 10, 943910. [Google Scholar] [CrossRef]
  10. Ouyang, Z.Y.; Song, C.S.; Zheng, H.; Polasky, S.; Xiao, Y.; Bateman, I.J.; Liu, J.G.; Ruckelshaus, M.; Shi, F.Q.; Xiao, Y.; et al. Using gross ecosystem product (GEP) to value nature in decision making. Proc. Natl. Acad. Sci. USA 2020, 117, 14593–14601. [Google Scholar] [CrossRef]
  11. Wang, D.; Liang, Y.J.; Peng, S.Z.; Yin, Z.C.; Huang, J.J. Integrated assessment of the supply-demand relationship of ecosystem services in the Loess Plateau during 1992–2015. Ecosyst. Health Sustain. 2022, 8, 2130093. [Google Scholar] [CrossRef]
  12. Wang, Z.F. Evolving landscape-urbanization relationships in contemporary China. Landsc. Urban Plan. 2018, 171, 30–41. [Google Scholar] [CrossRef]
  13. Tao, Y.; Li, F.; Crittenden, J.C.; Lu, Z.M.; Sun, X. Environmental Impacts of China’s Urbanization from 2000 to 2010 and Management Implications. Environ. Manag. 2016, 57, 498–507. [Google Scholar] [CrossRef]
  14. Jiang, H.; Peng, J.; Dong, J.Q.; Zhang, Z.M.; Xu, Z.H.; Meersmans, J. Linking ecological background and demand to identify ecological security patterns across the Guangdong-Hong Kong-Macao Greater Bay Area in China. Landsc. Ecol. 2021, 36, 2135–2150. [Google Scholar] [CrossRef]
  15. Li, X.; Yu, X.; Wu, K.N.; Feng, Z.; Liu, Y.N.; Li, X.L. Land-use zoning management to protecting the Regional Key Ecosystem Services: A case study in the city belt along the Chaobai River, China. Sci. Total Environ. 2021, 762, 143167. [Google Scholar] [CrossRef] [PubMed]
  16. Meng, Q.X.; Zhang, L.K.; Wei, H.J.; Cai, E.X.; Xue, D.; Liu, M.X. Linking Ecosystem Service Supply-Demand Risks and Regional Spatial Management in the Yihe River Basin, Central China. Land 2021, 10, 843. [Google Scholar] [CrossRef]
  17. Zhuang, Z.C.; Li, C.; Hsu, W.L.; Gu, S.H.; Hou, X.S.; Zhang, C.M. Spatiotemporal Changes in the Supply and Demand of Ecosystem Services in China’s Huai River Basin and Their Influencing Factors. Water 2022, 14, 2559. [Google Scholar] [CrossRef]
  18. Xie, G.D.; Zhang, C.X.; Zhang, L.M.; Chen, W.H.; Li, S. Improvement of the evaluation method for ecosystem service value based on per unit area. J. Nat. Resour 2015, 30, 1243–1254. [Google Scholar] [CrossRef]
  19. Wang, B.J.; Tang, H.P.; Zhang, Q.; Cui, F.Q. Exploring Connections among Ecosystem Services Supply, Demand and Human Well-Being in a Mountain-Basin System, China. Int. J. Environ. Res. Public Health 2020, 17, 5309. [Google Scholar] [CrossRef]
  20. Wang, J.; Zhai, T.L.; Lin, Y.F.; Kong, X.S.; He, T. Spatial imbalance and changes in supply and demand of ecosystem services in China. Sci. Total Environ. 2019, 657, 781–791. [Google Scholar] [CrossRef]
  21. Zhao, H.; Li, C.; Gao, M.H. Investigation of the Relationship between Supply and Demand of Ecosystem Services and the Influencing Factors in Resource-Based Cities in China. Sustainability 2023, 15, 7397. [Google Scholar] [CrossRef]
  22. Shen, J.S.; Li, S.C.; Wang, H.; Wu, S.Y.; Liang, Z.; Zhang, Y.T.; Wei, F.L.; Li, S.; Ma, L.; Wang, Y.Y.; et al. Understanding the spatial relationships and drivers of ecosystem service supply-demand mismatches towards spatially-targeted management of social-ecological system. J. Clean. Prod. 2023, 406, 136882. [Google Scholar] [CrossRef]
  23. Wei, W.; Nan, S.X.; Xie, B.B.; Liu, C.F.; Zhou, J.J.; Liu, C.Y. The spatial-temporal changes of supply-demand of ecosystem services and ecological compensation: A case study of Hexi Corridor, Northwest China. Ecol. Eng. 2023, 187, 106861. [Google Scholar] [CrossRef]
  24. Zhao, C.; Xiao, P.N.; Qian, P.; Xu, J.; Yang, L.; Wu, Y.X. Spatiotemporal Differentiation and Balance Pattern of Ecosystem Service Supply and Demand in the Yangtze River Economic Belt. Int. J. Environ. Res. Public Health 2022, 19, 7223. [Google Scholar] [CrossRef]
  25. Men, D.; Pan, J.H.; Sun, X.W. Spatial and temporal patterns of supply and demand risk for ecosystem services in the Weihe River Main Stream, NW China. Environ. Sci. Pollut. Res. 2022, 30, 36952–36966. [Google Scholar] [CrossRef] [PubMed]
  26. Chen, F.Y.; Li, L.; Niu, J.Q.; Lin, A.W.; Chen, S.Y.; Hao, L. Evaluating Ecosystem Services Supply and Demand Dynamics and Ecological Zoning Management in Wuhan, China. Int. J. Environ. Res. Public Health 2019, 16, 2332. [Google Scholar] [CrossRef]
  27. Shui, W.; Wu, K.X.; Du, Y.; Yang, H.F. The Trade-Offs between Supply and Demand Dynamics of Ecosystem Services in the Bay Areas of Metropolitan Regions: A Case Study in Quanzhou, China. Land 2022, 11, 22. [Google Scholar] [CrossRef]
  28. Yan, X.L.; Liu, C.H.; Han, Z.L.; Li, X.Y.; Zhong, J.Q. Spatiotemporal assessment of ecosystem services supply-demand relationships to identify ecological management zoning in coastal city Dalian, China. Environ. Sci. Pollut. Res. 2023, 30, 63464–63478. [Google Scholar] [CrossRef] [PubMed]
  29. Zhou, L.L.; Zhang, H.Z.; Bi, G.H.; Su, K.C.; Wang, L.; Chen, H.J.; Yang, Q.Y. Multiscale perspective research on the evolution characteristics of the ecosystem services supply-demand relationship in the chongqing section of the three gorges reservoir area. Ecol. Indic. 2022, 142, 109227. [Google Scholar] [CrossRef]
  30. Wu, X.; Liu, S.L.; Zhao, S.; Hou, X.Y.; Xu, J.W.; Dong, S.K.; Liu, G.H. Quantification and driving force analysis of ecosystem services supply, demand and balance in China. Sci. Total Environ. 2019, 652, 1375–1386. [Google Scholar] [CrossRef]
  31. Luo, Z.L.; Zuo, Q.T.; Shao, Q.X. A new framework for assessing river ecosystem health with consideration of human service demand. Sci. Total Environ. 2018, 640, 442–453. [Google Scholar] [CrossRef]
  32. Jing, Y.C.; Chen, L.; Sun, R. A theoretical research framework for ecological security pattern construction based on ecosystem services supply and demand. Acta Ecol. Sin. 2018, 38, 4121–4131. [Google Scholar]
  33. Xiao, P.N.; Zhao, C.; Zhou, Y.; Feng, H.Y.; Li, X.G.; Jiang, J.H. Study on Land Consolidation Zoning in Hubei Province Based on the Coupling of Neural Network and Cluster Analysis. Land 2021, 10, 756. [Google Scholar] [CrossRef]
  34. Zhang, Y.C.; Chen, Z.; Zhang, Y.; Mei, M. Urban Ecological Importance Assessment Based on Ecological Function and Ecological Demand:A Case Study of Changsha. Resour. Environ. Yangtze Basin 2018, 27, 2358–2367. [Google Scholar]
  35. Liu, W.; Zhan, J.Y.; Zhao, F.; Wang, C.; Zhang, F.; Teng, Y.M.; Chu, X.; Kumi, M.A. Spatio-temporal variations of ecosystem services and their drivers in the Pearl River Delta, China. J. Clean. Prod. 2022, 337, 130466. [Google Scholar] [CrossRef]
  36. Yan, K.; Wang, W.F.; Li, Y.H.; Wang, X.F.; Jin, J.X.; Jiang, J.; Yang, H.Q.; Wang, L.J. Identifying priority conservation areas based on ecosystem services change driven by Natural Forest Protection Project in Qinghai province, China. J. Clean. Prod. 2022, 362, 132453. [Google Scholar] [CrossRef]
  37. Guo, B.; Zang, W.Q.; Luo, W. Spatial-temporal shifts of ecological vulnerability of Karst Mountain ecosystem-impacts of global change and anthropogenic interference. Sci. Total Environ. 2020, 741, 140256. [Google Scholar] [CrossRef]
  38. Lv, X.J.; Xiao, W.; Zhao, Y.L.; Zhang, W.K.; Li, S.C.; Sun, H.X. Drivers of spatio-temporal ecological vulnerability in an arid, coal mining region in Western China. Ecol. Indic. 2019, 106, 105475. [Google Scholar] [CrossRef]
  39. Ming, L.; Chang, J.; Li, C.; Chen, Y.D.; Li, C.K. Spatial-Temporal Patterns of Ecosystem Services Supply-Demand and Influencing Factors: A Case Study of Resource-Based Cities in the Yellow River Basin, China. Int. J. Environ. Res. Public Health 2022, 19, 16100. [Google Scholar] [CrossRef] [PubMed]
  40. Wang, L.J.; Gong, J.W.; Ma, S.; Wu, S.; Zhang, X.M.; Jiang, J. Ecosystem service supply-demand and socioecological drivers at different spatial scales in Zhejiang Province, China. Ecol. Indic. 2022, 140, 109058. [Google Scholar] [CrossRef]
  41. Mashizi, A.K.; Sharafatmandrad, M. Investigating tradeoffs between supply, use and demand of ecosystem services and their effective drivers for sustainable environmental management. J. Environ. Manag. 2021, 289, 112534. [Google Scholar] [CrossRef]
  42. Spake, R.; Lasseur, R.; Crouzat, E.; Bullock, J.M.; Lavorel, S.; Parks, K.E.; Schaafsma, M.; Bennett, E.M.; Maes, J.; Mulligan, M.; et al. Unpacking ecosystem service bundles: Towards predictive mapping of synergies and trade-offs between ecosystem services. Glob. Environ. Change-Hum. Policy Dimens. 2017, 47, 37–50. [Google Scholar] [CrossRef]
  43. Lu, H.T.; Yan, Y.; Zhu, J.Y.; Jin, T.T.; Liu, G.H.; Wu, G.; Stringer, L.C.; Dallimer, M. Spatiotemporal Water Yield Variations and Influencing Factors in the Lhasa River Basin, Tibetan Plateau. Water 2020, 12, 1498. [Google Scholar] [CrossRef]
  44. Su, C.H.; Fu, B.J. Evolution of ecosystem services in the Chinese Loess Plateau under climatic and land use changes. Glob. Planet. Change 2013, 101, 119–128. [Google Scholar] [CrossRef]
  45. Underwood, E.C.; Hollander, A.D.; Safford, H.D.; Kim, J.B.; Srivastava, L.; Drapek, R.J. The impacts of climate change on ecosystem services in southern California. Ecosyst. Serv. 2019, 39, 101008. [Google Scholar] [CrossRef]
  46. Streimikiene, D.; Balezentis, T.; Krisciukaitiene, I. Promoting interactions between local climate change mitigation, sustainable energy development, and rural development policies in Lithuania. Energy Policy 2012, 50, 699–710. [Google Scholar] [CrossRef]
  47. Pham, H.V.; Sperotto, A.; Torresan, S.; Acuna, V.; Jorda-Capdevila, D.; Rianna, G.; Marcomini, A.; Critto, A. Coupling scenarios of climate and land-use change with assessments of potential ecosystem services at the river basin scale. Ecosyst. Serv. 2019, 40, 101045. [Google Scholar] [CrossRef]
  48. Salimi, S.; Scholz, M. Impact of future climate scenarios on peatland and constructed wetland water quality: A mesocosm experiment within climate chambers. J. Environ. Manag. 2021, 289, 112459. [Google Scholar] [CrossRef]
  49. Schirpke, U.; Kohler, M.; Leitinger, G.; Fontana, V.; Tasser, E.; Tappeiner, U. Future impacts of changing land-use and climate on ecosystem services of mountain grassland and their resilience. Ecosyst. Serv. 2017, 26, 79–94. [Google Scholar] [CrossRef]
  50. Hamlet, A.F.; Lee, S.Y.; Mickelson, K.E.B.; Elsner, M.M. Effects of projected climate change on energy supply and demand in the Pacific Northwest and Washington State. Clim. Chang. 2010, 102, 103–128. [Google Scholar] [CrossRef]
  51. Raymond, L.; Gotham, D.; McClain, W.; Mukherjee, S.; Nateghi, R.; Preckel, P.V.; Schubert, P.; Singh, S.; Wachs, E. Projected climate change impacts on Indiana’s Energy demand and supply. Clim. Chang. 2020, 163, 1933–1947. [Google Scholar] [CrossRef]
  52. Wei, H.J.; Fan, W.G.; Wang, X.C.; Lu, N.C.; Dong, X.B.; Zhao, Y.N.; Ya, X.J.; Zhao, Y.F. Integrating supply and social demand in ecosystem services assessment: A review. Ecosyst. Serv. 2017, 25, 15–27. [Google Scholar] [CrossRef]
  53. Larondelle, N.; Lauf, S. Balancing demand and supply of multiple urban ecosystem services on different spatial scales. Ecosyst. Serv. 2016, 22, 18–31. [Google Scholar] [CrossRef]
  54. Ala-Hulkko, T.; Kotavaara, O.; Alahuhta, J.; Hjort, J. Mapping supply and demand of a provisioning ecosystem service across Europe. Ecol. Indic. 2019, 103, 520–529. [Google Scholar] [CrossRef]
  55. Li, K.; Hou, Y.; Andersen, P.S.; Xin, R.H.; Rong, Y.J.; Skov-Petersen, H. An ecological perspective for understanding regional integration based on ecosystem service budgets, bundles, and flows: A case study of the Jinan metropolitan area in China. J. Environ. Manag. 2022, 305, 114371. [Google Scholar] [CrossRef]
  56. Brunsdon, C.; Fotheringham, A.S.; Charlton, M.E. Geographically Weighted Regression: A Method for Exploring Spatial Nonstationarity. Geogr. Anal. 1996, 28, 281–298. [Google Scholar] [CrossRef]
  57. Hezaveh, A.M.; Arvin, R.; Cherry, C.R. A geographically weighted regression to estimate the comprehensive cost of traffic crashes at a zonal level. Accid. Anal. Prev. 2019, 131, 15–24. [Google Scholar] [CrossRef] [PubMed]
  58. Pan, Z.Z.; Gao, G.Y.; Fu, B.J. Spatiotemporal changes and driving forces of ecosystem vulnerability in the Yangtze River Basin, China: Quantification using habitat-structure-function framework. Sci. Total Environ. 2022, 835, 155494. [Google Scholar] [CrossRef]
  59. Qu, S.; Wang, L.; Lin, A.; Yu, D.; Yuan, M.; Li, C.a. Distinguishing the impacts of climate change and anthropogenic factors on vegetation dynamics in the Yangtze River Basin, China. Ecol. Indic. 2020, 108, 105724. [Google Scholar] [CrossRef]
  60. Change, N.C. The CMIP6 landscape. Nat. Clim. Chang. 2019, 9, 727. [Google Scholar] [CrossRef]
  61. O’Neill, B.C.; Kriegler, E.; Ebi, K.L.; Kemp-Benedict, E.; Riahi, K.; Rothman, D.S.; van Ruijven, B.J.; van Vuuren, D.P.; Birkmann, J.; Kok, K.; et al. The roads ahead: Narratives for shared socioeconomic pathways describing world futures in the 21st century. Glob. Environ. Change-Hum. Policy Dimens. 2017, 42, 169–180. [Google Scholar] [CrossRef]
  62. Arnell, N.W.; Lloyd-Hughes, B. The global-scale impacts of climate change on water resources and flooding under new climate and socio-economic scenarios. Clim. Chang. 2014, 122, 127–140. [Google Scholar] [CrossRef]
  63. Rogelj, J.; Popp, A.; Calvin, K.V.; Luderer, G.; Emmerling, J.; Gernaat, D.; Fujimori, S.; Strefler, J.; Hasegawa, T.; Marangoni, G.; et al. Scenarios towards limiting global mean temperature increase below 1.5 degrees C. Nat. Clim. Chang. 2018, 8, 325–332. [Google Scholar] [CrossRef]
  64. Cook, B.I.; Mankin, J.S.; Marvel, K.; Williams, A.P.; Smerdon, J.E.; Anchukaitis, K.J. Twenty-First Century Drought Projections in the CMIP6 Forcing Scenarios. Earths Future 2020, 8, e2019EF001461. [Google Scholar] [CrossRef]
  65. Thomson, A.M.; Calvin, K.V.; Smith, S.J.; Kyle, G.P.; Volke, A.; Patel, P.; Delgado-Arias, S.; Bond-Lamberty, B.; Wise, M.A.; Clarke, L.E.; et al. RCP4.5: A pathway for stabilization of radiative forcing by 2100. Clim. Chang. 2011, 109, 77–94. [Google Scholar] [CrossRef]
  66. Riahi, K.; Rao, S.; Krey, V.; Cho, C.H.; Chirkov, V.; Fischer, G.; Kindermann, G.; Nakicenovic, N.; Rafaj, P. RCP 8.5-A scenario of comparatively high greenhouse gas emissions. Clim. Chang. 2011, 109, 33–57. [Google Scholar] [CrossRef]
  67. Scheiter, S.; Kumar, D.; Corlett, R.T.; Gaillard, C.; Langan, L.; Lapuz, R.S.; Martens, C.; Pfeiffer, M.; Tomlinson, K.W. Climate change promotes transitions to tall evergreen vegetation in tropical Asia. Glob. Chang. Biol. 2020, 26, 5106–5124. [Google Scholar] [CrossRef] [PubMed]
  68. Fahrig, L. Effects of habitat fragmentation on biodiversity. Annu. Rev. Ecol. Evol. Syst. 2003, 34, 487–515. [Google Scholar] [CrossRef]
  69. Micheli, F.; Mumby, P.J.; Brumbaugh, D.R.; Broad, K.; Dahlgren, C.P.; Harborne, A.R.; Holmes, K.E.; Kappel, C.V.; Litvin, S.Y.; Sanchirico, J.N. High vulnerability of ecosystem function and services to diversity loss in Caribbean coral reefs. Biol. Conserv. 2014, 171, 186–194. [Google Scholar] [CrossRef]
  70. Lu, Z.Y.F.; Li, W.; Yue, R.W. Investigation of the long-term supply-demand relationships of ecosystem services at multiple scales under SSP-RCP scenarios to promote ecological sustainability in China’s largest city cluster. Sustain. Cities Soc. 2024, 104, 105295. [Google Scholar] [CrossRef]
  71. Lewis, S.L.; Wheeler, C.E.; Mitchard, E.T.A.; Koch, A. Regenerate natural forests to store carbon. Nature 2019, 568, 25–28. [Google Scholar] [CrossRef]
  72. Hua, F.; Bruijnzeel, L.A.; Meli, P.; Martin, P.A.; Zhang, J.; Nakagawa, S.; Miao, X.; Wang, W.; McEvoy, C.; Peña-Arancibia, J.L.; et al. The biodiversity and ecosystem service contributions and trade-offs of forest restoration approaches. Science 2022, 376, 839–844. [Google Scholar] [CrossRef]
  73. Lu, H.T.; Stringer, L.C.; Yan, Y.; Wang, C.X.; Zhao, C.L.; Rong, Y.J.; Zhu, J.Y.; Wu, G.; Martin, D. Mapping ecosystem service supply and demand:historical changes and projections under SSP-RCP scenarios. Acta Ecol. Sin. 2023, 43, 1309–1325. [Google Scholar]
  74. Xia, H.; Liu, M. Hu Huanyong Line based on geographical synthesis: Simulation and prediction under SSPs-RCPs scenario matrix. Geogr. Res. 2022, 40, 2838–2855. [Google Scholar]
  75. Zhang, L.; Bai, Y.; Hu, Y.; Deng, X.; Liu, W. Valuation of ecosystem services in China under different SSP-RCP scenarios. Acta Ecol. Sin. 2023, 43, 510–521. [Google Scholar] [CrossRef]
  76. Chen, T.; Huang, Q.; Wang, Q. Ecological security zoning identification of Chengdu-Chongqing urban agglomeration based on supply-demand relationship of ecosystem services. Mt. Res. 2022, 40, 727–740. [Google Scholar]
  77. Guan, Y.R.; Shan, Y.L.; Huang, Q.; Chen, H.L.; Wang, D.; Hubacek, K. Assessment to China’s Recent Emission Pattern Shifts. Earths Future 2021, 9, e2021EF002241. [Google Scholar] [CrossRef]
  78. Liu, L.; Zhang, X.; Gao, Y.; Chen, X.; Xie, S.; Mi, J. Finer-Resolution Mapping of Global Land Cover: Recent Developments, Consistency Analysis, and Prospects. J. Remote Sens. 2021, 2021, 1–38. [Google Scholar] [CrossRef]
  79. Shan, Y.L.; Guan, D.B.; Zheng, H.R.; Ou, J.M.; Li, Y.; Meng, J.; Mi, Z.F.; Liu, Z.; Zhang, Q. Data Descriptor: China CO2 emission accounts 1997–2015. Sci. Data 2018, 5, 170201. [Google Scholar]
  80. Shan, Y.L.; Huang, Q.; Guan, D.B.; Hubacek, K. China CO2 emission accounts 2016–2017. Sci. Data 2020, 7, 54. [Google Scholar]
  81. Shan, Y.L.; Liu, J.H.; Liu, Z.; Xu, X.W.H.; Shao, S.; Wang, P.; Guan, D.B. New provincial CO2 emission inventories in China based on apparent energy consumption data and updated emission factors. Appl. Energy 2016, 184, 742–750. [Google Scholar]
  82. Hutchinson, M.F.; Xu, T. Anusplin Version 4.4 User Guide; Fenner School of Environment and Society, Australian National University: Canberra, Australia, 2013. [Google Scholar]
  83. Yang, J.L.; Dong, J.W.; Xiao, X.M.; Dai, J.H.; Wu, C.Y.; Xia, J.Y.; Zhao, G.S.; Zhao, M.M.; Li, Z.L.; Zhang, Y.; et al. Divergent shifts in peak photosynthesis timing of temperate and alpine grasslands in China. Remote Sens. Environ. 2019, 233, 111395. [Google Scholar]
  84. Zhang, X.; Liu, L.Y.; Chen, X.D.; Gao, Y.; Xie, S.; Mi, J. GLC_FCS30: Global land-cover product with fine classification system at 30m using time-series Landsat imagery. Earth Syst. Sci. Data 2021, 13, 2753–2776. [Google Scholar] [CrossRef]
  85. Zhang, X.; Liu, L.Y.; Wu, C.S.; Chen, X.D.; Gao, Y.; Xie, S.; Zhang, B. Development of a global 30m impervious surface map using multisource and multitemporal remote sensing datasets with the Google Earth Engine platform. Earth Syst. Sci. Data 2020, 12, 1625–1648. [Google Scholar] [CrossRef]
  86. Zhang, X.; Liu, L.Y.; Zhao, T.T.; Gao, Y.; Chen, X.D.; Mi, J. GISD30: Global 30 m impervious-surface dynamic dataset from 1985 to 2020 using time-series Landsat imagery on the Google Earth Engine platform. Earth Syst. Sci. Data 2022, 14, 1831–1856. [Google Scholar] [CrossRef]
Figure 1. Location of the study area.
Land 14 00788 g001
Figure 2. The conceptual framework of this study.
Land 14 00788 g002
Figure 3. The spatial distribution of ES supply and demand in Chongqing.
Land 14 00788 g003
Figure 4. The spatial distribution of ES supply–demand ratio in Chongqing.
Land 14 00788 g004
Figure 5. Changes of CESD (ac) and conversion of different supply–demand ratio levels (df) during 2010–2015, 2015–2020, and 2010–2020.
Land 14 00788 g005
Figure 6. Regression coefficients of climate factors and social factors based on GWR model in 2020.
Land 14 00788 g006
Figure 7. Supply and demand projections of ES in Chongqing under three scenarios in 2030 and 2060.
Land 14 00788 g007
Figure 8. The supply–demand ratio of ES in Chongqing under three scenarios in 2030 and 2060.
Land 14 00788 g008
Figure 9. Various ES supply–demand ratios for the one area and two clusters in 2030 and 2060. One area refers to the metropolitan area, two clusters refer to northeastern cluster and southeastern cluster. Please see Figure S1 in Supplementary Materials for detailed partitioning information.
Land 14 00788 g009
Table 1. Total annual ES supply and demand in Chongqing from 2010 to 2020.
SupplyDemandSupply and Demand Gap
201020152020201020152020201020152020
Food provision (1012 Kcal)46.053.254.624.023.125.222.030.020.8
Water retention (108 m3)233.91498.45420.1786.3978.9865.56147.52419.48354.62
Carbon fixation (106 tons)55.256.156.2146.1140.8157.9−90.8−90.4−101.9
Soil conservation (104 tons)126,496164,252184,183515823,76134,045102,734159,094150,138
Disclaimer/Publisher’s Note: The statements, opinions and data contained in all publications are solely those of the individual author(s) and contributor(s) and not of MDPI and/or the editor(s). MDPI and/or the editor(s) disclaim responsibility for any injury to people or property resulting from any ideas, methods, instructions or products referred to in the content.

