
Land Use and Land Cover Change Dynamics in the Niger Delta Region of Nigeria from 1986 to 2024


Abstract
1. Introduction
1.1. Land Cover Change in the Niger Delta Region
1.2. Managing the Impacts of LULCC
2. Materials and Methods
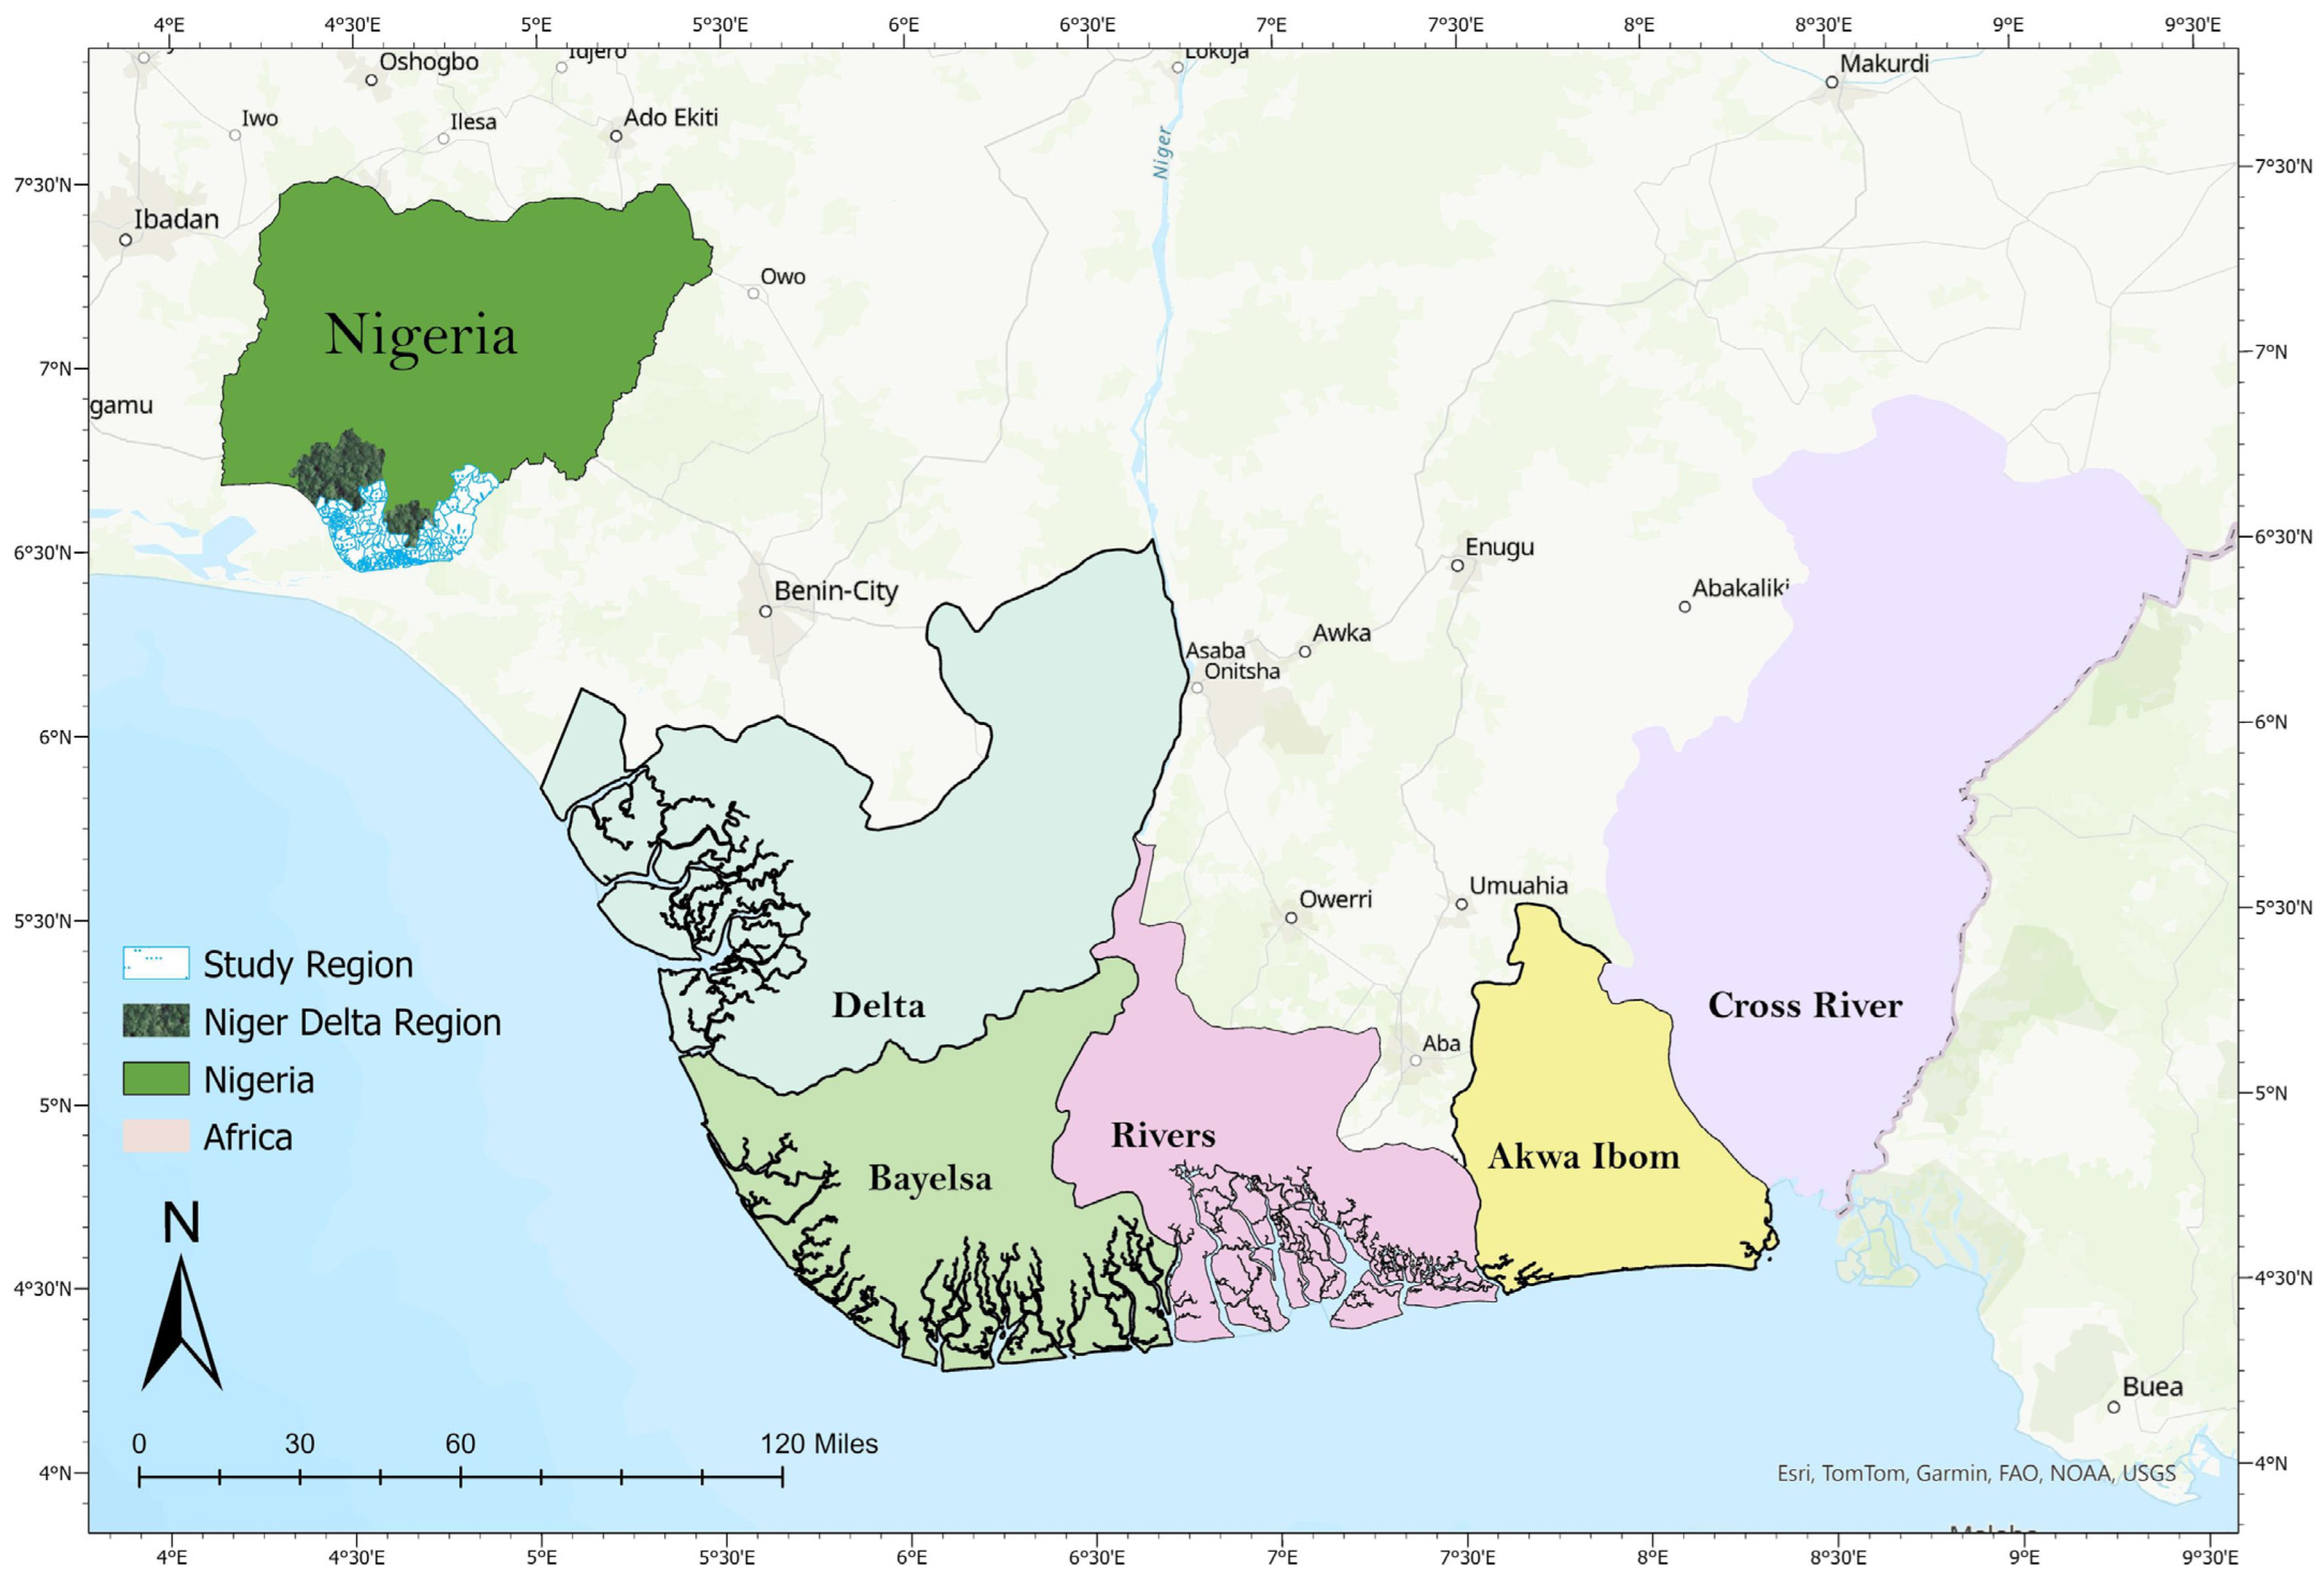
2.1. Descriptions of the Study Area
2.2. Remote Sensing Data
2.3. Data Selection and Pre-Processing
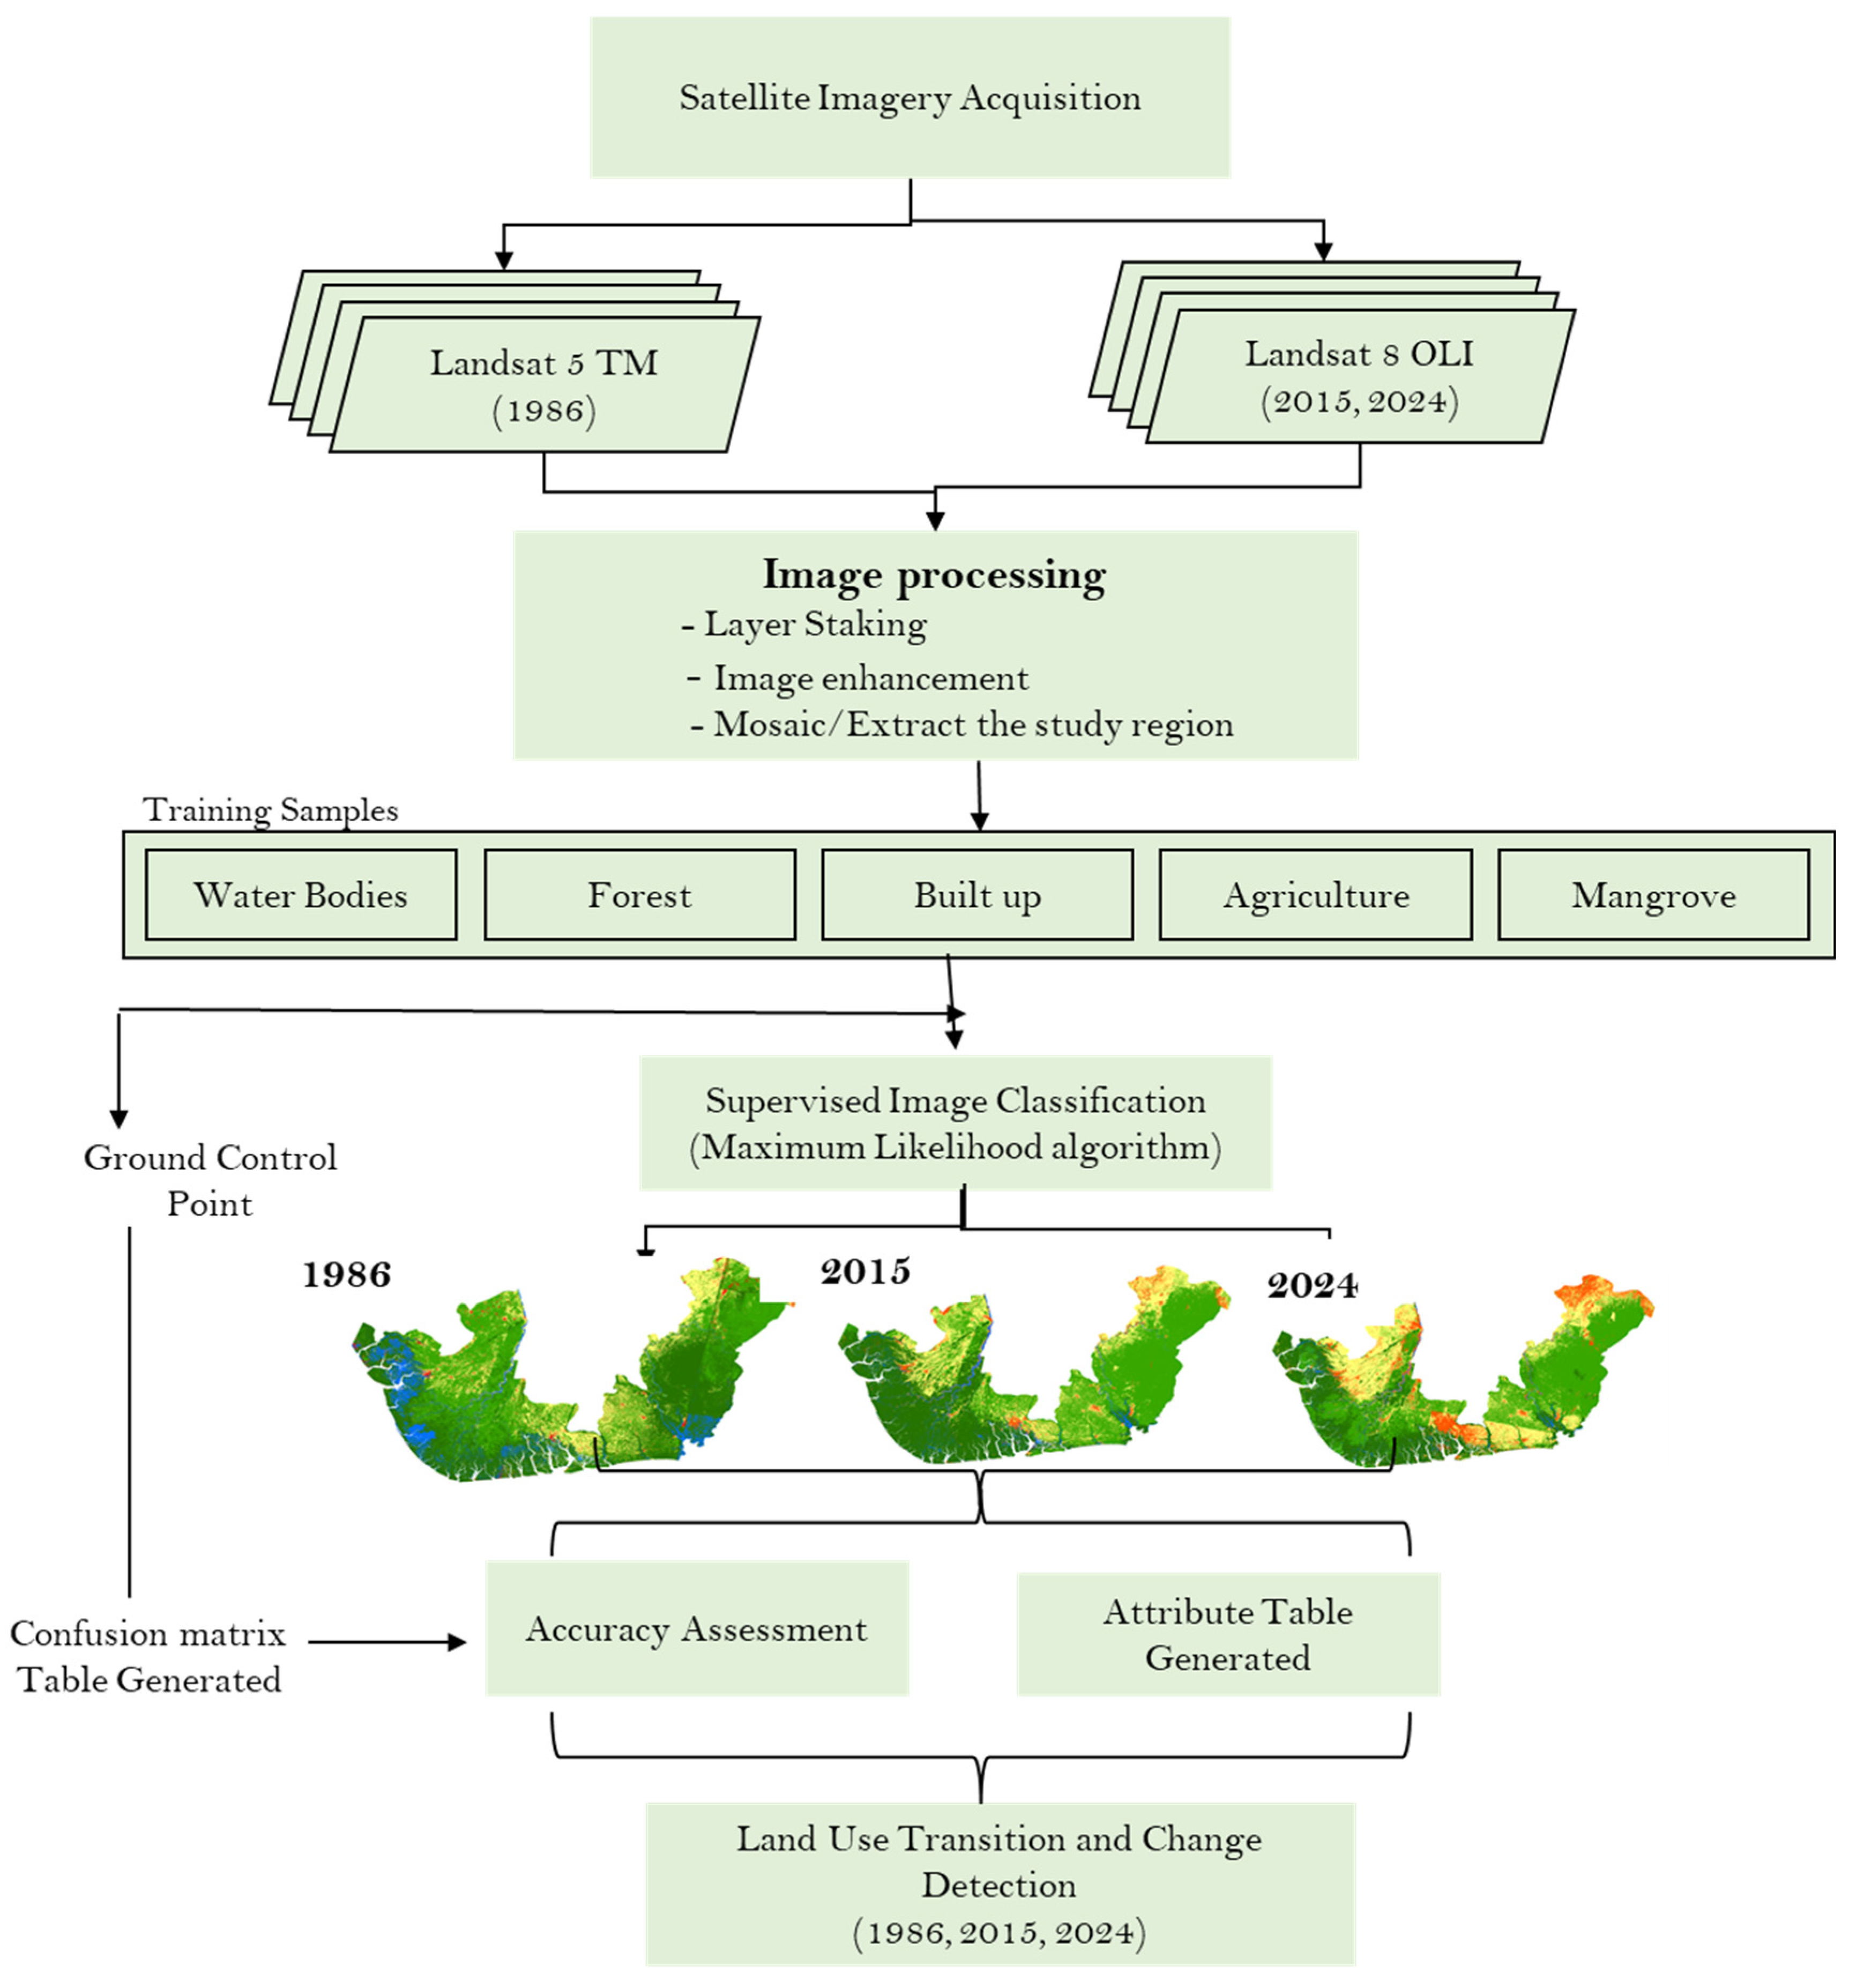
2.4. Land Use Classification
2.5. Accuracy Assessment
- User’s Accuracy
- Producer’s Accuracy
- Overall Accuracywhere N = total number of points, n is the type number of land cover data in the confusion matrix, Tii is the number of land types correctly classified in the confusion matrix, Ti + displays the sum of the categories in the classified data, and T + i shows the sum of category i in the measured or reference data.
2.6. Change Detection
3. Results
3.1. Accuracy Evaluation
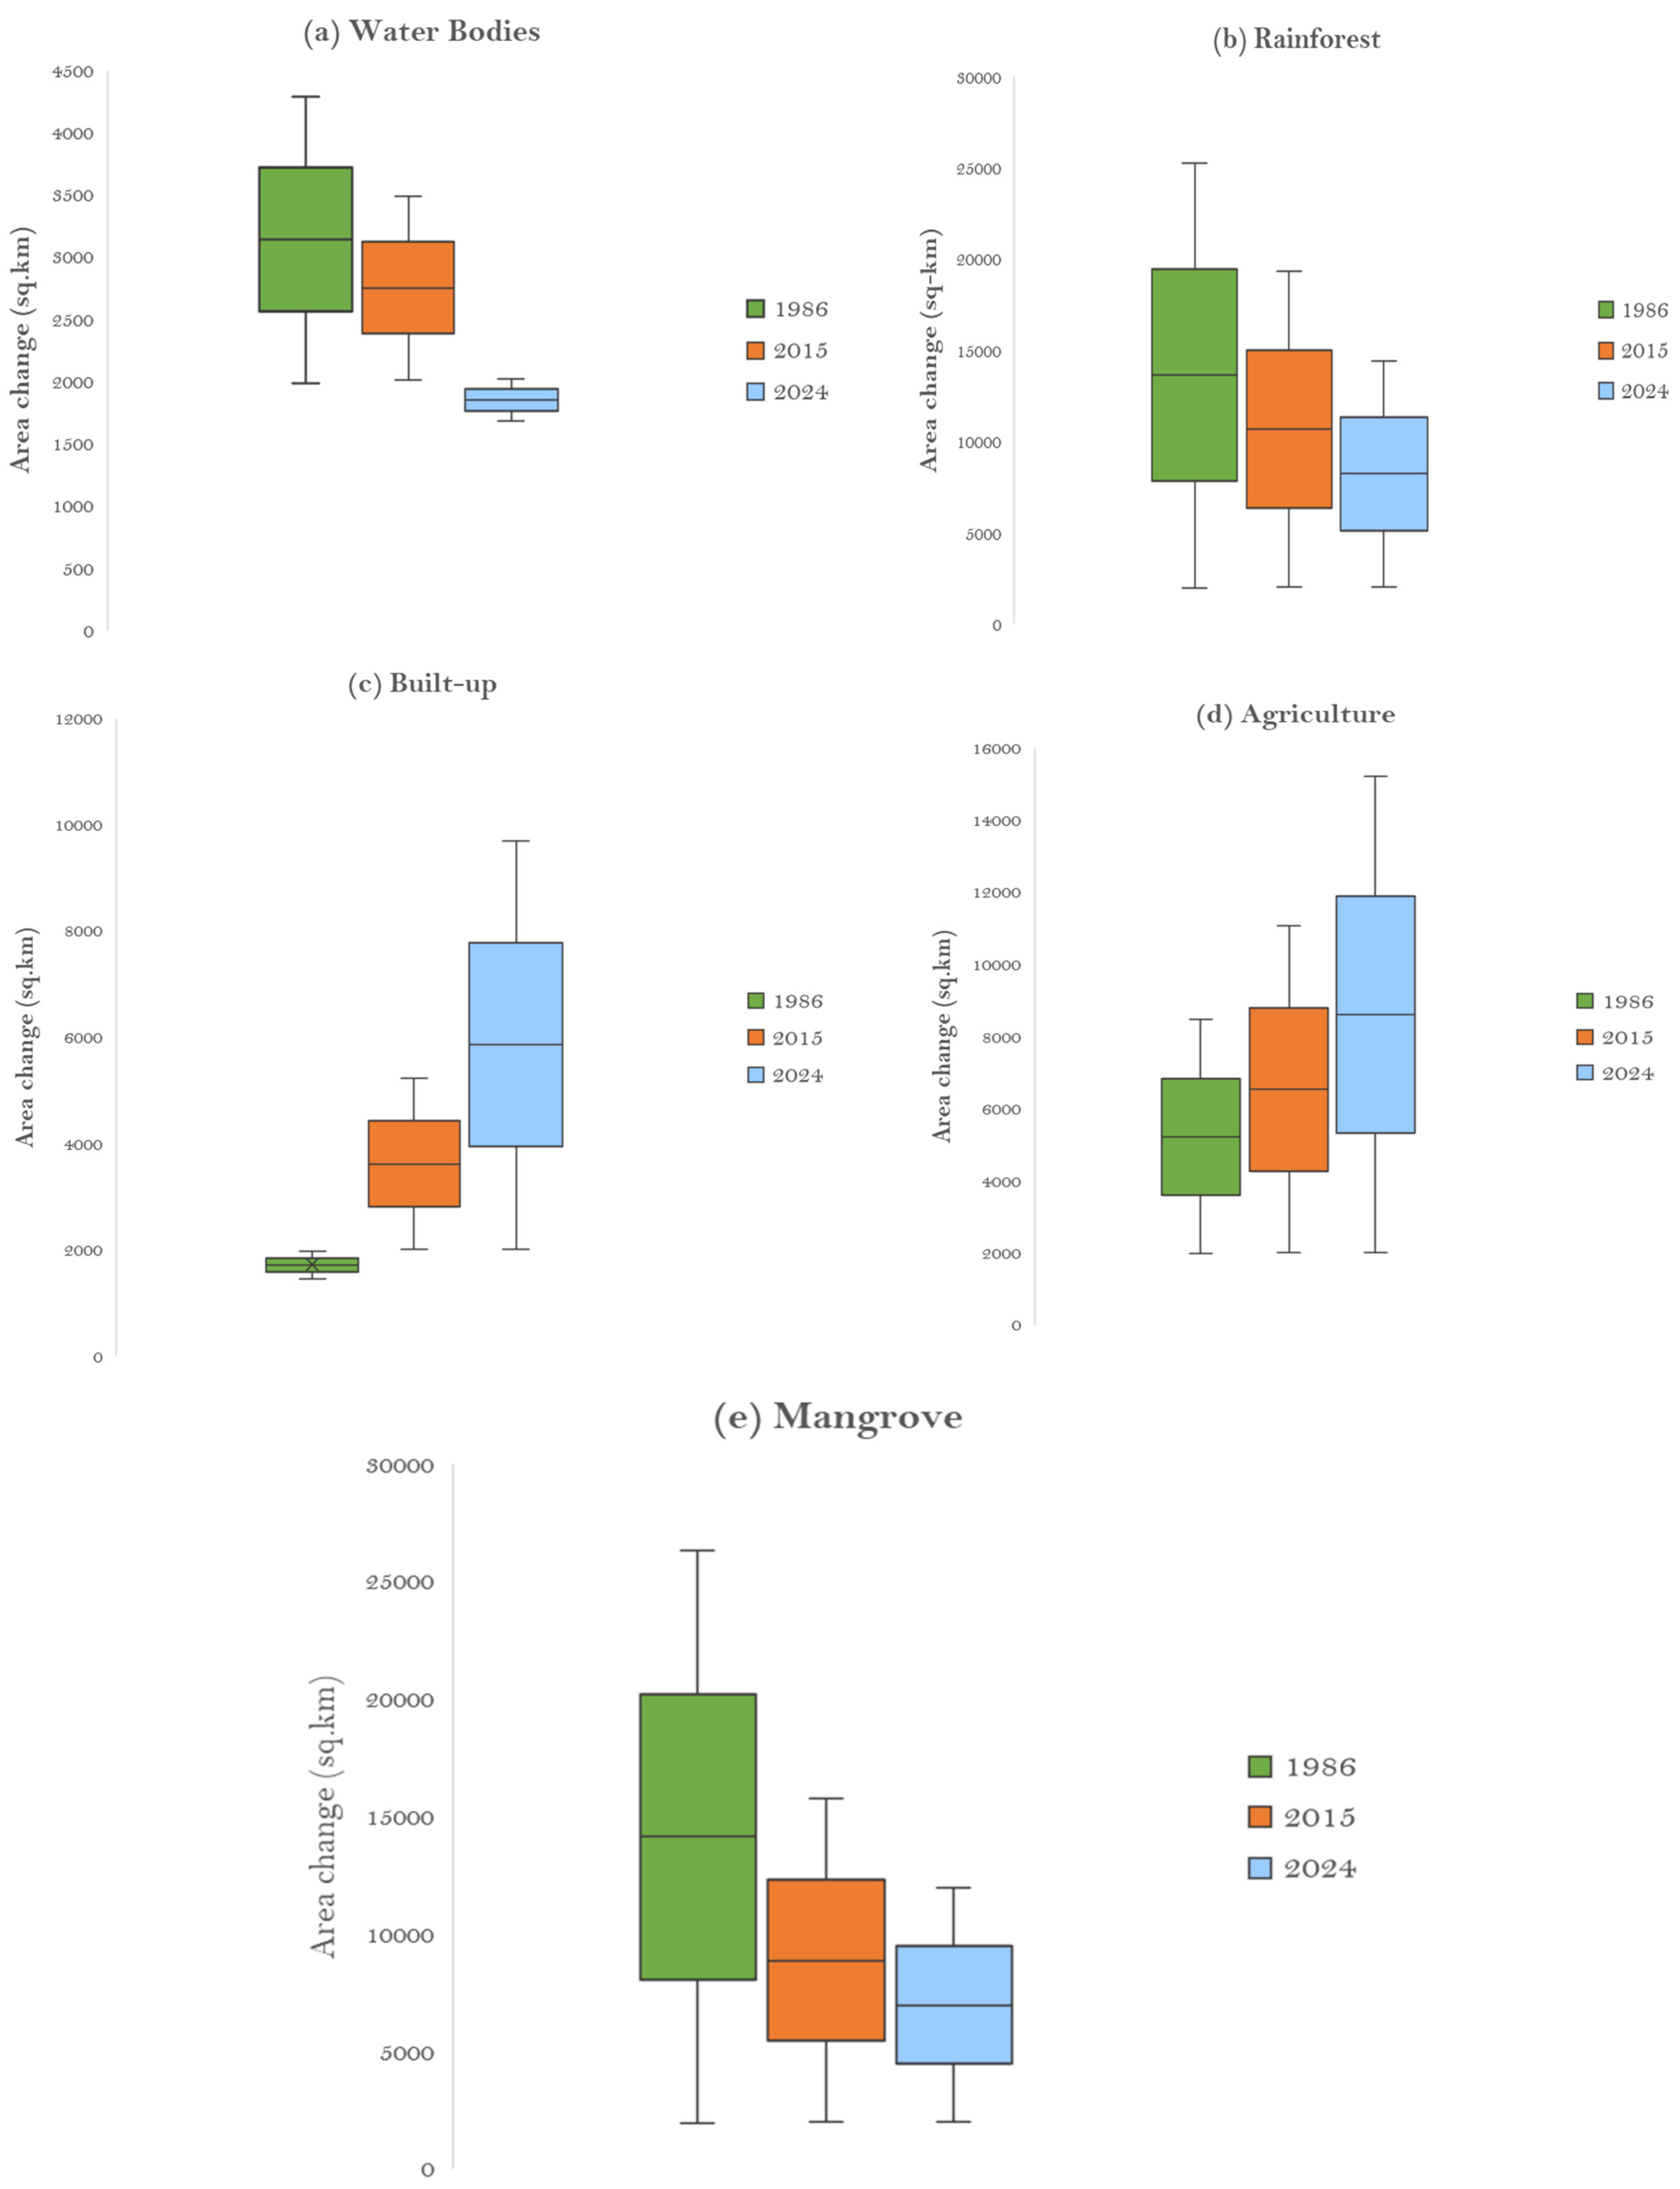
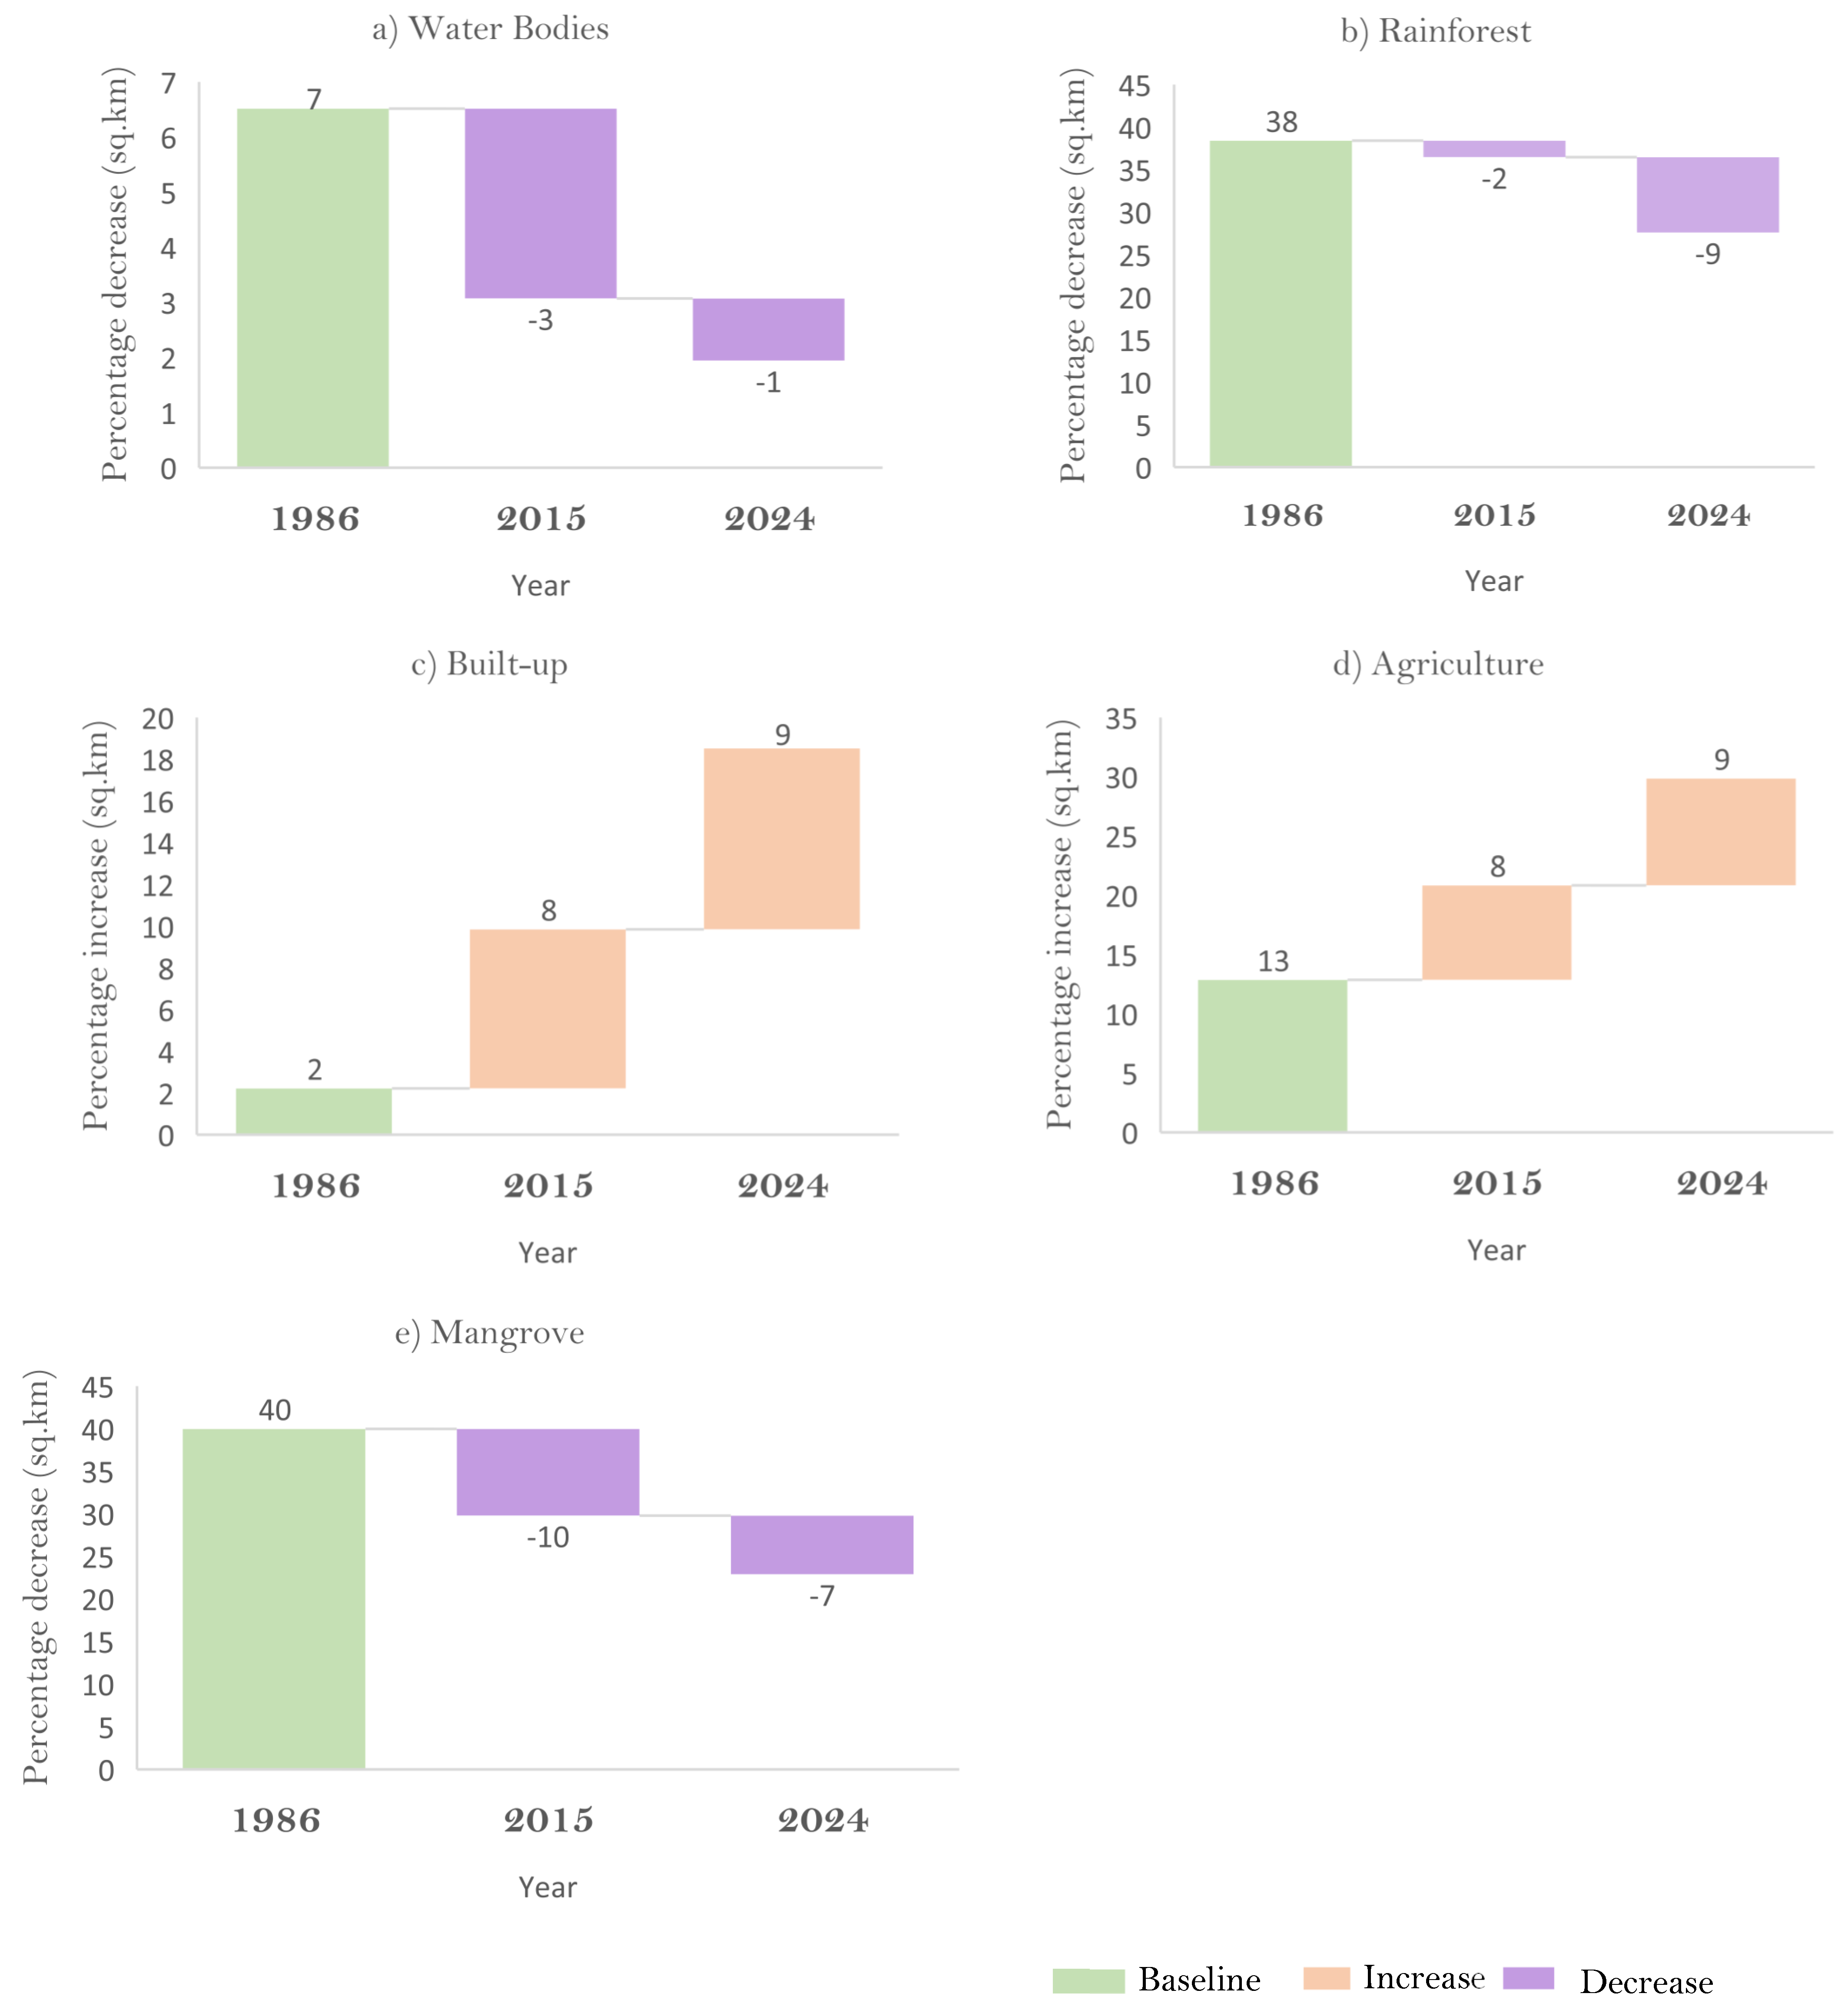
3.2. Change in Land Cover from 1986 to 2024 in the NDR
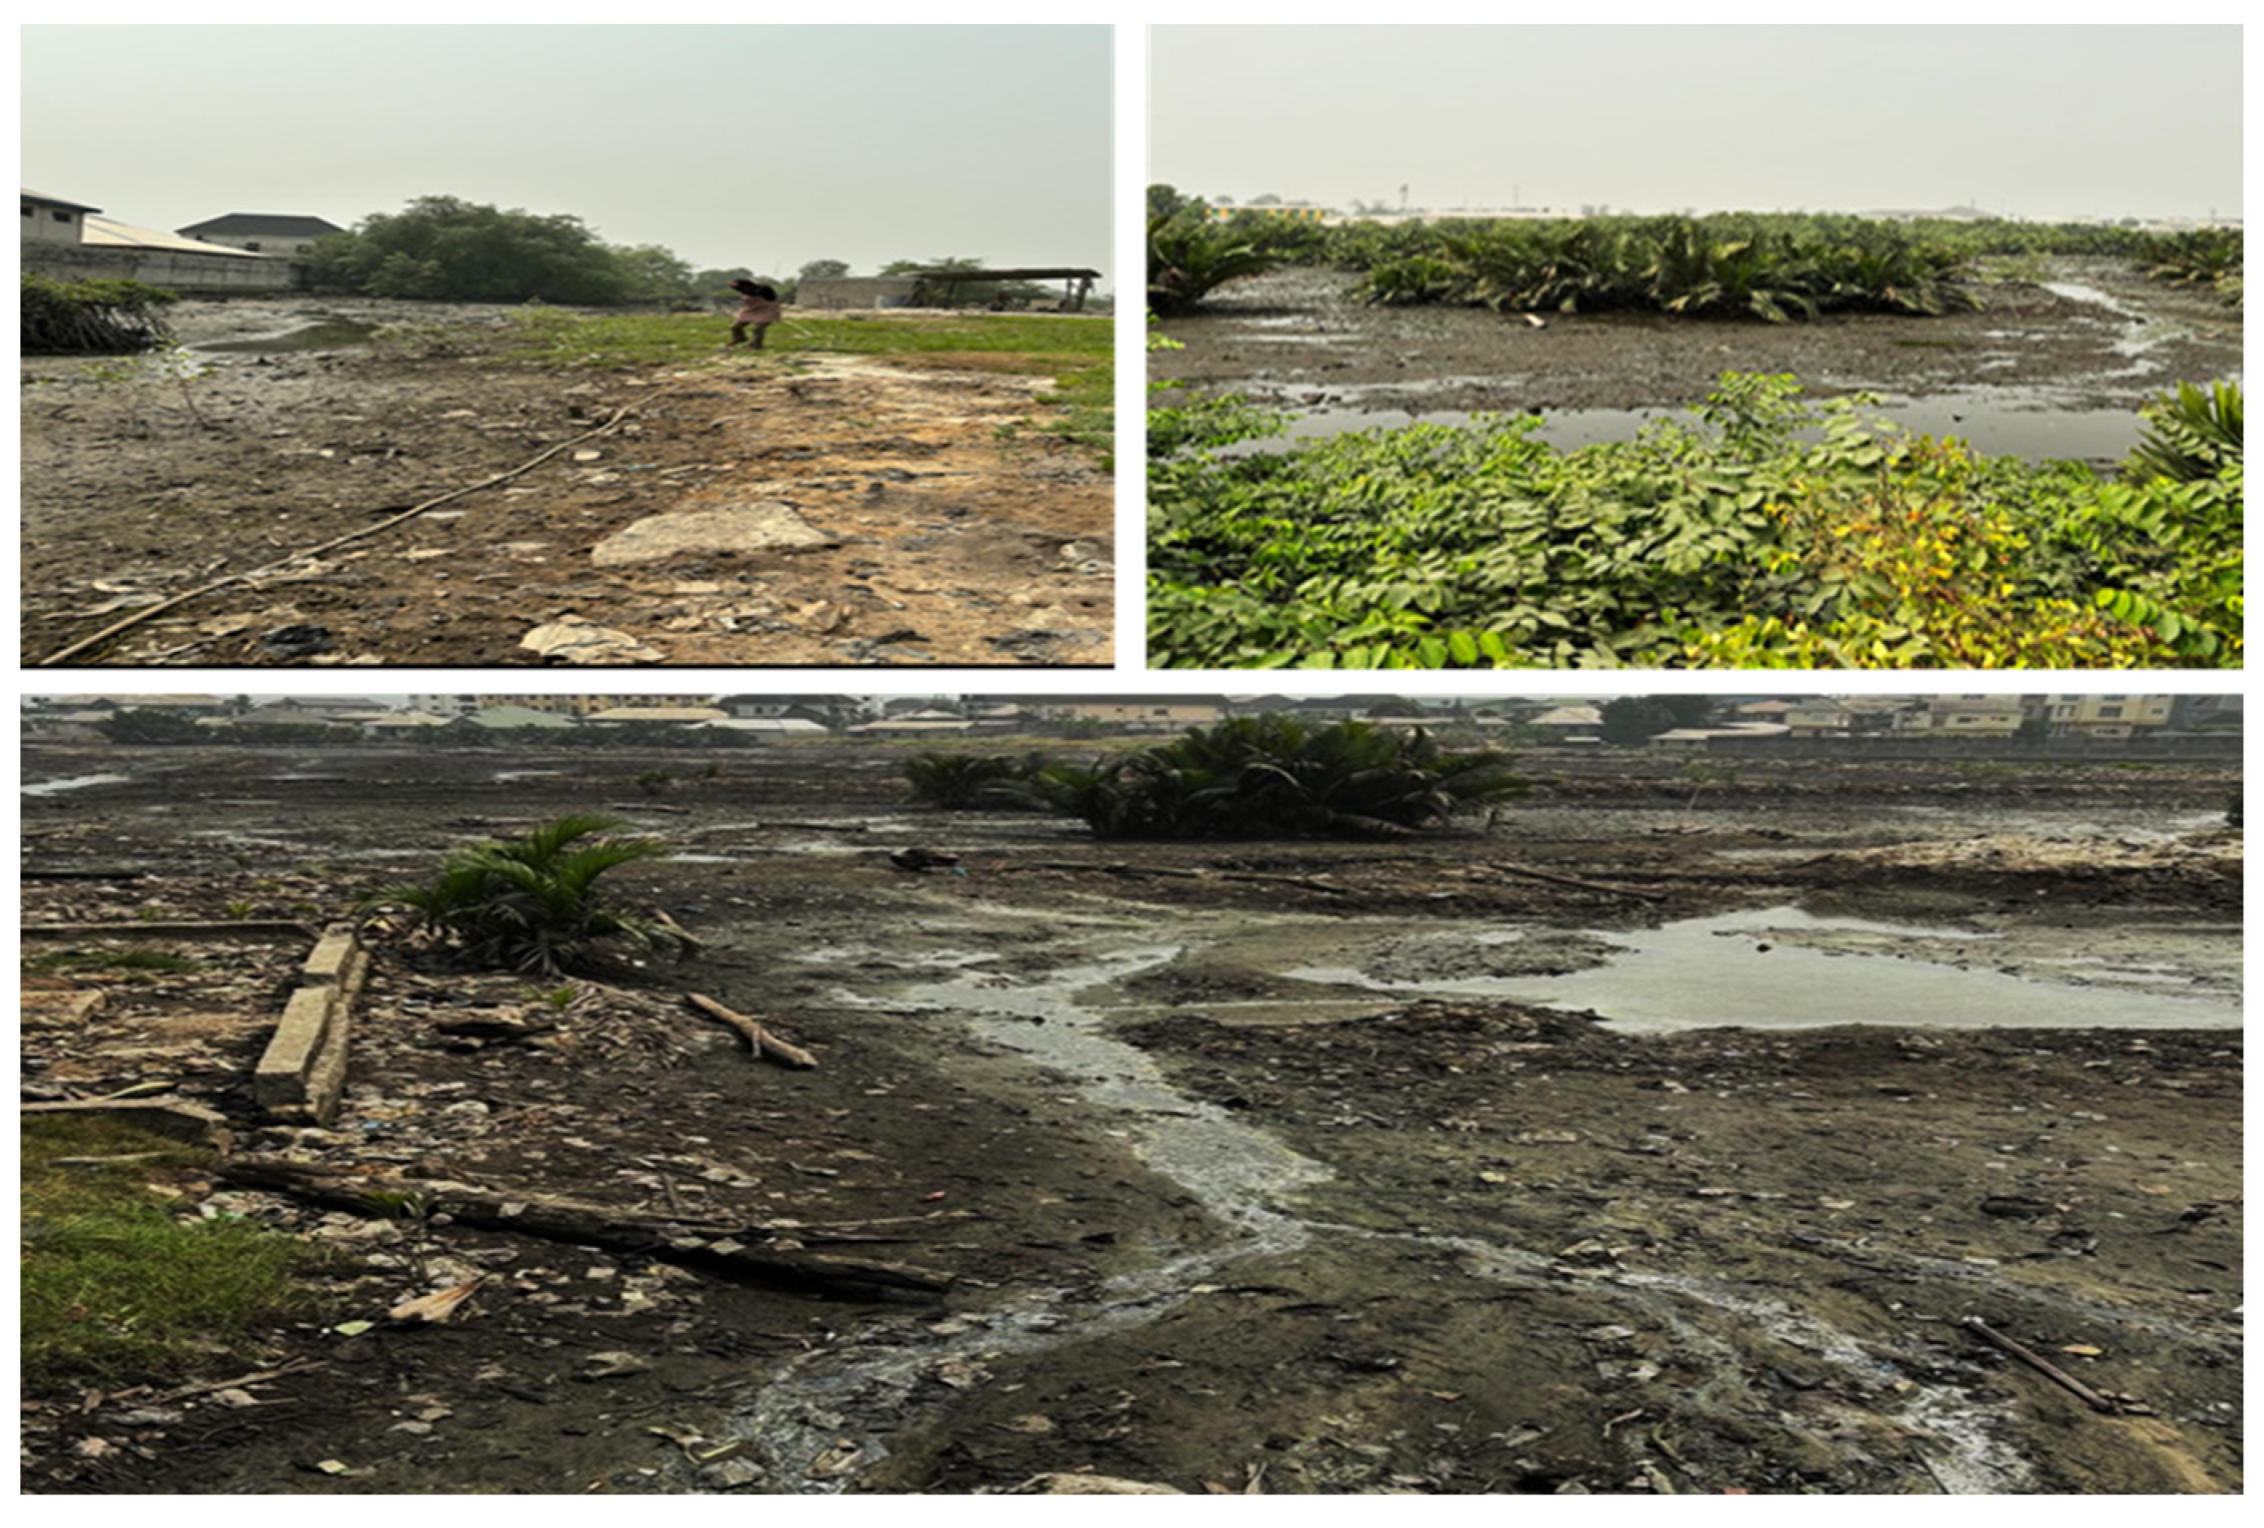
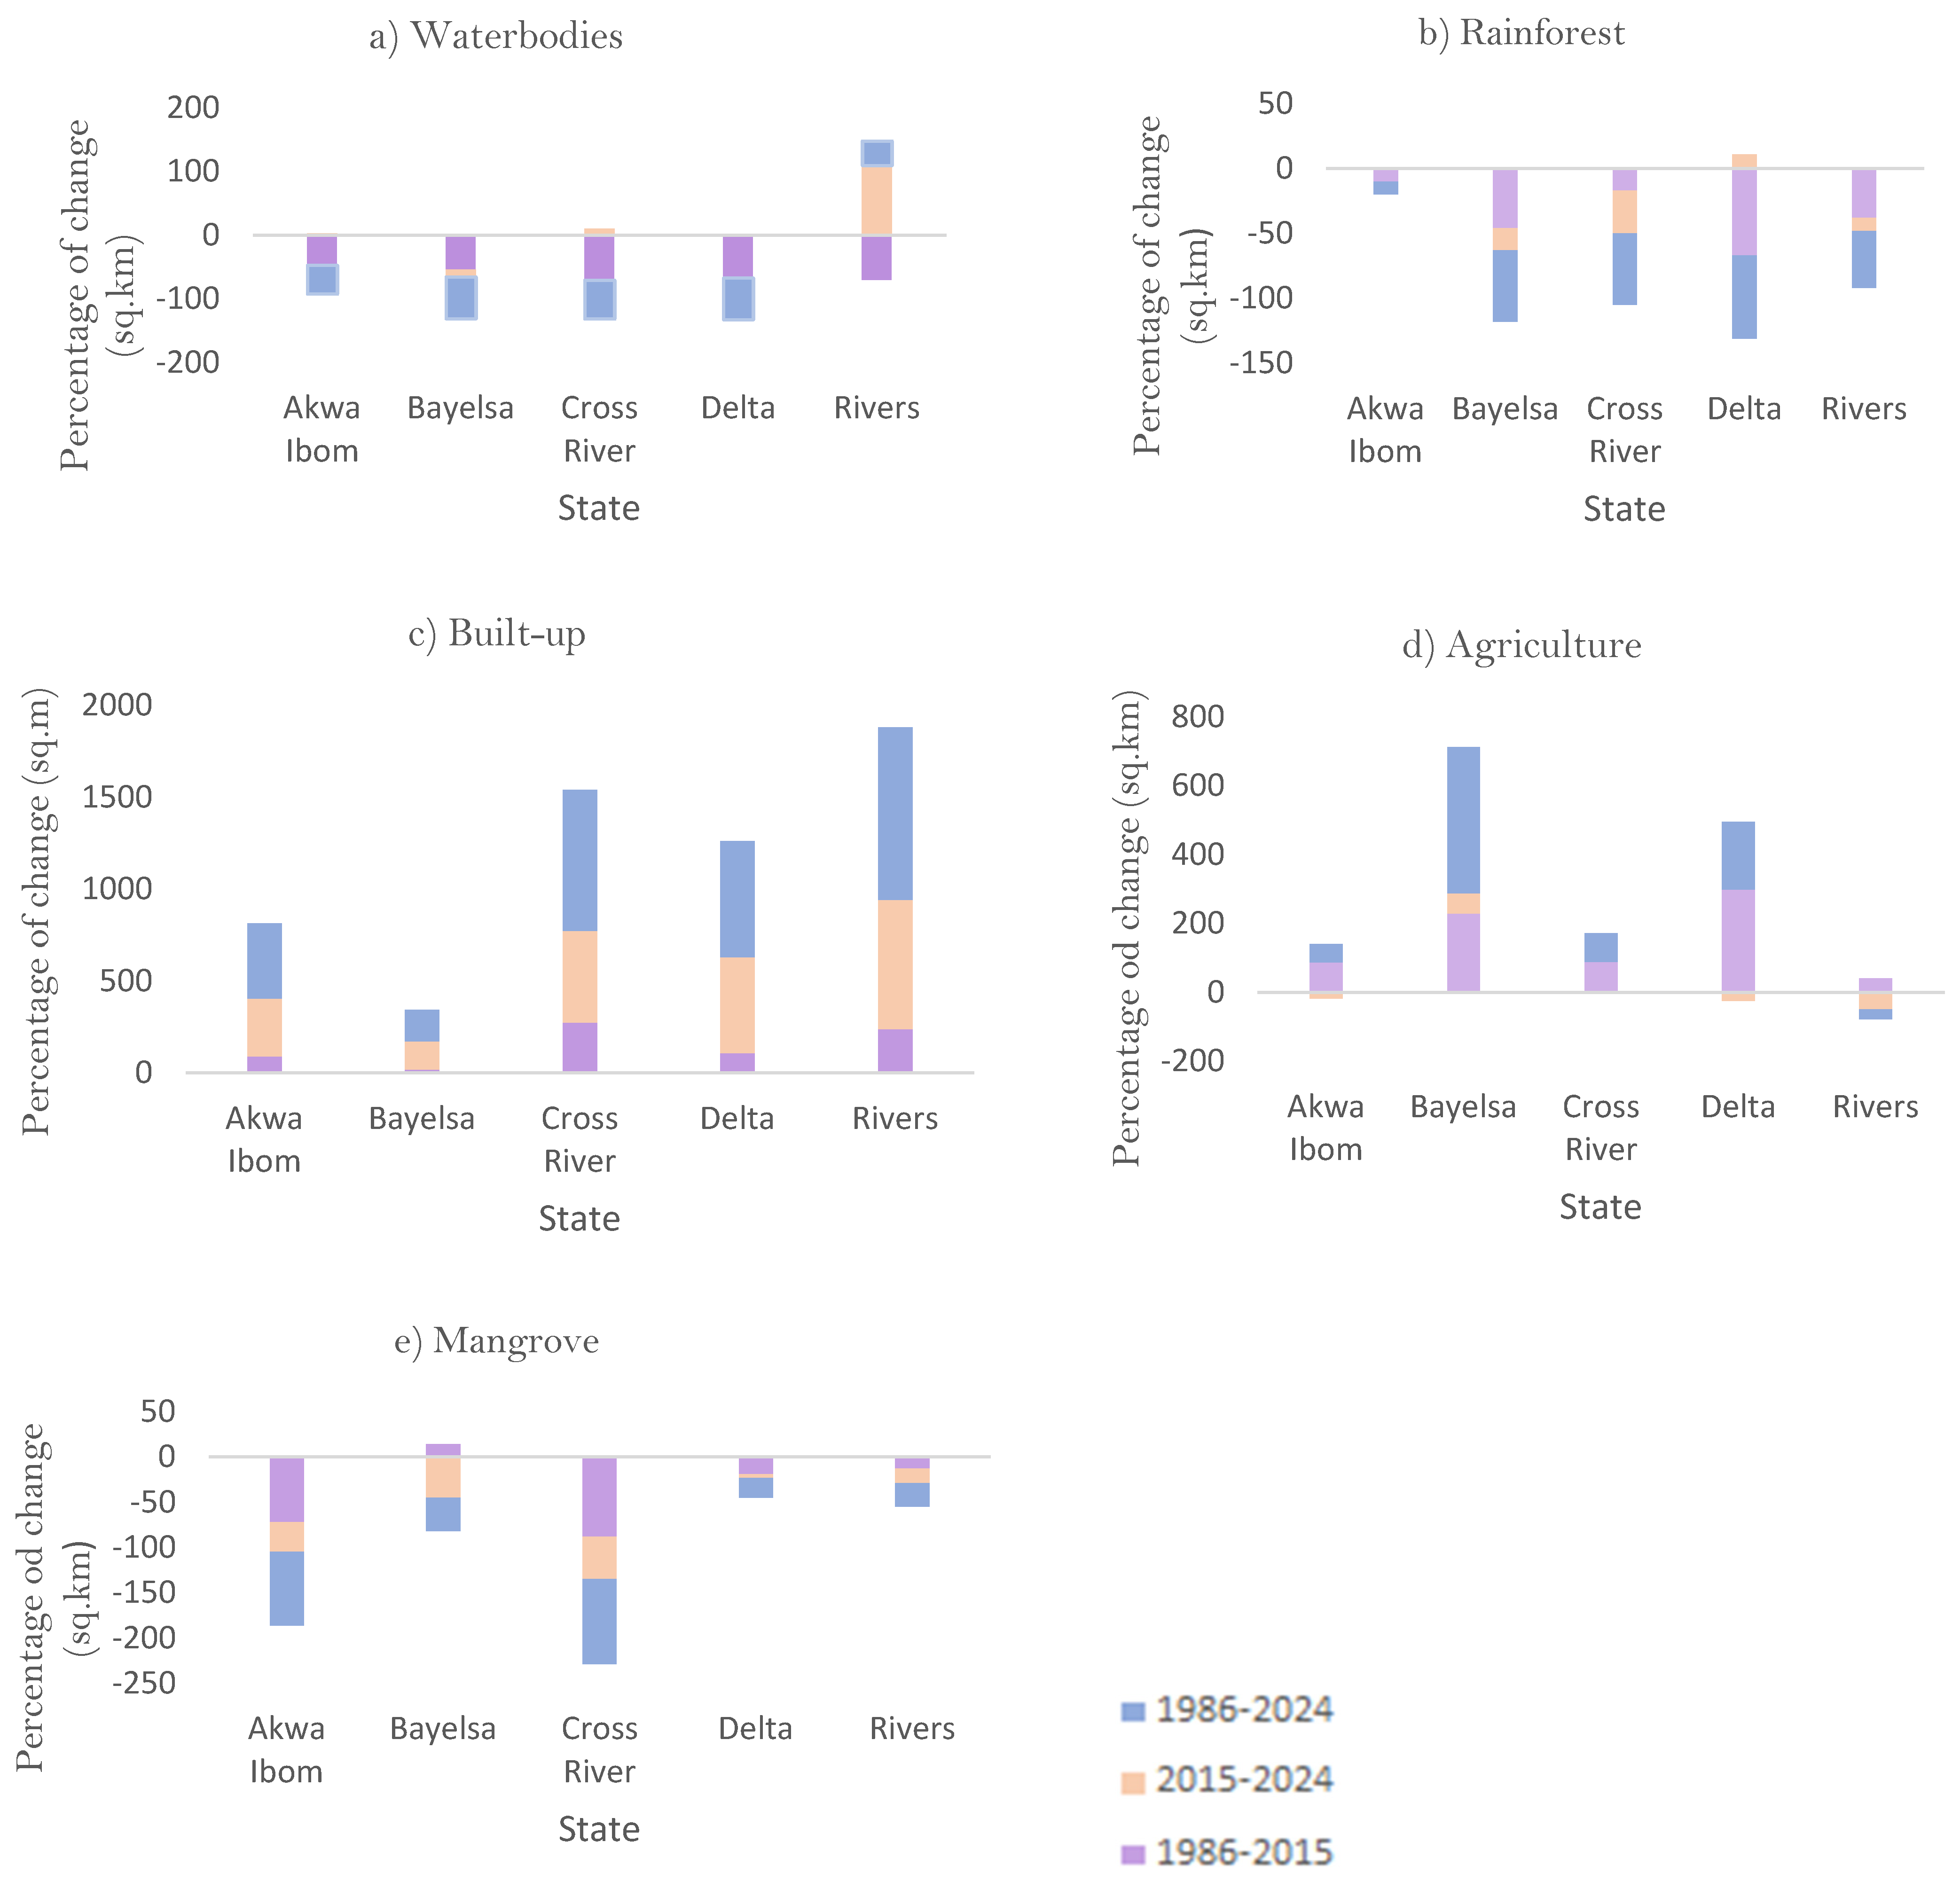
3.3. Observed Changes
4. Discussion
5. Conclusions
Author Contributions
Funding
Data Availability Statement
Acknowledgments
Conflicts of Interest
References
- Seyam, M.M.H.; Haque, M.R.; Rahman, M.M. Identifying the land use land cover (LULC) changes using remote sensing and GIS approach: A case study at Bhaluka in Mymensingh, Bangladesh. Case Stud. Chem. Environ. Eng. 2023, 7, 100293. [Google Scholar]
- Winkler, K.; Fuchs, R.; Rounsevell, M.; Herold, M. Global land use changes are four times greater than previously estimated. Nat. Commun. 2021, 12, 2501. [Google Scholar] [CrossRef] [PubMed]
- Sitch, S.; O’Sullivan, M.; Robertson, E.; Friedlingstein, P.; Albergel, C.; Anthoni, P.; Arneth, A.; Arora, V.K.; Bastos, A.; Bastrikov, V.; et al. Trends and Drivers of Terrestrial Sources and Sinks of Carbon Dioxide: An Overview of the TRENDY Project. Glob. Biogeochem. Cycles 2024, 38, e2024GB008102. [Google Scholar] [CrossRef]
- Chiaka, J.C.; Zhen, L.; Xiao, Y.; Hu, Y.; Wen, X.; Muhirwa, F. Spatial Assessment of Land Suitability Potential for Agriculture in Nigeria. Foods 2024, 13, 568. [Google Scholar] [CrossRef]
- Bondur, V.; Chimitdorzhiev, T.; Kirbizhekova, I.; Dmitriev, A. A Novel Method of Boreal Zone Reforestation/Afforestation Estimation Using PALSAR-1, 2 and Landsat-5, 8 Data. Forests 2024, 15, 132. [Google Scholar]
- Kang, J.; Zhang, B.; Dang, A. A novel geospatial machine learning approach to quantify non-linear effects of land use/land cover change (LULCC) on carbon dynamics. Int. J. Appl. Earth Obs. Geoinf. 2024, 128, 103712. [Google Scholar] [CrossRef]
- Naidoo, G. The mangroves of Africa: A review. Mar. Pollut. Bull. 2023, 190, 114859. [Google Scholar] [CrossRef]
- Sam, K.; Zabbey, N.; Gbaa, N.D.; Ezurike, J.C.; Okoro, C.M. Towards a framework for mangrove restoration and conservation in Nigeria. Reg. Stud. Mar. Sci. 2023, 66, 103154. [Google Scholar] [CrossRef]
- Norrman, K.-E. World Population Growth: A Once and Future Global Concern. World 2023, 4, 684–697. [Google Scholar] [CrossRef]
- Gu, D.; Andreev, K.; Dupre, M.E. Major trends in population growth around the world. China CDC Wkly. 2021, 3, 604. [Google Scholar] [CrossRef]
- Saraswati, C.M.; Judge, M.A.; Weeda, L.J.; Bassat, Q.; Prata, N.; Le Souëf, P.N.; Bradshaw, C.J. Net benefit of smaller human populations to environmental integrity and individual health and wellbeing. Front. Public Health 2024, 12, 1339933. [Google Scholar]
- Rahman, M.; Ningsheng, C.; Mahmud, G.I.; Islam, M.; Pourghasemi, H.; Ahmad, H.; Habumugisha, J.; Washakh, R.; Alam, M.; Liu, E. Flooding and its relationship with land cover change, population growth, and road density. Geosci. Front. 2021, 12, 101224. [Google Scholar]
- Kuta, A.A. Characterising Land Cover Changes in the Niger Delta Caused by Oil Production. Ph.D. Thesis, University of Nottingham, Nottingham, UK, 2023. [Google Scholar]
- Xiang, Y.; Wang, Y.; Chen, Y.; Zhang, Q. Impact of climate change on the hydrological regime of the Yarkant River Basin, China: An assessment using three SSP scenarios of CMIP6 GCMs. Remote Sens. 2021, 14, 115. [Google Scholar] [CrossRef]
- Elum, Z.A.; Lawal, O. Flood risk perception, disaster preparedness and response in flood-prone urban communities of Rivers State. Jàmbá-J. Disaster Risk Stud. 2022, 14, 1303. [Google Scholar]
- Numbere, A.O.; Maduike, E.M. The impact of unsustainable exploitation of forest and aquatic resources of the Niger Delta, Nigeria. In Biodiversity in Africa: Potentials, Threats and Conservation; Springer: Berlin/Heidelberg, Germany, 2022; pp. 239–265. [Google Scholar]
- Nababa, I.I.; Symeonakis, E.; Koukoulas, S.; Higginbottom, T.P.; Cavan, G.; Marsden, S. Land cover dynamics and mangrove degradation in the Niger Delta region. Remote Sens. 2020, 12, 3619. [Google Scholar] [CrossRef]
- Hagger, V.; Worthington, T.A.; Lovelock, C.E.; Adame, M.F.; Amano, T.; Brown, B.M.; Friess, D.A.; Landis, E.; Mumby, P.J.; Morrison, T.H. Drivers of global mangrove loss and gain in social-ecological systems. Nat. Commun. 2022, 13, 6373. [Google Scholar]
- Aransiola, S.A.; Zobeashia, S.S.L.-T.; Ikhumetse, A.A.; Musa, O.I.; Abioye, O.P.; Ijah, U.J.J.; Maddela, N.R. Niger Delta mangrove ecosystem: Biodiversity, past and present pollution, threat and mitigation. Reg. Stud. Mar. Sci. 2024, 75, 103568. [Google Scholar] [CrossRef]
- Onyenekwe, C.S.; Opata, P.I.; Ume, C.O.; Sarpong, D.B.; Egyir, I.S. Heterogeneity of adaptation strategies to climate shocks: Evidence from the Niger Delta region of Nigeria. Bio-Based Appl. Econ. 2023, 12, 17–35. [Google Scholar]
- Dan-Jumbo, N.G.; Metzger, M.J.; Clark, A.P. Urban Land-Use Dynamics in the Niger Delta: The Case of Greater Port Harcourt Watershed. Urban Sci. 2018, 2, 108. [Google Scholar] [CrossRef]
- Uche, I. Mangroves of the Niger Delta. In Mangrove Biology, Ecosystem, and Conservation; IntechOpen: Rijeka, Croatia, 2023. [Google Scholar]
- Siloko, B.E. Human security, sustainable livelihoods and development: The case of the Niger Delta region in Nigeria. Glob. Discourse 2024, 14, 411–432. [Google Scholar]
- Babaremu, K.; Taiwo, O.; Ajayi, D. Impacts of Land Use and Land Cover Changes on Hydrological Response. TWIST 2024, 19, 256–267. [Google Scholar]
- Effiong, C.; Ngang, E.; Ekott, I. Land use planning and climate change adaptation in river-dependent communities in Nigeria. Environ. Dev. 2024, 49, 100970. [Google Scholar] [CrossRef]
- Fubara, D.M.J. Analysis of hydrological characteristics: A case review of the niger delta. J. Water Resour. Prot. 2022, 14, 611–631. [Google Scholar]
- Ewim, D.R.E.; Orikpete, O.F.; Scott, T.O.; Onyebuchi, C.N.; Onukogu, A.O.; Uzougbo, C.G.; Onunka, C. Survey of wastewater issues due to oil spills and pollution in the Niger Delta area of Nigeria: A secondary data analysis. Bull. Natl. Res. Cent. 2023, 47, 116. [Google Scholar]
- Numbere, A.O. Chapter 20—Application of GIS and remote sensing towards forest resource management in mangrove forest of Niger Delta. In Natural Resources Conservation and Advances for Sustainability; Jhariya, M.K., Meena, R.S., Banerjee, A., Meena, S.N., Eds.; Elsevier: Amsterdam, The Netherlands, 2022; pp. 433–459. [Google Scholar]
- Aggarwal, A. A Geospatial Approach to Monitoring Land Use and Land Cover Dynamics: A Review. In Proceedings of the International Conference on Materials for Energy Storage and Conservation; Springer Nature: Singapore, 2022; pp. 63–71. [Google Scholar]
- Nababa, I.I. Monitoring and Modelling Disturbances to the Niger Delta Mangrove Forests. Ph.D. Thesis, Manchester Metropolitan University, Manchester, UK, 2022. [Google Scholar]
- Uwadiae Oyegun, C.; Lawal, O.; Ogoro, M. The Niger Delta Region. In Landscapes and Landforms of Nigeria; Springer: Berlin/Heidelberg, Germany, 2023; pp. 107–121. [Google Scholar]
- Swain, S.; Mishra, S.K.; Pandey, A. Appraisal of land use/land cover change over Tehri catchment using remote sensing and GIS. In Geospatial Technologies for Land and Water Resources Management; Springer: Berlin/Heidelberg, Germany, 2022; pp. 37–51. [Google Scholar]
- Darem, A.A.; Alhashmi, A.A.; Almadani, A.M.; Alanazi, A.K.; Sutantra, G.A. Development of a map for land use and land cover classification of the Northern Border Region using remote sensing and GIS. Egypt. J. Remote Sens. Space Sci. 2023, 26, 341–350. [Google Scholar] [CrossRef]
- Li, X.; Pang, Z.; Xue, F.; Ding, J.; Wang, J.; Xu, T.; Xu, Z.; Ma, Y.; Zhang, Y.; Shi, J. Analysis of Spatial and Temporal Variations in Evapotranspiration and Its Driving Factors Based on Multi-Source Remote Sensing Data: A Case Study of the Heihe River Basin. Remote Sens. 2024, 16, 2696. [Google Scholar] [CrossRef]
- Shirmard, H.; Farahbakhsh, E.; Müller, R.D.; Chandra, R. A review of machine learning in processing remote sensing data for mineral exploration. Remote Sens. Environ. 2022, 268, 112750. [Google Scholar] [CrossRef]
- Wulder, M.A.; Roy, D.P.; Radeloff, V.C.; Loveland, T.R.; Anderson, M.C.; Johnson, D.M.; Healey, S.; Zhu, Z.; Scambos, T.A.; Pahlevan, N. Fifty years of Landsat science and impacts. Remote Sens. Environ. 2022, 280, 113195. [Google Scholar] [CrossRef]
- Kumar, S.; Imen, S.; Sridharan, V.K.; Gupta, A.; McDonald, W.; Ramirez-Avila, J.J.; Abdul-Aziz, O.I.; Talchabhadel, R.; Gao, H.; Quinn, N.W. Perceived barriers and advances in integrating earth observations with water resources modeling. Remote Sens. Appl. Soc. Environ. 2024, 33, 101119. [Google Scholar] [CrossRef]
- Mashala, M.J.; Dube, T.; Mudereri, B.T.; Ayisi, K.K.; Ramudzuli, M.R. A systematic review on advancements in remote sensing for assessing and monitoring land use and land cover changes impacts on surface water resources in semi-arid tropical environments. Remote Sens. 2023, 15, 3926. [Google Scholar] [CrossRef]
- Crawford, C.J.; Roy, D.P.; Arab, S.; Barnes, C.; Vermote, E.; Hulley, G.; Gerace, A.; Choate, M.; Engebretson, C.; Micijevic, E.; et al. The 50-year Landsat collection 2 archive. Sci. Remote Sens. 2023, 8, 100103. [Google Scholar] [CrossRef]
- Merry, K.; Bettinger, P.; Crosby, M.; Boston, K. Geographic Information System Skills for Foresters and Natural Resource Managers; Elsevier: Amsterdam, The Netherlands, 2022. [Google Scholar]
- Olfato-Parojinog, A.; Sobremonte-Maglipon, P.A.; Limbo-Dizon, J.E.; Almadrones-Reyes, K.J.; Dagamac, N.H.A. Land use/land cover changes (LULCC) using remote sensing analyses in Rizal, Philippines. GeoJournal 2023, 88, 6105–6118. [Google Scholar]
- Tran, T.V.; Reef, R.; Zhu, X. A Review of Spectral Indices for Mangrove Remote Sensing. Remote Sens. 2022, 14, 4868. [Google Scholar] [CrossRef]
- Schill, S.; McNulty, V.; Perez, D.; Shono, K.; Friedman, K. Remote Sensing Techniques for Mapping and Monitoring Mangroves at Fine Scales; FAO: Rome, Italy, 2024. [Google Scholar]
- Richards, J.A.; Richards, J.A. Remote Sensing Digital Image Analysis; Springer: Berlin/Heidelberg, Germany, 2022; Volume 5. [Google Scholar]
- Rawat, K.; Kumar, S.; Garg, N. Statistical comparison of simple and machine learning based land use and land cover classification algorithms: A case study. J. Water Manag. Model. 2024. [Google Scholar] [CrossRef]
- Li, F.; Yigitcanlar, T.; Nepal, M.; Nguyen, K.; Dur, F. Machine learning and remote sensing integration for leveraging urban sustainability: A review and framework. Sustain. Cities Soc. 2023, 96, 104653. [Google Scholar]
- Abdulsalam, T.A.; Tajudeen, R.B.; Ogungbemi, S.S. Effect Of Globalization on Sustainable Development Goals In Nigeria: Niger Delta Communities In Perspective. J. Political Discourse 2024, 2, 250–262. [Google Scholar]
- Benson, A. Social and environmental drivers of climate change vulnerability in the Niger Delta region, Nigeria. Eur. J. Environ. Earth Sci. 2020, 1, 1–10. [Google Scholar] [CrossRef]
- Soltani, I.; Benzouaï, S. Land Use and Land Cover Change Detection Based on Urban Spectral Indices: A Case Study of the Coastal Municipalities of Annaba Province, Algeria. In Proceedings of the 2023 International Conference on Earth Observation and Geo-Spatial Information (ICEOGI), Algiers, Algeria, 22–24 May 2023; pp. 1–7. [Google Scholar]
- Barenblitt, A.; Fatoyinbo, L.; Thomas, N.; Stovall, A.; de Sousa, C.; Nwobi, C.; Duncanson, L. Invasion in the Niger Delta: Remote sensing of mangrove conversion to invasive Nypa fruticans from 2015 to 2020. Remote Sens. Ecol. Conserv. 2024, 10, 5–23. [Google Scholar]
- Uchegbulam, O.; Igben, J. Spatio-temporal analysis of land use and land cover dynamics in a part of Southern Nigeria. Sci. Afr. 2024, 23, 221–230. [Google Scholar]
- Abbass, K.; Qasim, M.Z.; Song, H.; Murshed, M.; Mahmood, H.; Younis, I. A review of the global climate change impacts, adaptation, and sustainable mitigation measures. Environ. Sci. Pollut. Res. 2022, 29, 42539–42559. [Google Scholar]
- Wekpe, V.O.; Whitworth, M.; Baily, B. Terrestrial environmental sensitivity index mapping (TESIM) of the coastal areas of the Niger Delta region of Nigeria. Sci. Afr. 2024, 24, e02152. [Google Scholar] [CrossRef]
- Sunkur, R.; Kantamaneni, K.; Bokhoree, C.; Ravan, S. Mangroves’ role in supporting ecosystem-based techniques to reduce disaster risk and adapt to climate change: A review. J. Sea Res. 2023, 196, 102449. [Google Scholar] [CrossRef]
- Emmanuel, A.A.; Ogah, D.A.T.; Kpalo, D.S.Y.; Magaji, D.I.J. Analysis of land cover change, implication on the terrestrial tree species composition and diversity in Yenagoa, Bayelsa State, Nigeria. Int. J. Environ. Des. Constr. Manag. 2023, 2. Available online: https://harvardpublications.com/hijedcm/article/view/75 (accessed on 31 March 2025).
- Feng, X.; Li, Y.; Wang, X.; Yang, J.; Yu, E.; Wang, S.; Wu, N.; Xiao, F. Impacts of land use transitions on ecosystem services: A research framework coupled with structure, function, and dynamics. Sci. Total Environ. 2023, 901, 166366. [Google Scholar] [CrossRef] [PubMed]
- Bennour, A.; Jia, L.; Menenti, M.; Zheng, C.; Zeng, Y.; Barnieh, B.A.; Jiang, M. Assessing impacts of climate variability and land use/land cover change on the water balance components in the Sahel using Earth observations and hydrological modelling. J. Hydrol. Reg. Stud. 2023, 47, 101370. [Google Scholar] [CrossRef]
- Odoh, B.I.; Nwokeabia, C.N.; Ezealaji, I.P. Temporal Analysis of Land Use, Land Cover, and Slope Variation in Rivers State, Nigeria: A Study from 2017 to 2023. Int. J. Res. Innov. Appl. Sci. 2024, 9, 454–467. [Google Scholar]
- Zabbey, N.; Kpaniku, N.C.; Sam, K.; Nwipie, G.N.; Okoro, O.E.; Zabbey, F.G.; Babatunde, B.B. Could community science drive environmental management in Nigeria’s degrading coastal Niger delta? Prospects and challenges. Environ. Dev. 2021, 37, 100571. [Google Scholar] [CrossRef]


| Acquisition Dates | Path/Row | Spatial Resolution | Satellite Sensor |
|---|---|---|---|
| 19 December 1986 | 187/055; 187/056; 188/055; 188/057; 188/056; 188/057; 189/056; 189/057; 190/056. | 30 m | LM5 |
| 14 January 2015 | 187/055; 187/056; 188/055; 188/057; 188/056; 188/057; 189/056; 189/057; 190/056. | 30 m | OLI |
| 30 December 2024 | 187/055; 187/056; 188/055; 188/057; 188/056; 188/057; 189/056; 189/057; 190/056. | 30 m | OLI |
| Land Classes | Description | Example Pixels |
|---|---|---|
| Water Bodies | Rivers, small ponds, streams, and reservoirs are blue pixels in the image. Riparian vegetation is not included in the water bodies. |  |
| Rainforest | A large area of mostly trees. | 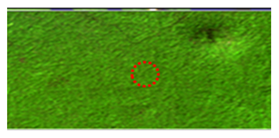 |
| Built-Up | A large area of mostly settlement. |  |
| Agriculture | A large area of farmland with grass and woody plants smaller than a tree. | 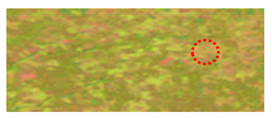 |
| Mangrove | A shrub or tree that grows mainly in coastal saline or brackish water. | 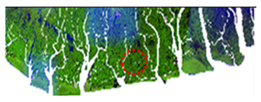 |
| Accuracy Assessment Point for 1986 | ||||||||
| Class Value | Water Bodies | Rainforest | Built-Up | Agriculture | Mangrove | Total | U_Accuracy | Kappa |
| Water Bodies | 8 | 2 | 0 | 0 | 0 | 10 | 80% | 0 |
| Rainforest | 0 | 39 | 0 | 0 | 1 | 40 | 98% | 0 |
| Built-up | 0 | 0 | 10 | 0 | 0 | 10 | 100% | 0 |
| Agriculture | 0 | 1 | 0 | 12 | 0 | 13 | 92% | 0 |
| Mangrove | 1 | 3 | 0 | 0 | 38 | 42 | 90% | 0 |
| Total | 9 | 45 | 10 | 12 | 39 | 115 | 0% | 0 |
| P_Accracy | 89% | 87% | 100% | 100% | 97% | 0% | 93% | 0 |
| Kappa | 0 | 0 | 0 | 0 | 0 | 0 | 0 | 0.90 |
| Accuracy Assessment Point for 2015 | ||||||||
| Class Value | Water Bodies | Vegetation | Built-Up | Agriculture | Mangrove | Total | U_Accuracy | Kappa |
| Water Bodies | 9 | 0 | 0 | 0 | 1 | 10 | 90% | 0 |
| Rainforest | 1 | 42 | 0 | 2 | 0 | 45 | 93% | 0 |
| Built-up | 0 | 1 | 9 | 0 | 0 | 10 | 90% | 0 |
| Agriculture | 0 | 0 | 1 | 16 | 0 | 17 | 94% | 0 |
| Mangrove | 3 | 1 | 0 | 0 | 21 | 25 | 84% | 0 |
| Total | 13 | 44 | 10 | 18 | 22 | 107 | 0% | 0 |
| P_Accuracy | 70% | 95% | 90% | 89% | 95% | 0 | 91% | 0 |
| Kappa | 0 | 0 | 0 | 0 | 0 | 0 | 0 | 0.87 |
| Accuracy Assessment Point for 2024 | ||||||||
| Class Value | Water Bodies | Vegetation | Built-Up | Agriculture | Mangrove | Total | U_Accuracy | Kappa |
| Water Bodies | 10 | 0 | 0 | 0 | 0 | 10 | 100% | 0 |
| Rainforest | 0 | 36 | 0 | 1 | 2 | 39 | 92% | 0 |
| Built-up | 0 | 4 | 11 | 0 | 0 | 15 | 73% | 0 |
| Agriculture | 0 | 9 | 0 | 14 | 1 | 24 | 58% | 0 |
| Mangrove | 0 | 0 | 0 | 0 | 19 | 19 | 100% | 0 |
| Total | 10 | 49 | 11 | 15 | 22 | 107 | 0 | 0 |
| P_Accuracy | 100% | 73% | 100% | 93% | 86% | 0 | 84% | 0 |
| Kappa | 0 | 0 | 0 | 0 | 0 | 0 | 0 | 0.79 |
| Land Use Classes | Land Use Area (km2) | Change Detection (km2) | ||||
|---|---|---|---|---|---|---|
| 1986 | 2015 | 2024 | 1986–2015 | 1986–2024 | 2015–2024 | |
| Water Bodies | 4291.00 (6.5%) | 1629.0 (3.1%) | 1015,9.0 (1.9%) | −2662.0 (−62.0%) | −3275.1 (−76.3%) | −613.1 (−37.6%) |
| Rainforest | 25,289.22 (38.41%) | 19,345.81 (36.5%) | 14,444.96 (27.6%) | −5943.4 (−23.5%) | −10,844.3 (−42.9%) | −4900.8 (−25.3%) |
| Built-up | 1465.42 (2.22%) | 5231.14 (9.9%) | 9694.42 (18.5%) | 3765.7 (257.0%) | 8229.0 (561.5%) | 4463.3 (85.3%) |
| Agriculture | 8474.76 (12.9%) | 11,065.16 (20.8%) | 15,202.06 (29.0%) | 2590.4 (30.6%) | 6727.3 (79.4%) | 4136.9 (37.4%) |
| Mangrove | 26,326.79 (40.0%) | 15,801.48 (29.8%) | 11,976.19 (22.9%) | −10,525.3 (−40.0%) | −14,350.6 (−54.5%) | −3825.3 (−24.2%) |
| Region | Year | Waterbodies | Rainforest | Built-Up | Agriculture | Mangrove | |||||
|---|---|---|---|---|---|---|---|---|---|---|---|
| Changes | Changes | Changes | Changes | Changes | |||||||
| km2 | % | km2 | % | km2 | % | km2 | % | km2 | % | ||
| Akwa Ibom | 1986–2015 | −54.0 | −47.8 | 254.0 | −10.0 | 180.0 | 88.7 | 1540.0 | 86.8 | −1966 | −72.6 |
| 2015–2024 | 3.0 | 5.1 | −265.0 | 0.5 | 644.0 | 168 | −602.0 | −18.2 | 220.0 | −33.4 | |
| 1986–2024 | −51.0 | −45.1 | −11.0 | −10.4 | 824.0 | 405 | 938.0 | 52.9 | −1746 | −81.8 | |
| Bayelsa | 1986–2015 | −685.0 | −54.5 | −444.0 | −46.2 | 17.0 | 18.7 | 295.0 | 228.7 | 815.0 | 14.3 |
| 2015–2024 | −141.0 | −24.7 | 2694.0 | −17.0 | 139.0 | 128.7 | 253.0 | 59.7 | −2947 | −45.3 | |
| 1986–2024 | −826.0 | −65.7 | 2250 | −55.4 | 156.0 | 171.4 | 548.0 | 424.8 | −2132 | −37.4 | |
| Cross River | 1986–2015 | −550.0 | −71.1 | 5860 | −17.7 | 1043 | 273.8 | 2809.0 | 88.8 | −9362 | −88.1 |
| 2015–2024 | 78.0 | 34.8 | −2306 | −33.1 | 1891.0 | 132.8 | −221.0 | −3.7 | 557.0 | −47.0 | |
| 1986–2024 | −472.0 | −61.0 | 3554 | −45 | 2934.0 | 770.1 | 2588.0 | 81.8 | −8805 | −93.7 | |
| Delta | 1986–2015 | −1203.0 | −67.7 | −6051 | −67.8 | 502.0 | 108.0 | 5722.0 | 298.0 | 1032 | −19.0 |
| 2015–2024 | 40.0 | 7.0 | 340.0 | 11.8 | 2426.0 | 250.9 | −1933.0 | −25.3 | −873 | −4.3 | |
| 1986–2024 | −1163.0 | −65.4 | −5711 | −64.0 | 2928.0 | 629.7 | 3789.0 | 197.3 | 159 | −22.4 | |
| Rivers | 1986–2015 | −260.0 | −70.5 | −1502 | −38.3 | 535.0 | 237.8 | 841.0 | 40.5 | 358 | −12.5 |
| 2015–2024 | 402.0 | 108.9 | 205 | −9.8 | 1579.0 | 207.8 | −1438.0 | −49.3 | −749 | −15.6 | |
| 1986–2024 | 142.0 | 38.5 | −1297 | −44.3 | 2114.0 | 939.6 | −597.0 | −28.8 | −391.0 | −26.2 | |
| State | Population |
|---|---|
| Akwa Ibom | 3,920,208 |
| Bayelsa | 1,703,358 |
| Cross River | 21,000 |
| Delta | 4,098,391 |
| Rivers | 5,185,420 |
Disclaimer/Publisher’s Note: The statements, opinions and data contained in all publications are solely those of the individual author(s) and contributor(s) and not of MDPI and/or the editor(s). MDPI and/or the editor(s) disclaim responsibility for any injury to people or property resulting from any ideas, methods, instructions or products referred to in the content. |
© 2025 by the authors. Licensee MDPI, Basel, Switzerland. This article is an open access article distributed under the terms and conditions of the Creative Commons Attribution (CC BY) license (https://creativecommons.org/licenses/by/4.0/).
Share and Cite
Agumagu, O.O.; Marchant, R.; Stringer, L.C. Land Use and Land Cover Change Dynamics in the Niger Delta Region of Nigeria from 1986 to 2024. Land 2025, 14, 765. https://doi.org/10.3390/land14040765
Agumagu OO, Marchant R, Stringer LC. Land Use and Land Cover Change Dynamics in the Niger Delta Region of Nigeria from 1986 to 2024. Land. 2025; 14(4):765. https://doi.org/10.3390/land14040765
Chicago/Turabian StyleAgumagu, Obroma O., Robert Marchant, and Lindsay C. Stringer. 2025. "Land Use and Land Cover Change Dynamics in the Niger Delta Region of Nigeria from 1986 to 2024" Land 14, no. 4: 765. https://doi.org/10.3390/land14040765
APA StyleAgumagu, O. O., Marchant, R., & Stringer, L. C. (2025). Land Use and Land Cover Change Dynamics in the Niger Delta Region of Nigeria from 1986 to 2024. Land, 14(4), 765. https://doi.org/10.3390/land14040765