Article

Exploring the Synergy Between Transport Superiority and the Rural Population System in Yunnan Province: A Temporal and Spatial Analysis for 2013 to 2021

College of Land Science and Technology, China Agricultural University, Beijing 100193, China
*
Author to whom correspondence should be addressed.
Land 2025, 14(4), 762; https://doi.org/10.3390/land14040762
Submission received: 2 March 2025 / Revised: 29 March 2025 / Accepted: 1 April 2025 / Published: 3 April 2025
(This article belongs to the Special Issue Rural Demographic Changes and Land Use Response)

Abstract

:
Yunnan Province, which is located in the mountainous plateau region of China, faces numerous challenges, including the population decline of rural areas. Achieving coordinated development between the transportation and rural population systems is crucial for fostering sustainable growth. In this study, we developed a rural population pressure state response (PPSR) model and a comprehensive transport superiority (TS) model that considers the influence of aviation. We quantified the rural population system and horizontal transportation superiority across Yunnan’s districts and counties for the period 2013 to 2021, examining their temporal and spatial heterogeneity. Using a spatial autocorrelation model, we also explored the trade-offs and synergy between Yunnan’s TS and PPSR. The main findings are as follows. (1) From 2013 to 2021, the spatial polarization pattern of PPSR in Yunnan Province gradually weakened, and there were different degrees of rural contraction overall. (2) From 2013 to 2021, Yunnan’s TS significantly increased, with aviation conditions having a notably positive impact, further strengthening Kunming’s position as the regional core. (3) In Yunnan, the relationship between TS and PPSR is significant, with a collaborative pattern emerging across districts and counties, reflecting distinct regional characteristics and a degree of polarization. This study provides valuable insights for integrating urban and rural development in plateau and mountainous areas and offers a new perspective for rural revitalization.

1. Introduction

Rural population decline has become a global issue, particularly in the context of urbanization [1]. Over the past two decades, China’s urbanization rate has increased from 42.99% to 66.16%, leading to significant changes in the social structure, economy, culture, and ecology of rural areas [2]. However, villages in plateau and mountainous regions face even more severe environmental and social challenges [3]. The population decline of rural areas in these regions is driven primarily by an imbalance in social spatial distribution, with resources and services highly concentrated in urban centers, and the marginalization of rural areas in economic, social, and political spheres. As a result, these challenges have a profound impact on the well-being of rural populations in plateau and mountainous areas and present significant obstacles to their sustainable development [4].
To address rural population decline, China has been implementing the Rural Revitalization Strategy since 2017, with poverty reduction as its central goal. This strategy aims to optimize various factors, such as land use, population distribution, and infrastructure, with the ultimate objective of achieving the integration of urban and rural development [5]. Population and transportation are two essential factors in solving the issue of rural population decline. A stable population system ensures a sustainable labor force and continued market demand in rural areas, both of which are crucial for revitalizing rural communities [6,7]. In contrast, transportation serves as a key enabler, breaking the isolation of rural areas and facilitating the flow of resources. Improved transportation connects rural areas to markets, enhances agricultural product sales, attracts tourism and investment, and stimulates overall economic prosperity. The significant wage gap between rural and urban areas has led to the migration of much of the rural population to cities and towns, contributing to rural depopulation and the phenomenon of rural hollowing [8]. Yunnan, a mountainous province in southwestern China with a strong reliance on traditional agriculture, faces severe challenges in certain remote areas due to poor transportation infrastructure, which exacerbates population loss and hinders regional economic development [9,10]. Thus, examining both population dynamics and transportation from a dual perspective provides valuable insights for addressing rural population decline, promoting rural revitalization, and fostering sustainable development in plateau and mountainous areas.
The population plays a fundamental role in rural development, serving as a key driver of social and economic progress [11]. Extensive research in rural sociology has examined the dynamics of rural populations, which have contributed to phenomena such as rural hollowing and population aging [12]. These changes impact various aspects, including land use policies, agricultural carbon emissions, and household saving rates in both urban and rural areas [13,14,15]. Recent studies addressing rural population systems have focused on quantitative measurements, changes in settlement patterns, driving forces, and institutional factors [16,17,18]. The advent of geographic information system (GIS) and remote sensing (RS) technologies has enhanced rural population research by providing multisource data, such as nighttime light data and social media big data [19,20]. These advances have led to the development of new methodologies, such as the use of nuclear density and concentration indices to analyze the distribution of rural hollowing [21]. For example, nighttime lighting datasets have been employed to assess the relative poverty risk of counties in China [22]. Building on the diverse research methods used in rural population studies, this paper explores the widely adopted pressure–state–response (PSR) model as a systematic and quantitative approach to addressing rural population challenges. The PSR model is a proven model that is used in various researches worldwide to assess ecological health and security [23]. Previous studies have demonstrated that the population system analysis process aligns well with the PSR framework. For example, the PSR model has been used to establish evaluation indices for urban population health resilience and to assess the multidimensional welfare sustainability of resettled residents [24,25]. However, while the PSR model has been extensively applied to urban populations, its use in evaluating the sustainable development of rural population systems remains relatively underexplored.
Transportation plays a critical role in both urban and rural sustainable development, structural optimization, and transformation. It is essential for addressing rural population decline and significantly influences the spatial distribution of rural population settlements [26,27,28]. In plateau and mountainous regions, transportation is crucial for the circulation of agricultural products and population movement, and it serves as a dynamic enabler for the flow of urban and rural resources. Previous research on urban–rural transportation systems has improved our understanding of rural distribution patterns, specifically the relationship between urban and rural areas. Considerable attention has been given to issues such as improving rural road infrastructure on the basis of accessibility, analyzing the impact of transportation infrastructure on the urban–rural income gap, and exploring the circulation function of civil aviation in relation to the population, economy, and agricultural products [29,30,31]. However, there remains a lack of research on the relationship between transportation conditions and rural population systems, particularly the comprehensive consideration of various transportation modes—aviation, high-speed rail, and roads—of different types and levels in specific regions such as plateau and mountainous areas. Therefore, further research is needed to develop a model for systematically evaluating transportation superiority in these regions.
The relationship between transportation and population is a key focus of research in both transportation geography and population geography. Previous studies on this relationship are primarily qualitative, with limited quantitative analysis. Dai et al. argued that rural infrastructure development acts as both a “pull” factor for rural populations returning to start businesses and a “push” factor for rural development [32]. Peng et al. reported that improved transportation accessibility helps reduce poverty rates among rural populations [33]. Through an analysis of county accessibility and population distribution, Wang et al. suggested that transportation conditions have a stronger impact on population concentration in less-developed rural areas than in more-developed regions [34]. Their research indicates that transportation development has a nonlinear effect on rural settlement patterns [16]. However, most previous studies have struggled to address this issue from a single-factor perspective, such as infrastructure or labor. There is a pressing need to consider rural revitalization and the coupling mechanisms between urban and rural factors. The coordinated development of these elements is crucial for sustainable rural development. To date, few studies have quantitatively analyzed the trade-offs and synergies between transportation advantages in plateau and mountainous areas and rural population systems. This study, therefore, employs spatial econometric methods to explore the trade-offs and synergies between these two factors, providing a new perspective and quantitative foundation for addressing the challenges in rural revitalization and urban–rural factor coupling.
Owing to natural environmental constraints, rural population mobility in Yunnan Province, the focus of this research, is highly dependent on transportation development. Rural settlements are scattered, with limited mobility, leading to increased poverty risk in certain areas. Moreover, urbanization has caused population shrinkage in certain rural regions. Given the importance of aviation for both the population and rural industries in this area, it is essential to study the development levels and interrelationships of transportation and the population. These factors are critical for the integrated development of urban and rural areas. Therefore, in this study focused on Yunnan Province, we construct a comprehensive transportation superiority (TS) model and a PPSR model to explore the spatial coordination between transportation conditions and the rural population in mountainous regions using kernel density analysis and spatial autocorrelation analysis.
The specific objectives of this study are (1) to quantify the levels of TS and PPSR and their spatiotemporal heterogeneity and (2) to examine the trade-offs between transportation conditions and the rural population system in southwestern mountainous areas so as to provide recommendations for better coordinating urban and rural factor flows and addressing rural challenges. This study aims to support research on rural revitalization pathways in mountainous areas, help alleviate rural issues, promote the coordinated development of urban and rural areas, and offer insights for the regional development of similar rural areas.

2. Materials and Methods

2.1. Study Area

Yunnan Province is located on the southwestern frontier of China, between latitudes 21°8′ N and 29°15′ N and longitudes 97°31′ E and 106°11′ E (Figure 1). The province spans 394,100 square kilometers and is home to 16 prefecture-level cities and 129 counties. Approximately 84% of the land area is mountainous, while plateaus and hills account for approximately 10%. Agricultural and population activities are predominantly concentrated in the relatively mild terrain of the lowland areas, which make up only 6.71% of the total land area. In 2021, the operational railway mileage in Yunnan reached 4744.37 km, and the total length of highways was 309,900 km. The China–Laos Railway and Changshui International Airport provide significant benefits to the plateau’s characteristic agriculture and population flow in Yunnan. In 2021, the province’s total population was 46.9 million, with an urbanization rate of 51.05%. Geographical, economic, and other factors have led to an uneven population distribution, with 12 prefecture-level cities having more rural residents than urban ones. This has resulted in disparities in regional and urban–rural development.

2.2. Data Resources

The data used in this paper span the years 2013 through 2021. The vector data for roads (including motorways; trunk roads; and primary, secondary, and tertiary roads) and railways (comprising ordinary and high-speed railways) of various grades and types were sourced from the OpenStreetMap (OSM) website “https://www.openstreetmap.org/ (accessed on 1 February 2025)” The point of interest (POI) data for fifteen civil aviation airports in Yunnan were obtained from the Civil Aviation Administration of China “https://www.caac.gov.cn/ (accessed on 1 February 2025)”. Nighttime lighting data with a spatial resolution of 1 km were derived from the DMSP-OLS dataset, which is collected by the meteorological satellite of the Defense Meteorological Satellite Program (DMSP). The population grid data, which were based on the global population density distribution, were sourced from LandScan, which was developed by the Oak Ridge National Laboratory of the U.S. Department of Energy and has a spatial resolution of 1 km. Passenger and cargo throughput data for airports were drawn from the statistical bulletin on civil aviation airport production issued by the Civil Aviation Administration of China. The original statistical data for other indicators were obtained from the Statistical Yearbook of Yunnan Province. Null values and outliers in statistical data were removed.

2.3. Method

2.3.1. Measurement of Comprehensive Transportation Superiority

The urban–rural transportation system has a complex structure. To comprehensively and quantitatively assess the transportation development level in Yunnan Province, this paper proposes an improved transportation superiority (TS) model, which incorporates three key factors: “quantity”, “quality”, and “potential” [35,36]. The model is defined as follows:
T S i = α 1 M i + β i ( α 2 A i + α 3 Q i )
where T S i represents the comprehensive transportation advantage index for each district and county. M i , A i , and Q i correspond to standardized values for road network density, traffic accessibility, and location advantage, respectively. β i is the aviation impact coefficient of forward standardization treatment. The weights of the three indicators α 1 , α 2 , and α 3 are assigned by the proportional weighting method, α 1 = α 2 = α 3 .
(1)
Measurement of “Quantity”—Weighted Road Network Density
The weighted road network density represents the “quantity” component of comprehensive transportation superiority [37]. The weights of different road grades are established in accordance with the “Code for Design of Highway Routes in China” (JTG D20-2017) [38]. The weights are determined through literature reviews of similar mountainous regions in southwestern China [39], expert scoring of Yunnan’s geographical constraints (e.g., terrain, speed limits, and road scale), and a fuzzy comprehensive evaluation method to calculate averaged weights. Railway network density is equally weighted due to its limited mileage (Table 1). The formula is as follows:
M i = j 7 P j L i j / S i
where M i represents the regional road network density in km/km2, P j is the weight value reflecting the traffic capacity of different types of roads, L i j is the total mileage of each road type within the region, and S i is the territorial area of the region. Since the railway network density is relatively small, the railway mileage is treated with equal weight.
(2)
Construction of a Grid Dataset for Comprehensive Transportation Cost
In this study, a cost grid dataset is constructed on the basis of space–time factors and the comprehensive OpenStreetMap (OSM) dataset. This grid dataset is used to assess traffic accessibility and location advantages. The study area is divided into 1 km × 1 km grids. Given that the area is relatively small compared with Yunnan Province and that internal accessibility differences are negligible, each grid is treated as a homogeneous point of accessibility.
To measure time costs, spatial distances must be converted into time distances, with different driving speeds and associated time costs assigned to each road type. In accordance with the road speed settings outlined in the “Technical Standard for Highway Engineering” (People’s Republic of China, JTGB01-2020) [40], the road types in the OSM dataset are matched with those specified in the Chinese standard, and the corresponding driving speeds for each level are determined (Table 2). For areas without roads, a traffic speed of 5 km/h is assumed.
(3)
Construction of the Aviation Impact Coefficient Model
In this study, a 100 km buffer zone is established around civil airports to define their service radius, and the aviation impact coefficient β i is calculated [35]. After reverse standardization, this coefficient is used as a correction factor for traffic accessibility and location advantage in the TS model. Within the buffer zones of each district and county, the number of airports, the level of each airport, the time grid cost, and spatial impedance are considered. The more airports present and the higher their level, the lower the time grid cost and spatial impedance.
  β i = 1 / m = 1 n l n ( N m + b 0 ) ω m
where N m is the number of m grade airports in the buffer zone defined according to districts and counties. This study sets b 0 as e to avoid the influence of a no-airport research unit on the research results. According to the classification of flight zones in China, there are three types of airports with different grades (4C, 4D, and 4F) in Yunnan Province, and ω m is the weight of m grade airports. For airport cargo throughput, passenger throughput, and takeoff and landing sorties, the weights of different grades of airports are determined via the AHP as follows: 4C (0.047), 4D (0.153), and 4F (0.800).
(4)
Measurement of “Quality”—Traffic Accessibility
The “quality” of TS is more clearly expressed in terms of “convenience”. In this study, the average reachable time method and the cost distance analysis tool in ArcGIS 10.8 are used to establish the time cost grid from each district to any grid in the study area and calculate the average time cost from each research unit to any grid.
  A i = p = 1 q T i p / q
where A i is the average time cost from each district to any grid, which is regarded as the traffic accessibility index. T i p is the time cost from research unit i to the p grid, and q is the total number of grids in the study area. The larger the index is, the worse the traffic accessibility.
(5)
Measurement of “Potential”—Location Advantage
The “potential” location advantage degree refers to the convenience in reaching the central city of a district or county. This study uses the cost grid statistical method to measure the degree of location advantage of each unit. The time cost grid from the provincial capital Kunming to any grid in each district and county is studied and established, and the average time cost of each district and county to Kunming is calculated.
Q i = j = 1 q T j / q i
where Q i is the average time cost from each district and county to the central city, T j is the location advantage index (i.e., the time cost from the grid to the central city in the research unit), and q i is the number of grids in the research unit. The larger the index, the worse the location advantage. The average time cost of the counties under the jurisdiction of Kunming is 0. Translation processing is used in the process of backward standardization.

2.3.2. Population Subsystem Measurement

Against the background of urban–rural integration, trends of rural contraction and vulnerability appear. This study constructs a population pressure state response (PPSR) rural population evaluation model, which is standardized and weighted via the entropy method.
P P S R i = 0.156 Con i + 0.386 Y i , t + 0.508 R i
where P P S R i is the rural population evaluation index of each district and county, whereas Con i , Y i , t , and R i are the standardized rural contraction index, rural population concentration index, and poverty return risk index, respectively, which are weighted by the entropy method.
(1)
Pressure—Poverty Return Risk Index
In this study, nighttime lighting and population remote sensing data were used to measure the poverty return risk index to reflect the “pressure” of the rural population system. The data processing workflow of the indicator is as follows [41,42]: extract the dark manned grid according to the mask, calculate the population in the dark manned grid of each district and county and the total population of the county, and then calculate the ratio of the two. The formula is as follows:
Z i , t = G p o v e r t y p o p d , t = L i g h t d , t × P d , t
R i , t = Z i , t P i , t = L i g h t d , t × P d , t P d , t
where L i g h t is the assignment for the identification of the matte grid, G p o v e r t y p o p represents the population in the matte manned grid, P d , t is the population in the original grid, and d and t refer to the grid and year, respectively. Z i , t is the total population without a light grid within each district and county. R i , t is the poverty return risk index of each district and county and is the ratio of the population in the high poverty return risk area of each district and county to the total population.
(2)
Status—Rural Contraction Index
This study uses the rural resident population to measure the rural contraction index to reflect the “state” of the rural population system. This study is based on the change rate of the rural resident population in the same interval periods: from 2005 to 2013 and 2013 to 2021. The specific formula is as follows:
C o n i = ( P i 2 / P i 1 n 1 )
where C o n i refers to the rural contraction index of a unit within the time range; n is the number of years within the study period; P i 1 indicates the number of rural permanent residents at the county level in the base period of the unit study; and P i 2 indicates the number of rural permanent residents at the county level at the end of the unit study. At that time, C o n i 0 indicates that the rural area was growing, and the greater the value, the more significant the rural growth. C o n i < 0 indicates that the rural area was shrinking, and | C o n i | indicates that the greater the rural contraction index, the more significant the rural contraction.
(3)
Response—Agricultural Population Concentration
The “one county, one industry” policy in Yunnan Province has led to the agglomeration of the agricultural population into small towns. In this study, agricultural population concentration is used to measure the “response” characteristics of the spatial distribution of the rural population [43]. The calculation formula is as follows:
R i = R P O P i / R P O P i S i / S i
where R i refers to the concentration index of the agricultural population in a unit. R P O P i and S i indicate the permanent resident population and area of the district and county in the unit, respectively. R P O P i and S i refer to the rural permanent population and provincial area of the province, respectively; the higher the agricultural population concentration index R R P O P i , the stronger the agricultural economic agglomeration of the unit.

2.3.3. Data Standardization and the Entropy Method

In this study, several indicators need to be dimensionally processed, and then the entropy method is used to calculate the weight and score, which can reflect the original information represented by each indicator and enhance the objectivity of the study.
X i j = X i j X j min X j max X j min
X i j = X j max X i j X j max X j min
S i = j = 1 m S i j = j = 1 m w j × X i j
where X i j and X i j are the original value and standardized value of the index in the region, respectively, and where X j min and X j max are the minimum and maximum values of the index, respectively. S i j is the index score of the unit production function. S i is the score of the area and is represented by three indicators; thus, m = 3 . w j is the weight of the index, and the other function evaluation methods are the same.

2.3.4. Trade-Off Coordination Relationship Analysis—Spatial Autocorrelation

The Moran index can measure the correlation between adjacent units in space. This paper constructs the queen spatial adjacency matrix and uses bivariate local spatial autocorrelation to explore the distribution pattern and evolution law of the trade-off and synergy relationships between variables quantitatively [44]. The definition of bivariate local spatial autocorrelation is as follows:
I k l i = X k i X ¯ k σ k j = 1 n w i j X l j X ¯ l σ l
where X k i is the value of the attribute of the space unit; X l j is the value of the attribute of the space unit; X k ¯ and X l ¯ are the average values of city attributes k and l , respectively; σ k and σ l are the variances of attributes k and l , respectively; and w i j is the spatial connection matrix between spatial elements i and j .
Bivariate spatial autocorrelation analysis can yield five types of results: “high-high” (“H-H”), “low-low” (“L-H”), “high-low” (“H-L”), “low-high” (“L-H”), and “not significant”. Here, “H-H” and “L-L” indicate that the proportion of two functions in the local area represents a positive spatial correlation, which is regarded as a collaborative relationship. “H-L” and “L-H” indicate that the proportion of the two functions in the local area is negatively correlated in space, which is regarded as a trade-off relationship. “Not significant” is indicative of two functions that are independent in this regional space.

3. Results

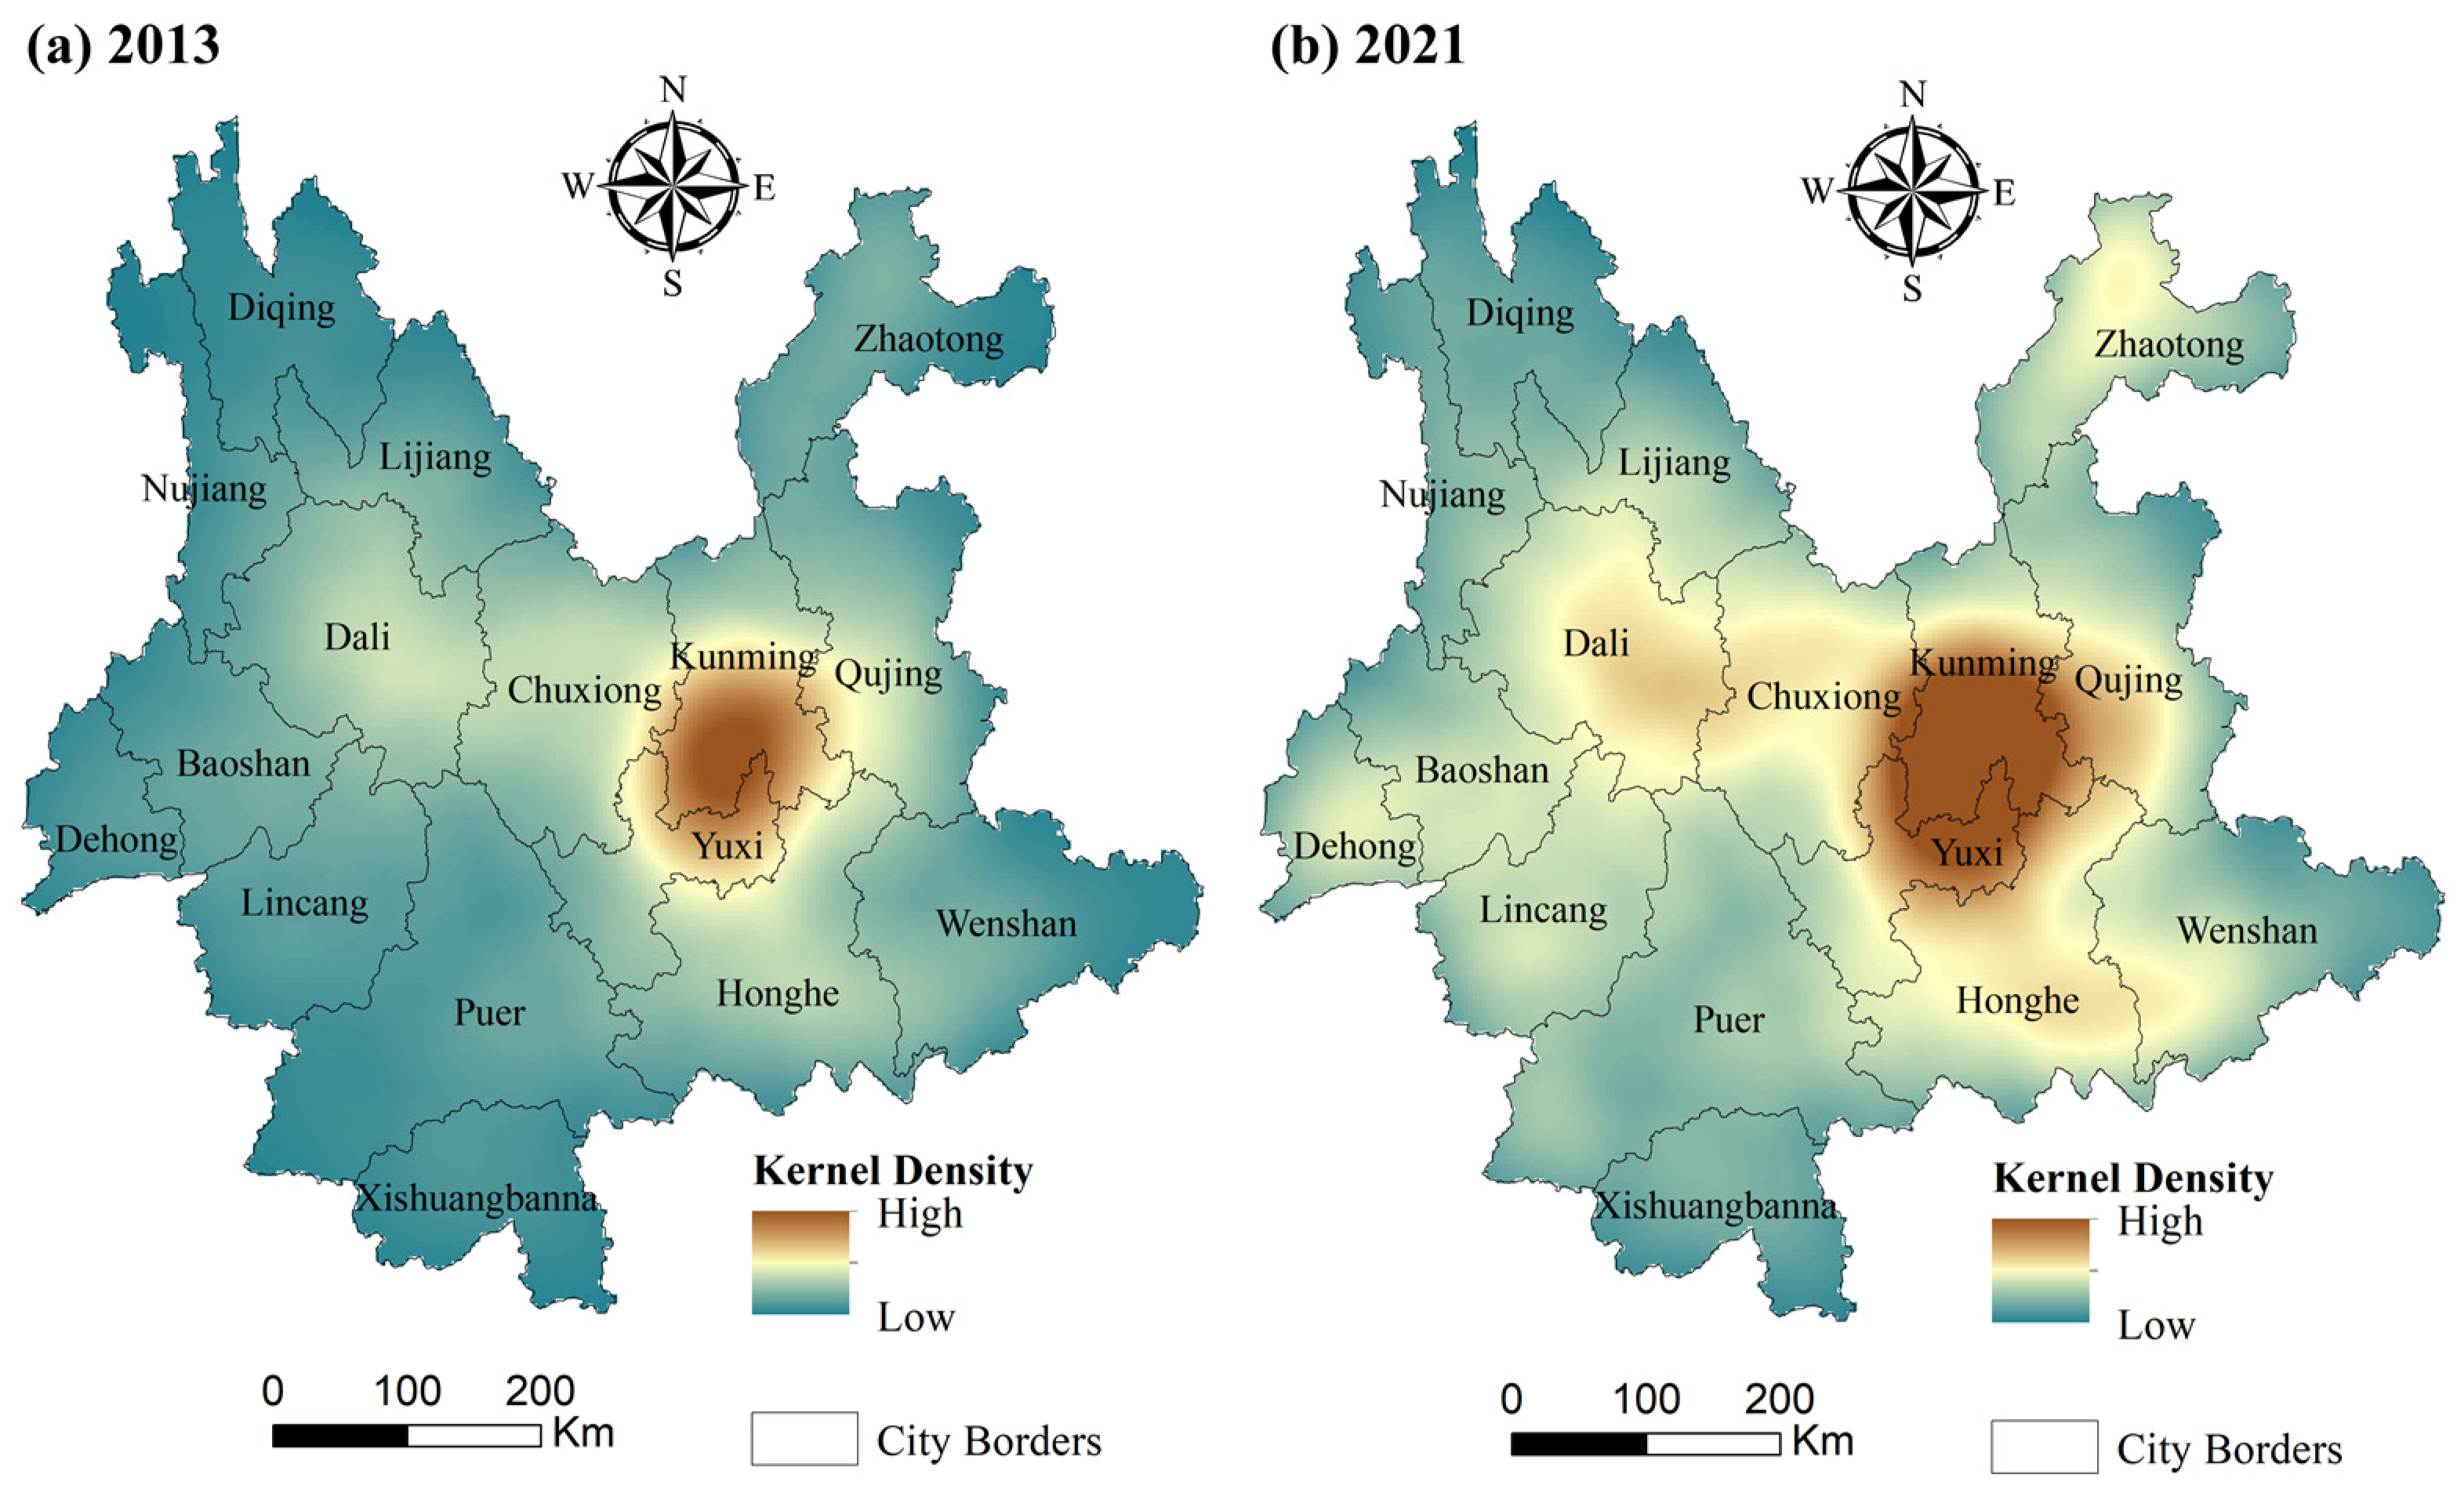
3.1. Kernel Density Analysis of TS Spatiotemporal Variation

Using kernel density analysis, the spatial distribution of transportation superiority (TS) across districts and counties in Yunnan Province is visualized. From 2013 to 2021, TS in Yunnan Province increased significantly, with a notable spatial clustering effect in cities such as Kunming and Yuxi in central Yunnan (Figure 2). The density gradually decreased toward the periphery, and the high-value areas expanded, which is consistent with the first law of geography, which posits that spatial correlation increases with geographical proximity. The urban agglomerations in central Yunnan exhibit high road accessibility and clear location advantages, forming a strong coupling relationship with the province’s overall economic development. However, the TS level in mountainous counties in northwestern Yunnan remains low due to limitations imposed by natural geography and economic conditions. By 2021, two high-value “channels” had emerged in central Yunnan, Dali, and Honghe. From 2013 to 2021, the degree of connectivity between expressways and railways improved, and the construction of the Shanghai–Kunming and Nanning–Kunming high-speed railways improved the linkage between central Yunnan’s urban agglomeration and its economic centers. During this period, the rural road network was largely established, and traffic-related poverty alleviation efforts led to an increase in social investments. Consequently, transportation conditions in remote mountainous areas of western Yunnan improved significantly. The continuous development of transportation infrastructure, coupled with rapid urbanization, not only facilitated the circulation of goods but also created opportunities for labor migration.

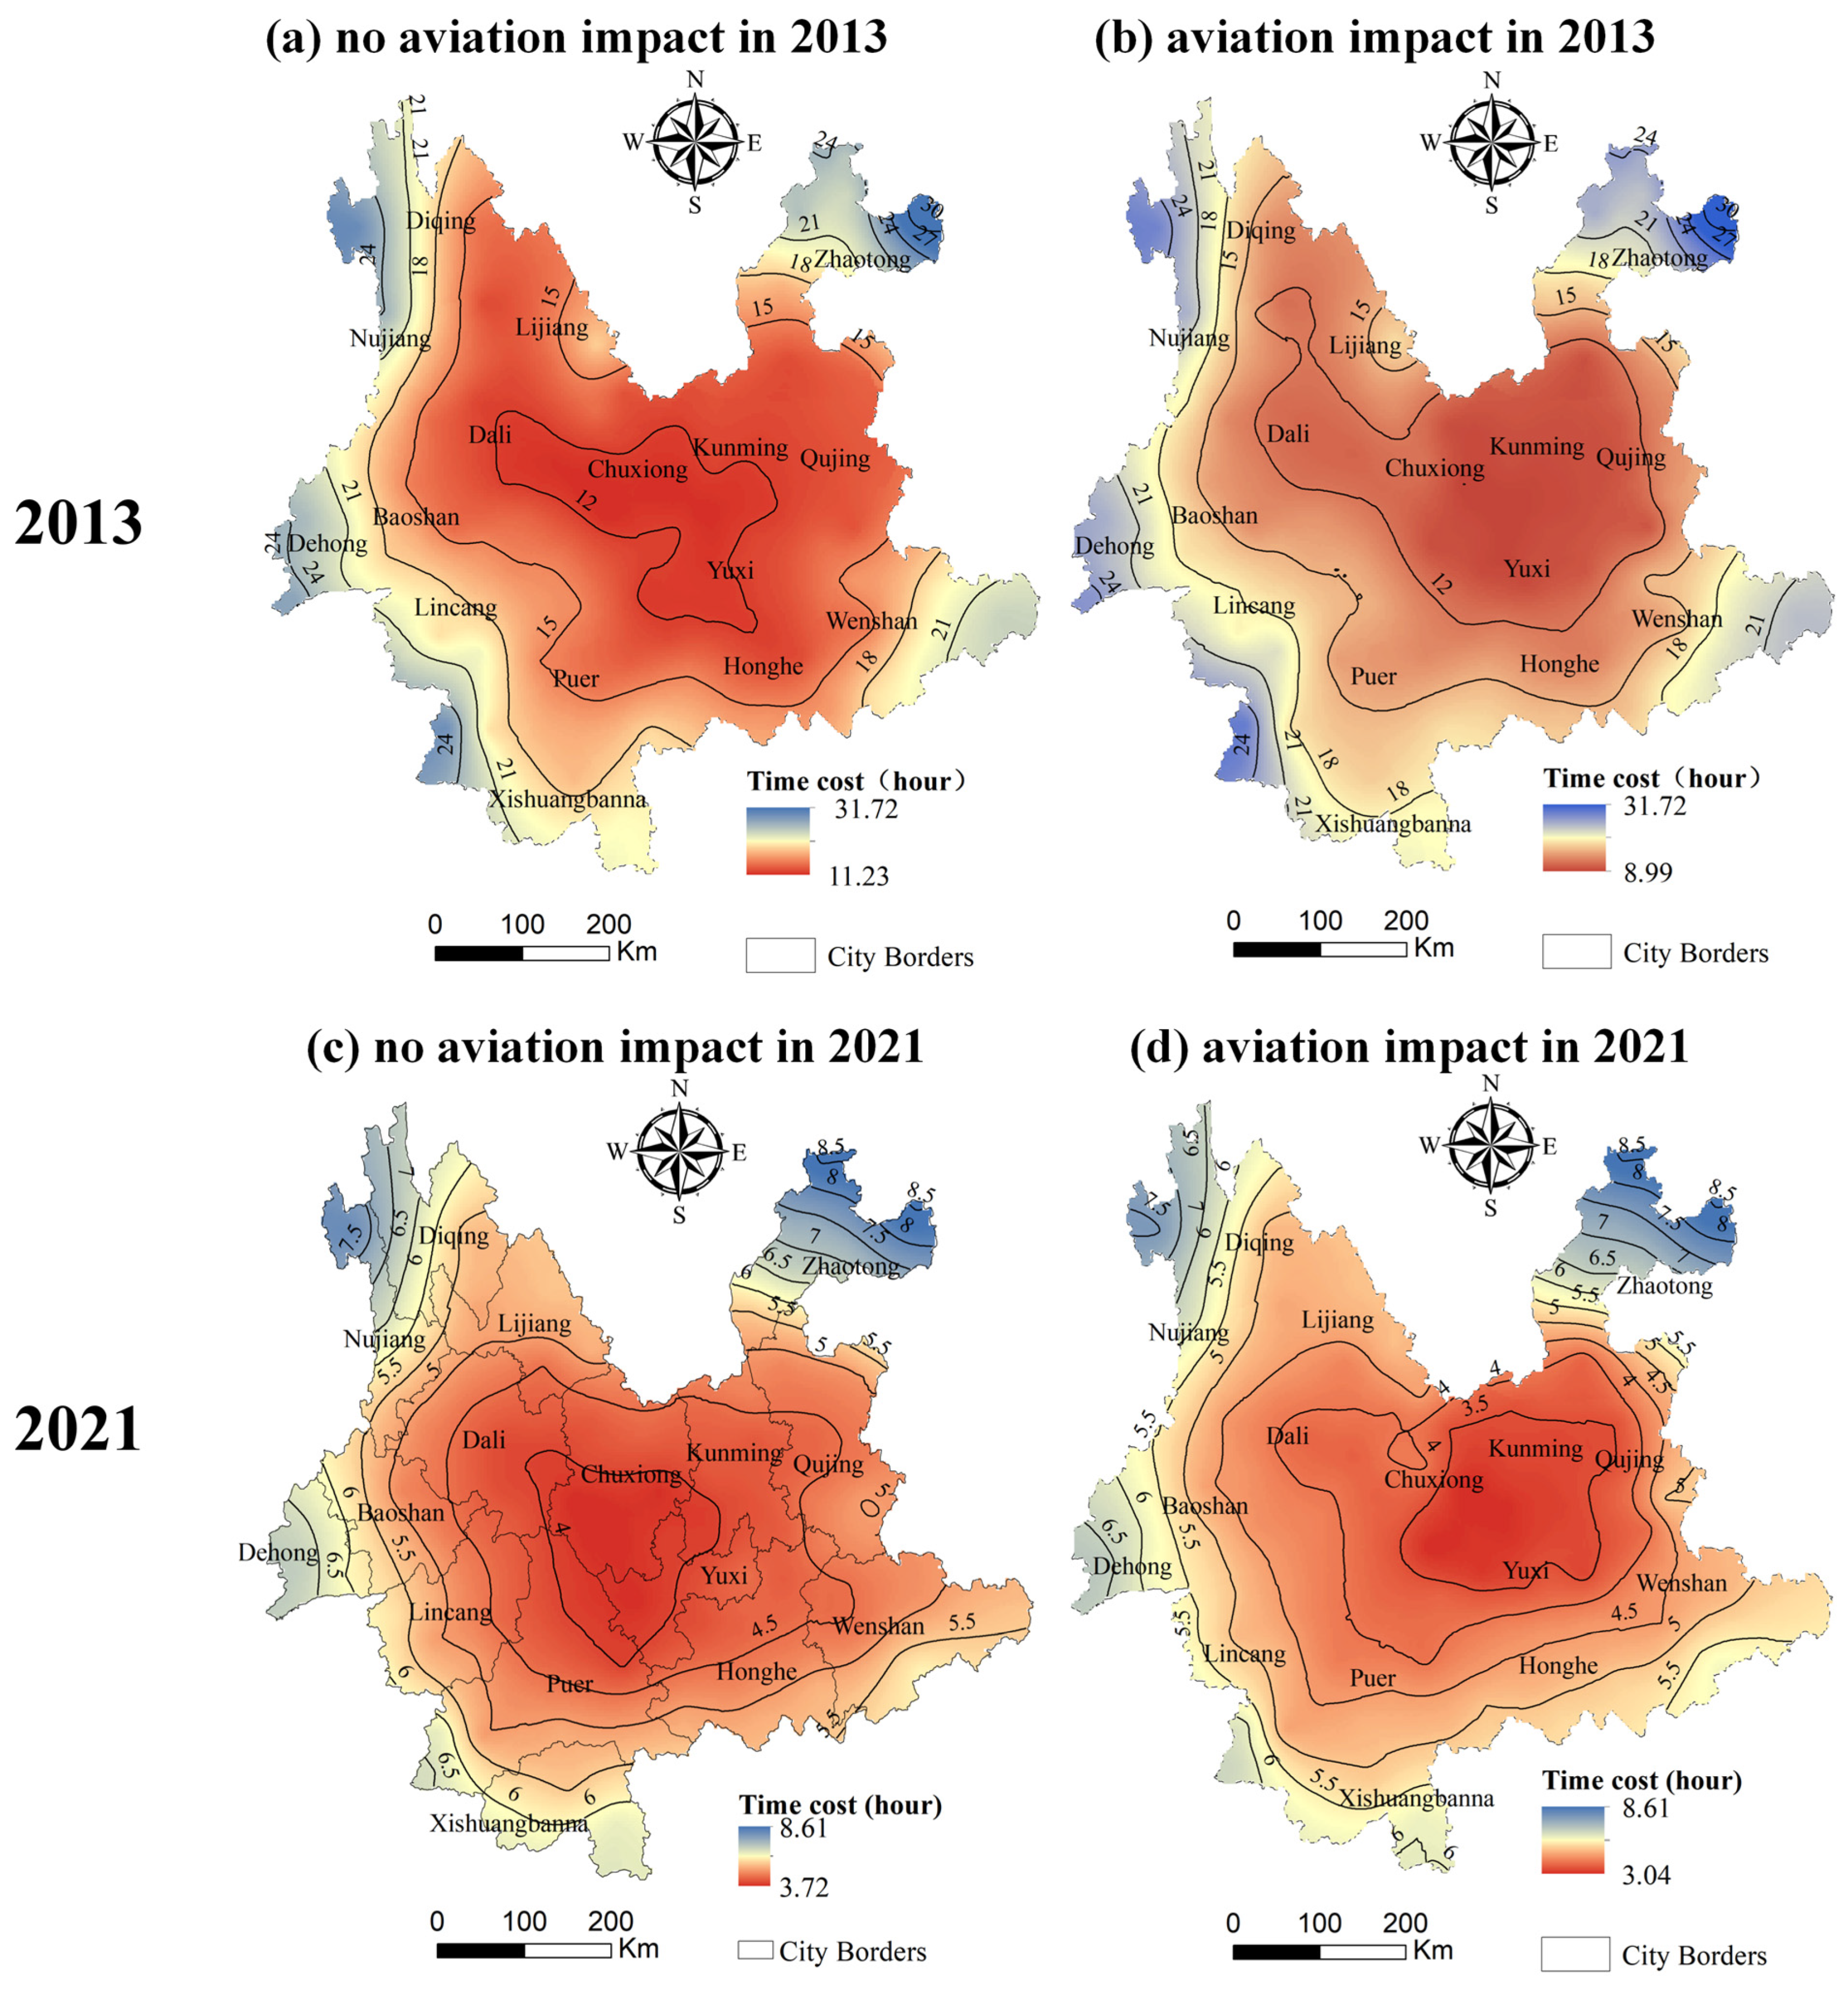
3.2. Analysis of the Aviation Enhancement Effect

On the basis of the temporal and spatial variations in TS, traffic accessibility results are interpolated by kriging, and accessibility time contours are extracted (Figure 3). The impacts of aviation on traffic accessibility from 2013 to 2021 are compared. The average accessibility times of cities in Yunnan Province in 2013 and 2021 were 15.67 h and 5.03 h, respectively. Under the influence of the aviation impact coefficient model, the average accessibility time for these cities decreased to 14.67 h in 2013 and 4.68 h in 2021, representing a reduction of approximately 8%. In the absence of aviation influence, the high-value area of traffic accessibility in Yunnan Province is located at the geographical center in a two-dimensional plane, with low-value areas concentrated along borders. From 2013 to 2021, overall traffic accessibility was centered in locations such as Chuxiong, Dali, and Yuxi, weakening from the central area to the surrounding regions. Under the influence of aviation conditions, the high-value area for traffic accessibility shifted significantly toward the provincial capital, Kunming. This shift indicates that aviation somewhat mitigated the spatial distance constraint on traffic, with Kunming’s accessibility increasing by more than 20% in 2021.

3.3. Measurement Results for the Rural Population

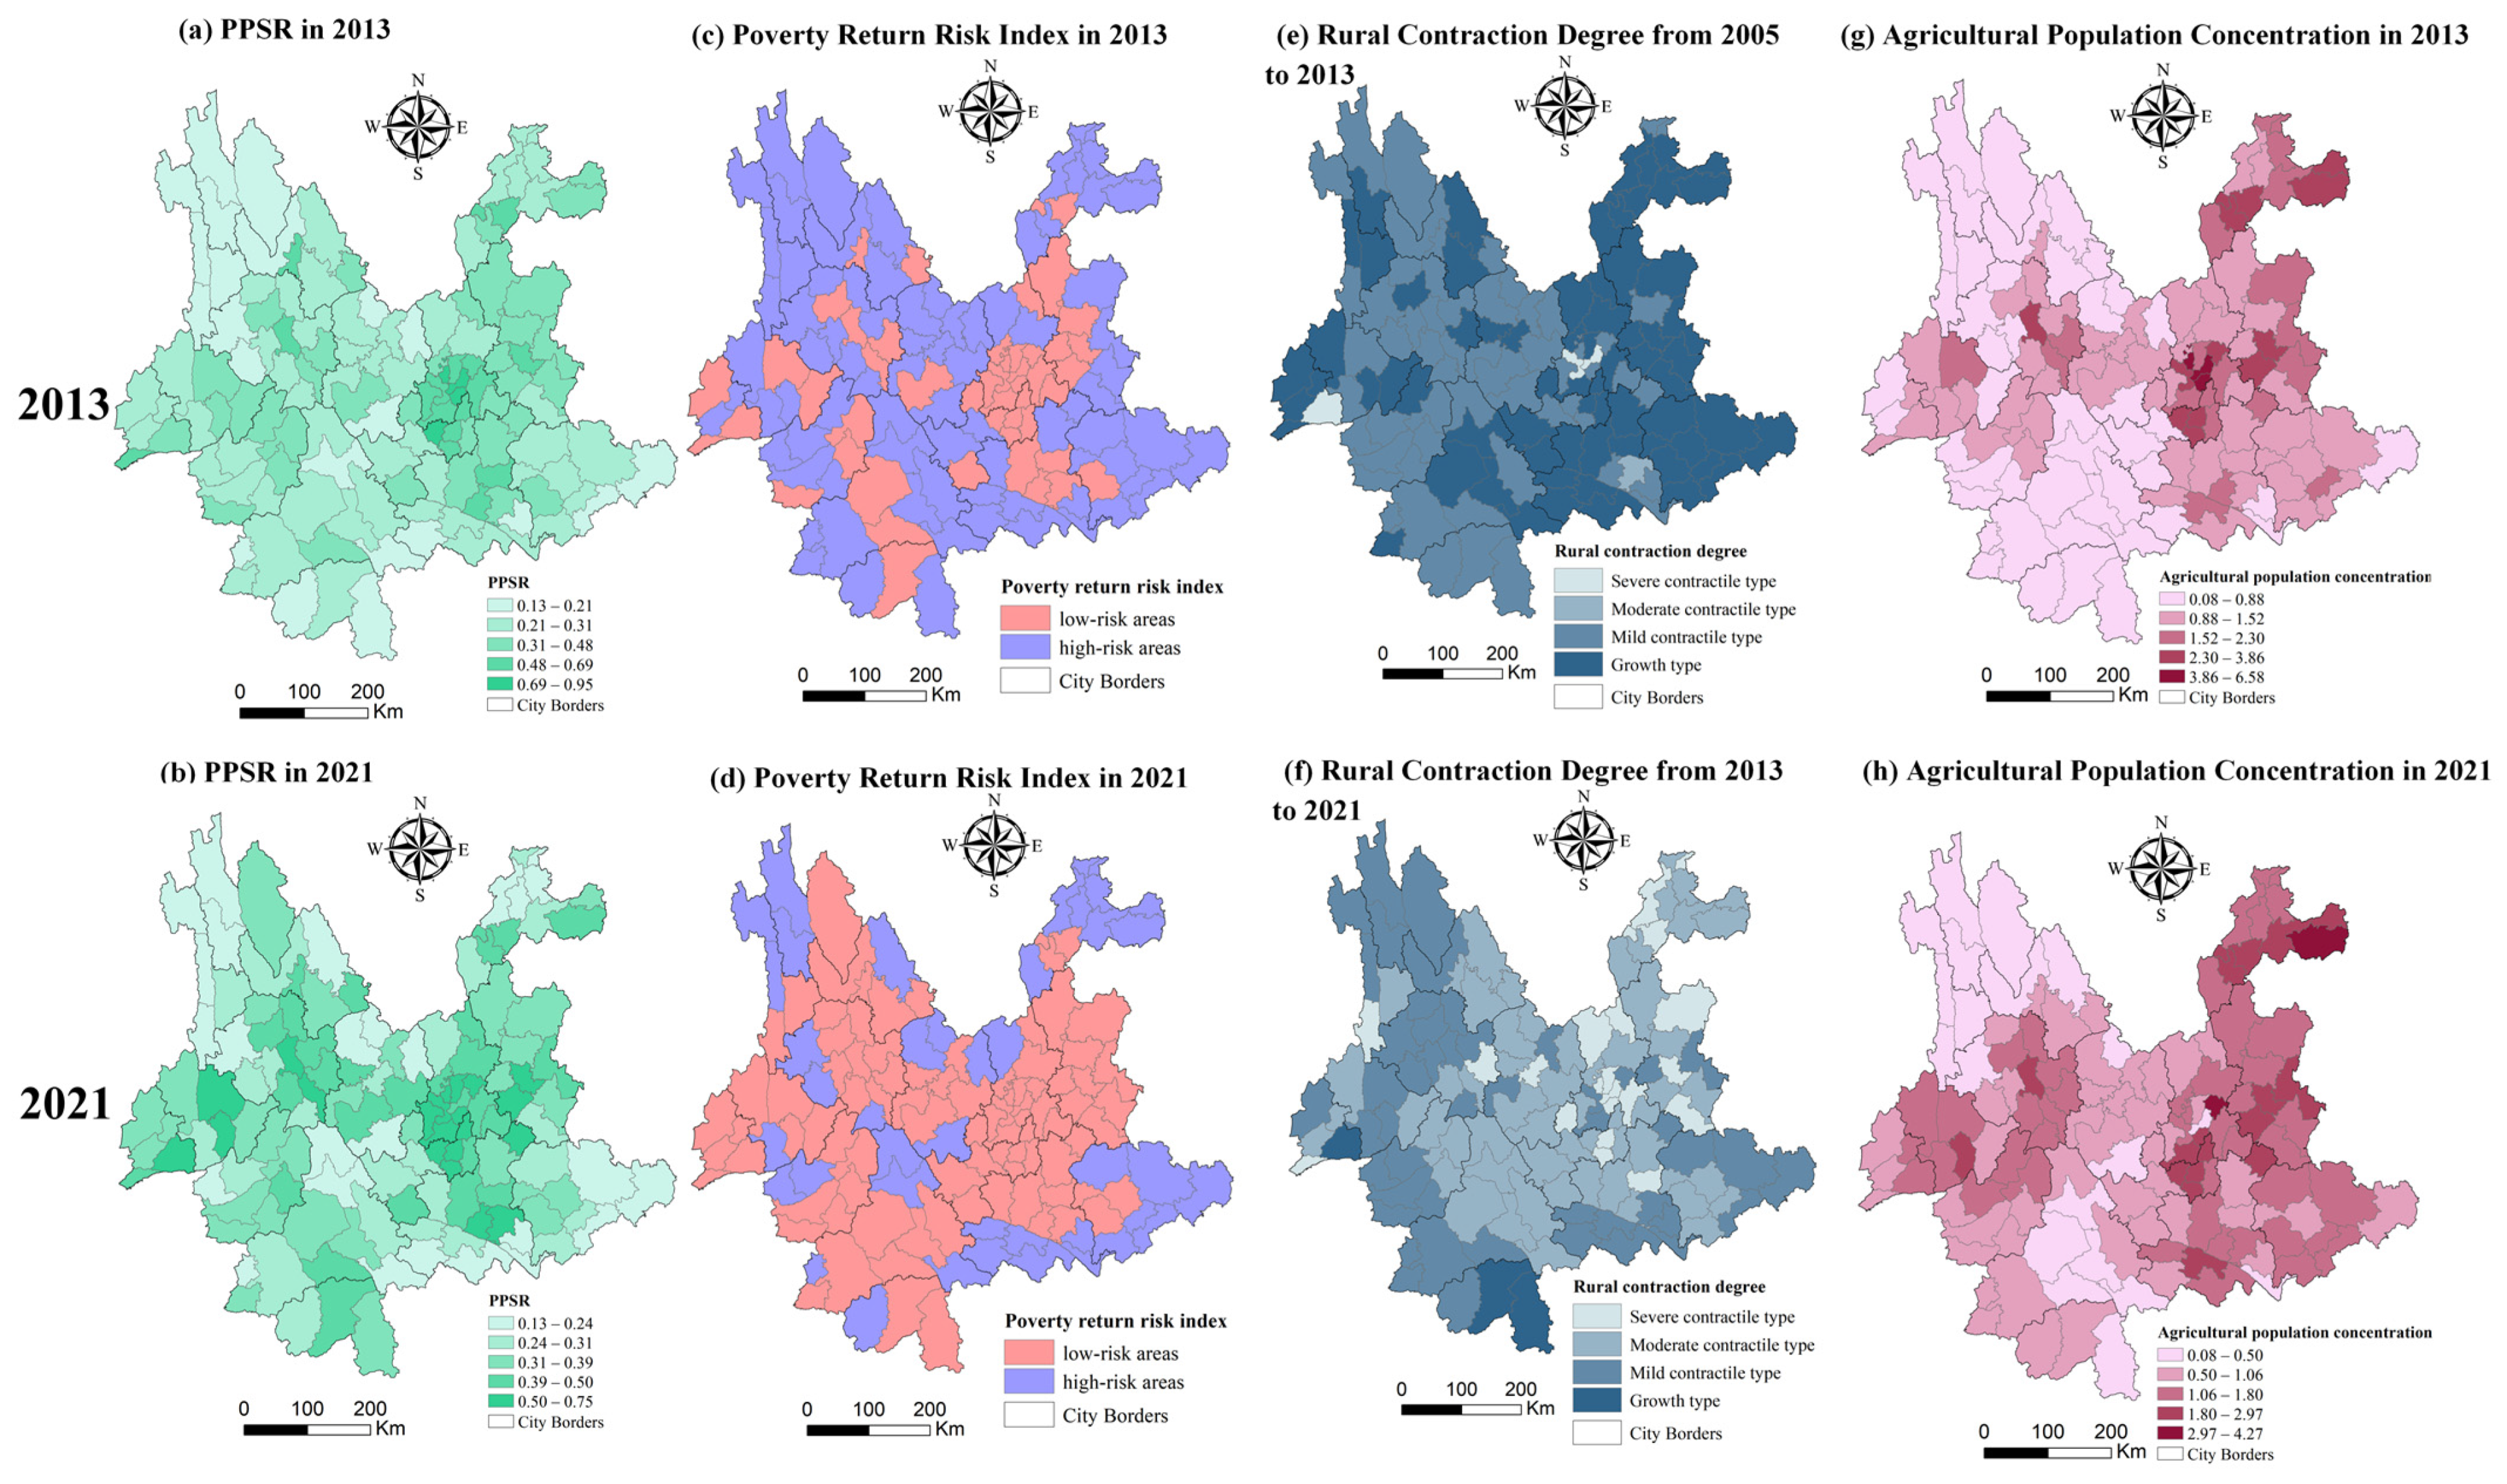
3.3.1. Analysis of Temporal and Spatial Changes in PPSR

The spatial distribution of the rural population pressure state response (PPSR) from 2013 to 2021 reveals significant spatial heterogeneity. From 2013 to 2021, the overall rural population increased, although certain areas experienced a decline, as shown in Figure 4a,b. The average value of the evaluation results increased from 0.333 in 2013 to 0.362 in 2021; the median increased from 0.285 in 2013 to 0.357 in 2021. The standard deviation decreased from 0.163 in 2013 to 0.128 in 2021, indicating that the population subsystem levels across counties and districts varied due to differences in regional development and rural contraction. Over this period, the overall spatial pattern of the population subsystem shifted from a “high in the east, low in the northwest” configuration in 2013 to a “one core, multiple points” pattern in 2021. Here, “one core” refers to Kunming and the northern part of Yuxi, which consistently remained high-value clusters, whereas “multiple points” refers to the distribution of independent high-value areas in Dali, Gucheng District, and other locations. The reduction in the overall gap is reflected in the sharp decrease in the number of low-value areas, from 29 in 2013 to 18 in 2021, with the polarization pattern significantly weakening.

3.3.2. Analysis of Spatiotemporal Changes in Poverty Return Risk Index

To assess the impact of the Rural Revitalization Strategy proposed in 2017 on the poverty return risk index of each county, this study calculates the poverty return risk index for 2013 and 2021 to determine the distribution of population density in nonurban areas, as shown in Figure 4c,d. From 2013 to 2021, urbanized areas (according to both light and population grids) expanded. In 2013, urbanization was primarily concentrated in the main urban areas of various cities. By 2021, Kunming had significantly expanded southward as people from surrounding areas migrated into the urban region. Several small population centers emerged throughout the province, and the urban scale of districts and counties grew to varying extents.
From 2013 to 2021, high-risk areas for poverty return (indicated by the no-light grid) were predominantly located in Zhaotong City, Qujing City, and other regions. Zhaotong City has a relatively small area, with a high rural population concentrated mainly in mountainous regions. In Qujing City, agricultural conditions are favorable, and the city has a large proportion of agricultural employees and a substantial population base. In western Yunnan, where many high mountains are found, the population is concentrated in areas with relatively high-quality resources within small mountain ranges. In contrast, the risk of poverty return in places such as Dali, Lijiang, and Baoshan has significantly decreased.
This study classifies areas with poverty return risk index scores of less than 0.5 as low-risk areas and those with scores greater than 0.5 as high-risk areas. From 2013 to 2021, the number of high-risk areas in the western region exceeded that in the eastern region, and the risk of poverty return was greater in border regions than in internal areas. In 2013, there were 48 low-risk areas and 81 high-risk areas. By 2021, the number of low-risk areas had increased to 86, whereas the number of high-risk areas had decreased to 43, with nearly 50% of high-risk areas transforming into low-risk areas. In 2021, high-risk areas were primarily concentrated along provincial boundaries in mountainous and river regions, characterized by low traffic accessibility and poor living conditions.

3.3.3. Analysis of Spatiotemporal Changes in Rural Contraction Degree

Using 2013 and 2021 as the reference years for measuring long-term rural contraction, the study examines the changes in the rural population in Yunnan Province. Two time intervals of equal length—2005 to 2013 and 2013 to 2021—are selected to measure the degree of rural contraction, as shown in Figure 4e,f. The degree of rural contraction is categorized into the following four types (Table 3):
From 2005 to 2013, the degree of rural contraction in Yunnan Province was characterized primarily by growth and mild contraction, indicating that rural areas continued to be the main source of population growth. The western districts and counties of Yunnan predominantly experienced mild contraction, whereas the eastern regions were characterized mainly by growth. A total of 68 counties were classified as growth-oriented, accounting for 52.70%, whereas 57 counties (44.19%) were classified as exhibiting mild contraction. Additionally, there was one county with moderate contraction and three counties with severe contraction.
From 2013 to 2021, the average rural contraction index for counties in Yunnan Province was 5.70%, and the overall degree of contraction was classified as moderate. The types of rural contraction in the region were primarily moderate and mild. The number of counties with growth or moderate contraction was relatively low: 21 and 3 counties, respectively. A total of 48 counties, or 37.21% of the total, experienced mild contraction, whereas 57 counties (44.19%) experienced moderate contraction. During this period, the counties experiencing severe contraction were located primarily in Kunming, Qujing, and Zhaotong, largely because of population migration to urban areas as a result of urbanization. The degree of rural contraction in border areas was relatively mild. While rural contraction generally reflects the degradation of rural settlements, urbanization has provided rural populations with a more convenient environment and income-generating opportunities, contributing to the flow of rural populations to cities and towns.

3.3.4. Analysis of Spatiotemporal Changes in Agricultural Population Concentration

This study calculates the agricultural population concentration index and classifies the study area into five levels using the natural breakpoint method, as shown in Figure 4g,h. From 2013 to 2021, the spatial distribution of the agricultural population concentration in Yunnan Province markedly differed from east to west. The eastern region predominantly comprised high-value areas of agricultural population concentration, whereas the western region was characterized mainly by low-value areas. For example, Diqing Prefecture and Nujiang Prefecture in the northwest are stable areas with extremely low concentrations of agricultural population. These areas have poor agricultural production conditions and a small population base. High-value areas are clustered in four main regions: Yuxi, Qujing, Zhaotong, and Dali. Yuxi and Dali are near large lakes, providing abundant water resources for agricultural development, which supports the formation of large villages. Qujing, with its flat terrain and developed agriculture, is close to Kunming, the provincial capital, and benefits from significant location advantages. Zhaotong is a city with a large population, which is primarily distributed in rural areas, with a sufficient labor force and high agricultural population concentration.

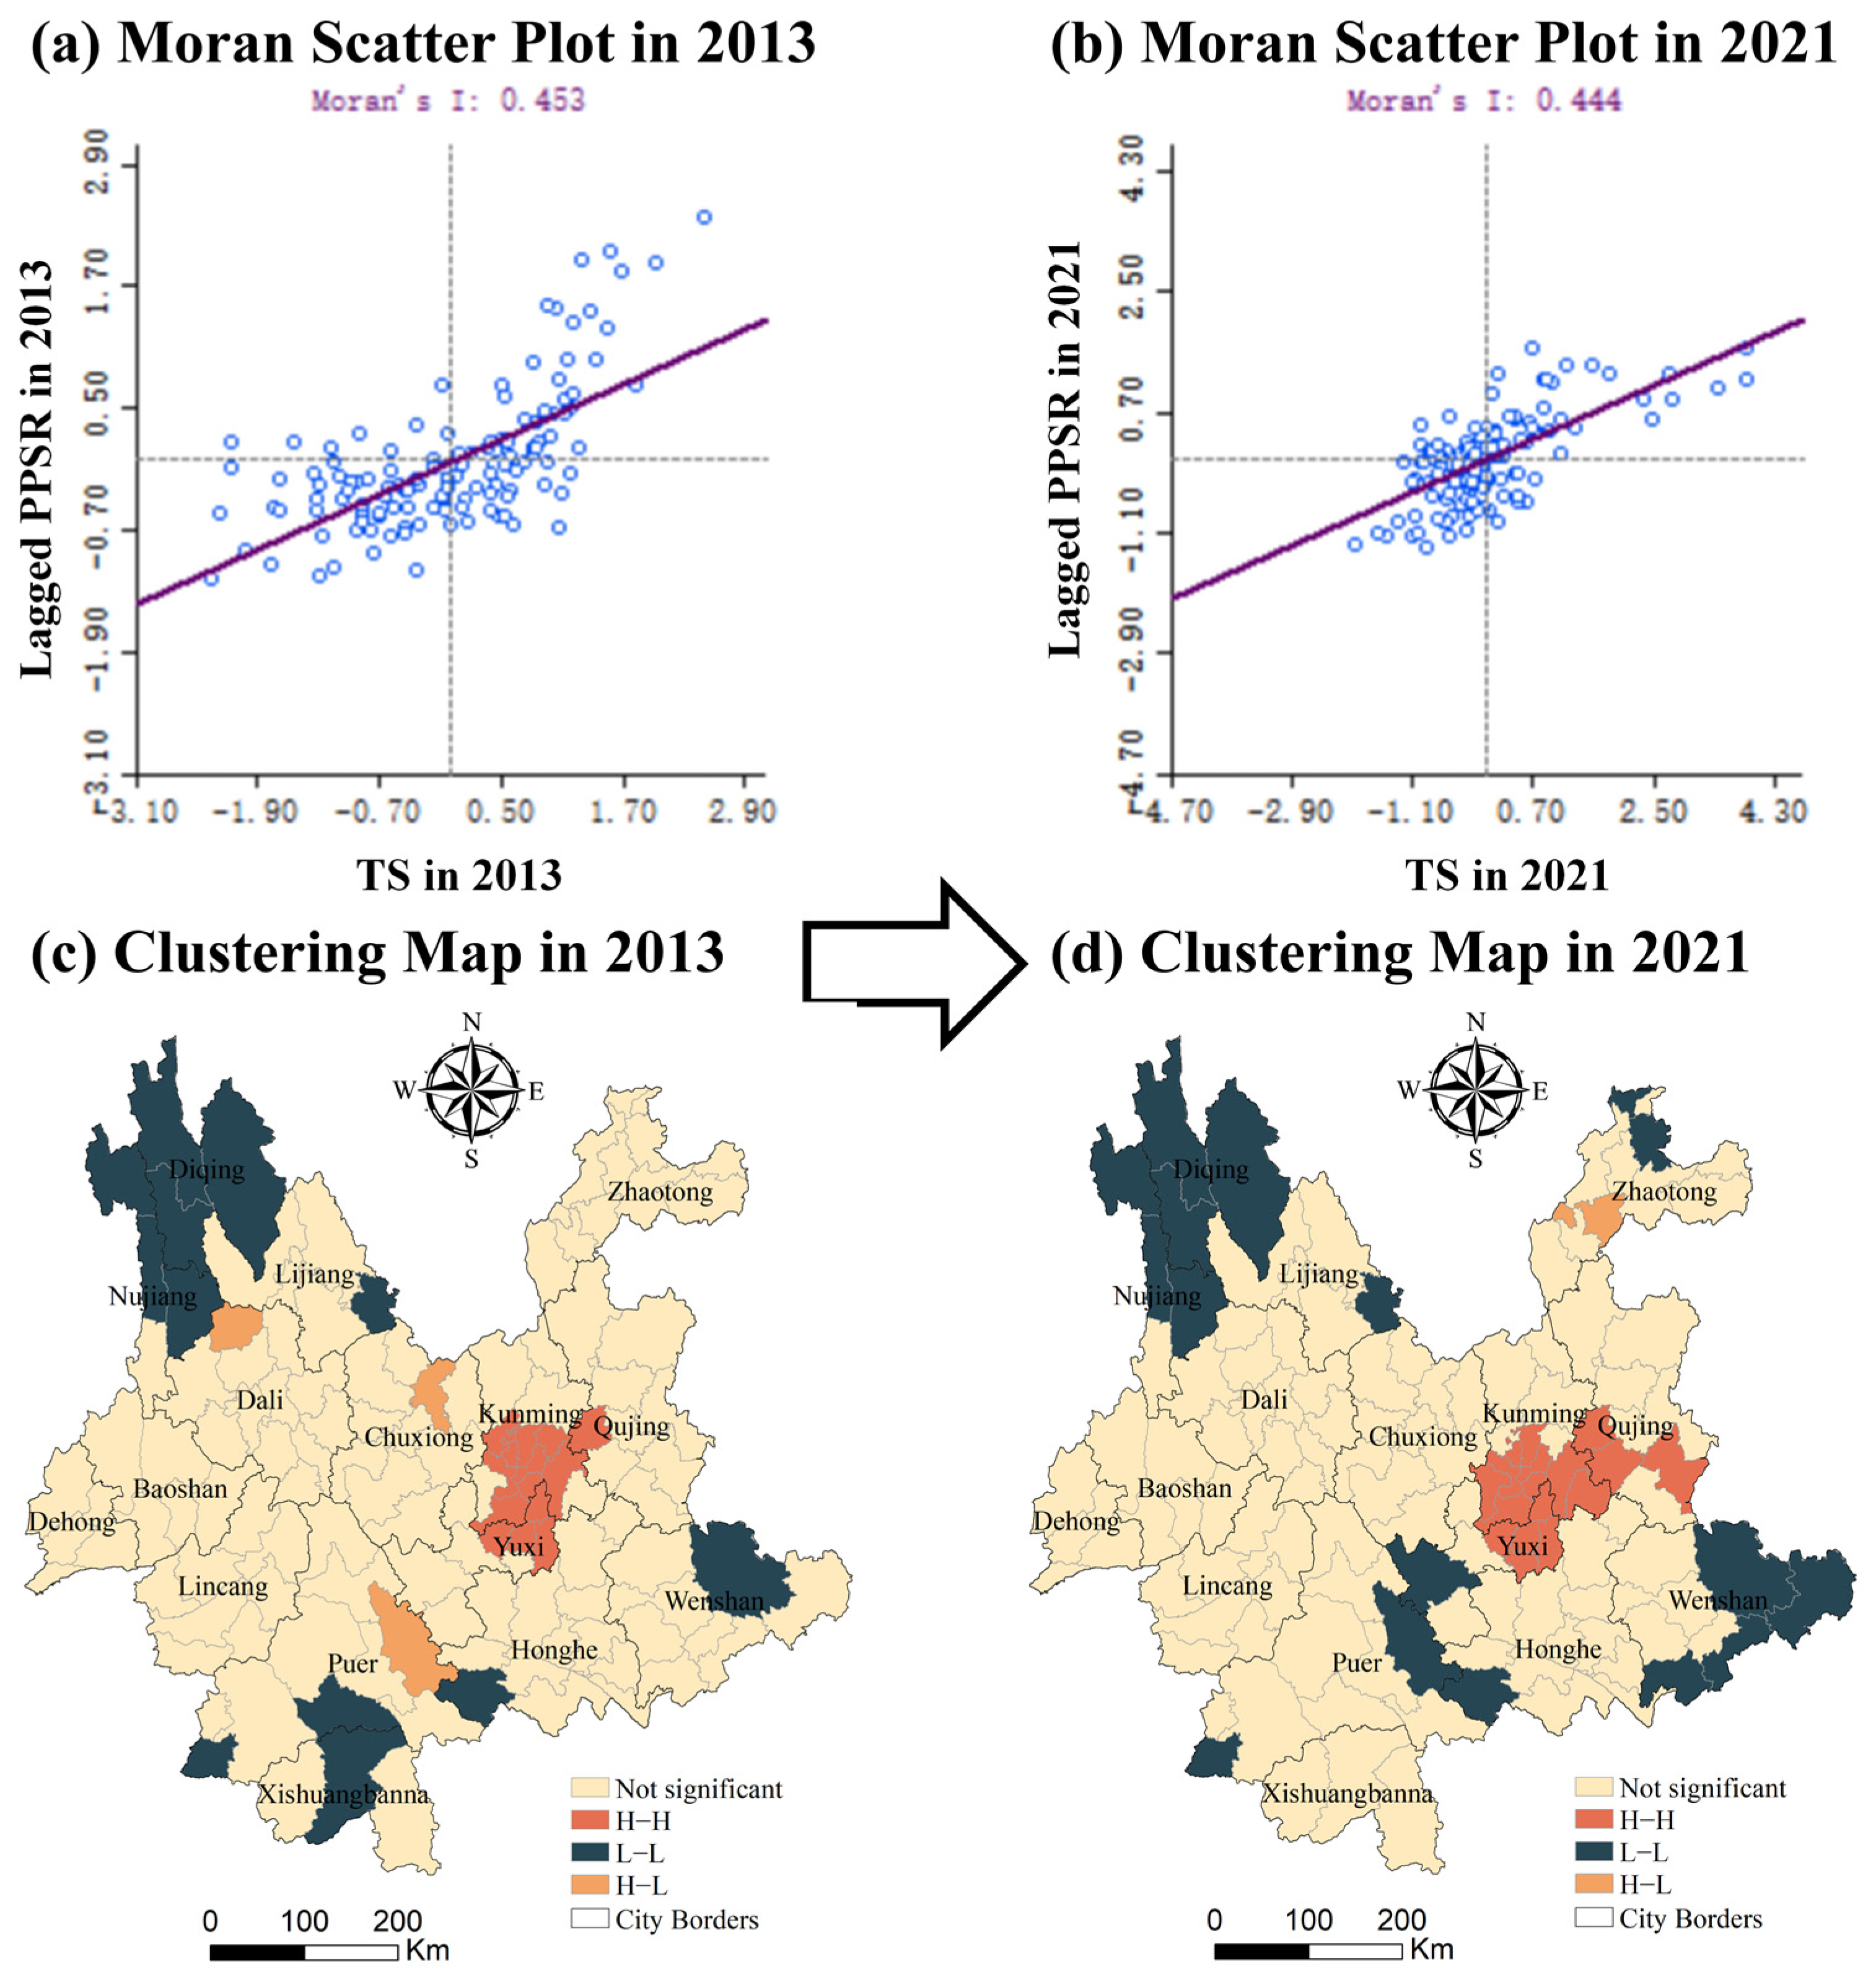
3.4. Trade-Off Synergy Analysis of TS and PPSR

This study employs bivariate local Moran’s I spatial autocorrelation analysis to examine the trade-off relationship between transport superiority (TS) and the rural population pressure state response (PPSR). A spatial scale comparison of districts and counties reveals that the relationships between TS and PPSR in Yunnan Province are predominantly collaborative, with distinct regional characteristics.
GeoDA 1.20 software was used to generate Moran scatter plots of TS and PPSR for 2013 and 2021, as shown in Figure 5a,b. Most districts and counties were located in the first and third quadrants from 2013 to 2021, indicating that, overall, TS and PPSR in these areas exhibited a synergistic relationship with a certain degree of polarization (Figure 5). In the first quadrant (“H-H”), TS and PPSR in the districts and counties presented high levels of synergy, indicating coordinated development. In the third quadrant (“L-L”), districts and counties exhibited a low-level synergistic relationship, with relatively poor traffic conditions and PPSR levels. A few districts and counties were located in the second and fourth quadrants, indicating a balanced development relationship between TS and PPSR (“H-L” and “L-H”).
Using the analysis results from GeoDA 1.20 software, a clustering map of TS and PPSR was created, as shown in Figure 5c,d. From 2013 to 2021, TS and PPSR in Yunnan Province showed a high level of synergy (“H-H”), with stable regional distributions primarily in Kunming, Yuxi, and surrounding areas (Figure 5). The number of these areas increased from 14 to 17, expanding eastward. TS and PPSR showed a low-level synergistic relationship (“L-L”) in border areas, primarily in the northwestern, southeastern, and southwestern regions, with the number of these areas increasing from 12 to 17. The “H-L” trade-off relationship exhibited a discrete distribution, with the number of such areas decreasing from three to one. TS and PPSR in other districts and counties were not correlated, while no areas displayed an “L-H” trade-off relationship. This analysis reveals that, during the process of urban–rural integration in Yunnan, there is a certain degree of polarization. Improvements in transportation conditions in districts and counties with more advanced urbanization can help increase the PPSR level and promote coordinated development. Conversely, remote districts and counties with poor transportation infrastructure and significant rural population issues struggle to achieve the equalization of urban and rural public services, resulting in low interconnectivity. For new urbanization to succeed and to achieve comprehensive sustainable development while addressing rural development challenges, the coordinated development of transportation and population in mountainous provinces is crucial.

4. Discussion

4.1. Aviation-Mediated Enhancement of Traffic Superiority in Yunnan Province

This study revealed that air transportation significantly enhances transport superiority (TS) in Yunnan Province. The transportation network, bolstered by improved air connectivity, links cities and villages, facilitating the flow of resources, particularly in plateau and mountainous areas [45]. Cities and towns are vital to the economic and social development of rural areas and influence the evolution of rural settlements [28]. The economic development and population movement in Yunnan Province are constrained by the mountainous terrain, and civil aviation plays an indispensable role in the development of inland plateau and mountainous regions. Aviation has improved urban–rural transportation advantages, promoting the flow of populations, tourism, and the logistics and transportation of agricultural products associated with plateau regions [46].
Aviation has significantly shifted the accessibility radius toward Kunming, the provincial capital, overcoming the spatial distance limitation on transportation. This finding indicates that Kunming Changshui International Airport plays a crucial role in reshaping the accessibility landscape, breaking geographical distance barriers, and enhancing the region’s capacity to attract population, capital, and goods. This improved connectivity strengthens the agglomeration advantages of central cities. In 2024, Yunnan Province plans to actively integrate itself into the unified and open transportation market, focusing on rural road improvements. By positioning Kunming as the regional core and leveraging the potential of civil airports, along with further development of urban and rural road networks, significant improvements can be made in rural residents’ access to employment opportunities, goods trading, and other essential services.

4.2. The PSR Structure of the Rural Population in Yunnan Province Shows Significant Differences

On the basis of pressure–state–response (PSR) theory, this study constructed a PPSR model with three aspects: rural contraction, rural population concentration, and the risk of returning to poverty. The temporal and spatial differences in PPSR levels were then analyzed. In 2021, the overall PPSR level in Yunnan Province increased, but it declined in certain areas. As urbanization progressed, many rural residents chose to work in cities rather than engage in traditional farming, with Kunming emerging as the preferred destination [47].
The rural contraction index serves as the “state” measurement index within the PPSR framework. The rural population in Yunnan Province has undergone two stages of development. In the first stage, the rural population either slightly increased or contracted, as the relationship between urban and rural areas in China began to integrate organically into urban–rural development. This led to a positive growth trend in the rural population but with a growing potential for rural contraction and urban expansion. In the second stage, significant advances in urban–rural planning led to increased migration of the rural population to cities and towns, exacerbating rural contraction. This shift, while creating challenges for rural culture and agricultural production, provided rural populations with a more favorable environment and greater income-generating opportunities [48].
The poverty return risk index, which serves as a measure of “pressure”, reflects the ability of the PPSR system to cope with external forces. The risk of returning to poverty in the border areas of Yunnan Province is greater than that in the internal regions, as the border areas face the dual constraints of social development and geographical conditions [49]. The western region has more high-risk poverty return areas than the eastern region does, as the eastern part of Yunnan hosts flatter terrain and larger cities, and the rural population is also more concentrated in the east. The western region, with its many high mountains and canyons, faces significant “pressure” with respect to the survival and development of its rural population [50]. This analysis also incorporates the measurement results of rural population concentration. In areas such as Qujing and Zhaotong, the rural population is relatively concentrated. For example, Songming County, Zhenxiong County, and other agricultural counties have large populations, extensive rural settlements, and large-scale crop cultivation, which facilitate agricultural production and the supply of such products to neighboring cities. In contrast, most districts and counties in the western region are constrained by agricultural production conditions and ethnic and geographical factors, resulting in lower rural population concentrations.
In general, the challenges and responses to PPSR in different regions of Yunnan Province vary. In recent years, Yunnan Province has implemented policies to promote new urbanization, with counties serving as key carriers. These efforts have focused on improving the quality and efficiency of assistance industries and infrastructure development and boosting the endogenous development capacity of poverty-relief areas and their populations, yielding certain positive outcomes. On the basis of the research findings, this paper proposes corresponding improvement policies for decision-makers. Urban and rural development should fully account for the population and industrial carrying capacity, enhance employment policies for migrant workers, leverage the driving forces from regional core cities in peripheral areas, and promote regional coordinated development.

4.3. Coordinated Development Path for TS and PPSR

Promoting the coordinated development of transport superiority (TS) and the rural population pressure state response (PPSR) is a problem-oriented approach to rural development in plateau and mountainous areas. To date, the underdeveloped agricultural industry and low income levels have caused rural laborers to prefer abandoning farming in favor of migrating to cities, leading to widespread rural hollowing [51]. A small number of people, mainly elderly individuals, choose to remain in rural areas, but the economic and time costs of staying are high [52]. Does the improvement in traffic accessibility reduce circulation costs and encourage rural residents to leave their hometowns? If farmers in underdeveloped areas continue to stay in rural areas, the rural contraction issue may be superficially alleviated, but the actual living conditions will remain poor. Therefore, promoting the equalization of public services between urban and rural areas is key [53]. Continuous optimization of public and transportation infrastructure also yields production benefits by improving agricultural productivity, reducing production costs, lowering labor migration expenses, and providing support for industrial development, thereby increasing farmers’ incomes.
China’s Rural Revitalization Strategy emphasizes providing rural populations with the freedom to move and the opportunity to choose between urban and rural employment and living conditions. In this regard, this study offers the following recommendations. (1) The development of urban and rural public services should be promoted through systemic reforms to achieve the equalization of services, ensuring that both urban and rural residents have access to fair and high-quality public services. (2) The transportation infrastructure should continue to be strengthened. At present, large areas of cities and villages in Yunnan lack a fully integrated transportation network. Increased investment in township transportation facilities should be prioritized to enhance regional connectivity. (3) The improvement of transportation superiority provides fundamental support for urban–rural talent circulation. Through spatial planning and transportation development, the allocation of educational resources can be optimized to ensure rural students’ education quality. Policymakers should aim to coordinate the planning of basic education institutions across urban and rural areas, and to promote the flow of outstanding teachers from urban to rural areas, thereby creating essential conditions for building urban–rural talent reserves. (4) Information infrastructure development should be promoted to improve the efficiency and accuracy of information exchange between regions, facilitating regional communication and supporting accelerated connectivity [54]. These initiatives will contribute to the coordinated development of TS and PPSR in Yunnan Province, reduce the gap between urban and rural areas, and foster comprehensive social and economic progress in both urban and rural regions.

5. Conclusions and Limitations

In this study, we have constructed a comprehensive traffic superiority (TS) model that incorporates the impact of aviation and a rural population pressure state response (PPSR) model. Using these models, the study quantifies the traffic superiority and rural population levels in 129 counties of Yunnan Province for the period 2013 to 2021 and examines their spatial–temporal heterogeneity. Finally, on the basis of a spatial autocorrelation model, the trade-off synergy between TS and PPSR in Yunnan Province is discussed. The main conclusions are as follows.
(1)
This study proposes an aviation impact coefficient model to calculate the degree of traffic advantage in Yunnan Province. The results show that the comprehensive traffic advantage of Yunnan Province significantly improved from 2013 to 2021, forming a high-value center with Kunming, Chuxiong, and Yuxi as the core, with the surrounding areas exhibiting diminishing values. Aviation conditions have had a significant positive impact on the revitalization of rural areas in Yunnan, with provincial traffic accessibility increasing by nearly 8%. In terms of land traffic, Kunming’s regional core position has been further strengthened.
(2)
PPSR calculations reveal that the rural population in Yunnan Province follows a spatial pattern of “one core and multiple points”. The polarization pattern gradually weakens due to the reduction in the overall gap. Most counties in Yunnan Province have experienced varying degrees of rural contraction, exhibiting two stages of intensifying contraction. The eastern part of Yunnan is characterized primarily by a high agricultural population concentration, whereas the western region is characterized predominantly by a low agricultural population concentration. Songming and Zhenxiong have the highest agricultural population concentrations. During this period, nearly 50% of the areas at a high risk of returning to poverty were transformed into low-risk areas. However, the risk of returning to poverty remains higher in the western and border areas than in the eastern and internal regions.
(3)
The relationships between TS and PPSR in Yunnan Province are predominantly synergistic, with significant regional characteristics and a degree of polarization. From 2013 to 2021, TS and PPSR exhibited high-level collaborative relationships (“H-H”) with stable regional distributions, mainly in Kunming, Yuxi, and other areas. Low-level synergy (“L-L”) regions were concentrated in border areas, with the northwestern, southeastern, and southwestern regions having the majority. Therefore, districts and counties should accelerate the coordinated development of TS and PPSR, promoting mutual benefits and narrowing regional disparities.
In conclusion, this study has measured the levels of TS and PPSR in Yunnan Province, explored their coordinated development path, and provided scientific guidance for the integration of urban and rural development in plateau and mountainous areas. The study offers a new perspective on rural revitalization. However, the following limitations should be considered. The resource environment, development type, and economic level in different regions are inconsistent. Therefore, the findings are most suitable for reference for those interested in similar mountainous areas. This study focused on TS and PPSR within transportation and population systems. Future research should consider additional factors, such as rural settlement, ecology, educational attainment, healthcare accessibility, income diversification mechanisms and culture, as well as the driving factors behind coordinated development. Owing to limitations in data acquisition, methodology, and time constraints, as well as the lack of long-term temporal and spatial evolution studies, future research should focus on the dynamic flow and interaction of more elements in urban and rural areas, particularly from a “flow space” perspective. Although this study has limitations, the results are consistent with those of similar regional studies in China, suggesting that the findings are broadly applicable and can be further explored in future research.

Author Contributions

Conceptualization, Q.H.; methodology, D.A.; software, Q.H. and Z.Z.; validation, Z.Z., R.W. and S.Z.; formal analysis, Q.H.; investigation, Z.Z.; resources, J.H.; data curation, Y.D.; writing—original draft preparation, Q.H.; writing—review and editing, D.A. and Q.H.; visualization, R.W.; supervision, D.A.; funding acquisition, D.A. and J.H. All authors have read and agreed to the published version of the manuscript.

Funding

This research was supported by National Science and Technology Support Program of China (No. 2015BAD06B01).

Data Availability Statement

The original contributions presented in the study are included in the article, further inquiries can be directed to the corresponding author.

Conflicts of Interest

The authors declare no conflicts of interest.

References

  1. Liu, Y.; Li, Y. Revitalize the World’s Countryside. Nature 2017, 548, 275–277. [Google Scholar] [CrossRef] [PubMed]
  2. Wang, Y.; Shu, C.; Yang, L.M.; Yuan, H.Z. A Decoupling Multiple-Relaxation-Time Lattice Boltzmann Flux Solver for Non-Newtonian Power-Law Fluid Flows. J. Non-Newton. Fluid Mech. 2016, 235, 20–28. [Google Scholar] [CrossRef]
  3. Ficko, A.; Sarkki, S.; Gultekin, Y.S.; Egli, A.; Hiedanpää, J. Reflective Thinking Meets Artificial Intelligence: Synthesizing Sustainability Transition Knowledge in Left-behind Mountain Regions. Geogr. Sustain. 2025, 6, 100257. [Google Scholar] [CrossRef]
  4. Tucker, C.M.; Alcántara-Ayala, I.; Gunya, A.; Jimenez, E.; Klein, J.A.; Xu, J.; Bigler, S.L. Challenges for Governing Mountains Sustainably: Insights From a Global Survey. Mt. Res. Dev. 2021, 41, R10. [Google Scholar] [CrossRef]
  5. Zhang, Q.; Cao, Z.; Liu, Y. Assessing Rural Revitalization Potential through Rural Transformation Degree and Sustainability: A Quantitative Study of 460 Case Villages in Lingbao, China. Habitat Int. 2024, 153, 103194. [Google Scholar] [CrossRef]
  6. Tian, Y.; Jiang, G.; Ma, W.; Wu, S.; Tian, Y.; Zhou, T. Understanding the Relationship between Population–Land–Industry Element Inputs and Function Outputs of Rural Settlement: An Efficiency-Based Perspective. Habitat Int. 2025, 159, 103370. [Google Scholar] [CrossRef]
  7. Fromentin, J. A Spatio-Temporal Approach to Population Diversity: Immigration and Rural Areas in France. J. Rural Stud. 2023, 103, 103099. [Google Scholar] [CrossRef]
  8. Gu, H.; Lao, X.; Wen, Z.; Zhao, Z. Spatiotemporal Patterns and Determinants of Interprovincial Migration in China Between 2000 and 2020. Acta Geogr. Sin. 2022, 77, 3041–3054. (In Chinese) [Google Scholar] [CrossRef]
  9. Liu, J.; Zhou, X.; Hou, X. Does a Migrant Relocation Program Aggravate Cropland Abandonment? A Case Study on Pingli County, China. Land 2025, 14, 518. [Google Scholar] [CrossRef]
  10. Zhuo, R.; Xu, X.; Zhou, Y.; Guo, X. Spatiotemporal Evolution Patterns and Influencing Factors of Rural Shrinkage Under Rapid Urbanization: A Case Study of Zhejiang Province, China. Land 2024, 13, 2137. [Google Scholar] [CrossRef]
  11. Dzanku, F.M. Transient Rural Livelihoods and Poverty in Ghana. J. Rural Stud. 2015, 40, 102–110. [Google Scholar] [CrossRef]
  12. Hodgkin, S.; Mnatzaganian, G.; Warburton, J.; Winterton, R. Networks of Care in Australian Rural Ageing Populations. J. Rural Stud. 2022, 92, 17–25. [Google Scholar] [CrossRef]
  13. Cui, H.; Zheng, L.; Wang, Y. The Impact of Changes in Land Transfer Decisions on Rural Livelihood Transitions: Evidence from Dynamic Panel Data in China. Appl. Geogr. 2025, 176, 103515. [Google Scholar] [CrossRef]
  14. Huang, Y.; Elahi, E.; You, J.; Sheng, Y.; Li, J.; Meng, A. Land Use Policy Implications of Demographic Shifts: Analyzing the Impact of Aging Rural Populations on Agricultural Carbon Emissions in China. Land Use Policy 2024, 147, 107340. [Google Scholar] [CrossRef]
  15. Du, X.; Mohd, S. Urban–Rural Heterogeneity in the Effect of Population Ageing on the Savings Rate of Urban and Rural Households in China. Econ. Anal. Policy 2024, 82, 999–1010. [Google Scholar] [CrossRef]
  16. Li, L.; Zhang, T.; Yang, Y. Unveiling Nonlinear Effects of Transport Development on Rural Settlement Transitions along the “Southern Jiangsu—Northern Shaanxi” Transect in China. Ecol. Indic. 2024, 159, 111712. [Google Scholar] [CrossRef]
  17. Long, H.; Liu, Y.; Li, X.; Chen, Y. Building New Countryside in China: A Geographical Perspective. Land Use Policy 2010, 27, 457–470. [Google Scholar] [CrossRef]
  18. Liu, Y.; Li, X.; Guo, Y. Exploring Land System Reform for Demographic Transition in Rural China. Land Use Policy 2024, 147, 107355. [Google Scholar] [CrossRef]
  19. Yang, S.; Yang, X.; Zhang, J.; Gao, X.; Zhou, J.; Wu, X. Assessing the Impacts of Rural Depopulation and Urbanization on Vegetation Cover: Based on Land Use and Nighttime Light Data in China, 2000–2020. Ecol. Indic. 2024, 159, 111639. [Google Scholar] [CrossRef]
  20. Wang, F.; Li, S.; Liu, L.; Gao, F.; Feng, Y.; Chen, Z. A Novel Index for Assessing the Rural Population Hollowing at Fine Spatial Resolutions Based on Tencent Social Media Big Data: A Case Study in Guangdong Province, China. Land Use Policy 2024, 137, 107028. [Google Scholar] [CrossRef]
  21. Wen, Q.; Li, J.; Ding, J.; Wang, J. Evolutionary Process and Mechanism of Population Hollowing out in Rural Villages in the Farming-Pastoral Ecotone of Northern China: A Case Study of Yanchi County, Ningxia. Land Use Policy 2023, 125, 106506. [Google Scholar] [CrossRef]
  22. Liu, T.; Yu, L.; Chen, X.; Li, X.; Du, Z.; Yan, Y.; Peng, D.; Gong, P. Utilizing Nighttime Light Datasets to Uncover the Spatial Patterns of County-Level Relative Poverty-Returning Risk in China and Its Alleviating Factors. J. Clean. Prod. 2024, 448, 141682. [Google Scholar] [CrossRef]
  23. Tavosi, M.; Vafakhah, M.; Sadeghi, S.H.; Shekohideh, H.; Moosavi, V. Comparative Assessment of Watershed Hydrological Health (WHH) Using Multi-Criteria Decision-Making Approach Based on PSR Framework. J. Environ. Manag. 2025, 373, 123833. [Google Scholar] [CrossRef]
  24. Liu, S.; Wei, H.; He, J.; Guo, H.; Gong, X. Assessment of Urban Population Health Resilience Guided by Cardiovascular and Cerebrovascular Diseases: A Case Study of Henan Province. Environ. Impact Assess. Rev. 2023, 103, 107248. [Google Scholar] [CrossRef]
  25. Zhou, Y.; Wei, L.; Lan, F.; Li, X.; Bian, J. Evaluation and Optimization on Urban Regeneration Sustainability from the Perspective of Multidimensional Welfare of Resettled Resident—Evidence from Resettlement Communities in Xi’an, China. Land 2022, 11, 1258. [Google Scholar] [CrossRef]
  26. Hassan, A.M.; Lee, H. Toward the Sustainable Development of Urban Areas: An Overview of Global Trends in Trials and Policies. Land Use Policy 2015, 48, 199–212. [Google Scholar] [CrossRef]
  27. Zeng, Z.; Song, B.; Zheng, X.; Li, H. Changes of Traffic Network and Urban Transformation: A Case Study of Xi’an City, China. Land Use Policy 2019, 88, 104195. [Google Scholar] [CrossRef]
  28. Chen, Z.; Liu, Y.; Feng, W.; Li, Y.; Li, L. Study on Spatial Tropism Distribution of Rural Settlements in the Loess Hilly and Gully Region Based on Natural Factors and Traffic Accessibility. J. Rural Stud. 2022, 93, 441–448. [Google Scholar] [CrossRef]
  29. Banick, R.; Heyns, A.M.; Regmi, S. Evaluation of Rural Roads Construction Alternatives According to Seasonal Service Accessibility Improvement Using a Novel Multi-Modal Cost-Time Model: A Study in Nepal’s Remote and Mountainous Karnali Province. J. Transp. Geogr. 2021, 93, 103057. [Google Scholar] [CrossRef]
  30. Lu, H.; Zhao, P.; Hu, H.; Zeng, L.; Wu, K.S.; Lv, D. Transport Infrastructure and Urban-Rural Income Disparity: A Municipal-Level Analysis in China. J. Transp. Geogr. 2022, 99, 103292. [Google Scholar] [CrossRef]
  31. Lenaerts, B.; Allroggen, F.; Malina, R. The Economic Impact of Aviation: A Review on the Role of Market Access. J. Air Transp. Manag. 2021, 91, 102000. [Google Scholar] [CrossRef]
  32. Dai, Z.; Guo, R.; Li, M. Rural Transportation Facilities Improvement, Digital Countryside Development and Migrant Workers Returning Home to Start Businesses. J. China Agric. Univ. 2023, 28, 265–278. (In Chinese) [Google Scholar]
  33. Peng, J.; Qin, X. Research on Poverty Alleviation Effect of Agricultural Infrastructure Since the 21st Century. Chin. J. Agric. Resour. Reg. Plan. 2022, 43, 206–215. (In Chinese) [Google Scholar]
  34. Wang, Z.; Xu, J.; Zhu, C.; Qi, Y.; Xu, L. The County Accessibility Divisions in China and Its Correlation with Population Distribution. Acta Geogr. Sin. 2010, 65, 416–426. (In Chinese) [Google Scholar]
  35. Tian, Y.; Fu, C.; Jiang, L.; Dong, Y.; Li, J. Spatial Coupling and Coordination between Urban Traffic Accessibility and Regional Eeonomy in the Yangtze River Economic Belt Considering the Impact of Aviation. Geogr. Geo-Inf. Sci. 2023, 39, 84–90. (In Chinese) [Google Scholar] [CrossRef]
  36. Li, S.; Li, J.; Wang, H.; Yang, Z.; Liu, X.; Lei, C. Impact of Transport Superiority on Ecosystem Health in Arid Regions: A Case Study of Southern Xinjiang, China. Ecol. Indic. 2024, 162, 112054. [Google Scholar] [CrossRef]
  37. Minaei, M. Evolution, Density and Completeness of OpenStreetMap Road Networks in Developing Countries: The Case of Iran. Appl. Geogr. 2020, 119, 102246. [Google Scholar] [CrossRef]
  38. JTG D20-2017; Design Specifications for Highway Alignment. China Communications Press: Beijing, China, 2017.
  39. Zhu, G.; Zhou, Z.; Zhang, Y.; Zhang, H.; Zhu, Y. Spatial Differentiation Characteristics of Road Networks Density under the Background of Roads Connectivity among Villages in Guizhou Province. Highway 2021, 66, 252–256. (In Chinese) [Google Scholar]
  40. JTGB01-2020; Technical Standard for Highway Engineering. Ministry of Transport of China: Beijing, China, 2020.
  41. Wu, J.; Liu, X. The Opening of High Speed Railway and Poverty Reduction in Rural China: Evidence from Remote Sensing Data. World Econ. Pap. 2022, 1, 1–17. (In Chinese) [Google Scholar]
  42. Smith, B.; Wills, S. Left in the Dark? Oil and Rural Poverty. J. Assoc. Environ. Resour. Econ. 2018, 5, 865–904. [Google Scholar] [CrossRef]
  43. Lv, D.; Zhang, Y.; Liu, Y. Spatial Coupling Relationship Between Rural Population and Economy Under the Background of Rural Shrinkage in Songnen Plain. Econ. Geogr. 2022, 42, 160–167. [Google Scholar] [CrossRef]
  44. Wei, W.; Xiao, L.; Zhang, X.; Jin, L.; Wang, D.; Long, X.; Yang, Q.; Li, J.; Zhou, Y. Spatial–Temporal Analysis of Coupling Coordination Between New Urbanization and Ecological Environment in Ya’an, China. Land 2025, 14, 65. [Google Scholar] [CrossRef]
  45. Fageda, X.; Suárez-Alemán, A.; Serebrisky, T.; Fioravanti, R. Air Connectivity in Remote Regions: A Comprehensive Review of Existing Transport Policies Worldwide. J. Air Transp. Manag. 2018, 66, 65–75. [Google Scholar] [CrossRef]
  46. Gao, X.; Sun, D. Transport Accessibility and Social Demand: A Case Study of the Tibetan Plateau. PLoS ONE 2021, 16, e0257028. [Google Scholar] [CrossRef]
  47. Shin, S.; Kim, T.-H. Assessing Negative Externalities of Rural Abandoned Houses in South Korea: Insights from Discrete Choice Experiments. Sustainability 2024, 16, 10877. [Google Scholar] [CrossRef]
  48. Cheng, M.; Yin, Z.; Westlund, H. Counterurbanization in China? A Case Study of Counties in Huang-Huai-Hai Area from the Perspective of Urban-Rural Relations. J. Rural Stud. 2024, 110, 103386. [Google Scholar] [CrossRef]
  49. Huang, G.; Zhang, M.; Qin, B. Poor Effect Test of Natural Geographical Environment in Arid Areas. China Popul. Resour. Environ. 2014, 24, 138–146. (In Chinese) [Google Scholar]
  50. Sofue, Y.; Kohsaka, R. Conversion Patterns of Agricultural Lands in Plains and Mountains: An Analysis of Underpinning Factors by Temporal Comparison with Geographically Weighted Regression in Depopulating Rural Japan. Environ. Sustain. Indic. 2024, 22, 100346. [Google Scholar] [CrossRef]
  51. Gao, X.; Xu, A.; Liu, L.; Deng, O.; Zeng, M.; Ling, J.; Wei, Y. Understanding Rural Housing Abandonment in China’s Rapid Urbanization. Habitat. Int. 2017, 67, 13–21. [Google Scholar] [CrossRef]
  52. Zhang, Z.; Ding, J.; Zhang, K.; Deng, X. Impact of Aging on Farmland Abandonment: Evidence from Rural China. Land 2025, 14, 393. [Google Scholar] [CrossRef]
  53. Liu, Y.; Lu, S.; Chen, Y. Spatio-Temporal Change of Urban–Rural Equalized Development Patterns in China and Its Driving Factors. J. Rural Stud. 2013, 32, 320–330. [Google Scholar] [CrossRef]
  54. Huang, A.; Xu, Y.; Zhang, Y.; Lu, L.; Liu, C.; Sun, P.; Liu, Q. A Spatial Equilibrium Evaluation of Primary Education Services Based on Living Circle Models: A Case Study within the City of Zhangjiakou, Hebei Province, China. Land 2022, 11, 1994. [Google Scholar] [CrossRef]
Figure 1. Study area.
Land 14 00762 g001
Figure 2. Kernel density analysis of TS from 2013 to 2021.
Land 14 00762 g002
Figure 3. Kriging interpolation chart of traffic accessibility under the aviation impact from 2013 to 2021.
Land 14 00762 g003
Figure 4. Charts of temporal and spatial changes in PPSR.
Land 14 00762 g004
Figure 5. Trade-off synergy chart of TS and PPSR.
Land 14 00762 g005
Table 1. Weight values of traffic capacity by type.
Road TypeMotorwayNational HighwayProvincial HighwayCounty RoadTownship RoadRampRailway
Weight0.40.20.180.120.070.031
Table 2. Type matching and speed setting of OSM roads and roads in Yunnan Province.
OSMMotorwayTrunkPrimarySecondaryTertiary
Corresponding TypeHigh-Speed HighwayNational Highway/Urban ExpresswayProvincial Road
/Main Road
County Road/Secondary Trunk RoadTownship Road/Branch Road
Speed
(km/h)
11070604035
OSMLinkRailway
Corresponding TypeRampOrdinary RailwayNanning–Kunming High-Speed RailwayShanghai–Kunming
High-Speed Railway
Speed
(km/h)
30100250300
Table 3. Table for classification of rural contraction types.
Evaluate ResultsTypes of Rural Contraction
Con i 0 Growth type
5 Con i 0 Mild contraction type
8 Con i 5 Moderate contraction type
Con i 8 Severe contraction type
Disclaimer/Publisher’s Note: The statements, opinions and data contained in all publications are solely those of the individual author(s) and contributor(s) and not of MDPI and/or the editor(s). MDPI and/or the editor(s) disclaim responsibility for any injury to people or property resulting from any ideas, methods, instructions or products referred to in the content.

