Article

Delineation of and Conflict Coordination in Municipal Territorial Space Functional Zones: A Case Study of Xuzhou, China

1
School of Public Administration, Yanshan University, Qinhuangdao 066004, China
2
Key Laboratory of Coastal Zone Development and Protection, Ministry of Natural Resources, Nanjing 210095, China
3
School of Public Policy and Management, China University of Mining and Technology, Xuzhou 221116, China
*
Author to whom correspondence should be addressed.
Land 2025, 14(4), 761; https://doi.org/10.3390/land14040761
Submission received: 24 February 2025 / Revised: 24 March 2025 / Accepted: 1 April 2025 / Published: 2 April 2025

Abstract

:
Urbanization-driven land use and cover change intensifies the competition for limited land resources, exacerbating spatial conflicts and challenging sustainable development, particularly in rapidly urbanizing regions. This study focuses on the delineation and coordination of territorial space functional zones, addressing conflicts arising from rapid urbanization and the multifunctionality of land resources. By integrating land suitability evaluation, spatial simulation, and spatial overlay analysis, this paper delineates three functional zones and three types of conflicts for 2035: a farmland protection zone, an ecological protection zone, and an urban development zone, and construction–farmland conflicts, construction–ecological conflicts, and farmland–ecological conflicts. A suboptimal equilibrium boundary is proposed to resolve conflicts by balancing the economic output price and the ecological service price of agricultural land against construction land prices. The results show that the optimized urban construction land (632.50 km2) is significantly smaller than that resulting from the planned 1.3-fold expansion, indicating that the original coefficient is unreasonable. Post-coordination, FPZ, and EPZ areas were adjusted to 1136.72 km2 and 295.15 km2, respectively, prioritizing food security and ecological conservation. The findings highlight the need for collaborative urban planning to mitigate spatial conflicts and manage the compounded effects of urbanization and land resource competition. This paper provides a quantitative framework for resolving space conflicts, offering insights for sustainable territorial planning and management.

1. Introduction

Territorial space is an important carrier for high-quality socio-economic development and ecological civilization construction and a core support element for the coupled development of the human–land system, with various functions such as sustaining production, living, and ecology [1]. Rapid industrialization and urbanization have triggered intense competition for land resources in urban–rural development. This has intensified conflicts between urban expansion, agricultural needs, and ecological preservation, causing imbalanced development, resource shortages, ecosystem degradation, and environmental pollution that hinder a sustainable growth [2,3,4,5]. In the past 40 years, China’s urbanization rate has been leading the world with an average annual growth rate of 1% [6], and the urban built-up area has expanded from 7000 km2 in 1981 to 64,000 km2 in 2023. The limited territorial space resources play different functions, and an unreasonable territorial space layout has difficulties in satisfying the principle of maximizing the benefits of land use, which triggers the problem of territorial spatial function conflicts [7,8]. Therefore, defining core functional areas based on local conditions and resources and coordinating territorial space functional zone conflicts are essential for improving land management and spatial governance [9,10].
Research on space functional zones has focused on type classification [11], delineation methods [12], simulation, and optimization [13]. Space functions can be divided broadly into two types, i.e., production, living, and ecological space functions and agriculture, urban, and ecological space functions [14,15]. In the early studies, the delineation of territorial space functional zones was mainly based on land use types, i.e., they were categorized according to the basic functions performed by land use types [16]. After the proposal of ‘multi-planning’ and ‘national spatial planning’, there has been an increase in studies on the delineation of space functional zones based on a dual evaluation, i.e., an evaluation of the carrying capacity of resources and the environment as well as a suitability evaluation of territorial space development, with more consideration given to the background conditions of the resources [10,13,17,18]. In terms of simulation and optimization, models such as SD, CA, CLUE-S, FLUS, and PLUS are used to simulate the future patterns of territorial space and to optimize the function of territorial space by setting limitations and constraints [13,19,20,21].
Research on territorial space conflicts has included the identification of conflict theory concepts, conflict measurement and assessment, conflict-driven mechanisms, and conflict optimization paths [6,22]. The identification of conflict theory concepts mainly requires to analyze and classify the conflict subject, conflict time, conflict region, conflict manifestation, etc. [23]. Therefore, the conflict concepts are not uniform and change with the research perspective. The methods of measurement and assessment of conflicts can be mainly classified into two categories, one of which is qualitative analysis, including the logical framework method, participatory survey method, game theory, etc. [24,25,26]. Such methods mainly provide a qualitative description that cannot measure the intensity of the conflicts and cannot demonstrate the specific state of the conflicts. The other category is quantitative measurement, including spatial overlay analysis, comprehensive index evaluation, and ecological risk assessment methods [6]. Spatial overlay analysis can visually demonstrate the specific location of existing conflicts [27]. Comprehensive index evaluation mainly identifies potential conflicts by evaluating functional suitability and is somewhat subjective in the selection of indicators [23,28]. Ecological risk evaluation is relatively objective and can show the strength of the conflicts but ignores the influence of socio-economic factors [6,22]. The driving mechanisms of space conflicts are mostly centered around the natural environment, socio-economics, and policy systems [6,22,29]. In the natural environment and socio-economics, the strength of the driving effects is analyzed from the perspectives of geography, statistics, etc., through the use of quantitative models, such as geographical detector and random forest [22,30]. In the policy and institutional fields, the impact of policy and institutional implementation on territorial space conflicts is analyzed from the perspectives of management, political science, etc. [29]. Based on the above, conflict optimization paths have been proposed accordingly, such as multi-objective planning, participatory management, zoning regulation, etc. [31,32,33].
Due to the imperfections of China’s land market, urban expansion has a unique demand-oriented character, i.e., most of the expansion process is under the control of the government, with the goal of achieving rapid economic growth in the short term [34]. Therefore, under the premise of limited land resources, the growth of urban space will inevitably require the occupation of agricultural and ecological space, which will lead to an imbalance in space structure and an intensification of space conflicts [4,22]. In addition, due to the multifunctionality of land resources, land space plays different functions in the process of development and utilization [32]. When it is used as an urban space, it reflects the economic value of the land and performs production and living functions. When it is used as an agricultural production space, it mainly plays the function of food production. When it is used as an ecological space, it plays the functions of ecological maintenance and environmental protection. Therefore, space conflicts under different function orientations are unavoidable.
The above studies can provide references for this paper to delineate territorial space functional zones and identify space conflicts, but most research on coordinating space conflicts is focused on qualitative analyses and on optimization through goal orientation, and there is a lack of research on solving the future municipal territorial space conflicts from different academic disciplines’ perspectives. Municipal territorial space planning serves three key functions: it provides the most comprehensive foundation for implementing upper level plans, facilitates practical resource allocation, and ensures effective industrial development [35,36]. Therefore, this paper focuses on Xuzhou, a rapidly expanding city in eastern China, using its resource background and reality of socio-economic development to delineate municipal territorial space functional zones for 2035, identify territorial space functional zone conflicts, and propose a conflict coordination scheme based on the principle of value equilibrium in economics. The results can provide reference for the adjustment of the municipal territorial space planning and the territorial space optimization.

2. Theoretical Framework

2.1. Territorial Space Functional Zones and Types of Conflicts

Functional zoning of territorial space is a spatial division of a region based on its functional characteristics and differences in territorial space resulting from the different ways of using resource elements in the region [9,37]. This paper defines three types of territorial space functional zones: (1) the farmland protection zone (FPZ) is a region delineated based on a cultivated land quality evaluation combined with the requirement for a certain amount of basic farmland in territorial space planning; (2) the ecological protection zone (EPZ) is a region with high ecological sensitivity, performing important ecosystem service functions; (3) the urban development zone (UDZ) is a region determined based on an urban construction suitability evaluation and a land use simulation, in which the main land use type is urban construction.
Based on the definition of these three types of territorial space functional zones, this paper identifies three types of territorial space functional zone conflicts: (1) construction–farmland conflicts (CFCs), i.e., spatial layout conflicts regarding the construction land within the UDZ and the FPZ; (2) construction–ecological conflicts (CECs), i.e., spatial layout conflicts regarding the construction land within the UDZ and the EPZ; (3) farmland–ecological conflicts (FECs), i.e., spatial layout conflicts between the FPZ and EPZ. In addition, construction–farmland–ecological conflicts are included in the above three types; so, they are not discussed separately.

2.2. Research Framework

Based on the above analyses, this paper constructs a research framework for the delineation of territorial space functional zones and the coordination of conflicts (Figure 1). Specifically, the research is carried out in four steps: (1) Delineation of territorial space functional zones. The results of the independent delineation of the three types of territorial space functional zones (FPZ, EPZ, and UDZ) are obtained through the cultivated land quality evaluation, the ecological protection importance evaluation, the urban suitability analysis, and the land use simulation. (2) Identification of territorial space functional zone conflicts and their characterization. Three types of conflicts, CFCs, CECs, and FECs, are identified through spatial overlay analysis. (3) Proposition of conflict solutions. According to the principle of value equilibrium, the theoretical proposition of equilibrium boundary is presented (see Section 2.3 for details of the analysis). Through the measurement of land value and the analysis of spatial interpolation, the spatial non-differentiation curve, i.e., the equilibrium boundary when the price of agricultural land (AP) and construction land (CP) is equal, is extracted and considered as the spatial boundary for conflict resolution. (4) Conflict coordination. Taking the equilibrium boundary as the spatial boundary, the land with CFCs and CECs within the boundary is retained as urban construction land, and that with CFCs and CECs outside the boundary is retained as FPZ and EPZ, respectively (see Section 2.3 for detailed reasons). The FECs are retained as FPZ conflicts with the priority principle of safeguarding basic survival needs and protecting food security. Finally, a layout of territorial space functional zones after conflict coordination is obtained.

2.3. Theoretical Proposition of Equilibrium Boundaries

According to existing studies, the AP in China can be divided into three parts: economic output price (APeo), ecological service price (APes), and social security price (APss) [34,38]. Three equilibrium boundaries can be defined based on the principle of value equilibrium: the ideal equilibrium boundary (IEB), the suboptimal equilibrium boundary (SEB), and the restricted equilibrium boundary (REB). The IEB is the spatial equilibrium curve when the sum of APeo, APes, and APss is equal to the CP (CP = APeo + APes + APss). The SEB is the spatial equilibrium curve when the sum of APeo and APes is equal to the CP (CP = APeo + APes). The REB is the spatial equilibrium curve when the APeo is equal to the CP (CP = APeo). IEB, SEB, and REB are all spatial undifferentiated curves of land resources used as agricultural land or construction land under different conditions.
From Xuzhou’s urban development practice, urban expansion is a spatial carrier to ensure the city’s economic and social development and the improvement of urbanization in the new era [39,40]. Therefore, this paper selected the SEB to solve the conflicts of territorial space functional zones. In Xuzhou, the value of land resources within the boundary used as construction land is greater than that within the boundary used as agricultural land; so, the land with CFCs and CECs within the boundary should be retained as urban construction land, and that with CFCs and CECs outside the boundary should be retained as FPZ and EPZ, respectively. The specific reasons for selecting the SEB are as follows: (1) The suboptimal equilibrium state meets the rigid requirements of rapid urbanization and economic development for urban construction land. Reasonable construction land growth can provide a space carrier for urban development, allowing for the occupation of some cultivated land and ecological land [41]. (2) The SEB also reflects the economic and ecological price of agricultural land, which can play a role in maintaining sustainable development in the region. (3) Although the suboptimal equilibrium state does not reflect the social price of agricultural land, excessive restrictions on the growth of urban construction land will impede urbanization, thus increasing the social costs.

3. Material and Methods

3.1. Study Area

Xuzhou (33°43′ N–34°58′ N, 116°22′ E–118°40′ E) is located in the northwestern part of Jiangsu Province, China, and includes five districts (Yunlong District (YL), Gulou District (GL), Quanshan District (QS), Tongshan District (TS), and Jiawang District (JW)), two county-level cities, and three counties, with a total area of about 11,765 km2. From 1990 to 2023, the GDP and per capita GDP in Xuzhou increased by 77.88 times and 63.83 times, respectively. Along with economic development, from 2009 to 2023, the urban construction land in Xuzhou increased by 383.35 km2, and the cultivated land and water area decreased by 327.05 km2 and 425.38 km2, respectively. It can be seen that in Xuzhou there is intense competition for various types of functional space. In order to better align with the practice of territorial spatial planning and land use control, the Xuzhou municipal district (generally called Xuzhou) was selected as the study area (Figure 2), with an area of about 2976 km2, in which Gulou District, Quanshan District, and Yunlong District are collectively referred to as the central urban area in this paper.

3.2. Data Sources and Preprocessing

The data used in this paper include land use data, basic geographic information data, socio-economic data, attribute data of cultivated land, land price data, etc., as shown in Table 1.
Preprocessing of basic geographic information data: Land use data, DEM data, meteorological data, NDVI data, NPP data, soil data, and socio-economic spatial data were all clipped in combination with the vector boundary of Xuzhou, with a unified resolution of 1 km. The land use data were reclassified into six types: cultivated land, forest land, grassland, water area, construction land, and unused land, which provided basic data and conversion rules for land use simulation and prediction.
Establishment of a spatial database of land price sample points: Vectorized processing of the benchmark land price map of Xuzhou from 2005 to 2022, combined with information on land price sample points from the China Land Value Information Service Platform; a spatial database of land price sample points was established, including 162 commercial sample points, 189 residential sample points, and 64 industrial sample points. As some land price sample points data were missing in some years, this paper used the average value in SPSSAU and eliminated some outliers. Finally, 374 land price sample points were selected, and their spatial distribution as well as the land price in 2022 are shown in Figure 3.

3.3. Methods

3.3.1. Delineation Methods for Territorial Space Functional Zones

(1)
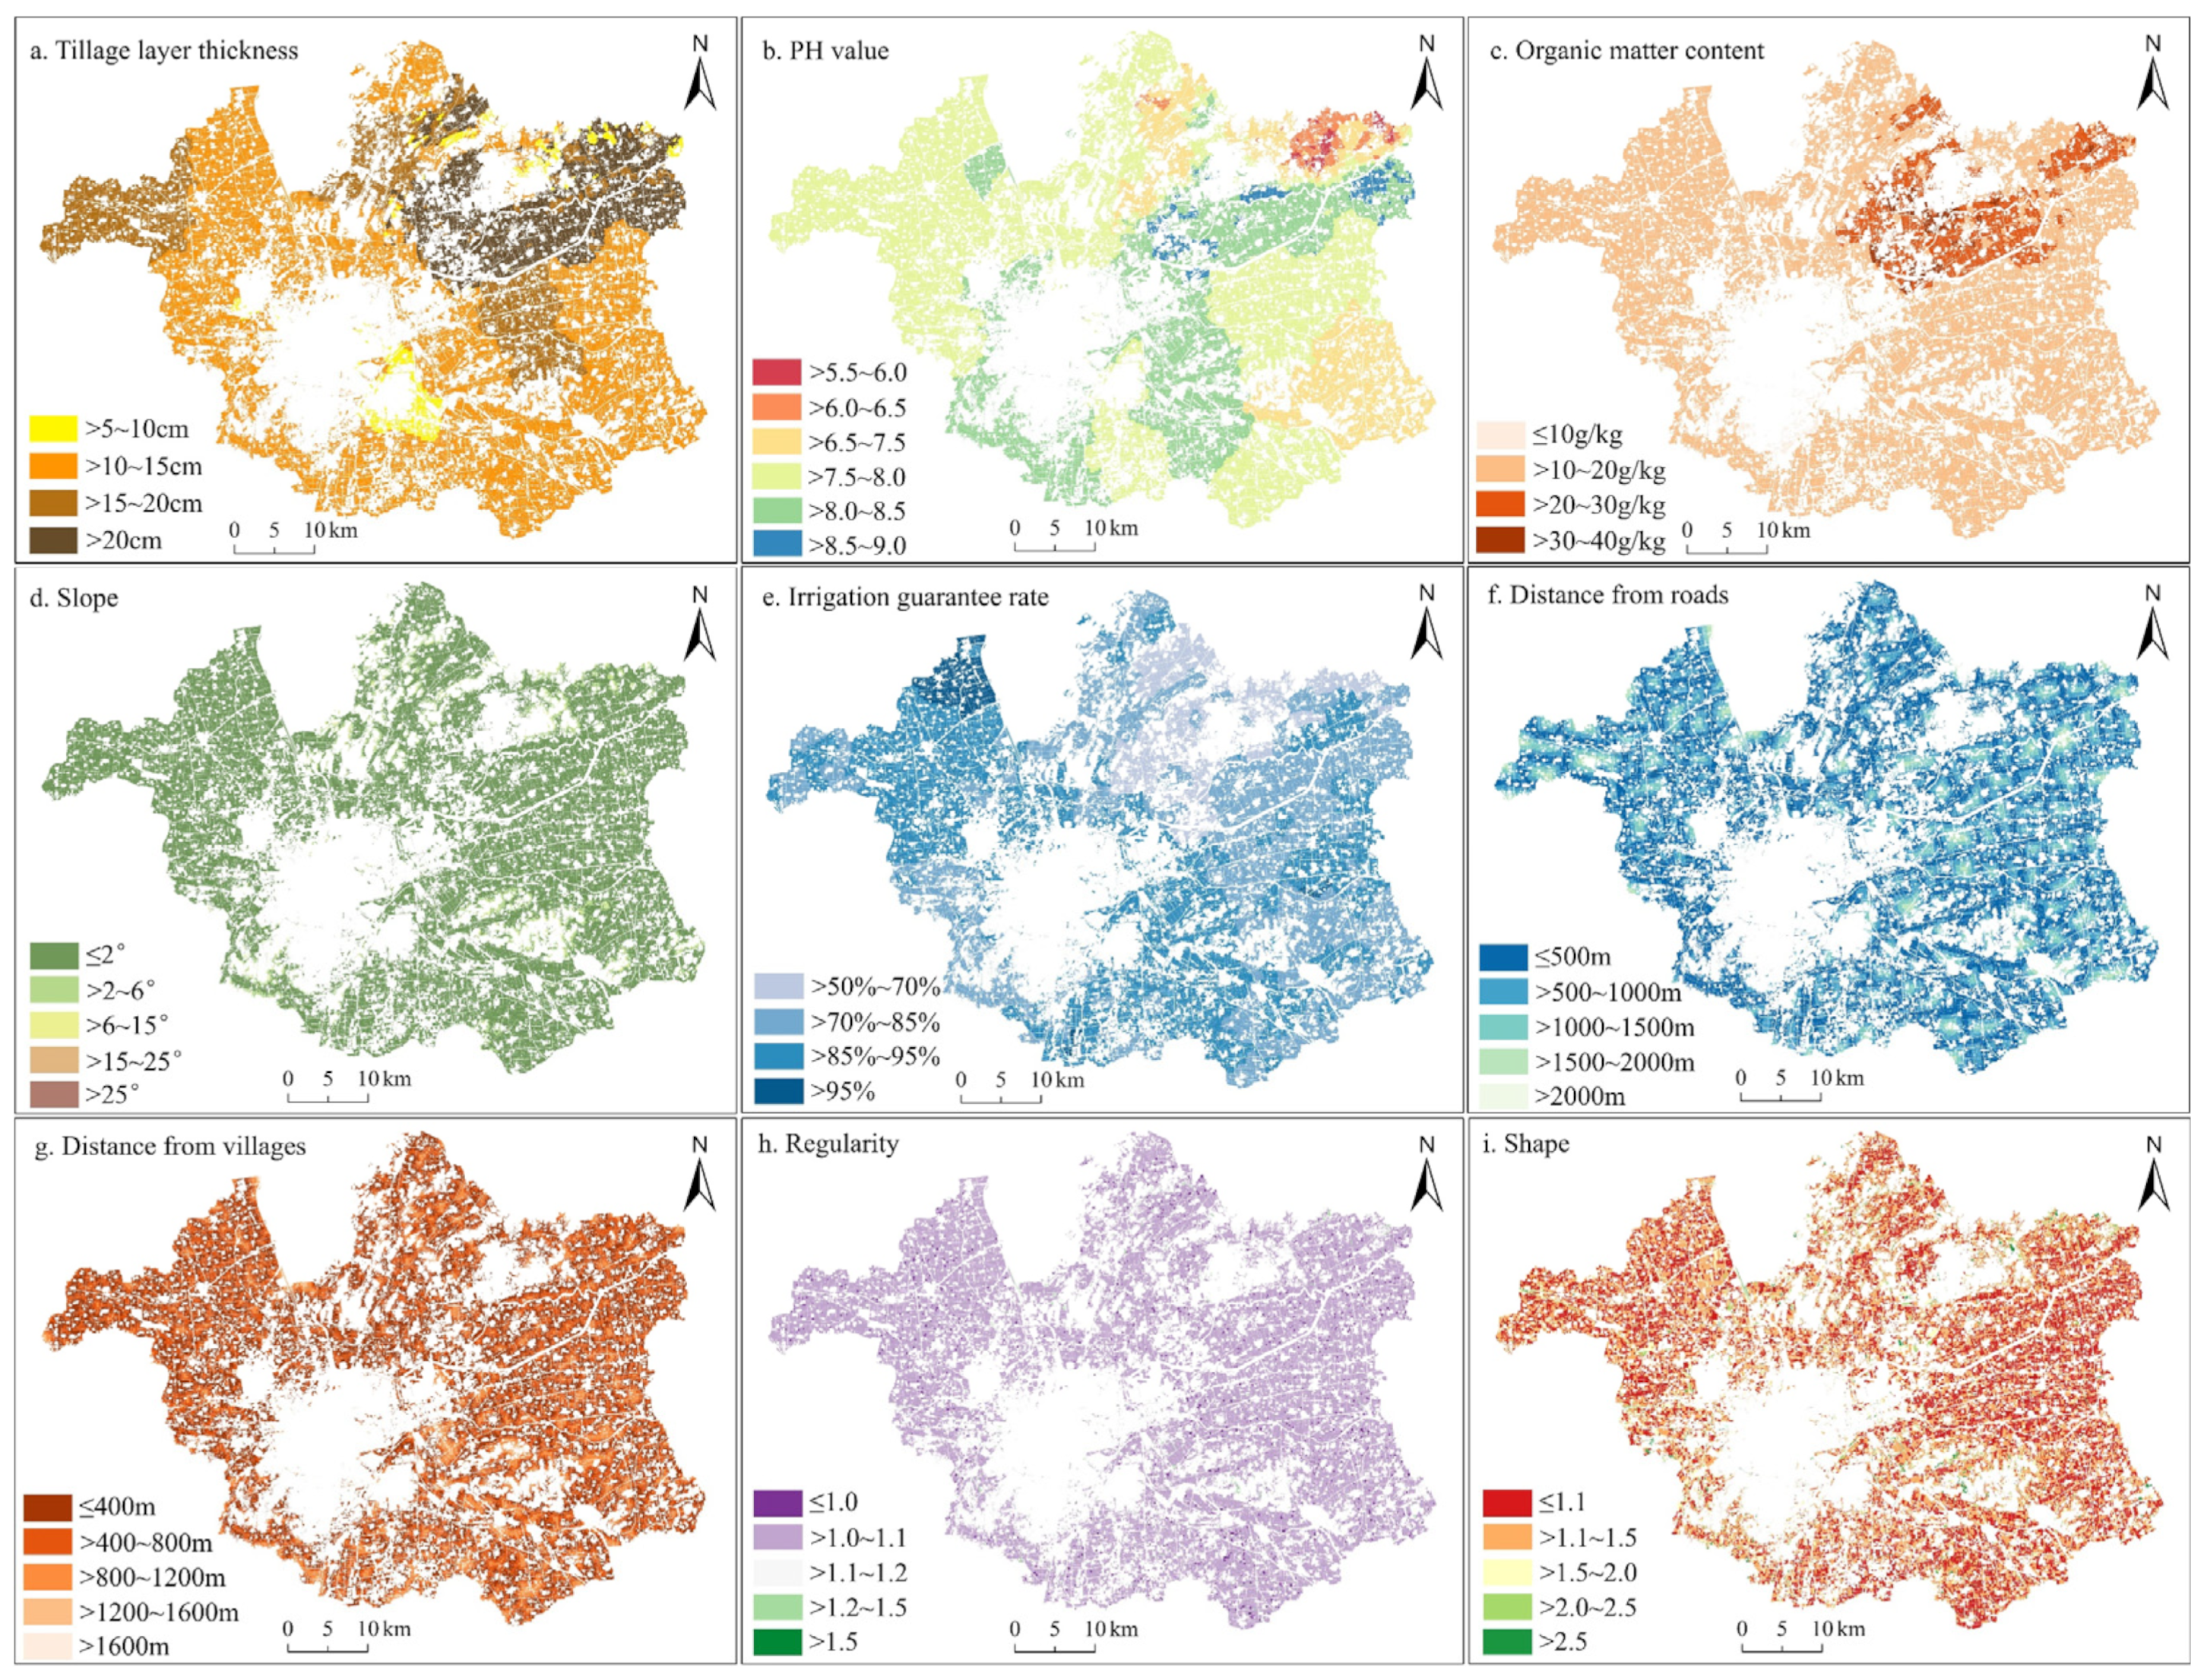
Delineation method for the FPZ
This paper selected 9 indicators from 3 layers of natural conditions (NCs), location conditions (LCs), and spatial layout (SL) to construct a cultivated land quality evaluation system and classified cultivated land quality in grades [42,43,44]. The entropy method was used to determine weights (Table 2). The TOPSIS method was used to judge the relative quality of cultivated land [45,46]; combining the results of this method with the requirements of the permanent basic farmland indexes issued in the Xuzhou Territorial Space Master Plan (2021–2035), better quality cultivated land was designated as FPZ.
(2)
Delineation methods for the EPZ
This paper analyzed the importance of ecological protection from two aspects: ecological sensitivity and the importance of ecosystem service functions. Ecological sensitivity includes soil erosion, land sanding, desertification, and salinization. Considering the background conditions of the study area, only soil erosion sensitivity was selected. Ecosystem service functions include water retention, soil conservation, wind-breaking and sand-fixing, and biodiversity maintenance. Considering the background conditions of the study area, the three functions of water conservation, soil conservation, and biodiversity maintenance were selected.
Soil erosion sensitivity is expressed by constructing an index, whose formula is as follows [47,48,49]:
S S = R × K × L S × C V 4
where SS is the soil erosion sensitivity index, R is the rainfall erosivity factor, K is the soil erodibility factor, LS is the slope length gradient factor (the surface roughness factor is selected for replacement in small areas), and CV is the vegetation cover factor; all of them are dimensionless factors.
The functions of water retention, soil conservation, and biodiversity are expressed by constructing the corresponding indexes. The formulas are as follows [47]:
W R = N P P × F s i c × F p r e × 1 S s l o
S c = N P P × 1 K × 1 S s l o
S b i o = N P P × F p r e × F t e m × 1 F d e m
where WR is the water retention service capacity index, Sc is the soil conservation service capacity index, Sbio is the biodiversity maintenance capacity index, NPP is the net primary productivity of vegetation, Fsic is the soil infiltration factor, Fpre is the average annual precipitation factor, Sslo is the slope factor, K is the soil erodibility factor, Ftem is the average annual temperature factor, and Fdem is the elevation factor; all of them are dimensionless factors.
In summary, the most sensitive areas according to the evaluation results of ecological sensitivity and the most important areas according to the evaluation results of ecosystem service functions were designated as EPZ. In addition, it was also necessary to consider the ecological space protection list in the ecological space control regional planning of Jiangsu Province to comprehensively delineate the EPZ.
(3)
Delineation methods for the UDZ
(1)
Suitability analysis of urban development and construction
The minimum cumulative resistance (MCR) model can describe the resistance that needs to be overcome during the movement of species from source to destination. This paper applied the MCR model to analyze the suitability of urban development and construction. The formula used is as follows [50]:
M C R = f min j = n i = m H i j × R i
where Hij is the distance from source j to unit i in any point in space, Ri is the resistance coefficient of unit i to the motion of any point in space, and fmin is the minimum value of cumulative resistance for different sources.
The whole process was carried out in ArcGIS. Firstly, we determined the ‘source’. The ‘source’ is the starting point from where the examined things spread outwards, and this paper took the construction land in 2020 as the source of space expansion. Secondly, we constructed the resistance surface. With reference to existing studies, the resistance factors affecting urban development and construction were selected (Table 3), and the resistance surfaces were constructed based on grades, scores, weights, and overlapping. Finally, we analyzed the suitability of urban development and construction. The cost distance function was used to combine the expansion sources with the resistance surface to obtain the minimum cumulative cost to characterize the suitability of urban development and construction.
  • (2)
    Land use simulation and delineation of urban development zones
This paper coupled the “FLUS–Markov” model with a UGB module to simulate the future land use pattern. One of the modules used was the suitability probability calculation module based on an artificial neural network (ANN), which selected the driving factors of land use change (elevation, slope, distance from road, distance from water, GDP scale, population density) and obtained the suitability distribution probability of the land use type in each raster by ANN training. The other module was the cellular automaton module based on an adaptive inertia mechanism, which is adjusted for the conversion probability of each raster by the neighborhood effect, adaptive inertia coefficients, spatial demand, and conversion cost based on the suitability probability. The formula is as follows [51,52]:
T P p , k t = s p p , k , t × Ω p , k t × I n e r t i a k t × 1 c o n k
where T P p , k t is the probability that grid p is transformed into land use type k at time t, sp (p,k,t) is the suitability probability of ANN output, Ω p , k t is the neighborhood effect of land use type k on raster p at time t, I n e r t i a k t is the adaptive inertia coefficient of land use type k at time t, and c o n k is the conversion cost.
The Markov model can be used to predict the state at t + 1 by analyzing the state at time t. The probability matrix for conversion from one land use type to another was generated based on historical records and was used to predict the demand for various types of land use under natural development conditions.
Based on the determination of the future land use pattern using the FLUS model and Markov model, the UGB delineation module of the FLUS model, which is a morphology-based erosion and expansion method, was used to preliminarily optimize the construction land and enhance its spatial connectivity. Then, the UDZ was delineated by comprehensively considering the urban development suitability and the preliminary optimization results of the construction land.

3.3.2. Analysis Methods for Territorial Space Functional Zone Conflicts

Conflict Identification Method

In this paper, three types of territorial space functional zone conflicts were identified through spatial overlay, and the territorial space functional zone conflict index (TSFZCI) was constructed to measure the characteristics of conflicts in different units. The formula is as follows [27,53]:
T S F Z C I = S c / S u
where Sc is the area of territorial space functional zone conflicts, and Su is the area of the study unit.
Kernel density analysis is based on spatial data points and reveals the degree of spatial aggregation of data by setting the search radius and attribute weights. This paper used kernel density to analyze the spatial density characteristics of territorial spatial functional zone conflicts. The formula is as follows [50,54]:
f ^ x = 1 n h i = 1 n K x x i h
where f ^ x is the density function of territorial space functional zone conflicts, K is the kernel function, (xxi) is the distance from the estimated point x to xi, h is the search radius, and n is the number of points within the search radius.

3.3.3. Equilibrium Boundary Model

According to the theoretical analysis in Section 2.3, the SEB refers to the spatial equilibrium curve when the land price is just expressed as the sum of APeo and APes and equal to the CP. The CP was obtained by examining the sample points in the database. The AP was obtained through the calculation of socio-economic statistics. Referring to existing studies and considering the feasibility and availability of data, this paper used cultivated land to represent agricultural land.
The APeo is expressed by the production value of grain or cash crops (net income from cultivated land area), and the APes is expressed by the ecological service value provided by cultivated land [55,56,57].
The calculated APeo and APes were used as historical data to construct a time series prediction model in SPSSAU to predict the AP in the future. Similarly, the historical data of the 374 sample points used for CP determination were matched with data from the optimal prediction model to predict the CP in the future. Using different interpolation methods in ArcGIS, the sample points used for CP determination were interpolated, and by comparing the results of cross-checking, the contours were extracted, obtaining the optimal interpolation results, i.e., the spatial non-differentiated curves where the CP was equal to the sum of APeo and APes. The formula is as follows [34]:
C P = A P e o + A P e s

4. Results

4.1. Delineation Results for Territorial Spatial Functional Zones

4.1.1. Delineation Results for the FPZ

The cultivated land quality evaluation indicators were processed according to the classification standards in Table 2, and the indicators’ spatial distribution was obtained, as shown in Appendix A, Figure A1. The tillage layer thickness in Xuzhou is mainly between 10 and 15 cm, and the soil is mainly alkaline. Jiawang District has the greatest differences in soil tillage layer thickness and soil PH value. The soil organic matter content of cultivated land mainly ranges from 10 to 20 g/kg, and the cultivated land with the highest organic matter content is located in Jiawang District. More than 90% of the cultivated land has a slope ≤2°, with the best irrigation conditions in the northern part of the Tongshan District. The irrigation guarantee rate of cultivated land near the water source of Weishan Lake is greater than 95%, and the irrigation conditions in some areas of the Jiawang District are relatively poor, which is largely due to the distribution of the mountain ranges and the topography and terrain features. The spatial distribution of cultivated land units is poor in contiguity and aggregation, and the differences between neighboring patches are relatively obvious. The regularity of the cultivated land is relatively good, and the regularity index for more than 90% of the cultivated land is between 1.0 and 1.1. Differences in the shape of the cultivated land are relatively obvious.
Based on the above classification results and indicators’ weights, the TOPSIS method was applied to determine the differences between the areas of each cultivated land unit and the most optimal solution and the worst solution and to judge the relative quality of the cultivated land. Combined with the target (1124.7391 km2) for permanent basic farmland under the municipal jurisdiction in the Xuzhou Territorial Spatial Overall Plan (2021–2035) released in November 2023, the final area of the delineated FPZ was 1189.33 km2, which accounted for 79.08% of the total cultivated land, and the spatial distribution was as shown in Figure 4. Among them, the FPZ distributed in Tongshan District was 819.60 km2, accounting for 76.96% of the cultivated land in this district. The FPZ distributed in Jiawang District was 335.04 km2, accounting for 86.54% of the cultivated land in this district. The FPZ distributed in Yunlong District was 18.93 km2, accounting for 65.34% of the cultivated land in this district. The FPZ distributed in Gulou District was 10.46 km2, accounting for 87.26% of the cultivated land in this district. The FPZ distributed in Quanshan District was 5.29 km2, accounting for 75.80% of the cultivated land in this district. The FPZ distributed in Quanshan District was 5.29 km2, accounting for 75.80% of the cultivated land in this district.

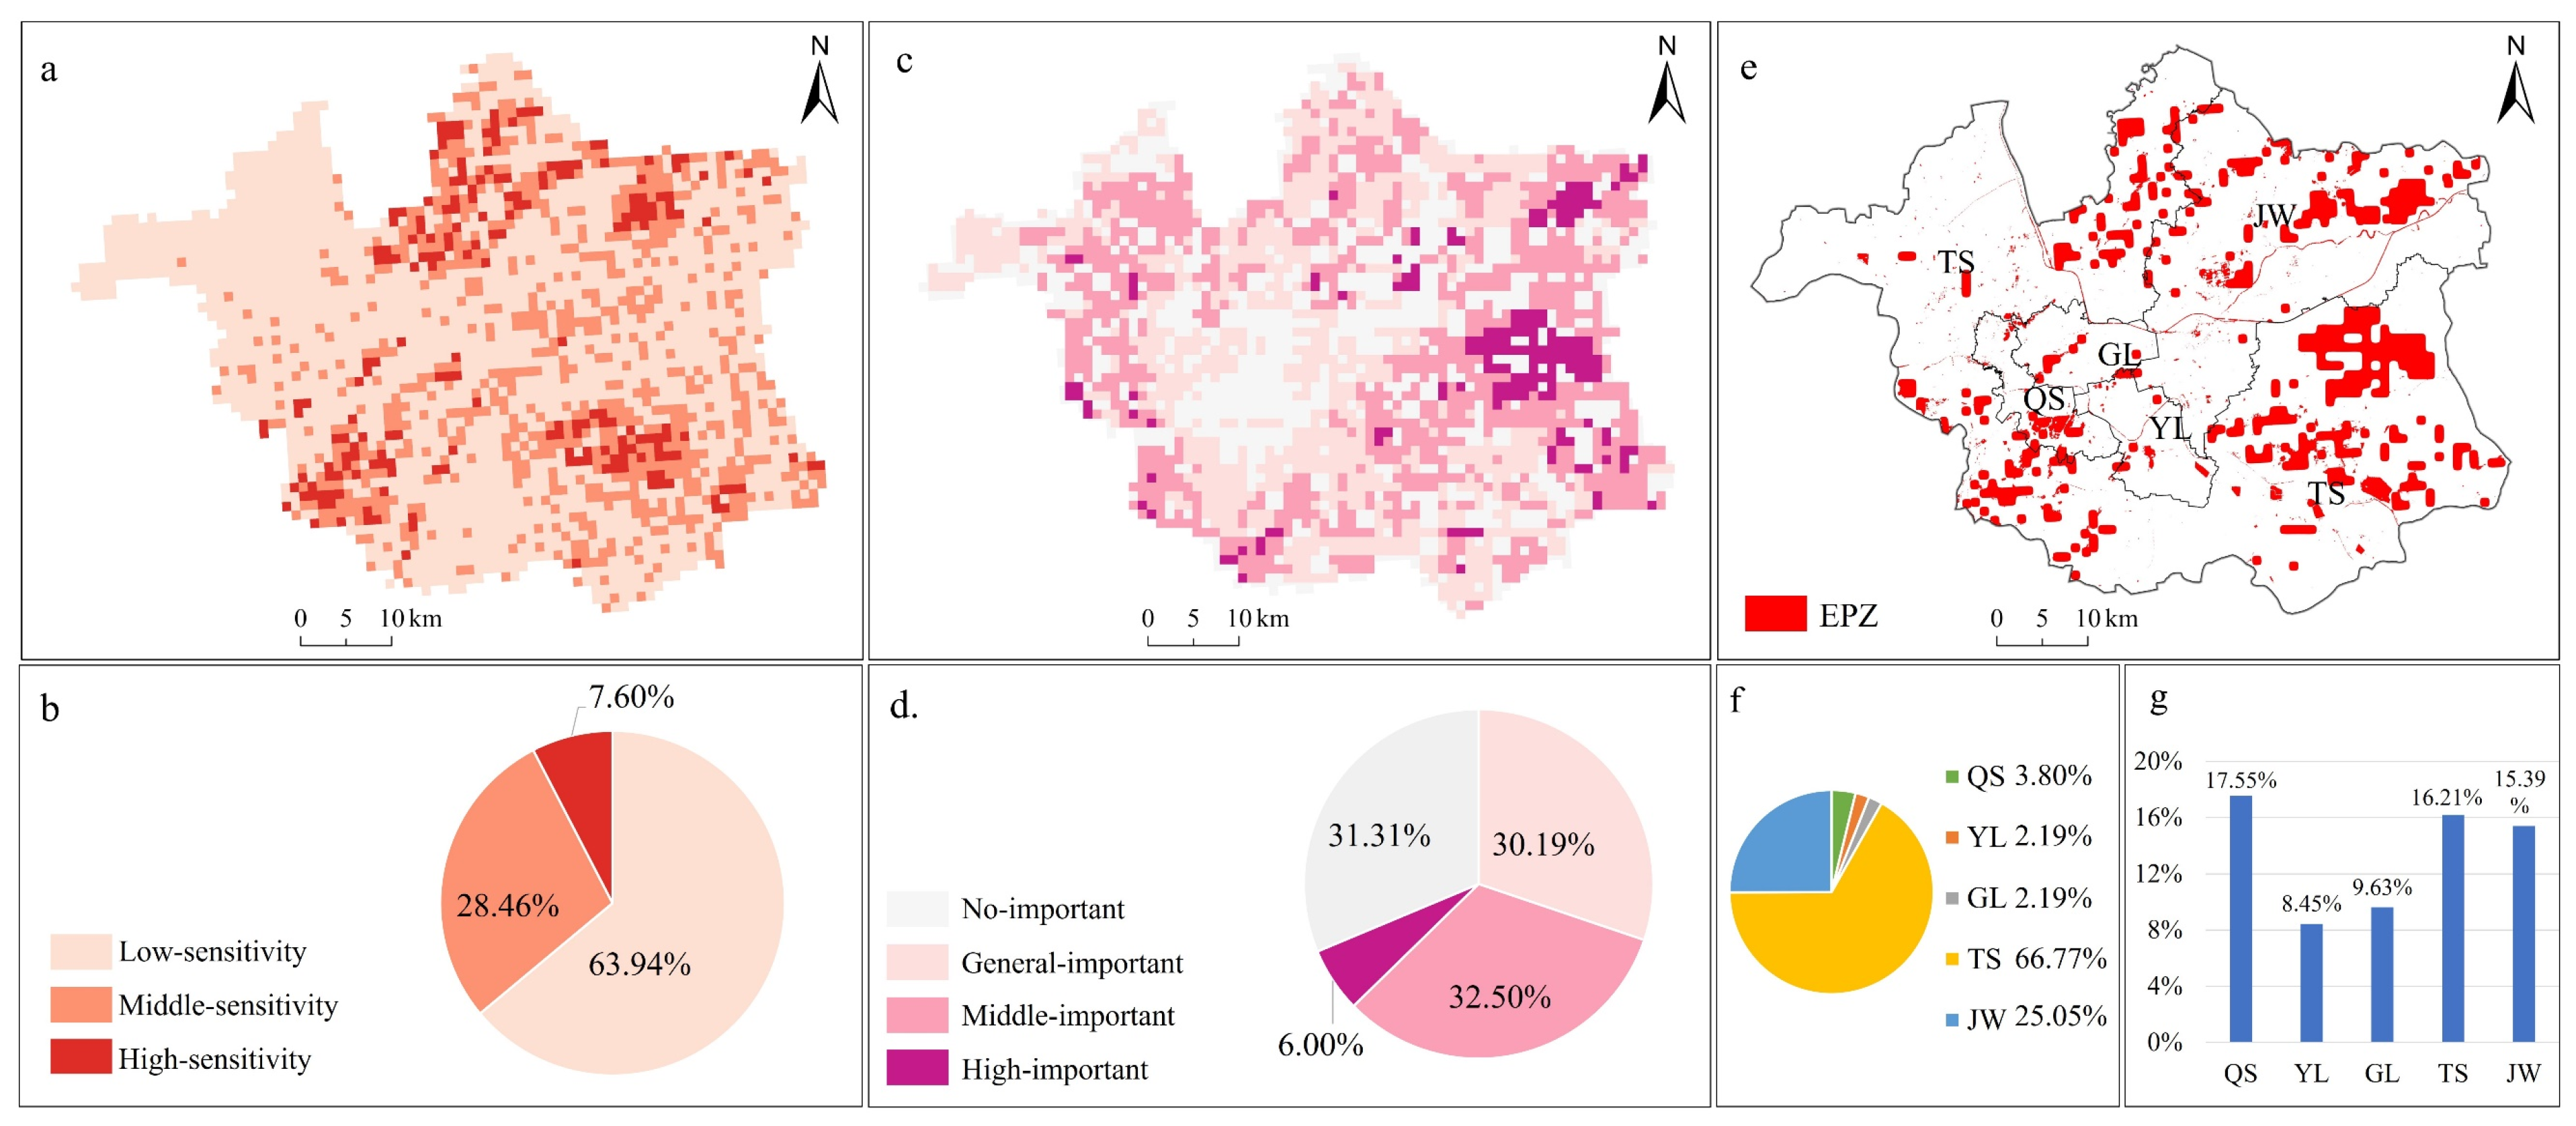
4.1.2. Delineation Results for the EPZ

The spatial layout of R, K, LS, and CV is shown in Appendix A, Figure A2. The ecological sensitivity evaluation results were obtained according to Formula (1), and ecological sensitivity was classified into three grades corresponding to low, middle, and high sensitivity using the natural breakpoint method, as shown in Figure 5a,b. It can be seen that the ecological sensitivity grade of the study area was mostly low, accounting for 63.94% of the area. The high-sensitivity grade was attributed to 7.60% of the area and mainly characterized the southwestern, southeastern, and northeastern parts of the study area. The distribution of land use types according to the sensitivity grade is shown in Table 4, with cultivated land having predominantly low and medium sensitivity grades, followed by construction land. In the high-sensitivity grade area, the proportion of cultivated land was relatively small, and the proportion of construction land, forest land, grassland, and unused land was relatively large, with forest land accounting for 16.27% of the area.
The evaluation results of the ecosystem service functions of water retention, soil conservation, and biodiversity are shown in Appendix A, Figure A3. The evaluation results of the importance of the ecosystem service functions were obtained through equal-weight overlay; the ecosystem service functions were classified into four grades as not important, generally important, of middle importance, and highly important by using the natural breakpoint method, as shown in Figure 5c,d. It can be seen that there was a relatively balanced proportion of ecosystem service functions classified as not important, generally important, and of middle importance. The proportion of highly important ecosystem service functions was very small, with a relatively contiguous area to those of ecosystem service functions of different importance located in the eastern part of the study area, and the rest scattered outside the central urban area. The distribution of land types in relation to the ecosystem service importance grade is shown in Table 4, with cultivated land dominating in all areas, followed by construction land. Cultivated land accounted for 80.65% of the areas with highly important ecosystem service functions, which shows that cultivated land plays an important role in the provision of ecosystem service functions.
Extracting the high-sensitivity area (177.01 km2) and the high-importance area (221.95 km2) and combining the results with data from the Xuzhou Ecological Space Protection List, the scale and spatial layout of the EPZ were comprehensively determined, as shown in Figure 5e–g. The total scale of the EPZ was 461.34 km2, accounting for 15.50% of the study area. In particular, the EPZ distributed in Tongshan District was 308.05 km2, accounting for 16.21% of the district. The EPZ in Jiawang District was 115.54 km2, accounting for 15.39% of the district. The EPZ in Quanshan District was 17.54 km2, accounting for 17.55% of the district. The EPZ in Yunlong District was 10.11 km2, accounting for 8.45% of the district. The EPZ in Gulou District was 10.09 km2, accounting for 9.63% of the district.

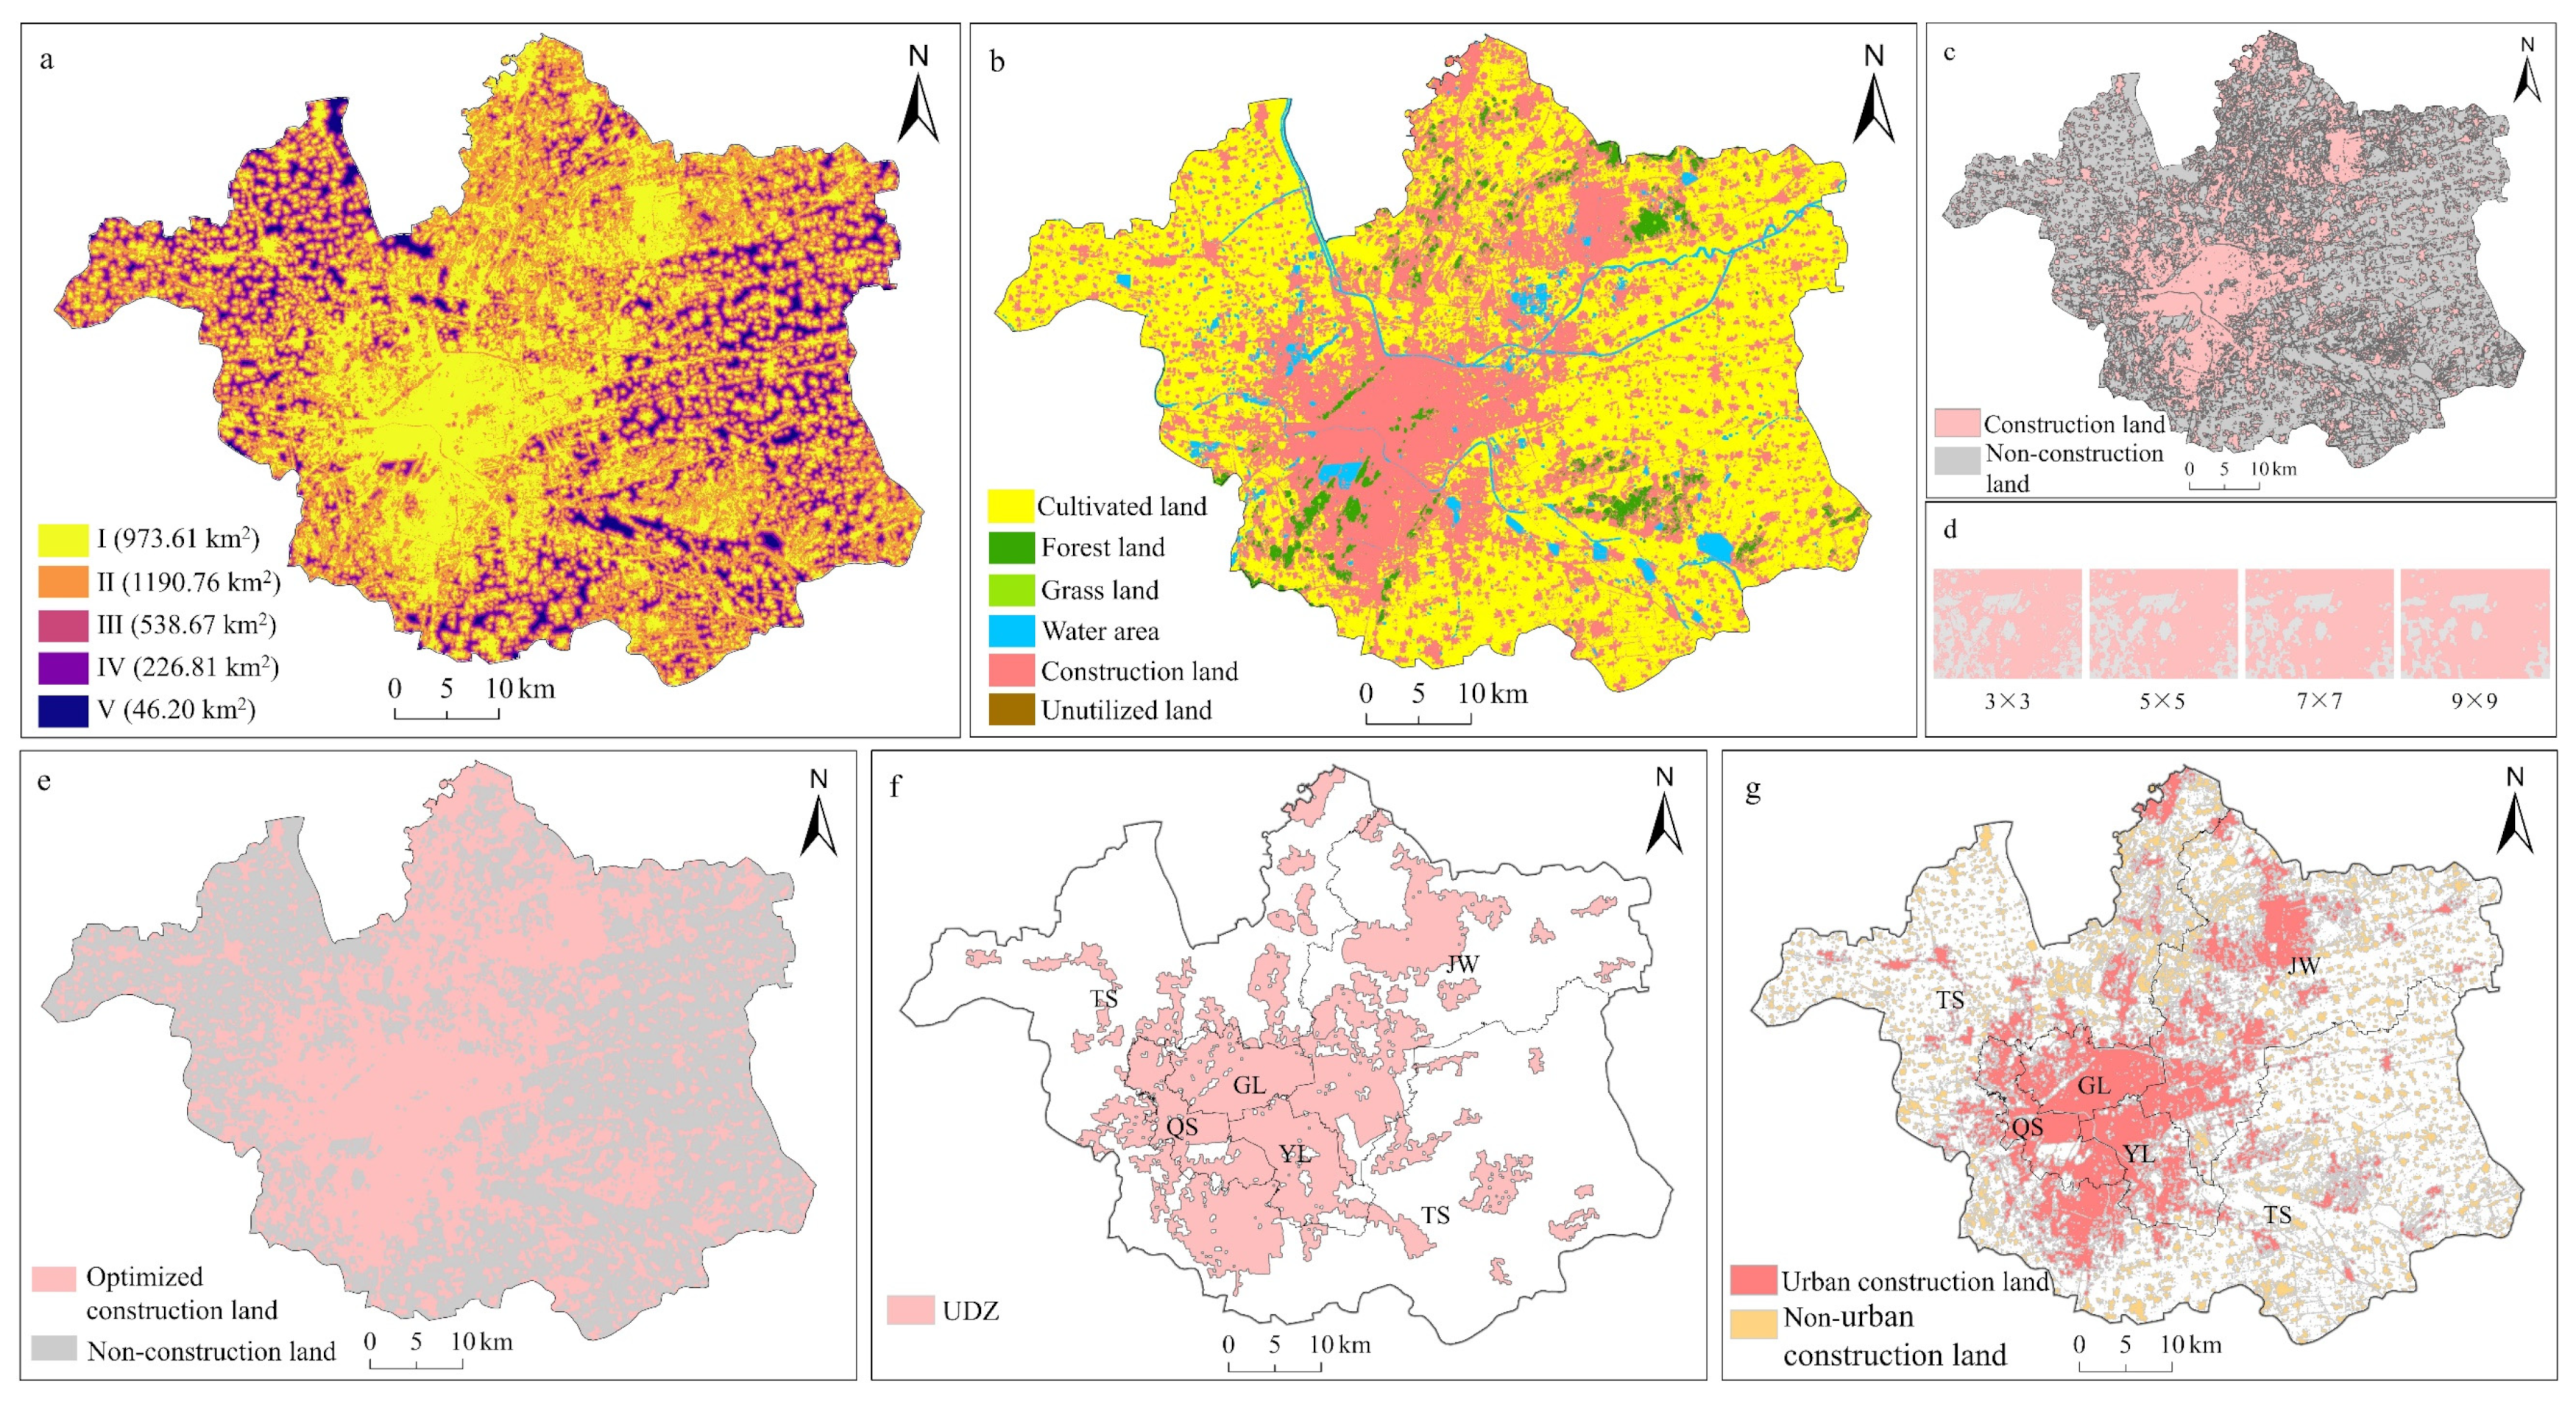
4.1.3. Delineation Results of the UDZ

The suitability grade of urban development and construction is shown in Figure 6a. The higher the grade, the more suitable the town development and construction. It can be seen that grade V and grade IV areas were mainly distributed in construction land and surrounding areas of cultivated land, accounting for 32.71% and 43.20% of the total area, respectively. In grade V area, 91.64% was construction land, and 7.49% was cultivated land. In grade IV area, 8.62% was construction land, and 87.20% was cultivated land. In grade III, II, and I areas, there were mainly cultivated land, forest land, and water areas, and no construction land.
Based on the land use data in 2005, the land use in 2020 was obtained by simulation. In total, 10% of the total number of pixels in the simulation results were selected to check the accuracy with respect to the actual 2020 data, obtaining a Kappa coefficient of 0.87 and an overall accuracy of 93.49%. This indicates that the simulation was good and could be used for prediction. Based on the land use transfer probability matrix from 2005 to 2020, the Markov model was used to predict the land use structure in 2035, and then the land use layout in 2035 was simulated in the FLUS model (Figure 6b). After extracting the construction land in the prediction results (Figure 6c), it could be seen that the construction land was fragmented in many scattered patches. Therefore, in the UGB delineation module, structural elements of 3 × 3, 5 × 5, 7 × 7 and 9 × 9 were selected for optimization, and the local results are shown in Figure 6d. It can be seen that the optimization with structural elements of 7 × 7 was able to maintain the edge details of the construction land as well as to enhance its contiguity. The preliminary optimization results are shown in Figure 6e.
In order to obtain a more complete UDZ, it was still necessary to remove the independent and smaller patches in the preliminary optimization results. In addition, the construction land included rural settlements. Combined with the administrative boundaries of villages in Xuzhou and the planning for urban development in municipal districts in the Xuzhou Territorial Space Master Plan (2021–2035), the initially optimized construction land was revised to obtain a relatively completed and contiguous UDZ (Figure 6f). According to the scope of the UDZ, the construction land in Xuzhou in 2035 could be divided into urban construction land and non-urban construction land (Figure 6g), and the scale of urban construction land was 698.69 km2.

4.2. Analysis of Territorial Space Functional Zone Conflicts

The three types of territorial space functional zone conflicts (CFCs, CECs, and FECs) were obtained by spatial overlay, as shown in Figure 7. The territorial space functional zone conflicts in Xuzhou covered an area of 277.83 km2. The scale of the FECs was the largest (119.80 km2), accounting for 43.12% of the total area of conflicts, and the FECs were mainly distributed in Tongshan District, with very little distribution in central urban areas. The scale of the CFCs was 87.88 km2, and they were mainly distributed in Tongshan and Jawang District, in addition to the southeastern part of Yulong District and the northwestern part of Gulou and Qanshan Districts. The scale of the CECs was 70.15 km2, and they were mainly distributed in Tongshan District, as well as in the central part of Jawang and Gulou Districts.
The TSFZCI of each district in descending order was Jawang District (0.1176), Gulou District (0.0916), Tongshan District (0.0871), Yunlong District (0.0696), and Quanshan District (0.0534), which indicated that Jawang District had the most serious overall conflicts, and Quanshan District had the weakest overall conflicts. The dominant conflict types differed among the districts (Figure 7c). The dominant conflict types were CECs (51.76%) and CFCs (47.13%) in Quanshan District, CFCs (60.80%) in Yunlong District, CECs (52.58%) in Gulou District, FECs (50.59%) in Tongshan District, and CFCs (40.84%) and FECs (39.91%) in Jawang District.
The kernel density characteristics of the territorial space functional zone conflicts in Xuzhou are shown in Figure 8. The kernel density value of the CFCs was relatively large, and the difference between intervals was obvious. The kernel density values of the CECs and FECs showed a relatively small difference, and these values were significantly smaller than that of the CFCs. In terms of spatial distribution, CFCs with a high kernel density interval [11.4787~21.5224] were distributed in all five districts, with the largest distribution area in Jawang District. CECs with a high kernel density interval [3.7734~6.6820], which was smaller in size, were only distributed in Tongshan District. FECs with a high kernel density interval [3.3608~5.6754] were distributed in Tongshan District and Jiawang District.
In terms of total conflicts, a high kernel density area [13.2061~23.7150] was present in all five districts, with a larger extension in Jawang, Tongshan, and Gulou Districts, which corresponds to the conflict index results of the five districts.

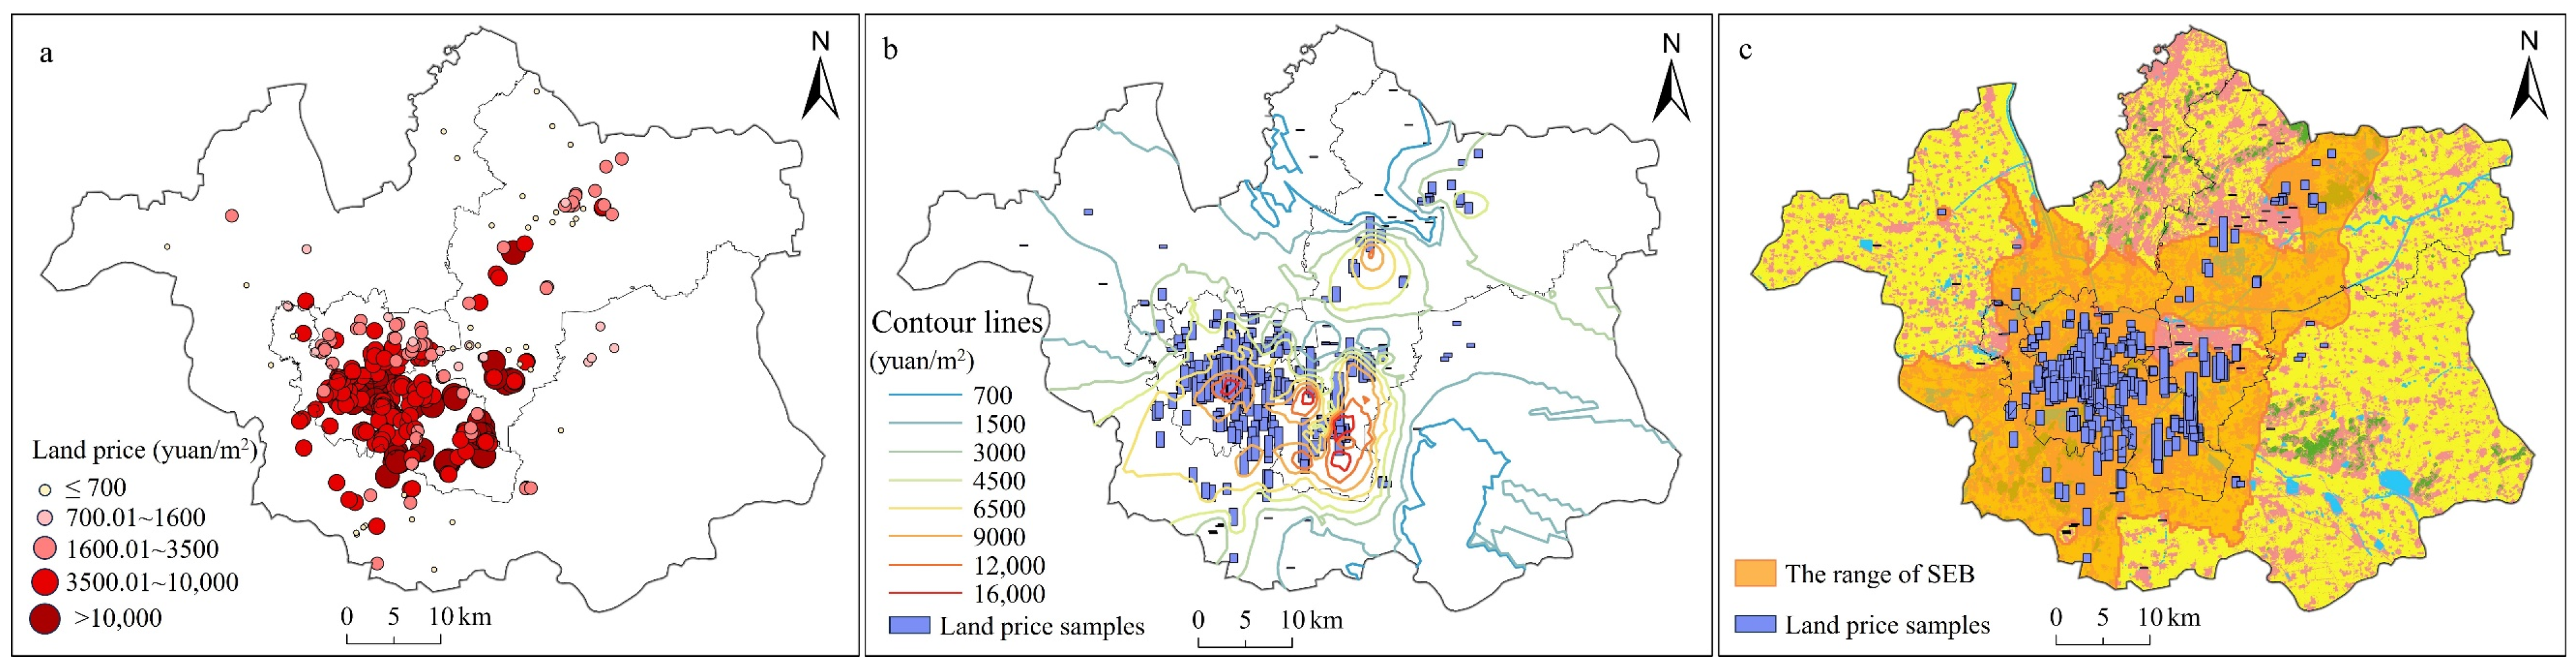
4.3. Extraction of the SEB

We used Formulas (9)–(11) to calculate the APeo and APes in Xuzhou from 2005 to 2021, as shown in Figure 9. It can be seen that the APeo and APes were predicted to constantly grow. The average annual growth rate of the APeo was found to be 9.41%, and its proportion was between 69% and 81% of the total price, and the average annual growth rate of the APes was found to be 5.68%, and its proportion was between 19% and 31% of the total price. Based on the APeo and APes from 2005 to 2021, time series data were defined in SPSSAU to construct time series prediction models. The prediction model for the APeo was the Brown exponential smoothing model, and the prediction model for the APes was the ARIMA (0,2,0) model, i.e., the differential autoregressive moving average model. The models’ R2 were all greater than 0.9, indicating a better prediction of the APes from 2022 to 2035. The prediction results, as shown in Figure 9, showed that the growth of the APeo will slow down from 2022 to 2035, ranging from 77% to 81% of the total value, and the growth of the APes will accelerate, reaching 19% to 22% of the total value. In 2035, the APeo and APes will be 1158.38 yuan/m2 and 341.08 yuan/m2, respectively.
Similarly, according to the prediction steps of the AP, 374 CP sample points (2006–2022) after preprocessing were brought into the time series prediction model and matched with the optimal prediction model, and the results showed that 350 CP sample points fitted well and could pass the accuracy test. Of them, 101 sample points were fitted with the Holt exponential smoothing model, 153 sample points were fitted with the Brown exponential smoothing model, and 96 sample points were fitted with the differential autoregressive moving average (ARIMA) model. The distribution of the land prices in 2035 is shown in Figure 10a.
The interpolation methods of classical Bayesian kriging, ordinary kriging, simple kriging, and pan kriging were selected to interpolate and analyze the CPs that passed the accuracy test. The cross-check results showed that the interpolation of the classical Bayesian kriging method was optimal, and these interpolation results were used to obtain the CP contours for Xuzhou in 2035 (Figure 10b). The corresponding AP (i.e., CP) in the SEB was 1499.46 yuan/m2, and the corresponding contour was extracted from the results of the interpolation analysis, leading to a SEB in 2035 (Figure 10c) with a scale of 1114.35 km2, spatially covering all of Yunlong District, 94.48% of Gulou District, 88.05% of Quanshan District, 42.94% of Jawang District, and 25.55% of Tongshan District.

4.4. Coordination of Territorial Space Functional Zone Conflicts

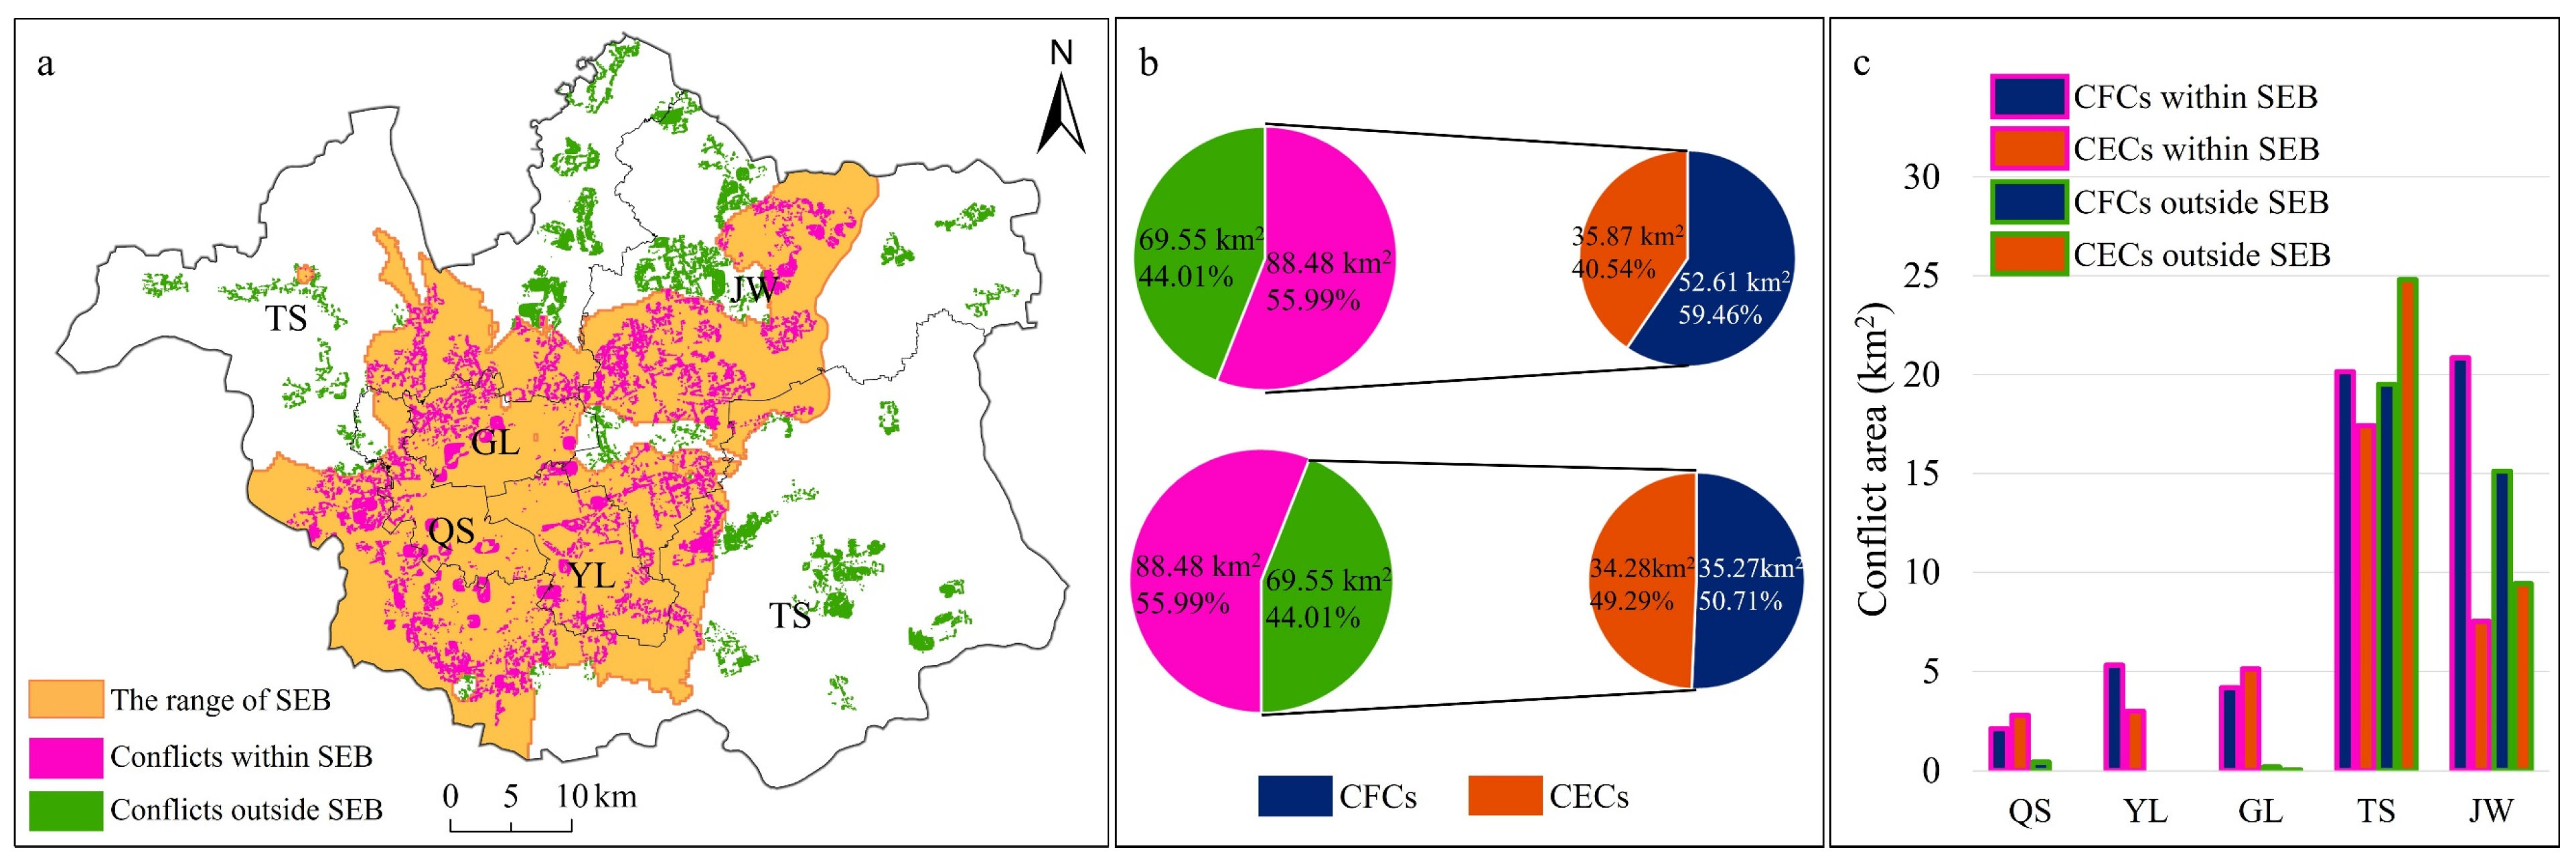
4.4.1. Analysis of Conflicts Within and Outside the SEB

The SEB extracted in Section 4.3 was used as the boundary for resolving territorial space functional zone conflicts (mainly for resolving CFCs and CECs), and the conflicts were divided into two parts (Figure 11). Within the SEB, the area with conflicts was 88.48 km2, of which CFCs occupied 52.61 km2 and CECs 35.87 km2. Outside the SEB, the area with conflicts was 69.55 km2, of which CFCs occupied 35.27 km2 and CECs 34.28 km2. Within the SEB, the conflicts in the UDZ and FPZ were more serious.
All of the conflicts in Yunlong District were located within the SEB. More than 80% of the CFCs in Quanshan District were located within the SEB, and all of the CECs were located within the SEB. More than 95% of the conflicts in Gulou District were located within the SEB. There was a small difference in the distribution of the conflicts in Tongshan and Jawang Districts within and outside the SEB.

4.4.2. Results for the Coordination of the Conflicts

Within the SEB, the value of land resources used as construction land was greater than that of land resources used as agricultural land; so, the land with both CFCs and CECs within the SEB was retained as urban construction land, while the land with CFCs and CECs outside the SEB was discarded as construction land and retained as FPZ and EPZ, respectively. In addition, there was an overlapping area of 3.36 km2 with CFCs and CECs within the SEB. Finally, the urban construction land in the UDZ after conflict coordination was 632.50 km2, and the comparison of its spatial distribution and details before and after conflict coordination is shown in Figure 12.
Based on the delineated FPZ, the CFCs inside the SEB were deducted, and the CFCs outside the SEB were retained. In addition, in order to satisfy the basic needs of the new population, food security should be given priority; so, the land with FECs should be retained as an FPZ. Finally, the area of the PFZ after conflict coordination was 1136.72 km2, and the comparison of its spatial distribution and details before and after conflict coordination is shown in Figure 13.
Based on the delineated EPZ, the CECs within the SEB were deducted. Although the land with FECs was retained as an FPZ in accordance with the principle of food security priority, it also has important ecological functions; so, the land with FECs can be used as both an FPZ and an ecological control zone (ECZ). In addition, after screening and removing the broken patches with very small areas, the area of the FPZ after conflict coordination was 295.15 km2, and the comparison of its spatial distribution and details before and after conflict coordination is shown in Figure 14.

5. Discussion

5.1. Appropriateness of Selecting the SEB to Resolve Space Conflicts in Xuzhou

The Pearson correlation coefficient between the built-up area and the per capita GDP and urbanization rate for Xuzhou City from 2005 to 2020 was 0.947 and 0.909, respectively, and passed the significance test, indicating that there was a significant positive correlation between built-up area and both urbanization rate and per capita GDP. Combined with the land use data from 2005 to 2020, it appeared that the construction land in Xuzhou has increased by 220.77 km2. By 2035, Xuzhou will still need to add new construction land to support its urban expansion [58]. Therefore, this paper selected the SEB to solve the spatial conflict. Compared with the IEB, the spatial scope of the SEB was larger, providing a moderate spatial scope for urban expansion and the development of new construction land to support the socio-economic development. The spatial scope of the SEB was smaller than that of the REB, which is also in line with the demand of regulating urban expansion and promoting urban renewal in the new era.

5.2. Comparative Analysis of the Optimization Results and Planning Data

In this paper, the scale of the FPZ after conflict coordination was 1136.72 km2, the scale of permanent basic farmland in Xuzhou City Territorial Space Plan was 1126.76 km2, and their spatial overlapping area was 691.02 km2. The scale of the EPZ after conflict coordination was 295.15 km2, and the scale of the ecological protection red line in the plan was 105.70 km2; thus, the EPZ almost fully covered the ecological protection red line. According to the requirements of the plan, the urban space area of Xuzhou City in 2035 will be 1.3246 times that of 2020 (573.19 km2), i.e., 759.25 km2. The urban construction land after conflict coordination was 632.50 km2. It can be seen that the expansion coefficient of about 1.3 times in the plan is not reasonable; this result is similar to the results of many scholars [59,60,61].

5.3. Management Policy Recommendations

Based on the above research, this paper can provide the following suggestions for the territorial space optimization and urban space management of Xuzhou.
(1)
Define the primary resolution of conflicts and the direction of territorial space optimization.
The central urban area should firstly solve the CFCs and CECs. Its land resources are more valuable to be used as construction land; so, it can appropriately sacrifice some cultivated land and ecological land, prioritize the support of urban development, and promote urban development and construction, so that from external expansion, internal enhancement will be achieved. The conflicts of territorial space functional zones in Jiawang District appeared to be the most serious, and the CFCs should be resolved primarily. Some cultivated land in Jiawang District is of better quality and provides important ecological functions; so, its protection as an FPZ and an ECZ at the same time should be emphasized [62]. The conflicts in Tongshan District appeared to be mainly FECs, and the basic farmland protection policy should be strictly implemented to give full play to the advantages of concentrated and contiguous cultivated land in this district, to strengthen the bottom-line control of territorial space, and to reasonably guide the structural adjustment of agricultural production space.
(2)
Improve the utilization efficiency of construction land and promote multi-center urban development.
According to the spatial interpolation results of land price, it can be seen that in the junction area of Gulou District and Quanshan District, the northeastern part of Yunlong District, the junction area of Yunlong District and Jiawang District, and the southwestern part of Jiawang District, the land price contour showed a distribution characterized by multi-center circles, indicating an obvious multi-center development pattern in Xuzhou. Part of the old urban areas in Gulou District, Quanshan District, and Yunlong District should focus on identifying low-utility land, promoting its redevelopment, tapping the potential of urban construction land, exploring the land mixed development and space composite utilization, and promoting urban renewal [63]. Jiawang District and Tongshan District, as “new districts” for development and construction, should rely on the two national industrial platforms in Xuzhou to drive the regional industrial development and promote the construction of new districts.
(3)
Coordinate urban and rural development to make up for the lost APss.
The APss was sacrificed in the process of using the SEB to coordinate space conflicts. The Government can make up for this by implementing an urban–rural integration strategy [64,65], for example, in terms of infrastructure, by promoting the integration of urban–rural infrastructure construction and the standardization of its maintenance, so as to achieve the sharing of public services between urban and rural areas [66]. In terms of economic development, rural economy can be promoted through the large-scale management of agricultural land, the choice of value-added ecological products, and the enhancement of agricultural technology [67]. In terms of the policy system, the Government can build a social security system for farmers to compensate for their losses.

5.4. Contribution to Research, Limitations, and Future Work

This paper focused on the delineation of and conflict coordination in territorial space functional zones. In common with the existing studies [10,13], in the process of delineating the territorial functional zones, the background conditions of the land resources and the suitability of the space development were fully considered. Under different research perspectives, scholars have classified different types of conflicts [27,28,53]. In this paper, three types of space conflicts (CFCs, CECs, and FECs) were delineated in order to propose coordination and management suggestions for each of them. In addition, this paper proposes a solution to resolve space conflicts by comparing the value of land resources used as different spaces using the SEB, which can provide a reference for space conflict coordination and space optimization.
Nonetheless, this paper has several limitations. Firstly, the time-series prediction model was used to predict the APeo, APes, and CP and only considered the objective development law of the value. Future studies could develop BP neural networks to analyze nonlinear links between land prices and influencing factors, enhancing the prediction models. Secondly, the extraction accuracy and application range of the SEB need to be strengthened. The current CP monitoring points were concentrated in Quanshan, Gulou, and Yunlong districts, with fewer in Jiawang and Tongshan. This imbalance affected SEB extraction accuracy, leading to errors in space conflict analysis and coordination. Future studies should enhance machine learning and data mining applications to improve the extraction accuracy of the SEB and expand the range of space optimization. Thirdly, the SEB framework proposed in this study specifically applies to expanding cities like Xuzhou, where urban growth patterns and spatial demands align with developmental-stage characteristics. Future comparative studies across cities at varied development stages will establish tailored equilibrium boundaries (IEB/SEB/REB) to address spatial conflicts through stage-specific optimization.

6. Conclusions

Based on the delineation of three types of territorial space functional zones (FPZ, EPZ, UDZ) in Xuzhou, this paper identified three types of conflicts (CFCs, CECs, FECs), determined the equilibrium boundaries based on the principle of value equilibrium, and adopted different solutions for conflicts inside and outside of the boundary by comparing the value of land resources. The main conclusions are as follows:
(1)
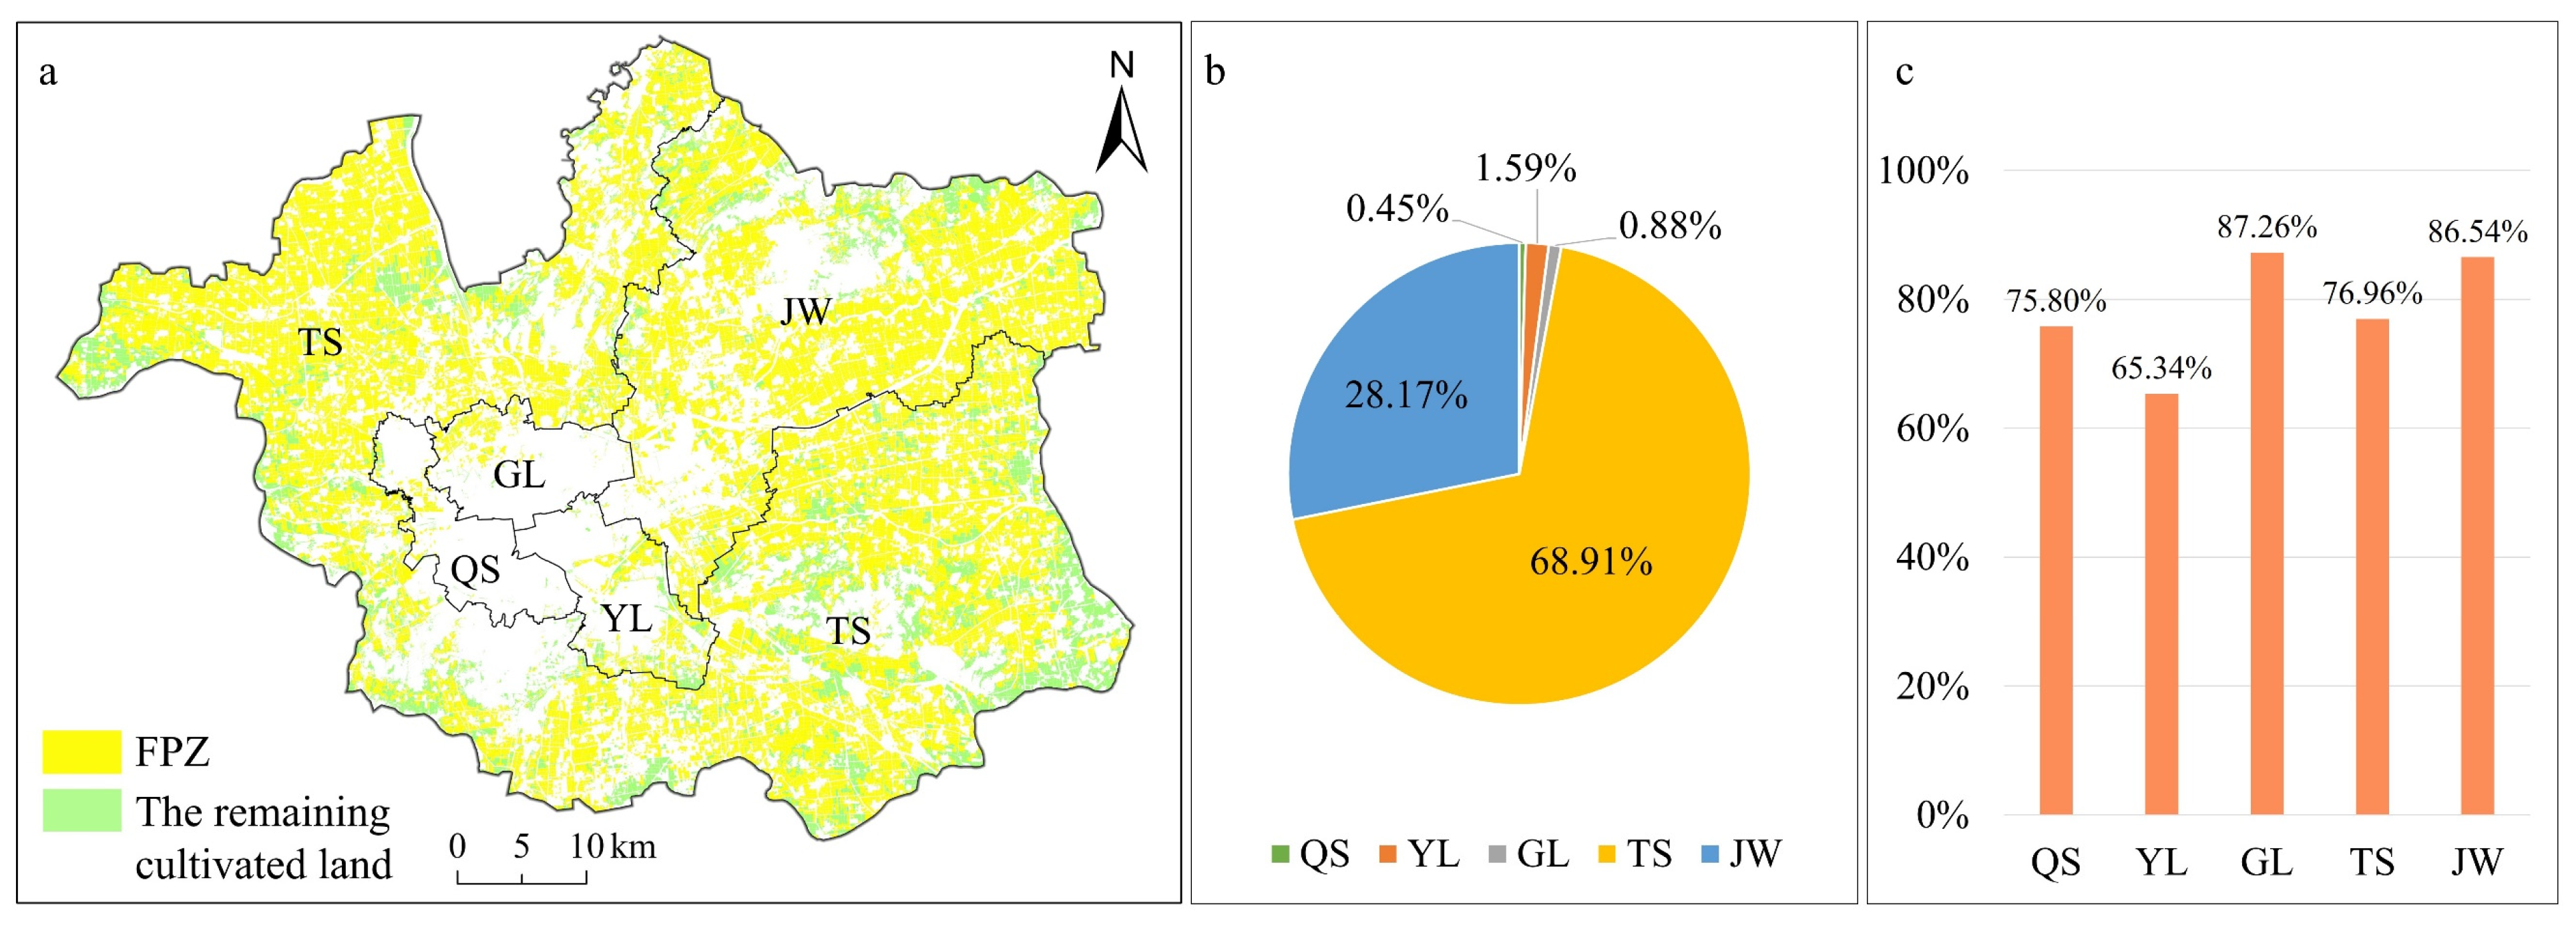
Individually delineated territorial spatial functional zones in Xuzhou were obtained; the scale of the FPZ was 1189.33 km2, the scale of the EPZ was 461.34 km2, the scale of UDZ was 897.76 km2, and the urban construction land in the UDZ was 698.69 km2.
(2)
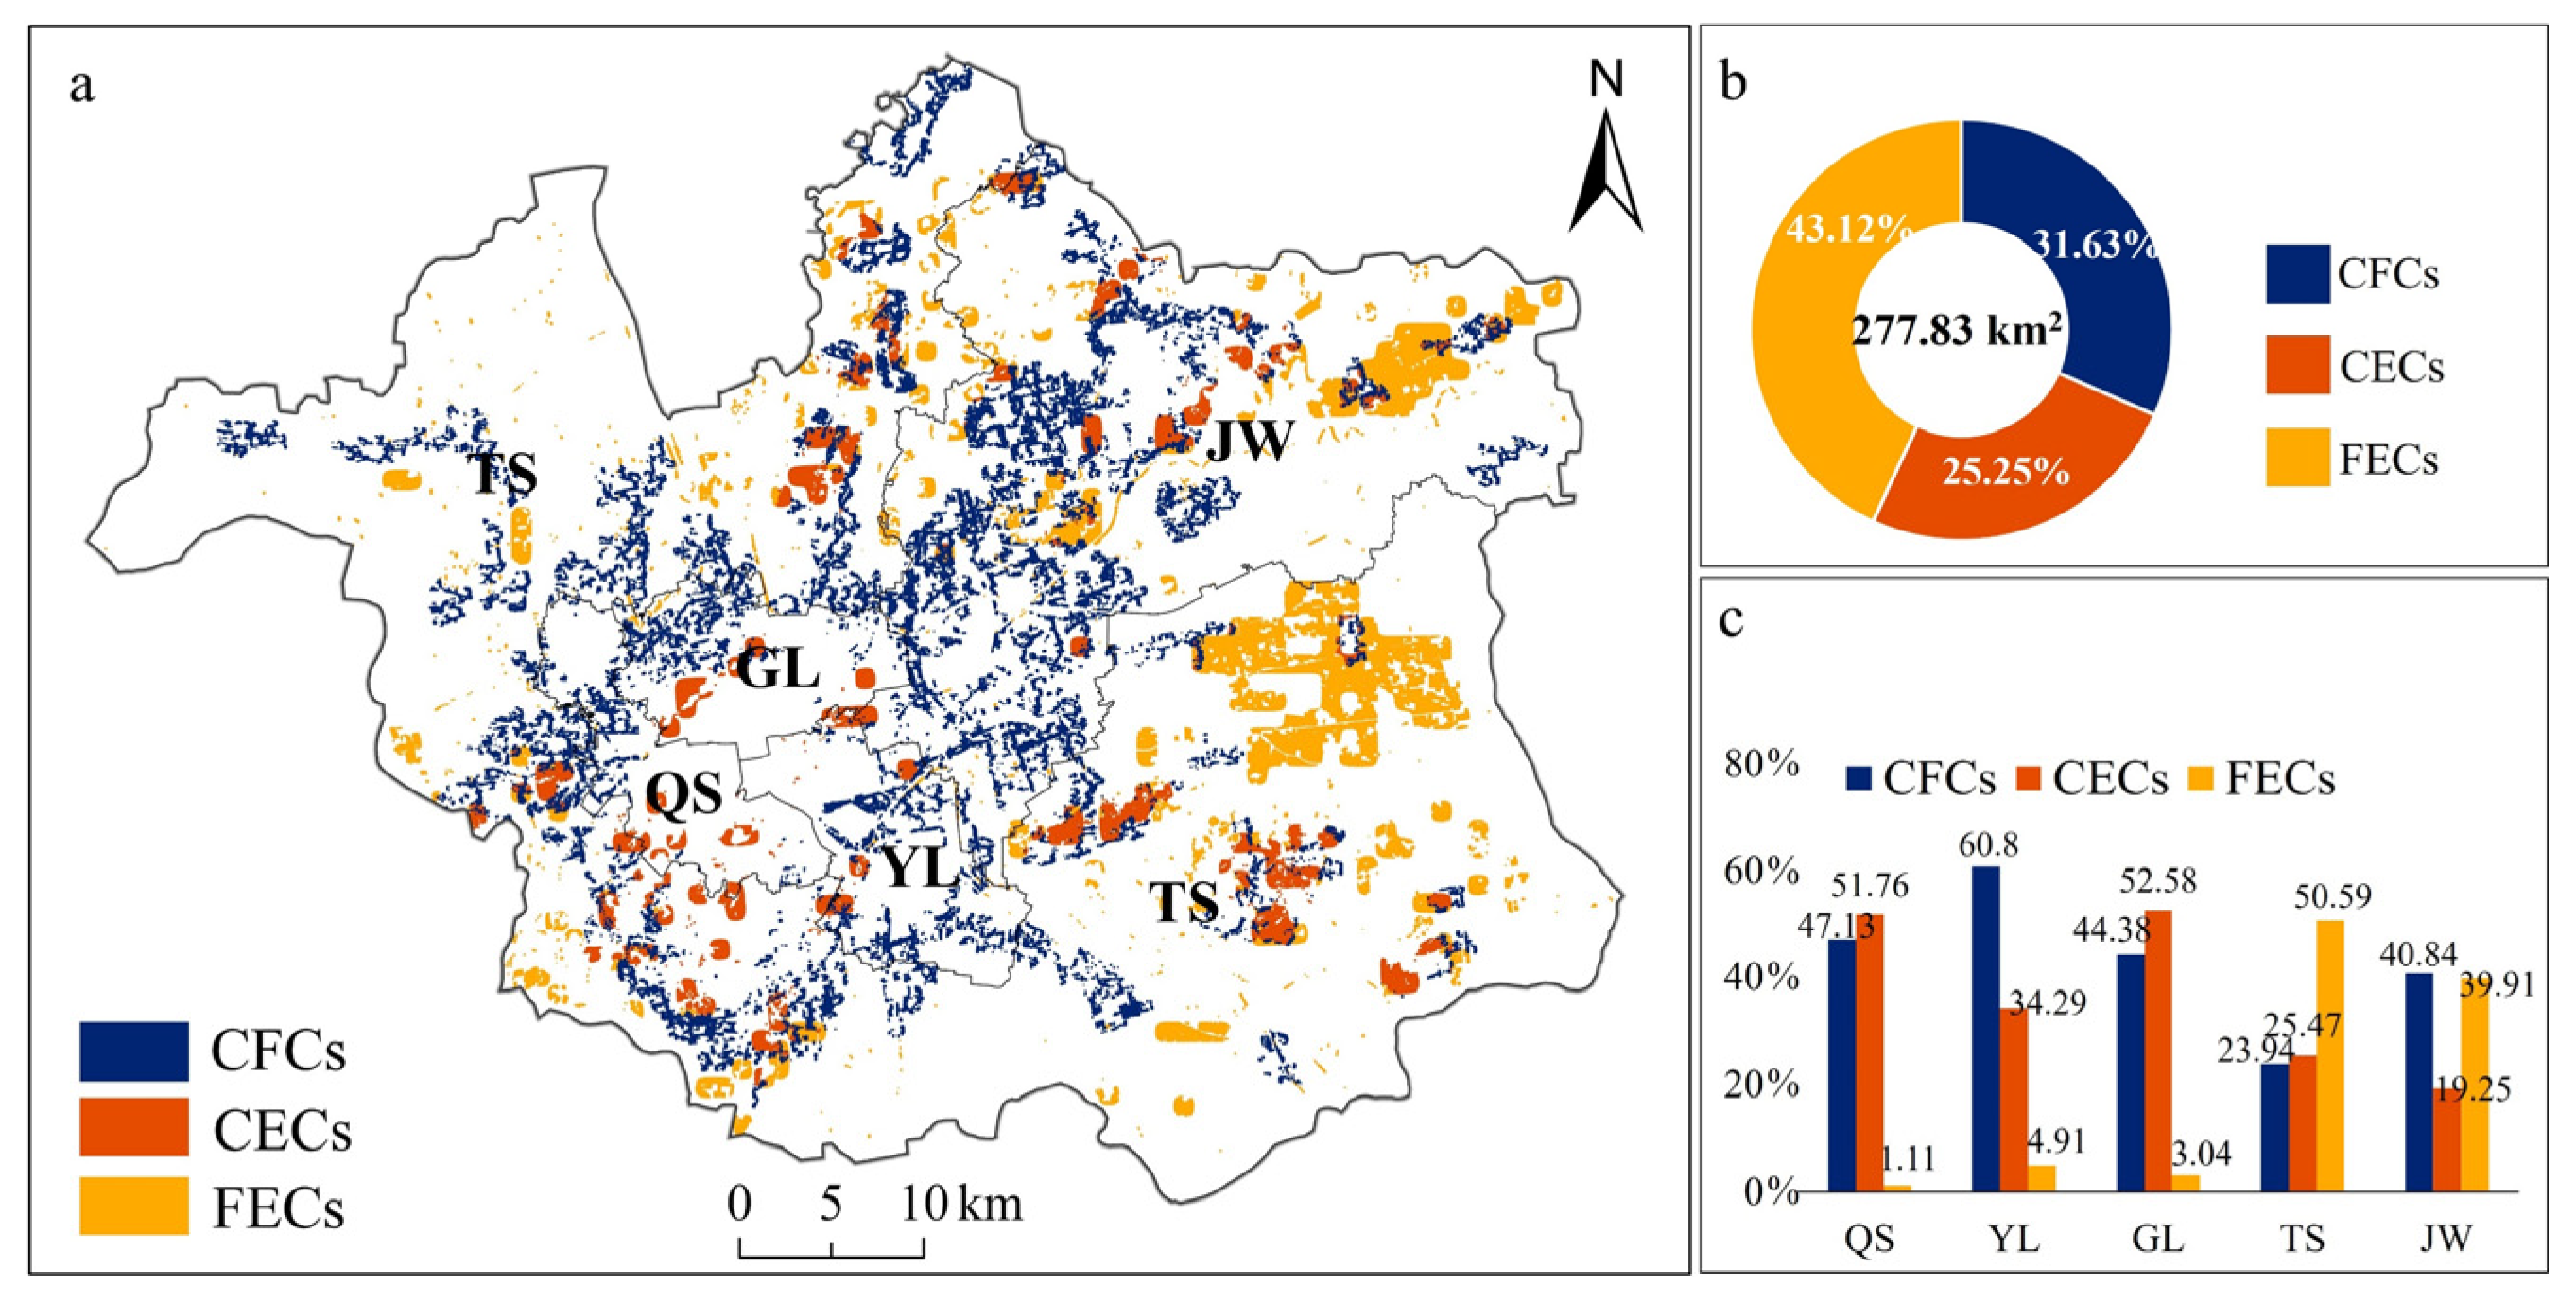
The area of territorial space functional zone conflicts in Xuzhou was 277.83 km2. The area of FECs was 119.80 km2, and its high-kernel-density areas were mainly distributed in Jiawang and Tongshan districts. The area of CFCs was 87.88 km2, and its high-kernel-density areas were distributed in five districts. The area of CECs was 70.15 km2, and its high-kernel-density areas were distributed only in Tongshan District. Jawang District had the most serious conflicts, and the conflicts were mainly CFCs and FECs. Quanshan District had relatively weaker conflicts, and the conflicts were CFCs and CECs.
(3)
The prediction obtained the AP (i.e., CP) corresponding to the SEB in 2035 of 1499.46 yuan/m2. The spatial scope of the SEB covered all of Yunlong District, most of Gulou and Quanshan Districts, and some parts of Jawang and Tongshan Districts.
(4)
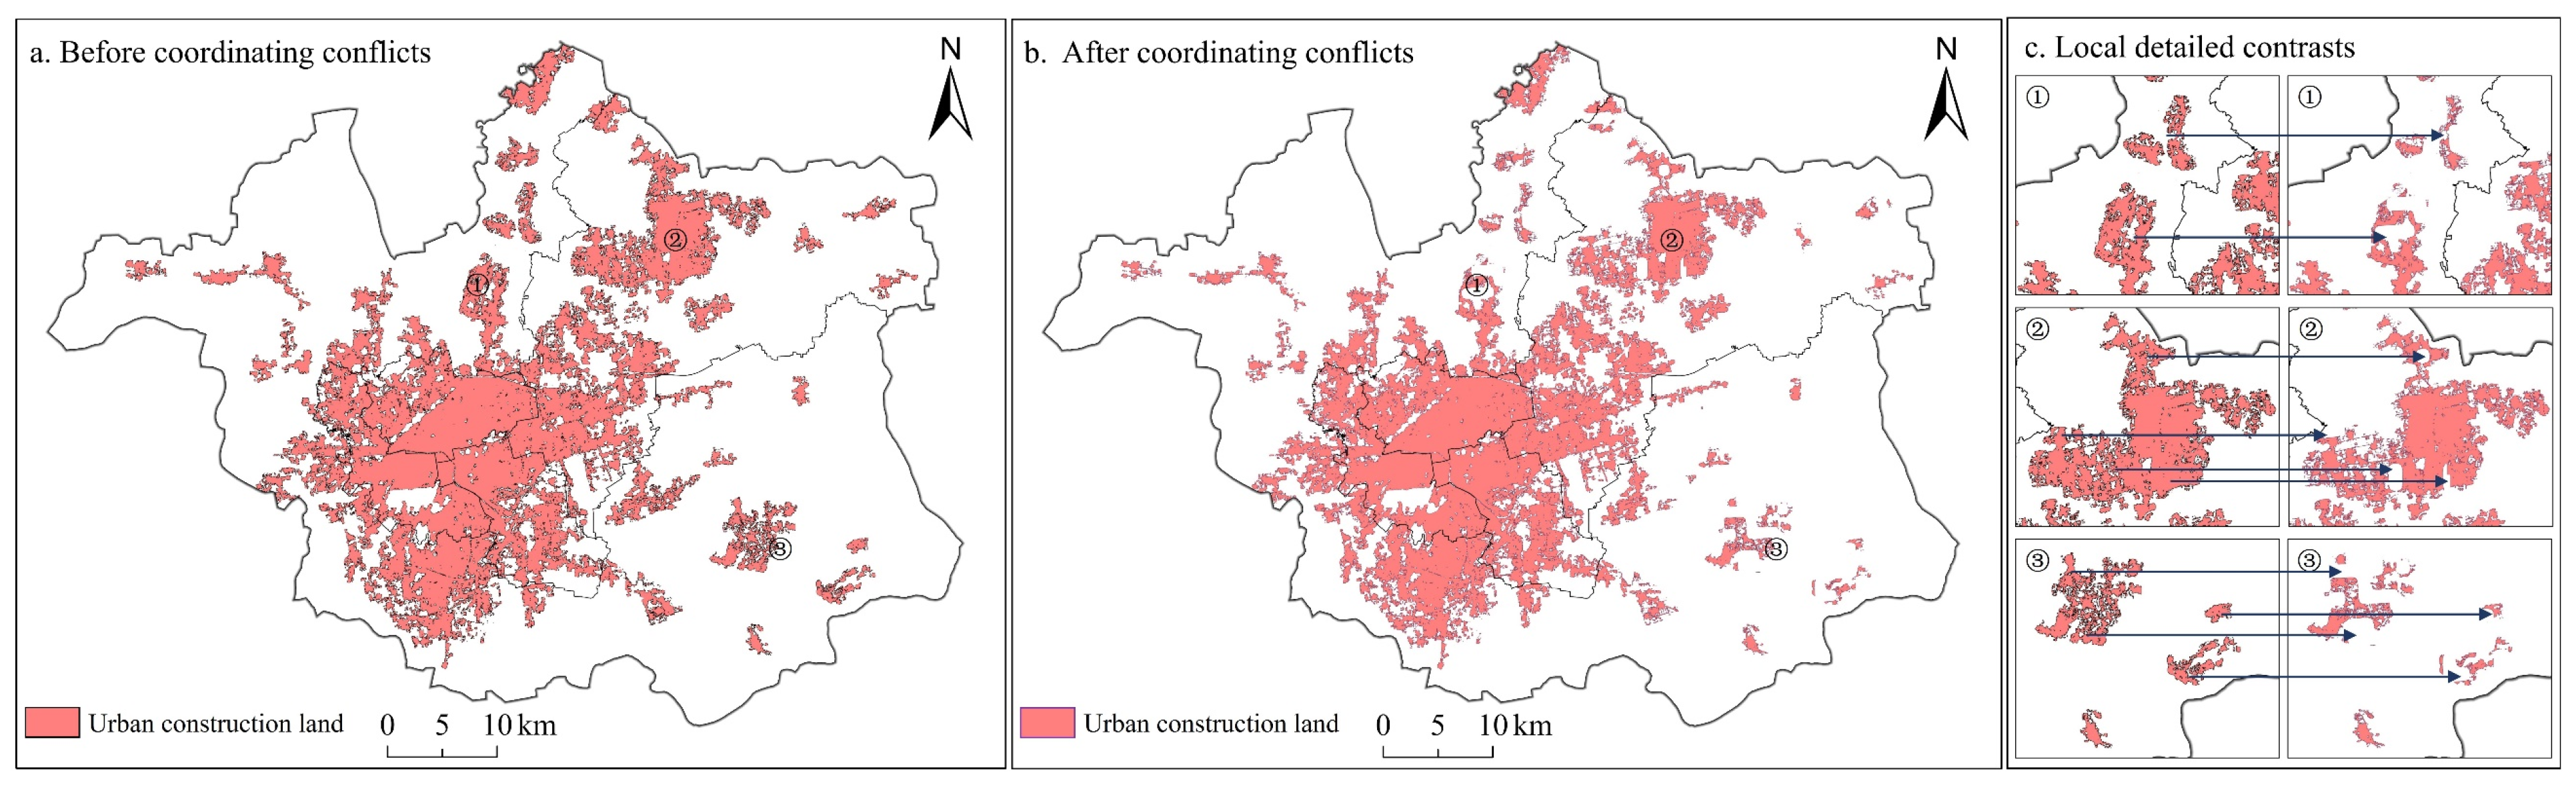
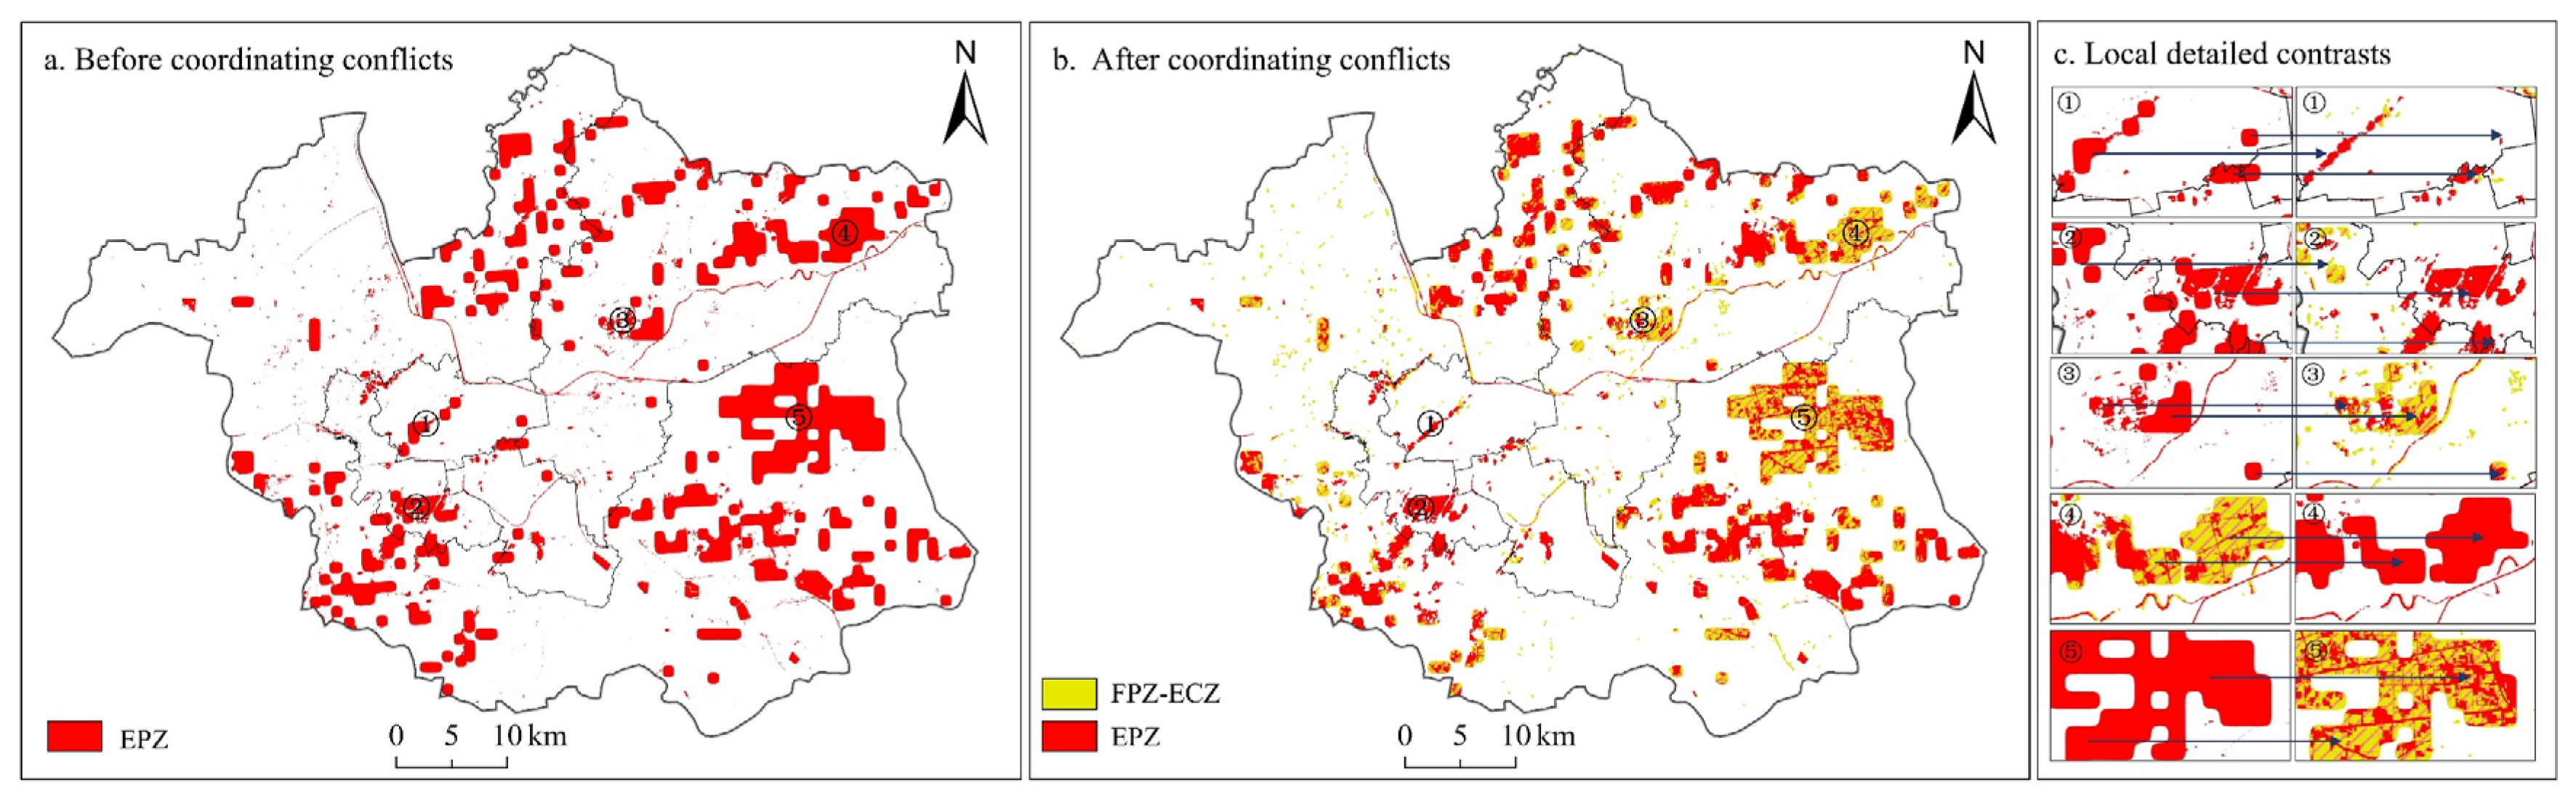
The land with CFCs and CECs within the SEB was retained as urban construction land, while that with these two conflict types outside the SEB was retained as an FPZ and an EPZ, respectively. The land with FECs was retained as an FPZ in accordance with the principle of food security priority and, at the same time, it was used as an ECZ. The areas of FPZ, EPZ, and the urban construction land in UDZ after optimization were 1136.72 km2, 295.15 km2, and 632.50 km2, respectively.

Author Contributions

X.L. (Xizhao Liu): conceptualization, methodology, formal analysis, data curation, writing—original draft, writing—review and editing. X.L. (Xiaoshun Li): resources, conceptualization, validation, writing—review and editing, funding acquisition. P.L.: writing—original draft, writing—review and editing, funding acquisition. Y.G.: formal analysis, validation. J.C.: validation, writing—review and editing. G.H.: validation, funding acquisition. All authors have read and agreed to the published version of the manuscript.

Funding

This research was supported by the National Natural Sciences Foundation of China (No. 72474214), the Natural Science Foundation of Hebei Province, China (No. G2023203015, No. G2024203010), and the Fundamental Research Funds for the Central Universities (No. 2022ZDPYSK08).

Data Availability Statement

Data will be made available on request.

Acknowledgments

Thanks to all the reviewers and editors.

Conflicts of Interest

The authors declare that they have no known competing financial interests or personal relationships that could have appeared to influence the work reported in this paper.

Appendix A

Figure A1. Cultivated land quality evaluation indicator’s spatial distribution.
Land 14 00761 g0a1
Figure A2. The spatial layout of R, K, LS, and CV.
Land 14 00761 g0a2
Figure A3. The evaluation results of the ecosystem service functions.
Land 14 00761 g0a3

References

  1. Liu, C.; Hao, M.; Tang, N.; Liang, X.; Cheng, L. Threshold effects of vegetation cover on production-living-ecological functions coordination in Xiangyang City, China. Environ. Monit. Assess. 2024, 196, 1202. [Google Scholar] [CrossRef] [PubMed]
  2. Li, S.; Zhao, X.; Pu, J.; Miao, P.; Wang, Q.; Tan, K. Optimize and control territorial spatial functional areas to improve the ecological stability and total environment in karst areas of Southwest China. Land Use Policy 2021, 100, 104940. [Google Scholar] [CrossRef]
  3. Chakraborty, S.; Maity, I.; Dadashpoor, H.; Novotnẏ, J.; Banerji, S. Building in or out? Examining urban expansion patterns and land use efficiency across the global sample of 466 cities with million+ inhabitants. Habitat Int. 2022, 120, 102503. [Google Scholar] [CrossRef]
  4. Zhang, Z.; Zhao, W.; Liu, Y.; Pereira, P. Impacts of urbanisation on vegetation dynamics in Chinese cities. Environ. Impact Assess. Rev. 2023, 103, 107227. [Google Scholar] [CrossRef]
  5. van Vliet, J. Direct and indirect loss of natural area from urban expansion. Nat. Sustain. 2019, 2, 755–763. [Google Scholar] [CrossRef]
  6. Liu, X.; Li, X.; Zhang, Y.; Wang, Y.; Chen, J.; Geng, Y. Spatiotemporal evolution and relationship between construction land expansion and territorial space conflicts at the county level in Jiangsu Province. Ecol. Indic. 2023, 154, 110662. [Google Scholar] [CrossRef]
  7. Baldini, C.; Marasas, M.E.; Tittonell, P.; Drozd, A.A. Urban, periurban and horticultural landscapes-Conflict and sustainable planning in La Plata district, Argentina. Land Use Policy 2022, 117, 106120. [Google Scholar] [CrossRef]
  8. Zong, S.; Xu, S.; Huang, J.; Ren, Y.; Song, C. Distribution patterns and driving mechanisms of land use spatial conflicts: Empirical analysis from counties in China. Habitat Int. 2025, 156, 103268. [Google Scholar] [CrossRef]
  9. Li, S.; Wenzhan, A.; Zhang, J.; Gan, M.; Wang, K.; Ding, L.; Li, W. Optimizing limit lines in urban-rural transitional areas: Unveiling the spatial dynamics of trade-offs and synergies among land use functions. Habitat Int. 2023, 140, 102907. [Google Scholar] [CrossRef]
  10. Wang, G.; Yang, D.; Xia, F.; Zhong, R.; Xiong, C. Three Types of Spatial Function Zoning in Key Ecological Function Areas Based on Ecological and Economic Coordinated Development: A Case Study of Tacheng Basin, China. Chin. Geogr. Sci. 2019, 29, 689–699. [Google Scholar] [CrossRef]
  11. Yang, Y.; Liu, Y.; Zhu, C.; Chen, X.; Rong, Y.; Zhang, J.; Huang, B.; Bai, L.; Chen, Q.; Su, Y.; et al. Spatial identification and interactive analysis of urban production—Living—Ecological spaces using point of interest data and a two-level scoring evaluation model. Land 2022, 11, 1814. [Google Scholar] [CrossRef]
  12. Deng, Y.; Yang, R. Influence mechanism of production-living-ecological space changes in the urbanization process of Guangdong Province, China. Land 2021, 10, 1357. [Google Scholar] [CrossRef]
  13. Zhang, Z.; Li, J. Spatial suitability and multi-scenarios for land use: Simulation and policy insights from the production-living-ecological perspective. Land Use Policy 2022, 119, 106219. [Google Scholar] [CrossRef]
  14. Jia, J.; Jiang, E.; Tian, S.; Qu, B.; Li, J.; Hao, L.; Liu, C.; Jing, Y. Land-use transformation and its eco-environmental effects of production–living–ecological space based on the county level in the Yelow River Basin. Land 2025, 14, 427. [Google Scholar] [CrossRef]
  15. Zhang, R.; Tian, G.; Borowiak, K.; Lisiak-Zielińska, M.; Lei, Y.; Yang, M.; Tian, Y.; Zhao, R.; Yan, J.; Mu, B. Measuring the evolutionary game process among three functional space types at the county scale in Henan Province, China. Cities 2023, 142, 104560. [Google Scholar] [CrossRef]
  16. Shi, Z.; Deng, W.; Zhang, S. Spatio-temporal pattern changes of land space in Hengduan Mountains during 1990–2015. J. Geogr. Sci. 2018, 28, 529–542. [Google Scholar] [CrossRef]
  17. Niu, J.; Jin, G.; Zhang, L. Territorial spatial zoning based on suitability evaluation and its impact on ecosystem services in Ezhou city. J. Geogr. Sci. 2023, 33, 2278–2294. [Google Scholar] [CrossRef]
  18. Qu, Y.; Zhang, Y.; Wang, S.; Shang, R.; Zong, H.; Zhan, L. Coordinated development of land multi-function space: An analytical framework for matching the supply of resources and environment with the use of land space for ecological protection, agricultural production and urban construction. J. Geogr. Sci. 2023, 33, 311–339. [Google Scholar] [CrossRef]
  19. Luan, C.; Liu, R.; Li, Y.; Zhang, Q. Comparison of various models for multi-scenario simulation of land use/land cover to predict ecosystem service value: A case study of Harbin-Changchun Urban Agglomeration, China. J. Clean. Prod. 2024, 478, 144012. [Google Scholar] [CrossRef]
  20. Yao, Z.; Jiang, C.; Shan-shan, F. Effects of urban growth boundaries on urban spatial structural and ecological functional optimization in the Jining Metropolitan Area, China. Land Use Policy 2022, 117, 106113. [Google Scholar] [CrossRef]
  21. Liu, D.; Tang, W.; Liu, Y.; Zhao, X.; He, J. Optimal rural land use allocation in central China: Linking the effect of spatiotemporal patterns and policy interventions. Appl. Geogr. 2017, 86, 165–182. [Google Scholar] [CrossRef]
  22. Chen, L.; Zhang, A. Identification of land use conflicts and dynamic response analysis of Natural-Social factors in rapidly urbanizing areas—A case study of urban agglomeration in the middle reaches of Yangtze River. Ecol. Indic. 2024, 161, 112009. [Google Scholar] [CrossRef]
  23. Jiang, S.; Meng, J.; Zhu, L. Spatial and temporal analyses of potential land use conflict under the constraints of water resources in the middle reaches of the Heihe River. Land Use Policy 2020, 97, 104773. [Google Scholar] [CrossRef]
  24. Hjalager, A.-M. Land-use conflicts in coastal tourism and the quest for governance innovations. Land Use Policy 2020, 94, 104566. [Google Scholar] [CrossRef]
  25. Karimi, A.; Brown, G. Assessing multiple approaches for modelling land-use conflict potential from participatory mapping data. Land Use Policy 2017, 67, 253–267. [Google Scholar] [CrossRef]
  26. Fienitz, M.; Siebert, R. “It is a total drama”: Land use conflicts in local land use actors’ experience. Land 2022, 11, 602. [Google Scholar] [CrossRef]
  27. Hong, W.; Guo, R.; Wang, W. A diagrammatic method for the identification and resolution of urban spatial conflicts. J. Environ. Manag. 2022, 316, 115297. [Google Scholar] [CrossRef]
  28. Qu, Y.; Wang, S.; Tian, Y.; Jiang, G.; Zhou, T.; Meng, L. Territorial spatial planning for regional high-quality development-An analytical framework for the identification, mediation and transmission of potential land utilization conflicts in the Yellow River Delta. Land Use Policy 2023, 125, 106462. [Google Scholar] [CrossRef]
  29. Nyuykighanse, N.E.; Yenlajai, B.J.; Fru, C.F.; Kimengsi, J.N. Land use conflicts and planning implications: Insights from Kumbo, Cameroon. J. Geogr. Environ. Earth Sci. Int. 2023, 27, 28–39. [Google Scholar] [CrossRef]
  30. Zhang, B.; Zhai, J.; Zhai, B.; Qu, Y. Understanding the “conflict-coordination” theoretical model of regional land use transitions: Empirical evidence from the interconversion between cropland and rural settlements in the lower yellow river, China. Habitat Int. 2024, 148, 103072. [Google Scholar] [CrossRef]
  31. Ma, W.; Jiang, G.; Chen, Y.; Qu, Y.; Zhou, T.; Li, W. How feasible is regional integration for reconciling land use conflicts across the urban-rural interface? Evidence from Beijing-Tianjin-Hebei metropolitan region in China. Land Use Policy 2020, 92, 104433. [Google Scholar] [CrossRef]
  32. Liang, Y.; Chai, D.; Zhou, X.; Ning, Y. Potential conflict diagnosis, simulation optimization and coordination of production-living-ecological space in gully areas of the Loess Plateau, China. Environ. Dev. 2024, 52, 101099. [Google Scholar] [CrossRef]
  33. Zhao, Y.; Liu, J.; Zhang, J.; Zhang, X.; Li, H.; Gao, F.; Zhan, Y. Spatial Identification and Evaluation of Land Use Multifunctions and Their Interrelationships Improve Territorial Space Zoning Management in Harbin, China. Land 2024, 13, 1092. [Google Scholar] [CrossRef]
  34. Li, X.; Wei, X.; Lang, W.; Wang, T.; Jiang, D.; Chen, X. The theoretical proposition on urban sprawl and its control strategy selection based on land price equilibrium. China Land Sci. 2018, 32, 6–13. [Google Scholar]
  35. Li, X.; Zhan, M.; Li, F.; Yan, J.; Xiao, Y. Research on the ideas and methods of conducting technology for implementation of territory spatial planning. J. Nat. Resour. 2022, 37, 2789–2802. [Google Scholar]
  36. Wu, T. A discussion on urban planning in spatial planning system. City Plan. Rev. 2019, 43, 9–17. [Google Scholar]
  37. Li, Y.; Zhao, J.; Zhang, S.; Zhang, G.; Zhou, L. Qualitative-quantitative identification and functional zoning analysis of production-living-ecological space: A case study of Urban Agglomeration in Central Yunnan, China. Environ. Monit. Assess. 2023, 195, 1163. [Google Scholar] [CrossRef]
  38. Liu, X.; Li, X.; Yang, J.; Fan, H.; Zhang, J.; Zhang, Y. How to resolve the conflicts of urban functional space in planning: A perspective of urban moderate boundary. Ecol. Indic. 2022, 144, 109495. [Google Scholar] [CrossRef]
  39. Cheng, J.; Li, X.; Geng, Y.; Wang, Z.; Li, T.; Fan, Q. Theoretical analysis and empirical study of urban expansion based on the marginal principle. Land 2023, 12, 1779. [Google Scholar] [CrossRef]
  40. Liu, X.; Li, X.; Wei, X.; Jiang, D.; Li, F.; Shen, C. Study on Fusion Demarcation of Urban Development Boundary Based on MCR and CA Model: A Case Study of Xuzhou City. China Land Sci. 2020, 34, 8–17. [Google Scholar]
  41. Lin, Y.; Qin, Y.; Yang, Y.; Zhu, H. Can price regulation increase land-use intensity? Evidence from China’s industrial land market. Reg. Sci. Urban Econ. 2020, 81, 103501. [Google Scholar] [CrossRef]
  42. Qian, F.; Jiao, S.; Yu, Y.; Wang, X.; Shao, T. Cultivated Land Quality Assessment and Obstacle Factors Diagnosis in Changtu County, Northeast China. Land Degrad. Dev. 2024, 35, 5065–5077. [Google Scholar] [CrossRef]
  43. Duan, D.; Sun, X.; Liang, S.; Sun, J.; Fan, L.; Chen, H.; Xia, L.; Zhao, F.; Yang, W.; Yang, P. Spatiotemporal Patterns of Cultivated Land Quality Integrated with Multi-Source Remote Sensing: A Case Study of Guangzhou, China. Remote Sens. 2022, 14, 1250. [Google Scholar] [CrossRef]
  44. Song, W.; Zhang, H.; Zhao, R.; Wu, K.; Li, X.; Niu, B.; Li, J. Study on cultivated land quality evaluation from the perspective of farmland ecosystems. Ecol. Indic. 2022, 139, 108959. [Google Scholar] [CrossRef]
  45. Gong, H.; Zhao, Z.; Chang, L.; Li, G.; Li, Y.; Li, Y. Spatiotemporal Patterns in and Key Influences on Cultivated-Land Multi-Functionality in Northeast China’s Black-Soil Region. Land 2022, 11, 1101. [Google Scholar] [CrossRef]
  46. Jing, X.; Tao, S.; Hu, H.; Sun, M.; Wang, M. Spatio-temporal evaluation of ecological security of cultivated land in China based on DPSIR-entropy weight TOPSIS model and analysis of obstacle factors. Ecol. Indic. 2024, 166, 112579. [Google Scholar] [CrossRef]
  47. Liu, X.; Li, X.; Chen, X.; Zhang, Y.; Li, G.; Shen, C. Coupling measurement and spatial conflict diagnosis between urbanization and ecological environment in Jiangsu Province of China. Trans. Chin. Soc. Agric. Eng. 2023, 39, 238–248. [Google Scholar] [CrossRef]
  48. Yi, K.; Zhang, J.; Wang, Y.; Zhang, S.; Liang, S.; Wu, G. Response of erosion sensitivity to land use change in populated areas: A case study of the middle and lower reaches of Yangtze River. Environ. Dev. Sustain. 2024. [Google Scholar] [CrossRef]
  49. Chen, M.; Xu, X.; Tan, Y.; Lin, Y. Assessing ecological vulnerability and resilience-sensitivity under rapid urbanization in China’s Jiangsu province. Ecol. Indic. 2024, 167, 112607. [Google Scholar] [CrossRef]
  50. Chen, Z.; Liu, Y.S.; Feng, W.; Li, Y.; Li, L. Study on spatial tropism distribution of rural settlements in the Loess Hilly and Gully Region based on natural factors and traffic accessibility. J. Rural Stud. 2022, 93, 441–448. [Google Scholar] [CrossRef]
  51. Zhang, H.; Li, H.; Zhang, J.; Wang, J.; Wang, G.; Shan, Y.; Zheng, H. Simulation of wetland distribution in the Yellow River Basin based on an improved Markov-FLUS model. Environ. Res. Lett. 2024, 19, 104001. [Google Scholar] [CrossRef]
  52. Li, L.; Huang, X.; Wu, D.; Yang, H. Construction of ecological security pattern adapting to future land use change in Pearl River Delta, China. Appl. Geogr. 2023, 154, 102946. [Google Scholar] [CrossRef]
  53. Liu, Y.; Zhang, Y.; Zhang, Y.; Liu, Y.; Wang, H.; Liu, Y. Conflicts between three land management red lines in Wuhan City: Spatial patterns and driving factors. Prog. Geogr. 2018, 37, 1672–1681. [Google Scholar] [CrossRef]
  54. Wang, K.; Zhang, F.; Xu, R.; Miao, Z.; Cheng, Y.; Sun, H. Spatiotemporal pattern evolution and influencing factors of green innovation efficiency: A China’s city level analysis. Ecol. Indic. 2023, 146, 109901. [Google Scholar] [CrossRef]
  55. Su, H.; Wu, C. Analysis of the lnfluencing factors of the Cultivated Land Resources Value in Black Soil Region Based on the Production-Living-Ecological Functions: A Case Study in Keshan County, Heilongiiang Province. China Land Sci. 2020, 34, 77–85. [Google Scholar] [CrossRef]
  56. Xie, G.; Zhang, C.; Zhen, L.; Zhang, L. Dynamic changes in the value of China’s ecosystem services. Ecosyst. Serv. 2017, 26, 146–154. [Google Scholar] [CrossRef]
  57. Chuai, X.; Huang, X.; Wu, C.; Li, J.; Lu, Q.; Qi, X.; Zhang, M.; Zuo, T.; Lu, J. Land use and ecosystems services value changes and ecological land management in coastal Jiangsu, China. Habitat Int. 2016, 57, 164–174. [Google Scholar] [CrossRef]
  58. Ji, H.; Li, X.; Geng, Y.; Chen, X.; Wang, Y.; Cheng, J.; Chen, Z. Delineation of Urban Development Boundary and Carbon Emission Effects in Xuzhou City, China. Land 2023, 12, 1819. [Google Scholar] [CrossRef]
  59. Zhang, T.; Liu, S.; Wang, M.; Hu, H.; Hu, Y. Integrating dual evaluation and FLUS model for land use simulation and urban growth boundary delineation in production-living-ecology spaces: A case study of Central Harbin, China. Geocarto Int. 2024, 39, 2392881. [Google Scholar] [CrossRef]
  60. Li, J.; Guldmann, J.-M.; Gong, J.; Su, H. Urban growth boundaries optimization under low-carbon development: Combining multi-objective programming and patch cellular automata models. J. Environ. Manag. 2023, 340, 117934. [Google Scholar] [CrossRef]
  61. Tan, X.; Yu, H.; Zhong, X.; Wang, W. Delineating urban growth boundaries by coupling urban interactions and ecological conservation. Cities 2024, 145, 104712. [Google Scholar] [CrossRef]
  62. Fan, Y.; Jin, X.; Gan, L.; Yang, Q.; Wang, L.; Lyu, L.; Li, Y. Exploring an integrated framework for “dynamic-mechanism-clustering” of multiple cultivated land functions in the Yangtze River Delta region. Appl. Geogr. 2023, 159, 103061. [Google Scholar] [CrossRef]
  63. Zheng, M.; Wang, H.; Shang, Y.; Zheng, X. Identification and prediction of mixed-use functional areas supported by POI data in Jinan City of China. Sci. Rep. 2023, 13, 2913. [Google Scholar] [CrossRef]
  64. Lu, Q.; Yao, S. From Urban–Rural Division to Urban–Rural Integration: A Systematic Cost Explanation and Chengdu’s Experience. China World Econ. 2018, 26, 86–105. [Google Scholar] [CrossRef]
  65. Liu, Y.; Zang, Y.; Yang, Y. China’s rural revitalization and development: Theory, technology and management. J. Geogr. Sci. 2020, 30, 1923–1942. [Google Scholar] [CrossRef]
  66. Ma, L.; Liu, S.; Fang, F.; Che, X.; Chen, M. Evaluation of urban-rural difference and integration based on quality of life. Sustain. Cities Soc. 2020, 54, 101877. [Google Scholar] [CrossRef]
  67. Shen, Z.; Hong, T.; Blancard, S.; Bai, K. Digital financial inclusion and green growth: Analysis of Chinese agriculture. Appl. Econ. 2024, 56, 5555–5573. [Google Scholar] [CrossRef]
Figure 1. Research framework.
Land 14 00761 g001
Figure 2. Study area. ((a) Location of Jiangsu Province in China. (b,c) Location of Xuzhou in Jiangsu Province. (d) Xuzhou municipal district (Study area).)
Land 14 00761 g002
Figure 3. Spatial distribution of land price sampling points and their price in 2022.
Land 14 00761 g003
Figure 4. The delineation results for the FPZ in Xuzhou. ((a) Farmland protection zone. (b) The distribution proportion of FPZ. (c) The proportion of FPZ in cultivated land.)
Land 14 00761 g004
Figure 5. The delineation results for the EPZ in Xuzhou. ((a) Ecological sensitivity. (b) The proportion of land according to its ecological sensitivity. (c) Importance of ecosystem services. (d) The proportion of ecosystem services according to their importance. (e) Ecological protection zone. (f). The distribution of EPZ in the different districts. (g) The proportion of EPZ in each district.).
Land 14 00761 g005
Figure 6. The delineation results for the UDZ in Xuzhou. ((a) Suitability grade of urban development. (b) Land use types in 2035. (c) Construction land in 2035. (d) Local display of optimization of different structural elements. (e) Preliminary optimized construction land. (f) Urban development zone. (g) Urban construction land.)
Land 14 00761 g006
Figure 7. Territorial space functional zone conflicts in Xuzhou. ((a) Conflicts in territorial space function zone. (b) Proportion of conflicts. (c) Proportion of conflicts in different districts).
Land 14 00761 g007
Figure 8. Kernel density of territorial space functional zone conflicts in Xuzhou.
Land 14 00761 g008
Figure 9. APeo, APes, and AP in Xuzhou.
Land 14 00761 g009
Figure 10. Land price contours and the SEB in 2035. ((a) Land price samples in 2035. (b) Land price contour lines in 2035. (c) SEB in 2035.)
Land 14 00761 g010
Figure 11. Conflict layout within and outside the SEB in 2035. ((a) Conflict layout. (b) Conflict structure. (c) Conflict structure in each district.).
Land 14 00761 g011
Figure 12. Comparison of urban construction land before and after conflict coordination.
Land 14 00761 g012
Figure 13. Comparison of FPZ before and after conflict coordination.
Land 14 00761 g013
Figure 14. Comparison of EPZ before and after conflict coordination.
Land 14 00761 g014
Table 1. The data sources.
Data TypeData SourcesInstruction
Land use typeResource and Environmental Science Data Platform (https://www.resdc.cn) accessed on 10 December 2023Raster data (30 m)
DEMGeospatial Data Cloud (http://www.gscloud.cn) accessed on 10 December 2023Raster data (30 m)
Meteorological data (annual precipitation, annual average temperature, etc.)Resource and Environmental Science Data Platform (https://www.resdc.cn) accessed on 10 December 2023
Meteorological Data Network (http://data.cma.cn/) accessed on 10 December 2023
Raster data (1 km)
Normalized vegetation index (NDVI)Resource and Environmental Science Data Platform (https://www.resdc.cn) accessed on 15 December 2023Raster data (1 km)
Vegetation net primary productivity (NPP)Resource and Environmental Science Data Platform (https://www.resdc.cn) accessed on 15 December 2023Raster data (1 km)
Soil dataChinese Soil Dataset based on the World Soil Database (HWSD) (v1.1) accessed on 1 November 2023Raster data (1 km)
Socio-economic spatial data (spatial distribution of GDP, population density)Resource and Environmental Science Data Platform (https://www.resdc.cn) accessed on 1 November 2023Raster data (1 km)
Socio-economic statistics (population, food production, output, cropped area, etc.)Xuzhou Statistical Yearbook
Xuzhou National Economic and Social Development Statistics Bulletin
Cultivated land attributeXuzhou Cultivated Land Classification and Grading DatabaseNon-public
Land priceXuzhou Natural Resources and Planning Bureau (https://zrzy.jiangsu.gov.cn/xz/) accessed on 5 March 2024
China Land Value Information Service Platform (https://www.landvalue.com.cn/) accessed on 5 March 2024
Partially public
Territorial spatial planning dataXuzhou Natural Resources and Planning Bureau (https://zrzy.jiangsu.gov.cn/xz/) accessed on 5 March 2024Partially public
Table 2. Classification standards and weights of cultivated land quality evaluation indicators.
IndicatorsClassification StandardWeight
10080604020
NCTillage layer thickness (cm)>20>15~20>10~15>5~10≤50.17
PH value>6.5~7.5>6.0~6.5, >7.5~8.0>5.5~6.0, >8.0~8.5>5.0~5.5, >8.5~9.0≤5.0, >9.00.06
Organic matter content (g/kg)>40>30~40>20~30>10~20≤100.14
Slope (°)≤2>2~6>6~15>15~25>250.08
Irrigation guarantee rate (%)>95>85%~95>70%~85>50%~70≤500.15
LCDistance from roads (m)0~500>500~1000>1000~1500>1500~2000>20000.12
Distance from villages (m)0~400>400~800>800~1200>1200~1600>16000.05
SLRegularity>1.5>1.2~1.5>1.1~1.2>1.0~1.1≤1.00.05
Shape≤1.1>1.1~1.5>1.5~2.0>2.0~2.5>2.50.11
Note: The regularity of cultivated land was calculated using the formula f r = 2 ln p / 4 / ln a , and the shape of cultivated land was calculated using the formula f s = 0.25 p / a , where fr is regularity, fs is the shape indicator, p is the length of the perimeter of the cultivated land patch, and a is the area of the cultivated land patch.
Table 3. Resistance factors classification, scores, and weights.
FactorsClassificationScoreWeightFactorsClassificationScoreWeight
Elevation0~6050.15Distance from roads (m)0~50050.14
60~1204500~10004
120~18031000~15003
180~24021500~20002
>2401>20001
Slope0°~2°50.19Spatial distribution of GDP (100,000 yuan/km2)≤300010.18
2°~6°43000~80002
6°~15°38000~15,0003
15°~25°215,000~30,0004
>25°1>30,0005
Distance from water area (m)0~100050.16Population density (Persons/km2)≤80010.18
1000~20004800~28002
2000~300032800~50003
3000~400025000~84004
>40001>84005
Table 4. Land type structure according to ecological sensitivity grade and ecosystem service importance grade in Xuzhou (%).
Land Use TypeCultivated LandForest LandGrasslandWater AreaConstruction LandUnused Land
sensitivity gradeLow sensitivity66.33740.08100.00131.76620.000731.8134
Medium sensitivity61.55941.52770.02553.11110.001133.7752
High sensitivity44.728816.26890.47120.55230.012837.9662
ecosystem service importance gradeNot important55.83041.41780.03173.16340.001539.5551
Generally important55.78843.42610.09832.14030.003738.5432
Middle importance76.19300.77570.02161.13090.000221.8785
Highly important80.65280.08320.00050.52800.000018.7355
Disclaimer/Publisher’s Note: The statements, opinions and data contained in all publications are solely those of the individual author(s) and contributor(s) and not of MDPI and/or the editor(s). MDPI and/or the editor(s) disclaim responsibility for any injury to people or property resulting from any ideas, methods, instructions or products referred to in the content.

