Article

Altitudinal Differences in Decreasing Heat Deficit at the End of the Growing Season of Alpine Grassland on the Qinghai–Tibetan Plateau from 1982 to 2022

1
College of Geographical Science, Inner Mongolia Normal University, Hohhot 010022, China
2
Inner Mongolia Key Laboratory of Remote Sensing and Geographic Information Systems, Inner Mongolia Normal University, Hohhot 010022, China
3
College of Water Conservancy and Civil Engineering, Inner Mongolia Agricultural University, Hohhot 010022, China
4
Institute of Geographic Sciences and Natural Resources Research, Chinese Academy of Sciences, Beijing 100049, China
*
Author to whom correspondence should be addressed.
Land 2025, 14(4), 758; https://doi.org/10.3390/land14040758
Submission received: 1 March 2025 / Revised: 27 March 2025 / Accepted: 30 March 2025 / Published: 1 April 2025

Abstract

:
As a measure of the accumulated heat deficit during the growing season transition, cooling degree days (CDD) play a crucial role in regulating vegetation phenology and ecosystem dynamics. However, systematic analyses of CDD trends and their driving mechanisms remain limited, particularly in high-altitude regions where climate variability is pronounced. This study investigated the spatiotemporal variability in CDD from 1982 to 2022 in alpine grasslands on the Qinghai–Tibetan Plateau (TP) and quantified the contributions of key climatic factors. The results indicate that lower CDD values (<350 °C-days) were predominantly found in warm, arid regions, whereas higher CDD values (>600 °C-days) were concentrated in colder, wetter areas. Temporally, area-averaged CDD exhibited a significant decline, decreasing from 490.9 °C-days in 1982 to 495.8 °C-days in 2022 at a rate of 3.8 °C-days per year. Elevation plays a critical role in shaping CDD patterns, displaying a nonlinear relationship: CDD decrease as elevation increases up to 4300 m, beyond which they increase, suggesting a transition from global climate-driven warming at lower elevations to local environmental controls at higher elevations, where snow–albedo feedback, topographic effects, and atmospheric circulation patterns regulate temperature dynamics. Tmax was identified as the dominant climatic driver of CDD variation, particularly above 4300 m, while radiation showed a consistent positive influence across elevations. In contrast, precipitation had a limited and spatially inconsistent effect. These findings emphasize the complex interactions between elevation, temperature, radiation, and precipitation in regulating CDD trends. By providing a long-term perspective on CDD variations and their climatic drivers, this study enhances our understanding of vegetation–climate interactions in alpine ecosystems. The results offer a scientific basis for modeling late-season phenological changes, ecosystem resilience, and land-use planning under ongoing climate change.

1. Introduction

The end of the growing season (EOS) of vegetation in autumn represents the termination of the annual vegetation growth on the vegetated land surface and is a crucial stage in the energy and material cycles of ecosystems [1]. As an important indicator of autumn phenology, the EOS directly or indirectly influences carbon, water, and nutrient cycling in terrestrial ecosystems [2,3,4] by extending or shortening the growing season length and thus altering vegetation photosynthesis and respiration [5]. The EOS can generally be determined using remotely sensed vegetation indices, such as the normalized difference vegetation index (NDVI) and the enhanced vegetation index (EVI) [6], and is widely used to assess the ecosystem responses to climate change at large spatial scales. In studies investigating the impacts of climate change on the EOS, cooling degree day (CDD) is one of the most important climatic indicators used to explain the variability in the EOS and has greater accuracy than average temperature, as well as other features of autumn phenology observed at the species level, such as the date of leaf coloring [7], senescence [8], and/or fall [9]. CDD is defined as the cumulative sum of the differences between the daily mean air temperature and a threshold temperature, calculated over the period starting from the first day when the daily mean air temperature falls below the threshold temperature until the onset of autumn phenology. It reflects the accumulated heat deficit or loss that drives vegetation into winter dormancy. In high-latitude and high-altitude regions, an increase (or decrease) in CDD can advance (or delay) autumn phenology, thereby shortening (or prolonging) the growing season length and further impacting ecosystem functioning [10,11]. For example, one study using ground-observed leaf coloring dates from 2000 to 2012 found a significant negative partial correlation between CDD and the leaf coloring date in alpine grasslands on the Tibetan Plateau, indicating that lower CDD can delay the timing of leaf coloring [7]. For some deciduous tree species in northern mid- to high-latitude regions, several studies have shown that higher CDD accelerate fall leaf coloration and senescence, and consequently, CDD has been used as an important input variable in vegetation autumn phenology simulation models [7,12]. An early study first proposed a CDD model as part of a framework for simulating the carbon and water budgets in a beech forest in France, specifically describing the response of the beech forest ecosystem to climate change [13]. Similarly, for hardwood species in North America, a CDD model was developed using 14 years of field to describe canopy (tree crowns) senescence, including processes such as leaf coloration and leaf drop [14]. More recent studies demonstrated that the CDD model could explain approximately 90% of the spatiotemporal variations in leaf senescence in temperate deciduous forests, showing stronger performance in modeling leaf coloring dates compared to models based solely on daily average temperature [15,16]. The traditional CDD model was further improved by incorporating drought stress (CDDP model), which increased the accuracy (R² between modeled and observed values) in predicting leaf browning dates for Leymus chinensis in Inner Mongolian grasslands from 0.36 to 0.74 [17]. Similarly, the CDD model was modified by introducing wind speed and then applied to foliar senescence across various vegetation types in the northern hemisphere [18].
Although these studies demonstrated the regulatory effect of CDD on autumn phenology and developed various CDD models with substantial improvements in accuracy over time and among vegetation types, most CDD-related studies are based on ground-observed, species-specific leaf coloring or the leaf fall date with limited spatial and temporal coverage, and few studies have documented the spatial and temporal variability in the CDD itself. Rapidly advancing remote sensing technology provides an efficient and effective approach to detecting fundamental changes in the EOS, which is a key remotely sensed autumn phenological metric at a large spatial scale. This advancement offers a crucial opportunity for analyzing spatiotemporal dynamics in CDD. For example, the largest CDD was observed in regions where the EOS was positively regulated by temperature based on an analysis of remote sensing NDVI data across alpine and temperate grasslands in China from 2001 to 2020 [19]. The Qinghai–Tibetan Plateau (TP), known as the “Third Pole of the Earth”, plays a critical role in global climate change research due to its distinctive geographical position and extreme environmental conditions. It has an average elevation exceeding 4000 m [20] and covers an area of approximately 2.5 × 10⁶ km2 [21]. Investigating CDD dynamics on the TP is crucial for understanding how high-altitude ecosystems respond to climate variability and addressing existing gaps in phenological research.
The variability in CDD is largely influenced by climate change, with key factors including rising temperatures, increasing precipitation heterogeneity, and the growing frequency of extreme climate events [22]. Among these, maximum temperature (Tmax), minimum temperature (Tmin), precipitation (Pre), and radiation (Rad) have been hypothesized to play significant roles in regulating CDD variability [23]. These climatic factors regulate CDD both directly by influencing cold unit accumulation and indirectly by modifying vegetation growth conditions, such as local microclimates, soil moisture availability, and surface energy balance. This study aims to address the above knowledge gaps by comprehensively analyzing the spatiotemporal patterns and altitudinal variations in CDD across multiple vegetation types on the TP using long-term remote sensing data. Although the EOS is not the focus of this study, it is used to define the temporal boundary for the CDD calculation, anchoring the accumulation period from the peak of the growing season (POS) to the onset of senescence. The spatial correspondence between the EOS and CDD observed in this study helps to clarify the climatic context of vegetation dormancy timing at the macroscale. Through the integration of long-term cross-calibrated NDVI data, a phenology-based CDD calculation framework, and ridge regression modeling, this study not only assesses the spatial and altitudinal variability in CDD in alpine grasslands but also provides new insights into their climatic drivers and nonlinear elevation-dependent patterns under changing environmental conditions.

2. Materials and Methods

2.1. Data Sources

2.1.1. Study Area and Vegetation Type

The Qinghai–Tibetan Plateau (TP) is located in western China and spans multiple provinces, including Tibet, Qinghai, Sichuan, and Gansu (Figure 1). Boundary data for the TP were obtained from the National Tibetan Plateau Data Center (TPDC) (https://data.tpdc.ac.cn, accessed on 29 March 2025), while vegetation-type data for 2001 at a 1:1,000,000 scale (~1 km spatial resolution) were sourced from the Resource and Environment Science and Data Center of China (https://www.resdc.cn, accessed on 29 March 2025). The vegetation-type data were resampled to a spatial resolution of 0.0833° × 0.0833° to match the pixel size of the NDVI data. The vegetation types were aggregated into four main categories: meadows, steppes, shrubs, and cushions.

2.1.2. Satellite NDVI Dataset

The NDVI has been widely applied to monitor vegetation growth [24], dynamics [25], and phenology [26] across diverse ecosystems. This study used the third-generation Global Inventory Modeling and Mapping Studies (GIMMS) NDVI dataset [27,28], derived from the Advanced Very High-Resolution Radiometer (AVHRR) onboard National Oceanic and Atmospheric Administration (NOAA) satellites. The data have a spatial resolution of 0.0833° and a 15-day temporal resolution, covering the period from July 1981 to December 2015. Its accuracy has been validated through calibration and corrections for viewing geometry, volcanic aerosols, and sensor-related biases [27].
Additionally, MODIS NDVI data (MOD09GA), with a 500 m spatial resolution and daily temporal resolution, covering the period from 2000 to 2022, were used to determine the EOS. This dataset was processed with advanced atmospheric correction and cloud screening to ensure data quality (https://modis.gsfc.nasa.gov/, accessed on 29 March 2025) [29]. To generate semi-monthly MODIS NDVI data at a 1/12° spatial resolution, we applied the maximum-value composite (MVC) method, selecting the maximum NDVI value from two consecutive half-month periods. The overlap period (2001–2015) was divided into two segments: 2001–2013 and 2014–2015. The former segment (2001–2013) was used to calibrate a linear regression model for each pixel, and the latter (2014–2015) served to evaluate the performance of the linear regression model [19,30].
In this study, cross-calibration was applied to combine the advantages of high-spatial-resolution MODIS NDVI with the traditional long time series of the GIMMS NDVI to produce a new GIMMS NDVI dataset. By incorporating NDVI data from 2000 to 2015, the NDVI dataset was extended to cover the period from 1982 to 2022. This approach effectively ensures consistency across multiple satellite sensors. Further details on this approach are available in previous studies [31,32].

2.1.3. Gridded Climate Data

Gridded ERA5-Land reanalysis data (1982–2022) from the European Center for Medium-Range Weather Forecasts (ECMWF) were used (https://cds.climate.copernicus.eu, accessed on 29 March 2025). Compared to its predecessor ERA-interim, ERA5-Land provides enhanced spatial (0.1° × 0.1°) and temporal (hourly) resolutions. We analyzed the contributions of daily mean, minimum, and maximum temperatures (Tmean, Tmin, Tmax, °C), total precipitation (Pre, mm), and downward shortwave radiation (Rad, W/m2) to the CDD, all at a daily temporal resolution. The preseason period does not always coincide with the CDD accumulation period, as the CDD accumulate only during ecodormancy, a dormancy phase influenced by environmental factors. Therefore, the POS–EOS period was selected to ensure consistency between Tmin, Tmax, Pre, and Rad data and the CDD accumulation process. NASADEM, an updated version of the Digital Elevation Model (DEM) derived from Shuttle Radar Topography Mission (SRTM) data, provides elevation information at a 30 m spatial resolution [33]. Both datasets were resampled to a 0.0833° × 0.0833° spatial resolution with a 15-day temporal interval to align with the new NDVI dataset using bilinear interpolation, a widely used method for resampling reanalysis climate data [34,35]. Although spatial interpolation may introduce minor biases, bilinear interpolation has been demonstrated to effectively preserve spatial gradients and minimize abrupt transitions between grid cells, ensuring compatibility across datasets [36]. It should be noted that the resampling was not intended to enhance the spatial resolution of the original datasets, but rather to achieve grid alignment for integrated analysis.

2.2. Methodology

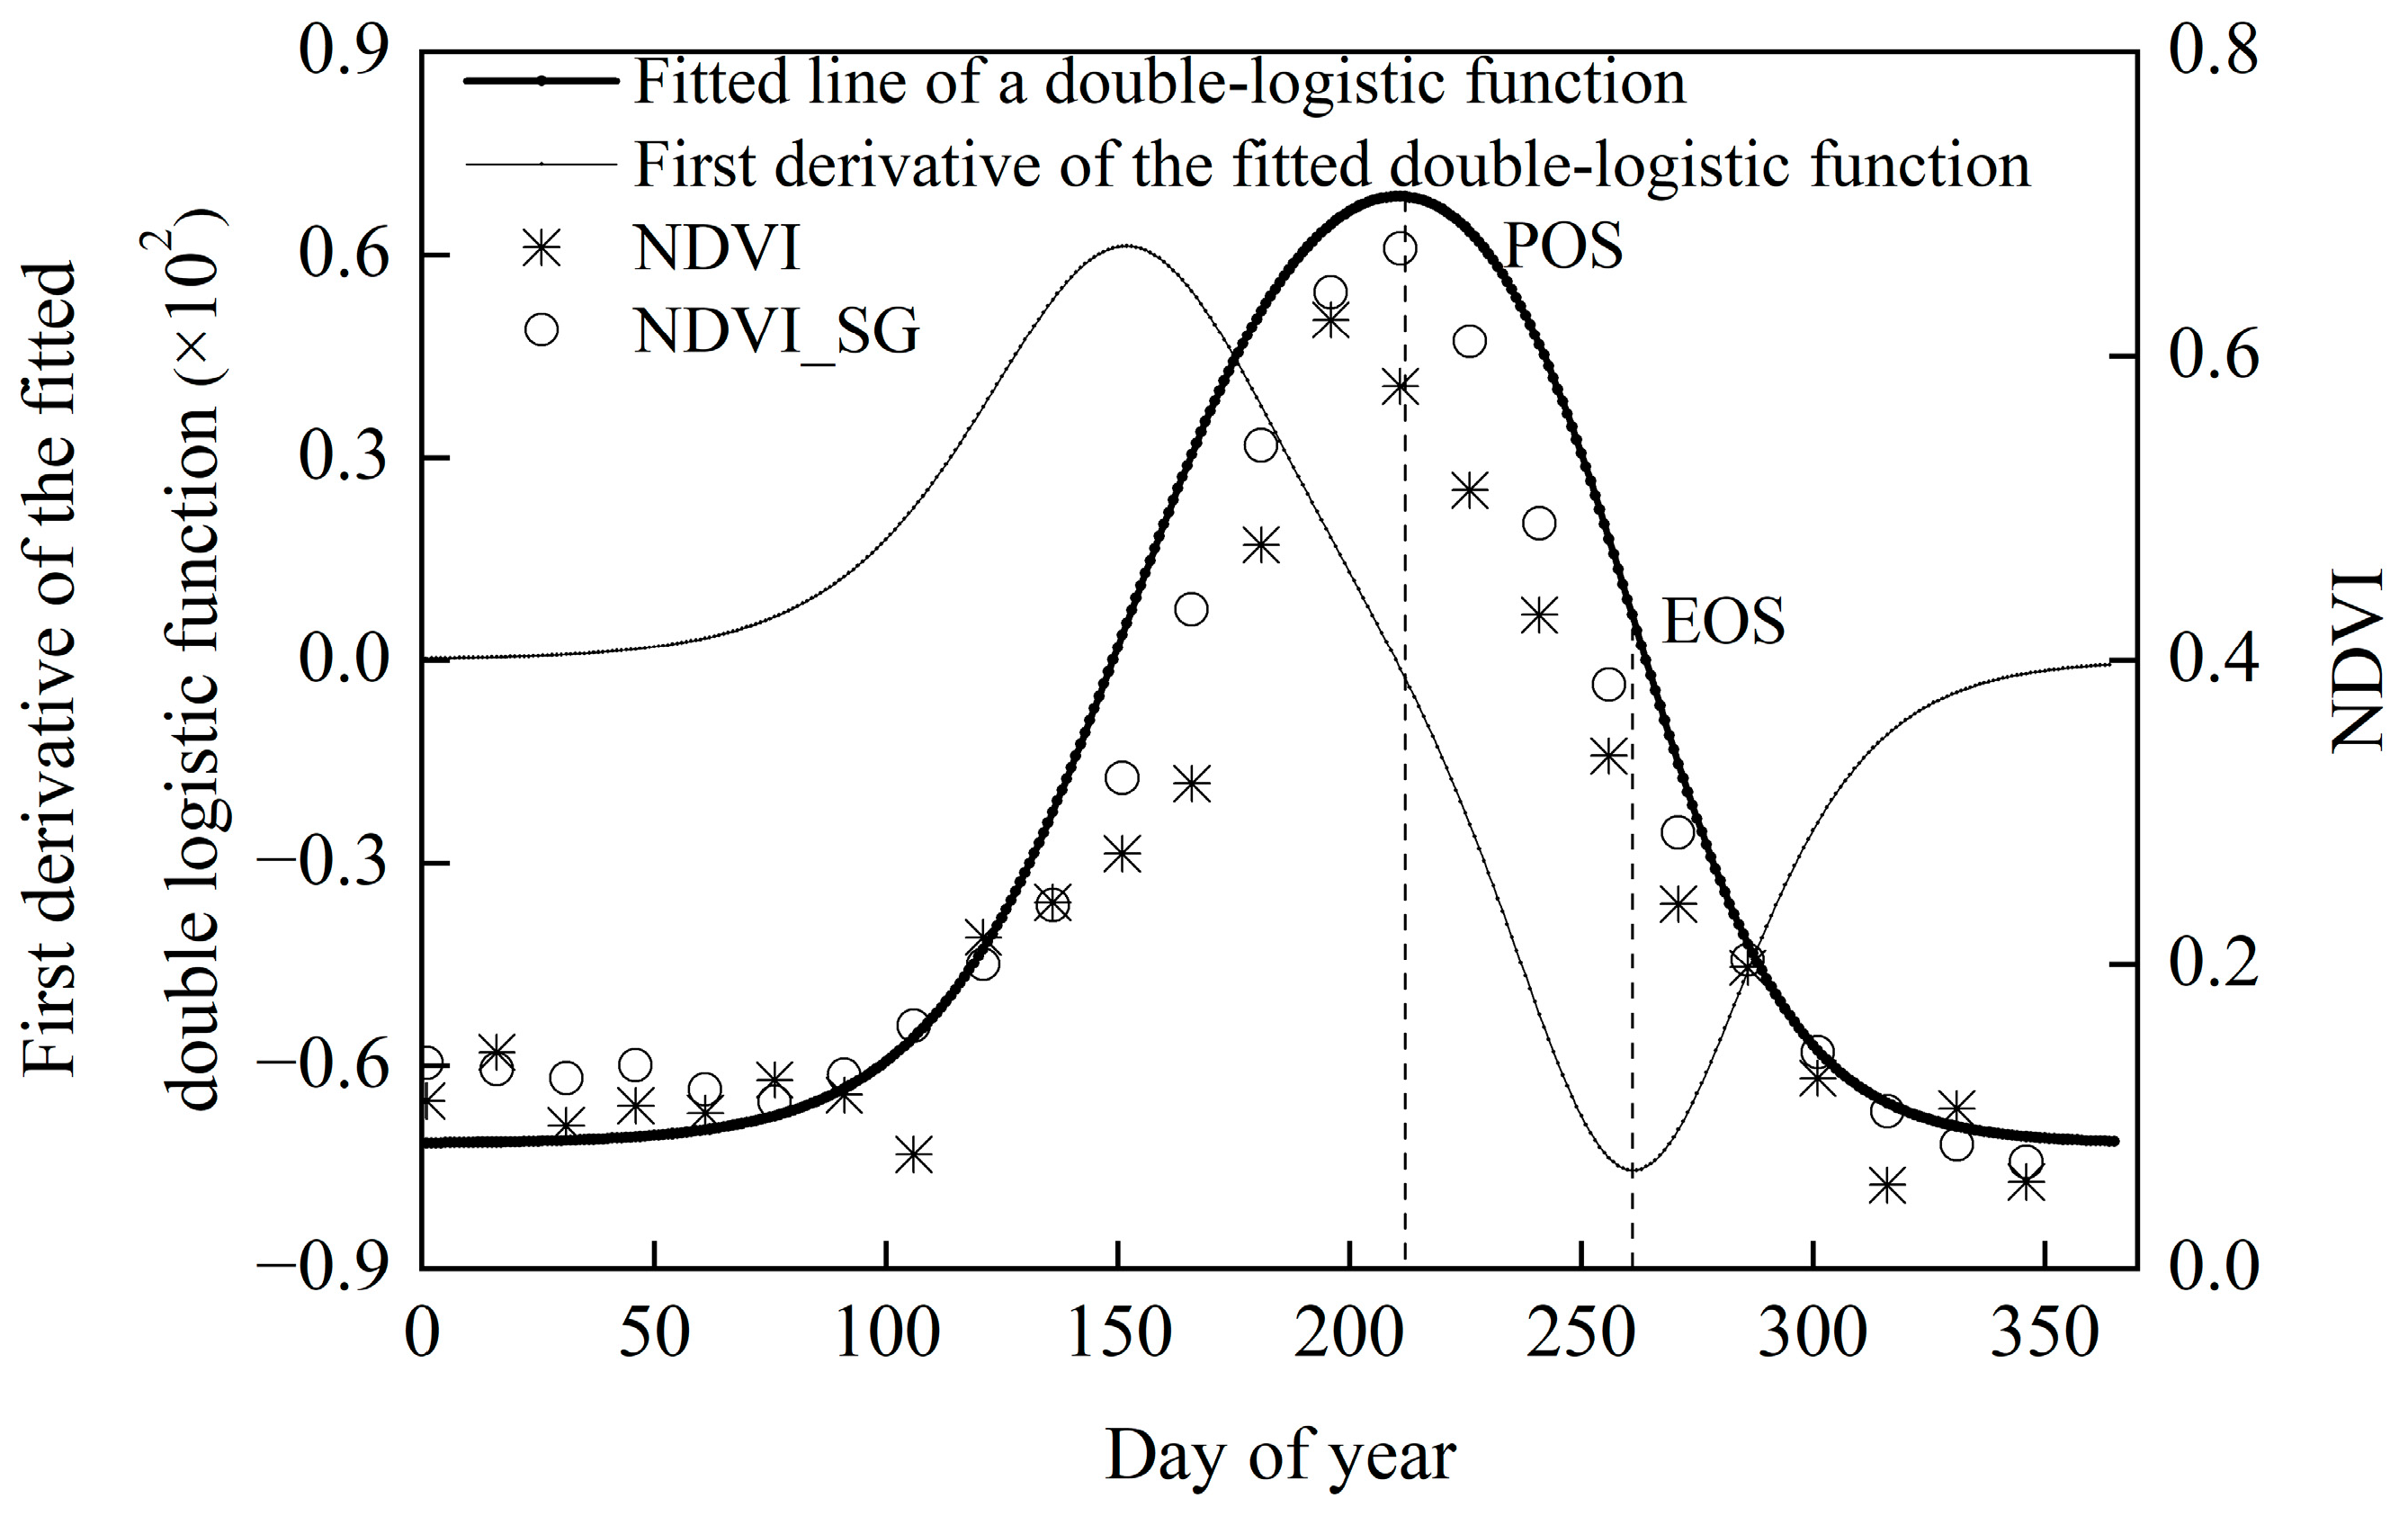
2.2.1. Determination of EOS

To ensure reliable EOS estimation, the NDVI time series were smoothed using the Savitzky–Golay (S-G) filter, a least-squares polynomial fitting approach that reduces noise from atmospheric disturbances and cloud contamination [37]. Additionally, to minimize the influence of bare soil and sparsely vegetated areas on NDVI trends, grid cells with an annual mean NDVI below 0.1 over the 41-year period were excluded from the analysis.
The EOS is a critical phenological indicator representing the transition from active vegetation growth to dormancy. To quantify the EOS from the smoothed NDVI time series, we employed a four-parameter double-logistic function (Equation (1)), which characterizes the seasonal vegetation cycle using curve-fitting techniques [38]. The EOS corresponds to the inflection point where the first derivative of the fitted curve reaches its minimum, representing the period of the most rapid decline in NDVI and the transition from peak growth to senescence.
y ( t ) = C 1 + C 2 ( 1 1 + e ( a 1 + b 1 t ) 1 1 + e ( a 2 + b 2 t ) ) ,
where y t is the NDVI at time t ; C 1 and C 2 represent the background greenness and peak NDVI in a given year, respectively. The parameters a 1 , b 1 , a 2 , and b 2 control the shape of the curve, where a 1 and b 1 correspond to the peak position and slope of the NDVI curve during the growing season, respectively, while a 2 and b 2 represent those during the senescence period. This approach improves the accuracy of EOS detection by capturing the most rapid decline in NDVI, reducing uncertainties caused by abrupt spectral fluctuations in the NDVI time series. Figure 2 illustrates the methodological workflow for identifying the EOS and POS.

2.2.2. Estimates of CDD

CDD was calculated as the sum of the differences in the base temperature T b and daily mean temperature T m between DOY1 and DOY2 (Equation (2)).
C D D = D O Y 1 D O Y 2 ( T b T m ) w h e n T b T m     0     w h e n     T b T m ,
Here, T b , D O Y 1 , and D O Y 2 were set to 15 °C [5,7,18,39], the POS, and the EOS, respectively. By definition, CDD values are always non-negative, representing the total cooling accumulated over a given period. A higher CDD indicates a greater cumulative heat deficit, reflecting more significant cooling intensity over time.

2.2.3. Trend Analysis

To analyze the relationship between CDD and environmental factors (elevation, temperature, and precipitation), we applied simple linear regression models. The regression equations were formulated as follows:
Y = β 0 + β 1 X + ε ,
where Y represents CDD, X is the predictor variable (elevation, temperature, or precipitation), β 0 is the intercept, β 1 is the regression coefficient, and ε represents the residual error. The regression models were fitted using the least-squares method, and their statistical significance was assessed using Pearson correlation coefficients (r) and p-values. The variability in CDD estimates was quantified using the standard deviation (SD), depicted as error bars.

2.2.4. Mann–Kendall (MK) Test

To detect trend variations in CDD across elevation gradients, we applied the Mann–Kendall (MK) test, a non-parametric method widely used for trend detection in climatology and hydrology [40,41]. The MK test identifies statistically significant monotonic trends in time series data without assuming normality. The elevation threshold used to delineate segmented trend patterns in the results was determined based on a marked inflection observed in the MK trend profile.

2.2.5. Experimental Design

We hypothesized that climatic factors were key drivers of CDD accumulation. Given this assumption, an analytical framework was employed to estimate the contributions of climate change to CDD variability [42,43,44]. Ridge regression is a widely recognized method used to separate multiple factors [43]. Thus, we applied the ridge regression model to quantify the relationship between CDD and the driving factors. Before conducting the regression analysis, all variables were normalized. The ridge regression model is represented as follows:
J β β = β arg min i = 1 m C D D i b j = 1 n β j x i j 2 + μ j = 1 n β j 2 ,
where i is an integer between 1 and m ( m grids in total); j = 1 , 2 , 3 , or 4 , and x j represents the independent variable; n = 4 , which is the number of independent variables; x denotes the normalized value of each determining factor; and C D D i is the normalized C D D value of the i t h grid. μ is a small disturbance term used to eliminate covariance between individual variables; b is a constant term, and β j is the regression coefficient of the j t h variable. The ridge regression coefficient β j and the standardized trends in the climatic factors Tmin Tmin (°C), Tmax Tmax (°C), Pre (mm), and Rad (W/m2) were used to quantify their contributions to CDD dynamics:
η c j = β z j · x j t r e n d ,
η r j = η c j η c 1 + η c 2 + η c 3 + η c 4 ,
where x j t r e n d represents the normalized independent variables, β z j denotes the standardized ridge regression coefficients, and η r j is the relative contribution of x j to the trend in CDD over the average CDD accumulation period (from the 41-year mean POS to mean EOS). To evaluate potential multicollinearity among the four climatic predictors (Tmin, Tmax, precipitation, and radiation), we calculated the variance inflation factor (VIF) for each variable using long-term (1982–2022) spatial mean values.

3. Results

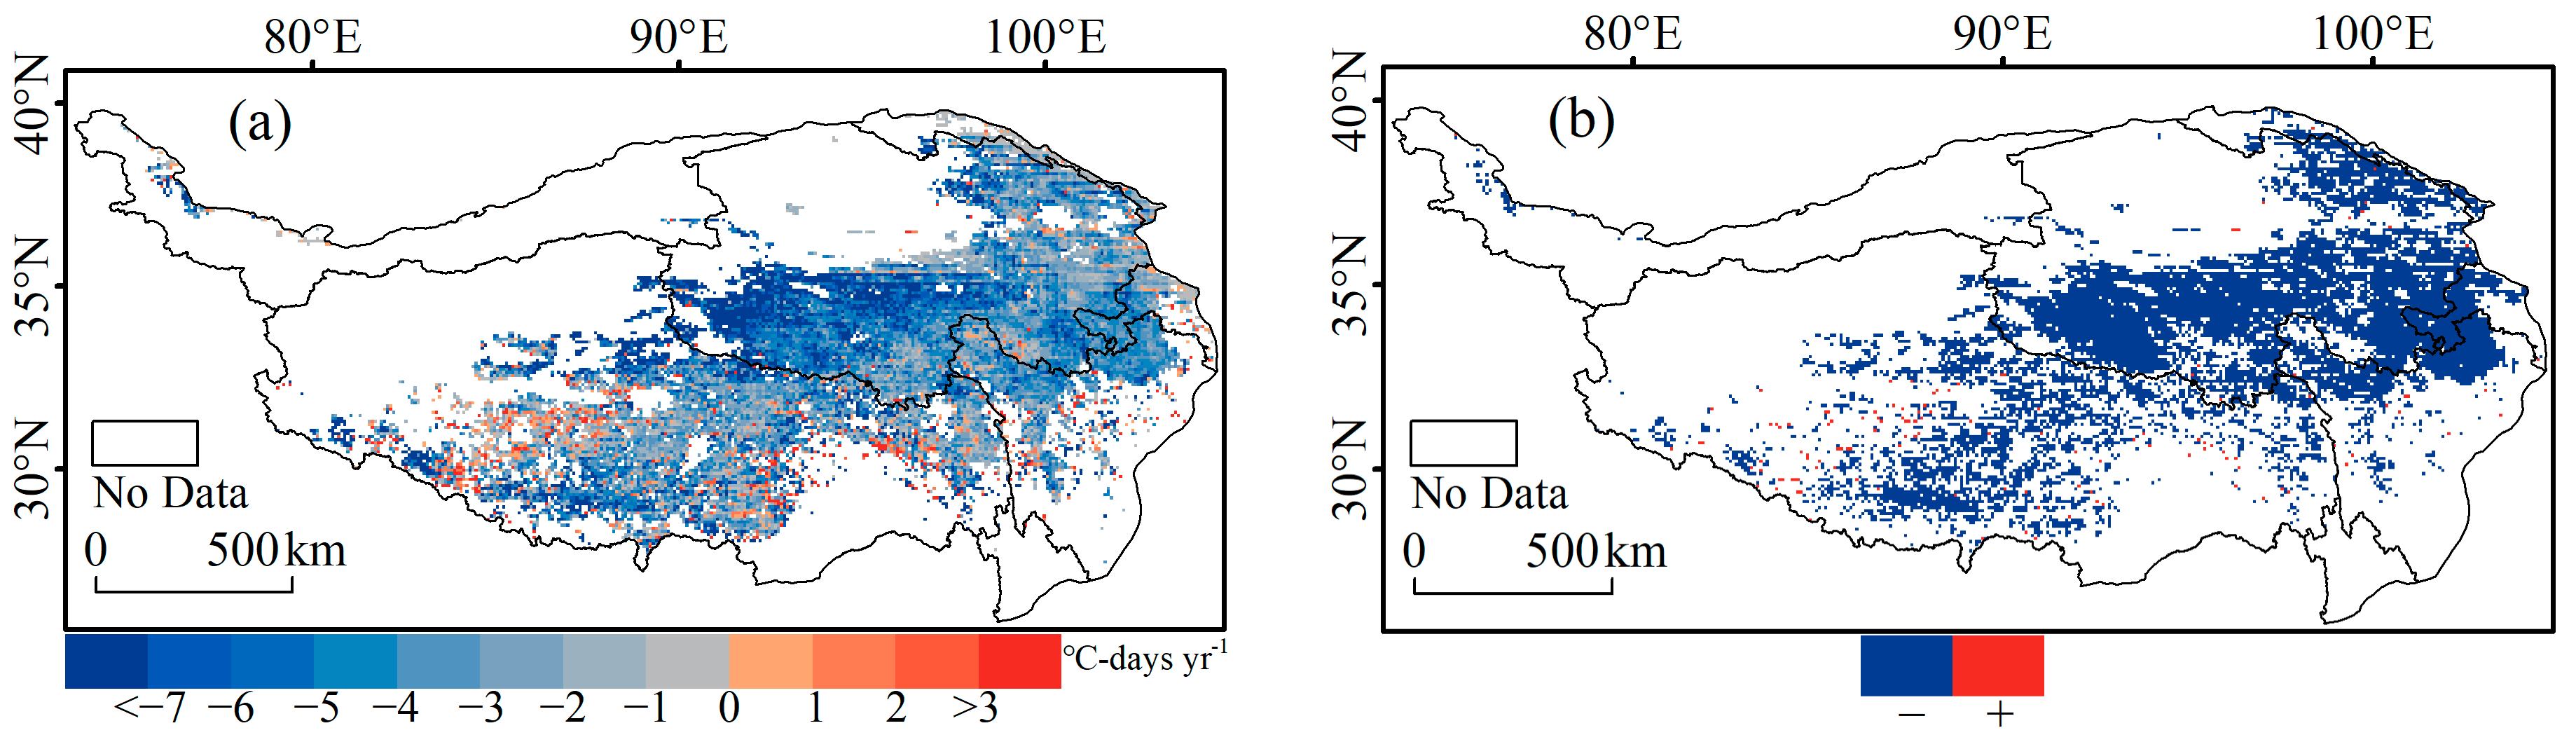
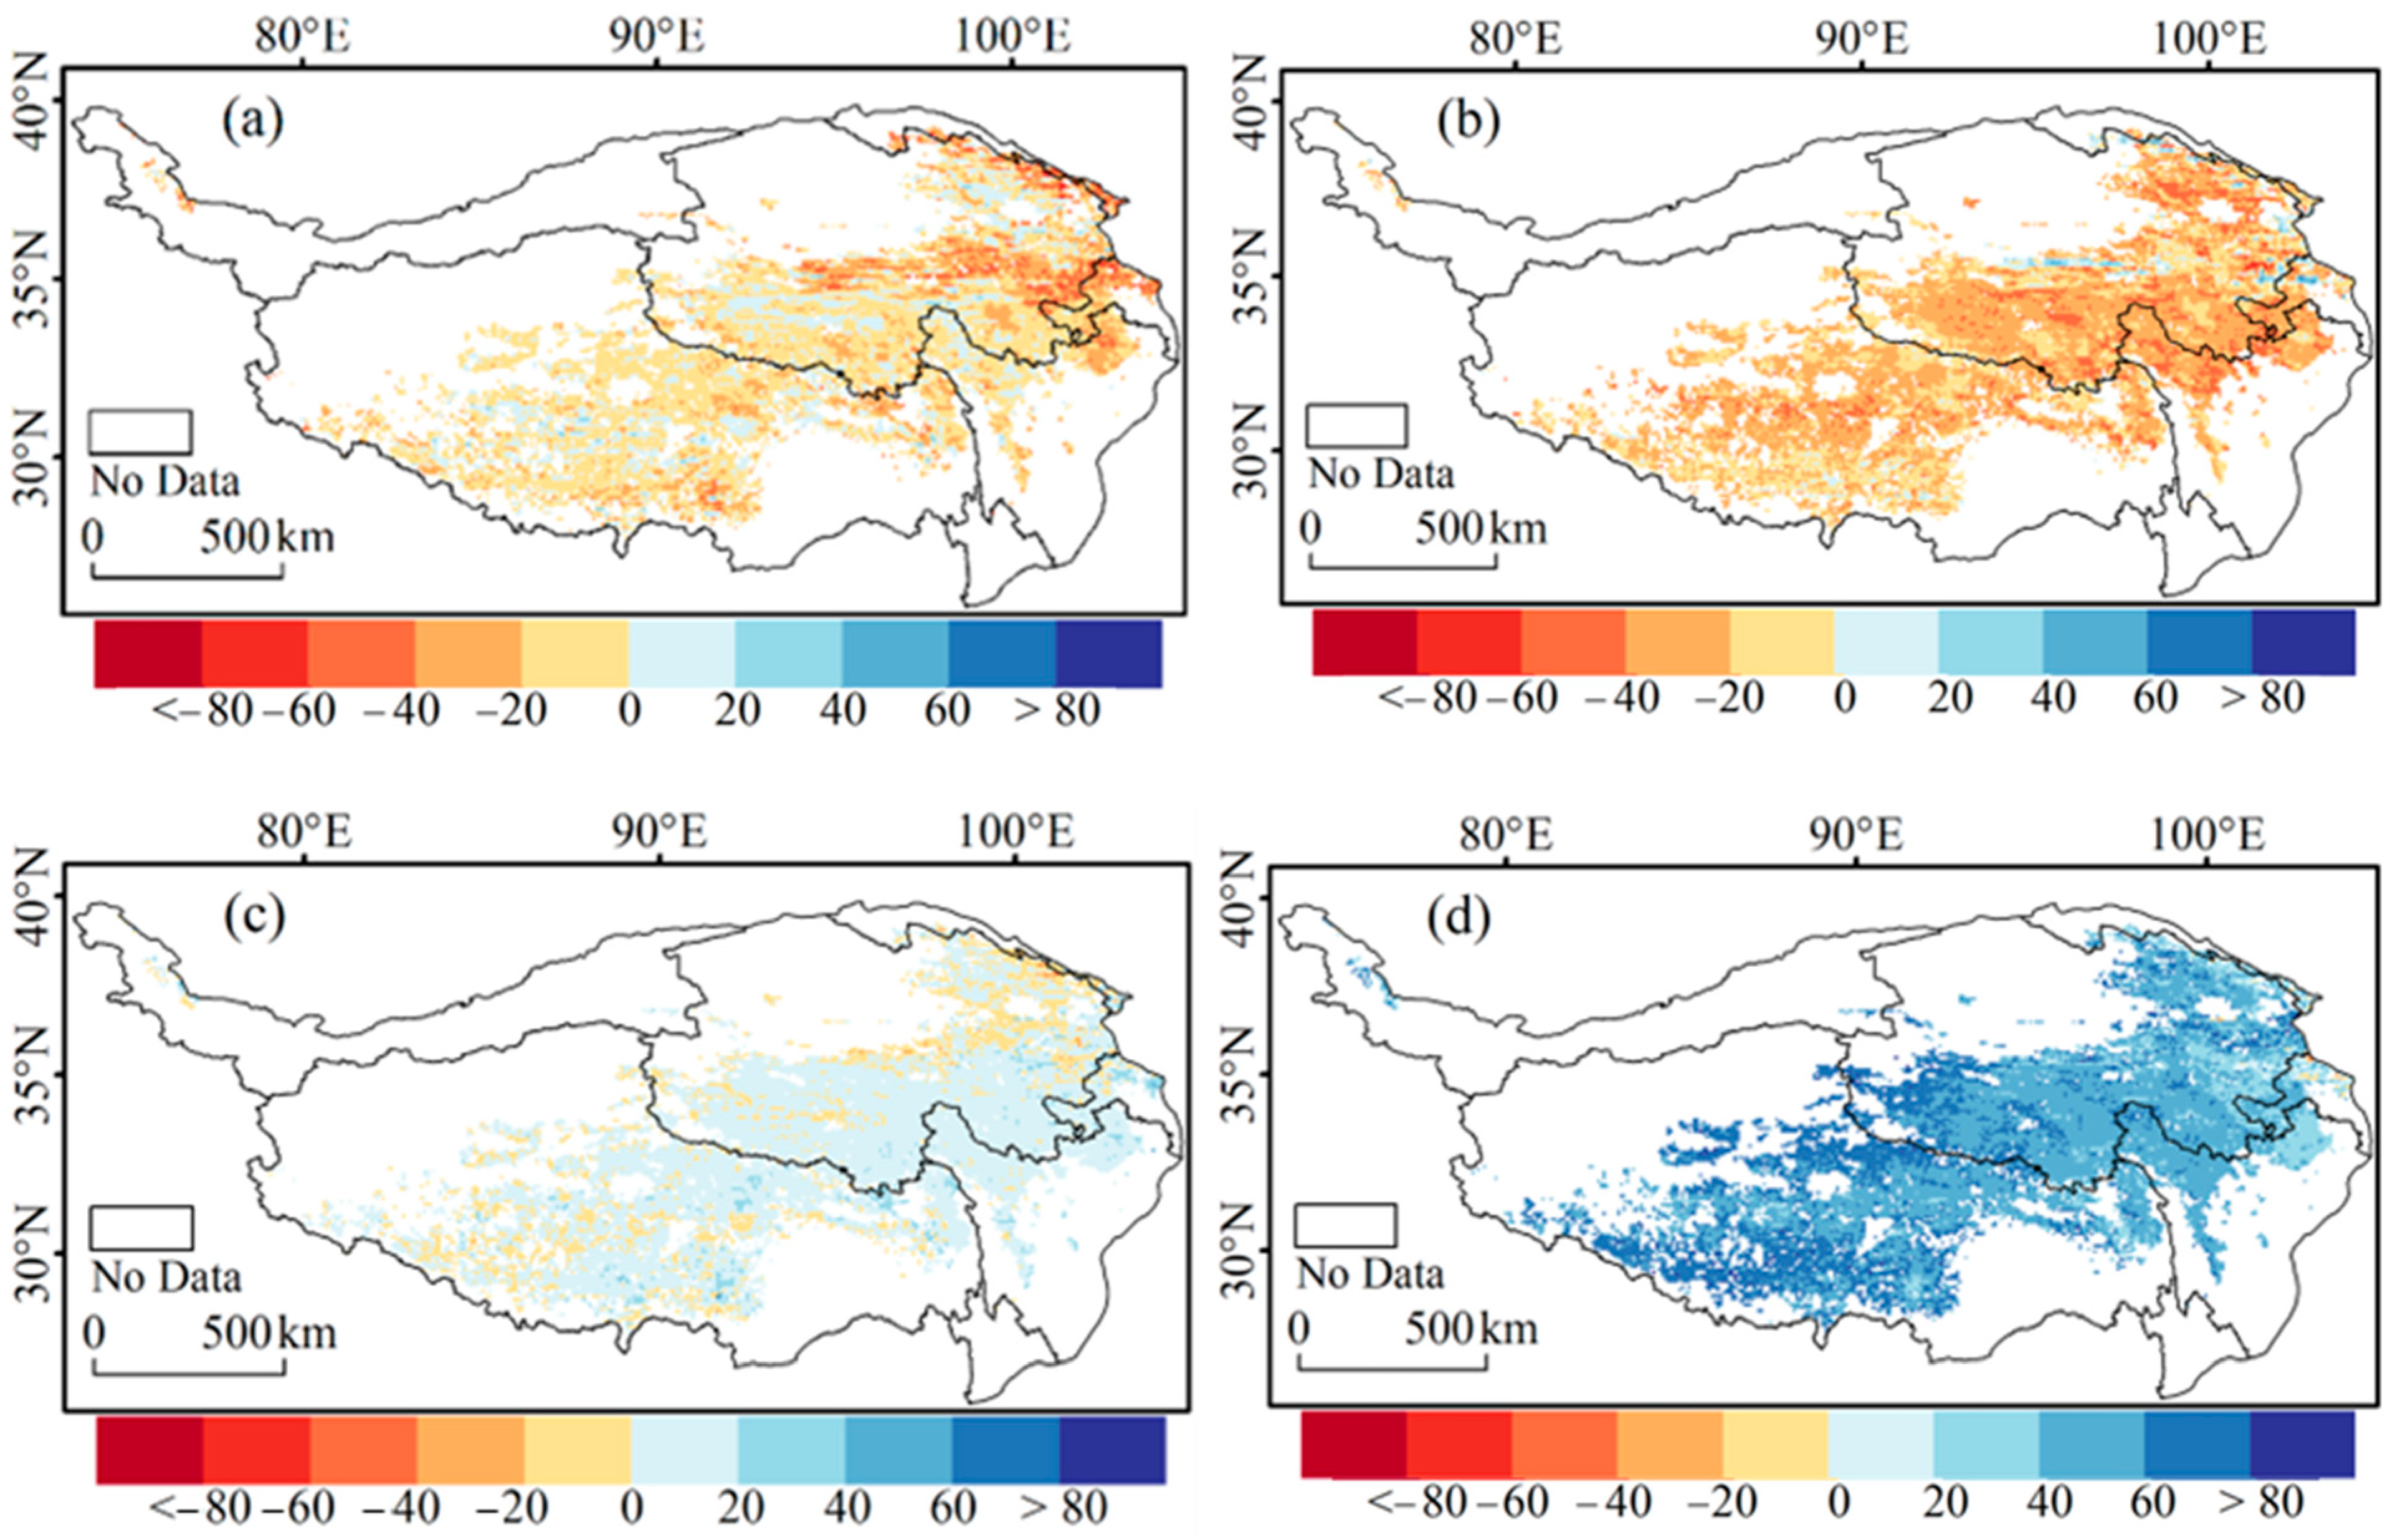
3.1. Spatial Pattern of the CDD

The mean EOS across the TP between 1982 and 2022 ranged between DOYs 250 and 292 (corresponding to 7 September and 19 October, respectively) and showed a delayed trend from the northeast (<DOY 260) to the southwest (>DOY 280) (Figure 3a). Generally, the mean CDD from 1982 to 2022 exhibited a positive relationship with the EOS in space (Figure 3b). As CDD were calculated over the period from POS to EOS, their spatial distributions were intrinsically connected. Regions with higher CDD values tended to correspond to later EOS dates, suggesting a spatial alignment between thermal conditions during the cooling phase and the timing of growing season termination.
Widespread smaller CDD values were mostly distributed in the northeastern region and some fragmented areas in the southwestern parts of the plateau, where the CDD were generally <350 °C-days. Larger CDD were observed in the southwestern bordering region and some central regions, where the CDD mostly exceeded 600 °C-days. CDD between 350 and 600 °C-days were mostly observed in the central area of the plateau. These spatial patterns of CDD also correspond well to the spatial distribution of plateau elevation (Figure S1); that is, regions with high elevations showed large CDD, and vice versa. This was further confirmed by the statistical analysis of altitudinal variations in CDD, where the CDD increased by 0.13 °C-days per 100 m increase (Figure 4a; R = 0.89, p < 0.01). This was more prominent in regions with elevations > 3100 m (0.15 °C-days/100 m, R = 0.96, p < 0.01). This altitudinal CDD gradient could also be translated to variations in CDD across the temperature gradient (Figure 4b; R = −0.96, p < 0.01), with areas with a cold climate (high elevation) showing larger CDD and areas with a warm climate (low elevation) showing smaller CDD. A strong nonlinear relationship was observed between precipitation and the CDD (Figure 4c), which was best represented by a logarithmic model (r = 0.67, p < 0.01). This indicates that the CDD increased rapidly with precipitation at lower values, but the rate of increase diminished at higher precipitation levels, suggesting a saturation-like response. This pattern may reflect the indirect influence of precipitation on CDD through its modulation of local temperature and humidity conditions, rather than a direct effect of the precipitation volume alone. There were no clear differences in the CDD among vegetation types, except for CDD of ~30 °C-days that were relatively lower for the shrub (504 ± 201 °C-days) than the others (Figure 4d).

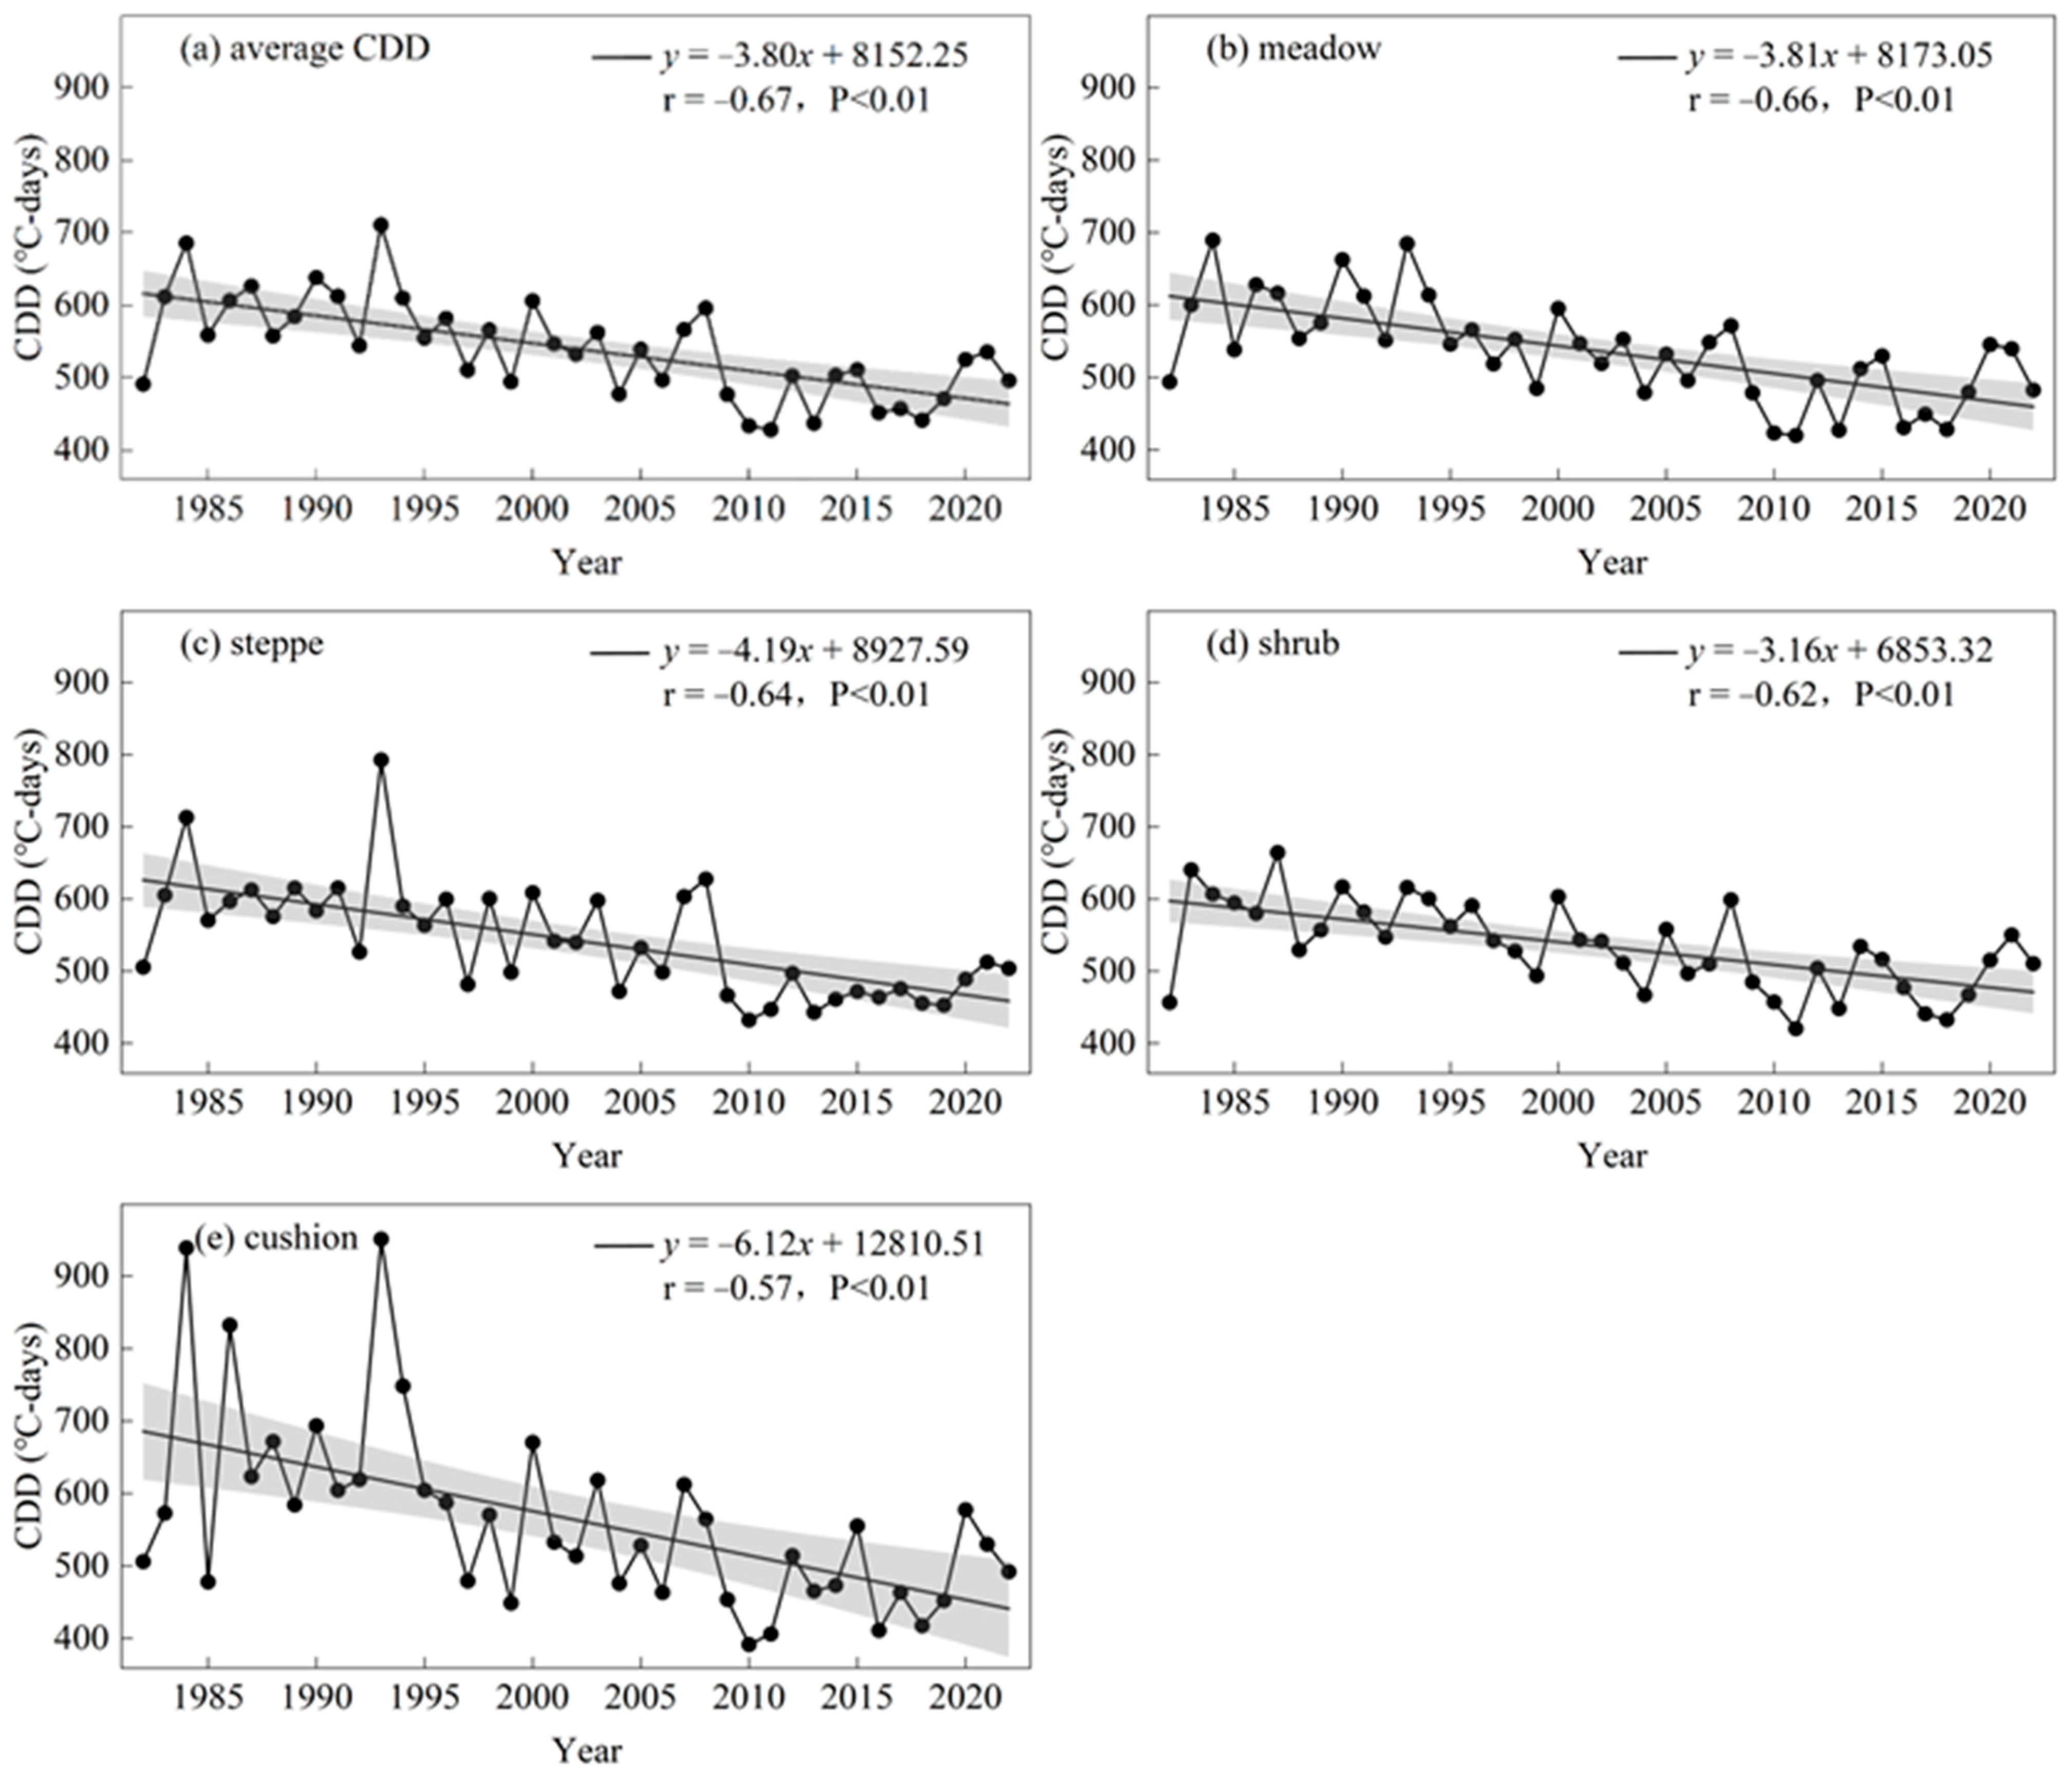
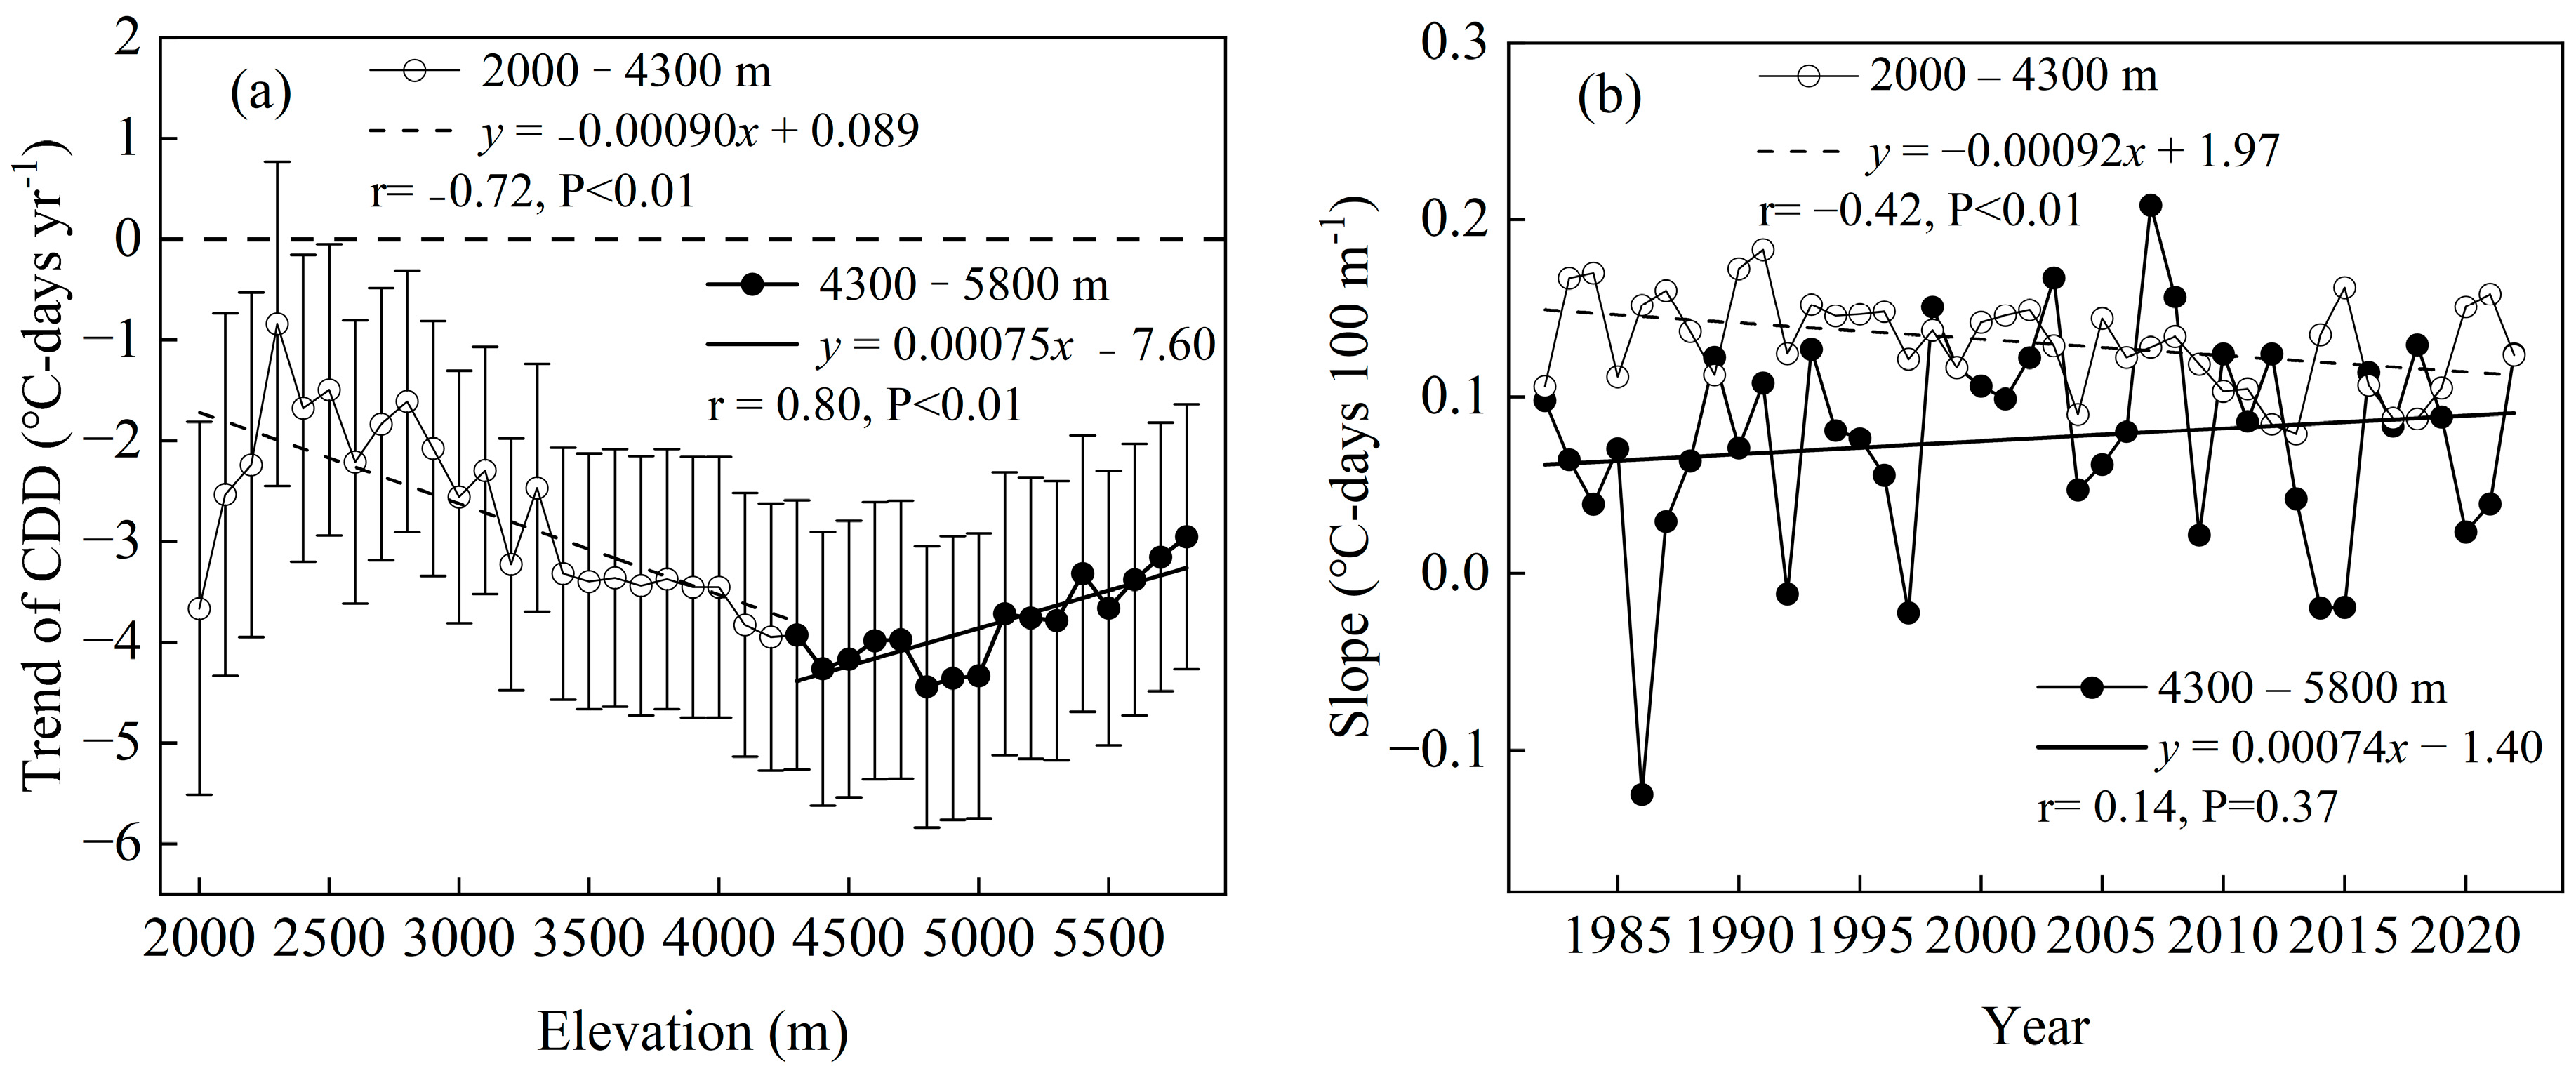
3.2. Temporal and Altitudinal Trends in the CDD

The area-averaged CDD for the grasslands on the TP varied from 427.8 °C-days in 2011 to 710.6 °C-days in 1993, exhibiting a significant decreasing trend from 1982 to 2022, with an annual decrease of 3.8 °C-days (Figure 5a; R = −0.67, p < 0.01). This decreasing trend was consistent across all four vegetation types, with the most pronounced decline observed in cushion vegetation (Figure 5e; 6.1 °C-days yr−1) and the minimum decrease in shrub (Figure 5d; 3.2 °C-days yr−1). At the pixel level, approximately 95.8% of the total pixels showed a decrease in CDD, with 89.9% showing statistically significant changes (p < 0.05). Only 4.2% of the study area, primarily in the southwestern part of the plateau, showed an increase in CDD (Figure 6).
While the majority of the study area experienced a decrease in CDD, the magnitude of this trend varied with altitude (Figure 7). The average CDD trend from 1982 to 2022, as shown in Figure 7a, revealed distinct patterns below and above 4300 m, as estimated by the Mann–Kendall (MK) test. In regions below 4300 m, the magnitude of the decrease in CDD significantly increased with increases in altitude, with a rate of 0.0009 °C-days·yr−1·100 m−1 (R = −0.72, p < 0.01). This suggests that the warming trend at higher altitudes was more pronounced during the study period. However, above 4300 m, the rate of decrease in CDD slowed significantly, with a reduced rate of 0.00075 °C-days·yr−1·100 m−1 (R = 0.80, p < 0.01), indicating diminished warming at higher altitudes.
The annual variation in CDD along altitudinal gradients, as shown in Figure 7b, exhibited a similar pattern. Over time, the annual variation in CDD in low-altitude areas decreased (R = −0.42, p < 0.01), while no significant change was observed in high-altitude areas (R = 0.14; p = 0.37). This suggests that the annual variation in CDD along the altitudinal gradient became more uniform. Overall, these results highlight the complex relationship between CDD variation, elevation, and temporal changes, with a shift from a divergent trend at lower altitudes to a more uniform trend at higher altitudes.

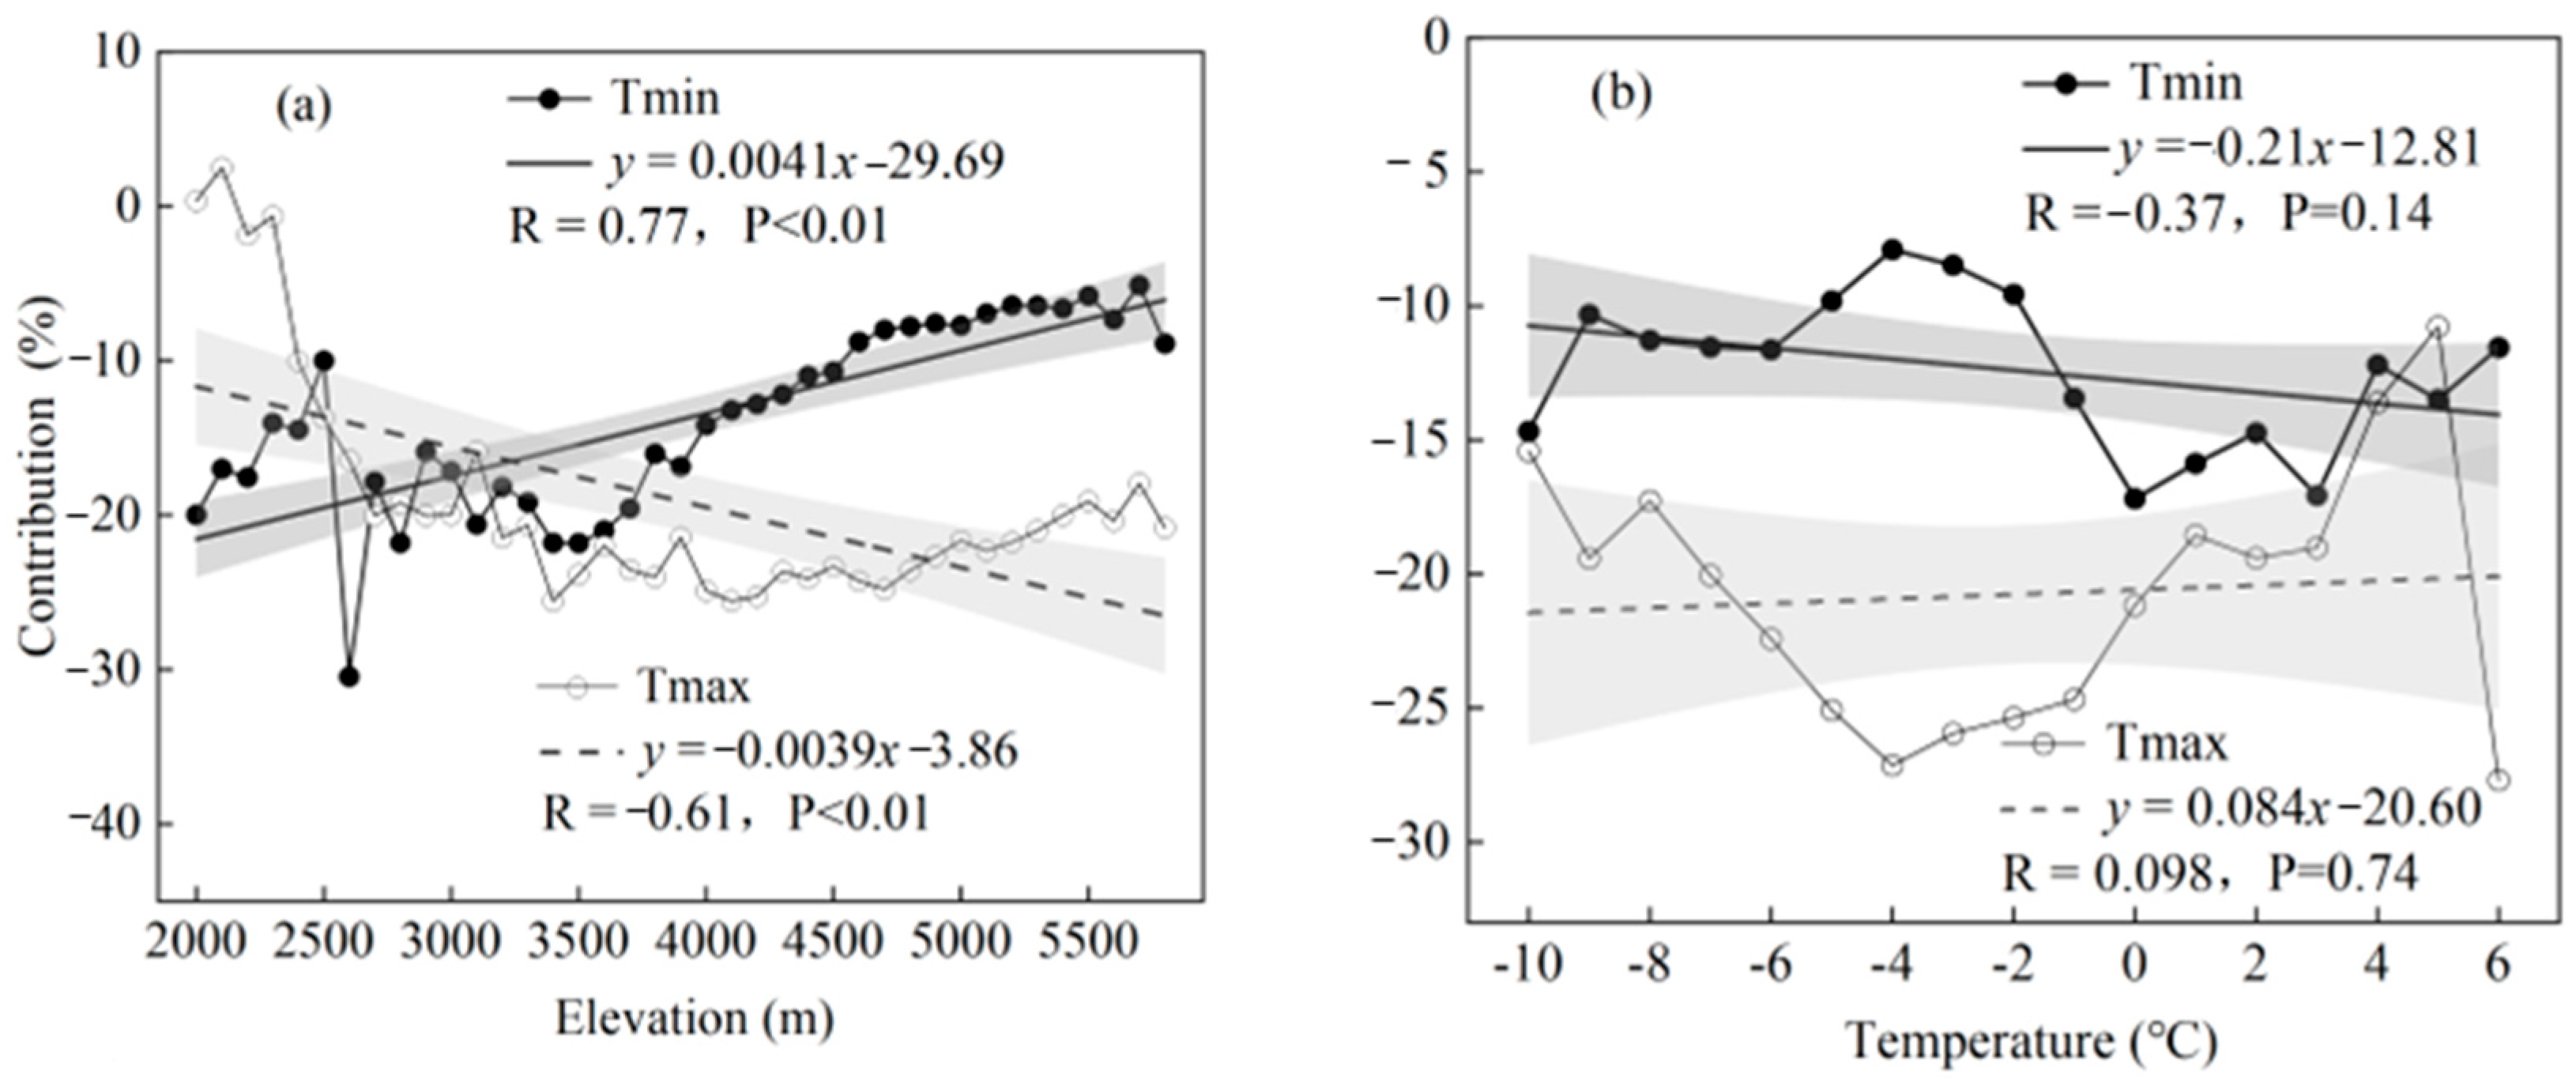
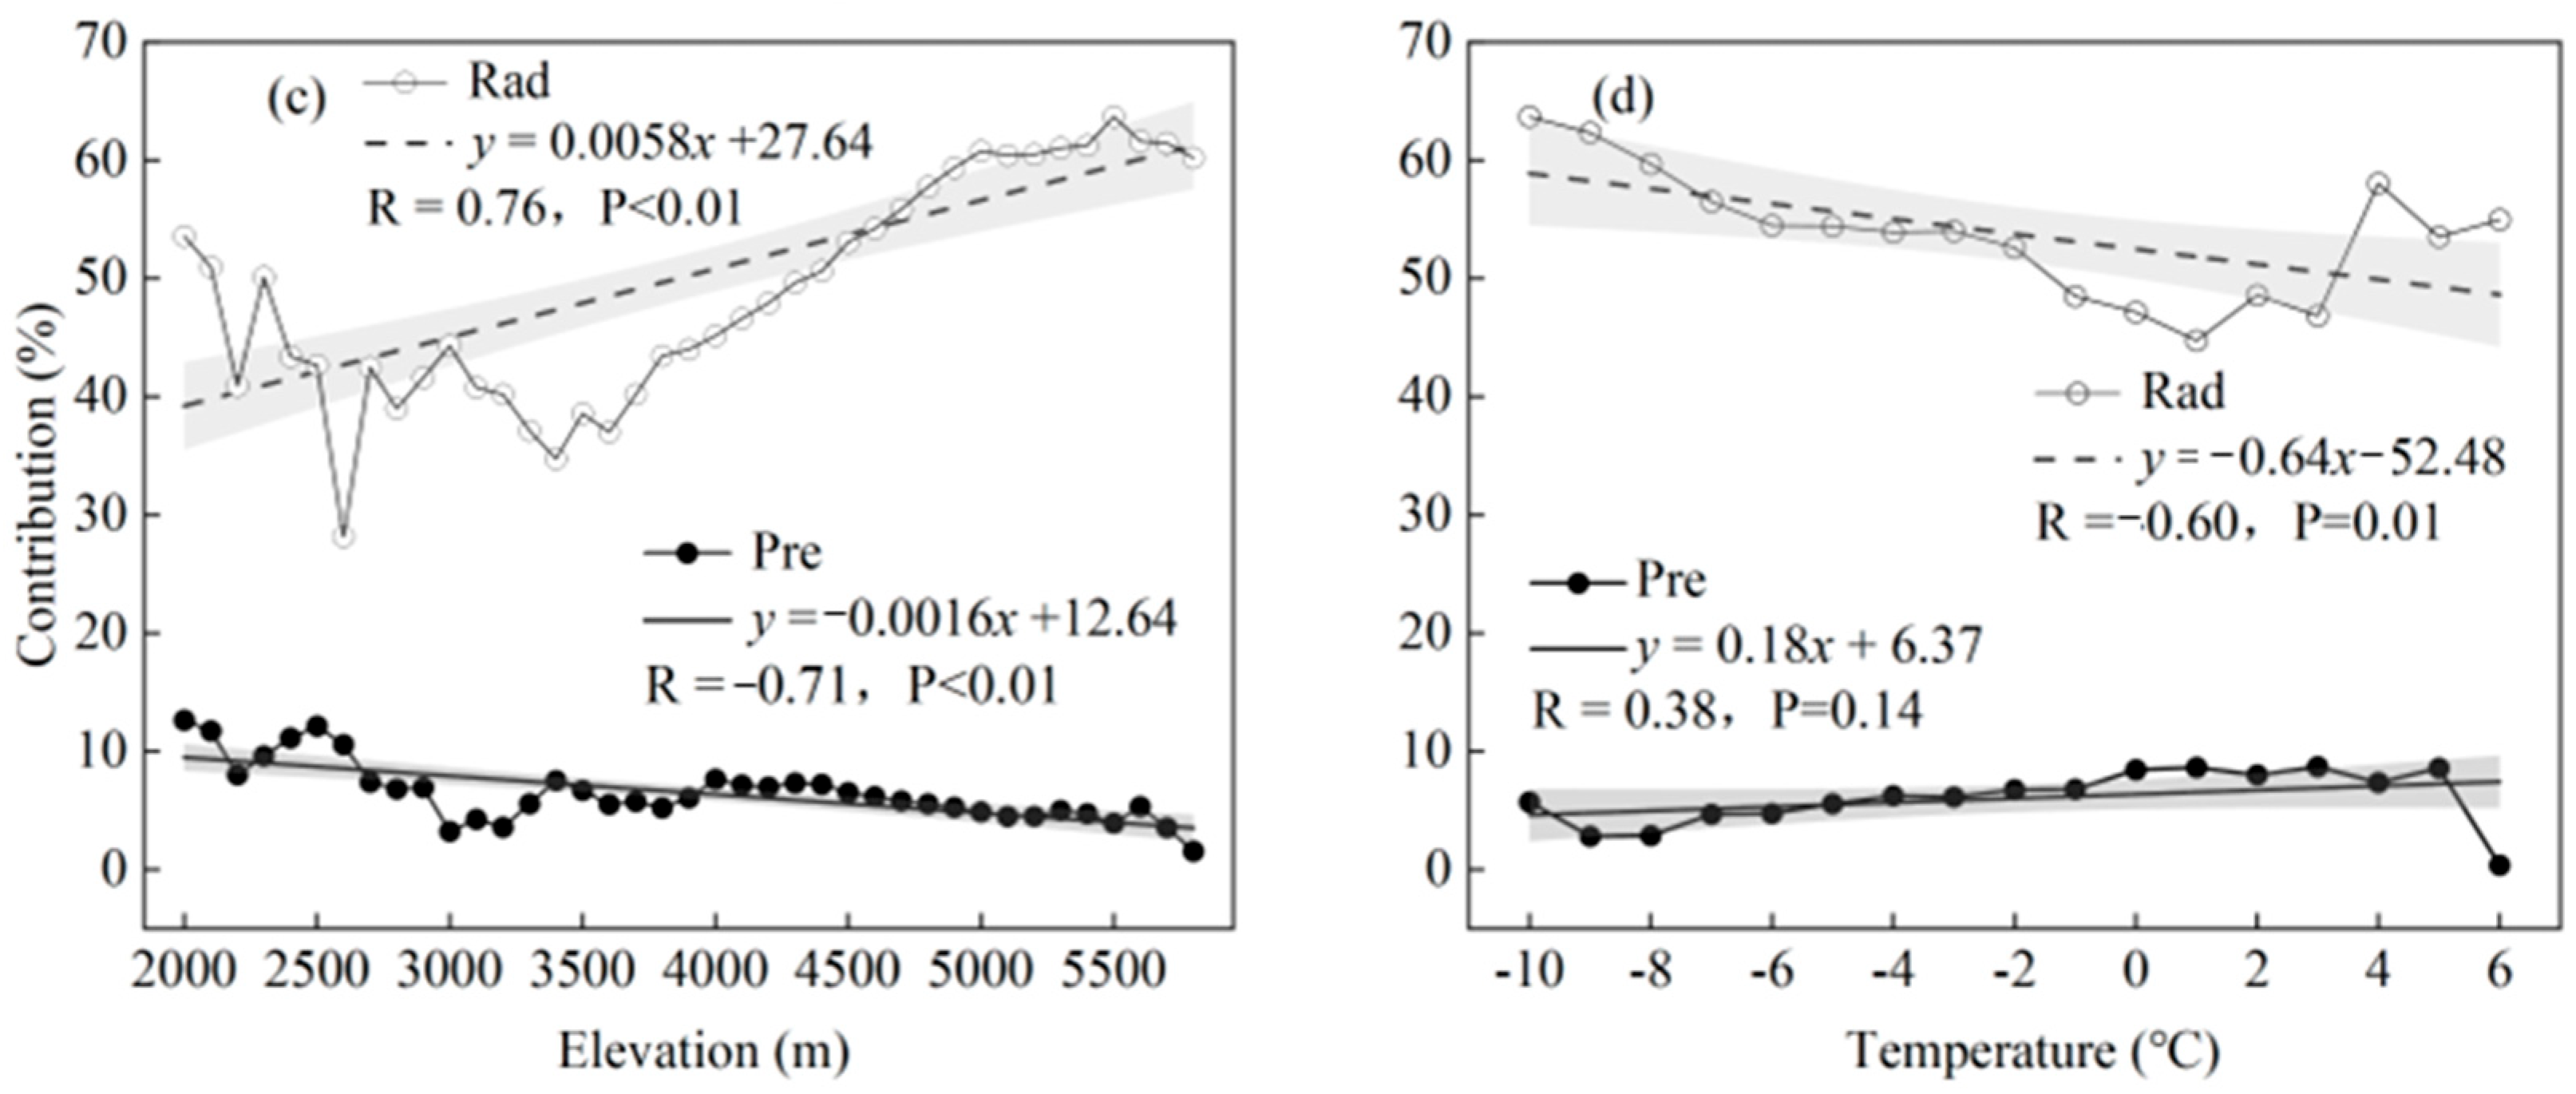
3.3. Contributions of Tmin and Tmax to CDD

The results showed significant spatial heterogeneity in the contributions of Tmin, Tmax, Pre, and Rad to the CDD (Figure 8). The contribution of Tmin to the CDD ranged from −79.7% to 37.2%, with negative contributions concentrated in the northeast and south, while positive contributions were observed in the southwest and central parts (Figure 8a). The contribution of Tmax showed a similar spatial pattern, with positive contributions primarily concentrated in a small area in the northeast, while the remainder of the study area experienced varying degrees of negative effects (Figure 8b). Tmax had the largest overall effect on the CDD, ranging from −70.1% to 64.3%; Pre had a positive effect on the CDD, with its contribution reaching a maximum of 51.2%, while a small negative effect was observed in the northeast and southwest, with values of approximately −20% (Figure 8c); and Rad had a positive impact, with an average contribution of 53.3% across more than 95% of the study area, peaking at 87.3% (Figure 8d). These trends were further validated by partial correlation analysis (Figure S2).
At different elevations, Tmin and Tmax exhibited opposite contributions to the CDD (Figure 9a), with Tmin showing the most significant effect overall. Between 2000 m and 2400 m, the contribution of Tmin to the CDD exceeded that of Tmax, while their contributions were similar between 2400 m and 3800 m. At elevations above 3800 m, the contribution of Tmax to the CDD increased with altitude, stabilizing around 4900 m, while the contribution of Tmin gradually declined. Consistent with the temperature gradient, Tmax generally had a more significant negative impact on the CDD compared to Tmin, with an overall average decrease of approximately −20%. In contrast, Tmin showed a non-significant decreasing trend, with an average contribution of approximately −10% (Figure 9b).
The positive contribution of Rad to the CDD along the elevation gradient was significantly higher than that of Pre. As elevation increased, the contributions of Rad and Pre to the CDD exhibited opposing trends: Rad’s contribution increased, while Pre’s contribution decreased (Figure 9c). Along the temperature gradient, the contribution of Rad continued to exceed that of Pre, with Rad’s contribution showing a slight decrease and Pre’s contribution remaining relatively stable (Figure 9d). As shown in Figure 9, the contributions of Tmax and Rad to the CDD increased with elevation, suggesting that these two factors had a greater influence on the CDD. However, we do not conclude that Rad’s contribution is the largest; the reasons for this are discussed in detail in the following section.
In the VIF analysis, Tmin and Tmax showed moderate multicollinearity (VIF = 6.74 and 6.72), consistent with their inherent physical correlation. In contrast, precipitation and radiation had much lower VIFs (1.20 and 1.28), suggesting negligible multicollinearity. These results support the use of ridge regression to stabilize coefficient estimates and address potential collinearity among predictors.

4. Discussion

4.1. Spatial Distributions of EOS and CDD

The present study investigated the spatial patterns of CDD and EOS in the alpine grasslands on the TP, revealing distinct geographic patterns that are critical for understanding ecosystem resilience to climate change. Notably, the EOS exhibited a delayed trend from northeast to southwest, consistent with previous findings [45]. This spatial pattern suggests that regions with a later EOS experience prolonged vegetation activity before dormancy onset, likely influenced by accumulated thermal conditions. Similarly, the CDD showed a comparable spatial pattern, with higher CDD values generally corresponding to a later EOS. This relationship underscores the role of CDD in regulating autumn phenology, where greater cumulative cooling contributes to delayed senescence. Interestingly, the CDD exhibited an inverse spatial pattern relative to accumulated growing degree days (AGDD) [46], suggesting that regions with higher CDD values required less heat for green-up onset. This pattern indicates that sufficient dormancy accumulation in the preceding year reduced the thermal threshold needed for vegetation reactivation, an observation that aligns with previous studies.
A comprehensive spatial analysis further demonstrated that elevation, temperature, and precipitation played a more significant role in shaping CDD patterns than the vegetation type. This is largely attributable to the distinct climatic and environmental conditions of high-altitude regions, where CDD strongly correlate with temperature. Specifically, increasing elevation and precipitation lead to lower temperatures, which subsequently constrain vegetation growth and phenological processes [47]. Understanding these relationships is crucial for assessing the impact of climate change on vegetation growth and ecological systems. The observed spatial coherence between the EOS and CDD supports the idea that the accumulated heat deficit during the late growing season may constrain the timing of vegetation dormancy. While our study did not explore the underlying physiological mechanisms, this spatial coupling highlights the potential of CDD as remote sensing-based indicators of autumn phenology patterns in high-altitude regions.
Additionally, we evaluated spatial CDD distributions using two approaches: one incorporating both Tmin and Tmax and another based solely on Tmin with a base temperature of 15 °C (Figure S3). Despite variations in temperature, the overall spatial patterns remained consistent, supporting the robustness of our methodology. As highlighted in previous studies, Tmin exhibits similar phenological effects to Tmean and Tmax, except during summer [26]. Consequently, for consistency and clarity, we primarily present spatial CDD distributions derived from Tmean with a base temperature of 15 °C. Building upon these spatial insights, the next section explores the temporal trends in CDD, providing a deeper understanding of climatic influences on alpine grassland ecosystems.

4.2. Decrease in CDD over Time

The CDD exhibited a consistent and significant decline from 1982 to 2022 across all vegetation types, reflecting the broader warming trend on the TP. Previous studies have documented significant warming on the TP since the 1950s, with a rate approximately twice the global average [47,48]. This warming pattern, particularly in winter, has been linked to reduced chilling accumulation, which in turn influences vegetation dormancy and phenological cycles [46]. Our findings (Figure S4) were consistent with previous studies that characterize the climate trajectory of the TP as warming–wetting [47].
Over the study period, significant increasing trends in Tmin (0.049 °C yr−1, p < 0.01) and Tmax (0.031 °C yr−1, p < 0.01) were observed, while precipitation exhibited a slight, statistically insignificant increase (0.34 mm yr−1, p = 0.26). The widespread temperature rise, particularly the greater increase in Tmin compared to Tmax, suggests that the temperature rise, rather than the precipitation change, is the primary driver of CDD decline. Spatially, 95.1% of the study area exhibited increasing Tmin, 87.6% showed rising Tmax, and 70% experienced precipitation growth (Figure S5a,b). However, regional variations were evident, with decreasing trends in both Tmin and Tmax observed in the southwestern and northeastern regions, reflecting local climate variability [49]. Additionally, significant precipitation increases were concentrated in the central region (Figure S5c), whereas a general decline in solar radiation was detected across the study area (Figure S5d).
Overall, these results indicate a notable shift in climate characterized by rising temperatures, increased moisture availability, and declining solar radiation, which collectively contribute to the significant decline in CDD. Several mechanisms may explain this trend. Warmer temperatures and enhanced moisture availability accelerate vegetation growth, shortening the dormancy period and leading to reduced CDD. Increased precipitation further amplifies this effect by elevating atmospheric humidity, which promotes vegetation development and modifies energy balance dynamics. This is particularly evident in the eastern and southeastern regions of the TP, where monsoon influences and topographic effects enhance precipitation, fostering higher vegetation cover and biodiversity [50]. Consequently, these climatic shifts may contribute to greater ecosystem heterogeneity, with vegetation cover and biodiversity in the southeastern TP exceeding those in the northwestern region.

4.3. Decrease in CDD with Increasing Altitude

Previous studies have demonstrated that the responses of alpine grasslands to climate change vary along elevational gradients [20,51,52]. Specifically, the effect of temperature changes on spring phenology in grasslands increases with increasing altitude [53,54]. AGDD exhibit a negative correlation with elevation, with higher altitudes experiencing lower AGDD values. In contrast, CDD demonstrate a more complex relationship with elevation, indicating differential thermal constraints at varying altitudes [46].
Within this context, our findings reveal a nonlinear relationship between CDD and elevation. CDD decrease with increasing elevation from 2000 m to 4300 m, reflecting stronger warming effects at lower elevations, which accelerate CDD reduction. However, above 4300 m, CDD exhibit an increasing trend, coinciding with changes in Tmin and Tmax, which rise with elevation up to 4300 m but decline beyond this threshold (Figure S6). These results suggest that temperature variations along the elevational gradient play a dominant role in controlling CDD dynamics.
The distinct CDD trends at different elevations likely reflect the interplay between global climate change and local environmental controls. At lower elevations (<4300 m), CDD decline more significantly with altitude, suggesting that global warming is the dominant driver of change. This is consistent with previous studies showing that low-elevation regions are more directly affected by large-scale climate warming due to enhanced heat accumulation and atmospheric energy balance changes [55,56]. Increased Tmin and Tmax at these altitudes result in faster reductions in CDD, as the overall warming trend reduces the number of CDD required to transition into dormancy.
Conversely, at higher elevations (>4300 m), CDD show an increasing trend, indicating that temperature regulation in these regions is influenced more by local climatic and environmental factors. High-altitude areas are often subject to terrain-driven climate effects, including topographic shading, persistent snow and ice cover, and shifts in cloud cover and radiation fluxes, which alter the rate of temperature increase [55]. The snow–albedo feedback mechanism also plays a critical role, as changes in snow cover can amplify or dampen local warming effects, influencing the accumulation of CDD [57]. Additionally, high-altitude atmospheric circulation patterns may buffer global warming impacts, leading to less pronounced CDD reductions compared to those at lower elevations.
The observed positive correlation between CDD and elevation above 4300 m suggests that higher altitudes impose constraints on the growing season, leading to shortened vegetation life cycles and altered ecological dynamics. Increased temperature extremes and climatic variability at high altitudes place greater physiological demands on alpine vegetation, potentially modifying the community structure and species composition. These shifts influence species diversity, ecosystem functionality, and plant competitive dynamics.
For instance, elevation-induced constraints on the growing season length can alter plant distribution patterns and resource allocation strategies. A shortened growth period at extreme altitudes may limit the optimal utilization of environmental resources, affecting energy flow and nutrient cycling within alpine ecosystems. Consequently, the interaction between elevation and CDD has profound implications for alpine ecosystem stability, species adaptation, and ecological processes. Understanding these dynamics is crucial for predicting vegetation responses to climate change in high-altitude environments and for informing conservation and ecological management strategies in fragile alpine ecosystems.

4.4. Comparative Discussion on the Role of Tmin and Tmax in CDD Variation

Contrary to the initial hypothesis that Tmin plays a decisive role in CDD variation, our results indicate that the relative contributions of Tmax and Tmin to CDD are elevation-dependent. Overall, Tmax exhibited a stronger influence on CDD than Tmin, a pattern likely driven by temperature–elevation interactions during the POS–EOS period (Figure S7). Specifically, the rate of decline in Tmin exceeded that of Tmax between 2200 m and 3000 m, whereas Tmax declined more rapidly than Tmin between 3100 m and 4700 m before reversing at higher elevations (>4700 m). While Tmin decreased more rapidly than Tmax in areas below 3000 m and above 5000 m, these zones represented only a small portion (10%) of the study area and thus had limited influence on the overall trend. Consequently, within the 3100–4700 m range, the dominant negative contribution of Tmax resulted in its stronger overall impact on CDD.
Our findings align with previous studies [26,58,59], which reported a significant but declining trend in annual solar radiation across the TP. Solar radiation plays a crucial role in the vegetation’s phenological sensitivity in certain regions, particularly in regions where chilling accumulation is insufficient [60]. For example, previous research suggested that the insolation sum effects are amplified when accumulated chilling is deficient [61]. Additionally, the heat requirement for plant growth has been found to be negatively correlated with the insolation sum, which contrasts with the positive relationship observed between CDD and Rad in our study. This suggests that chilling accumulation deficits may amplify the influence of insolation on CDD, highlighting the role of Rad as a significant contributor to CDD variability.
While previous research has predominantly relied on ground-based experiments to investigate the relationship between solar radiation and vegetation phenology (e.g., green-up and senescence) [58], relatively few studies have explored the link between solar radiation and CDD using remote sensing data. Our results support earlier findings that autumn warming delays the EOS [62], which is attributed to higher temperatures and reduced vegetation water demand, facilitating photosynthesis and delaying chlorophyll degradation [7]. Furthermore, we observed a positive correlation between Rad and autumn phenology during late summer and early autumn, suggesting that higher Rad levels enhance vegetation photosynthetic capacity, prolonging the growing season and delaying abscisic acid accumulation. Given that Rad is predominantly determined by latitude and seasonal cycles, it remains relatively insensitive to climate change except under persistently cloudy conditions. Increased Rad during CDD accumulation may delay autumn phenology, further enhancing CDD accumulation. However, the underlying mechanisms linking Rad and CDD warrant further investigation.
The relatively minor influence of precipitation on CDD compared to temperature aligns with previous studies on AGDD [46]. This can be attributed to high levels of sunshine and evapotranspiration, which result in temperature exerting a direct effect on precipitation patterns, rather than precipitation directly affecting CDD. Future research could further explore the potential role of water availability in shaping CDD dynamics, particularly by incorporating indicators such as soil moisture.
While elevation was not explicitly included as an independent predictor in the ridge regression model, its indirect influence on CDD variability is evident from the altitudinal gradients of the climatic variables analyzed (see Figure 3 and Figure 4). Elevation is inherently correlated with temperature, precipitation, and radiation in high-altitude regions and thus may act as a latent variable modulating the spatial distribution of CDD. In particular, our findings suggest that elevation exerts its effect primarily through its interactions with Tmin and Tmax, which are major drivers of CDD. In general, higher elevations are associated with lower temperatures, which reduce growing degree day accumulation and enhance CDD values. Precipitation and radiation patterns also vary with altitude due to orographic and atmospheric effects. Although this potential collinearity is mitigated by the use of ridge regression—which is robust to multicollinearity—we acknowledge that the influence of elevation on the contribution of individual climatic factors remains complex and may warrant more explicit modeling in future studies.

4.5. Uncertainties in the Present Study

This study differs from previous research by quantifying and analyzing changes in CDD, rather than solely treating it as a factor influencing phenological processes and photosynthesis [63]. Earlier studies primarily examined CDD in relation to EOS timing [3,5,64] and incorporated them into process-based phenological models [65,66]. Our findings underscore the complex interactions between temperature, precipitation, and solar radiation in shaping phenological dynamics, with temperature emerging as the dominant climatic driver across the TP [45]. While the spatiotemporal variations in EOS and CDD identified in this study align with previous research, some discrepancies exist. Specifically, long-term EOS trends differ from those derived from short-term observations [67], emphasizing the importance of extended temporal datasets. Given that the present study covers a 41-year period, surpassing those in most of the previous research [62,67], uncertainties related to temporal inconsistencies are relatively minor.
One key source of uncertainty arises from the use of NDVI data from multiple satellite sensors, including AVHRR, MODIS, and SPOT-VGT [68]. Previous studies have shown that phenological trends inferred from AVHRR and MODIS diverged significantly after 2000, likely due to differences in sensor characteristics and data processing techniques [45,69]. To address this issue, we applied cross-calibration between AVHRR and MODIS NDVI datasets, ensuring temporal consistency and minimizing potential biases. Another notable challenge is the presence of mixed pixels, particularly in heterogeneous landscapes, where a single pixel may encompass multiple land cover types. This issue is particularly relevant for NDVI-derived phenological metrics such as the EOS, which can be affected by spectral mixing, leading to spatial inconsistencies in CDD estimation. These uncertainties are especially pronounced in vegetation transition zones, where spectral blending can obscure phenological boundaries. To reduce the impact of mixed-pixel effects, we adopted several strategies: (1) applying the maximum-value composite (MVC) method to the MODIS NDVI to reduce spectral noise from mixed land cover classes, (2) resampling all datasets to a consistent spatial resolution to enhance spatial comparability, and (3) aggregating vegetation categories to minimize classification uncertainty. Despite these efforts, future studies should consider incorporating higher-resolution vegetation indices and sub-pixel decomposition techniques to further refine land cover classification and improve the accuracy of phenological estimates.
Additionally, the use of gridded meteorological data instead of station-based observations may introduce errors associated with interpolation and spatial averaging. Although gridded datasets provide extensive spatial coverage, their accuracy may be lower in remote or high-altitude regions with sparse meteorological stations. Despite these limitations, the advantage of this study lies in its systematic assessment of the spatial and temporal variability in CDD across the TP, coupled with an analysis of key meteorological drivers.
The differences between our results and those of previous studies can be attributed to variations in the study area, dataset selection, phenological calculation methods, and CDD threshold definitions. Nonetheless, our findings are broadly consistent with previous research, reinforcing our understanding of CDD dynamics in alpine grasslands on the TP. However, one notable limitation of this study is the lack of physiological and ecological quantification of CDD impacts. Future research should integrate physiological indicators and experimental validation to further elucidate the biological mechanisms underlying CDD responses. Additionally, our results have significant implications for ecosystem stability and vegetation growth, offering new perspectives on autumn phenology, AGDD, and spring phenology. By linking these processes, this study provides insights into ecosystem functioning and phenological transitions in alpine grasslands, supporting biodiversity conservation and vegetation management on the TP.
In addition to confirming regional CDD trends and their climatic influences, this study contributes to the understanding of high-altitude phenological responses by uncovering a nonlinear altitudinal transition in CDD patterns, applying a long-term, cross-sensor NDVI dataset with consistent phenological modeling, and quantifying the relative importance of multiple climate drivers across elevation gradients. These methodological and ecological insights provide a foundation for future research on late-season thermal dynamics and their implications for vegetation–climate interactions under ongoing climate change.

5. Conclusions

This study provides a comprehensive assessment of the spatiotemporal variability in cooling degree days (CDD) across the Qinghai–Tibetan Plateau (TP) from 1982 to 2022. The findings reveal a significant decreasing trend in CDD in both space and time. However, this decline was not uniform across elevations, with a notable transition near 4300 m, marking a shift from enhanced cooling loss at mid-altitudes to stabilized or even increasing CDD in high-altitude zones. This nonlinear altitudinal response underscores the complex interplay between large-scale climate warming and localized environmental feedback in alpine regions.
The results further highlight that Tmax is the dominant climatic factor influencing CDD, with its contribution varying across elevation bands. The relative contributions of other factors, such as radiation and precipitation, varied along environmental gradients, reflecting elevation-dependent shifts in dominant drivers. These findings highlight the importance of considering altitude-specific mechanisms when assessing vegetation–climate interactions in mountainous ecosystems. By clarifying the temporal evolution and climatic regulation of CDD, this study advances our understanding of thermal constraints on autumn phenology and vegetation adaptation in high-altitude environments. The results provide a valuable foundation for modeling ecosystem stability, carbon balance, and biophysical feedback under ongoing climate change. In addition to ecological insights, this study has implications for land-use planning and agricultural sustainability on the TP. A continued decline in CDD may prolong the growing season in some areas while reducing thermal constraints in others, thereby affecting pasture management and cropping systems.
Future research should focus on incorporating physiological indicators to better understand how CDD variations affect vegetation phenology and ecosystem functioning. Moreover, exploring long-term socioeconomic consequences, such as the impacts on agricultural production and land development, will be essential for developing effective adaptation strategies under ongoing climate change.

Supplementary Materials

The following supporting information can be downloaded at: https://www.mdpi.com/article/10.3390/land14040758/s1.

Author Contributions

Y.Z.: writing—original draft and visualization; G.B. and Y.B.: conceptualization, supervision, and funding acquisition; S.T.: software; Z.Y.: data curation and methodology; W.R.: formal analysis. All authors have read and agreed to the published version of the manuscript.

Funding

This study was jointly supported by the National Natural Science Foundation of China (Grant No. 21K20200001), the Natural Science Foundation of Inner Mongolia, China (Grant No. 2021MS04014), the Fundamental Research Funds for the Inner Mongolia Normal University (Grant No. 2022JBXC017), and the Graduate Student’s Research & Innovation Fund of Inner Mongolia Normal University (Grant No. CXJJB22014).

Data Availability Statement

All data used in this study were obtained from publicly available sources. The processed dataset is available from the authors upon reasonable request.

Conflicts of Interest

The authors declare that they have no known competing financial interests or personal relationships that could have appeared to influence the work reported in this paper.

References

  1. Cong, N.; Shen, M.; Piao, S. Spatial variations in responses of vegetation autumn phenology to climate change on the Tibetan Plateau. J. Plant Ecol. 2016, 10, 744–752. [Google Scholar]
  2. Fu, Y.; Li, X.; Zhou, X.; Geng, X.; Guo, Y.; Zhang, Y. Progress in plant phenology modeling under global climate change. Sci. China Earth Sci. 2020, 63, 1237–1247. [Google Scholar]
  3. Jeong, S.J.; Medvigy, D. Macroscale prediction of autumn leaf coloration throughout the continental United States. Glob. Ecol. Biogeogr. 2014, 23, 1245–1254. [Google Scholar] [CrossRef]
  4. Lang, W.; Chen, X.; Qian, S.; Liu, G.; Piao, S. A new process-based model for predicting autumn phenology: How is leaf senescence controlled by photoperiod and temperature coupling? Agric. For. Meteorol. 2019, 268, 124–135. [Google Scholar]
  5. Xie, Y.; Civco, D.L.; Silander, J.A. Species-specific spring and autumn leaf phenology captured by time-lapse digital cameras. Ecosphere 2018, 9, e02089. [Google Scholar]
  6. An, S.; Chen, X.; Zhang, X.; Lang, W.; Ren, S.; Xu, L. Precipitation and Minimum Temperature are Primary Climatic Controls of Alpine Grassland Autumn Phenology on the Qinghai-Tibet Plateau. Remote Sens. 2020, 12, 431. [Google Scholar]
  7. Zhu, W.; Zheng, Z.; Jiang, N.; Zhang, D. A comparative analysis of the spatio-temporal variation in the phenologies of two herbaceous species and associated climatic driving factors on the Tibetan Plateau. Agric. For. Meteorol. 2018, 248, 177–184. [Google Scholar]
  8. Dragoni, D.; Rahman, A.F. Trends in fall phenology across the deciduous forests of the Eastern USA. Agric. For. Meteorol. 2012, 157, 96–105. [Google Scholar]
  9. Vitasse, Y.; Baumgarten, F.; Zohner, C.M.; Kaewthongrach, R.; Fu, Y.H.; Walde, M.G.; Moser, B. Impact of microclimatic conditions and resource availability on spring and autumn phenology of temperate tree seedlings. New Phytol. 2021, 232, 537–550. [Google Scholar]
  10. Delpierre, N.; Dufrêne, E.; Soudani, K.; Ulrich, E.; Cecchini, S.; Boé, J.; François, C. Modelling interannual and spatial variability of leaf senescence for three deciduous tree species in France. Agric. For. Meteorol. 2009, 149, 938–948. [Google Scholar]
  11. Keenan, T.F.; Richardson, A.D. The timing of autumn senescence is affected by the timing of spring phenology: Implications for predictive models. Glob. Change Biol. 2015, 21, 2634–2641. [Google Scholar] [PubMed]
  12. Gill, A.L.; Gallinat, A.S.; Sanders-DeMott, R.; Rigden, A.J.; Short Gianotti, D.J.; Mantooth, J.A.; Templer, P.H. Changes in autumn senescence in northern hemisphere deciduous trees: A meta-analysis of autumn phenology studies. Ann. Bot. 2015, 116, 875–888. [Google Scholar]
  13. Dufrêne, E.; Davi, H.; François, C.; Maire, G.L.; Dantec, V.L.; Granier, A. Modelling carbon and water cycles in a beech forest. Ecol. Model. 2005, 185, 407–436. [Google Scholar]
  14. Richardson, A.D.; Bailey, A.S.; Denny, E.G.; Martin, C.W.; O’Keefe, J. Phenology of a northern hardwood forest canopy. Glob. Change Biol. 2006, 12, 1174–1188. [Google Scholar]
  15. Yu, R.; Schwartz, M.D.; Donnelly, A.; Liang, L. An observation-based progression modeling approach to spring and autumn deciduous tree phenology. Int J Biometeorol 2016, 60, 335–349. [Google Scholar]
  16. Tao, Z.; Wang, H.; Dai, J.; Alatalo, J.; Ge, Q. Modeling spatiotemporal variations in leaf coloring date of three tree species across China. Agric. For. Meteorol. 2018, 249, 310–318. [Google Scholar]
  17. Ren, S.; Qin, Q.; Ren, H.; Sui, J.; Zhang, Y. New model for simulating autumn phenology of herbaceous plants in the Inner Mongolian Grassland. Agric. For. Meteorol. 2019, 275, 136–145. [Google Scholar]
  18. Wu, C.; Wang, J.; Ciais, P.; Peñuelas, J.; Zhang, X.; Sonnentag, O.; Tian, F.; Wang, X.; Wang, H.; Liu, R.; et al. Widespread decline in winds delayed autumn foliar senescence over high latitudes. Proc. Natl. Acad. Sci. USA 2021, 118, e2015821118. [Google Scholar]
  19. Yuan, Z.; Tong, S.; Bao, G.; Chen, J.; Yin, S.; Li, F.; Sa, C.; Bao, Y. Spatiotemporal variation of autumn phenology responses to preseason drought and temperature in alpine and temperate grasslands in China. Sci. Total. Environ. 2022, 859, 160373. [Google Scholar]
  20. Liu, L.; Zhang, X.; Donnelly, A.; Liu, X. Interannual variations in spring phenology and their response to climate change across the Tibetan Plateau from 1982 to 2013. Int. J. Biometeorol. 2016, 60, 1563–1575. [Google Scholar]
  21. Shen, M.; Wang, S.; Jiang, N.; Sun, J.; Cao, R.; Ling, X.; Fang, B.; Zhang, L.; Zhang, L.; Xu, X.; et al. Plant phenology changes and drivers on the Qinghai–Tibetan Plateau. Nat. Rev. Earth Environ. 2022, 3, 633–651. [Google Scholar] [CrossRef]
  22. Zhu, W.; Jiang, N.; Chen, G.; Zhang, D.; Zheng, Z.; Fan, D. Divergent shifts and responses of plant autumn phenology to climate change on the Qinghai-Tibetan Plateau. Agric. For. Meteorol. 2017, 239, 166–175. [Google Scholar] [CrossRef]
  23. Mu, S.; Li, J.; Chen, Y.; Gang, C.; Zhou, W.; Ju, W. Spatial Differences of Variations of Vegetation Coverage in Inner Mongolia during 2001–2010. Acta Geogr. Sin. 2012, 67, 1255–1268. [Google Scholar]
  24. Kong, D.; Zhang, Q. Seasonal vegetation response to climate change in the Northern Hemisphere (1982–2013). Glob. Planet. Change 2017, 148, 1–8. [Google Scholar] [CrossRef]
  25. Wang, H.; Liu, D.; Lin, H.; Montenegro, A.; Zhu, X. NDVI and vegetation phenology dynamics under the influence of sunshine duration on the Tibetan plateau. Int. J. Climatol. 2014, 35, 687–698. [Google Scholar] [CrossRef]
  26. Zhang, B.; Cui, L.; Shi, J.; Wei, P. Vegetation Dynamics and Their Response to Climatic Variability in China. Adv. Meteorol. 2017, 2017, 1–10. [Google Scholar] [CrossRef]
  27. Pinzon, J.; Tucker, C. A Non-Stationary 1981–2012 AVHRR NDVI3g Time Series. Remote Sens. 2014, 6, 6929–6960. [Google Scholar] [CrossRef]
  28. Tucker, C.J.; Pinzon, J.E.; Brown, M.E.; Slayback, D.A.; Pak, E.W.; Mahoney, R.; Vermote, E.F.; El Saleous, N. An extended AVHRR 8-km NDVI dataset compatible with MODIS and SPOT vegetation NDVI data. Int. J. Remote Sens. 2005, 26, 4485–4498. [Google Scholar] [CrossRef]
  29. Zhang, X.; Friedl, M.A.; Schaaf, C.B.; Strahler, A.H.; Hodges, J.C.F.; Feng, G.; Reed, B.C.; Huete, A. Monitoring vegetation phenology by MODIS. Remote Sens. Environ. 2003, 84, 471–475. [Google Scholar] [CrossRef]
  30. Yuan, Z.; Bao, G.; Dorjsuren, A.; Oyont, A.; Chen, J.; Li, F.; Dong, G.; Guo, E.; Shao, C.; Du, L. Climatic Constraints of Spring Phenology and Its Variability on the Mongolian Plateau From 1982 to 2021. J. Geophys. Res. Biogeosciences 2024, 129, e2023JG007689. [Google Scholar] [CrossRef]
  31. Bao, G.; Bao, Y.; Sanjjava, A.; Qin, Z.; Zhou, Y.; Xu, G. NDVI-indicated long-term vegetation dynamics in Mongolia and their response to climate change at biome scale. Int. J. Climatol. 2015, 35, 4293–4306. [Google Scholar]
  32. Bao, G.; Qin, Z.; Bao, Y.; Zhou, Y.; Li, W.; Sanjjav, A. NDVI-Based Long-Term Vegetation Dynamics and Its Response to Climatic Change in the Mongolian Plateau. Remote Sens. 2014, 6, 8337–8358. [Google Scholar] [CrossRef]
  33. Yan, Y.; Xin, Z.; Bai, X.; Zhan, H.; Xi, J.; Xie, J.; Cheng, Y. Analysis of Growing Season Normalized Difference Vegetation Index Variation and Its Influencing Factors on the Mongolian Plateau Based on Google Earth Engine. Plants 2023, 12, 2550. [Google Scholar] [CrossRef] [PubMed]
  34. Bai, J.; Zhang, H.; Sun, R.; Li, X.; Xiao, J.; Wang, Y. Estimation of global GPP from GOME-2 and OCO-2 SIF by considering the dynamic variations of GPP-SIF relationship. Agric. For. Meteorol. 2022, 326, 109180. [Google Scholar]
  35. Bai, Y.; Li, S. Growth peak of vegetation and its response to drought on the Mongolian Plateau. Ecol. Indic. 2022, 141, 109150. [Google Scholar]
  36. An, S.; Zhu, X.; Shen, M.; Wang, Y.; Cao, R.; Chen, X.; Yang, W.; Chen, J.; Tang, Y. Mismatch in elevational shifts between satellite observed vegetation greenness and temperature isolines during 2000–2016 on the Tibetan Plateau. Glob. Change Biol. 2018, 24, 5411–5425. [Google Scholar] [PubMed]
  37. Chen, J.; Jönsson, P.; Tamura, M.; Gu, Z.; Matsushita, B.; Eklundh, L. A simple method for reconstructing a high-quality NDVI time-series data set based on the Savitzky–Golay filter. Remote Sens. Environ. 2004, 91, 332–344. [Google Scholar] [CrossRef]
  38. Jönsson, P.; Eklundh, L. TIMESAT—A program for analyzing time-series of satellite sensor data. Comput. Geosci. 2004, 30, 833–845. [Google Scholar]
  39. Xie, Y.; Wang, X.; Silander, J.A. Deciduous forest responses to temperature, precipitation, and drought imply complex climate change impacts. Proc. Natl. Acad. Sci. USA 2015, 112, 13585–13590. [Google Scholar]
  40. Shen, X.; Liu, B.; Li, G.; Zhou, D. Impact of Climate Change on Temperate and Alpine Grasslands in China during 1982–2006. Adv. Meteorol. 2015, 2015, 180614. [Google Scholar]
  41. Li, Z.; Chen, J.; Chen, Z.; Sha, Z.; Yin, J.; Chen, Z. Quantifying the contributions of climate factors and human activities to variations of net primary productivity in China from 2000 to 2020. Front. Earth Sci. 2023, 11, 1084399. [Google Scholar]
  42. Huang, Z.; Zhou, L.; Chi, Y. Spring phenology rather than climate dominates the trends in peak of growing season in the Northern Hemisphere. Glob. Change Biol. 2023, 29, 4543–4555. [Google Scholar]
  43. Li, G.; Wu, C.; Chen, Y.; Huang, C.; Zhao, Y.; Wang, Y.; Ma, M.; Ding, Z.; Yu, P.; Tang, X. Increasing temperature regulates the advance of peak photosynthesis timing in the boreal ecosystem. Sci. Total. Environ. 2023, 882, 163587. [Google Scholar]
  44. Yang, J.; Xiao, X.; Doughty, R.; Zhao, M.; Zhang, Y.; Köhler, P.; Wu, X.; Frankenberg, C.; Dong, J. TROPOMI SIF reveals large uncertainty in estimating the end of plant growing season from vegetation indices data in the Tibetan Plateau. Remote Sens. Environ. 2022, 280, 113209. [Google Scholar]
  45. Che, M.; Chen, B.; Innes, J.L.; Wang, G.; Dou, X.; Zhou, T.; Zhang, H.; Yan, J.; Xu, G.; Zhao, H. Spatial and temporal variations in the end date of the vegetation growing season throughout the Qinghai–Tibetan Plateau from 1982 to 2011. Agric. For. Meteorol. 2014, 189, 81–90. [Google Scholar]
  46. Cong, N.; Shen, M.; Piao, S.; Chen, X.; An, S.; Yang, W.; Fu, Y.H.; Meng, F.; Wang, T. Little change in heat requirement for vegetation green-up on the Tibetan Plateau over the warming period of 1998–2012. Agric. For. Meteorol. 2017, 232, 650–658. [Google Scholar]
  47. Huang, H.; Xi, G.; Ji, F.; Liu, Y.; Wang, H.; Xie, Y. Spatial and Temporal Variation in Vegetation Cover and Its Response to Topography in the Selinco Region of the Qinghai-Tibet Plateau. Remote Sens. 2023, 15, 4101. [Google Scholar]
  48. Kuang, X.; Jiao, J.J. Review on climate change on the Tibetan Plateau during the last half century. J. Geophys. Res. Atmos. 2016, 121, 3979–4007. [Google Scholar]
  49. Solomon, S.; Qin, D.; Manning, M.; Chen, Z.; Marquis, M.; Avery, K.; Tignor, M.; Miller, H. Climate Change 2007: The Physical Science Basis. In Working Group I Contribution to the Fourth Assessment Report of the IPCC; Cambridge University Press: Cambridge, UK, 2007. [Google Scholar]
  50. Zhuo, G.; Chen, S.; Zhou, B. Spatio-temporal variation of vegetation coverage over the Tibetan Plateau and its responses to climatic factors. Acta Ecol. Sin. 2018, 38, 3208–3218. [Google Scholar]
  51. Liu, Q.; Fu, Y.H.; Zhu, Z.; Liu, Y.; Liu, Z.; Huang, M.; Janssens, I.A.; Piao, S. Delayed autumn phenology in the Northern Hemisphere is related to change in both climate and spring phenology. Glob. Change Biol. 2016, 22, 3702–3711. [Google Scholar] [PubMed]
  52. Shen, X.; Liu, B.; Henderson, M.; Wang, L.; Wu, Z.; Wu, H.; Jiang, M.; Lu, X. Asymmetric effects of daytime and nighttime warming on spring phenology in the temperate grasslands of China. Agric. For. Meteorol. 2018, 259, 240–249. [Google Scholar]
  53. Liu, L.; Liu, L.; Liang, L.; Donnelly, A.; Park, I.; Schwartz, M.D. Effects of elevation on spring phenological sensitivity to temperature in Tibetan Plateau grasslands. Chin. Sci. Bull. 2014, 59, 4856–4863. [Google Scholar]
  54. Piao, S.; Cui, M.; Chen, A.; Wang, X.; Ciais, P.; Liu, J.; Tang, Y. Altitude and temperature dependence of change in the spring vegetation green-up date from 1982 to 2006 in the Qinghai-Xizang Plateau. Agric. For. Meteorol. 2011, 151, 1599–1608. [Google Scholar]
  55. Pepin, N.; Bradley, R.S.; Diaz, H.F.; Baraer, M.; Caceres, E.B.; Forsythe, N.; Fowler, H.; Greenwood, G.; Hashmi, M.Z.; Liu, X.D.; et al. Elevation-dependent warming in mountain regions of the world. Nat. Clim. Change 2015, 5, 424–430. [Google Scholar]
  56. Zu, K.; Wang, Z. Research progress on the elevational distribution of mountain species in response to climate change. Biodivers. Sci. 2022, 30, 21451. [Google Scholar]
  57. Jeong, S.J.; Medvigy, D.; Shevliakova, E.; Malyshev, S. Uncertainties in terrestrial carbon budgets related to spring phenology. J. Geophys. Res. Biogeosci. 2012, 117, G01030. [Google Scholar]
  58. Shen, M.; Piao, S.; Cong, N.; Zhang, G.; Jassens, I.A. Precipitation impacts on vegetation spring phenology on the Tibetan Plateau. Glob. Change Biol. 2015, 21, 3647–3656. [Google Scholar]
  59. Shen, M.; Piao, S.; Jeong, S.-J.; Zhou, L.; Zeng, Z.; Ciais, P.; Chen, D.; Huang, M.; Jin, C.-S.; Li, L.Z.X.; et al. Evaporative cooling over the Tibetan Plateau induced by vegetation growth. Proc. Natl. Acad. Sci. USA 2015, 112, 9299–9304. [Google Scholar]
  60. Huang, K.; Xia, J.; Wang, Y.; Ahlström, A.; Chen, J.; Cook, R.B.; Cui, E.; Fang, Y.; Fisher, J.B.; Huntzinger, D.N.; et al. Enhanced peak growth of global vegetation and its key mechanisms. Nat. Ecol. Evol. 2018, 2, 1897–1905. [Google Scholar]
  61. Fu, Y.H.; Piao, S.; Vitasse, Y.; Zhao, H.; De Boeck, H.J.; Liu, Q.; Yang, H.; Weber, U.; Hänninen, H.; Janssens, I.A. Increased heat requirement for leaf flushing in temperate woody species over 1980–2012: Effects of chilling, precipitation and insolation. Glob. Change Biol. 2015, 21, 2687–2697. [Google Scholar]
  62. Liu, Q.; Fu, Y.H.; Zeng, Z.; Huang, M.; Li, X.; Piao, S. Temperature, precipitation, and insolation effects on autumn vegetation phenology in temperate China. Glob. Change Biol. 2015, 22, 644–655. [Google Scholar] [CrossRef]
  63. Martel, M.C.; Margolis, H.A.; Coursolle, C.; Bigras, F.J.; Heinsch, F.A.; Running, S.W. Decreasing photosynthesis at different spatial scales during the late growing season on a boreal cutover. Tree Physiol. 2005, 25, 689–699. [Google Scholar] [CrossRef]
  64. Wang, K.F.; Bao, G.; Tong, S.Q.; Huang, X.J.; Bao, Y.H.; Ye, Z.G.; Yuan, Z.H. Climate sensitivity of the start of the growing season in spring and the end of the growing season in autumn for vegetation in Inner Mongolia. Acta Prataculturae Sin. 2023, 32, 30–41. [Google Scholar]
  65. Liu, L.; Ji, H.; An, J.; Shi, K.; Ma, J.; Liu, B.; Tang, L.; Cao, W.; Zhu, Y. Response of biomass accumulation in wheat to low-temperature stress at jointing and booting stages. Environ. Exp. Bot. 2019, 157, 46–57. [Google Scholar]
  66. Wang, X.; Wu, C.; Liu, Y.; Peñuelas, J.; Peng, J. Earlier leaf senescence dates are constrained by soil moisture. Glob. Change Biol. 2022, 29, 1557–1573. [Google Scholar] [CrossRef] [PubMed]
  67. Piao, S.; Mohammat, A.; Fang, J.; Cai, Q.; Feng, J. NDVI-based increase in growth of temperate grasslands and its responses to climate changes in China. Glob. Environ. Change 2006, 16, 340–348. [Google Scholar] [CrossRef]
  68. Zeng, H.; Jia, G.; Epstein, H. Recent changes in phenology over the northern high latitudes detected from multi-satellite data. Environ. Res. Lett. 2011, 6, 045508. [Google Scholar] [CrossRef]
  69. Zhang, G.; Dong, J.; Zhou, C.; Xu, X.; Wang, M.; Ouyang, H.; Xiao, X. Increasing cropping intensity in response to climate warming in Tibetan Plateau, China. Field Crops Res. 2013, 142, 36–46. [Google Scholar] [CrossRef]
Figure 1. Geographic location and overview of the Qinghai–Tibetan Plateau study area.
Land 14 00758 g001
Figure 2. The methodology used to identify the peak of the growing season (POS) and end of the growing season (EOS) based on the first derivative of a four-parameter double-logistic function.
Land 14 00758 g002
Figure 3. Spatial patterns of the means of (a) the end of the growing season (EOS) and (b) cooling degree days (CDD) for alpine grassland on the Qinghai–Tibetan Plateau from 1982 to 2022.
Land 14 00758 g003
Figure 4. Variations in cooling degree days (CDD) and the percentage of pixels with changes in (a) elevation, (b) annual mean temperature, (c) annual mean precipitation, and (d) vegetation types on the Qinghai–Tibetan Plateau. CDD are represented by a solid black line with solid circles, while the percentage of pixels is shown as a dashed gray line with open circles across all subplots. Error bars indicate the standard deviation (SD) of CDD values within each bin.
Land 14 00758 g004aLand 14 00758 g004b
Figure 5. Interannual variation in cooling degree days (CDD) by vegetation type, 1982–2022. Solid black lines indicate linear trends, and shaded areas represent the 95% confidence intervals. Subplots show CDD for the entire study area (a), meadow (b), steppe (c), shrub (d), and cushion vegetation (e). Regression equations and Pearson correlation coefficients (r) are shown in each panel.
Land 14 00758 g005
Figure 6. Spatial distributions of temporal trends in (a) cooling degree days (CDD) and (b) corresponding significant trends (p < 0.05) from 1982 to 2022 on the Qinghai–Tibetan Plateau.
Land 14 00758 g006
Figure 7. (a) Changes in trends in cooling degree days (CCDs) with altitude on the Qinghai–Tibetan Plateau and (b) annual variation in altitudinal gradients of CDD from 1982 to 2022.
Land 14 00758 g007
Figure 8. Spatial distribution of the relative contributions of (a) minimum temperature (Tmin), (b) maximum temperature (Tmax), (c) precipitation (Pre), and (d) radiation (Rad) to cooling degree day (CDD) variance from 1982 to 2022.
Land 14 00758 g008
Figure 9. Climatic contributions to CDD under different elevation and temperature gradients on the Qinghai–Tibetan Plateau. Subplots show the effects of Tmax and Tmin with elevation (a), Tmax and Tmin with temperature (b), radiation and precipitation with elevation (c), and radiation and precipitation with temperature (d).
Land 14 00758 g009aLand 14 00758 g009b
Disclaimer/Publisher’s Note: The statements, opinions and data contained in all publications are solely those of the individual author(s) and contributor(s) and not of MDPI and/or the editor(s). MDPI and/or the editor(s) disclaim responsibility for any injury to people or property resulting from any ideas, methods, instructions or products referred to in the content.

