Abstract
Land use and land cover (LULC) change is a dynamic process influenced by various factors, including agricultural expansion. In Chile’s Aconcagua Basin, avocado plantations are potentially driving territorial transformations. However, current land cover data lacks the resolution required to accurately assess this impact. Accordingly, our study used advanced geospatial analysis techniques to address this gap. Through a detailed analysis of the spatial and temporal changes, it was determined that the most significant expansion of avocado plantations occurred between 2003 and 2013, with an increase of 402%. This growth primarily took place at the expense of native vegetation, particularly sclerophyllous shrubland, as well as other agricultural lands, near agricultural and urban lands. By 2023, changes in avocado plantation were significantly slower, with minimal alterations in LULC (5%), suggesting a possible influence of drought on small-scale farmers. However, the small loss of avocado plantation was mainly replaced by fruit farm land. Moreover, our findings suggest that while avocado plantations have become larger, more dominant, and more isolated, native vegetation has become more fragmented and reduced in patch size. Based on these results, sustainable land management practices were proposed. These findings provide a crucial foundation for developing sustainable land management strategies that balance agricultural production with environmental sustainability, landscape transformation and the well-being of local communities.
1. Introduction
Agriculture is a crucial activity providing most of the food for the human population although it requires about 38% of the global land surface []. In central Chile, the expansion of agricultural land has occurred at the expense of shrublands between 1975 and 2008 [] raising concerns about forest conservation and land planning. During the subsequent period in the Valparaíso Region, the area of fruit plantations has slightly decreased from 50,865 ha to 46,764 ha [,]. Nevertheless, social environmental conflicts related to orchard plantations remain, particularly concerning avocado plantations [,,]. While one part suggests that they have unsustainably expanded affecting rural communities, biodiversity and ecosystems [,,], others claims that avocado plantation is ecologically sustainable because a higher intrapredial carbon sequestration [,]. That controversy lacks a landscape perspective. Thus, an in-depth analysis of land use and land cover (LULC) change dynamics of avocado plantations is crucial for developing sustainable land management.
LULC provides crucial insights into the complex interactions between terrestrial ecosystem changes and human behavior, revealing the primary drivers and consequences of environmental transformations [,,]. Various factors influence LULC changes, including local needs and environmental sustainability [], making it a key consideration in assessing both global and local dynamics in response to environmental and socioeconomic factors []. As LULC continues to evolve, it has become a critical issue for decision-makers, economists, and scientists in evaluating environmental changes and developing sustainable land management strategies []. LULC maps offer essential data on visible land features, such as orchards, water bodies, forests, urban areas, and agricultural fields, helping to monitor and understand the impact of human and natural activities over time [].
An efficient and widely recognized alternative for mapping and monitoring LULC is the use of remote sensing []. In this context, remote sensing imagery is a viable option for the detection of changes at various spatiotemporal scales, thanks to its high resolution and broad availability []. Despite the significance of remote sensing in long-term change detection analysis, several challenges arise, including the large volume of data, the need to standardize information from multiple sensors, and the demand for fast processing and efficient storage []. In this regard, Google Earth Engine (GEE) offers several advantages []. GEE can be used as a cloud computing platform in conjunction with machine learning algorithms for satellite image analysis []. This platform provides a powerful tool for processing, analyzing, and visualizing large volumes of remote sensing data [,]. Therefore, it can be used for LULC dynamics in Chile.
In Chile, natural vegetation has been continuously decreasing over recent decades [,]. Forests and natural woodland areas have been affected by the expansion of forestry plantations and agricultural lands [,]. While the presence of exotic species has increased mainly in central-southern Chile [,], agricultural land use changes have been observed across much of the country [,]. In particular, orchards and fruit-growing lands have expanded significantly in central Chile, driven by the growth of the export-oriented fruit agroindustry [,]. Since the 1990s, avocado (Persea americana Mill.) exports have increased, leading to an expansion of cultivated areas [,]. Chile is among the world’s top ten avocado producers, with its avocado exports valued at over USD 300 million []. This phenomenon may be affecting the hydrological regime, terrestrial ecosystems—including native vegetation—the water supply for the population, and biodiversity conservation. Thus, it could be driving territorial transformations and landscape patterns and connectivity. A comprehensive understanding of LULC change processes, along with their causes and effects, can help mitigate and manage their impacts and consequences effectively []. Therefore, analyzing the dynamics of avocado plantation as a driver of LULC changes in central Chilean basins is crucial.
In the context of landscape transformation, the application of landscape metrics constitutes a key tool for quantifying and understanding the effects of land use transformations on the structure and functioning of ecosystems []. These metrics allow for the evaluation of fundamental aspects of the landscape, such as the degree of fragmentation, connectivity between patches, and the spatial dominance of certain land use classes, using indicators such as the number of patches (NP), the largest patch index (LPI), the mean patch area, and the Euclidean nearest-neighbor distance (ENN) [,]. Connectivity refers to the ability of organisms to move across a landscape, which is influenced by the landscape’s structure and composition. It plays a vital role in biodiversity conservation and helps mitigate the negative impacts of habitat fragmentation []. In the specific case of the expansion of avocado plantations, the use of these indicators facilitates the detection of patterns of LULC conversion into agricultural areas, enabling the identification of the dispersion or concentration of such patches and, consequently, assessing how landscape integrity and connectivity are altered []. Thus, landscape metrics become an essential component for evaluating the impact of human activities on territorial transformation and for supporting decision-making processes aimed at sustainable development in basins, both in Chile and globally.
Several high-spatial-resolution LULC products (30 × 30 m) obtained from satellite images are available for Chilean territory, such as those developed by the National Forestry Corporation (CONAF, by its Spanish acronym) [], MapBiomass-Chile [], and CLDynamicLandCover from Galleguillos et al. []. However, one of their main limitations is the lack of differentiation between specific fruit species. Instead, they categorize all fruit crops together or classify them under broad agricultural land categories. This makes it challenging to conduct a detailed analysis of fruit crops, particularly avocado plantations. A recent study [] introduced a new database, CR2LUC, which offers a broader range of categories but at a lower spatial resolution. However, in the Aconcagua basin, the largest basin in Chile and the second most productive irrigated valley in the country that belongs to the Valparaíso region, the precision in identifying avocado plantations and some agricultural lands remains limited. In this basin, approximately 60% of fruit production is destined for export [], highlighting the need for studies that examine the spatial and territorial dynamics of avocado plantations, which can be performed with remote sensing.
Considering the need to study avocado plantations, the objective of this research is to evaluate the influence of avocado plantations on LULC changes and the landscape transformations in the Aconcagua basin over the past twenty years (2003–2023). To achieve this, Landsat imagery and the Random Forest classifier within the Google Earth Engine (GEE) platform were utilized. First, a general spatiotemporal analysis of LULC changes was conducted. Second, a detailed assessment of change analysis of avocado and native vegetation lands was carried out. Finally, the effects of avocado plantation and native vegetation changes on landscape transformation patterns were analyzed. This study will provide a crucial foundation for developing sustainable land management strategies that balance agricultural production with environmental sustainability, landscape transformation, and the well-being of local communities.
2. Materials and Methods
2.1. Study Area
The Aconcagua Basin (32°–33° S, 70°–72° W) is located in the Valparaíso Region, Central Chile and covers an area of 7300 km2 (Figure 1a) [,]. The basin is made up of five geomorphological units. These comprise, from east to west, the Andes Range, the pre-range, the transversal cords-transitional basins, the coastal range, and the coastal plains []. Hydrogeological sectors are mostly made up of recent unconsolidated sediments. These are associated with fluvial deposits, alluvial–colluvial deposits, and continental terraces [,]. The Aconcagua River and its tributaries stretch 215 km in length []. In the Aconcagua basin, the climate is subject to high intra- and inter-annual variability [], with mean annual precipitation values of 280 mm/year in the Central Depression and around 620 mm/year in the Principal Cordillera. Based on the Köppen–Geiger classification [], the lower part is characterized by a Mediterranean climate of winter rainfall, coastal influence and long dry season with average temperatures of 14.5° [,]. The interior presents a Mediterranean to semi-arid climate characterized by a warm climate with moderate winter rainfall. High-altitude climate with winter rain and cold tundra climate with winter rain predominate in the upper reaches of the basin []. The area has a great diversity of flora and fauna, with 14 types of vegetation formations, such as Mediterranean sclerophyllous forest, thorny forest and Mediterranean interior thorny scrub [].
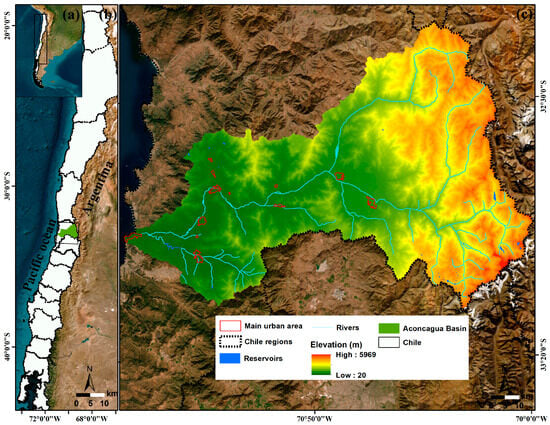
Figure 1.
Location of the Aconcagua basin in Chile. (a) Geographic context in South America; (b) Chilean context; and (c) elevation.
The Aconcagua river basin supports 12% of Chile’s national agricultural, livestock and forestry production and is home to over half a million people []. It is the second most productive irrigated valley in Chile after the Maipo River valley. The main water uses in the Aconcagua basin are agriculture (25.79 m3/s), urban water (2.84 m3/s) and industry (2.63 m3/s) [,].
2.2. Data Sources and LULC Classification Processing
Below is an explanation of the methodology used to generate training and testing data for the supervised classification of land use and land cover (LULC) for the years 2003, 2013, and 2023 using Google Earth Engine (GEE) (Figure 2).
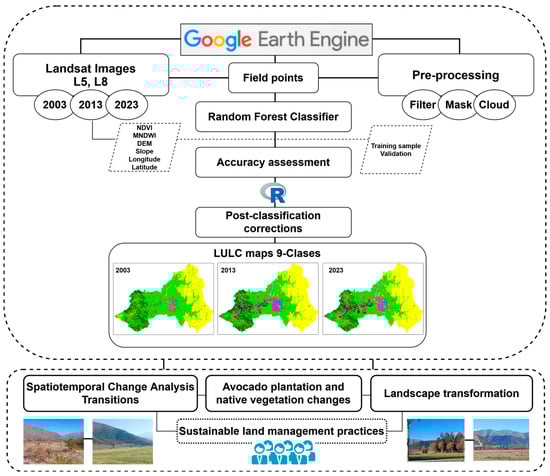
Figure 2.
Methodological flowchart used.
2.2.1. Data Sources and Preprocessing
These years were selected based on a 10-year period to better capture the changes over time. The field work in the basin was carried out in 2023, while 2013 represents a significant reference point, as it was a period of intense megadrought. Ground truth points were acquired through field surveys and photo interpretation, and each point was labeled according to the following classes: water (1), fruit farm land (2), shrublands (3), other agricultural lands (4), avocado land (5), exotic plantations (6), bare soil (7), urban areas (8), and dense vegetation (9). A detailed description of each class can be found in Table 1. The land use classification proposed in this study is based on the nomenclature of Zhao et al. [] and the study by Duran-Llacer et al. [], modified to better fit the scope of this research. The total number of points varied across classes and time periods, with 1428 points collected for both 2023 and 2013, and 1210 points for 2003.

Table 1.
Description of the land use/land cover employed in the investigation.
For each time period analyzed, specific preprocessing steps were applied according to the characteristics of the sensors used. For 2013 and 2023, Landsat 8 imagery was employed. The images were filtered by date, the area of interest, and cloud cover percentage (<10%). For the dates, images from the entire year were considered, with a focus on the dry season. From these images, a median composition was generated to obtain a representative image of the studied period. A cloud-masking function was applied to remove contaminated pixels, and key spectral indices such as the Normalized Difference Vegetation Index (NDVI) [] and the Modified Normalized Difference Water Index (MNDWI) [] were calculated as follows:
where NIR, R, G, SWIR1, are the reflectances in the near infrared (NIR), red, green, and shortwave infrared, respectively.
NDWI = NIR − R/NIR + R,
MNDWI = G – SWIR1/G – SWIR1,
These indices were then appended to the image along with additional topographic variables (derived from a NASADEM [] digital elevation model at 30 m, such as slope) and spatial information (longitude and latitude). The inclusion of these supplementary bands enhanced spectral information, thereby improving the discrimination between different land cover classes. In contrast, for the 2003 period, Landsat 5 imagery was used, which required the application of sensor-specific cloud masking, and the calculation of spectral indices adapted to Landsat 5′s band configuration.
2.2.2. Supervised Classification and Validation
Following the extraction of the predictor variables, the entire dataset was randomly split into training and testing subsets. Stratified sampling was employed by combining various point collections (e.g., water, urban, avocado land, shrublands, etc.) to ensure proportional representation of all classes. Approximately 80% of the samples were designated for training the classifier, while the remaining 20% were reserved for validation purposes []. The random column generation function was used in combination with internal validation methods, including the error matrix and out-of-bag (OOB) calculation []. This random partitioning ensured that the training and testing sets were both representative and independent, thereby enhancing the reliability of the subsequent accuracy assessment. With the training dataset prepared, a Random Forest (RF) classifier was trained []. RF is a classification algorithm that utilizes multiple decision trees to classify pixels, applying a voting mechanism to assign each pixel its final category []. For the 2013 and 2023 datasets, the classifier was configured with 500 trees and a fixed seed to ensure reproducibility. The training was conducted using the spectral bands of each Landsat image per year, the calculated indices, and the additional topographic and spatial variables. For the 2003 dataset, an analogous procedure was followed using the appropriate bands and functions tailored to Landsat 5 imagery.
For 2023, real ground truth points were available, and a model was trained and applied for both 2023 and 2013, as images from both periods were captured by the same sensor (Landsat 8). In contrast, for 2003 (Landsat 5), training points were generated through photointerpretation, while some field points collected in 2023 were retained if they had not undergone coverage changes. This approach allowed for the training of a specific model for 2003, as the model used for 2023 and 2013 could not be directly applied due to being trained with Landsat-8 data.
Once trained, the classifier was applied to the corresponding preprocessed image to generate a classified LULC map in which each pixel was assigned an integer value corresponding to a specific land cover class. The reserved testing dataset was then used to derive accuracy metrics, including overall accuracy [] and the Kappa coefficient []. These performance metrics provided a quantitative assessment of the classifier’s reliability and, by extension, the quality of the LULC change maps produced for the Aconcagua basin.
2.3. LULC Change Detection and Transitions
Land use and land cover change detection was carried out to identify and quantify the transitions between the mapped classes during three distinct periods: 2003–2013, 2013–2023, and 2003–2023. First, reclassified LULC rasters for the beginning and ending years in each interval were stacked, and a custom function was applied to each pixel pair, transforming the 2003 and 2013 values (or 2013 and 2023, etc.) into a single two-digit code. For instance, a pixel labeled as class 2 in 2003 that changed to class 5 in 2013 was coded as “25”. Each of these codes were then interpreted as a unique transition—from no change (e.g., class 2 remaining class 2) to conversions among various land uses (e.g., fruit farm land converting to avocado plantations). This step produced a “change raster”.
To explore transitions quantitatively, the original LULC rasters were also converted into data frames, and frequency tables were generated to tabulate how many pixels underwent each type of conversion. By grouping these data and calculating their associated areas (based on the pixel size), it became possible to determine net gains or losses for each LULC class over time. Several visual outputs were created from these results, including change maps displaying only those pixels where a class shift occurred, bar plots illustrating net area changes, and Sankey diagrams showing more detailed multi-year transitions (2003–2013–2023). These visualizations helped pinpoint which classes (e.g., avocado land, native vegetation = dense vegetation and shrublands, fruit farm land) had the most significant expansions or contractions, and whether these patterns followed the same trajectory across both time intervals or shifted in the later years.
2.4. Change Analysis of Avocado and Native Vegetation Lands
To evaluate changes in avocado orchards (avocado land) and native vegetation between 2003 and 2023, two reclassified LULC rasters were stacked, and each pixel’s 2003 and 2023 classes were combined into a single code (e.g., 35 if a pixel went from class 3 to class 5). By examining these codes, gains and losses of avocado and native vegetation were identified and quantified, highlighting the classes from which avocado or native vegetation expanded—or to which they were converted. Finally, the results were aggregated to produce a net balance of gains and losses and to visualize which classes contributed most to the observed changes.
2.5. Local Landscape Patterns
A local landscape pattern analysis was performed to capture fine-scale differences in spatial configuration between the 2003 and 2023 LULC maps. Specifically, we used the lsp_compare() function from the motif package in R, applying a “cove” signature and the Jensen-Shannon divergence to quantify differences in land cover composition []. Local landscapes were defined as 10 × 10-pixel windows (window = 10), and a threshold of 0.9 was set to highlight areas where spatial dissimilarities were most pronounced. The output is a “distance” raster in which zero represents no local changes, and higher values indicate greater alterations in land cover patterns between 2003 and 2023. This method provides a granular perspective, enabling the identification of specific hotspots of transformation that might otherwise remain undetected in broader-scale analyses. More details can be found in [], and the R package can be downloaded from [].
2.6. Landscape Metrics
To quantify changes in landscape structure over time and under different management practice scenarios, several landscape metrics were calculated for classes 3 (avocado land) and 5 (native vegetation) using the landscapemetrics package in R version 4.4.2 []. Specifically, the Number of Patches, Largest Patch Index, Mean Patch Area, and Mean Euclidean Nearest Neighbor Distance [,] were derived at the class level for the actual LULC maps from 2003, 2013, and 2023, as well as for three scenarios in 2023. A description of each scenario is provided below:
- -
- Scenario 1 (S1): “avocado decrease”. Replacement of the avocado land above 550 m by native vegetation.
- -
- Scenario 2 (S2): “avocado expansion”. A 200 m buffer around existing avocado patches was applied.
- -
- Scenario 3 (S3): “ecological restoration”. Complete replacement of avocado plantations by native vegetation throughout the basin.
The scenarios were selected based on the authors’ local expert criteria and the reviewed literature, with the objective of proposing new management practices focused on ecological efforts and restoration through changes in land use and cover patterns. Thus, S1 considers a decrease in avocado plantation surface, S2 evaluates an extreme scenario of agricultural expansion [,], and S3 represents full ecological restoration with an increase in native vegetation, following the criteria of Leubert and Pliscoff []. By comparing these metrics among historical maps and the three scenarios, we can assess shifts in landscape configuration—such as fragmentation or connectivity—driven by avocado plantation expansion and ecological restoration efforts.
3. Results
3.1. Spatiotemporal Change Analysis
The land use and land cover (LULC) classifications for the years 2003, 2013, and 2023 are shown in Figure 3. Initially, more detailed categories were defined, distinguishing between subcategories of bare soil and fruit crops. However, to avoid class confusion, improve accuracy, and align with the research objectives, a total of nine classes were established. The accuracy of the analysis was good, with overall accuracy (OA) exceeding 78.9% and a Kappa index above 73.3%. In 2003, the indicators were 0.86% and 0.82%, while in 2013 and 2023 they were 0.74% and 0.69%, respectively. Regarding the distribution of land use categories, shrublands, bare soil, and dense vegetation were predominant. The least represented categories included forestry plantations, water bodies, and urban areas. The valleys are primarily dominated by agricultural lands, particularly fruit farm land, avocado plantations, and prairie crop rotation areas. The main changes occurred between 2003 and 2013, with the most significant transformations observed in shrublands, fruit farm land, bare soil, and avocado plantations.
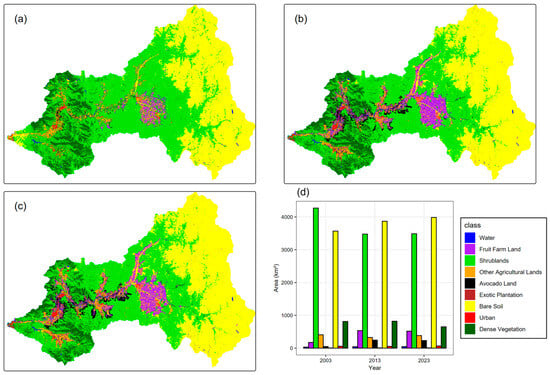
Figure 3.
Land use land cover (LULC) changes in Aconcagua basin by class in (a) 2003, (b) 2013, and (c) 2023. (d) represents the surface area in km2.
The main agricultural changes occurred in the lower and middle parts of the basin, particularly near urban areas, and the avocado plantations expanded towards the hills. In contrast, dense vegetation and shrublands, predominantly characterized by sclerophyllous vegetation, remained relatively stable on high slopes. However, their greatest decrease was observed near agricultural valleys and urban zones (Figure 3).
3.1.1. Net Area Change of LULC
During the study period, shrublands decreased by 793.11 km2 (18.57%) between 2003 and 2013, followed by a slight increase of 0.27% in the subsequent decade (Figure 4 and Figure S1). Similarly, dense vegetation decreased from 812.72 km2 in 2003 to 650.37 km2 in 2023 (19.98%). In contrast, urban areas expanded from 57.85 km2 to 66.14 km2 over the study period, representing an approximate rate of 14.34%. Bare soil areas increased continuously, expanding by 300.49 km2 or 8.42% in the first period and by 115.76 km2 or 2.99% in the second one. Likewise, water class showed a slight increase, as this category includes both natural water bodies and artificial reservoirs. The annual growth rate of forestry plantations was 32.00%, corresponding to an increase of 1.76 km2 between 2003 and 2013, while between 2013 and 2023, the rate declined to 6.47%, representing an expansion of 0.47 km2. The statistical details of these variations can be found in Table S1 in the Supplementary Materials.
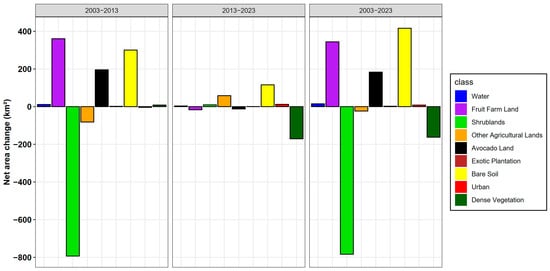
Figure 4.
Net area changes of land use land cover (LULC) in the Aconcagua basin by class between 2003 and 2013 (left), 2013 and 2023 (center), 2003 and 2023 (right).
Fruit farm land and avocado plantations increased only to 2013, after which a slight decrease was observed through 2023. However, the overall increase was substantial: fruit crops increased by 360.74 km2, i.e., an increase rate of 207.30%, while avocado plantations expanded from 48.59 km2 to 244.25 km2, corresponding to an increase of 195.66 km2, equivalent to 402.66% rate. Between 2013 and 2023, the decrease was minimal, with only a 12.30 km2 decrease in surface area. This represents that, proportionally, avocado plantations experienced the highest increase compared to all other land use categories. The highest loss rates were observed in shrublands, dense vegetation, and other agricultural lands. Conversely, the net positive change was recorded in avocado plantations, fruit crops, and bare soil.
3.1.2. LULC Transition and Change Map
Figure 5 shows the transitions across the three periods (2003–2013–2023). Native vegetation was grouped, including the dense vegetation and shrubland classes, and the most representative surfaces were analyzed to better highlight spatial and temporal changes, which especially occurred in farm land. The same figure, but including the original ungrouped classes, can be found in the Supplementary Materials as Figure S2. To enhance the visual interpretation of spatial changes, Figures S3–S5 presents the change maps for the three periods. The period 2003–2023 was analyzed in detail since, as previously observed, the changes between 2013 and 2023 were less noticeable.
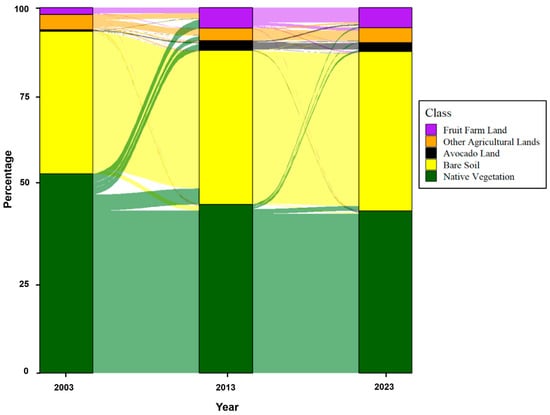
Figure 5.
Sankey plots of LULC transitions between 2003, 2013, and 2023 (%) in the Aconcagua basin.
The main LULC transitions during 2003–2023 occurred from native vegetation to agricultural land and from native vegetation to bare soil. The loss of native vegetation was driven by the expansion of fruit farm land (227.76 km2 or 24.07%). A similar trend was observed in the class of other agricultural lands (187.22 km2 or 19.79%). The total loss of native forest to all agricultural land classes amounted to 596.84 km2 or 63.10%. These transitions were most evident in the lower and middle region of the basin. Conversely, bare soil significantly expanded at the expense of native vegetation, mainly in the upper part of the basin (534.90 km2 or 56.55%). Additionally, fruit farm land gained surface area by replacing other agricultural lands in the central region of the basin (41.34 km2 or 12.00%). The transition matrices can be found in Tables S2–S4, where these data can be consulted.
3.2. Change Analysis of Avocado Plantations and Native Vegetation
To analyze avocado plantations as primary drivers of change, given their potential influence on significant territorial transformations, landscape patterns, and ecosystem loss in the Aconcagua basin, their spatial dynamics were thoroughly examined (Figure 6a). Native vegetation was also included in the analysis, as it is one of the main LULC categories that has experienced significant surface loss across the basin (Figure 6b).
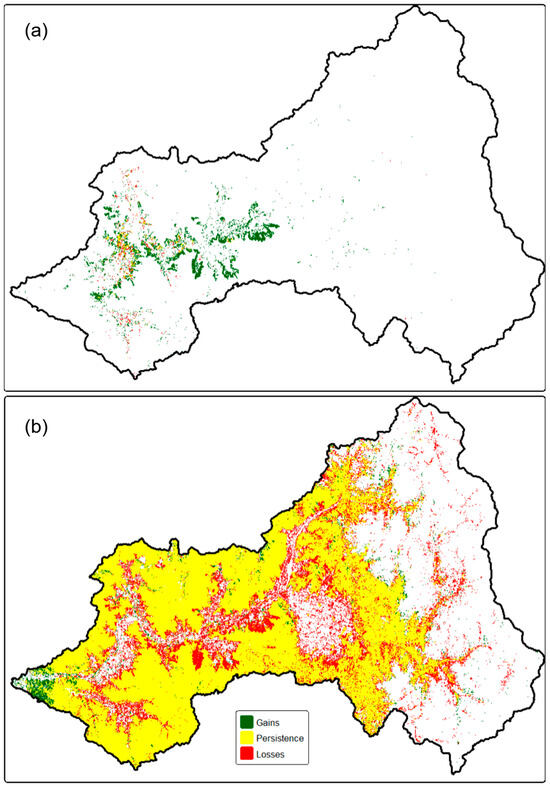
Figure 6.
Gains, persistence and losses of avocado plantation (a) and native vegetation (b) between 2003–2023 in the Aconcagua basin.
In our previous analyses, we confirmed that avocado plantations expanded significantly, increasing by 183.35 km2 or 377.32% between 2003 and 2023. Although a slight decrease of 12.30 km2 occurred between 2013 and 2023 (5%), the most significant changes occurred during the initial period, with a remarkable growth of 402.65% or 195.66 km2. This expansion mainly occurred around agricultural and urban zones, with a notable expansion towards the hills, particularly in areas with medium to high slopes, and predominantly in the middle-low part of the basin.
The LULC class most affected by avocado expansion was native vegetation, which lost 181.86 km2 or 19.23%, as shown in Figure 7 and Table S4. No major expansion was observed in the mid-upper and upper parts of the basin or towards the coastal zone. The impact on these areas was minimal, possibly due to drought conditions or limited resources among small farmers. Another class that decreased due to avocado expansion was other agricultural lands. Notably, within native vegetation, the most affected type was arborescent sclerophyllous shrubland (Figure S6). This category showed low gains, primarily in the lowest areas near the coast. While much of its surface area remained stable, the most significant losses occurred near agricultural lands, cities, and rivers. In general, the small loss in avocado plantation surface was mainly replaced by fruit farm land, and native vegetation (Figure 7 and Tables S3 and S4).
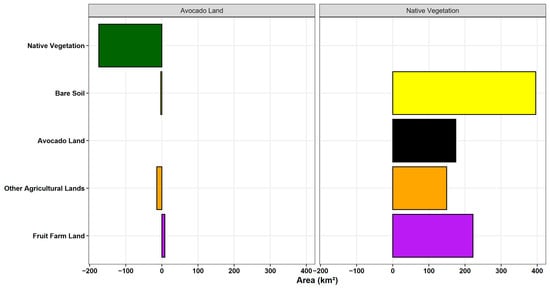
Figure 7.
Contributions to net change between 2003 and 2023 of avocado plantation and native vegetation in the Aconcagua basin.
3.3. Local Landscape Patterns and Metrics Under Land Sustainability Practices
Figure 8 illustrates the changes in local landscape patterns within the study area between 2003 and 2023. This result reinforces the findings obtained, but from a landscape perspective. It is evident that agricultural and urban lands are the primary drivers of local landscape pattern changes. Notably, avocado plantations have played the most important role in these transformations, as indicated by the red-colored areas with values ranging from 0.8 to 1. In contrast, values close to zero represent minimal or no local changes, corresponding to areas of sclerophyllous natural vegetation and bare soil. Therefore, the most critical points of local landscape transformation and the greatest alterations in LULC are driven by the expansion of avocado plantations. Local landscape patterns for the remaining periods are presented in Figures S7 and S8 in the Supplementary Materials.
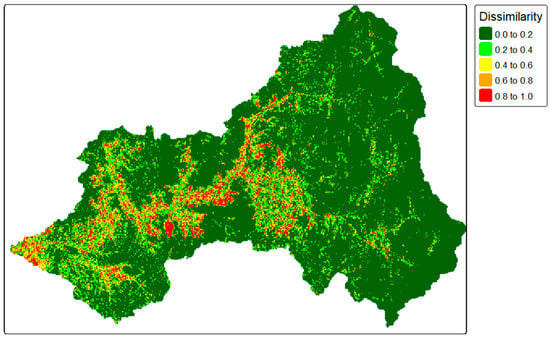
Figure 8.
Local landscape patterns between 2003 and 2023 in the Aconcagua basin.
The landscape metrics analysis for both avocado plantations and native vegetation over the period 2003 to 2023 revealed distinct trends in spatial configuration (Table 2). For avocado lands, the number of patches increased markedly from 2297 in 2003 to 7262 in 2013, before declining to 4823 in 2023—an overall increase of approximately 110% over the two decades. In contrast, native vegetation patches exhibited a more modest rise, from 9273 in 2003 to 11,231 in 2013 and 10,756 in 2023, amounting to a 16% increase.
Table 2.
Changes in landscape pattern indices for the avocado land and the native vegetation in 2003, 2013, and 2023 in the Aconcagua basin.
The Largest Patch Index (LPI) also showed divergent patterns: avocado areas experienced a dramatic escalation from 0.02% in 2003 to 0.23% in 2023 (a 1050% increase), indicating that the largest avocado patch became substantially more dominant over time. Meanwhile, native vegetation saw a reduction in LPI from 51.30% in 2003 to 41.68% in 2023 (an 18.75% decrease), suggesting increased fragmentation of the native vegetation cover.
In terms of mean patch area, avocado plantations expanded from an average of 1.60 ha in 2003 to 3.70 ha in 2023—representing a 131.25% increase—implying that individual avocado patches grew larger. Conversely, the average of native vegetation patches contracted from 42.90 ha in 2003 to 30.10 ha in 2023, a decrease of nearly 30%, which reinforces the notion of a diminishing and more fragmented native landscape.
Finally, the mean Euclidean nearest neighbor distance for avocado patches increased from 113 m in 2003 to 130.20 m in 2023 (a 15.22% rise), indicating growing isolation among avocado patches. In contrast, native vegetation patches experienced a decrease in this metric from 222.50 m in 2003 to 183.50 m in 2023 (a 17.53% reduction), reflecting a trend towards closer proximity among native patches. Collectively, these results indicate that while avocado plantations have become larger, more dominant in the middle–low part of the basin and, and more isolated, native vegetation has become more fragmented and reduced in patch size over the study period.
Three different scenarios were analyzed to quantify changes in landscape structure and, consequently, to identify or propose new management practices based on ecological efforts and restoration (Table 3). Avocado plantations were specifically evaluated, as they have been identified as a major LULC that transforms the landscape and impacts native vegetation, which is among the most affected areas due to the expansion of avocado plantation. The scenarios description was presented in Section 2.6.
Table 3.
Changes in landscape pattern indices for the avocado plantations and the native vegetation in 2023 under three scenarios in the Aconcagua basin.
Based on the 2023 LULC baseline, the simulated scenarios produced contrasting effects on landscape configuration for avocado plantations and native vegetation. In S1, which involves reducing avocado by substituting avocado lands beyond 550 m with native vegetation, the number of avocado patches increased to 3996 accompanied by a very low Largest Patch Index (LPI) of 0.07% and a modest mean patch area of 3.4 hectares. The mean Euclidean nearest neighbor distance for avocado patches was 129.4 m, indicating relatively close proximity among these smaller, more fragmented patches. In contrast, native vegetation in S1 showed an increase to 10,890 patches, with an LPI of 42.3%, a mean patch area of 30.1 ha, and a nearest neighbor distance of 133.9 m, suggesting a widespread yet fragmented cover.
In S2, simulating the expansion of avocado plantations through a 200 m buffer, the landscape configuration shifted markedly. Here, the number of avocado patches dramatically decreased to 475, while the LPI increased substantially to 8.03% and the mean patch area soared to 180.2 ha. This indicates that avocado patches became much larger and more spatially dominant, though also more isolated, as reflected by the increased mean nearest neighbor distance of 615.6 m. Concurrently, native vegetation in S2 decreased to 7817 patches, with an LPI of 37.7%, a slightly larger mean patch area of 37.5 ha, and an increased nearest neighbor distance of 152.0 m, suggesting a reduction in the continuity of the native cover.
Finally, S3 represents an ecological restoration intervention where avocado plantations are entirely replaced by native vegetation. As expected, no metrics were recorded for avocado land under this scenario. Native vegetation, however, achieved 10,896 patches, with an LPI of 44.04%, a mean patch area of 31.4 ha, and a reduced mean nearest neighbor distance of 127.4 m. This configuration implies a more consolidated and potentially less fragmented native vegetation cover compared to S2.
In general, these results demonstrate that management interventions can have profound and divergent impacts on landscape structure. While S2 enhances the dominance and spatial aggregation of avocado plantations, S1 and S3 promote a landscape with more, albeit smaller, native vegetation patches, influencing both the degree of fragmentation and connectivity within the landscape.
4. Discussion
4.1. Assessment of Change Analysis of LULC and Avocado Plantations
A nine-class classification was successfully generated at a 30 m resolution, with emphasis on avocado plantations. Therefore, we proved that a supervised classification with the Random Forest method on the Google Earth Engine (GEE) platform and Landsat images from 2003, 2013, and 2023, allow an in-depth analysis of the influences of avocado plantations on LULC changes in the Aconcagua basin.
Particularly, our geospatial analysis workflow went beyond LULC products for Chile’s Aconcagua basin that do not distinguish specific fruit crops CONAF [] and MapBiomas []. This highlights the significance of the present study, which introduces an updated classification that independently categorizes avocado plantations, fruit farm lands, and other agricultural lands.
The latest LULC update by CONAF dates to 2019 [], and its evaluation report identifies wildfires, land conversion for livestock and agriculture, and urban expansion as the three primary drivers of LULC change. These findings align with the results of this study, which revealed an increase in urban areas, a decrease in shrublands and dense native vegetation, and a substantial expansion of all fruit crops. Wildfires may have played a role in the loss of native vegetation areas, resulting in their conversion to bare soil, which could subsequently transit to agricultural land, as suggested by Zambrano et al. []. However, the results of our study indicate that avocado plantations primarily expanded at the expense of native vegetation, particularly shrublands. MapBiomas provides annual maps from 2000 to 2022. Nevertheless, it is limited to a general agricultural land class. In contrast, the CLDynamicLandCover product by Galleguillos et al. [] represents an advancement as it includes a specific fruit trees class. However, this dataset is only available until 2018, and avocado plantations are not a specific class. A recent product was developed to study long-term land use dynamics: CR2LUC by Boisier et al. [], which describes LULC changes in Chile since 1950. This innovative dataset, with a 1 km spatial resolution, includes specific fruit crop classes, including avocado plantations. Yet, its low spatial resolution limits the precise identification of avocado plantations within the studied basin.
Climate change has significantly influenced land cover changes in central-southern Chile, due to rising temperatures and decreasing precipitation, which have negatively affected the productivity of rainfed crops and grasslands []. This trend suggests that the increase in bare soil observed between 2003 and 2023 may, to some extent, be attributed to decreasing precipitation. The central region has been experiencing a prolonged megadrought [] since before 2010 [], which continues to the present day. In the Aconcagua basin, this has resulted in precipitation deficits of approximately 32.9% [], and this trend is expected to persist in the future. This prolonged drought may have contributed to the slight reduction in avocado plantations between 2013 and 2023 (about 5%), which is consistent with the findings of Bellisario et al. []. Duran-Llacer et al. [] found that in the nearby Petorca basin, some avocado plantations had been abandoned by 2017 due to water stress. The affected parcels were owned primarily by small-scale farmers who lacked the financial resources and infrastructure to adapt to the precipitation deficit. A similar situation may have occurred in the Aconcagua by 2023, where fruit farmland and avocado plantations experienced a decline in farmers’ incomes alongside rising irrigation costs, as reported by Aldunce et al. []. However, according to the results of this study, the small loss of avocado plantation was mainly replaced by fruit farm land and natural vegetation. This suggests that these areas were not entirely lost or converted into bare soil but instead transitioned to fruit farms or less intensive crops, providing a more viable solution for small-scale farmers. Additionally, native vegetation on steep slopes may have regained some of the lost surface area. Despite this, it is evident that avocado plantations expanded significantly, primarily at the expense of native sclerophyllous vegetation and other agricultural lands. Therefore, while the drought may have affected small-scale farmers, its overall impact on avocado production appears to be limited, as large-scale commercial producers dedicated to avocado exports managed to maintain adequate irrigation for their plots and preserve their cultivated area.
It was reaffirmed that the expansion of avocado plantations occurred towards the hills, as documented in previous studies [] and observed in adjacent basins []. However, this study provides highly precise spatial evidence, identifying that the most significant changes were observed around agricultural and urban zones, particularly in areas with medium to high slopes, and predominantly in the middle–lower part of the basin. The municipalities or communes in these areas contain the largest avocado plantation surfaces, as confirmed by the agricultural cadastres of the Natural Resources Information Center (CIREN) []. Although avocado plantations significantly contributed to the loss of native vegetation, they were not the only cause, fruit farms land and other agricultural lands also played a role in this decrease.
As a result of the expansion of avocado plantations, water resources may be increasingly affected, particularly groundwater levels. Similar trends have been observed in other basins within the Valparaíso region, such as La Ligua and Petorca [], where researchers found that areas with the greatest groundwater depletion coincided with those experiencing the highest increase in avocado plantations. According to Taucare et al. [], groundwater levels in the Aconcagua basin have declined by up to 48.68 m below the ground surface (m b.g.s) due to increased water extraction and reduced recharge caused by prolonged drought conditions. These extractions may be directly linked to the expansion of agricultural areas, particularly fruit farm land and avocado plantations, which have grown by 527.49 km2, representing a 575.09% increase. It is important to clarify that the avocado is a subtropical fruit tree that requires a substantial water supply throughout the year for optimal vegetative growth and productivity. In a Mediterranean region, the water requirements to achieve maximum yields for this crop exceed ~7500 m3 ha⁻1 year⁻1 [].
Despite the above claims, the water class in the resulting LULC classification showed a slight increase over the study period. However, it is important to note that this class includes both natural and artificial water bodies. It appears that the infrastructure for agricultural water supply expanded or remained stable in certain areas, despite declining rainfall and groundwater levels. According to Bolados et al. [] and Panez-Pinto et al. [], the Chilean government built several reservoirs to mitigate the effects of the drought. In addition, it is possible that large-scale farmers built their own reservoirs to ensure irrigation supply.
Aldunce et al. [] emphasized that the growing water demand from the agricultural sector has disrupted the natural water cycle. However, this situation is not only the result of drought and agricultural expansion but it is also exacerbated by Chile’s highly unequal system of water rights and distribution [,]. The expansion of avocado plantations in adjacent basins has resulted in the overallocation of both surface and groundwater rights, leading to multiple conflicts concerning the human right to water, agro-industry demands, and illegal groundwater extraction [,]. In Chile, water rights are granted to different users in perpetuity and at no cost, as national legislation defines water as a public good while allowing individuals to acquire rights for its use []. Consequently, water rights have been distributed for years with limited regulatory oversight, contributing to uncontrolled and even illegal water extraction for agricultural purposes []. Although the DGA (General Water Directorate), the institution responsible for granting and monitoring water rights in Chile, has recently introduced several efficient water management measures, past years lacked effective regulatory mechanisms. This may have had serious consequences for water re-sources in the Aconcagua basin.
Our findings related to the loss of native vegetation due to the expansion of avocado plantations was consistent with a previous survey in which respondents reported a per-ceived decline in sclerophyllous forests, the endemic forests of central Chile, known for their high drought resistance []. Similarly, Lavín et al. [] documented this trend, indicating that it also results in habitat loss for pollinators and, consequently, a decline in ecosystem services.
On the other hand, the environmental impacts of increasing avocado plantation have been documented in other Latin American regions. In Mexico, significant environmental consequences have been identified, particularly affecting biodiversity []. This situation is not unfamiliar in Aconcagua []. Despite generating economic benefits such as job creation, social inequality persists, as wealth remains concentrated among large agribusinesses and families involved in the export sector. Additionally, the construction of irrigation channels and roads to adapt land for avocado plantation may have led to high levels of sedimentation in water sources intended for human consumption, as observed in Colombia []. In the state of Michoacán, Mexico, evidence suggests that excessive fertilization in avocado trees, particularly with phosphorus, may be temporarily mitigating soil carbon loss []. Furthermore, Pérez-Solache et al. [] demonstrated that land use conversion to avocado plantations alters soil chemical properties, which in turn affects both the quantity and quality of resources available to herbivorous insects.
In contrast to the previously documented ecological impacts widely reported in the international scientific literature, a 2020 study in Chile [] presented different findings. It reported that avocado plantations create a new internal ecosystem that positively replaces species. Plantations closer to native scrublands show high biodiversity, with an abundance of native species, mitigating the greenhouse effect and facilitating faster soil recovery compared to reforestation. Additionally, it was concluded that avocado plantations could help maintain native ecosystems at risk of degradation. However, further studies are needed to validate these findings, as the negative ecological impacts of avocado plantations have been scientifically proven worldwide.
Regardless of the current controversy surrounding environmental issues related to avocado plantations, certain practices must be followed for planting and cultivation. These include avoiding excessive humidity and low temperatures, as well as ensuring deep, sandy loam or clayey loam soils that are porous and well aerated. Proper plant spacing and soil preparation are crucial for healthy growth. Pruning should be done in three stages to maintain leaf balance, improve light penetration, and facilitate harvesting. A balanced supply of nutrients is vital, especially during spring, when demand is highest. A drip irrigation system is recommended, as is being aware of common diseases affecting the crop [].
4.2. Implications of Changes in Avocado Plantations on Landscape Transformation: Sustainable Land Management Practices
The temporal analysis of landscape metrics reveals contrasting trends between avocado plantations and native vegetation from 2003 to 2023. Avocado areas have shown significant spatial transformation, with a notable increase in the Largest Patch Index (LPI) and mean patch area, suggesting that these plantations have consolidated into larger, more dominant patches over time. The increase in the number of patches from 2297 in 2003 to 4823 in 2023—after peaking in 2013—coupled with a rise in mean Euclidean nearest neighbor distance, indicates a growing spatial isolation among these patches. In contrast, native vegetation exhibited a relatively modest increase in patch count and even experienced declines in both LPI and mean patch area over the same period, reflecting a trend towards fragmentation of and reduction in contiguous natural cover. These divergent dynamics underscore the impact of agricultural expansion, particularly avocado cultivation, on landscape structure and highlight the potential ecological consequences such as altered connectivity and biodiversity loss.
The scenario-based analysis further illustrates how targeted land management strategies can dramatically reshape the landscape. In S1, which simulates a reduction in avocado by substituting areas beyond 550 m with native vegetation, the results indicate an increase in the number of smaller avocado patches, alongside a substantial rise in native vegetation patches. This scenario suggests enhanced fragmentation for both land covers, though with a moderate degree of connectivity maintained. S2, representing an expansion of avocado plantations via a 200 m buffer, leads to a landscape dominated by fewer but much larger and spatially isolated avocado patches, as evidenced by the sharp increase in LPI and mean patch area. Conversely, S3, which models an ecological restoration by replacing avocado with native vegetation, eliminates avocado metrics entirely while producing a more consolidated native vegetation configuration characterized by a high number of patches and an elevated LPI. These outcomes demonstrate that management practices can lead to significant trade-offs, where intensification of avocado plantations may enhance agricultural yield at the expense of ecological connectivity, whereas restoration efforts can strengthen native vegetation but may require balancing socioeconomic considerations. S1 and S3 can therefore be considered as references for sustainable land management practices measures.
A landscape approach in agricultural areas can contribute to sustainable development by balancing conservation and productivity. In this context, modeled scenarios can serve as valuable tools for stakeholders, helping them protect native vegetation while optimizing agriculture. One promising strategy is ecological intensification, an agricultural system designed to mitigate the environmental impacts of intensive farming. However, its widespread adoption faces a major barrier: sustainable agriculture is typically promoted at the farm level rather than across entire landscapes []. Additionally, adopting alternative production models, such as the Community Model of Avocado Production (CMAP) in Zitácuaro, Mexico, could be beneficial. CMAP prioritizes local labor, enabling communities to retain land ownership and directly manage land use and cultivation decisions. As a governance framework, it limits external intervention, safeguards local institutions and cultural values, and enhances livelihood security for its members []. Implementing a similar model in Aconcagua could strengthen small farmers’ protection and promote sustainable land use practices in avocado plantations.
Prioritizing the conservation of native vegetation or adopting biodiversity-friendly practices can help mitigate the effects of agricultural expansion on wild pollinators Lavín et al. []. It is important to establish scientific and political agreements between academic and government agencies and effective regulations that guarantee adequate water resources management []. Also, more efficient irrigation systems could improve water availability and reduce the impacts of agricultural expansion [], including horizontal sprinkler, surface drip, and subsurface drip, which have been applied in Egypt []. The development of smart irrigation control and scheduling technologies, combined with water-saving strategies like agricultural water pricing reforms, plays a crucial role in advancing precision irrigation []. A possible crop adaptation strategy for arid environments could involve introducing crops that are better suited to the region’s evolving ecological conditions []. One such example is the prickly pear Opuntia a native plant of arid and semi-arid regions. Its unique adaptation mechanisms allow it to thrive in harsh climatic conditions, while also offering high nutritional value and being rich in value-added compounds [,]. In addition, it is essential to implement measures to monitor and regulate nutrient use in avocado plantations, given the possible chemical alterations of the soil, ensuring the protection of both soil and water resources [].
5. Conclusions
This study assesses the impact of avocado plantations on LULC changes within the Aconcagua basin using advanced geospatial analysis techniques in Google Earth Engine. The most significant LULC changes occurred between 2003 and 2013, with avocado plantations undergoing the most substantial transformations, followed by native vegetation, such as sclerophyllous shrublands, as well as fruit farm land and bare soil.
The LULC that experienced the greatest loss due to the expansion of avocado plantations were native vegetation and other agricultural lands. By 2023, the rate of change in avocado plantations had slightly decreased, possibly indicating the impact of drought on small-scale farmers. However, the transition was primarily toward fruit farm land, suggesting that alternative measures were taken to cope with the drought. This expansion mainly occurred around agricultural and urban zones, with a notable expansion towards the hills, particularly in areas with medium to high slopes, and predominantly in the middle-low part of the basin. In contrast, native vegetation remained relatively stable on high slopes and their greatest decrease was observed near agricultural valleys and urban zones.
The analysis of local landscape patterns and some landscape metrics revealed that the expansion of avocado plantations is the primary driver of the most critical local landscape transformations and the greatest alterations in LULC. Additionally, the metrics indicate that while avocado plantations have become larger, more dominant, and more isolated, native vegetation has become increasingly fragmented and has decreased in patch size. Based on these findings, three different future scenarios were analyzed to quantify changes in landscape structure and, consequently, to identify or propose new management practices based on ecological efforts and restoration. This analysis demonstrated that a portion of avocado plantations could be replaced with native forest, promoting a landscape with more, but smaller, native vegetation patches. This, in turn, influences both the degree of fragmentation and connectivity within the landscape. In addition, some management practices were proposed for the Aconcagua basin. Further research is needed to evaluate the impact of avocado plantations on landscape patterns, as well as to investigate water demand, evapotranspiration, carbon storage, soil chemistry, and related social challenges. These findings serve as a crucial foundation for developing sustainable land management practices that balance agricultural production with environmental conservation, landscape dynamics, and community well-being.
Supplementary Materials
The following supporting information can be downloaded at: https://www.mdpi.com/article/10.3390/land14040750/s1.
Author Contributions
Conceptualization, I.D.-L.; methodology, I.D.-L. and A.A.S.; software, I.D.-L. and A.A.S.; validation, I.D.-L. and A.A.S.; formal analysis, I.D.-L., A.A.S. and P.M.; investigation, I.D.-L., A.A.S. and F.L.; resources, I.D.-L.; writing—original draft preparation, I.D.-L. and A.A.S.; writing—review and editing, I.D.-L., A.A.S., P.M., R.M.-R., F.F., L.R.-L. and F.Z.; visualization, I.D.-L., A.A.S., P.M., L.R.-L., R.M.-R. and F.Z.; project administration, I.D.-L. and F.Z.; funding acquisition I.D.-L., L.R.-L., F.Z. and F.F. All authors have read and agreed to the published version of the manuscript.
Funding
This research was funded by the National Agency for Research and Development of Chilean Government ANID, Fondecyt Postdoctorado N° 3230678.
Data Availability Statement
Codes and data are available through communication with the authors.
Acknowledgments
Iongel Duran-Llacer is grateful for the National Agency for Research and Development of Chilean Government ANID, Fondecyt Postdoctorado N°3230678 and Hémera Centro de Observación de la Tierra, Universidad Mayor.
Conflicts of Interest
Author Andrés A. Salazar is the founder and owner of the company Boreal Austral. The remaining authors declare that the research was conducted in the absence of any commercial or financial relationships that could be construed as a potential conflict of interest.
References
- Food and Agriculture Organization of the United Nations. The State of Food and Agriculture 2020. Overcoming Water Challenges in Agriculture; FAO: Rome, Italy, 2020. [Google Scholar] [CrossRef]
- Schulz, J.J.; Cayuela, L.; Echeverria, C.; Salas, J.; Rey Benayas, J.M. Monitoring Land Cover Change of the Dryland Forest Landscape of Central Chile (1975-2008). Appl. Geogr. 2010, 30, 436–447. [Google Scholar] [CrossRef]
- CIREN. Centro de Información de Recursos Naturales. Catastro Frutícola 2008. Región de Valparaíso; CIREN: Santiago, Chile, 2008; Available online: https://bibliotecadigital.ciren.cl/items/deeda92d-495c-4bb1-b380-a3a08ec6adbb/ (accessed on 7 July 2024).
- CIREN. Centro de Información de Recursos Naturales. Catastro Frutícola 2023. Región de Valparaíso; CIREN: Santiago, Chile, 2023; Available online: https://bibliotecadigital.ciren.cl/items/c7fdd7a6-0c40-4b77-bb9a-3ed733cfe2fa (accessed on 7 July 2024).
- Youlton, C.; Espejo, P.; Biggs, J.; Norambuena, M.; Cisternas, M.; Neaman, A.; Salgado, E. Quantification and Control of Runoff and Soil Erosion on Avocado Orchards on Ridges along Steep-Hillslopes. Cienc. Investig. Agrar. 2010, 37, 113–123. [Google Scholar] [CrossRef]
- Magrach, A.; Sanz, M.J. Environmental and Social Consequences of the Increase in the Demand for ‘Superfoods’ World-Wide. People Nat. 2020, 2, 267–278. [Google Scholar] [CrossRef]
- Berasaluce, M.; Díaz-Siefer, P.; Rodríguez-Díaz, P.; Mena-Carrasco, M.; Ibarra, J.T.; Celis-Diez, J.L.; Mondaca, P. Social-Environmental Conflicts in Chile: Is There Any Potential for an Ecological Constitution? Sustainability 2021, 13, 12701. [Google Scholar] [CrossRef]
- Lavín, U.; Martinez-Harms, M.J.; Celis-Diez, J.L.; Francois, J.P.; Aguirre, Y.; Martínez-Harms, J. Modelling Pollination Maps in Agroecosystems of a Chilean Biodiversity Hotspot. Ecosyst. People 2024, 20, 2358471. [Google Scholar] [CrossRef]
- Latorre-Cárdenas, M.C.; González-Rodríguez, A.; Godínez-Gómez, O.; Arima, E.Y.; Young, K.R.; Denvir, A.; García-Oliva, F.; Ghilardi, A. Estimating Fragmentation and Connectivity Patterns of the Temperate Forest in an Avocado-Dominated Landscape to Propose Conservation Strategies. Land 2023, 12, 631. [Google Scholar] [CrossRef]
- Pérez-Solache, A.; Vaca-Sánchez, M.S.; Maldonado-López, Y.; De Faria, M.L.; Borges, M.A.Z.; Fagundes, M.; Oyama, K.; Méndez-Solórzano, M.I.; Aguilar-Peralta, J.S.; Hernández-Guzmán, R.; et al. Changes in Land Use of Temperate Forests Associated to Avocado Production in Mexico: Impacts on Soil Properties, Plant Traits and Insect-Plant Interactions. Agric. Syst. 2023, 204, 103556. [Google Scholar] [CrossRef]
- CAZALAC. Centro del Agua para Zonas Áridas y Semiáridas de América Latina y el Caribe. Estado Del Arte Ambiental de Plantaciones de Persea Americana Mill En Chile. 2020. Available online: https://www.cazalac.org/wp-content/uploads/2023/06/Cazalac_Estudio_12-09.pdf (accessed on 5 January 2025).
- Redagrícola. Sustentabilidad del palto en Chile. Available online: https://redagricola.com/sustentabilidad-del-palto-en-chile/ (accessed on 4 January 2025).
- Muhammad, R.; Zhang, W.; Abbas, Z.; Guo, F.; Gwiazdzinski, L. Spatiotemporal Change Analysis and Prediction of Future Land Use and Land Cover Changes Using QGIS MOLUSCE Plugin and Remote Sensing Big Data: A Case Study of Linyi, China. Land 2022, 11, 419. [Google Scholar] [CrossRef]
- Feng, S.; Li, W.; Xu, J.; Liang, T.; Ma, X.; Wang, W.; Yu, H. Land Use/Land Cover Mapping Based on GEE for the Monitoring of Changes in Ecosystem Types in the Upper Yellow River Basin over the Tibetan Plateau. Remote Sens. 2022, 14, 5361. [Google Scholar] [CrossRef]
- Salazar, A.A.; Arellano, E.C.; Muñoz-sáez, A.; Miranda, M.D.; da Silva, F.O.; Zielonka, N.B.; Crowther, L.P.; Silva-ferreira, V.; Oliveira-reboucas, P.; Dicks, L.V. Restoration and Conservation of Priority Areas of Caatinga’s Semi-arid Forest Remnants Can Support Connectivity within an Agricultural Landscape. Land 2021, 10, 550. [Google Scholar] [CrossRef]
- Feizizadeh, B.; Omarzadeh, D.; Kazemi Garajeh, M.; Lakes, T.; Blaschke, T. Machine Learning Data-Driven Approaches for Land Use/Cover Mapping and Trend Analysis Using Google Earth Engine. J. Environ. Plan. Manag. 2023, 66, 665–697. [Google Scholar] [CrossRef]
- Hussain, S.; Mubeen, M.; Nasim, W.; Mumtaz, F.; Abdo, H.G.; Mostafazadeh, R.; Fahad, S. Assessment of Future Prediction of Urban Growth and Climate Change in District Multan, Pakistan Using CA-Markov Method. Urban Clim. 2024, 53, 101766. [Google Scholar] [CrossRef]
- Qacami, M.; Khattabi, A.; Lahssini, S.; Rifai, N.; Meliho, M. Land-Cover/Land-Use Change Dynamics Modeling Based on Land Change Modeler. Ann. Reg. Sci. 2023, 70, 237–258. [Google Scholar] [CrossRef]
- Inglada, J.; Vincent, A.; Arias, M.; Tardy, B.; Morin, D.; Rodes, I. Operational High Resolution Land Cover Map Production at the Country Scale Using Satellite Image Time Series. Remote Sens. 2017, 9, 95. [Google Scholar] [CrossRef]
- Kadri, N.; Jebari, S.; Augusseau, X.; Mahdhi, N.; Lestrelin, G.; Berndtsson, R. Analysis of Four Decades of Land Use and Land Cover Change in Semiarid Tunisia Using Google Earth Engine. Remote Sens. 2023, 15, 3257. [Google Scholar] [CrossRef]
- Lasaponara, R.; Abate, N.; Fattore, C.; Aromando, A.; Cardettini, G.; Di Fonzo, M. On the Use of Sentinel-2 NDVI Time Series and Google Earth Engine to Detect Land-Use/Land-Cover Changes in Fire-Affected Areas. Remote Sens. 2022, 14, 4723. [Google Scholar] [CrossRef]
- Gorelick, N.; Hancher, M.; Dixon, M.; Ilyushchenko, S.; Thau, D.; Moore, R. Google Earth Engine: Planetary-Scale Geospatial Analysis for Everyone. Remote Sens. Environ. 2017, 202, 18–27. [Google Scholar] [CrossRef]
- Duran-Llacer, I.; Munizaga, J.; Arumí, J.L.; Ruybal, C.; Aguayo, M.; Sáez-Carrillo, K.; Arriagada, L.; Rojas, O. Lessons to Be Learned: Groundwater Depletion in Chile’s Ligua and Petorca Watersheds through an Interdisciplinary Approach. Water 2020, 12, 2446. [Google Scholar] [CrossRef]
- del Pozo, A.; Catenacci-Aguilera, G.; Acosta-Gallo, B. Consequences of Land Use Changes on Native Forest and Agricultural Areas in Central-Southern Chile during the Last Fifty Years. Land 2024, 13, 610. [Google Scholar] [CrossRef]
- Martin-Gallego, P.; Marston, C.G.; Altamirano, A.; Pauchard, A.; Aplin, P. Mapping Alien and Native Forest Dynamics in Chile Using Earth Observation Time Series Analysis. For. Ecol. Manag. 2024, 560, 121847. [Google Scholar] [CrossRef]
- Miranda, A.; Altamirano, A.; Cayuela, L.; Lara, A.; González, M. Native Forest Loss in the Chilean Biodiversity Hotspot: Revealing the Evidence. Reg. Environ. Change 2017, 17, 285–297. [Google Scholar] [CrossRef]
- Martínez-Retureta, R.; Aguayo, M.; Abreu, N.J.; Urrutia, R.; Echeverría, C.; Lagos, O.; Rodríguez-López, L.; Duran-Llacer, I.; Barra, R.O. Influence of Climate and Land Cover/Use Change on Water Balance: An Approach to Individual and Combined Effects. Water 2022, 14, 2304. [Google Scholar] [CrossRef]
- Martínez-Retureta, R.; Aguayo, M.; Abreu, N.J.; Stehr, A.; Duran-Llacer, I.; Rodríguez-López, L.; Sauvage, S.; Sánchez-Pérez, J.M. Estimation of the Climate Change Impact on the Hydrological Balance in Basins of South-Central Chile. Water 2021, 13, 794. [Google Scholar] [CrossRef]
- Bellisario, A.; Janke, J. Assessing the Impacts of a Multi-Year Drought on Water Resources and Agriculture in the Aconcagua River Basin of Chile. Investig. Geográficas 2024, 67, 72–94. [Google Scholar] [CrossRef]
- Panez-Pinto, A.; Mansilla-Quiñones, P.; Moreira-Muñoz, A. Agua, Tierra y Fractura Sociometabólica Del Agronegocio. Bitacora 2018, 28, 153–160. [Google Scholar] [CrossRef]
- Roose, I.; Panez, A. Social Innovations as A Response to Dispossession: Community Water Management in View of Socio-Metabolic Rift in Chile. Water 2020, 12, 566. [Google Scholar] [CrossRef]
- Benavidez-Silva, C.; Jensen, M.; Pliscoff, P. Future Scenarios for Land Use in Chile: Identifying Drivers of Change and Impacts over Protected Area System. Land 2021, 10, 408. [Google Scholar] [CrossRef]
- Jiang, C.; Du, X.; Cai, J.; Li, H.; Chen, Q. Study on the Evolution and Prediction of Land Use and Landscape Patterns in the Jianmen Shu Road Heritage Area. Land 2024, 13, 2165. [Google Scholar] [CrossRef]
- Hernández, A.; Miranda, M.; Arellano, E.C.; Saura, S.; Ovalle, C. Landscape Dynamics and Their Effect on the Functional Connectivityof a Mediterranean Landscape in Chile. Ecol. Indic. 2015, 48, 198–206. [Google Scholar] [CrossRef]
- CONAF. Corporación Forestal Nacional. Actualización Del Catastro De Los Recursos Vegetacionales De La Región De Valparaíso Año 2019; CONAF: Santiago, Chile, 2019. [Google Scholar]
- MapBiomas. Colección 1 [2024] de la Serie Anual de Mapas de Cobertura y Uso del Suelo de Chile. Available online: https://chile.mapbiomas.org/ (accessed on 12 August 2024).
- Galleguillos, M.; Ceballos-Comisso, A.; Gimeno, F.; Zambrano-Bigiarini, M. CLDynamicLandCover [Dataset]. Zenodo 2024. [Google Scholar] [CrossRef]
- Boisier, J.P.; Alvarez-garreton, C.; Marinao, R.; Galleguillos, M. Increasing Water Stress in Chile Evidenced by Novel Datasets of Water Availability, Land Use and Water Use. EGUsphere 2024, 1–50. [Google Scholar] [CrossRef]
- Taucare, M.; Viguier, B.; Figueroa, R.; Daniele, L. The Alarming State of Central Chile’s Groundwater Resources: A Paradigmatic Case of a Lasting Overexploitation. Sci. Total Environ. 2024, 906, 167723. [Google Scholar] [CrossRef] [PubMed]
- Webb, M.J.; Winter, J.M.; Spera, S.A.; Chipman, J.W.; Osterberg, E.C. Water, Agriculture, and Climate Dynamics in Central Chile’s Aconcagua River Basin. Phys. Geogr. 2021, 42, 395–415. [Google Scholar] [CrossRef]
- Aliaga-Alvarado, M.; Gómez-Escalonilla, V.; Martínez-Santos, P. Identification of Non-Conventional Groundwater Resources by Means of Machine Learning in the Aconcagua Basin, Chile. J. Hydrol. Reg. Stud. 2023, 49, 101502. [Google Scholar] [CrossRef]
- DGA. Dirección General de Aguas. Proyecto Actualización de La Modelación Hidrogeológica Integrada Del Aconcagua No 446. Dirección General de Aguas División de Estudios y Planificación, Realizado Por Wsp Consulting Chile. S.I.T. No 446. 2019. Available online: https://repositoriodirplan.mop.gob.cl/biblioteca/items/390cf4e5-f5e8-462c-9123-6c70782ca2b7/full (accessed on 7 July 2024).
- Köppen, W. Klassifikation Der Klimate Nach Temperatur, Niederschlag Und Jahreslauf. Petermanns Geogr. Mitt. 1918, 64, 193–203. [Google Scholar]
- Duran-Llacer, I.; Zambrano, F.; Rodríguez-López, L.; Martínez-Retureta, R.; Arumí, J.L. Analysis of Drought in Agriculture and Natural Vegetation Areas in Central Chile. In Proceedings of the IGARSS 2024—2024 IEEE International Geoscience and Remote Sensing Symposium, Athens, Greece, 7–12 July 2024; pp. 3643–3646. [Google Scholar] [CrossRef]
- Crespo, S.A.; Lavergne, C.; Fernandoy, F.; Muñoz, A.A.; Cara, L.; Olfos-Vargas, S. Where Does the Chilean Aconcagua River Come from? Use of Natural Tracers for Water Genesis Characterization in Glacial and Periglacial Environments. Water 2020, 12, 2630. [Google Scholar] [CrossRef]
- DGA. Dirección General de Aguas. Plan Estratégico de Gestión Hídrica En La Cuenca de Aconcagua. Dirección General de Aguas, División de Estudios y Planificación, Realizado Por UTP Hídrica-Eridanus. S.I.T. No 464. 2020. Available online: https://repositoriodirplan.mop.gob.cl/biblioteca/items/1bb23582-1c34-4d30-940b-7c04b38b6753/full (accessed on 11 July 2024).
- Janke, J.R.; Ng, S.; Bellisario, A. An Inventory and Estimate of Water Stored in Firn Fields, Glaciers, Debris-Covered Glaciers, and Rock Glaciers in the Aconcagua River Basin, Chile. Geomorphology 2017, 296, 142–152. [Google Scholar] [CrossRef]
- Zhao, Y.; Feng, D.; Yu, L.; Wang, X.; Chen, Y.; Bai, Y.; Hernández, H.J.; Galleguillos, M.; Estades, C.; Biging, G.S.; et al. Detailed Dynamic Land Cover Mapping of Chile: Accuracy Improvement by Integrating Multi-Temporal Data. Remote Sens. Environ. 2016, 183, 170–185. [Google Scholar] [CrossRef]
- Rouse, J.; Haas, R.; Scheel, J.; Eering, D.W. Monitoring Vegetation Systems in the Great Plains with ERTS. In Proceedings of the 3rd Earth Resources Technology Satellite Symposium, Washington, DC, USA, 10–14 December 1973; 1976; Volume 1, pp. 48–62. [Google Scholar]
- Xu, H. Modification of Normalised Difference Water Index (NDWI) to Enhance Open Water Features in Remotely Sensed Imagery. Int. J. Remote Sens. 2006, 27, 3025–3033. [Google Scholar] [CrossRef]
- NASA-JPL. NASADEM: NASA NASADEM Digital Elevation 30m. NASADEM Merged DEM Global 1 arc second V001. DAAC de procesos terrestres del EOSDIS de la NASA. Available online. Available online: https://lpdaac.usgs.gov/products/nasadem_hgtv001/ (accessed on 12 August 2024).
- Breiman, L. RFRSF: Employee Turnover Prediction Based on Random Forests and Survival Analysis. Mach. Learn. 2001, 45, 5–32. [Google Scholar] [CrossRef]
- Story, M.; Congalton, R.G. Accuracy Assessment: A User’s Perspective. Remote Sens. Br. 1986, 52, 397–399. [Google Scholar]
- Cohen, J. A Coefficient of Agreement for Nominal Scales. Educ. Psychol. Meas. 1960, 20, 37–46. [Google Scholar] [CrossRef]
- Nowosad, J. Motif: An Open-Source R Tool for Pattern-Based Spatial Analysis. Landsc. Ecol. 2021, 36, 29–43. [Google Scholar] [CrossRef]
- Nowosad, J. Motif: An Open-Source R Tool for Pattern-Based Spatial Analysis, version 0.6.4; R Foundation for Statistical Computing: Vienna, Austria, 2021. [Google Scholar]
- Hesselbarth, M.H.K.; Sciaini, M.; With, K.A.; Wiegand, K.; Nowosad, J. Landscapemetrics: An Open-Source R Tool to Calculate Landscape Metrics. Ecography 2019, 42, 1648–1657. [Google Scholar] [CrossRef]
- Oficina de Estudios y Políticas Agrarias. ODEPA. Agricultura Chilena: Reflexiones y Desafíos Al 2030; ODEPA: Santiago, Chile, 2017. [Google Scholar]
- Teklay, A.; Dile, Y.T.; Asfaw, D.H.; Bayabil, H.K.; Sisay, K. Impacts of Climate and Land Use Change on Hydrological Response in Gumara Watershed, Ethiopia. Ecohydrol. Hydrobiol. 2021, 21, 315–332. [Google Scholar] [CrossRef]
- Leubert, F.; Pliscoff, P. Sinopsis Bioclimática y Vegetacional de Chile, 2nd ed.; Universitaria: Santiago, Chile, 2018. [Google Scholar]
- Zambrano, F.; Vrieling, A.; Meza, F.; Duran-Llacer, I.; Fernández, F.; Venegas-González, A.; Raab, N.; Craven, D. Shifts in Water Supply and Demand Drive Land Cover Change across Chile. Eartharxiv Repos. 2025. [Google Scholar] [CrossRef]
- Garreaud, R.; Alvarez-Garreton, C.; Barichivich, J.; Boisier, J.P.; Christie, D.; Galleguillos, M.; Lequesne, C.; Mcphee, J.; Zambrano-5 Bigiarini, M. The 2010-2015 Mega Drought in Central Chile: Impacts on Regional Hydroclimate and Vegetation. Hydrol. Earth Syst. Sci. Discuss 2017, 21, 6307–6327. [Google Scholar] [CrossRef]
- Aldunce, P.; Haverbeck, F.; Sapiains, R.; Quilaqueo, A.; Castro, C.P. Public Perception of Drought and Extreme Rainfall Impacts in a Changing Climate: Aconcagua Valley and Chañaral, Chile. Sustainability 2024, 16, 7916. [Google Scholar] [CrossRef]
- Moreno-Ortega, G.; Pliego, C.; Sarmiento, D.; Barceló, A.; Martínez-Ferri, E. Yield and Fruit Quality of Avocado Trees under Different Regimes of Water Supply in the Subtropical Coast of Spain. Agric. Water Manag. 2019, 221, 192–201. [Google Scholar] [CrossRef]
- Bolados García, P.; Henríquez Olguín, F.; Ceruti Mahn, C.; Sánchez Cuevas, A. La Eco-Geo-Política Del Agua: Una Propuesta Desde Los Territorios En Las Luchas Por La Recuperación Del Agua En La Provincia de Petorca (Zona Central de Chile). Rupturas 2018, 8, 167–199. [Google Scholar]
- Panez-Pinto, A.; Faúndez-Vergara, R.; Mansilla-Quiñones, C. Politización de La Crisis Hídrica En Chile: Análisis Del Conflicto Por El Agua En La Provincia de Petorca. Agua Territ. 2017, 10, 131–148. [Google Scholar] [CrossRef]
- Álamos, N.; Alvarez-Garreton, C.; Muñoz, A.; González-Reyes, Á. The Influence of Human Activities on Streamflow Reductions during the Megadrought in Central Chile. Hydrol. Earth Syst. Sci. 2024, 28, 2483–2503. [Google Scholar] [CrossRef]
- Prieto, M.; Calderón-Seguel, M.; Fragkou, M.C.; Fuster, R. The (Not-so-Free) Chilean Water Model. The Case of the Antofagasta Region, Atacama Desert, Chile. Extr. Ind. Soc. 2022, 11, 101081. [Google Scholar] [CrossRef]
- Suarez, A. Critical Overview of the Expansion of Hass Avocado Plantations in Salamina, Northern Caldas, Colombia. J. Land Use Sci. 2024, 19, 230–238. [Google Scholar] [CrossRef]
- Denvir, A.; García-Oliva, F.; Arima, E.Y.; Latorre-Cárdenas, M.C.; González-Rodríguez, A.; Young, K.R.; De La Cruz, L.I.L. Sustainability Implications of Carbon Dynamics on the Avocado Frontier. Agric. Ecosyst. Environ. 2024, 359, 108746. [Google Scholar] [CrossRef]
- Torres, A. Manual Del Cultivo Del Palto; Boletín IN.; Torres, A., INIA, Eds.; INIA: Santiago, Chile, 2017. [Google Scholar]
- Díaz-Siefer, P.; Fontúrbel, F.E.; Berasaluce, M.; Huenchuleo, C.; Lal, R.; Mondaca, P.; Juan, L. Celis-Diez. The Market–Society–Policy Nexus in Sustainable Agriculture. Environ. Dev. Sustain. 2022, 26, 29981–30000. [Google Scholar] [CrossRef]
- Ramírez, M.I.; Špirić, J.; Orozco-Meléndez, F.; Merlo-Reyes, A. Sustainability of the Community Model of Avocado Production in the Monarch Butterfly Biosphere Reserve, Michoacán, México. GeoJournal 2024, 89, 189. [Google Scholar] [CrossRef]
- Duran-Llacer, I.; Rodríguez-López, L.; Arumí, J.L.; Martínez-Retureta, R.; Urrutia, R. Ecosistemas Dependientes de Las Aguas Subterráneas En Ambientes Semiáridos; SERIE COMU.; CRHIAM, Ed.; CHRIAM: Concepción, Chile, 2024. [Google Scholar]
- Abd-Elaty, I.; Ramadan, E.M.; Elbagory, I.A.; Nosair, A.M.; Kuriqi, A.; Garrote, L.; Ahmed, A.A. Optimizing Irrigation Systems for Water Efficiency and Groundwater Sustainability in the Coastal Nile Delta. Agric. Water Manag. 2024, 304, 109064. [Google Scholar] [CrossRef]
- Xing, Y.; Wang, X. Precision Agriculture and Water Conservation Strategies for Sustainable Crop Production in Arid Regions. Plants 2024, 13, 3184. [Google Scholar] [CrossRef]
- Edvan, R.L.; Mota, R.R.M.; Dias-Silva, T.P.; do Nascimento, R.R.; de Sousa, S.V.; da Silva, A.L.; de Araújo, M.J.; Araújo, J.S. Resilience of Cactus Pear Genotypes in a Tropical Semi-Arid Region Subject to Climatic Cultivation Restriction. Sci. Rep. 2020, 10, 10040. [Google Scholar] [CrossRef]
- Loukili, E.H.; Merzouki, M.; Taibi, M.; Elbouzidi, A.; Hammouti, B.; Kumar Yadav, K.; Khalid, M.; Addi, M.; Ramdani, M.; Kumar, P.; et al. Phytochemical, Biological, and Nutritional Properties of the Prickly Pear, Opuntia Dillenii: A Review. Saudi Pharm. J. 2024, 32, 102167. [Google Scholar] [CrossRef]
Disclaimer/Publisher’s Note: The statements, opinions and data contained in all publications are solely those of the individual author(s) and contributor(s) and not of MDPI and/or the editor(s). MDPI and/or the editor(s) disclaim responsibility for any injury to people or property resulting from any ideas, methods, instructions or products referred to in the content. |
© 2025 by the authors. Licensee MDPI, Basel, Switzerland. This article is an open access article distributed under the terms and conditions of the Creative Commons Attribution (CC BY) license (https://creativecommons.org/licenses/by/4.0/).