Article

Growing Season Normalized Difference Vegetation Index in the Nepal Himalaya and Adjacent Areas, 2000–2019: Sensitivity to Climate Change and Terrain Factors

CEN Center for Earth System Research and Sustainability, Institute of Geography, University of Hamburg, Bundesstr. 55, 20146 Hamburg, Germany
*
Author to whom correspondence should be addressed.
Land 2025, 14(4), 749; https://doi.org/10.3390/land14040749
Submission received: 8 February 2025 / Revised: 14 March 2025 / Accepted: 26 March 2025 / Published: 1 April 2025

Abstract

:
Precisely detecting and attributing changes in vegetation greenness is crucial for sustainable ecosystem management. The normalized difference vegetation index (NDVI) is highly responsive to changes in vegetation cover and is essential for assessing vegetation dynamics. This study integrates a digital elevation model (DEM) with climate data (temperature, precipitation, evapotranspiration, and solar radiation) and MODIS-NDVI imagery (2000–2019) to investigate NDVI fluctuations and their correlation with climate change in the central Himalaya. Trend analysis of NDVI time-series data examined vegetation response influenced by elevation, aspect, and slope. The results revealed significant spatial and temporal NDVI variations, with an overall increase of 0.01 per decade (p < 0.05), indicating gradual vegetation improvement, though 26.3% of the area (107,138 km2) showed a decreasing trend. NDVI trends increased with elevation, peaking at 2000–2500 m, and then declined up to 4000 m, where they stabilized. While trends varied across slopes, they were independent of the aspect. Spearman correlation analysis revealed elevation-dependent vegetation responses to climate. Below 1000 masl, the NDVI was negatively correlated with temperature and evapotranspiration and positively with precipitation. At higher elevations (>4000 masl), temperature and evapotranspiration positively correlated with the NDVI, suggesting warming supports growth. These findings highlight complex interactions between vegetation, climate, and topography that are crucial for targeted ecosystem management.

1. Introduction

Vegetation encompasses a fundamental element of ecosystems, serving as a crucial link connecting the atmospheric, hydrological, and pedological systems [1]. The sensitivity of vegetation cover to global warming has gained major attention from researchers considering the recorded impacts of anthropogenic warming on the biosphere [2]. Lately, there has been growing awareness regarding the sensitivity of vegetation in mountain areas to climate change [3,4,5,6] and, therefore, the requirement for monitoring and quantifying the spatiotemporal dynamics of vegetation [7,8,9].
The advancement of satellite remote sensing technology has considerably reinforced our capabilities to monitor and analyze vegetation dynamics across extensive spatial and temporal scales [10,11,12]. Therefore, it empowers researchers to establish direct associations between alterations in vegetation attributes and their underlying causes [13,14]. The normalized difference vegetation index (NDVI) is the most often used vegetation index (VI) [15]. Vegetation greenness might show either a positive development (greening) or a negative tendency (browning). These year-to-year variations are linked to either slow climate change drivers, such as temperature, precipitation, and drought, or to more rapid shifts caused by specific land management acts that cause changes in land cover or land use [13]. Numerous studies employed the NDVI as a simple and straightforward index, e.g., [6,9,16,17], which is generally used to indicate alterations to vegetation cover in response to climate change [15]. Research has demonstrated that the NDVI is a relatively strong indicator of green biomass, even in ecosystems with sparse vegetation and complex topography [6,17]. At global and regional scales, the relations between the NDVI and climate factors (e.g., temperature and precipitation) have been analyzed through either correlation or regression analysis in many studies, e.g., [6,9,16,17,18].
The Himalaya is characterized by climatic gradients (i.e., moisture decrease from the outer to the inner ranges and from southeast to northwest), being a biodiversity hotspot with a wide variety of plant communities and varying anthropogenic influences [19,20,21,22]. Consequently, distinct plant communities are likely to respond in different ways to environmental and climatic forces. Mountains are the most dynamic systems on Earth and are highly susceptible to shifts in changing climate [4,23,24,25]. Higher elevations in mountainous regions experience a faster warming rate compared to their lower counterparts, in many cases measured and also predicted by models [26]. Hence, the responses of vegetation dynamics will be elevation-specific [9,17,27].
Acquiring a complete understanding of vegetation dynamics across the central Himalayan region by relying solely on a limited number of local scale/site-specific studies poses a challenge; therefore, there is a requirement for regional scale monitoring [9]. The impacts of climate change on vegetation dynamics in the Himalaya and on the Tibetan Plateau have gained increasing attention [27,28,29,30,31,32,33,34,35,36,37]; however, compared to other mountain regions, the number of studies is limited. This could possibly be due to the challenges of geographical inaccessibility along with the absence of long-term field monitoring stations [38].
A number of studies have primarily assessed how the NDVI is connected to climate factors in the Himalaya [9,39,40,41,42,43,44,45]. However, it is equally important to understand how climate and the NDVI interact in various topographic settings. The problem of how NDVI values alter in relation to variations in terrain features, such as elevation, slope, and aspect, has been largely overlooked in previous studies. Previous research that examined NDVI patterns or trends in the Himalaya may have been influenced by certain limitations such as the absence of detailed topographic analyses, limited temporal coverage, the absence of an integrated climate–topography analytical framework, and the exclusion of key climatic variables, like evapotranspiration and solar radiation [39,42,43,44]. Specific geographical factors clearly impact NDVI results. Furthermore, we must examine the impact of geography on parameters, for example, sunshine exposure, which influences NDVI patterns. Our current research aims to fill this large gap in the research, especially in the central Himalayan region. Including topography in climate–NDVI research adds a new dimension and addresses the scarcity of topographic-dependent analyses of the NDVI in this region.
Shrestha et al. [46] explored the trends in the vegetation of Nepal by using the NDVI, which generally indicated that vegetation greenness increased due to rising temperatures and an extended growing season at higher elevations. Krakauer et al. [47] also presented greening trends in the mid-elevation zones of Nepal where climatic conditions were favorable for vegetation growth. Mishra and Mainali [9] discussed NDVI trends across elevation bands in the Himalaya. They reported that greening peaks at mid-elevation but declines towards higher altitudes due to more adverse climate conditions. Anderson et al. [17] studied the sensitivity of the NDVI to temperature and precipitation in the Nepal Himalaya. They showed that lowland vegetation was largely driven by precipitation, while vegetation at high elevations responded to temperature fluctuations. Tiwari et al. [48] observed that extreme events such as droughts and floods cause abrupt drops in the NDVI, representing ecosystem sensitivity. Baniya et al. [49] studied treeline ecotones in Langtang National Park and recorded a significant gain in the NDVI, indicating favorable conditions for high-elevation vegetation. Regmi et al. [50] analyzed the seasonal changes in NDVI and observed a positive change in all seasons except the post-monsoon season in agricultural areas. Baniya et al. [41] analyzed the growing season dynamics of Nepal from 1982 to 2015, indicating a positive correlation between temperature and the NDVI and a negative correlation with precipitation. These results highlight the value of the NDVI in the detection of vegetation responses to environmental change and point to region-specific climatic gradients and more advanced models in interpreting trends correctly.
Krakauer et al. [47] analyzed the NDVI in Nepal and perceived an increase over the study period, which is consistent with global trends. Their study utilized an 8 km spatial resolution NDVI dataset, which is coarser compared to our study. Additionally, our study incorporates topography, including slope and aspect, along with elevation, to provide a more thorough analysis. Mishra and Mainali [9] examined NDVI trends and their drivers in the Himalayan ecoregions. While they discussed the mean NDVI at various elevations, they did not investigate how the NDVI interacts with climatic characteristics in distinct altitudinal bands. Sharma et al. [43] and Rai et al. [44] also investigated the NDVI trends in Nepal, yet they overlooked the influence of terrain on vegetation greenness in the region. Terrain has a substantial impact on plant patterns, and its exclusion may result in an incomplete understanding of NDVI dynamics. The blend of accurate climate data and terrain characteristics offers a more advanced understanding of NDVI dynamics compared to studies that might rely on less accurate or detailed data.
This study addresses a key research gap in the central Himalaya by examining how topographically categorized NDVI trends correlate with temperature, precipitation, evapotranspiration, and solar radiation at every 1000 m elevation interval. By spanning from high mountains to lowlands, this study provides a comprehensive elevation-, slope-, and aspect-based analysis of vegetation climate interactions, integrating an in-depth, literature-supported discussion. This integrated analytical framework differentiates this study from previous research in the Nepal Himalaya. Therefore, in this study, we performed a trend analysis of satellite-derived growing-season NDVI time-series and investigated the response of vegetation cover to changes in climate parameters in the central Himalaya over two decades, accounting for elevation, aspect, and slope. Since the snow cover throughout the winter substantially influences the spectral response of pixels in mountainous areas, the monitoring of subtropical mountain vegetation is best conducted with imagery acquired during the growing season [30,51]. We focus on solving two research questions:
(i)
What are the trends observed in the growing season normalized difference vegetation indices (NDVIs) from 2000 to 2019 across different elevations, slopes, and aspects in the study region?
(ii)
How do the trends in the growing season NDVIs align with variations in temperature, precipitation, evapotranspiration, and solar radiation accounting for terrain factors such as altitude, slope, and aspect?

2. Materials and Methods

2.1. Study Area

A rectangular area in the central Himalayan region was selected to conduct this research, defined by the following coordinates: southwest corner—Latitude 26.33193°, Longitude 80.02441°; northeast corner—Latitude 30.5154°, Longitude 88.2334°. The study region includes mainly Nepal and some parts of India and Tibet, in total covering an area of 407,369 square kilometers (Figure 1). The elevation of the region ranges from 8 m to 8849 m above sea level (masl). Political boundaries may not always precisely coincide with ecological processes and vegetation patterns. Hence, we captured the natural boundaries and gradients important to this study, such as elevation ranges, climatic zones, or vegetation transitions, by drawing a rectangle across Nepal. In this way, we identified a particular area of interest that fit with the goals of this study, which took high mountains, highlands, foothills, lowlands, etc., into consideration. It enabled a more targeted investigation within a well-defined geographic region. Extension beyond the nation’s boundary permitted the inclusion of nearby areas that could have similar biological traits or environmental circumstances. With this approach, it was possible to analyze NDVI trends and their connections to climate and terrain factors in a way that is more ecologically relevant.

Climate, Vegetation, and Terrain

The climate of the studied region is characterized and influenced by the Indian monsoon, topographical variations, altitudinal and temperature gradients, microclimates, glacier and snowmelt, winter westerly disturbances, neighboring climate influences, etc. In the growing season, the lowland temperature varies from 20 °C to 30 °C, in hilly regions, it varies from 15 °C to 25 °C, and in highlands and mountains, it varies from 5 °C to 15 °C. Due to its unique physiographical and topographical settings, the central Himalaya keeps enormous climatic and ecological diversity within a north–south gradient [21]. The climate of Nepal varies greatly, with remarkable climatic differences being particularly related to the vast orography of the Himalaya [52]. The climate of Nepal is essentially dominated by the highly seasonal monsoon weather system. The monsoonal summer precipitation provides, by far, the largest share of the annual precipitation, contributing, based on locations, approximately 70–85% of the annual precipitation [52]. The southeastern part of Nepal receives the first monsoon rainfall, which slowly moves towards the west. Therefore, a distinct reduction in monsoonal precipitation from east to west can be observed [19,20,53].
Because of the monsoon climate and altitudinal variety, a diverse range of habitats exist, ranging from lowland evergreen tropical forests in the lowland to warm temperate evergreen and cool temperate deciduous forests, eventually transitioning into coniferous forests as they approach the treeline [21,22,54,55]. Continuing upward, Rhododendron dwarf shrub heaths spread up to the high alpine meadows before plant life gradually surrenders to the harsh conditions of high mountains [21]. Deep river valleys induce their microclimates, resulting in significant variations in flora in relatively small regions with varying aspects and elevations [22,54,55].
The complicated topography of the central Himalaya can be separated into a few physiographic regions: the Terai Plain, the Siwalik Hills, the Middle Mountains, the High Mountains, and the High Himalaya. Each area is distinguished by unique elevation ranges from the flat Terai Plain to the snow-covered peaks of the High Himalaya. This variation in geography has a profound impact on Nepal’s climate and biodiversity patterns [21,22,27,56,57].

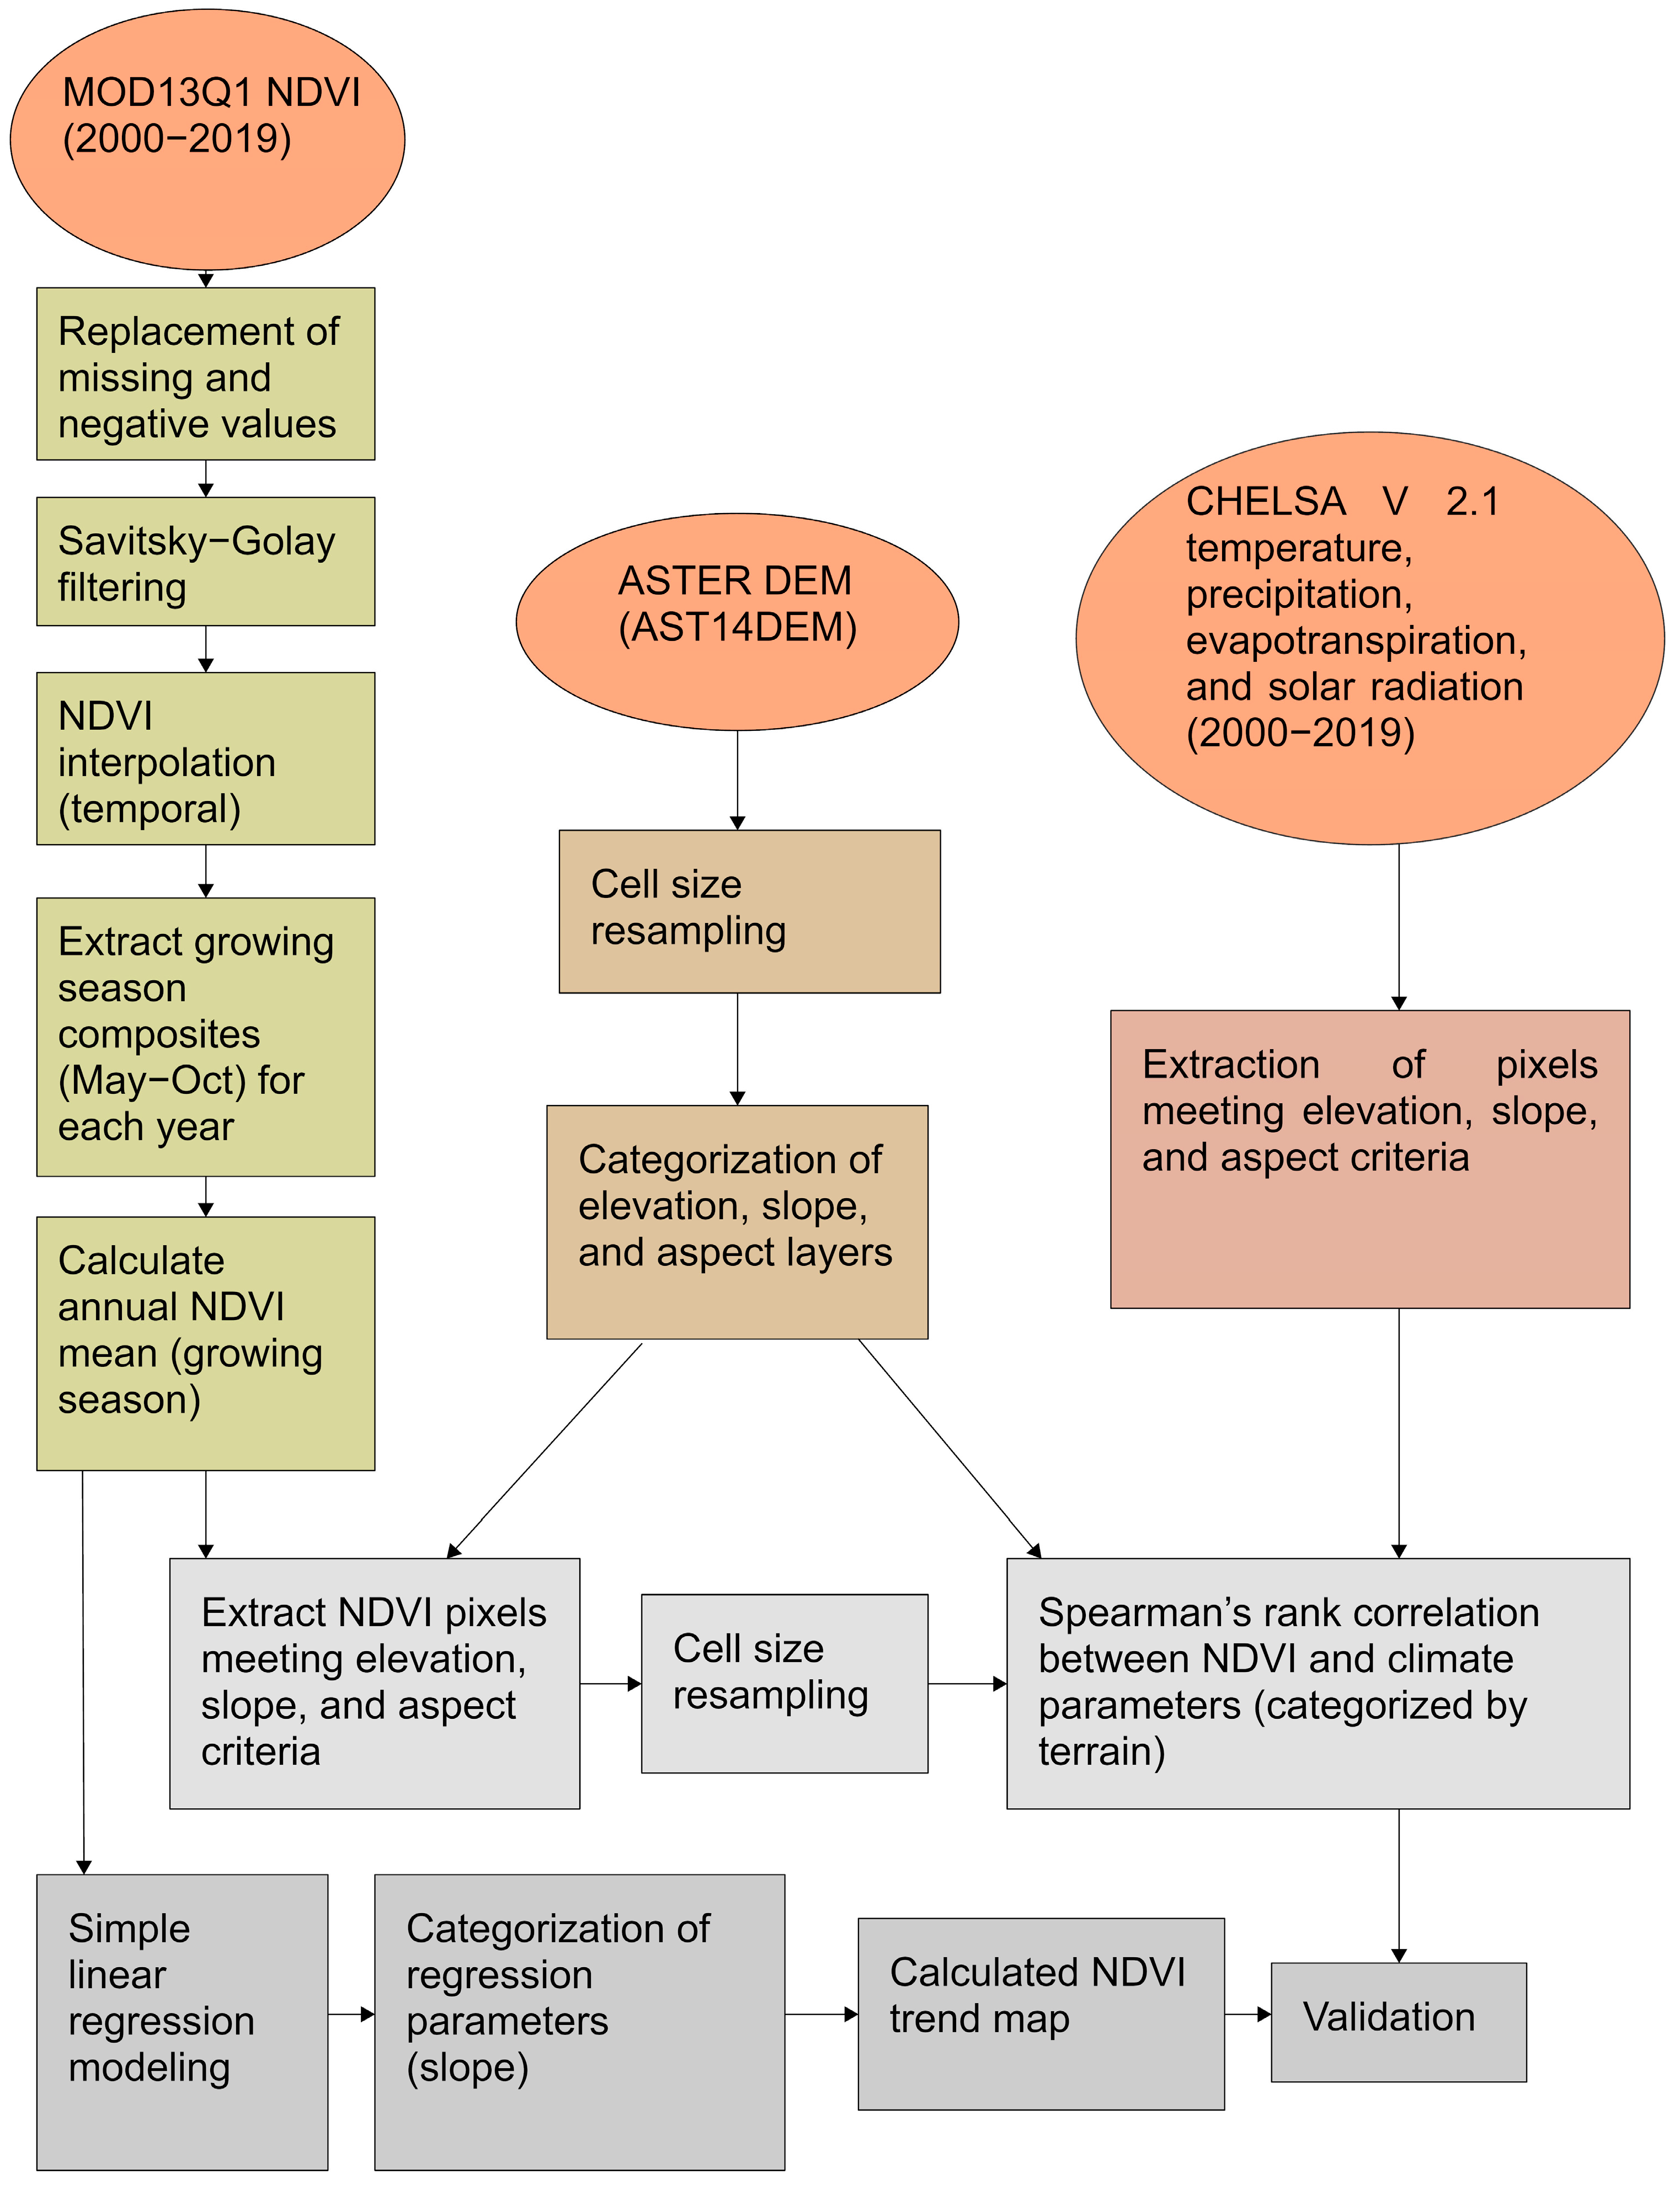
2.2. Data Acquisition and Image Pre-Processing

2.2.1. NDVI Dataset

This study used the Terra Moderate Resolution Imaging Spectroradiometer (MODIS) Vegetation Indices (MOD13Q1) Version 6.1 (available at https://lpdaac.usgs.gov/products/mod13q1v061/, accessed on 20 January 2021). The MOD13Q1 dataset was utilized in this study, which spans the years 2000 through 2019. It gives information with a 16-day temporal resolution, which means that vegetation indices are calculated roughly every two weeks [58]. The data’s spatial resolution is 250 m, indicating that each pixel in the dataset represents a portion of the Earth’s surface that is 250 m by 250 m in size. Data from four granules were collected in HDF format to cover the research area. The data were then mosaiced (combining the four granules into a single dataset) and clipped to the research region using ArcGIS Pro 3.0. The data were then reprojected to the WGS84 coordinate system. To improve the quality and accuracy of the dataset for this investigation, the Savitsky–Golay (SG) filter was applied to the NDVI data [59]. The NDVI data were treated using the SG filter to get rid of undesirable changes and give a smoother representation of the underlying vegetation signal [60]. This filter was chosen since it has already been used successfully in previous studies [61,62,63]. Cai et al. [64] concluded that when the smoothing parameters are properly calibrated, local filtering techniques (such as SG) can produce highly accurate results. The method makes use of polynomial fitting within a moving window, which is usually set to a window size that strikes a balance between smoothing and preserving the overall trend fluctuations in the NDVI signal. The Savitzky–Golay filter was applied to the MOD13Q1 dataset with a window size of 5 points and a 2nd-order polynomial. The window size in our investigation was selected to guarantee optimal data smoothing without losing crucial short-term information. These settings were chosen to maintain inter-annual variability while effectively reducing high-frequency noise. The SG filtering was performed using the sgolayfilt function from the Signal package in R (version 1-1.8) [65,66].
The analysis of the NDVI was primarily targeted at the region’s growing season. The period designated as the growing season was May through October, which corresponds to the typical period of active vegetation growth and photosynthesis in the region. We aimed to analyze the changes and patterns in the NDVI by confining the analysis to the growing season to capture the maximal vegetation activity. This approach allowed for a more focused assessment of the dynamics of the vegetation and how it is related to environmental conditions throughout the critical time of plant development and productivity. The mean values of the NDVI were calculated to investigate the NDVI during the growing period. Our approach included averaging the NDVI values across the growing season for each year individually and also calculating multi-year mean values to capture longer-term trends [67,68]. To gain insight into the long-term vegetation dynamics in the research area, we employed the mean NDVI values to evaluate the overall vegetation greenness and its fluctuations within and across distinct elevational gradients.

2.2.2. Topographic Data

The ASTER Digital Elevation Model (AST14DEM) product (available at: https://lpdaac.usgs.gov/products/ast14demv003/, accessed on 20 January 2021) at a spatial resolution of 1 arc second, which translates to approximately 30 m horizontal posting at the equator, was used here to extract terrain factors [69]. Elevation, slope, and aspect were derived from the ASTER DEM using ArcGIS Pro 3.0 [70]. The study area was divided into twelve vertical zones based on elevation values. The elevation ranges for each zone were as follows: <1000, 1000–1500, 1500–2000, 2000–2500, 2500–3000, 3000–3500, 3500–4000, 4000–4500, 4500–5000, 5000–5500, 5500–6000, and >6000 masl. These elevation bands consisted of 42.20%, 5.32%, 4.21%, 2.75%, 2.26%, 2.10%, 2.16%, 4.68%, 13.42%, 13.97%, 6.03%, and 0.85% of the total study area, respectively. The slope was divided into <5°, 5–10°, 10–20°, 20–30°, 30–40°, 40–50°, and >50°. Also, the division of aspect values fell into the category of slope-free direction/flat (−1), north (0–22.5°, 337.5–360°), northeast (22.5–67.5°), east (67.5–112.5°) southeast (112.5–157.5°), south (157.5–202.5°), southwest (202.5–247.5°), west (247.5–292.5°), and northwest (292.5–337.5°).
Using the Attribute Extraction Tool in ArcGIS Pro 3.0, the categorized elevation, slope, and aspect layers were extracted. Following that, mask extraction was used to superimpose the spatial distribution of the mean NDVI, air temperature, annual precipitation, evapotranspiration, and solar radiation throughout the growing season. Lastly, an analysis of the spatiotemporal distribution of the NDVI and climate parameters at various elevations, slopes, and aspects was performed (Figure 2).

2.2.3. Climate Data

Climate data (i.e., temperature, precipitation, evapotranspiration, and solar radiation) were obtained from CHELSA V2.1 (Climatologies at High resolution for the Earth Land Surface Areas) for the same study period. The used monthly time-series of tas (mean daily air temperature), pr (precipitation amount), pet (potential evapotranspiration), and rsds (surface downwelling shortwave flux in air) data are available at https://www.doi.org/10.16904/envidat.228 (accessed on 20 February 2021) [71]. It gives downscale model output for climate parameter estimates. The resolution of the CHELSA data is 30 arc seconds.
A resampling procedure was performed to establish a consistent cell size throughout the raster datasets used in this study, ensuring consistency and comparability across them. In this method, each dataset’s spatial resolution was changed to the CHELSA climate data cell size. In this instance, the NDVI dataset and the topographic data, comprising elevation, slope, and aspect, underwent resampling to meet the intended cell size. After image processing, there was a total of 42.51 million cells in the study area raster. The image processing and analysis in this work were mostly performed with ArcGIS Pro 3.0, R statistical tools, and, to some extent, Python 3.9.7 [72].

2.3. Trend and Correlation Analysis

For trend analysis of the spatiotemporal changes in the NDVI over two decades, a simple linear slope analysis model was employed using the ArcPhy function in Python 3.9.7. The linear slope for each grid unit in the research region was calculated here. The linear slope showed the rate of change in the NDVI over time, indicating whether and at what rate vegetation greenness increased or decreased. This analysis was critical for understanding the long-term patterns and dynamics of vegetation [67,68,73] in the research region. This method has been widely employed in previous studies to quantify the size and direction of change in vegetation greenness over time [6,60,74,75,76]. Spearman’s rank correlation analysis and significance tests were performed using R 4.1.2 software on the NDVI with climate parameters at various altitudes, slopes, and aspects. Then, the impact of the climatic factors on vegetation dynamics throughout the complex mountain terrain was studied.

3. Results

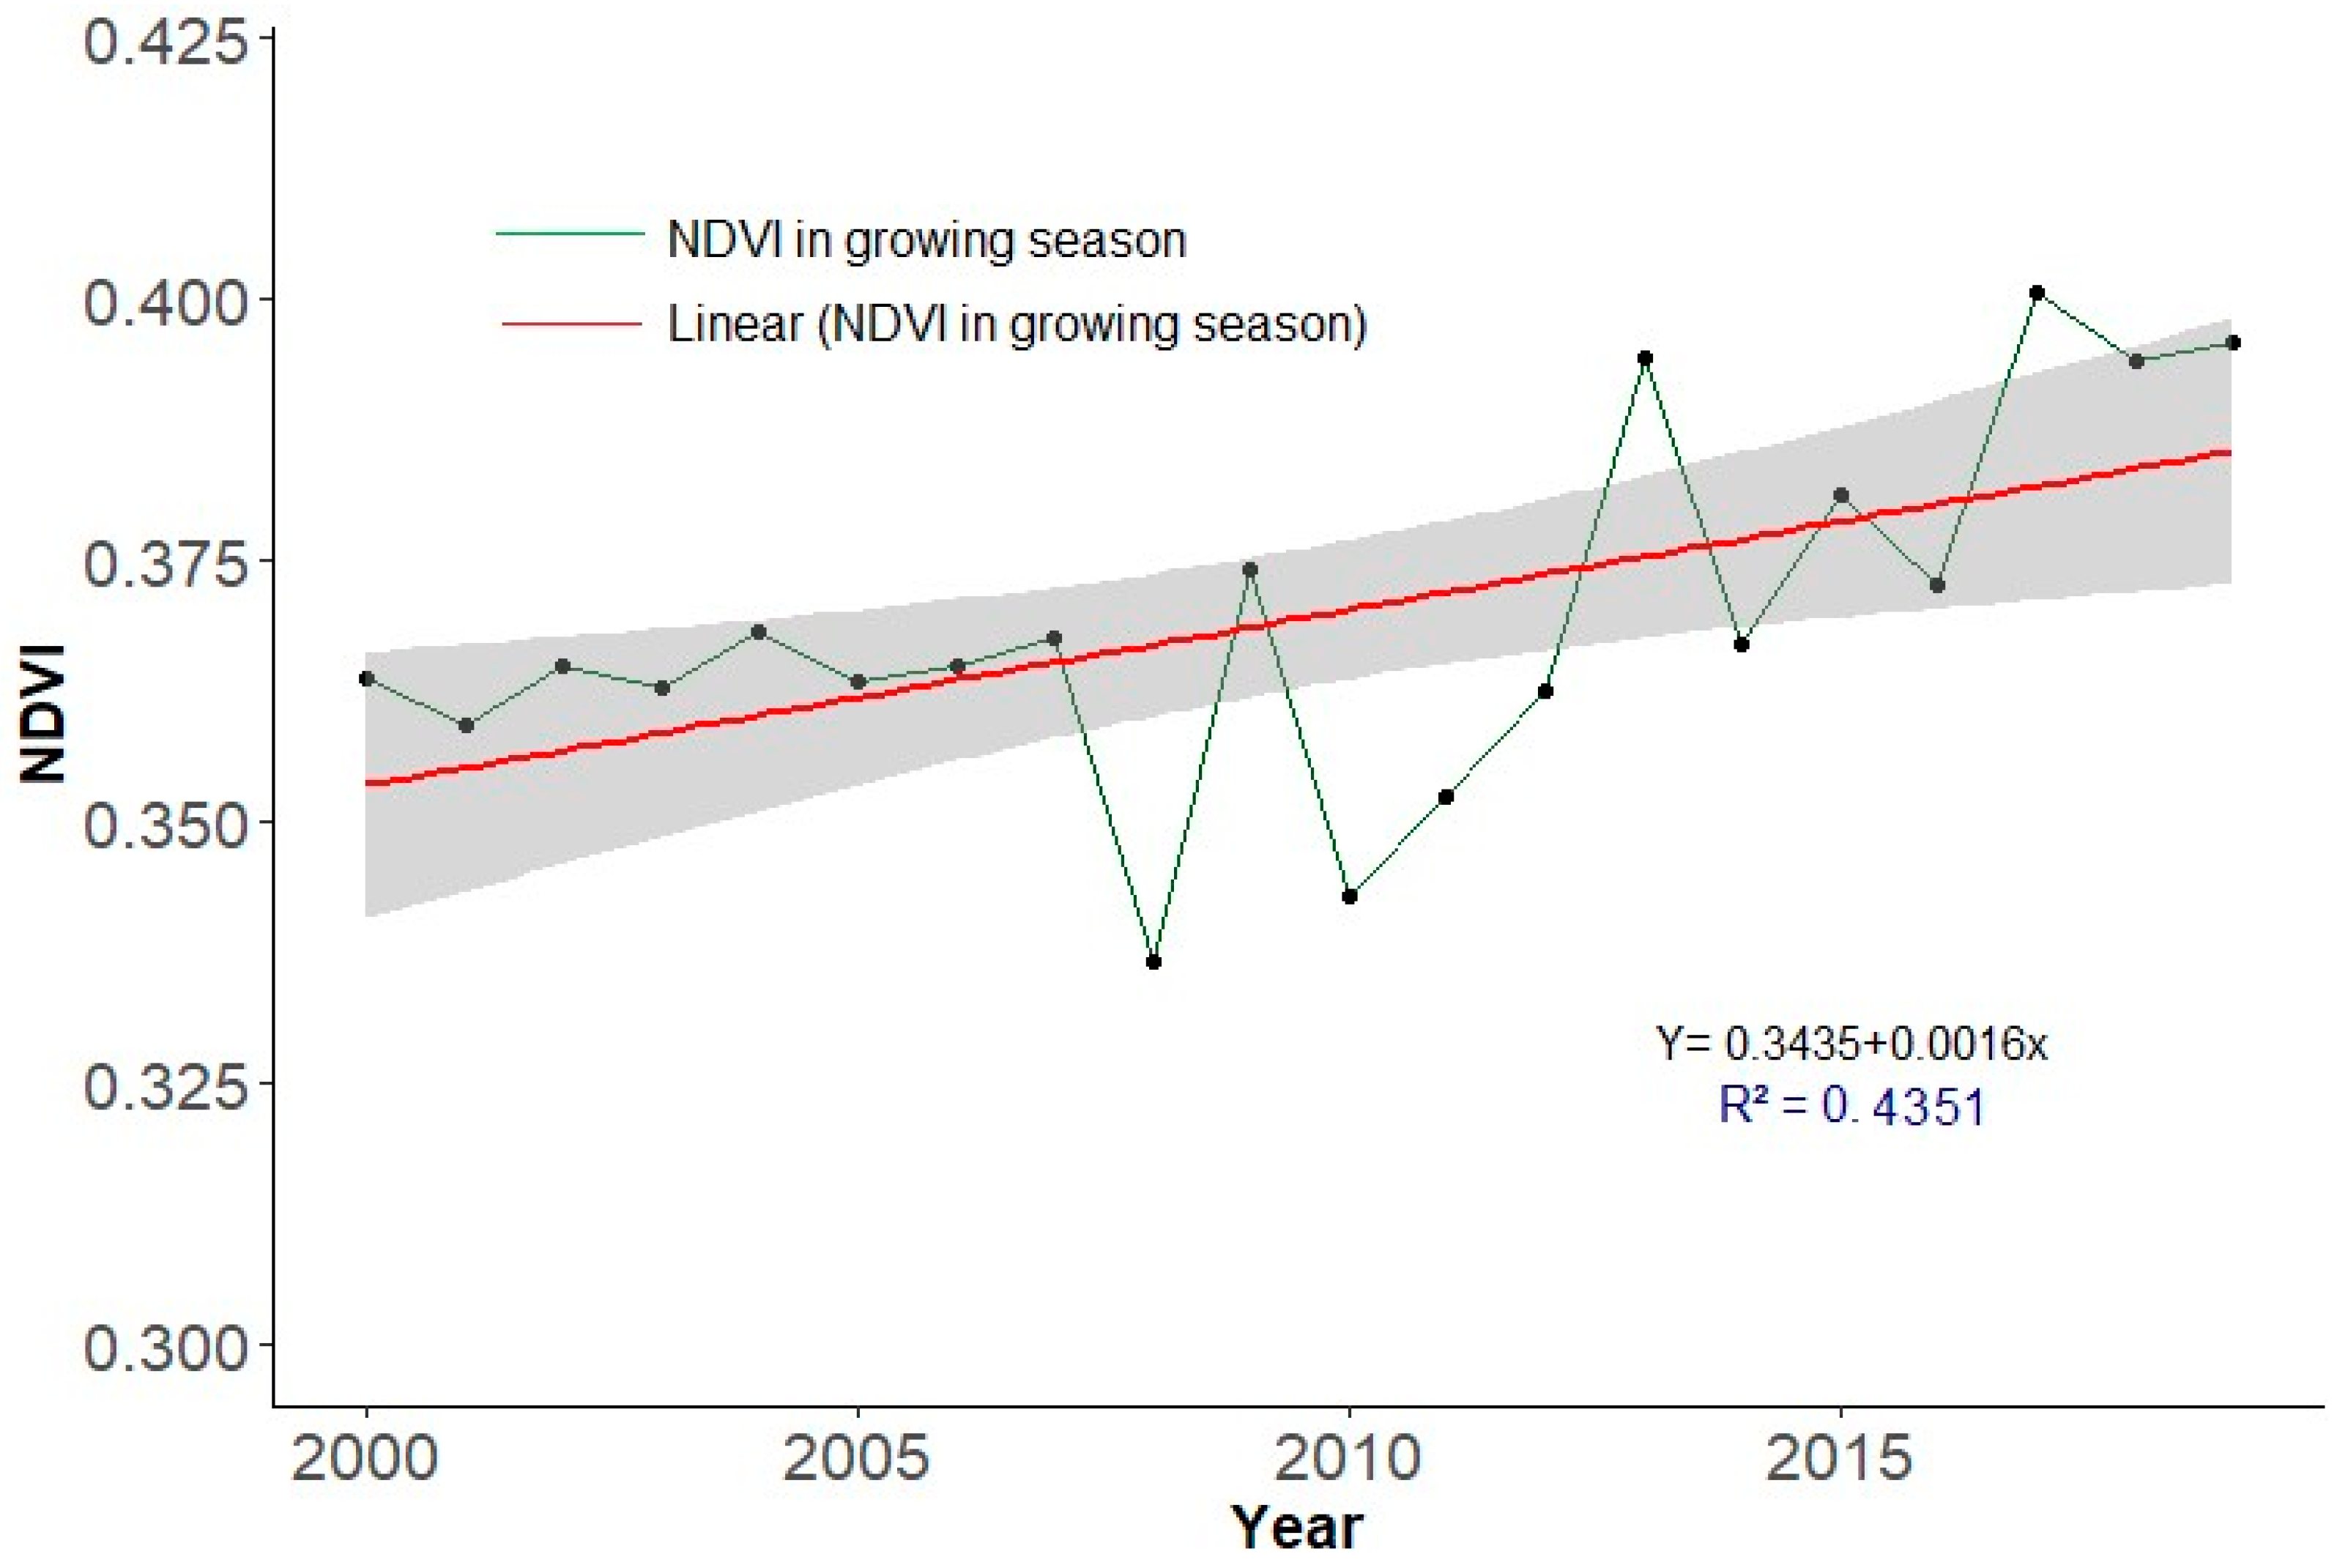
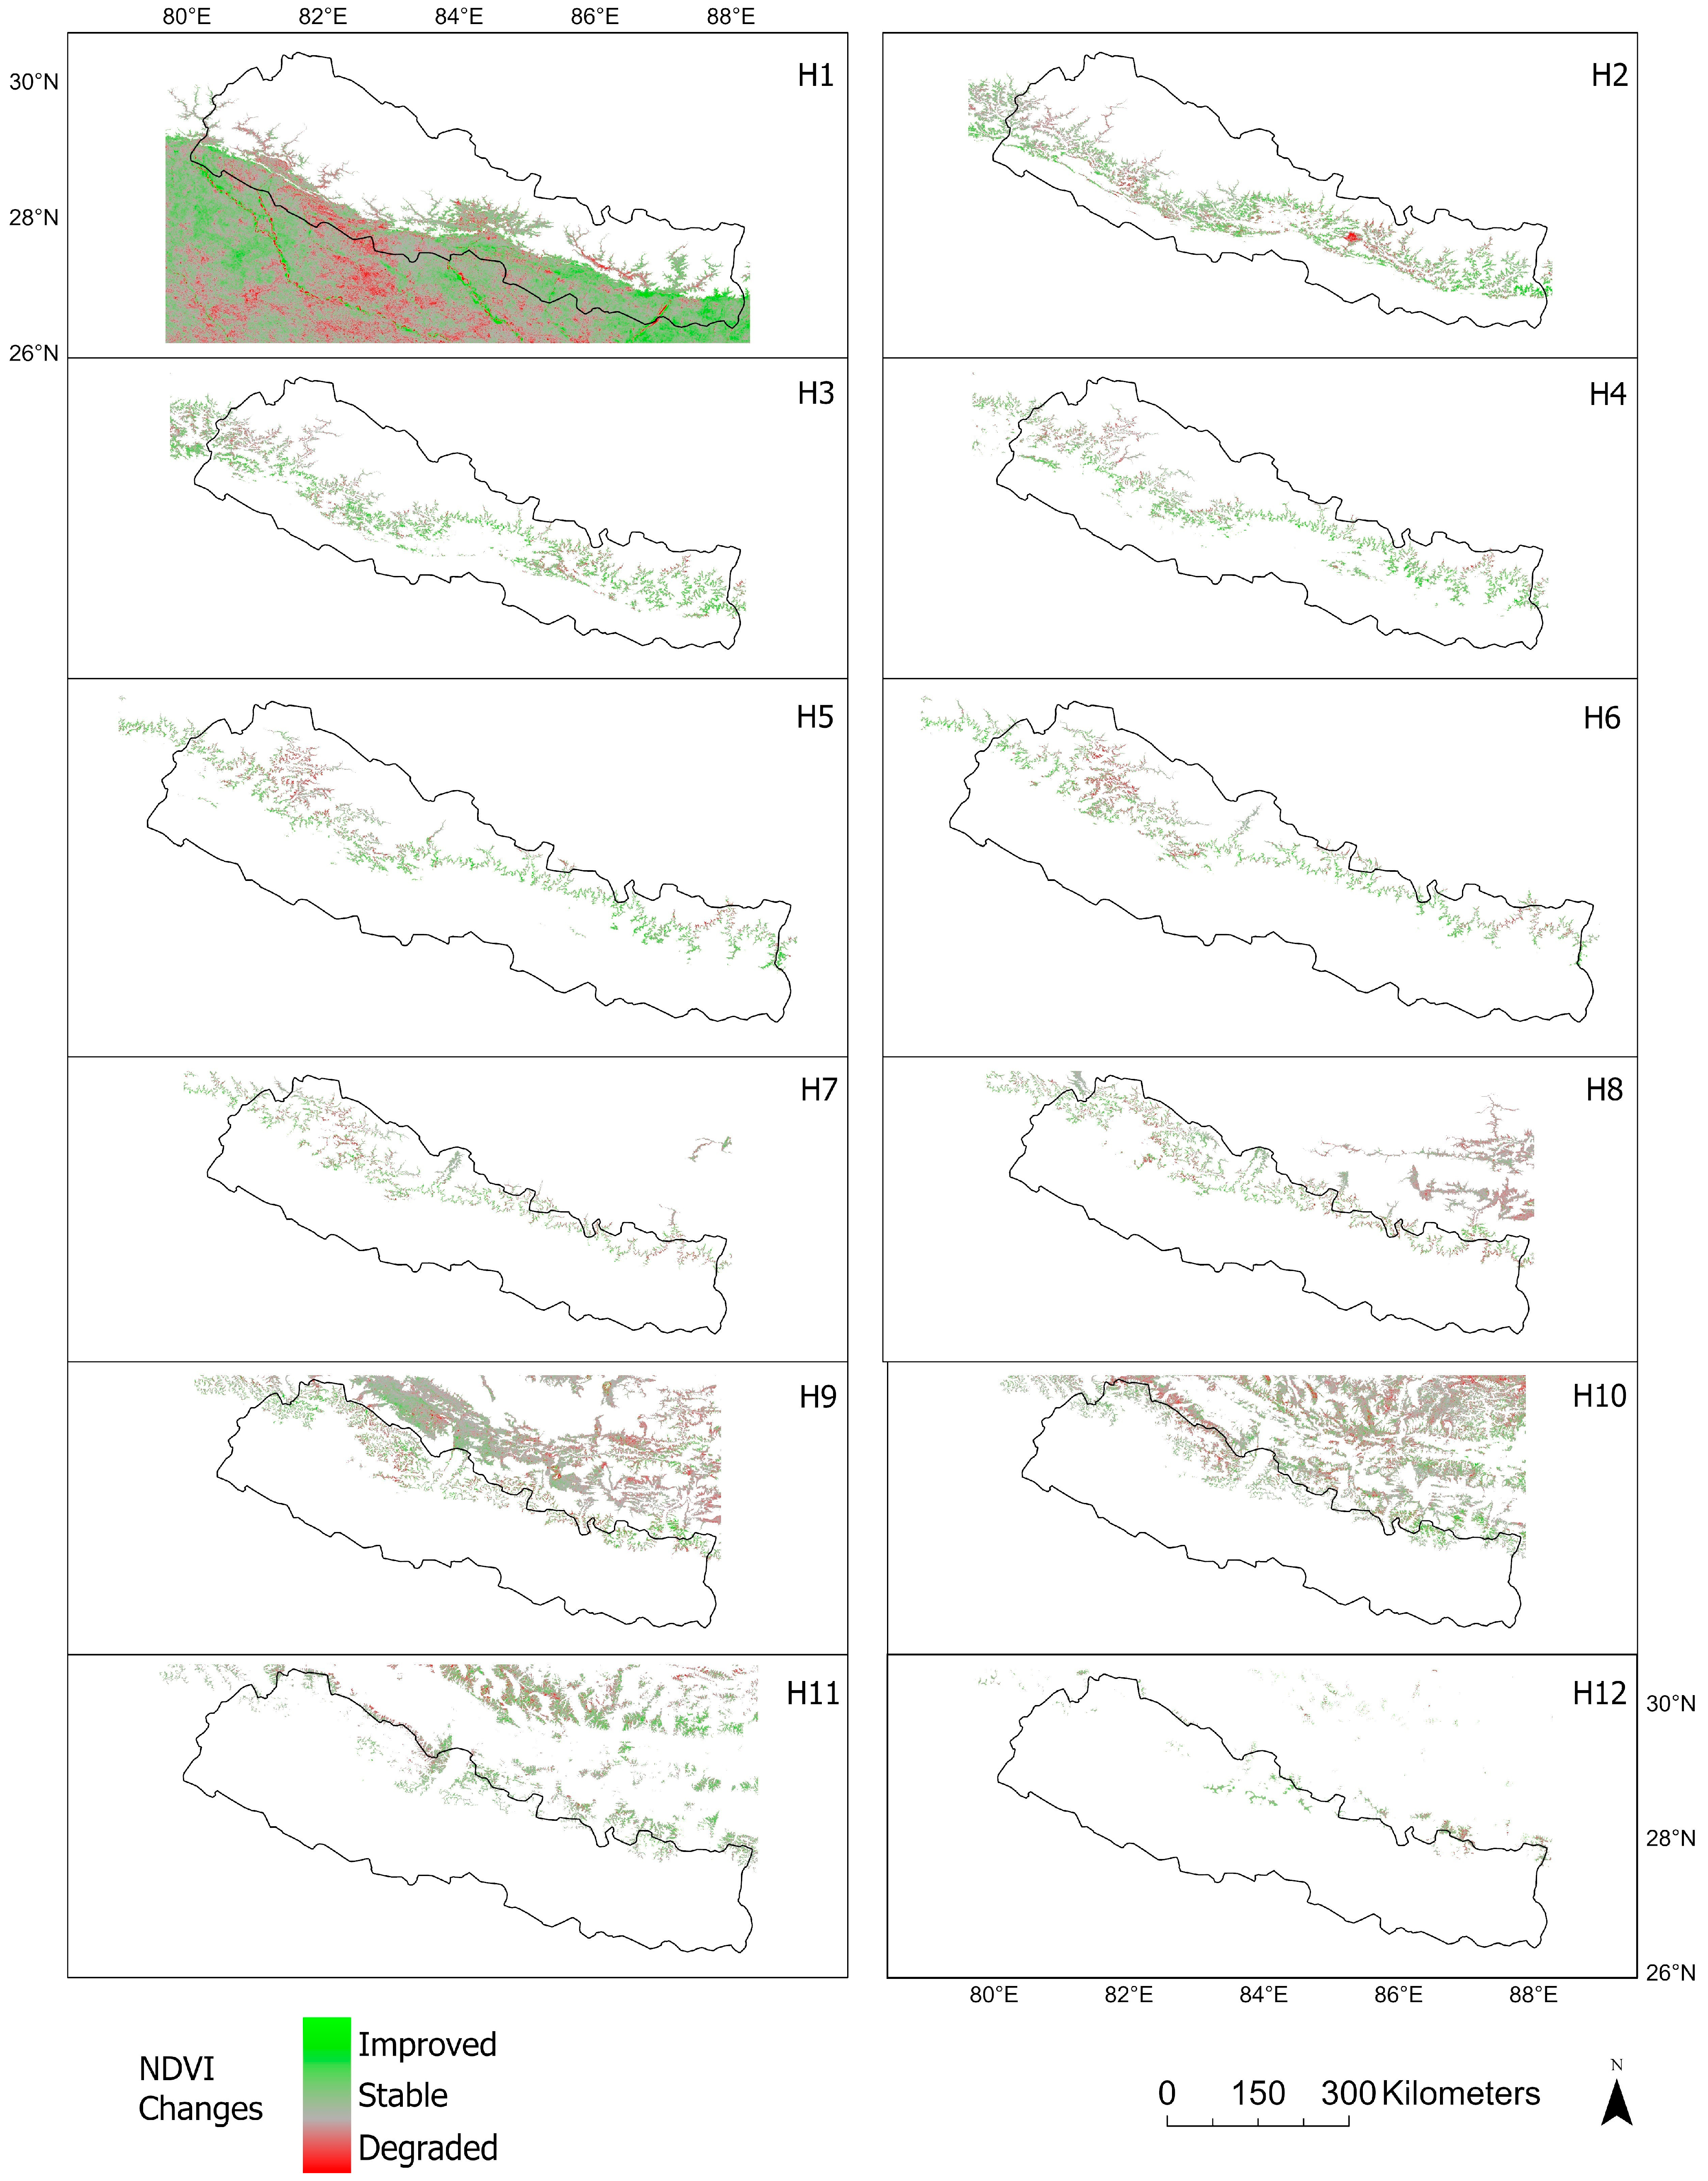
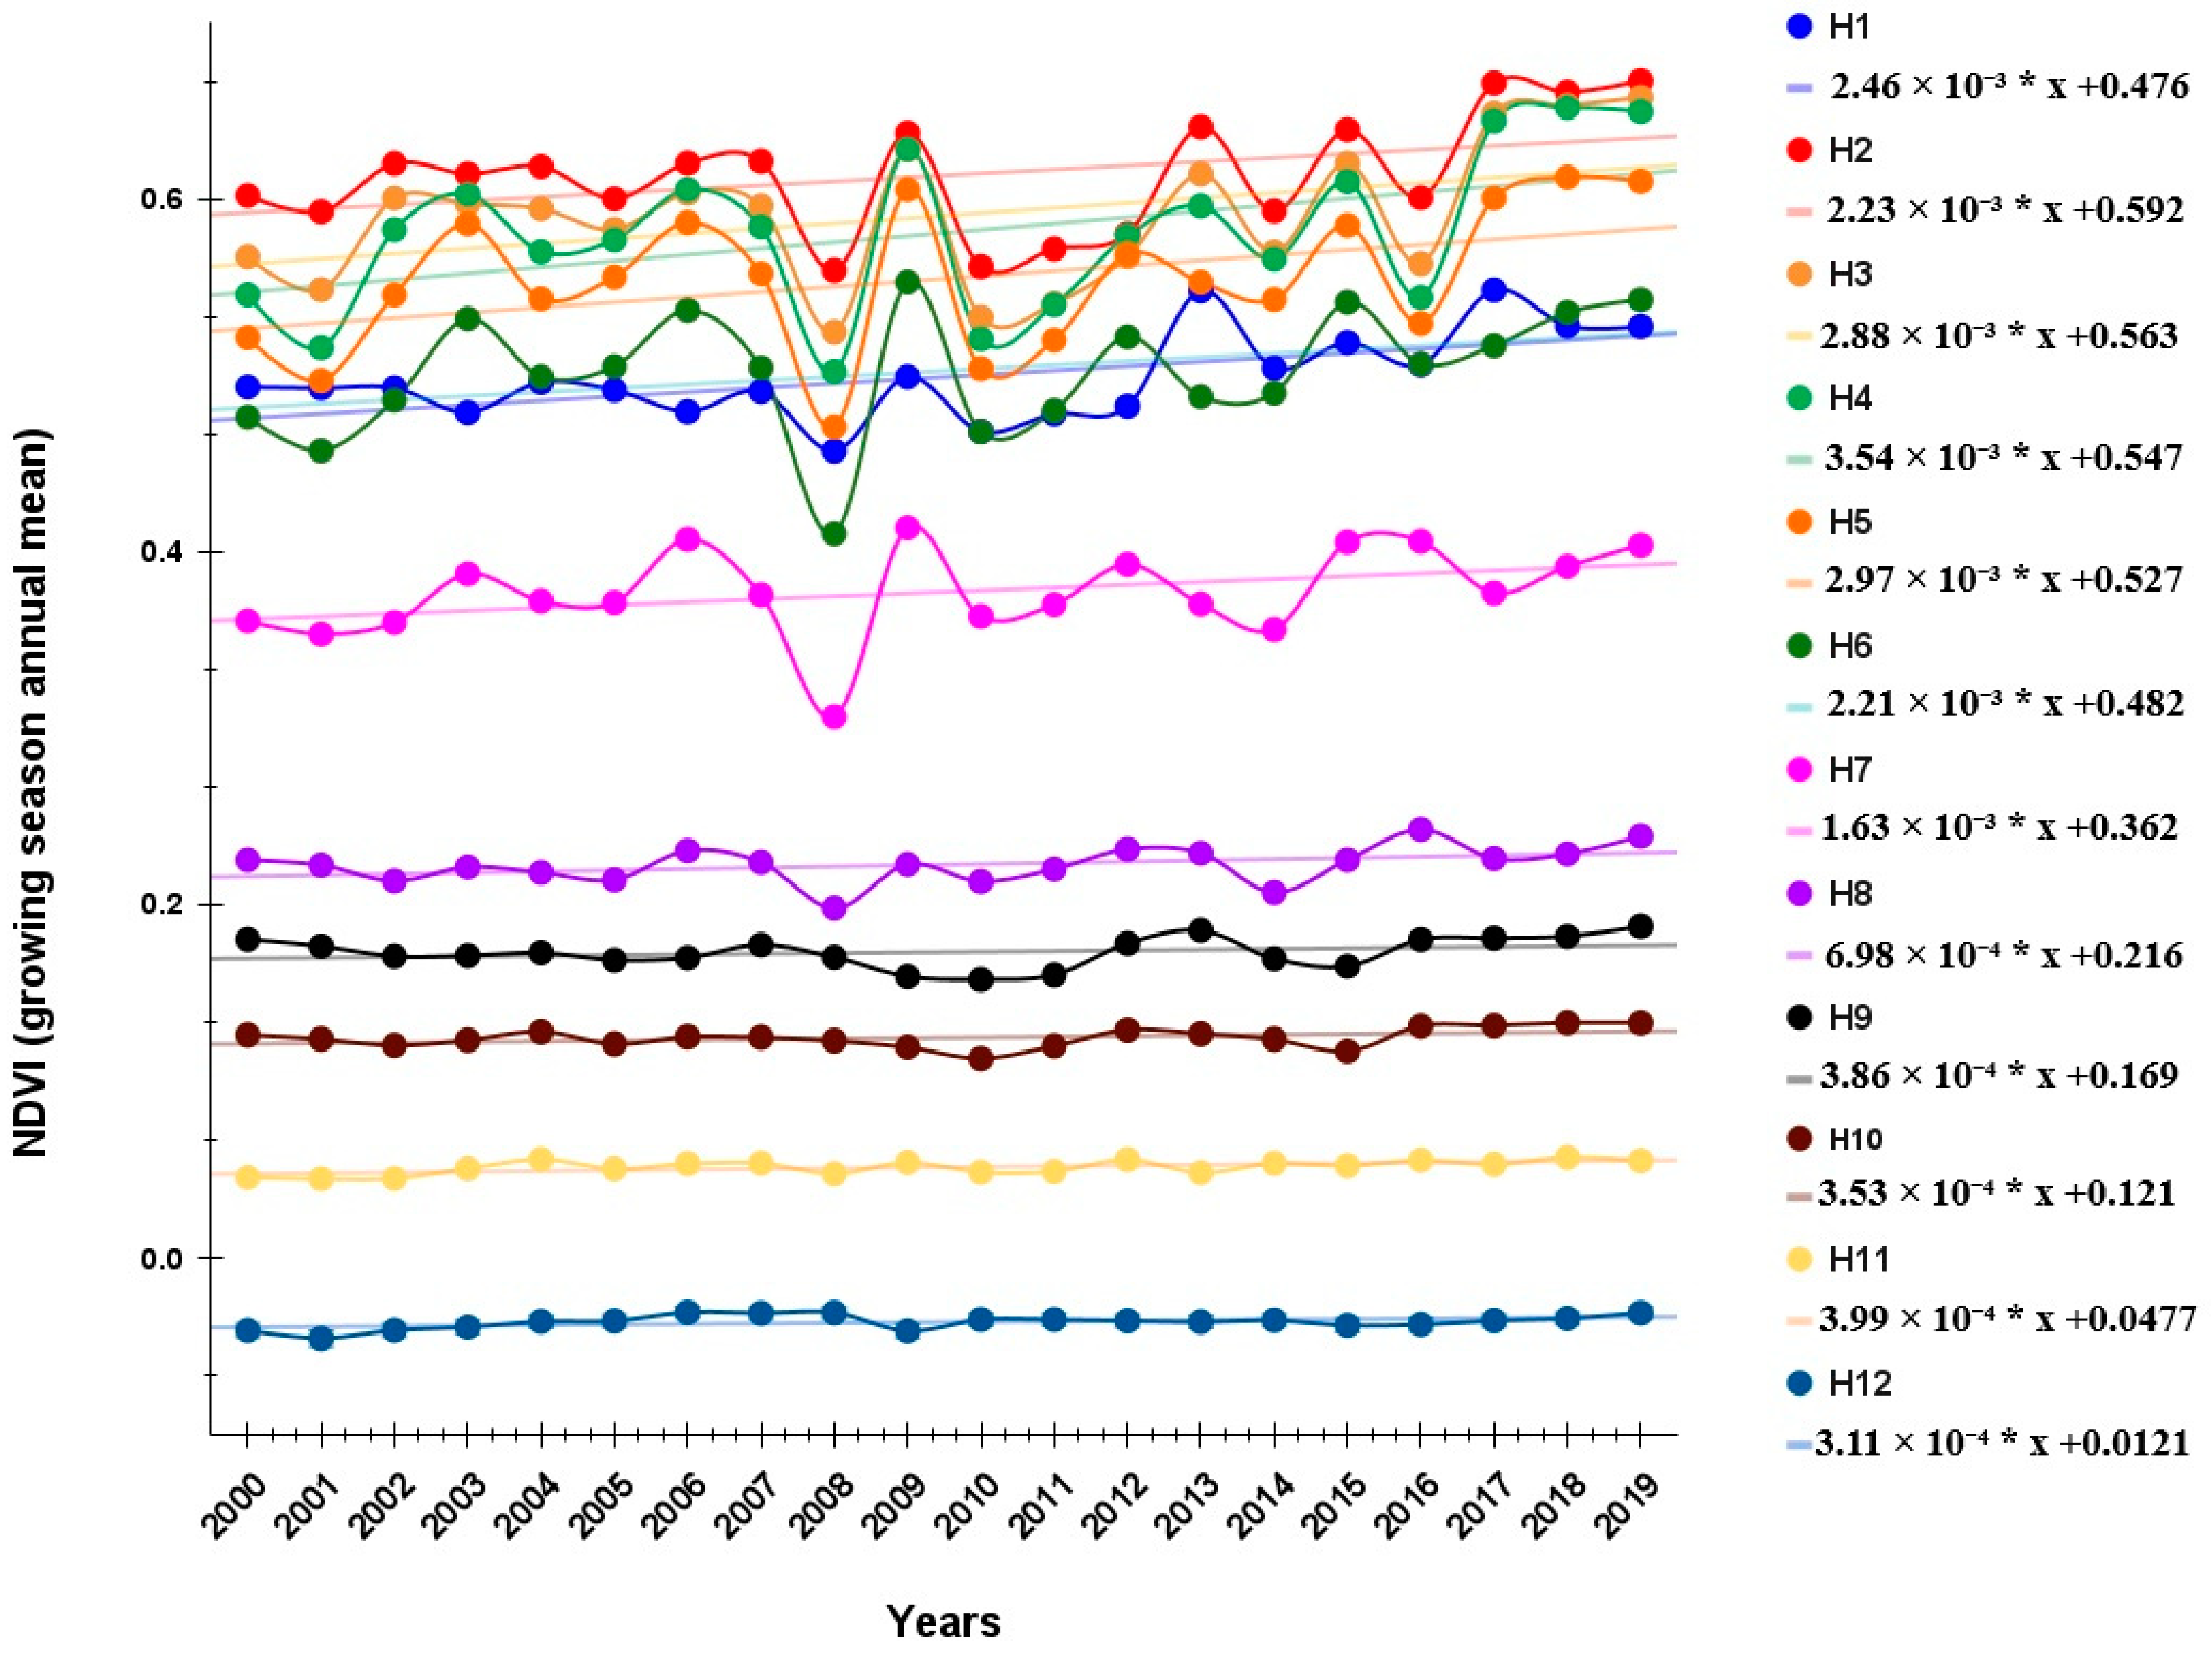
3.1. Temporal and Spatial Variability in Growing Season NDVI

A significant temporal variation was detected in the normalized difference vegetation index (NDVI) values throughout the growing season from 2000 to 2019. With a growth rate of 0.01 per decade (p < 0.05), the overall trend indicates a gradual slight increase in vegetation cover. Notably, the lowest noted NDVI value of 0.336 occurred in 2008, suggesting relatively limited vegetation coverage during that particular year. Conversely, the highest observed NDVI value of 0.401 was recorded in 2017, reflecting a substantial improvement in the vegetation condition (Figure 3). These findings emphasize the dynamic nature of NDVI values over the studied time period and highlight the positive trajectory of vegetation growth across the central Himalaya.
In this study, we used a t-test on the slope from a simple linear regression to determine whether the NDVI data exhibited a significant linear trend over a 20-year period. The null hypothesis was that the slope equals zero (no trend), whereas the alternative hypothesis was that the slope does not equal zero. With 20 data points, the estimated slope was approximately 0.0016862 per year, and the standard error of the slope was about 0.000546, resulting in a t-statistic of roughly 3.09 (with 18 degrees of freedom). The corresponding p-value (approx. 0.006) was less than 0.05, leading us to reject the null hypothesis and conclude that a statistically significant positive trend exists. This slope corresponds to an increase in the NDVI of approximately 0.0337 (0.0016862 × 20) over the 20-year period.
The spatial distribution of the mean annual growing season NDVI and the annual trends of change within each grid for the period spanning from 2000 to 2019 were also analyzed here (Figure 4). Across the entire region, most of the area was occupied by mean annual growing season NDVI values ranging from 0.264 to 0.899. Low NDVI values (0 to 0.337) were consistently observed along the northern and northeastern margins. In contrast, grids with high NDVI values (ranging from 0.652 to 0.999) were predominantly distributed in the central areas along the Nepal Himalayan belt (Figure 4A).
The grids across the entire region demonstrated an increasing trend, indicating a gradual enhancement in vegetation cover. Despite the overall increasing trend in the NDVI value, a major portion of the areas displayed a decline. These areas were predominantly located in the northern regions, along with portions of the southwestern lowland areas. Spatially, these declining areas were scattered and intersected, highlighting noticeable spatial variations (Figure 4B). The spatial distribution of the mean annual NDVI and its trends within each grid provide valuable insights into the heterogeneity in vegetation conditions across the studied region.

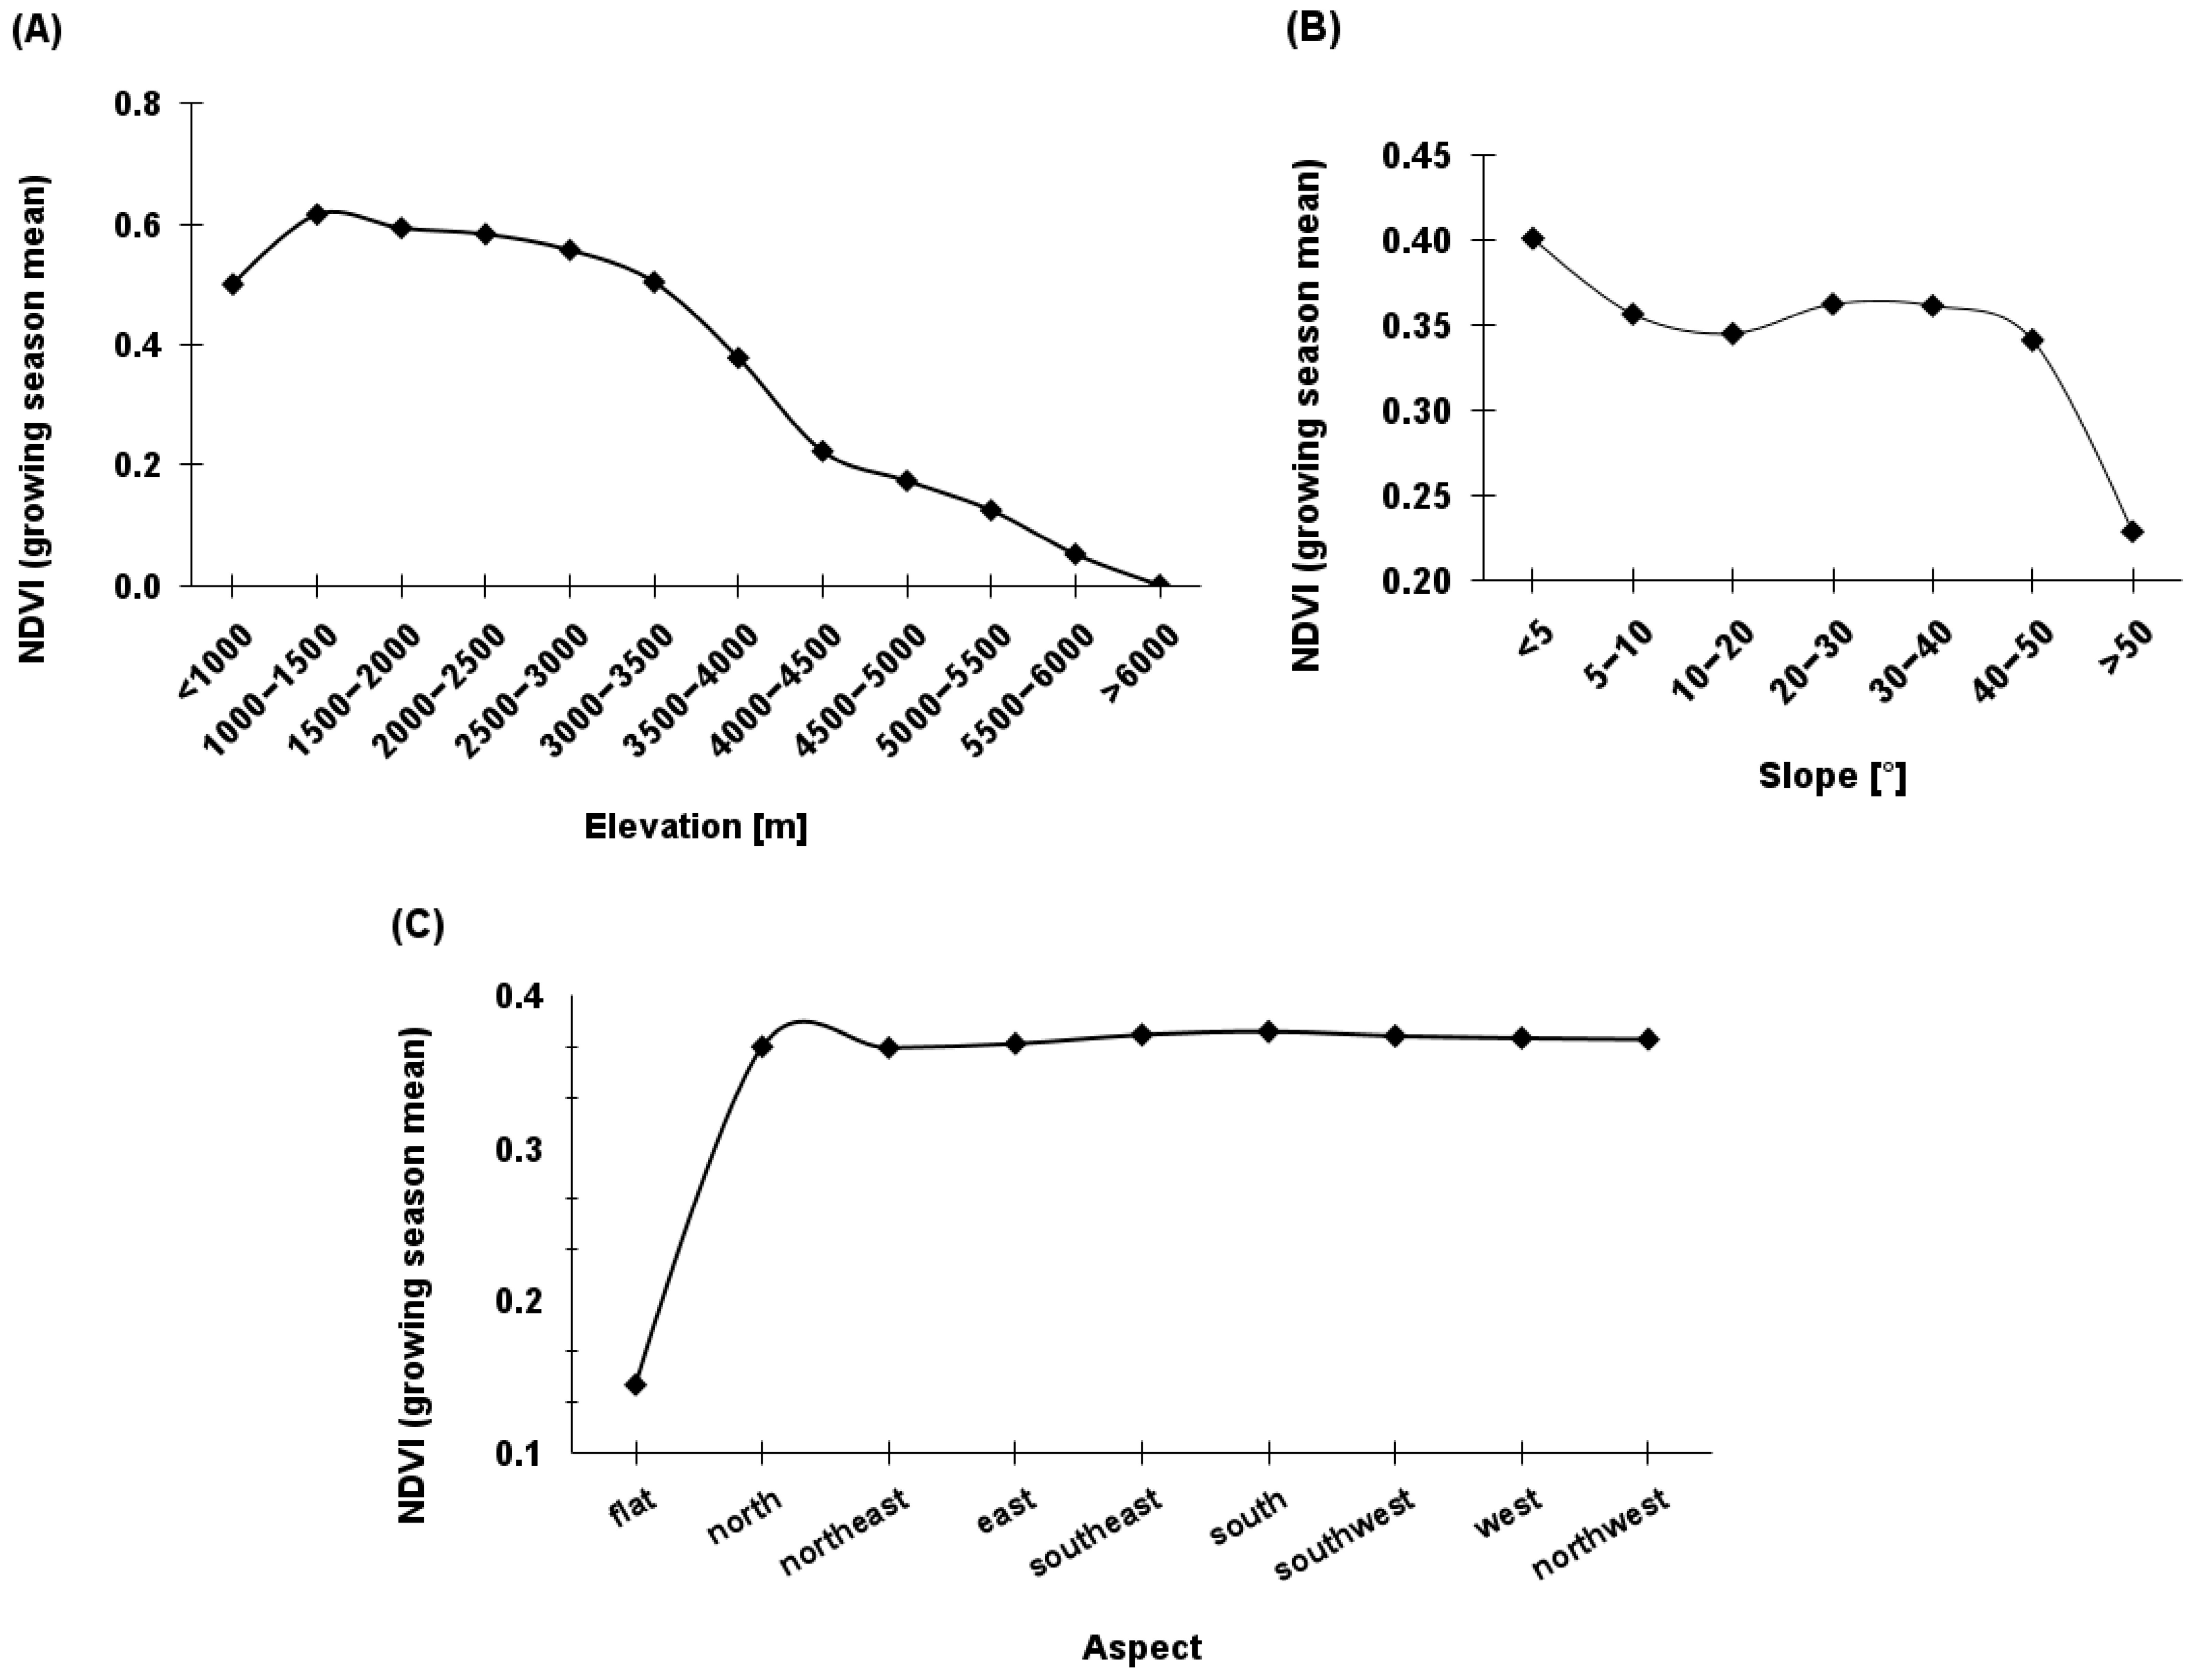
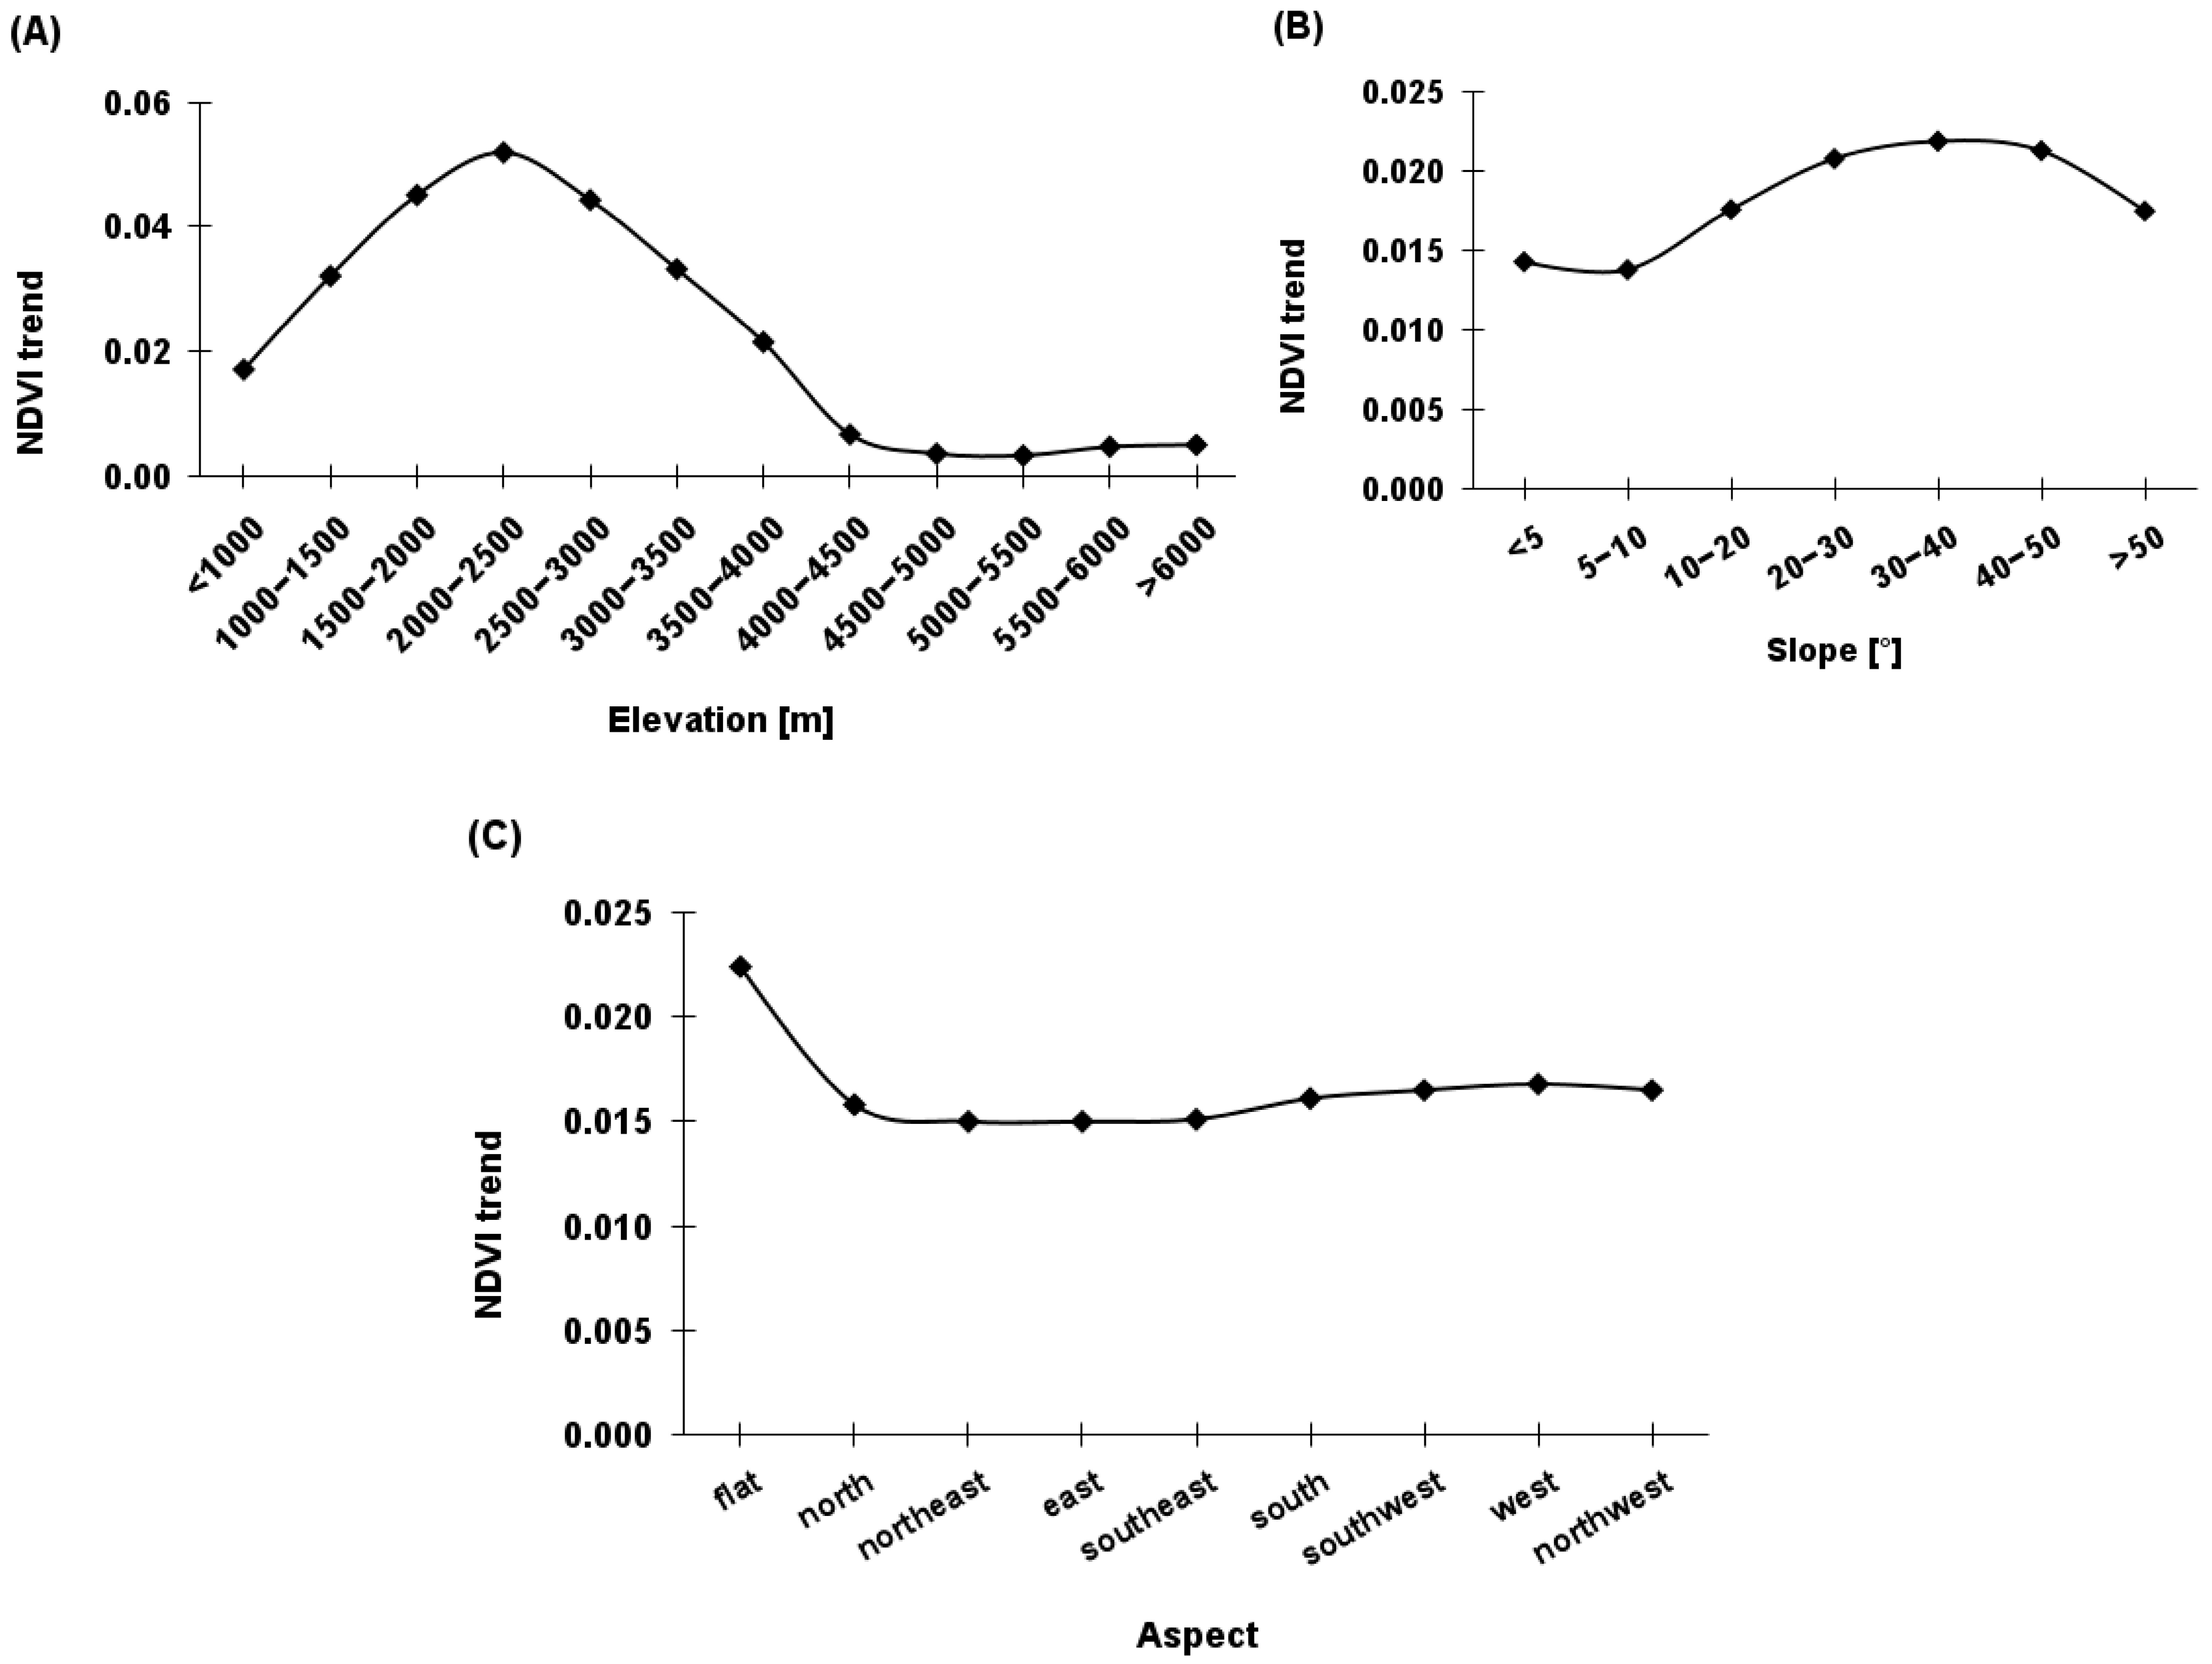
3.2. Effect of Terrain Factors on the NDVI

To investigate the influence of terrain factors on the NDVI, we focused on three key topographic variables: elevation, slope, and aspect. In accordance with the findings depicted in Figure 5A, the mean NDVI values during the growing season displayed an initial gain, followed by a subsequent decline, as elevation increased. Notably, the highest recorded NDVI value (0.615) was observed within the elevational band of H2: 1000–1500 masl.
The maximum NDVI values were recorded for slopes below 5 degrees, indicating a favorable condition for vegetation growth. More greenness was observed below 5 degrees over the last two decades. From slopes 5 to 40, the average NDVI over 20 years varied between 0.4 to 0.34 (Figure 5B). Conversely, the relationship between aspect and NDVI values reveals no discernible influence of aspect on vegetation conditions (5C). The absence of significant variations in NDVI values across different aspect values in our results suggests that the aspect of the terrain does not play a substantial role in shaping vegetation dynamics in the studied area. Coarser satellite images can make it challenging to obtain accurate results in aspect/slope-dependent NDVI analysis. More specific or local scale studies are needed to define the effect of aspect on the mean NDVI.
Overall, our investigation highlights the importance of considering elevation and slope when assessing the impact of terrain on the NDVI. Between 1000 and 3000 masl, the growing season mean NDVI in the Nepal Himalaya ranged approximately from 0.6 to 0.46 (Figure 5A). This elevation range supports increasing vegetation, resulting in greater greenness and healthier plant cover. While elevation exhibited a distinct effect on the mean NDVI values, indicating an optimal elevation range for vegetation productivity, slope demonstrated a nonlinear relationship, with gentle slopes being more favorable to plant growth. These findings contribute to a deeper understanding of the complex interactions between terrain characteristics and the NDVI, thereby facilitating more informed assessments of ecosystem health and dynamics.
An overview of the relationship between NDVI trends and the three terrain factors, i.e., elevation, slope, and aspect, was also analyzed. Specifically, the figure (Figure 6A) showcases the variations in NDVI trends based on different elevation zones. The NDVI per decade trends were as follows: 0.017, 0.032, 0.045, 0.051, 0.044, 0.033, 0.021, 0.006, 0.003, 0.003, 0.004, and 0.005 for the elevational bands H1 to H12 (which vary from below 1000 to above 6000 masl). The NDVI growth rate was minimal where the slope was less than 10 degrees. The NDVI growth rate was the highest (0.022, 0.023 per decade) in areas with slopes of 20–30° and 30–40° and the lowest in areas with slopes of 5–10°. This reveals that vegetation improvement was visible as the slope increased to 40° (Figure 6B). The influence of aspects on NDVI growth trends remained relatively consistent over the decades, as depicted in Figure 6C.
The vegetation improvement area included 32.5%, the stable unchanging region accounted for 41.2%, and the vegetation degradation area represented only 26.3% of the whole research area. For a more detailed examination of vegetation cover changes within Nepal’s borders, the breakdown was as follows: 47.5% indicated enhancement, 29.4% remained stable, and 23.1% depicted degradation. Figure 7A provides insights into the spatial distribution of changes in vegetation greenness across the entire studied area. Upon closer examination, it becomes apparent that the western part of Nepal exhibited a higher degree of degradation in vegetation greenness (Figure 7B). On the other hand, the pixels located on the eastern side of Nepal gained more vegetation greenness as compared to the western part of Nepal (Figure 7C). This observation suggests that the eastern side of Nepal exhibits favorable conditions for vegetation growth. On the other hand, areas such as the Ganges lowland demonstrate more pronounced degradation in vegetation greenness. These regions may be affected by various factors, including land use changes, climate variability, or anthropogenic activities, leading to a decline in vegetation cover and greenness. Vegetation greenness appears to exhibit more stability on the Tibetan Plateau. A substantial portion of the highly elevated area demonstrated an increased stability in the trend of growing season NDVI. Between the elevations of 3000 to 4000 masl, a noteworthy degradation trend was evident, comprising 25% of the area within this elevation range. Below this elevation threshold, a more pronounced improvement in vegetation condition becomes noticeable (Figure 8).
An analysis of changes in vegetation greenness at different elevational ranges, from H1 (below 1000 m) to H12 (above 6000 m), indicates distinct spatial patterns of vegetation greenness across these elevation zones. The findings reveal that the elevation ranges from H2 to H6 exhibited significant gains in vegetation greenness (Figure 9). Above H6, which represents the band 3000–3500, the vegetation greenness appeared to exhibit more stability. This suggests that at these higher elevations, the greenness remains relatively consistent over time.
The NDVI over time identifies different growth rates at different elevational ranges (Figure 10). Within the elevation range of 2000 to 2500 masl (H4), the NDVI demonstrated the maximum increasing trend with a growth rate of 0.035 per decade, which indicates a significant increase in vegetation greenness in that specific elevation range. It slowed down to 3500–4000 masl. Nevertheless, above the elevation of 4000 masl, the growth rate was still positive and stable but not as sharp as at middle elevations (Figure 6A and Figure 10).
A lower mean NDVI during the growing season was noted in 2008 and 2010 (Figure 3 and Figure 10). Low temperature, radiation, and evapotranspiration in 2008 (Figure 11) might have contributed to the reduced NDVI. In 2009, the observed peak of greenness (Figure 10) aligned with elevated temperature, solar radiation, and evapotranspiration (Figure 11) in the same year, pointing to increased vegetation activity.

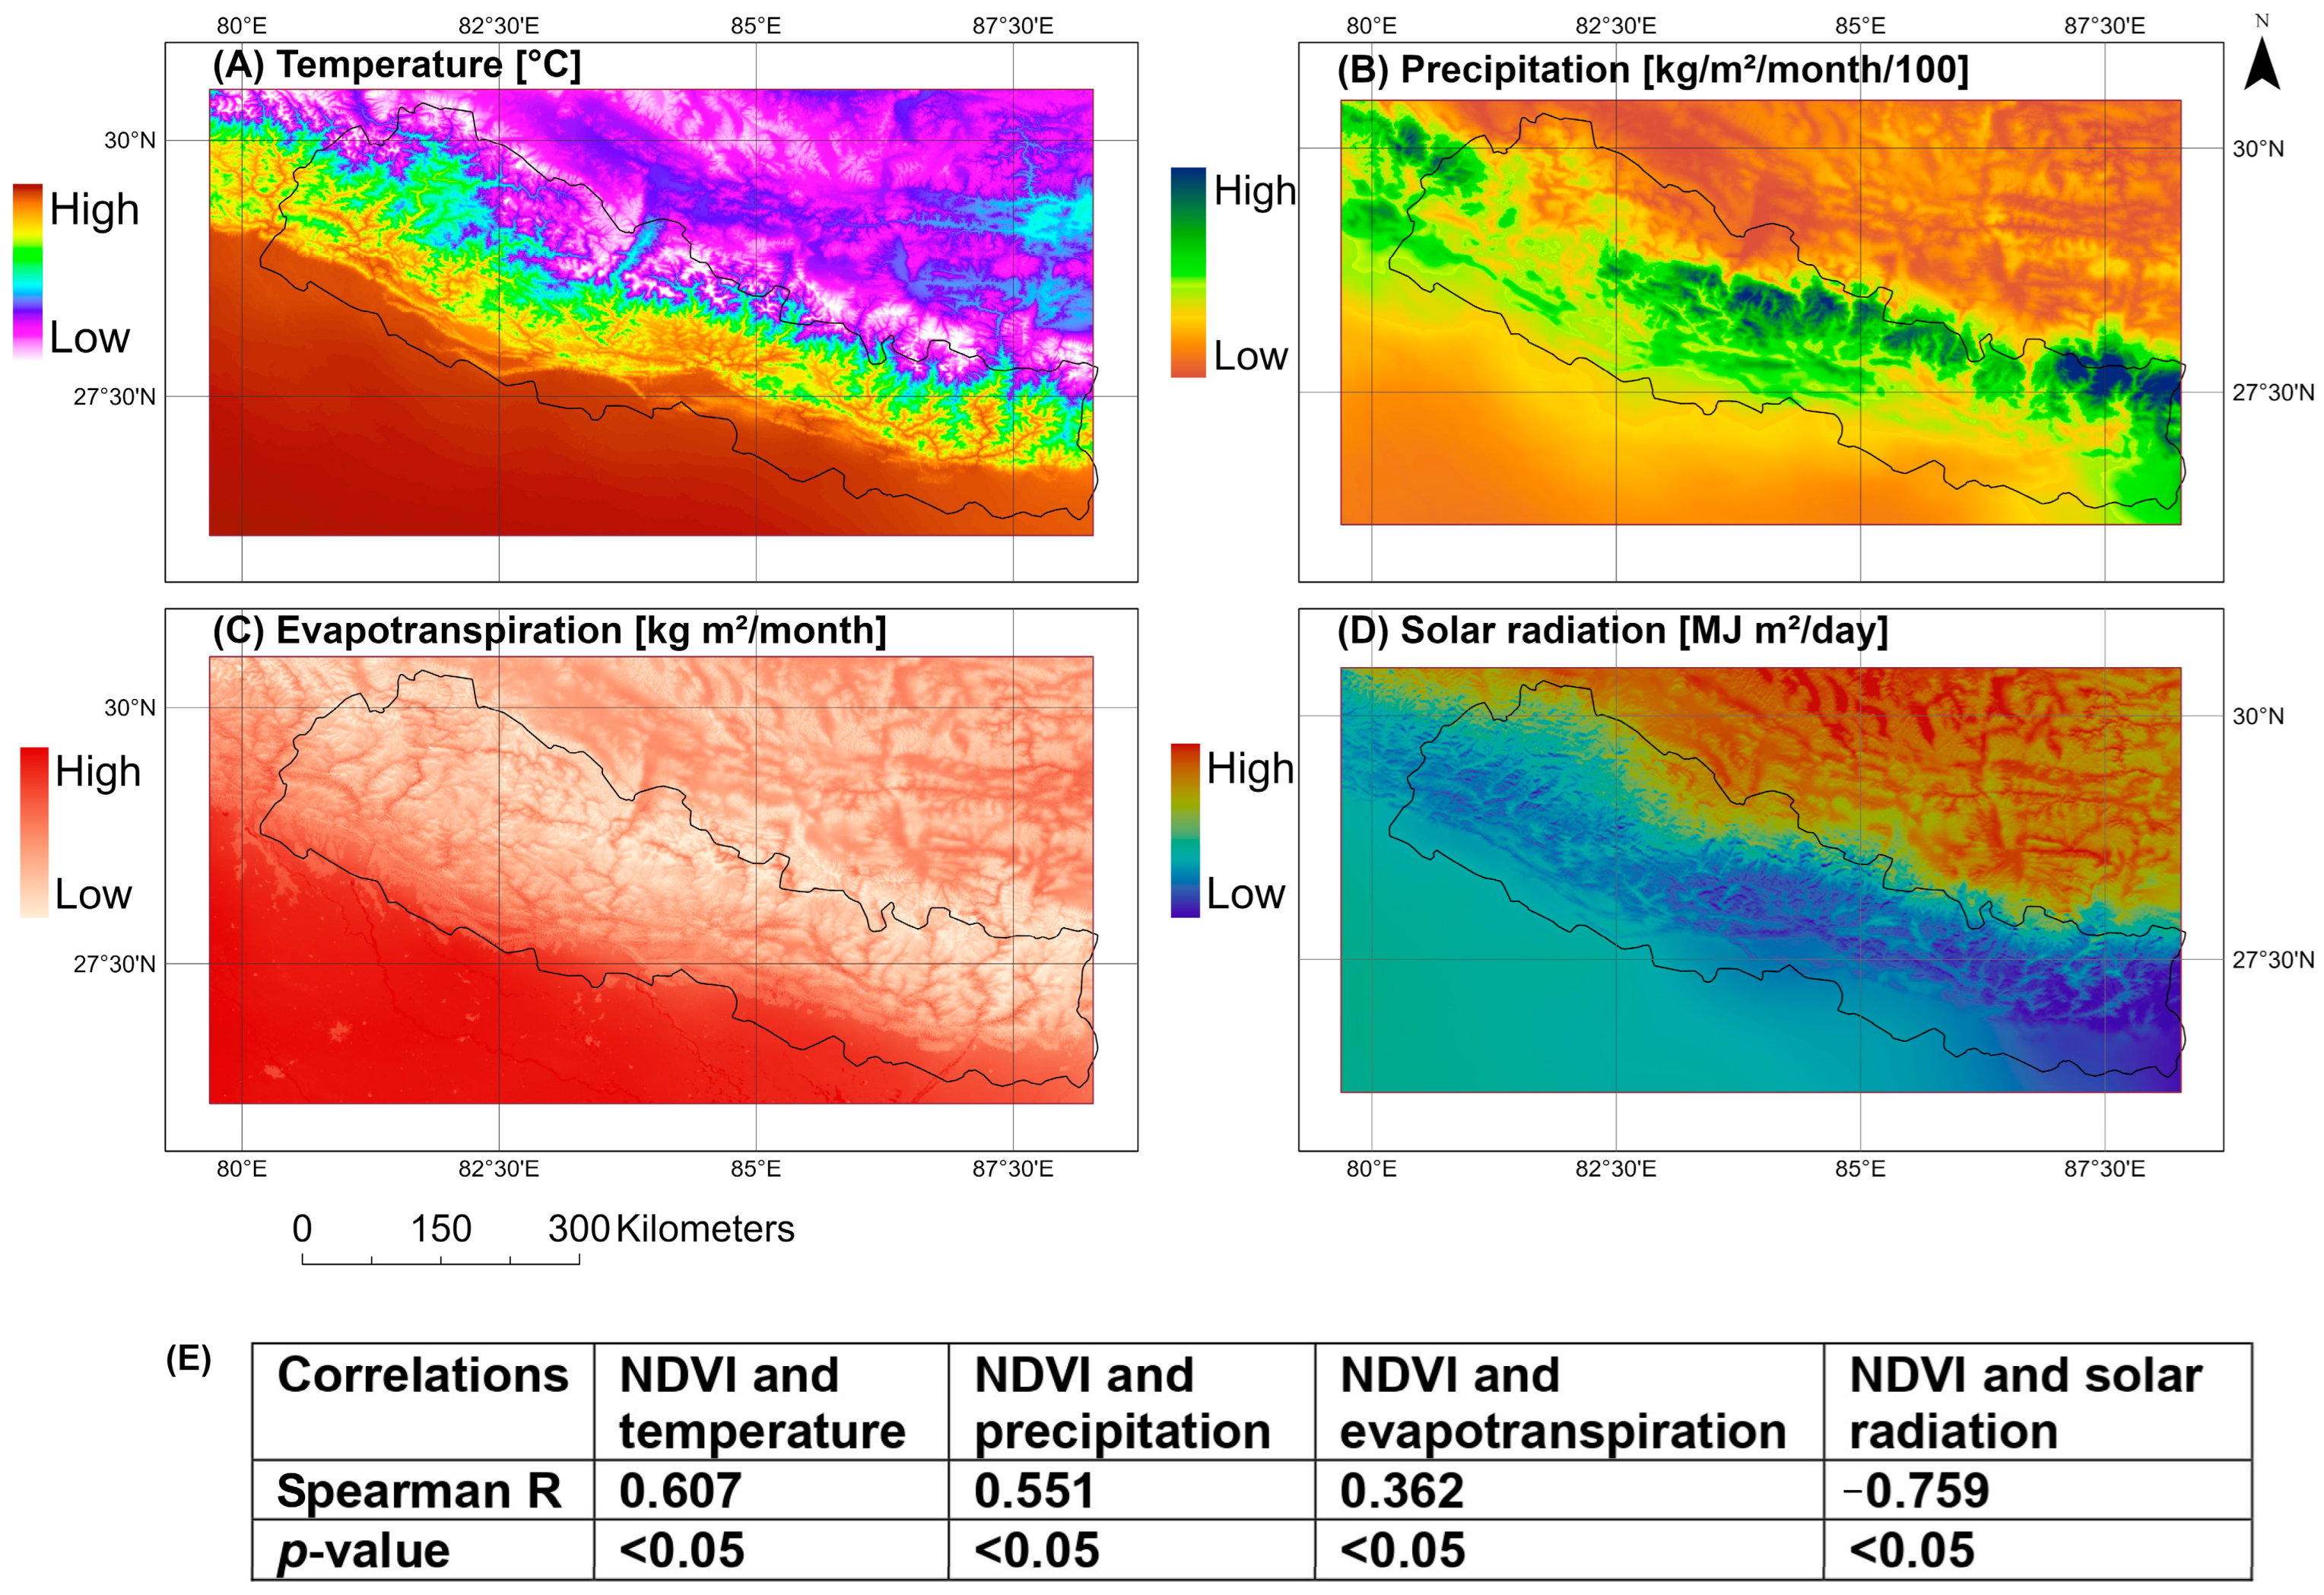
3.3. NDVI Sensitivity to Climate Parameters

In general, vegetation greenness and temperature are positively correlated. However, this connection is altered by the interaction with topography, similar to the NDVI’s association with precipitation and evapotranspiration. Areas characterized by lower radiation (Figure 12D) exhibited enhanced vegetation greenness, largely observed in the western part of Nepal (Figure 7C). This finding supports the negative correlation between the NDVI and radiation in the mentioned areas (Figure 12D). The variations in the mean NDVI over the two decades (Figure 3) were associated with the fluctuation in the climate parameters (Figure 11).

3.4. NDVI Sensitivity to Climate in Relation to Terrain Factors

Table 1 shows the relationship between the mean NDVI and the climate parameters (i.e., temperature, precipitation, evapotranspiration, and solar radiation) for different elevations, slopes, and aspects. By analyzing this table, we can examine how the growing season mean NDVI varies with climate across different elevation ranges, slope gradients, and aspects. This kind of analysis can identify patterns or trends in vegetation growth (as indicated by the NDVI) in relation to changing climatic conditions.

3.4.1. Elevation-Dependent Association Between the NDVI and Climate

NDVI and Temperature: As elevation increases, the correlation between the NDVI and temperature undergoes a gradual adjustment from negative to positive. At lower elevations (<1000 masl), there is a strong negative correlation between the NDVI and temperature (as temperature increases, NDVI values decrease). So, higher temperatures may have a detrimental effect on vegetation growth at lower elevations (Table 1).
In the elevation range of 1500 to 4000 masl, the correlation between temperature and NDVI is either very weak or statistically insignificant. This suggests that there is little to no discernible relationship between temperature and vegetation greenness (as captured by the NDVI) within this elevation range (Table 1). One possible explanation for this uncorrelated behavior could be the influence of human activities in the Nepal Himalaya and surrounding areas. Human activities, such as agriculture, deforestation, land use changes, and infrastructure development, can significantly impact vegetation dynamics and mask the influence of temperature on the NDVI. These elevation zones, which may be more heavily influenced by human activities, might experience alterations in vegetation patterns that are not solely driven by temperature variations.
After reaching an elevation of 4000 masl and beyond, the normalized difference vegetation index and temperature exhibit a positive correlation. This indicates that there is a greater correlation between higher temperatures and increased plant greenness as elevation rises, as shown by higher NDVI values. In these higher elevation zones, there is a positive link between the NDVI and temperature, which shows that a rise in temperature favors more plant growth (Table 1). With longer growing seasons, less cold stress, and more energy available for photosynthesis, the increasing temperatures at higher elevations may offer better circumstances for plant development. The data suggest that elevation plays a role in influencing the correlation between the NDVI and temperature, with different elevation ranges exhibiting different patterns of correlation.
NDVI and precipitation: For elevations below 1000 masl, there is a strong positive correlation between the NDVI and precipitation, with a correlation coefficient of 0.708 (p < 0.05). This suggests that higher precipitation levels are associated with increased vegetation greenness in these lower-elevation zones. Except for the elevation range from 3500 to 4500 masl, there is a gradual transition from a positive correlation between vegetation greenness and precipitation to a negative correlation, as elevation increases. The coefficients are even more negative as elevation increases further, i.e., −0.176 for 2000–2500 masl, −0.449 for 2500–3000 masl, −0.455 for 3000–3500 masl, and so on (Table 1). Higher precipitation levels are associated with lower vegetation greenness at these higher elevation ranges.
NDVI and evapotranspiration: The table also presents the correlation between the normalized difference vegetation index and potential evapotranspiration across different elevation ranges. There is a negative association between the NDVI and evapotranspiration at lower elevations below 1000 masl and elevation ranges of 1000–1500 masl and 1500–2000 masl. There is a decline in vegetation greenness as evapotranspiration increases. These areas might have experienced higher water stress, leading to reduced vegetation growth. In contrast, at elevations ranging from 2000 to 6000 masl, there is a positive correlation between the NDVI and evapotranspiration (Table 1). This implies that as evapotranspiration increases, there is an enhancement in vegetation greenness. These areas may have more favorable water availability and suitable conditions for vegetation growth.
NDVI and solar radiation: Below 1000 masl, there is a negative correlation coefficient of −0.559 between the NDVI and solar radiation, resulting in solar radiation increases and vegetation greenness decreases in these lower elevations. From 1000 to 2000 masl, there is a positive correlation between the NDVI and solar radiation, indicating that as solar radiation increases, vegetation greenness also tends to increase within these elevation ranges. The positive correlation between the NDVI and solar radiation continues to be significant until 6000 masl. As solar radiation increases, there is a general trend of increased vegetation greenness.
Therefore, elevation significantly influences the relationships between the NDVI and various climatic factors, revealing distinct patterns across different elevational ranges. At lower elevations (<1000 masl), the NDVI negatively correlates with temperature and evapotranspiration, indicating that higher temperatures and water stress reduce vegetation greenness, while increased precipitation positively impacts it. From 1500 to 4000 masl, the correlation between temperature and the NDVI weakens, likely due to human activities masking natural climatic influences. Beyond 4000 masl, the NDVI positively correlates with both temperature and evapotranspiration, suggesting that warmer temperatures and better water availability at high altitudes promote vegetation growth. Solar radiation generally correlates positively with the NDVI across elevations, except below 1000 masl, where it negatively affects vegetation greenness. These findings highlight the elevation-dependent variation in vegetation responses to climatic factors.

3.4.2. Slope and Aspect-Dependent Correlation Between the NDVI and Climate

The NDVI and temperature show a significant positive correlation over most slope ranges, apart from slopes less than 5 degrees. The correlation coefficients, which range from 0.012 to 0.931, demonstrate a consistent positive association between temperature and the NDVI. With correlation values ranging from 0.062 to 0.700, the NDVI exhibits a positive connection with precipitation in most slope ranges. In places with slopes less than 5 degrees, precipitation has a significant impact on the amount of greenery. The NDVI correlates positively with evapotranspiration on most slopes, with correlation coefficients ranging from 0.460 to 0.832. For slopes of less than 5 degrees, the connection between evapotranspiration and slope is negligible. On the other hand, the negative connection suggests that decreased greenness is linked to more solar radiation (Table 2). The influence of aspects did not provide any significant information in the correlation analysis as the images are coarser for aspect analysis in mountainous regions (Table 3).

4. Discussion

A significant body of scientific literature has highlighted the dynamic modifications unfolding within the Himalayan region as a direct result of climate shifts [25,46,77,78,79,80,81,82,83]. However, the understanding of the relationship between complex terrain and observed shifts in vegetation greenness in response to warming across Nepal and its neighboring areas is still deficient, stressing the need for further analyses of the interaction of climate and NDVI in various topographic settings.

4.1. Trends in Growing Season NDVI

A considerable portion (32.5%) of our study region’s vegetation has been greening since 2000. Case studies documenting vegetation trends in sub-parts of the western Himalaya [9,14], the eastern Himalaya [84], and neighboring Tibet [32,85] show a similar greening pattern. This observed greening phenomenon is consistent with recent global-scale investigations [86,87,88], and comparable trends have been observed in nearby regions such as China [85], where an increase in vegetation productivity has been consistently reported. Eastern Nepal mainly received an improvement in vegetation enhancement (Figure 7C) [84] where precipitation is higher and radiation is moderate to low (Figure 12), compared to other parts of the studied area. The Himalayas have a distinct dual gradient of temperature and moisture [52]. The temperature gradient parallels the north–south elevation gradient [89], whereas the moisture gradient runs east–west [20]. Monsoon systems, prevailing winds, and the barrier impact of mountain ranges influence moisture availability. As a result, the eastern areas receive more precipitation than the western parts. This moisture gradient provides variable moisture regimes over the Himalayas, determining the vegetation patterns found in the region [21].
The degradation of green cover (approximately 26.3% of the entire study area) is particularly pronounced in the western and central regions of Nepal, as well as in the southern part of the study area where the Terai plains and the Ganges lowlands are located. In the context of climate change-induced treeline dynamics, the correlation between tree radial growth and climatic factors is increasingly discussed [5,48,90,91,92,93,94,95]. Higher winter temperatures exert a positive influence on growth, while elevated pre-monsoon temperatures and increased drought stress during the pre-monsoon season have a negative impact, especially in the western and central Himalayas [5,93,96,97]. These findings emphasize the significance of moisture availability as a controlling factor in vegetation dynamics. Western and central Nepal receive notably lower precipitation in comparison to the eastern regions (Figure 12B). Our findings suggest that the enhancement in vegetation cover is primarily concentrated in east Nepal, while signs of degradation are evident in western Nepal (Figure 7). This disparity is likely due to regional differences in precipitation patterns, with eastern Nepal receiving higher and more consistent rainfall, which supports vegetation growth, whereas western Nepal experiences relatively lower and more variable precipitation, contributing to vegetation degradation.
The degradation of vegetation in the western part of the study area, especially in the southern Terai plains and Ganges lowlands, is influenced by climatic and anthropogenic factors. The western region receives relatively lower and more variable precipitation compared to the eastern parts; hence, it is more prone to significant moisture deficits limiting plant growth. This situation is further exacerbated by seasonal droughts, resulting in enhanced drought stress and a decline in vegetation health, especially in areas with low precipitation. Further, the altered pattern of land use, in particular, urbanization, is disrupting the natural dynamics of vegetation. This is very apparent in the Terai plains, where rising population and other economic activities lead to broad-range conversions of land. According to Timilsina et al. [98], the reduction in vegetation cover over the past 20 years has to be mainly attributed to ongoing urbanization, triggered by demographic changes. The dual gradients of moisture and temperature in the north–south and east–west directions in the Himalayas presents unique climatic zones that affect vegetation patterns, with the western region experiencing harsher conditions for plant growth, in particular, in terms of drought stress. Research on the Qinghai–Tibet Plateau [99,100], which is subjected to even drier conditions, indicates that climate change, particularly increased temperatures and variable precipitation, has significantly impacted vegetation dynamics. For instance, a study by Shen et al. [101] found that rising temperatures and altered precipitation patterns have led to changes in grassland productivity, with increased temperature sometimes restraining vegetation growth in dry steppe regions.
Shrestha et al. [46] aimed to delineate the relative contributions of climatic and non-climatic factors to vegetation dynamics in Nepal. Their study revealed an overall increase in the NDVI at a rate of 0.0013 per year throughout the study period, with a large portion of the vegetation cover exhibiting a positive greening trend [46]. They reported that vegetation dynamics in higher elevations are predominantly driven by temperature fluctuations [46], while lower elevations are more influenced by precipitation and human interventions, such as agricultural expansion [46]. These findings suggest that observed trends in vegetation improvement and degradation are largely attributable to human activities, in line with previous studies on land use change in the region [6,102]. Moreover, distinguishing the effects of climatic influences from human impacts on vegetation dynamics over the past centuries presents a complex challenge [103].
Approximately 41.2% of the total study region shows stability. The northeastern part of the study region, situated within the Tibetan Plateau, predominantly exhibits a state of consistent greenness. The Tibetan Plateau within our study domain demonstrates a modest increase in vegetation cover, distributed across various areas. Although this rise is dispersed, most of this area is characterized by growth stability (Figure 7A). This observation aligns with conclusions drawn from the existing literature [18,104] regarding the overall vegetation dynamics on the Tibetan Plateau.
The growth rates (0.01 per decade) observed in the NDVI trend within our study area are supported by several studies conducted across various Himalayan regions, encompassing Nepal, India, and the Tibetan Plateau. These studies have consistently identified a comparable growth trend in the NDVI during the growing seasons [6,17,30,41,49,105,106,107,108,109,110,111]. A lower mean NDVI during the growing season was noted in 2008 and 2010 (Figure 3 and Figure 10). Heavy snow might have caused a decline in the length of the growing season [53,108,109]. The annual mean NDVI (growing season) decreases with elevation (Figure 5). The growth rate of the NDVI does not follow this pattern (Figure 6). The rate reaches its peak at around 2500 masl, after which the NDVI trend slows down. Surprisingly, once the elevation surpasses 4000 masl, the growth rate maintains a consistently increasing trend even as the elevation increases further (Figure 6). In a recent study, Anderson et al. [17] also reported similar significant positive and steady NDVI growth rates in Nepal, spanning elevations from 4125 m to 6000 m, using the Mann–Kendall trend analysis. Their findings revealed growth rates ranging from 0.0035 to 0.0034 per decade by employing Landsat-derived NDVI data. Similarly, our analysis, based on MODIS NDVI data within the same elevated region in our study area, yielded a growth trend of 0.003 to 0.004 per decade (Figure 6). The growth rate of the NDVI is slightly higher in areas characterized by a slope ranging between 20 to 30 degrees in comparison to regions with gentler inclines (Figure 6).
The greening trend at mid-elevations suggests favorable conditions for sustainable agroforestry and biodiversity conservation, aligning with previous studies that highlight the role of temperature-driven vegetation expansion in the Himalayas [46,106]. However, browning signs for lowland and western parts indicate potential risks of land degradation, increased evapotranspiration stress, and unsustainable expansion of agriculture, as verified in the research findings of Mishra and Chaudhuri [14] and Li et al. [84]. It is necessary to comprehend these climate–vegetation interactions to develop climate adaptation strategies, such as the implementation of drought-resistant crops, the optimization of irrigation systems, and an enhancement in land management policies in water-limited areas [41]. Conservation efforts should also be focused on protecting vulnerable high-elevation ecosystems where the NDVI increases but remains vulnerable to extreme climatic alternations [17].

4.2. Alignment of Growing Season NDVI with Climate, Taking Complex Terrain into Account
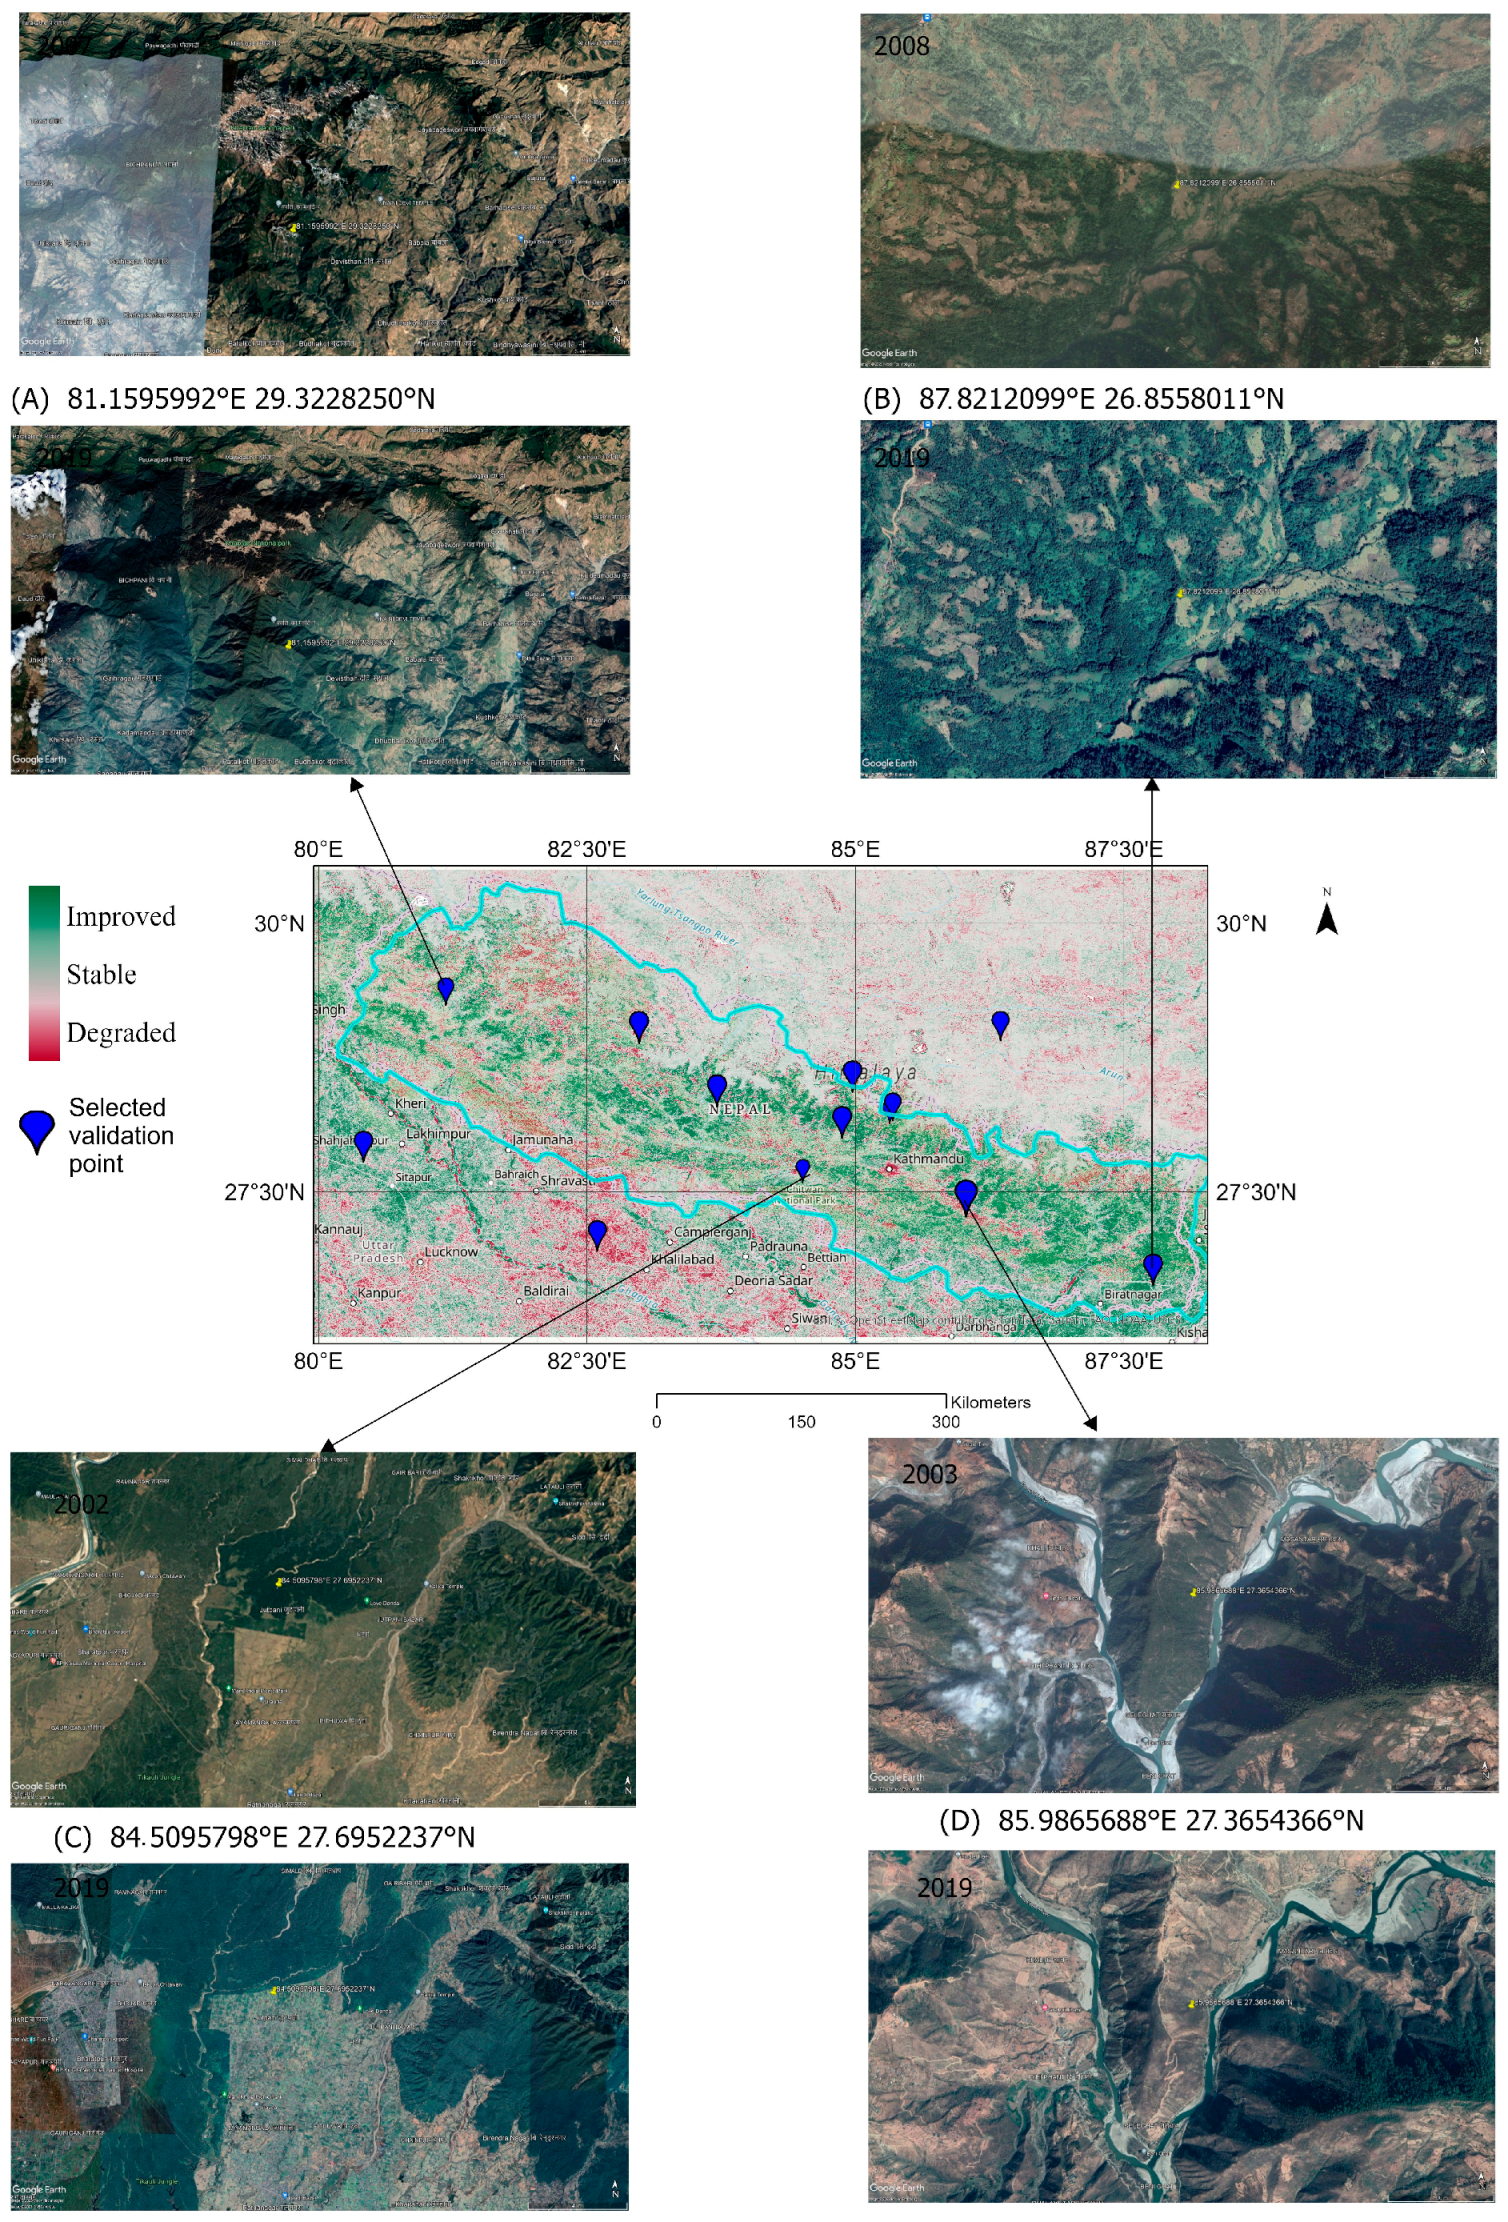
Across the study region, there exists a positive relationship between temperature, precipitation, and potential evapotranspiration with the NDVI, although solar radiation does not follow this pattern (Table 1). Within the lower elevational band of H1 (<1000 masl), precipitation acts as a promoter of vegetation greenness, as also observed in the research by Sarania et al. [112]. Conversely, an increase in temperature, evapotranspiration, and solar radiation discourages vegetation enhancement in this region. In the higher elevational band of H9 (>4500 masl), a contrasting correlation between climatic factors and the NDVI is apparent. Here, the NDVI is associated with an increase in temperature, evapotranspiration, and solar radiation, all of which foster vegetation growth, as highlighted by some other studies [112,113,114,115]. Precipitation and solar radiation play a vital role in vegetation cover change on gentle slopes. Nepal’s remarkable biodiversity is attributed to its complex topographical and climatic variations [21], which shift swiftly over relatively short distances, often within just a few kilometers [41]. Understanding the elevational dependency of vegetation cover change in the Nepal Himalaya and its adjoining areas due to long-term climate modification is critical for understanding the complicated dynamics of the region’s ecosystems [50,84].
While much of our findings align with previous studies showing a general greening trend in the mid-elevation zones of the Himalayas [9,85], our results reveal distinct spatial and elevational variations that have been underexplored in the literature. Especially noteworthy is that the greening trends above 4000 masl in our study area show a consistent NDVI growth rate (in line with Anderson et al.) [17], even for those regions where vegetation productivity is often regarded as limited due to climatic constraints. Our study supports previous findings regarding the importance of temperature and precipitation in driving NDVI variability across different elevations [114]. However, our results also show differences in the solar radiation effect. In lower elevation zones (<1000 masl), its impact on NDVI variability appears to be less intense, presumably due to the interplay with evapotranspiration and temperature effects. This is unlike the observation of Rai et al. [115], who reported more consistent variations in solar radiation across all elevation bands. Mainali et al. [106] reported that at lower elevations, where temperatures are higher and solar radiation is abundant, vegetation growth depends more on moisture availability than sunlight. In the central Himalaya, below the treeline, the NDVI is more strongly linked to monsoonal moisture than to temperature or radiation, indicating that water availability is the primary driver of vegetation. As a result, solar radiation benefits vegetation at cold high elevations but has a lesser effect (or even detrimental effect via drought stress) at warmer low elevations.

4.3. Validation

The results from our research confirm the findings of previous studies on the NDVI trend in the central Himalaya [9,17,32,47,51,85]. The observed trend in the NDVI mean, with recorded low values in 2008 and 2010, and the elevational dependency of the NDVI trends are validated by the findings of Li et al. [84]. Random validation points were strategically chosen throughout the study region (Figure 13). These points were then validated by comparing trend results to images from Google Earth and Landsat. This validation method was also adopted in previous research [9,116]. We chose random validation points dispersed throughout the whole study region to provide a robust validation of the NDVI patterns seen in this study. The selection was performed to ensure coverage of diverse vegetation types, elevation bands, and terrain characteristics to capture a wide range of vegetation responses. The selection included areas with significant vegetation enhancement as well as regions showing degradation trends, ensuring comprehensive validation of NDVI variability. By targeting areas with both positive and negative NDVI trends, we aimed to accurately represent the heterogeneity in the vegetation conditions across the study area.
The NDVI, while widely used, has constraints such as sensitivity to atmospheric interference and saturation in high biomass regions. Advanced indices like EVI and EVI2 address these issues by improving sensitivity to dense vegetation. Zhen et al. [117] illustrated the better performance of EVI2 in snow-affected areas and its consistency across sensors, such as Sentinel-2 and Landsat-8. Similarly, Son et al. [118] indicated the potential of EVI for crop yield estimation under different climatic conditions. Despite these advancements, the NDVI remains the most suitable index for this study due to its extensive validation, ease of interpretation, and availability of long-term datasets. The simplicity in the NDVI thus enables effective regional-scale vegetation monitoring across various topographic and climatic gradients, which is so important in the study area in the central Himalaya. In addition, MODIS NDVI provides consistent 16-day composite data with the least atmospheric noise, making it ideal for the analysis of long-term trends. Moreover, the wide usage of the NDVI within similar studies advocates for its reliability and comparability on vegetation dynamics assessment in this ecologically sensitive region.
The eastern and central Middle Mountain regions accounted for nearly half of the forest gains in all three time periods, while the western Middle Mountains contributed about one-fifth of the total gains [119]. Most forest gains occurred early (before 2014) in the central Middle Mountains, with smaller scattered early gains in the western Terai region [119]. The high rate of cropland abandonment in the Middle Mountains (86%) provides a key explanation for the strong NDVI increase in this region, as abandoned agricultural land transitions into forest, shrubland, or grassland over time [119]. Similarly, the 64.7% abandonment in the High Mountains suggests vegetation recovery in formerly cultivated areas, contributing to localized greening trends [119]. In contrast, the lower abandonment rates in Siwalik and Terai reflect more stable or actively cultivated landscapes, likely corresponding to weaker NDVI increases in these regions [119]. These spatial differences highlight how land use transitions, specifically the widespread shift from agriculture to natural vegetation in the Middle Mountains, play a crucial role in shaping NDVI trends.

4.4. Limitations

In this study, the spatial resolution of the data is not very high; this was a necessary trade-off between data availability and the need for broader temporal coverage. For future investigations, higher-resolution NDVI datasets or acceptable approaches to improve data accuracy must be included. Certain uncertainties persist in our study. The climate data resolution is still not as high as that of the NDVI obtained directly via remote sensing. So, we had to resample it to the coarser cell. There is also no uniform categorization standard regarding the NDVI trend grading in the available literature; therefore, in this work, the quantitative grading of the NDVI change trend is based on features of central Himalayan vegetation. To guide ecological monitoring and mountain vegetation restoration initiatives, future studies should investigate the influence of microclimate and human activities on the mountain NDVI. Human influences are widespread in the central Himalaya; however, the scope of this research does not currently allow for a highly detailed analysis of their impact.
Another limitation of this study is the reliance on linear trend analysis, which assumes a constant rate of change and may oversimplify the nonlinear dynamics of vegetation responses to climatic and environmental factors. Vegetation in rapidly changing environments may often exhibit nonlinear responses to variables like temperature, precipitation, and land use. Moreover, more sophisticated approaches could include Theil–Sen trend analysis or machine learning, which could better capture nonlinear vegetation responses to climate change, offering deeper insights into ecosystem dynamics [120]. Future studies should embrace these approaches for more robust trend analyses.
However, for the scope of this research, the use of linear trend analysis with the NDVI is well-suited and justified. Linear models are effective in identifying broad-scale, long-term vegetation trends across large regions, such as the central Himalaya, where the primary goal is to detect general patterns of NDVI change (greening or browning). The simplicity of the method ensures computational efficiency, making it feasible to analyze two decades of MODIS data spanning diverse topographical and climatic gradients. Besides this, linear trend analysis provides a plain interpretation of the variation in time that is necessary while communicating findings with policymakers and other stakeholders.

5. Conclusions

This study provides an in-depth analysis of vegetation dynamics within the central Himalaya, emphasizing the significant influence of elevation, slope, and climatic factors on the normalized difference vegetation index (NDVI) over the past two decades. By integrating high-resolution satellite data with detailed topographical and climatic analyses, this research reveals how vegetation responds differently across various elevational zones, drawing attention to the complex interplay between climate and topography.
The findings highlight the importance of considering these factors in regional environmental management and conservation strategies, particularly in the context of ongoing climate change. This study offers valuable insights for policymakers aiming to develop targeted approaches to protect and enhance vegetation cover across the Himalayas’ diverse and sensitive mountain ecosystems. Additionally, this research underscores the need for future studies to further explore the impacts of micro-climatic conditions and human activities on vegetation trends, especially in transitional zones where distinct plant communities interact, such as the subalpine and treeline ecotones. These insights are crucial for sustaining the biodiversity and ecosystem services of the region, which are vital for the livelihoods of the local communities.

Author Contributions

Conceptualization, M.U.S.N., U.S. and M.B.; methodology, M.U.S.N. and M.B.; software, M.U.S.N. and M.B.; validation, M.U.S.N., U.S. and M.B.; formal analysis, M.U.S.N.; investigation, M.U.S.N. and M.B.; data curation, M.U.S.N.; writing—original draft preparation, M.U.S.N.; writing—review and editing, M.U.S.N., U.S. and M.B.; visualization, M.U.S.N.; supervision, M.B. and U.S. All authors have read and agreed to the published version of the manuscript.

Funding

This research was funded by merit scholarships for international students enrolled at Universität Hamburg, Hamburg, Germany.

Data Availability Statement

The new data created and presented in this study are available on request from the first author.

Conflicts of Interest

The authors declare no conflicts of interest.

References

  1. Breckle, S.W. Walter’s Vegetation of the Earth: The Ecological Systems of the Geo-Biosphere; Springer: Berlin/Heidelberg, Germany, 2002. [Google Scholar]
  2. Lovejoy, T.E.; Hannah, L.J. (Eds.) Biodiversity and Climate Change; Yale University Press: New Haven, CT, USA; London, UK, 2019. [Google Scholar]
  3. Baker, B.; Moseley, R. Advancing treeline and retreating glaciers: Implications for conservation in Yunnan, PR China. Arct. Antarct. Alp. Res. 2007, 39, 200–209. [Google Scholar] [CrossRef]
  4. Schickhoff, U. Dynamics of mountain ecosystems. In Handbook of Biogeography; Millington, A., Blumler, M., Schickhoff, U., Eds.; SAGE Publications: London, UK, 2011; pp. 313–337. [Google Scholar]
  5. Schickhoff, U.; Bobrowski, M.; Böhner, J.; Schwab, N.; Müller, M.; Scholten, T.; Weidinger, J.; Shrestha, B.B. Climate Change and Treeline Dynamics in the Himalaya. In Climate Change, Glacier Response, and Vegetation Dynamics in the Himalaya; Singh, R.B., Schickhoff, U., Mal, S., Eds.; Springer: Cham, Switzerland, 2016; pp. 271–306. [Google Scholar]
  6. Zhu, M.; Zhang, J.; Zhu, L. Variations in growing season NDVI and its sensitivity to climate change responses to green development in mountainous areas. Front. Environ. Sci. 2021, 9, 678450. [Google Scholar] [CrossRef]
  7. Gonzalez, P.; Neilson, R.P.; Lenihan, J.M.; Drapek, R.J. Global patterns in the vulnerability of ecosystems to vegetation shifts due to climate change. Glob. Ecol. Biogeogr. 2010, 19, 755–768. [Google Scholar] [CrossRef]
  8. Gottfried, M.; Pauli, H.; Futschik, A.; Akhalkatsi, M.; Barancok, P.; Alonso, J.L.B.; Coldea, G.; Dick, J.; Erschbamer, B.; Kazakis, G.; et al. Continent-wide response of mountain vegetation to climate change. Nat. Clim. Change 2012, 2, 111–115. [Google Scholar] [CrossRef]
  9. Mishra, N.B.; Mainali, K.P. Greening and browning of the Himalaya: Spatial patterns and the role of climatic change and human drivers. Sci. Total Environ. 2017, 587–588, 326–339. [Google Scholar] [CrossRef]
  10. Levin, N.; Shmida, A.; Levanoni, O.; Tamari, H.; Kark, S. Predicting mountain plant richness and rarity from space using satellite-derived vegetation indices. Divers. Distrib. 2007, 13, 692–703. [Google Scholar] [CrossRef]
  11. Fensholt, R.; Rasmussen, K.; Nielsen, T.T.; Mbow, C. Evaluation of earth observation-based long-term vegetation trends: Intercomparing NDVI time series trend analysis consistency of Sahel from AVHRR GIMMS, Terra MODIS, and SPOT VGT data. Remote Sens. Environ. 2009, 113, 1886–1898. [Google Scholar] [CrossRef]
  12. Brown, M.; De Beurs, K.; Marshall, M. Global phenological response to climate change in crop areas using satellite remote sensing of vegetation, humidity and temperature over 26 years. Remote Sens. Environ. 2012, 126, 174–183. [Google Scholar] [CrossRef]
  13. Kuenzer, C.; Dech, S.; Wagner, W. Remote Sensing Time Series Revealing Land Surface Dynamics: Status Quo and the Pathway Ahead. In Remote Sensing Time Series; Kuenzer, C., Dech, S., Wagner, W., Eds.; Springer: Cham, Switzerland, 2015; pp. 1–24. [Google Scholar] [CrossRef]
  14. Mishra, N.B.; Chaudhuri, G. Spatio-temporal analysis of trends in seasonal vegetation productivity across Uttarakhand, Indian Himalayas, 2000–2014. Appl. Geogr. 2015, 56, 29–41. [Google Scholar] [CrossRef]
  15. Nemani, R.R.; Keeling, C.D.; Hashimoto, H.; Jolly, W.M.; Piper, S.C.; Tucker, C.J.; Myneni, R.B.; Running, S.W. Climate-driven increases in global terrestrial net primary production from 1982 to 1999. Science 2003, 300, 1560–1563. [Google Scholar] [CrossRef]
  16. Piao, S.; Wang, X.; Ciais, P.; Zhu, B.; Wang, T.; Liu, J. Changes in satellite-derived vegetation growth trend in temperate and boreal Eurasia from 1982 to 2006. Glob. Change Biol. 2011, 17, 3228–3239. [Google Scholar] [CrossRef]
  17. Anderson, K.; Fawcett, D.; Cugulliere, A.; Boulton, C.A.; Nightingale, J. Vegetation expansion in the subnival Hindu Kush Himalaya. Glob. Change Biol. 2020, 26, 1608–1625. [Google Scholar] [CrossRef]
  18. Zhang, Z.X.; Chang, J.; Xu, C.Y.; Zhou, Y.; Wu, Y.H.; Chen, X.; Jiang, S.; Duan, Z. The Response of Lake Area and Vegetation Cover Variations to Climate Change over the Qinghai-Tibetan Plateau during the Past 30 Years. Sci. Total Environ. 2018, 635, 443–451. [Google Scholar] [CrossRef]
  19. Anders, A.M.; Roe, G.H.; Hallet, B.; Montgomery, D.R.; Finnegan, N.J.; Putkonen, J. Spatial patterns of precipitation and topography in the Himalaya. Geol. Soc. Am. 2006, 398, 39–53. [Google Scholar] [CrossRef]
  20. Böhner, J. General climatic controls and topoclimatic variations in Central and High Asia. Boreas 2006, 35, 279–295. [Google Scholar]
  21. Miehe, G.; Pendry, C.A.; Chaudhary, R. Nepal: An Introduction to the Natural History, Ecology and Human Environment of the Himalayas; Royal Botanic Garden: Edinburgh, UK, 2015. [Google Scholar]
  22. Rokaya, M.B.; Sigdel, S.R. (Eds.) Flora and Vegetation of Nepal; Springer: Cham, Switzerland, 2024. [Google Scholar]
  23. Körner, C.; Ohsawa, M.; Spehn, E.; Nogués-Bravo, D.; Theurillat, J.P.; Tranquillini, E.; Hughes, L.; Larcher, W. Mountain systems. In Ecosystems and Human Well-Being: Current State and Trends; Hassan, R., Scholes, R., Ash, N., Eds.; Island Press: Washington, DC, USA, 2005; Volume 1, pp. 681–716. [Google Scholar]
  24. Hock, R.; Rasul, G.; Adler, C.; Huggel, C.; Cogley, J.G.; Gruber, S.; Hirabayashi, Y.; Jackson, M.; Kääb, A.; Kang, S.; et al. High mountain areas. In Special Report on the Ocean and Cryosphere in a Changing Climate; IPCC, Ed.; IPCC: Geneva, Switzerland, 2019; pp. 131–202. [Google Scholar]
  25. Schickhoff, U.; Bobrowski, M.; Schwab, N.; Mal, S.; Singh, R. The World’s Mountains in the Anthropocene. In Mountain Landscapes in Transition; Schickhoff, U., Singh, R., Mal, S., Eds.; Springer: Cham, Switzerland, 2022; pp. 1–144. [Google Scholar] [CrossRef]
  26. Mountain Research Initiative EDW Working Group. Elevation-dependent warming in mountain regions of the world. Nat. Clim. Change 2015, 5, 424–430. [Google Scholar] [CrossRef]
  27. Dolezal, J.; Dvorsky, M.; Kopecky, M. Vegetation dynamics at the upper elevational limit of vascular plants in Himalaya. Sci. Rep. 2016, 6, 24881. [Google Scholar] [CrossRef]
  28. Liu, X.; Chen, B. Climatic warming in the Tibetan Plateau during recent decades. Int. J. Climatol. J. R. Meteorol. Soc. 2000, 20, 1729–1742. [Google Scholar] [CrossRef]
  29. Telwala, Y.; Brook, B.W.; Manish, K.; Pandit, M.K. Climate-induced elevational range shifts and increase in plant species richness in a Himalayan biodiversity epicentre. PLoS ONE 2013, 8, e57103. [Google Scholar] [CrossRef]
  30. Zhang, Y.; Gao, J.; Liu, L.; Wang, Z.; Ding, M.; Yang, X. NDVI-based vegetation changes and their responses to climate change from 1982 to 2011: A case study in the Koshi River Basin in the middle Himalayas. Glob. Planet. Change 2013, 108, 139–148. [Google Scholar] [CrossRef]
  31. Che, M.; Chen, B.; Innes, J.L.; Wang, G.; Dou, X.; Yan, J.; Zhou, T.; Zhang, H.; Xu, G.; Zhao, H. Spatial and temporal variations in the end date of the vegetation growing season throughout the Qinghai–Tibetan Plateau from 1982 to 2011. Agric. For. Meteorol. 2014, 189, 81–90. [Google Scholar] [CrossRef]
  32. Li, H.; Li, Y.; Shen, W.; Li, Y.; Lin, J.; Lu, X.; Xu, X.; Jiang, J. Elevation-dependent vegetation greening of the Yarlung Zangbo River basin in the southern Tibetan Plateau, 1999–2013. Remote Sens. 2015, 7, 16672–16687. [Google Scholar] [CrossRef]
  33. Ganjurjav, H.; Gao, Q.; Gornish, E.S.; Schwartz, M.W.; Liang, Y.; Zhang, Y.; Cao, X.; Zhang, W.; Li, W.; Wan, Y.; et al. Differential response of alpine steppe and alpine meadow to climate warming in the Central Qinghai-Tibetan Plateau. Agric. For. Meteorol. 2016, 223, 233–240. [Google Scholar] [CrossRef]
  34. Salick, J.; Fang, Z.; Hart, R. Rapid changes in eastern Himalayan alpine flora with climate change. Am. J. Bot. 2019, 106, 520–530. [Google Scholar] [CrossRef] [PubMed]
  35. Hamid, M.; Khuroo, A.A.; Malik, A.H.; Ahmad, R.; Dar, G.H. Early evidence of shifts in alpine summit vegetation: A case study from Kashmir Himalaya. Front. Plant Sci. 2020, 11, 421. [Google Scholar] [CrossRef]
  36. Sekar, K.C.; Thapliyal, N.; Bhojak, P.; Bisht, K.; Pandey, A.; Mehta, P.; Rawat, R.S. Early Signals of Climate Change Impacts on Alpine Plant Diversity in Indian Himalaya. Biodivers. Conserv. 2024, 33, 207–233. [Google Scholar] [CrossRef]
  37. Verma, A.; Chawla, A.; Singh, C.P.; Kumar, A. Compositional Change in Vascular Plant Diversity in the Alpine Mountainous Region of Indian North-Western Himalaya Indicate Effects of Warming. Biodivers. Conserv. 2023, 32, 2425–2449. [Google Scholar] [CrossRef]
  38. Mukhtar, H.; Yang, Y.; Xu, M.; Wu, J.; Abbas, S.; Wei, D.; Zhao, W. Elevation-Dependent Vegetation Greening and Its Responses to Climate Changes in the South Slope of the Himalayas. Geophys. Res. Lett. 2025, 52, e2024GL113276. [Google Scholar] [CrossRef]
  39. Baniya, B.; Tang, Q.; Pokhrel, Y.; Xu, X. Vegetation Dynamics and Ecosystem Service Values Changes at National and Provincial Scales in Nepal from 2000 to 2017. Environ. Dev. 2019, 32, 100464. [Google Scholar] [CrossRef]
  40. Joshi, N.; Gyawali, P.; Sapkota, S.; Maharjan, S.; Shrestha, M.L.; Kafle, G. Analyzing the effect of climate change (rainfall and temperature) on vegetation cover of Nepal using time series MODIS images. ISPRS Ann. Photogramm. Remote Sens. Spatial Inf. Sci. 2019, IV-2/W5, 209–216. [Google Scholar] [CrossRef]
  41. Baniya, B.; Tang, Q.; Koirala, M.; Rijal, K.; Kattel, G. Growing season vegetation dynamics based on NDVI and the driving forces in Nepal during 1982–2015. For. J. Inst. For. 2020, 17, 1–22. [Google Scholar] [CrossRef]
  42. Bhatt, J.; Alkan, M. Temporal NDVI change detection of Nepal using Modis imagery. Sigma J. Eng. Nat. Sci. 2020, 38, 927–943. [Google Scholar]
  43. Sharma, I.; Tongkumchum, P.; Ueranantasun, A. Regression analysis of normalized difference vegetation index (NDVI) to compare seasonal patterns and 15-year trend of vegetation from east to west of Nepal. Nat. Environ. Pollut. Technol. 2021, 20, 267–273. [Google Scholar]
  44. Rai, M.R.; Chidthaisong, A.; Ekkawatpanit, C.; Varnakovida, P. Assessing Climate Change Trends and Their Relationships with Alpine Vegetation and Surface Water Dynamics in the Everest Region, Nepal. Atmosphere 2021, 12, 987. [Google Scholar] [CrossRef]
  45. Zhou, D.; Zhang, L.; Hao, L.; Sun, G.; Xiao, J.; Li, X. Large discrepancies among remote sensing indices for characterizing vegetation growth dynamics in Nepal. Agric. For. Meteorol. 2023, 339, 109546. [Google Scholar] [CrossRef]
  46. Shrestha, B.; Zhang, L.; Shrestha, S.; Maharjan, L.; Khadka, N.; Dahal, P. Spatiotemporal Patterns, Sustainability, and Primary Drivers of NDVI-Derived Vegetation Dynamics (2003–2022) in Nepal. Environ. Monit. Assess. 2024, 196, 607. [Google Scholar] [CrossRef] [PubMed]
  47. Krakauer, N.Y.; Lakhankar, T.; Anadón, J.D. Mapping and attributing normalized difference vegetation index trends for Nepal. Remote Sens. 2017, 9, 986. [Google Scholar] [CrossRef]
  48. Tiwari, A.; Jha, P.K. An overview of treeline response to environmental changes in Nepal Himalaya. Trop. Ecol. 2018, 59, 273–285. [Google Scholar]
  49. Baniya, B.; Gaire, N.P.; Techato, Q.; Dhakal, Y.; Dhital, Y.P. High Altitudinal Vegetation Dynamics Including Treeline Ecotone in Langtang National Park, Nepal. Nepal J. Environ. Sci. 2021, 9, 13–24. [Google Scholar] [CrossRef]
  50. Regmi, R.; Ma, Y.; Ma, W.; Baniya, B.; Bashir, B. Interannual Variation of NDVI, Precipitation, and Temperature during the Growing Season. Appl. Ecol. Environ. Sci. 2020, 8, 218–228. [Google Scholar] [CrossRef]
  51. Krishnaswamy, J.; John, R.; Joseph, S. Consistent response of vegetation dynamics to recent climate change in tropical mountain regions. Glob. Change Biol. 2014, 20, 203–215. [Google Scholar] [CrossRef]
  52. Böhner, J.; Miehe, G.; Miehe, S. Climate and weather. In Nepal: An Introduction to the Natural History, Ecology, and Human Environment of the Himalayas; Miehe, G., Pendry, C.A., Chaudhary, R.P., Eds.; Royal Botanic Garden: Edinburgh, UK, 2015; pp. 23–89. [Google Scholar]
  53. Shrestha, A.B.; Aryal, R. Climate Change in Nepal and Its Impact on Himalayan Glaciers. Reg. Environ. Change 2011, 11, 65–77. [Google Scholar] [CrossRef]
  54. Bhandari, G.B.; Shrestha, K.K. Comparative study of understory vegetation in the community forests and national parks of Nepal. Banko Janakari 2007, 17, 38–42. [Google Scholar]
  55. Basnet, K.; Shrestha, B.B.; Niraula, R.R. Diversity and vegetation structure of Sal (Shorea robusta Gaertn. f.) forests in Chitwan National Park, Nepal. J. For. Res. 2018, 29, 463–471. [Google Scholar]
  56. Gurung, J.; Bawa, K.S. Conservation education in the Annapurna Conservation Area, Nepal: An exploratory assessment. Environ. Conserv. 1993, 20, 341–349. [Google Scholar]
  57. Barik, S.K.; Adhikari, B.; Basnet, K. Woody species composition and regeneration status in three different forest types of central Nepal. J. For. Res. 2020, 31, 923–935. [Google Scholar]
  58. NASA LP DAAC. MOD13Q1: MODIS/Terra Vegetation Indices 16-Day L3 Global 250 m SIN Grid V006; NASA EOSDIS Land Processes DAAC, USGS Earth Resources Observation and Science (EROS) Center: Sioux Falls, SD, USA, 2015. [Google Scholar] [CrossRef]
  59. Savitzky, A.; Golay, M.J. Smoothing and differentiation of data by simplified least squares procedures. Anal. Chem. 1964, 36, 1627–1639. [Google Scholar] [CrossRef]
  60. Tucker, C.J.; Pinzon, J.E.; Brown, M.E.; Slayback, D.A.; Pak, E.W.; Mahoney, R.; Vermote, E.F.; El Saleous, N. An extended AVHRR 8-km NDVI dataset compatible with MODIS and SPOT vegetation NDVI data. Int. J. Remote Sens. 2005, 26, 4485–4498. [Google Scholar] [CrossRef]
  61. Jonsson, P.; Eklundh, L. TIMESAT—A program for analyzing time-series of satellite sensor data. Comput. Geosci. 2004, 30, 833–845. [Google Scholar] [CrossRef]
  62. Fontana, F.; Rixen, C.; Jonas, T.; Abegg, B.; Wunder, J.; Zemp, M. Alpine grassland phenology as seen in AVHRR VEGETATION and MODIS NDVI time series: A comparison with in situ measurements. Sensors 2008, 8, 2833–2853. [Google Scholar] [CrossRef]
  63. Cowpertwait, P.S.P.; Metcalfe, A.V. Introductory Time Series with R; Springer: New York, NY, USA, 2009. [Google Scholar]
  64. Cai, Z.; Jönsson, P.; Jin, H.; Eklundh, L.; Zhang, Y.; Wagner, F. Performance of Smoothing Methods for Reconstructing NDVI Time-Series and Estimating Vegetation Phenology from MODIS Data. Remote Sens. 2017, 9, 1271. [Google Scholar] [CrossRef]
  65. Ligges, U.; Krey, S.; Mersmann, O.; Schnackenberg, S. Signal Processing. In CRAN Signal Package; Version 1-1.8; R Foundation for Statistical Computing: Vienna, Austria, 2023; Available online: https://cran.r-project.org/web/packages/signal/index.html (accessed on 20 December 2023).
  66. R Development Core Team. R: A Language and Environment for Statistical Computing; R Foundation for Statistical Computing: Vienna, Austria, 2008; Available online: http://www.R-project.org (accessed on 20 January 2022).
  67. Jarlan, L.; Mangiarotti, S.; Mougin, E.; Hiernaux, P.; Mazzega, P.; Le Dantec, V. Assimilation of SPOT/VEGETATION NDVI Data into a Sahelian Vegetation Dynamics Model. Remote Sens. Environ. 2008, 112, 1381–1394. [Google Scholar] [CrossRef]
  68. Peng, D.; Zhang, B.; Liu, L.; Huang, X.; Wang, Q.; Liang, L.; Zhao, S. Characteristics and drivers of global NDVI-based FPAR from 1982 to 2006. Glob. Biogeochem. Cycles 2012, 26, 1–15. [Google Scholar] [CrossRef]
  69. NASA/METI/AIST/Japan Spacesystems and U.S./Japan ASTER Science Team. ASTER Global Digital Elevation Model V003; NASA EOSDIS Land Processes Distributed Active Archive Center (LP DAAC): Sioux Falls, SD, USA, 2019. Available online: https://lpdaac.usgs.gov/products/astgtmv003/ (accessed on 20 January 2021).
  70. Esri. ArcGIS Pro; Version 3.0; Environmental Systems Research Institute: Redlands, CA, USA, 2024; Available online: https://www.esri.com/en-us/arcgis/products/arcgis-pro/overview (accessed on 5 November 2022).
  71. Karger, D.N.; Conrad, O.; Böhner, J.; Kawohl, T.; Kreft, H.; Soria-Auza, R.W.; Zimmermann, N.E.; Linder, H.P.; Kessler, M. Climatologies at high resolution for the earth’s land surface areas. Sci. Data 2021, 4, 170122. [Google Scholar] [CrossRef]
  72. Python Software Foundation. Python Programming Language; Version 3.9.7; Python Software Foundation: Beaverton, OR, USA, 2021. [Google Scholar]
  73. Lunetta, R.S.; Knight, J.F.; Ediriwickrema, J.; Lyon, J.G.; Worthy, L.D. Land-cover change detection using multi-temporal MODIS NDVI data. Remote Sens. Environ. 2006, 105, 142–154. [Google Scholar] [CrossRef]
  74. Eastman, J.; Sangermano, F.; Machado, E.A.; Rogan, J.; Anyamba, A. Global trends in seasonality of Normalized Difference Vegetation Index (NDVI), 1982–2011. Remote Sens. 2013, 5, 4799–4818. [Google Scholar] [CrossRef]
  75. Tong, X.; Wang, K.; Brandt, M.; Tian, F.; Yue, Y.; Fensholt, R. Assessing future vegetation trends and restoration prospects in the Karst regions of Southwest China. Remote Sens. 2016, 8, 357. [Google Scholar] [CrossRef]
  76. Zhang, R.; Ouyang, Z.T.; Xie, X.; Guo, H.Q.; Tan, D.Y.; Xiao, X.M.; Qi, J.G.; Zhao, B. Impact of Climate Change on Vegetation Growth in Arid Northwest of China from 1982 to 2011. Remote Sens. 2016, 8, 364. [Google Scholar] [CrossRef]
  77. Schickhoff, U.; Singh, R.B.; Mal, S. Climate Change and Dynamics of Glaciers and Vegetation in the Himalaya: An Overview. In Climate Change, Glacier Response, and Vegetation Dynamics in the Himalaya; Singh, R.B., Schickhoff, U., Mal, S., Eds.; Springer: Cham, Switzerland, 2016; pp. 1–26. [Google Scholar] [CrossRef]
  78. Aase, T.H. Climate Change and the Future of Himalayan Farming; Oxford University Press: Oxford, UK, 2017. [Google Scholar]
  79. Keenan, T.F.; Riley, W.J. Greening of the land surface in the world’s cold regions consistent with recent warming. Nat. Clim. Change 2018, 8, 825–828. [Google Scholar] [CrossRef]
  80. Wester, P.; Mishra, A.; Mukherji, A.; Shrestha, A.B. The Hindu Kush Himalaya Assessment; Springer: Cham, Switzerland, 2019. [Google Scholar]
  81. Schickhoff, U.; Mal, S. Current changes in alpine ecosystems of Asia. In Encyclopedia of the World’s Biomes; Goldstein, M.I., DellaSala, D.A., Eds.; Elsevier: Amsterdam, The Netherlands, 2020; Volume 1, pp. 589–598. [Google Scholar]
  82. Rani, S.; Kumar, R. (Eds.) Climate Change: Impacts, Responses and Sustainability in the Indian Himalaya; Springer: Cham, Switzerland, 2022. [Google Scholar]
  83. Sharma, S.; Kuniyal, J.C.; Chand, P.; Rawat, S.; Dhyani, S.; Bhatt, D. Climate Change Adaptation, Risk Management, and Sustainable Practices in the Himalaya; Springer: Cham, Switzerland, 2024. [Google Scholar]
  84. Li, H.; Jiang, J.; Chen, B.; Ma, L.; Yang, G.; Xie, D. Pattern of NDVI-based vegetation greening along an altitudinal gradient in the eastern Himalayas and its response to global warming. Environ. Monit. Assess. 2016, 188, 186. [Google Scholar] [CrossRef]
  85. Piao, S.; Yin, G.; Tan, J.; Cheng, L.; Huang, M.; Li, Y.; Liu, R.; Mao, J.; Myneni, R.B.; Peng, S.; et al. Detection and Attribution of Vegetation Greening Trend in China over the Last 30 Years. Glob. Change Biol. 2015, 21, 1601–1609. [Google Scholar] [CrossRef] [PubMed]
  86. Piao, S.; Mohammat, A.; Fang, J.; Cai, Q.; Feng, J. NDVI-based increase in growth of temperate grasslands and its responses to climate changes in China. Glob. Environ. Change 2006, 16, 340–348. [Google Scholar] [CrossRef]
  87. Piao, S.; Fang, J.; Ciais, P.; Peylin, P.; Huang, Y.; Sitch, S.; Wang, T. The carbon balance of terrestrial ecosystems in China. Nature 2009, 458, 1009–1013. [Google Scholar] [CrossRef] [PubMed]
  88. de Jong, R.; Verbesselt, J.; Zeileis, A.; Schaepman, M.E. Shifts in global vegetation activity trends. Remote Sens. 2013, 5, 1117–1133. [Google Scholar] [CrossRef]
  89. Karki, R.; Hasson, S.U.; Schickhoff, U.; Scholten, T.; Bohner, J. Rising precipitation extremes across Nepal. Climate 2017, 5, 4. [Google Scholar] [CrossRef]
  90. Liang, E.; Dawadi, B.; Pederson, N.; Eckstein, D. Is the growth of birch at the upper timberline in the Himalayas limited by moisture or by temperature? Ecology 2014, 95, 2453–2465. [Google Scholar] [CrossRef]
  91. Bräuning, A.; Grießinger, J.; Hochreuther, P.; Wernicke, J. Dendroecological Perspectives on Climate Change on the Southern Tibetan Plateau. In Climate Change, Glacier Response, and Vegetation Dynamics in the Himalaya; Singh, R.B., Schickhoff, U., Mal, S., Eds.; Springer: Cham, Switzerland, 2016; pp. 347–364. [Google Scholar]
  92. Sigdel, S.; Wang, Y.; Camarero, J.; Zhu, H.; Liang, E.; Peñuelas, J. Moisture-mediated responsiveness of treeline shifts to global warming in the Himalayas. Glob. Change Biol. 2018, 24, 5549–5559. [Google Scholar] [CrossRef]
  93. Schwab, N.; Kaczka, R.J.; Janecka, K.; Bräuning, A.; Dawadi, B.; Wiedenbein, L.; Bhattacharya, S. Climate change-induced shift of tree growth sensitivity at a Central Himalayan treeline ecotone. Forests 2018, 9, 267. [Google Scholar] [CrossRef]
  94. Schwab, N.; Janecka, K.; Kaczka, R.J.; Böhner, J.; Chaudhary, R.P.; Scholten, T.; Schickhoff, U. Ecological Relationships at a Near-Natural Treeline, Rolwaling Valley, Nepal Himalaya: Implications for the Sensitivity to Climate Change. Erdkunde 2020, 74, 15–44. [Google Scholar] [CrossRef]
  95. Schickhoff, U.; Bobrowski, M.; Böhner, J.; Bürzle, B.; Chaudhary, R.P.; Müller, M.; Scholten, T.; Schwab, N.; Weidinger, J. The Treeline Ecotone in Rolwaling Himal, Nepal: Pattern-Process Relationships and Treeline Shift Potential. In Ecology of Himalayan Treeline Ecotone; Singh, S.P., Reshi, Z.A., Joshi, R., Eds.; Springer: Singapore, 2023; pp. 95–145. [Google Scholar] [CrossRef]
  96. Dahal, P.; Shrestha, N.S.; Shrestha, M.L.; Krakauer, N.Y.; Panthi, J.; Pradhanang, S.M.; Jha, A.; Lakhankar, T. Drought Risk Assessment in Central Nepal: Temporal and Spatial Analysis. Nat. Hazards 2016, 80, 1913–1932. [Google Scholar] [CrossRef]
  97. Panthi, S.; Bräuning, A.; Zhou, Z.K.; Fan, Z.X.; Sano, M.; Gaire, N.P.; Thapa, U.K. Tree rings reveal recent intensified spring drought in the Central Himalaya, Nepal. Glob. Planet. Change 2017, 157, 26–34. [Google Scholar] [CrossRef]
  98. Timilsina, R.H.; Ojha, G.P.; Nepali, P.B.; Tiwari, U. Landscapes in Transition: A Study of Agricultural Land Use Change in Inner Terai of Nepal. Int. J. Soc. Sci. Manag. 2025, 12, 46–59. [Google Scholar]
  99. Guo, J.; Zhai, L.; Sang, H.; Cheng, S.; Li, H. Effects of Hydrothermal Factors and Human Activities on the Vegetation Coverage of the Qinghai-Tibet Plateau. Sci. Rep. 2023, 13, 13488. [Google Scholar] [CrossRef]
  100. Huang, K.; Zhang, Y.; Zhu, J.; Liu, Y.; Zu, J.; Zhang, J. The Influences of Climate Change and Human Activities on Vegetation Dynamics in the Qinghai-Tibet Plateau. Remote Sens. 2016, 8, 876. [Google Scholar] [CrossRef]
  101. Shen, M.; Piao, S.; Jeong, S.-J.; Zhou, L.; Zeng, Z.; Ciais, P.; Chen, D.; Huang, M.; Jin, C.-S.; Li, L.Z.X.; et al. Evaporative Cooling over the Tibetan Plateau Induced by Vegetation Growth. Proc. Natl. Acad. Sci. USA 2015, 112, 9299–9304. [Google Scholar] [CrossRef] [PubMed]
  102. Wang, X.; Xiao, J.; Li, X.; Zhang, Y.; Wang, K.; Guo, H.; Chen, B. Contrasting vegetation responses to climate change in the Hindu Kush Himalaya: Insights from satellite observations and CMIP5 simulations. Glob. Planet. Change 2020, 192, 103268. [Google Scholar] [CrossRef]
  103. Schickhoff, U.; Bobrowski, M.; Böhner, J.; Bürzle, B.; Chaudhary, R.P.; Gerlitz, L.; Heyken, H.; Lange, J.; Müller, M.; Scholten, T.; et al. Do Himalayan Treelines Respond to Recent Climate Change? An Evaluation of Sensitivity Indicators. Earth Syst. Dyn. 2015, 6, 245–265. [Google Scholar] [CrossRef]
  104. Jiang, F.; Deng, M.; Long, Y.; Chen, M.; Wang, H.; Li, Q.; Zhang, Y. Spatial pattern and dynamic change of vegetation greenness from 2001 to 2020 in Tibet, China. Front. Plant Sci. 2022, 13, 892625. [Google Scholar] [CrossRef]
  105. Panday, P.K.; Ghimire, B. Time-series analysis of NDVI from AVHRR data over the Hindu Kush–Himalayan region for the period 1982–2006. Int. J. Remote Sens. 2012, 33, 6710–6721. [Google Scholar] [CrossRef]
  106. Mainali, J.; All, J.; Jha, P.K.; Bhuju, D.R.; Shrestha, B.B.; Devkota, D. Responses of montane forest to climate variability in the central Himalayas of Nepal. Mt. Res. Dev. 2015, 35, 66–77. [Google Scholar] [CrossRef]
  107. Xu, H.J.; Wang, X.P.; Yang, T.B. Trend shifts in satellite-derived vegetation growth in Central Eurasia, 1982–2013. Sci. Total Environ. 2017, 579, 1658–1674. [Google Scholar] [CrossRef] [PubMed]
  108. Shrestha, A.B.; Wake, C.P.; Dibb, J.E.; Mayewski, P.A. Precipitation fluctuations in the Nepal Himalaya and its vicinity and relationship with some large-scale climatological parameters. Int. J. Climatol. 2000, 20, 317–327. [Google Scholar] [CrossRef]
  109. Paudel, K.P.; Andersen, P. Response of rangeland vegetation to snow cover dynamics in Nepal Trans Himalaya. Clim. Change 2013, 117, 149–162. [Google Scholar] [CrossRef]
  110. Offen, I.A.; Bobrowski, M.; Jahan, R.; Adhikari, P.; Hartmann, M.; Barclay, M.V.L.; Weipert, J. Vegetation-environment relationships, species richness, and climate change impacts along the elevational gradient in the Sikkim Himalaya–General findings and preliminary results from a reconnaissance field trip. In Biodiversität und Naturausstattung im Himalaya VII; Hartmann, M., Barclay, M.V.L., Weipert, J., Eds.; Verein der Freunde & Förderer des Naturkundemuseums Erfurt e.V.: Erfurt, Germany, 2021; pp. 9–40. [Google Scholar]
  111. Grytnes, J.A.; Vetaas, O.R. Species richness and altitude: A comparison between null models and interpolated plant species richness along the Himalayan altitudinal gradient, Nepal. Am. Nat. 2002, 159, 294–304. [Google Scholar]
  112. Sarania, B.; Guttal, V.; Tamma, K. Characterising the vegetation-rainfall relationship in the Northeast Himalaya, India. bioRxiv 2021. [Google Scholar] [CrossRef]
  113. Gaire, N.; Koirala, M.; Bhuju, D.; Carrer, M. Treeline dynamics with climate change at the central Nepal Himalaya. Clim. Past 2014, 10, 1277–1290. [Google Scholar] [CrossRef]
  114. Huang, X.; Zhang, T.; Yi, G.; Wang, X.; Yan, M.; Li, C.; He, X. Dynamic changes of NDVI in the growing season of the Tibetan Plateau during the past 17 years and its response to climate change. Int. J. Environ. Res. Public Health 2019, 16, 3452. [Google Scholar] [CrossRef]
  115. Rai, I.D.; Padalia, H.; Singh, G.; Rawal, R.S.; Sharma, S.; Bhatt, I.D. Vegetation dry matter dynamics along treeline ecotone in Western Himalaya, India. Trop. Ecol. 2020, 61, 116–127. [Google Scholar] [CrossRef]
  116. Eckert, S.; Hüsler, F.; Liniger, H.; Hodel, E. Trend analysis of MODIS NDVI time series for detecting land degradation and regeneration in Mongolia. J. Arid Environ. 2015, 113, 16–28. [Google Scholar] [CrossRef]
  117. Zhen, Z.; Chen, S.; Yin, T.; Gastellu-Etchegorry, J.-P. Globally Quantitative Analysis of the Impact of Atmosphere and Spectral Response Function on 2-Band Enhanced Vegetation Index (EVI2) over Sentinel-2 and Landsat-8. ISPRS J. Photogramm. Remote Sens. 2023, 205, 206–226. [Google Scholar] [CrossRef]
  118. Son, N.T.; Chen, C.F.; Chen, C.R.; Chang, L.Y.; Minh, V.Q.; Trung, N.H. A Comparative Analysis of Multitemporal MODIS EVI and NDVI Data for Large-Scale Rice Yield Estimation. Agric. For. Meteorol. 2014, 197, 52–64. [Google Scholar] [CrossRef]
  119. Budhathoki, K.; Jamaludin, J.; Schmidt-Vogt, D.; Webb, E. Land Covers Associated with Forest Expansion Hot Spots in the Nepal Himalaya. Environ. Res. Lett. 2024, 19, 124021. [Google Scholar] [CrossRef]
  120. Yang, M.; He, Z.; Pi, G.; You, M. Spatiotemporal Variations in MODIS EVI and MODIS LAI and the Responses to Meteorological Drought across Different Slope Conditions in Karst Mountain Regions. Sustainability 2024, 16, 7870. [Google Scholar] [CrossRef]
Figure 1. The location and elevation of the study area.
Land 14 00749 g001
Figure 2. Step-by-step methodological workflow for data acquisition, pre-processing, and integration of remote sensing data. The dark orange oval-shaped box represents the data source, the green, olive, and light orange-colored rectangular boxes indicate image processing and data extraction, and the gray rectangular boxes represent data integration and result analysis.
Land 14 00749 g002
Figure 3. Normalized difference vegetation index (NDVI) trends during the growing season from 2000 to 2019.
Land 14 00749 g003
Figure 4. (A) Spatial distribution of the mean annual growing season NDVI and (B) spatial distribution of the trends of NDVI change within each grid for the years 2000–2019.
Land 14 00749 g004
Figure 5. NDVI (growing season mean) variations with (A) elevation, (B) slope, and (C) aspect.
Land 14 00749 g005
Figure 6. Variations in NDVI trends with (A) elevation, (B) slope, and (C) aspect.
Land 14 00749 g006
Figure 7. The spatial distribution of changes in growing season greenness (as captured by MODIS NDVI) over two decades in (A) the Nepal Himalaya and surrounding area, (B) western Nepal, and (C) eastern Nepal. The purple box indicates the highly elevated region with more changes in vegetation cover.
Land 14 00749 g007
Figure 8. Vegetation cover changes (% of total area) from 2000 to 2019 at different (A) elevations, (B) aspects, and (C) slopes.
Land 14 00749 g008
Figure 9. Changes in vegetation greenness over two decades (from 2000 to 2019) at different elevational ranges: H1 (below 1000 m), H2 (1000–1500 m), H3 (1500–2000 m), H4 (2000–2500 m), H5 (2500–3000 m), H6 (3000–3500), H7 (3500–4000 m), H8 (4000–4500 m), H9 (4500–5000 m), H10 (5000–5500 m), H11 (5500–6000 m), and H12 (above 6000 m).
Land 14 00749 g009
Figure 10. Growing season mean NDVI across different elevation bands (H1 to H12) in the central Himalaya (2000–2019), with trend lines showing long-term vegetation changes across altitudes.
Land 14 00749 g010
Figure 11. Growing season mean (A) temperature, (B) precipitation, (C) potential evapotranspiration, and (D) solar radiation derived from CHELSA 2.1 monthly data.
Land 14 00749 g011
Figure 12. Spatial distribution of climate parameters: (A) temperature, (B) precipitation, (C) evapotranspiration, and (D) solar radiation. (E) The results of pixel-based correlations between the climate parameters and the NDVI in the growing season over two decades in the study area.
Land 14 00749 g012
Figure 13. Selected validation points used in the comparison of multitemporal Google Earth imagery that shows significant vegetation improvement and degradation. (A,B) Points showing an NDVI positive trend/enhancement in vegetation cover; (C,D) points showing a negative trend in the trend map, documented by Google Earth imagery. The labels next to the English names are in Nepali, representing the same location names in the local language.
Land 14 00749 g013
Table 1. Correlation between climate parameters and annual mean (growing season) NDVI at different elevations (Spearman’s rank correlation).
Elevations (masl)NDVI and Temperaturep-ValueNDVI and Precipitationp-ValueNDVI and Evapotranspirationp-ValueNDVI and Solar Radiationp-Value
<1000−0.7580.000.7080.00−0.7390.00−0.5590.00
1000–15000.2540.000.0010.86−0.0960.000.0950.00
1500–20000.0980.000.0080.20−0.0820.000.1400.00
2000–2500−0.0090.28−0.1760.000.1620.000.3590.00
2500–3000−0.0210.02−0.4490.000.3290.000.4440.00
3000–35000.1160.00−0.4550.000.2780.000.3470.00
3500–40000.0090.30.0560.00−0.1440.00−0.1360.00
4000–45000.060.000.3230.00−0.3610.00−0.3820.00
4500–50000.1940.00−0.1250.000.2050.000.1480.00
5000–55000.4350.00−0.3820.000.5760.000.5370.00
5500–60000.5360.00−0.3410.000.6710.000.6340.00
>60000.3110.00−0.2170.000.1310.000.2360.00
Table 2. Correlation between climate parameters and annual mean (growing season) NDVI at different slopes (Spearman’s rank correlation).
Slopes
(Degrees)
NDVI and Temperaturep-ValueNDVI and
Precipitation
p-ValueNDVI and Evapotranspirationp-ValueNDVI and Solar Radiationp-Value
Less than 50.01210.000.70090.000.00280.25−0.62950.00
5–100.70270.000.61150.000.51130.00−0.75140.00
10–200.88200.000.50230.000.46020.00−0.69300.00
20–300.89190.000.35660.000.51820.00−0.66420.00
30–400.90760.000.22380.000.63570.00−0.62360.00
40–500.92830.000.06280.030.74140.00−0.59240.00
Above 500.93320.00−0.08280.170.83230.00−0.53250.01
Table 3. Correlation between climate parameters and annual mean (growing season) NDVI at different aspects (Spearman’s rank correlation).
AspectsNDVI and Temperaturep-ValueNDVI and Precipitationp-ValueNDVI and
Evapotranspiration
p-ValueNDVI and Solar Radiationp-Value
Flat0.5180.000.6030.000.5220.00−0.4950.00
North0.7630.000.4910.000.4130.00−0.7040.00
Northeast0.7500.010.4970.000.3930.00−0.7210.00
East0.7250.000.5020.000.3960.00−0.7370.00
Southeast0.7320.000.4960.000.4100.00−0.7420.02
South0.7290.000.5220.000.4260.00−0.7480.00
Southwest0.7520.000.4920.040.4580.00−0.7310.00
West0.7360.000.4860.000.4510.00−0.7250.00
Northwest0.7380.000.4580.000.4230.03−0.7050.00
Disclaimer/Publisher’s Note: The statements, opinions and data contained in all publications are solely those of the individual author(s) and contributor(s) and not of MDPI and/or the editor(s). MDPI and/or the editor(s) disclaim responsibility for any injury to people or property resulting from any ideas, methods, instructions or products referred to in the content.

