
The Nonlinear Impact of Economic Growth Pressure on Urban Land Green Utilization Efficiency—Empirical Research from China


Abstract
1. Introduction
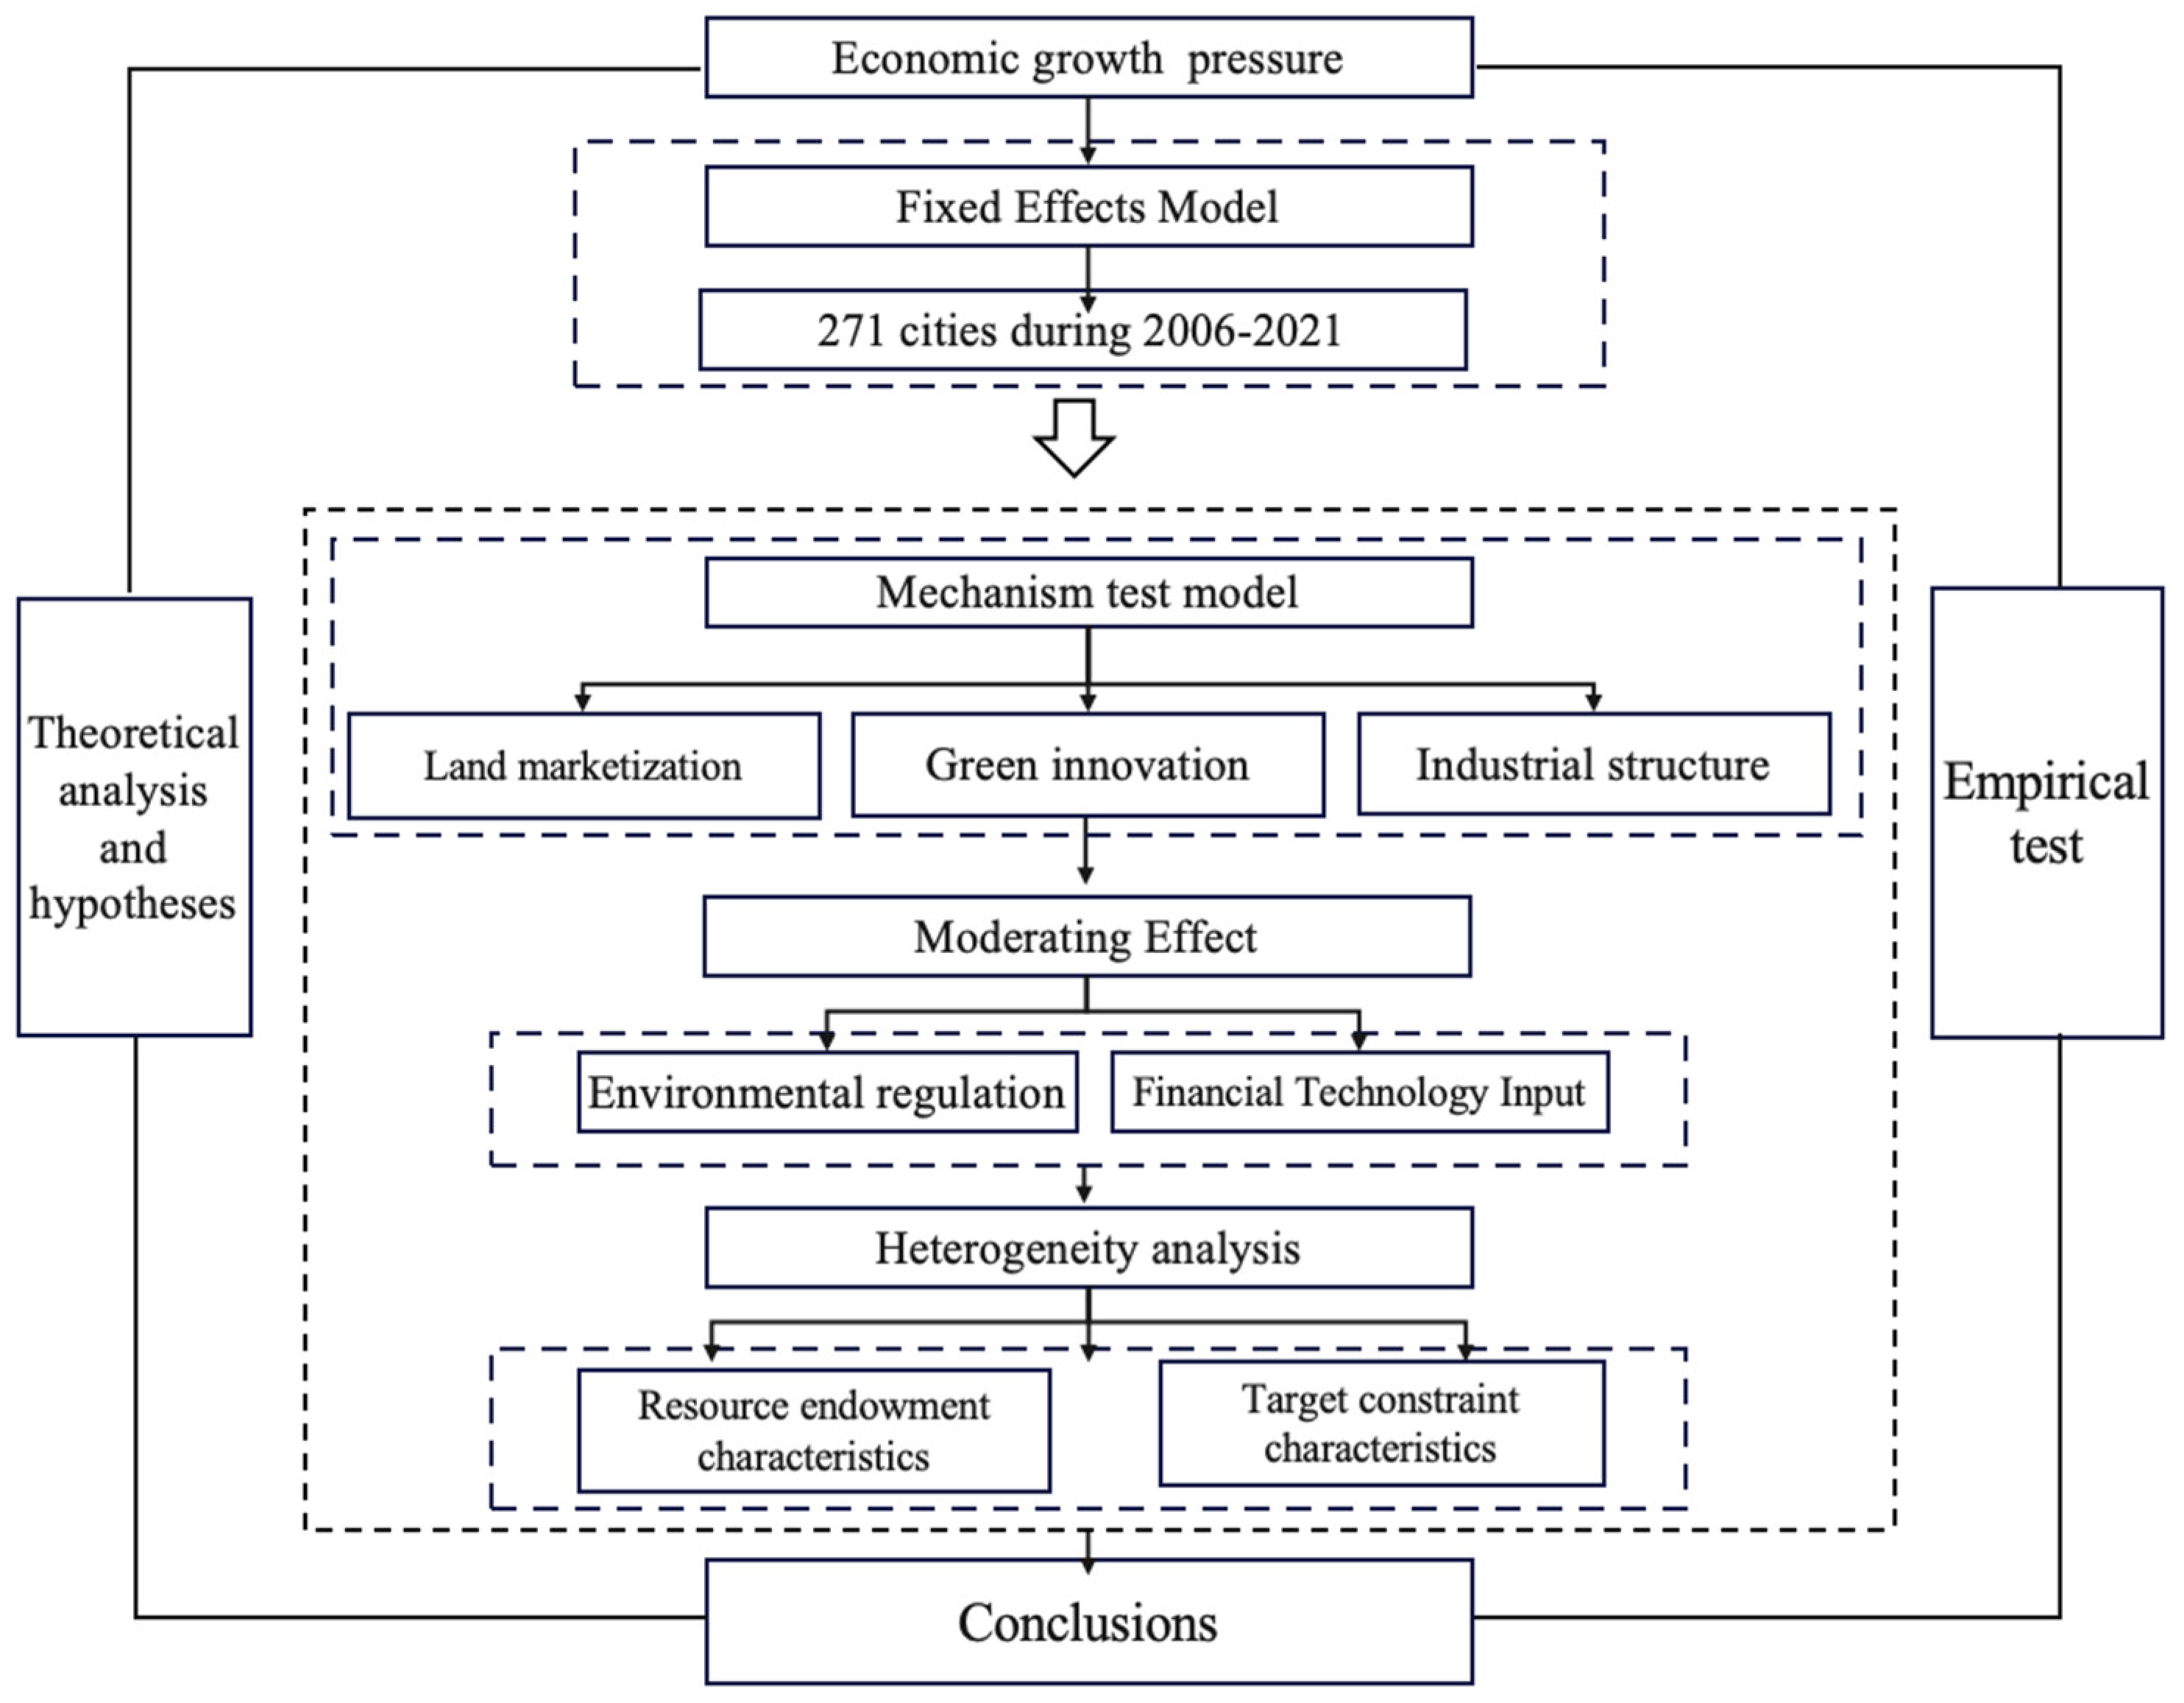
- This research delves into the intrinsic mechanisms and potential heterogeneity of EGP on ULGUE. It analyzes the mediating roles of land marketization, green technology innovation, and industrial upgrading alongside the moderating effects of environmental regulation and financial technology investment. Additionally, we compare the roles of different mediating variables and examine regional differences in the moderating effects of the moderating variables. This analysis enhances the theoretical understanding of how EGP influences ULGUE.
2. Theoretical Analysis and Research Hypotheses
2.1. EGP and Green Land Use
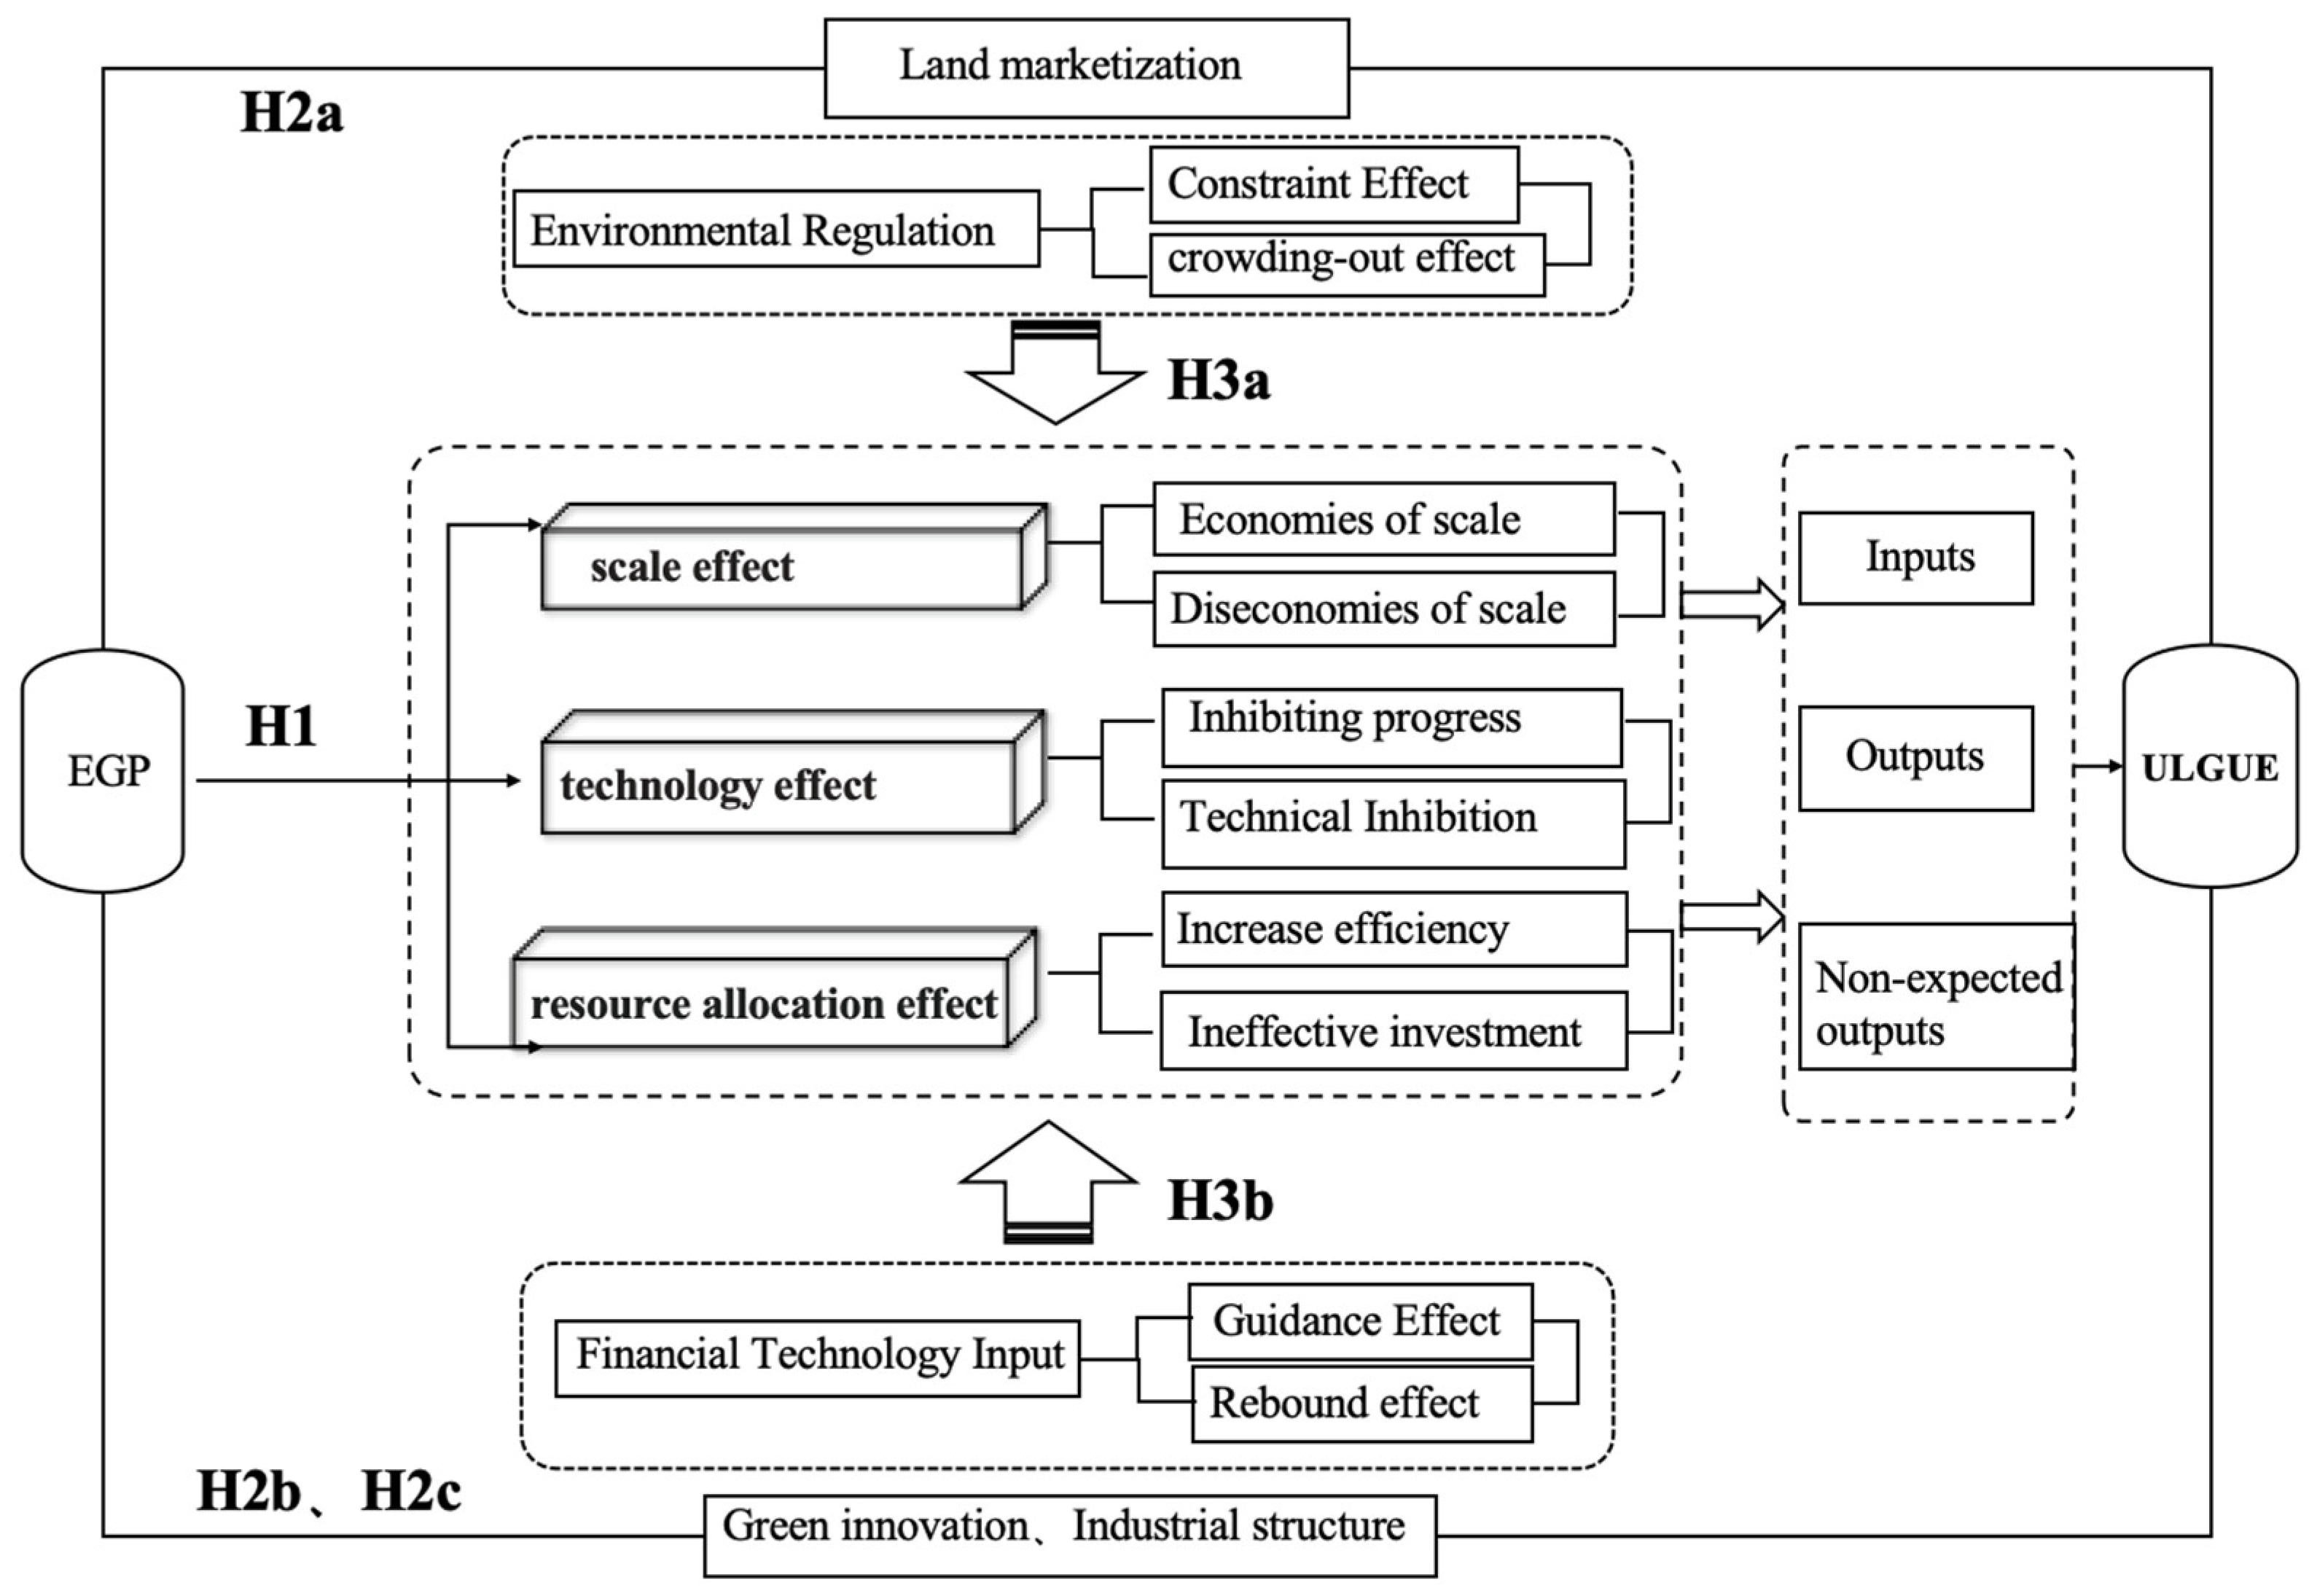
2.2. Main Effect Mechanism
2.3. Mediation Mechanism
2.4. Moderation Mechanism
3. Model Setting, Variables, and Data Sources
3.1. Model Setting
3.1.1. Baseline Model
3.1.2. Mediating Effect Model
3.1.3. Moderating Effect Model
3.2. Variables
3.2.1. Dependent Variable
3.2.2. Key Explanatory Variable
3.2.3. Mediating Variables
3.2.4. Moderating Variables
3.2.5. Control Variables
3.3. Data Sources
4. Results
4.1. Benchmark Regression
4.2. Analysis of Mediating Effect
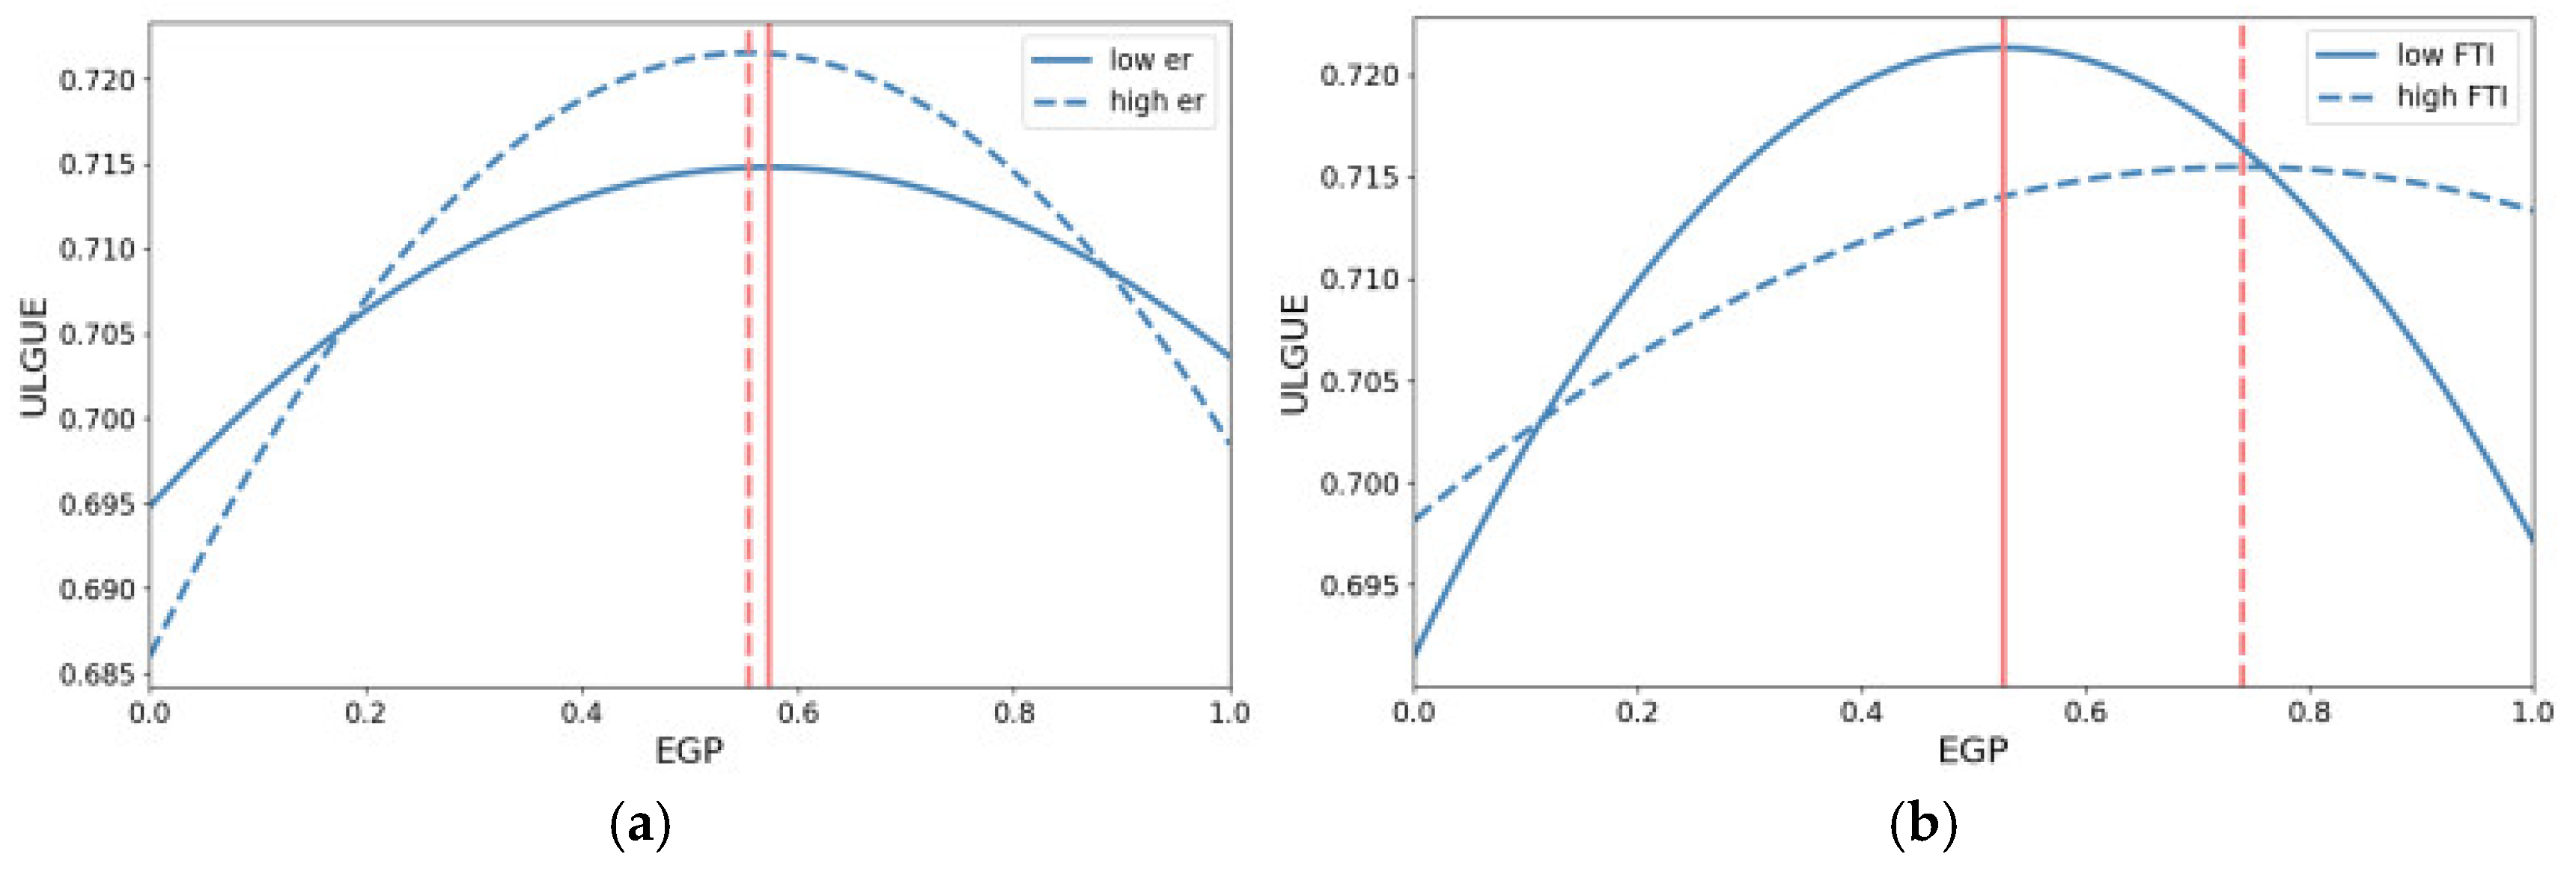
4.3. Analysis of Moderating Effects
4.4. Endogeneity Discussion
4.5. Further Robust Analysis
5. Heterogeneity Analysis
5.1. Impact of EGP on ULGUE Under Different Resource Endowments
5.2. The Impact of EGP on ULGUE Under Different Target Constraint Features
6. Conclusions and Policy Implications
6.1. Conclusions
6.2. Policy Implications
- Reasonable regulation of economic growth targets. The study indicates that excessive EGP can hinder urban land use efficiency. Therefore, local governments should establish targets that align with their respective stages of economic development. During the initial phases of industrial advancement, adopting more growth objectives could be justified to optimize ULGUE. Conversely, in the post-industrial phase, the focus should shift from rapid expansion to economic quality, mitigating the negative impact on urban land use. Moreover, economic targets should be integrated with sustainable land use strategies, incorporating indicators that emphasize environmentally friendly land use to counterbalance the adverse effects of EGP.
- To mitigate the adverse effects of EGP, local governments should optimize the land transfer system, prioritize technological and industrial upgrading, and emphasize the role of regulation and incentives. This includes improving the land property rights system, establishing an open and transparent land transaction market, and optimizing the land supply mechanism. Governments should accelerate the aggregation of high-level innovation resources, enhance regional talent systems, and cultivate a culture of innovation. Strengthening policy guidance can further promote the growth of emerging industries while phasing out high-input, high-pollution, and low-efficiency industries. In particular, technological and industrial upgrading should play a central role in this process. Furthermore, adequate environmental supervision plays a pivotal role in enhancing the beneficial influence of EGP on urban land development. Fintech inputs can also help alleviate its adverse effects. Therefore, enhancing environmental regulations, establishing a comprehensive monitoring system, and increasing fiscal support for green industries are essential. Specifically, while the eastern region should focus on strengthening environmental supervision, the western and northeastern regions should emphasize investments in science and technology to drive sustainable development.
- Scientific evaluation of local conditions and differentiating policy formulation. The research underscores the critical need to consider regional differences and policy goal-setting approaches in policy evaluation. Resource-based cities should avoid excessive dependence on resource exploitation and prioritize sustainable urban land use by accounting for local resource availability and environmental capacity. Furthermore, compared to the eastern region, the central, western, and northeastern regions should focus on optimizing economic structures, setting growth targets that align with their developmental foundations, and ensuring a balance between ecological conservation and economic development. Additionally, when formulating economic growth targets, municipal governments should consider adopting a flexible “soft constraint” approach to enable more adaptive and diversified policy measures.
6.3. Limitations
Author Contributions
Funding
Data Availability Statement
Conflicts of Interest
References
- Cordero, R.R.; Roth, P.; Da Silva, L. Economic Growth or Environmental Protection?: The False Dilemma of the Latin-American Countries. Environ. Sci. Policy 2005, 8, 392–398. [Google Scholar] [CrossRef]
- Parikh, J.; Shukla, V. Urbanization, Energy Use and Greenhouse Effects in Economic Development: Results from a Cross-National Study of Developing Countries. Glob. Environ. Change 1995, 5, 87–103. [Google Scholar] [CrossRef]
- Pata, U.K. Renewable Energy Consumption, Urbanization, Financial Development, Income and CO2 Emissions in Turkey: Testing EKC Hypothesis with Structural Breaks. J. Clean. Prod. 2018, 187, 770–779. [Google Scholar] [CrossRef]
- Jiao, L.; Xu, Z.; Xu, G.; Zhao, R.; Liu, J.; Wang, W. Assessment of Urban Land Use Efficiency in China: A Perspective of Scaling Law. Habitat Int. 2020, 99, 102172. [Google Scholar] [CrossRef]
- NBSC. China Statistical Yearbook 2021. Available online: https://www.stats.gov.cn/ (accessed on 17 March 2025).
- Bai, C.; Xie, D.; Zhang, Y. Industrial Land Transfer and Enterprise Pollution Emissions: Evidence from China. Econ. Anal. Policy 2024, 81, 181–194. [Google Scholar] [CrossRef]
- Liu, T.; Liu, H.; Qi, Y. Construction Land Expansion and Cultivated Land Protection in Urbanizing China: Insights from National Land Surveys, 1996–2006. Habitat Int. 2015, 46, 13–22. [Google Scholar] [CrossRef]
- Wang, Y.; Jiang, Y.; Li, W.; Dong, S.; Gao, C. Determinants of Land Use Conflicts with the Method of Cross-Wavelet Analysis: Role of Natural Resources and Human Activities in Spatial-Temporal Evolution. J. Clean. Prod. 2023, 429, 139498. [Google Scholar] [CrossRef]
- Czarnecki, A.; Milczarek-Andrzejewska, D.; Widła-Domaradzki, Ł.; Jórasz-Żak, A. Conflict Dynamics over Farmland Use in the Multifunctional Countryside. Land Use Policy 2023, 128, 106587. [Google Scholar] [CrossRef]
- Liu, Y. Introduction to Land Use and Rural Sustainability in China. Land Use Policy 2018, 74, 1–4. [Google Scholar] [CrossRef]
- Tan, S.; Hu, B.; Kuang, B.; Zhou, M. Regional Differences and Dynamic Evolution of Urban Land Green Use Efficiency within the Yangtze River Delta, China. Land Use Policy 2021, 106, 105449. [Google Scholar] [CrossRef]
- Chen, Y.; Chen, Z.; Xu, G.; Tian, Z. Built-up Land Efficiency in Urban China: Insights from the General Land Use Plan (2006–2020). Habitat Int. 2016, 51, 31–38. [Google Scholar] [CrossRef]
- Liu, S.; Xiao, W.; Li, L.; Ye, Y.; Song, X. Urban Land Use Efficiency and Improvement Potential in China: A Stochastic Frontier Analysis. Land Use Policy 2020, 99, 105046. [Google Scholar] [CrossRef]
- Chen, W.; Shen, Y.; Wang, Y.; Wu, Q. The Effect of Industrial Relocation on Industrial Land Use Efficiency in China: A Spatial Econometrics Approach. J. Clean. Prod. 2018, 205, 525–535. [Google Scholar] [CrossRef]
- Guastella, G.; Pareglio, S.; Sckokai, P. A Spatial Econometric Analysis of Land Use Efficiency in Large and Small Municipalities. Land Use Policy 2017, 63, 288–297. [Google Scholar] [CrossRef]
- Zhu, X.; Li, Y.; Zhang, P.; Wei, Y.; Zheng, X.; Xie, L. Temporal–Spatial Characteristics of Urban Land Use Efficiency of China’s 35mega Cities Based on DEA: Decomposing Technology and Scale Efficiency. Land Use Policy 2019, 88, 104083. [Google Scholar] [CrossRef]
- Wang, Z.; Fu, H.; Liu, H.; Liao, C. Urban Development Sustainability, Industrial Structure Adjustment, and Land Use Efficiency in China. Sustain. Cities Soc. 2023, 89, 104338. [Google Scholar] [CrossRef]
- Yang, G.; Wang, X.; Peng, L.; Zhang, X. Dynamic Interactions of Urban Land Use Efficiency, Industrial Structure, and Carbon Emissions Intensity in Chinese Cities: A Panel Vector Autoregression (PVAR) Approach. Land 2025, 14, 57. [Google Scholar] [CrossRef]
- Xie, X.; Fang, B.; Xu, H.; He, S.; Li, X. Study on the Coordinated Relationship between Urban Land Use Efficiency and Ecosystem Health in China. Land Use Policy 2021, 102, 105235. [Google Scholar] [CrossRef]
- Zhang, M.; Chen, E.; Zhang, C.; Liu, C.; Li, J. Multi-Scenario Simulation of Land Use Change and Ecosystem Service Value Based on the Markov–FLUS Model in Ezhou City, China. Sustainability 2024, 16, 6237. [Google Scholar] [CrossRef]
- Feng, Y.; Li, Y.; Nie, C. The Effect of Place-Based Policy on Urban Land Green Use Efficiency: Evidence from the Pilot Free-Trade Zone Establishment in China. Land 2023, 12, 701. [Google Scholar] [CrossRef]
- Lu, X.; Chen, D.; Kuang, B.; Zhang, C.; Cheng, C. Is High-Tech Zone a Policy Trap or a Growth Drive? Insights from the Perspective of Urban Land Use Efficiency. Land Use Policy 2020, 95, 104583. [Google Scholar] [CrossRef]
- Chakraborty, S.; Maity, I.; Dadashpoor, H.; Novotnẏ, J.; Banerji, S. Building in or out? Examining Urban Expansion Patterns and Land Use Efficiency across the Global Sample of 466 Cities with Million+ Inhabitants. Habitat Int. 2022, 120, 102503. [Google Scholar] [CrossRef]
- Kang, H.; Fu, M.; Kang, H.; Li, L.; Dong, X.; Li, S. The Impacts of Urban Population Growth and Shrinkage on the Urban Land Use Efficiency: A Case Study of the Northeastern Region of China. Land 2024, 13, 1532. [Google Scholar] [CrossRef]
- Yu, J.; Zhou, K.; Yang, S. Land Use Efficiency and Influencing Factors of Urban Agglomerations in China. Land Use Policy 2019, 88, 104143. [Google Scholar] [CrossRef]
- Liu, J.; Feng, H.; Wang, K. The Low-Carbon City Pilot Policy and Urban Land Use Efficiency: A Policy Assessment from China. Land 2022, 11, 604. [Google Scholar] [CrossRef]
- Zhang, R.; Wen, L.; Jin, Y.; Zhang, A.; Gil, J.M. Synergistic Impacts of Carbon Emission Trading Policy and Innovative City Pilot Policy on Urban Land Green Use Efficiency in China. Sustain. Cities Soc. 2025, 118, 105955. [Google Scholar] [CrossRef]
- Wang, A.; Lin, W.; Liu, B.; Wang, H.; Xu, H. Does Smart City Construction Improve the Green Utilization Efficiency of Urban Land? Land 2021, 10, 657. [Google Scholar] [CrossRef]
- Zhou, G.; Xu, H.; Jiang, C.; Deng, S.; Chen, L.; Zhang, Z. Has the Digital Economy Improved the Urban Land Green Use Efficiency? Evidence from the National Big Data Comprehensive Pilot Zone Policy. Land 2024, 13, 960. [Google Scholar] [CrossRef]
- Du, J.; Thill, J.-C.; Peiser, R.B. Land Pricing and Its Impact on Land Use Efficiency in Post-Land-Reform China: A Case Study of Beijing. Cities 2016, 50, 68–74. [Google Scholar] [CrossRef]
- Wang, P.; Shao, Z.; Wang, J.; Wu, Q. The Impact of Land Finance on Urban Land Use Efficiency: A Panel Threshold Model for Chinese Provinces. Growth Change 2021, 52, 310–331. [Google Scholar] [CrossRef]
- Yu, B.; Zhou, X. Urban Administrative Hierarchy and Urban Land Use Efficiency: Evidence from Chinese Cities. Int. Rev. Econ. Financ. 2023, 88, 178–195. [Google Scholar] [CrossRef]
- Gao, X.; Zhang, A.; Sun, Z. How Regional Economic Integration Influence on Urban Land Use Efficiency? A Case Study of Wuhan Metropolitan Area, China. Land Use Policy 2020, 90, 104329. [Google Scholar] [CrossRef]
- Liao, X.; Fang, C.; Shu, T.; Ren, Y. Spatiotemporal Impacts of Urban Structure upon Urban Land-Use Efficiency: Evidence from 280 Cities in China. Habitat Int. 2023, 131, 102727. [Google Scholar] [CrossRef]
- Liu, J.; Hou, X.; Wang, Z.; Shen, Y. Study the Effect of Industrial Structure Optimization on Urban Land-Use Efficiency in China. Land Use Policy 2021, 105, 105390. [Google Scholar] [CrossRef]
- Hersperger, A.M.; Oliveira, E.; Pagliarin, S.; Palka, G.; Verburg, P.; Bolliger, J.; Grădinaru, S. Urban Land-Use Change: The Role of Strategic Spatial Planning. Glob. Environ. Change 2018, 51, 32–42. [Google Scholar] [CrossRef]
- Marondedze, A.K.; Mutanga, O.; Cho, M.A. Promoting Inclusion in Urban Land Use Planning Using Participatory Geographic Information System (PGIS) Techniques: A Systematic Review. J. Environ. Manag. 2024, 370, 123099. [Google Scholar] [CrossRef]
- Yin, J.; Dong, J.; Hamm, N.A.S.; Li, Z.; Wang, J.; Xing, H.; Fu, P. Integrating Remote Sensing and Geospatial Big Data for Urban Land Use Mapping: A Review. Int. J. Appl. Earth Obs. Geoinf. 2021, 103, 102514. [Google Scholar] [CrossRef]
- Xie, H.; Chen, Q.; Lu, F.; Wang, W.; Yao, G.; Yu, J. Spatial-Temporal Disparities and Influencing Factors of Total-Factor Green Use Efficiency of Industrial Land in China. J. Clean. Prod. 2019, 207, 1047–1058. [Google Scholar] [CrossRef]
- Xue, D.; Yue, L.; Ahmad, F.; Draz, M.U.; Chandio, A.A.; Ahmad, M.; Amin, W. Empirical Investigation of Urban Land Use Efficiency and Influencing Factors of the Yellow River Basin Chinese Cities. Land Use Policy 2022, 117, 106117. [Google Scholar] [CrossRef]
- Ma, L.; Xu, W.; Zhang, W.; Ma, Y. Effect and Mechanism of Environmental Regulation Improving the Urban Land Use Eco-Efficiency: Evidence from China. Ecol. Indic. 2024, 159, 111602. [Google Scholar] [CrossRef]
- Zhou, C.; Wang, J.; Wu, Z. Impact of China’s Energy-Consuming Right Trading on Urban Land Green Utilization Efficiency. Land 2024, 13, 729. [Google Scholar] [CrossRef]
- Li, X.; Liu, C.; Weng, X.; Zhou, L.-A. Target Setting in Tournaments: Theory and Evidence from China. Econ. J. 2019, 129, 2888–2915. [Google Scholar] [CrossRef]
- Wang, Z.; Li, X.; Xue, X.; Liu, Y. More Government Subsidies, More Green Innovation? The Evidence from Chinese New Energy Vehicle Enterprises. Renew. Energy 2022, 197, 11–21. [Google Scholar] [CrossRef]
- Zhu, J.; Lin, B. Economic Growth Pressure and Energy Efficiency Improvement: Empirical Evidence from Chinese Cities. Appl. Energy 2022, 307, 118275. [Google Scholar] [CrossRef]
- Yu, H.; Wang, J.; Hou, J.; Yu, B.; Pan, Y. The Effect of Economic Growth Pressure on Green Technology Innovation: Do Environmental Regulation, Government Support, and Financial Development Matter? J. Environ. Manag. 2023, 330, 117172. [Google Scholar] [CrossRef]
- Ma, L. Performance Feedback, Government Goal-Setting and Aspiration Level Adaptation: Evidence from Chinese Provinces. Public Adm. 2016, 94, 452–471. [Google Scholar] [CrossRef]
- Chen, J.; Chen, X.; Hou, Q.; Hu, M. Haste Doesn’t Bring Success: Top-down Amplification of Economic Growth Targets and Enterprise Overcapacity. J. Corp. Financ. 2021, 70, 102059. [Google Scholar] [CrossRef]
- Zhong, Q.; Wen, H.; Lee, C.-C. How Does Economic Growth Target Affect Corporate Environmental Investment? Evidence from Heavy-Polluting Industries in China. Environ. Impact Assess. Rev. 2022, 95, 106799. [Google Scholar] [CrossRef]
- Chai, J.; Hao, Y.; Wu, H.; Yang, Y. Do Constraints Created by Economic Growth Targets Benefit Sustainable Development? Evidence from China. Bus. Strategy Environ. 2021, 30, 4188–4205. [Google Scholar] [CrossRef]
- Liu, D.; Xu, C.; Yu, Y.; Rong, K.; Zhang, J. Economic Growth Target, Distortion of Public Expenditure and Business Cycle in China. China Econ. Rev. 2020, 63, 101373. [Google Scholar] [CrossRef]
- Ren, S.; Du, M.; Bu, W.; Lin, T. Assessing the Impact of Economic Growth Target Constraints on Environmental Pollution: Does Environmental Decentralization Matter? J. Environ. Manag. 2023, 336, 117618. [Google Scholar] [CrossRef]
- Shen, F.; Liu, B.; Luo, F.; Wu, C.; Chen, H.; Wei, W. The Effect of Economic Growth Target Constraints on Green Technology Innovation. J. Environ. Manag. 2021, 292, 112765. [Google Scholar] [CrossRef]
- Qiu, S.; Wang, Z.; Liu, S. The Policy Outcomes of Low-Carbon City Construction on Urban Green Development: Evidence from a Quasi-Natural Experiment Conducted in China. Sustain. Cities Soc. 2021, 66, 102699. [Google Scholar] [CrossRef]
- Tan, R.; Zhang, T.; Liu, D.; Xu, H. How Will Innovation-Driven Development Policy Affect Sustainable Urban Land Use: Evidence from 230 Chinese Cities. Sustain. Cities Soc. 2021, 72, 103021. [Google Scholar] [CrossRef]
- Kirkpatrick, L.O.; Smith, M.P. The Infrastructural Limits to Growth: Rethinking the Urban Growth Machine in Times of Fiscal Crisis. Int. J. Urban Reg. Res. 2011, 35, 477–503. [Google Scholar] [CrossRef]
- Li, F.; Wang, Z.; Huang, L. Economic Growth Target and Environmental Regulation Intensity: Evidence from 284 Cities in China. Environ. Sci. Pollut. Res. 2022, 29, 10235–10249. [Google Scholar] [CrossRef]
- Shi, B.; Zhu, G.; Li, N. Does Economic Growth Targets Setting Lead to Carbon Emissions? An Empirical Study from China. J. Environ. Manag. 2024, 368, 122084. [Google Scholar] [CrossRef]
- Brodsgaard, K.E. Critical Readings on the Communist Party of China (4 Vols. Set); Brill: Leiden, The Netherlands, 2016; ISBN 978-90-04-30248-8. [Google Scholar]
- Li, H.; Zhou, L.-A. Political Turnover and Economic Performance: The Incentive Role of Personnel Control in China. J. Public Econ. 2005, 89, 1743–1762. [Google Scholar] [CrossRef]
- Edin, M. State Capacity and Local Agent Control in China: CCP Cadre Management from a Township Perspective. China Q. 2003, 173, 35–52. [Google Scholar] [CrossRef]
- Zhang, Y.; Mao, W.; Zhang, B. Distortion of Government Behaviour under Target Constraints: Economic Growth Target and Urban Sprawl in China. Cities 2022, 131, 104009. [Google Scholar] [CrossRef]
- You, D.; Zhang, Y.; Yuan, B. Environmental Regulation and Firm Eco-Innovation: Evidence of Moderating Effects of Fiscal Decentralization and Political Competition from Listed Chinese Industrial Companies. J. Clean. Prod. 2019, 207, 1072–1083. [Google Scholar] [CrossRef]
- Sun, Y.; Tang, Y.; Li, G. Economic Growth Targets and Green Total Factor Productivity: Evidence from China. J. Environ. Plan. Manag. 2023, 66, 2090–2106. [Google Scholar] [CrossRef]
- Tang, P.; Jiang, Q.; Mi, L. One-Vote Veto: The Threshold Effect of Environmental Pollution in China’s Economic Promotion Tournament. Ecol. Econ. 2021, 185, 107069. [Google Scholar] [CrossRef]
- Zhong, M.; Wang, P.; Ji, M.; Zeng, X.-H.; Wei, H.-X. Promote or Inhibit: Economic Goal Pressure and Residents’ Health. Front. Public Health 2021, 9, 725957. [Google Scholar] [CrossRef]
- He, C.; Zhou, Y.; Huang, Z. Fiscal Decentralization, Political Centralization, and Land Urbanization in China. Urban Geogr. 2016, 37, 436–457. [Google Scholar] [CrossRef]
- Li, K.; Lin, B. Economic Growth Model, Structural Transformation, and Green Productivity in China. Appl. Energy 2017, 187, 489–500. [Google Scholar] [CrossRef]
- Zheng, W.; Walsh, P.P. Economic Growth, Urbanization and Energy Consumption—A Provincial Level Analysis of China. Energy Econ. 2019, 80, 153–162. [Google Scholar] [CrossRef]
- Kubick, T.R.; Masli, A.N.S. Firm-Level Tournament Incentives and Corporate Tax Aggressiveness. J. Account. Public Policy 2016, 35, 66–83. [Google Scholar] [CrossRef]
- Perdiguero, J.; Jiménez, J.L. Sell or Not Sell Biodiesel: Local Competition and Government Measures. Renew. Sustain. Energy Rev. 2011, 15, 1525–1532. [Google Scholar] [CrossRef]
- Chatman, D.G.; Noland, R.B. Do Public Transport Improvements Increase Agglomeration Economies? A Review of Literature and an Agenda for Research. Transp. Rev. 2011, 31, 725–742. [Google Scholar] [CrossRef]
- Oliveira, E.A.; Andrade, J.S.; Makse, H.A. Large Cities Are Less Green. Sci. Rep. 2014, 4, 4235. [Google Scholar] [CrossRef] [PubMed]
- Yu, N.; de Roo, G.; de Jong, M.; Storm, S. Does the Expansion of a Motorway Network Lead to Economic Agglomeration? Evidence from China. Transp. Policy 2016, 45, 218–227. [Google Scholar] [CrossRef]
- Du, W.; Li, M. The Impact of Land Resource Mismatch and Land Marketization on Pollution Emissions of Industrial Enterprises in China. J. Environ. Manag. 2021, 299, 113565. [Google Scholar] [CrossRef]
- Lan, J.; Li, Q.; Zheng, Y.; Liu, Z. The Impact of the Low-Carbon City Pilots Programme on Industrial Land Transfer by Local Governments in China. Econ. Anal. Policy 2023, 77, 824–842. [Google Scholar] [CrossRef]
- Acemoglu, D.; Moscona, J.; Robinson, J.A. State Capacity and American Technology: Evidence from the Nineteenth Century. Am. Econ. Rev. 2016, 106, 61–67. [Google Scholar] [CrossRef]
- Arqué-Castells, P. How Venture Capitalists Spur Invention in Spain: Evidence from Patent Trajectories. Res. Policy 2012, 41, 897–912. [Google Scholar] [CrossRef]
- Jiang, Y.; Waley, P. Financialization of Urban Development in China: Fantasy, Fact or Somewhere in Between? Reg. Stud. 2022, 56, 1271–1281. [Google Scholar] [CrossRef]
- Wu, F. Land Financialisation and the Financing of Urban Development in China. Land Use Policy 2022, 112, 104412. [Google Scholar] [CrossRef]
- Brandt, L.; Tombe, T.; Zhu, X. Factor Market Distortions across Time, Space and Sectors in China. Rev. Econ. Dyn. 2013, 16, 39–58. [Google Scholar] [CrossRef]
- Hassine, H.B.; Mathieu, C. R&D Crowding out or R&D Leverage Effects: An Evaluation of the French Cluster-Oriented Technology Policy. Technol. Forecast. Soc. Change 2020, 155, 120025. [Google Scholar] [CrossRef]
- Zhang, X.; Tan, K.-Y. Incremental Reform and Distortions in China’s Product and Factor Markets. World Bank Econ. Rev. 2007, 21, 279–299. [Google Scholar] [CrossRef]
- Buera, F.J.; Kaboski, J.P.; Shin, Y. Finance and Development: A Tale of Two Sectors. Am. Econ. Rev. 2011, 101, 1964–2002. [Google Scholar] [CrossRef]
- Feng, J.; Lichtenberg, E.; Ding, C. Balancing Act: Economic Incentives, Administrative Restrictions, and Urban Land Expansion in China. China Econ. Rev. 2015, 36, 184–197. [Google Scholar] [CrossRef]
- Lian, H.; Li, H.; Ko, K. Market-Led Transactions and Illegal Land Use: Evidence from China. Land Use Policy 2019, 84, 12–20. [Google Scholar] [CrossRef]
- Wang, Y.; Hui, E.C. Are Local Governments Maximizing Land Revenue? Evidence from China. China Econ. Rev. 2017, 43, 196–215. [Google Scholar] [CrossRef]
- Restuccia, D.; Rogerson, R. The Causes and Costs of Misallocation. J. Econ. Perspect. 2017, 31, 151–174. [Google Scholar] [CrossRef]
- Yang, Y.; Xue, R.; Zhang, X.; Cheng, Y.; Shan, Y. Can the Marketization of Urban Land Transfer Improve Energy Efficiency? J. Environ. Manag. 2023, 329, 117126. [Google Scholar] [CrossRef]
- Kahn, M.E.; Li, P.; Zhao, D. Water Pollution Progress at Borders: The Role of Changes in China’s Political Promotion Incentives. Am. Econ. J. Econ. Policy 2015, 7, 223–242. [Google Scholar] [CrossRef]
- Liu, J.; Jiang, Z.; Chen, W. Land Misallocation and Urban Air Quality in China. Environ. Sci. Pollut. Res. 2021, 28, 58387–58404. [Google Scholar] [CrossRef]
- Jiang, X.; Lu, X.; Liu, Q.; Chang, C.; Qu, L. The Effects of Land Transfer Marketization on the Urban Land Use Efficiency: An Empirical Study Based on 285 Cities in China. Ecol. Indic. 2021, 132, 108296. [Google Scholar] [CrossRef]
- Lu, X.; Tao, X. Local Government Environmental Attention and Urban Land Green Use Efficiency in China: The Intermediary Role of Industrial Restructuring. Land 2024, 13, 21. [Google Scholar] [CrossRef]
- Zhang, J.; Zhang, Y. Examining the Effects of Economic Growth Pressure on Green Total Factor Productivity: Evidence from China. Econ. Change Restruct. 2023, 56, 4309–4337. [Google Scholar] [CrossRef]
- Quan, Z.X. Institutional Transformation and Marketisation: The Changing Patterns of Housing Investment in Urban China. Habitat Int. 2006, 30, 327–341. [Google Scholar] [CrossRef]
- Tao, R.; Su, F.; Liu, M.; Cao, G. Land Leasing and Local Public Finance in China’s Regional Development: Evidence from Prefecture-Level Cities. Urban Stud. 2010, 47, 2217–2236. [Google Scholar] [CrossRef]
- Wang, Q.; Wang, Y.; Chen, W.; Zhou, X.; Zhao, M. Factors Affecting Industrial Land Use Efficiency in China: Analysis from Government and Land Market. Environ. Dev. Sustain. 2021, 23, 10973–10993. [Google Scholar] [CrossRef]
- Zhang, J.; Xu, R.; Chen, J. Does Industrial Land Marketization Reform Faciliate Urban Land Use Efficiency? Int. Rev. Econ. Financ. 2024, 96, 103609. [Google Scholar] [CrossRef]
- Nelson, R.A. Recent Evolutionary Theorizing About Economic Change. In Theorien der Organisation: Die Rückkehr der Gesellschaft; Ortmann, G., Sydow, J., Türk, K., Eds.; VS Verlag für Sozialwissenschaften: Wiesbaden, Germany, 1997; pp. 81–123. ISBN 978-3-322-95661-3. [Google Scholar]
- Feng, Y.; Wang, X.; Liang, Z.; Hu, S.; Xie, Y.; Wu, G. Effects of Emission Trading System on Green Total Factor Productivity in China: Empirical Evidence from a Quasi-Natural Experiment. J. Clean. Prod. 2021, 294, 126262. [Google Scholar] [CrossRef]
- Li, C.; Qi, Y.; Liu, S.; Wang, X. Do Carbon ETS Pilots Improve Cities’ Green Total Factor Productivity? Evidence from a Quasi-Natural Experiment in China. Energy Econ. 2022, 108, 105931. [Google Scholar] [CrossRef]
- Lin, B.; Xu, M. Exploring the Green Total Factor Productivity of China’s Metallurgical Industry under Carbon Tax: A Perspective on Factor Substitution. J. Clean. Prod. 2019, 233, 1322–1333. [Google Scholar] [CrossRef]
- Yin, G.; Lin, Z.; Jiang, X.; Qiu, M.; Sun, J. How Do the Industrial Land Use Intensity and Dominant Industries Guide the Urban Land Use? Evidences from 19 Industrial Land Categories in Ten Cities of China. Sustain. Cities Soc. 2020, 53, 101978. [Google Scholar] [CrossRef]
- Lu, X.; Jiang, X.; Gong, M. How Land Transfer Marketization Influence on Green Total Factor Productivity from the Approach of Industrial Structure? Evidence from China. Land Use Policy 2020, 95, 104610. [Google Scholar] [CrossRef]
- Peuckert, J. What Shapes the Impact of Environmental Regulation on Competitiveness? Evidence from Executive Opinion Surveys. Environ. Innov. Soc. Transit. 2014, 10, 77–94. [Google Scholar] [CrossRef]
- Wu, H.; Xu, L.; Ren, S.; Hao, Y.; Yan, G. How Do Energy Consumption and Environmental Regulation Affect Carbon Emissions in China? New Evidence from a Dynamic Threshold Panel Model. Resour. Policy 2020, 67, 101678. [Google Scholar] [CrossRef]
- Ambec, S.; Cohen, M.A.; Elgie, S.; Lanoie, P. The Porter Hypothesis at 20: Can Environmental Regulation Enhance Innovation and Competitiveness? Rev. Environ. Econ. Policy 2013, 7, 2–22. [Google Scholar] [CrossRef]
- Kostka, G.; Goron, C. From Targets to Inspections: The Issue of Fairness in China’s Environmental Policy Implementation. Environ. Politics 2021, 30, 513–537. [Google Scholar]
- Tian, Y.; Feng, C. The Internal-Structural Effects of Different Types of Environmental Regulations on China’s Green Total-Factor Productivity. Energy Econ. 2022, 113, 106246. [Google Scholar] [CrossRef]
- Gnagey, M.K. Wetlands and Open Space: The Impact of Environmental Regulations on Land Use Patterns. J. Environ. Manag. 2018, 225, 148–159. [Google Scholar] [CrossRef]
- Spalding, A.K. Exploring the Evolution of Land Tenure and Land Use Change in Panama: Linking Land Policy with Development Outcomes. Land Use Policy 2017, 61, 543–552. [Google Scholar] [CrossRef]
- López-Gamero, M.D.; Molina-Azorín, J.F.; Claver-Cortés, E. The Potential of Environmental Regulation to Change Managerial Perception, Environmental Management, Competitiveness and Financial Performance. J. Clean. Prod. 2010, 18, 963–974. [Google Scholar] [CrossRef]
- Liu, Y.; Fan, P.; Yue, W.; Song, Y. Impacts of Land Finance on Urban Sprawl in China: The Case of Chongqing. Land Use Policy 2018, 72, 420–432. [Google Scholar] [CrossRef]
- Ge, T.; Cai, X.; Song, X. How Does Renewable Energy Technology Innovation Affect the Upgrading of Industrial Structure? The Moderating Effect of Green Finance. Renew. Energy 2022, 197, 1106–1114. [Google Scholar] [CrossRef]
- Kou, P.; Han, Y. Vertical Environmental Protection Pressure, Fiscal Pressure, and Local Environmental Regulations: Evidence from China’s Industrial Sulfur Dioxide Treatment. Environ. Sci Pollut. Res. 2021, 28, 60095–60110. [Google Scholar] [CrossRef]
- Smith, L.E.D.; Siciliano, G. A Comprehensive Review of Constraints to Improved Management of Fertilizers in China and Mitigation of Diffuse Water Pollution from Agriculture. Agric. Ecosyst. Environ. 2015, 209, 15–25. [Google Scholar] [CrossRef]
- Chung, J.; Yoon, S. Effects of Tax Incentive Policies for Land Use on Local Socioeconomic Conditions: A Case of Tax Policies for Urban Regeneration Projects in Republic of Korea. Land 2023, 12, 1801. [Google Scholar] [CrossRef]
- Liu, Z.; Jiang, C.; Huang, J.; Zhang, W.; Li, X. Fiscal Incentive, Political Incentive, and Strategic Interaction of Illegal Land Use by Local Governments. Land Use Policy 2023, 129, 106647. [Google Scholar] [CrossRef]
- Wu, Z.; Fan, X.; Zhu, B.; Xia, J.; Zhang, L.; Wang, P. Do Government Subsidies Improve Innovation Investment for New Energy Firms: A Quasi-Natural Experiment of China’s Listed Companies. Technol. Forecast. Soc. Change 2022, 175, 121418. [Google Scholar] [CrossRef]
- He, L.; Chen, L. The Incentive Effects of Different Government Subsidy Policies on Green Buildings. Renew. Sustain. Energy Rev. 2021, 135, 110123. [Google Scholar] [CrossRef]
- Long, H.; Qu, Y. Land Use Transitions and Land Management: A Mutual Feedback Perspective. Land Use Policy 2018, 74, 111–120. [Google Scholar] [CrossRef]
- Zhang, Q.; Zhang, S.; Ding, Z.; Hao, Y. Does Government Expenditure Affect Environmental Quality? Empirical Evidence Using Chinese City-Level Data. J. Clean. Prod. 2017, 161, 143–152. [Google Scholar] [CrossRef]
- Fisher-Vanden, K.; Sue Wing, I. Accounting for Quality: Issues with Modeling the Impact of R&D on Economic Growth and Carbon Emissions in Developing Economies. Energy Econ. 2008, 30, 2771–2784. [Google Scholar] [CrossRef]
- Zhu, H.; Zhao, S.; Abbas, A. Relationship between R&D Grants, R&D Investment, and Innovation Performance: The Moderating Effect of Absorptive Capacity. J. Public Aff. 2020, 20, e1973. [Google Scholar] [CrossRef]
- Wadho, W.; Chaudhry, A. Innovation and Firm Performance in Developing Countries: The Case of Pakistani Textile and Apparel Manufacturers. Res. Policy 2018, 47, 1283–1294. [Google Scholar] [CrossRef]
- Du, J.; Yi, H. Target-Setting, Political Incentives, and the Tricky Trade-off between Economic Development and Environmental Protection. Public Adm. 2022, 100, 923–941. [Google Scholar] [CrossRef]
- Gelbach, J.B. When Do Covariates Matter? And Which Ones, and How Much? J. Labor Econ. 2016, 34, 509–543. [Google Scholar] [CrossRef]
- Zhao, Z.; Bai, Y.; Wang, G.; Chen, J.; Yu, J.; Liu, W. Land Eco-Efficiency for New-Type Urbanization in the Beijing-Tianjin-Hebei Region. Technol. Forecast. Soc. Change 2018, 137, 19–26. [Google Scholar] [CrossRef]
- Zhang, J. Estimation of China’s Provincial Capital Stock (1952–2004) with Applications. J. Chin. Econ. Bus. Stud. 2008, 6, 177–196. [Google Scholar] [CrossRef]
- Ding, J.; Liu, B.; Shao, X. Spatial Effects of Industrial Synergistic Agglomeration and Regional Green Development Efficiency: Evidence from China. Energy Econ. 2022, 112, 106156. [Google Scholar] [CrossRef]
- Gu, R.; Li, C.; Yang, Y.; Zhang, J. The Impact of Industrial Digital Transformation on Green Development Efficiency Considering the Threshold Effect of Regional Collaborative Innovation: Evidence from the Beijing-Tianjin-Hebei Urban Agglomeration in China. J. Clean. Prod. 2023, 420, 138345. [Google Scholar] [CrossRef]
- Li, L.; Li, M.; Ma, S.; Zheng, Y.; Pan, C. Does the Construction of Innovative Cities Promote Urban Green Innovation? J. Environ. Manag. 2022, 318, 115605. [Google Scholar] [CrossRef]
- Xu, N.; Zhao, D.; Zhang, W.; Zhang, H.; Chen, W.; Ji, M.; Liu, M. Innovation-Driven Development and Urban Land Low-Carbon Use Efficiency: A Policy Assessment from China. Land 2022, 11, 1634. [Google Scholar] [CrossRef]
- Xu, H.; Li, Z.; Guo, L.; Liu, Y. The Impact of Innovative City Pilot Policy on Urban Land Green Use Efficiency: A Quasi-Natural Experiment from China. Land 2025, 14, 168. [Google Scholar] [CrossRef]
- Ouyang, X.; Li, Q.; Du, K. How Does Environmental Regulation Promote Technological Innovations in the Industrial Sector? Evidence from Chinese Provincial Panel Data. Energy Policy 2020, 139, 111310. [Google Scholar] [CrossRef]
- Song, Y.; Yang, T.; Li, Z.; Zhang, X.; Zhang, M. Research on the Direct and Indirect Effects of Environmental Regulation on Environmental Pollution: Empirical Evidence from 253 Prefecture-Level Cities in China. J. Clean. Prod. 2020, 269, 122425. [Google Scholar] [CrossRef]
- Lin, B.; Ma, R. How Does Digital Finance Influence Green Technology Innovation in China? Evidence from the Financing Constraints Perspective. J. Environ. Manag. 2022, 320, 115833. [Google Scholar] [CrossRef]
- Masini, E.; Tomao, A.; Barbati, A.; Corona, P.; Serra, P.; Salvati, L. Urban Growth, Land-Use Efficiency and Local Socioeconomic Context: A Comparative Analysis of 417 Metropolitan Regions in Europe. Environ. Manag. 2019, 63, 322–337. [Google Scholar] [CrossRef] [PubMed]
- Fan, X.; Zhou, Y.; Xie, Q. Performance Evaluation, Environmental Regulation, and Urban Land Green Use Efficiency: Evidence from China. Environ. Prog. Sustain. Energy 2023, 42, e14120. [Google Scholar] [CrossRef]
- Song, X.; Feng, Q.; Xia, F.; Li, X.; Scheffran, J. Impacts of Changing Urban Land-Use Structure on Sustainable City Growth in China: A Population-Density Dynamics Perspective. Habitat Int. 2021, 107, 102296. [Google Scholar] [CrossRef]
- Gan, C.; Yu, J.; Zhao, W.; Fan, Y. Big Data Industry Development and Carbon Dioxide Emissions: A Quasi-Natural Experiment. J. Clean. Prod. 2023, 422, 138590. [Google Scholar] [CrossRef]
- Lyu, Y.; Xiao, X.; Zhang, J. Does the Digital Economy Enhance Green Total Factor Productivity in China? The Evidence from a National Big Data Comprehensive Pilot Zone. Struct. Change Econ. Dyn. 2024, 69, 183–196. [Google Scholar] [CrossRef]
- Wu, J.; Barnes, T. Local Planning and Global Implementation: Foreign Investment and Urban Development of Pudong, Shanghai. Habitat Int. 2008, 32, 364–374. [Google Scholar] [CrossRef]
- Koroso, N.H.; Lengoiboni, M.; Zevenbergen, J.A. Urbanization and Urban Land Use Efficiency: Evidence from Regional and Addis Ababa Satellite Cities, Ethiopia. Habitat Int. 2021, 117, 102437. [Google Scholar] [CrossRef]
- Cheng, Z.; Li, X.; Zhang, Q. Can New-Type Urbanization Promote the Green Intensive Use of Land? J. Environ. Manag. 2023, 342, 118150. [Google Scholar] [CrossRef]
- Hou, X.; Liu, J.; Zhang, D.; Zhao, M.; Xia, C. Impact of Urbanization on the Eco-Efficiency of Cultivated Land Utilization: A Case Study on the Yangtze River Economic Belt, China. J. Clean. Prod. 2019, 238, 117916. [Google Scholar] [CrossRef]
- Chen, M.; Huang, Y.; Tang, Z.; Lu, D.; Liu, H.; Ma, L. The Provincial Pattern of the Relationship between Urbanization and Economic Development in China. J. Geogr. Sci. 2014, 24, 33–45. [Google Scholar] [CrossRef]
- Lee, S.; Oh, D.-W. Economic Growth and the Environment in China: Empirical Evidence Using Prefecture Level Data. China Econ. Rev. 2015, 36, 73–85. [Google Scholar] [CrossRef]
- Pan, W.; Wang, J.; Lu, Z.; Liu, Y.; Li, Y. High-Quality Development in China: Measurement System, Spatial Pattern, and Improvement Paths. Habitat Int. 2021, 118, 102458. [Google Scholar] [CrossRef]
- Yang, W.; Huang, R.; Li, D. China’s High-Quality Economic Development: A Study of Regional Variations and Spatial Evolution. Econ. Change Restruct. 2024, 57, 86. [Google Scholar] [CrossRef]
- Lind, J.T.; Mehlum, H. With or Without U? The Appropriate Test for a U-Shaped Relationship. Oxf. Bull. Econ. Stat. 2010, 72, 109–118. [Google Scholar] [CrossRef]
- Liu, T.; Cao, G.; Yan, Y.; Wang, R.Y. Urban Land Marketization in China: Central Policy, Local Initiative, and Market Mechanism. Land Use Policy 2016, 57, 265–276. [Google Scholar] [CrossRef]
- Gyourko, J.; Shen, Y.; Wu, J.; Zhang, R. Land Finance in China: Analysis and Review. China Econ. Rev. 2022, 76, 101868. [Google Scholar] [CrossRef]
- Qun, W.; Yongle, L.; Siqi, Y. The Incentives of China’s Urban Land Finance. Land Use Policy 2015, 42, 432–442. [Google Scholar] [CrossRef]
- Lau, C.K.M. New Evidence about Regional Income Divergence in China. China Econ. Rev. 2010, 21, 293–309. [Google Scholar] [CrossRef]
- Ren, J.; Li, Y.; Zhang, J.; Xu, H.; Hao, C. Does Urban Shrinkage Equate to a Decline in Development Levels?—Urban Development Measurement and Influencing Factors Analysis. Environ. Impact Assess. Rev. 2024, 105, 107401. [Google Scholar] [CrossRef]
- Yuan, B.; Zhang, Y. Flexible Environmental Policy, Technological Innovation and Sustainable Development of China’s Industry: The Moderating Effect of Environment Regulatory Enforcement. J. Clean. Prod. 2020, 243, 118543. [Google Scholar] [CrossRef]
- Li, D.; Tang, F.; Jiang, J. Does Environmental Management System Foster Corporate Green Innovation? The Moderating Effect of Environmental Regulation. Technol. Anal. Strateg. Manag. 2019, 31, 1242–1256. [Google Scholar]
- Li, Z.; Solaymani, S. Effectiveness of Energy Efficiency Improvements in the Context of Energy Subsidy Policies. Clean Technol. Environ. Policy 2021, 23, 937–963. [Google Scholar] [CrossRef]
- Sovacool, B.K. Reviewing, Reforming, and Rethinking Global Energy Subsidies: Towards a Political Economy Research Agenda. Ecol. Econ. 2017, 135, 150–163. [Google Scholar] [CrossRef]
- Liang, T.; Zhang, Y.-J.; Qiang, W. Does Technological Innovation Benefit Energy Firms’ Environmental Performance? The Moderating Effect of Government Subsidies and Media Coverage. Technol. Forecast. Soc. Change 2022, 180, 121728. [Google Scholar] [CrossRef]
- Deng, H.; Li, C.; Wang, L. The Impact of Corporate Innovation on Environmental Performance: The Moderating Effect of Financing Constraints and Government Subsidies. Sustainability 2022, 14, 11530. [Google Scholar] [CrossRef]
- Zhang, J.; Zhang, Y. Does Tourism Contribute to the Nighttime Economy? Evidence from China. Curr. Issues Tour. 2023, 26, 1295–1310. [Google Scholar] [CrossRef]
- He, T.; Song, H. A Novel Approach to Assess the Urban Land-Use Efficiency of 767 Resource-Based Cities in China. Ecol. Indic. 2023, 151, 110298. [Google Scholar] [CrossRef]
- Martinez-Fernandez, C.; Audirac, I.; Fol, S.; Cunningham-Sabot, E. Shrinking Cities: Urban Challenges of Globalization. Int. J. Urban Reg. Res. 2012, 36, 213–225. [Google Scholar] [CrossRef]
- Xie, H.; Wang, W.; Yang, Z.; Choi, Y. Measuring the Sustainable Performance of Industrial Land Utilization in Major Industrial Zones of China. Technol. Forecast. Soc. Change 2016, 112, 207–219. [Google Scholar] [CrossRef]
- Zhang, Q.; Zhao, X. Can the Digital Economy Facilitate the Optimization of Industrial Structure in Resource-Based Cities? Struct. Change Econ. Dyn. 2024, 71, 405–416. [Google Scholar] [CrossRef]
- Fan, F.; Zhang, X. Transformation Effect of Resource-Based Cities Based on PSM-DID Model: An Empirical Analysis from China. Environ. Impact Assess. Rev. 2021, 91, 106648. [Google Scholar] [CrossRef]
- Wang, Y.; Chen, X. Natural Resource Endowment and Ecological Efficiency in China: Revisiting Resource Curse in the Context of Ecological Efficiency. Resour. Policy 2020, 66, 101610. [Google Scholar] [CrossRef]
- Song, Y.; Yeung, G.; Zhu, D.; Xu, Y.; Zhang, L. Efficiency of Urban Land Use in China’s Resource-Based Cities, 2000–2018. Land Use Policy 2022, 115, 106009. [Google Scholar] [CrossRef]
- Aken, T.V.; Lewis, O.A. The Political Economy of Noncompliance in China: The Case of Industrial Energy Policy. J. Contemp. China 2015, 24, 798–822. [Google Scholar]
- Chen, Y.; Li, H.; Zhou, L.-A. Relative Performance Evaluation and the Turnover of Provincial Leaders in China. Econ. Lett. 2005, 88, 421–425. [Google Scholar] [CrossRef]


| Layer of Criteria | Factors | Indicators | Unit | References |
|---|---|---|---|---|
| Input indicators | Land | Constructed urban space | square kilometer | Xue et al. (2022) [40] Zhao et al. (2018) [128] Ding et al. (2022) [130] |
| Capital | Fixed capital stock (based on 2006, calculated using the perpetual inventory method) | 100 million Yuan | ||
| Labor | Workforce in the secondary and tertiary sectors | 10 thousand persons | ||
| Expected outputs | Economic gains | Secondary and tertiary sector value creation | 100 million Yuan | Xie et al. (2021) [19] Gu et al. (2023) [131] |
| Social gains | Urban resident income capacity | Yuan | ||
| Environmental gains | Urban green space ratio | square meter per person | ||
| Non-expected outputs | Negative impact on the environment | Industrial SO2 emissions Industrial wastewater discharge Industrial SO2 emissions | 10 thousand tons | Zhao et al. (2018) [128] Zhou et al. (2024) [29] Ma et al. (2024) [41] |
| Variable | Symbol | Obs | Mean | Std. Dev. | Min | Max | |
|---|---|---|---|---|---|---|---|
| Dependent variable | Urban land green utilization efficiency | ULGUE | 4336 | 0.713 | 0.110 | 0.513 | 1.028 |
| Explanatory variable | Economic growth pressure | EGP | 4336 | 0.452 | 0.151 | 0.000 | 1.000 |
| EGP2 | 4336 | 0.262 | 0.148 | 0.000 | 1.000 | ||
| Mediating variables | Land marketization | lnLM | 4336 | 6.303 | 0.985 | 3.378 | 8.301 |
| Green innovation | lnGI | 4336 | 4.148 | 1.645 | 1.386 | 7.252 | |
| Industrial structure upgrading | Ind | 4336 | 45.404 | 10.151 | 26.180 | 59.430 | |
| Moderating variables | Environmental regulation | ER | 4336 | 0.008 | 0.001 | 0.006 | 0.010 |
| Financial Technology Input | FTI | 4336 | 0.014 | 0.010 | 0.003 | 0.034 | |
| Control variables | Opening degree | lnopd | 4336 | 5.450 | 1.660 | 2.086 | 8.203 |
| Urbanization rate | UR | 4336 | 52.348 | 15.029 | 19.770 | 89.600 | |
| Economic Development level | PGDP | 4336 | 10.537 | 0.670 | 8.849 | 11.954 | |
| Population density | DEN | 4336 | 5.838 | 0.847 | 2.916 | 7.200 | |
| Government intervention intensity | GOV | 4336 | 10.708 | 0.512 | 9.521 | 11.636 | |
| Infrastructure level | INF | 4336 | 23.582 | 14.240 | 4.976 | 57.557 | |
| (1) | (2) | (3) | (4) | (5) | (6) | |
|---|---|---|---|---|---|---|
| ULGUE | ULGUE | Eastern Region | Central Region | Western Region | Northeastern Region | |
| EGP | 0.072 *** | 0.067 *** | 0.040 | 0.079 ** | 0.193 *** | 0.101 * |
| (3.720) | (3.471) | (1.158) | (2.265) | (3.246) | (1.686) | |
| EGP2 | −0.060 *** | −0.057 *** | −0.021 | −0.078 ** | −0.172 * | −0.103 ** |
| (−3.183) | (−3.032) | (−0.538) | (−2.283) | (−3.165) | (−2.044) | |
| lnopd | 0.002 ** | 0.005 ** | 0.002 | 0.004 *** | −0.002 | |
| (2.201) | (2.164) | (0.937) | (2.973) | (−0.681) | ||
| UR | −0.000 *** | −0.001 *** | −0.000 | −0.000 | −0.001 * | |
| (−3.411) | (−3.785) | (−1.225) | (−0.517) | (−1.845) | ||
| PGDP | −0.008 * | −0.017 ** | 0.001 | −0.006 | 0.031 | |
| (−1.649) | (−2.236) | (0.171) | (−0.379) | (1.618) | ||
| DEN | 0.001 | −0.028 | −0.001 | 0.002 | 0.085 | |
| (0.106) | (−1.050) | (−0.090) | (0.498) | (1.079) | ||
| GOV | −0.004 | −0.023 | −0.012 | 0.058 *** | −0.070 * | |
| (−0.483) | (−1.492) | (−1.034) | (3.138) | (−1.908) | ||
| INF | 0.000 | 0.012 ** | 0.173 | −0.000 | 0.001 | |
| (0.017) | (2.164) | (1.306) | (−0.856) | (0.335) | ||
| City FE | YES | YES | YES | YES | YES | YES |
| Year FE | YES | YES | YES | YES | YES | YES |
| N | 4336 | 4336 | 1230 | 1185 | 1185 | 480 |
| R2 | 0.915 | 0.915 | 0.924 | 0.902 | 0.911 | 0.949 |
| F | 11.433 | 3.443 | 5.882 | 1.364 | 4.107 | 2.371 |
| (1) | (2) | (3) | (4) | (5) | (6) | (7) | |
|---|---|---|---|---|---|---|---|
| ULGUE | lnLM | ULGUE | lnGI | ULGUE | Ind | ULGUE | |
| EGP | 0.054 *** | 0.885 ** | 0.053 *** | 0.785 *** | 0.052 *** | 5.356 ** | 0.053 *** |
| (3.268) | (2.480) | (3.193) | (2.654) | (3.151) | (2.199) | (3.182) | |
| EGP2 | −0.050 *** | −0.706 ** | −0.049 *** | −1.003 *** | −0.047 *** | −5.140 ** | −0.049 *** |
| (−3.079) | (−2.176) | (−2.997) | (−3.373) | (−2.926) | (−2.186) | (−2.995) | |
| lnopd | 0.002 *** | 0.020 | 0.002 *** | 0.010 | 0.002 *** | 0.045 | 0.002 *** |
| (3.411) | (1.609) | (3.357) | (0.967) | (3.382) | (0.301) | (3.408) | |
| UR | −0.000 *** | 0.005 | −0.000 *** | 0.005 *** | −0.000 *** | −0.004 | −0.000 *** |
| (−4.036) | (1.448) | (−4.009) | (2.733) | (−4.170) | (−0.229) | (−4.017) | |
| PGDP | −0.008 ** | 0.350 *** | −0.009 ** | 0.531 *** | −0.010 ** | 13.005 *** | −0.012 *** |
| (−2.179) | (5.098) | (−2.400) | (9.772) | (−2.501) | (15.764) | (−3.067) | |
| DEN | −0.008 * | 0.001 | −0.008 * | 0.029 | −0.008 * | 0.577 | −0.008 * |
| (−1.742) | (0.009) | (−1.705) | (0.401) | (−1.768) | (0.969) | (−1.778) | |
| GOV | 0.000 | 0.841 *** | −0.002 | 0.208 * | −0.001 | 6.476 *** | −0.002 |
| (0.002) | (4.924) | (−0.274) | (1.896) | (−0.080) | (6.249) | (−0.259) | |
| INF | 0.000 | 0.001 *** | 0.000 | −0.000 | 0.000 | 0.008 *** | 0.000 |
| (1.227) | (2.986) | (1.021) | (−0.255) | (1.224) | (3.731) | (1.147) | |
| lnLM | 0.071 ** | ||||||
| (2.116) | |||||||
| lnGI | 0.005 ** | ||||||
| (2.017) | |||||||
| Ind | 0.002 ** | ||||||
| (2.357) | |||||||
| _cons | 0.831 *** | −6.907 *** | 0.846 *** | −4.164 *** | 0.842 *** | −16.837 ** | 0.876 *** |
| (10.510) | (−3.485) | (10.633) | (−3.276) | (10.602) | (−14.271) | (10.924) | |
| R2 | 0.945 | 0.796 | 0.945 | 0.964 | 0.945 | 0.947 | 0.945 |
| F | 6.125 | 10.411 | 5.829 | 17.501 | 5.902 | 63.264 | 6.179 |
| Inflection point | 0.5844 | 0.5738 | 0.5931 | 0.5867 |
| lnLM | lnGI | Ind | |
|---|---|---|---|
| Cl Lower | 0.003 | 0.001 | −0.007 |
| Cl Upper | 0.094 | 0.040 | 0.046 |
| Point Estimate | 0.052 | 0.012 | 0.001 |
| (1) | (2) | (3) | (4) | (5) | |
|---|---|---|---|---|---|
| ER | Eastern Region | Central Region | Western Region | Northeastern Region | |
| EGP | 0.100 *** | 0.109 *** | 0.119 *** | 0.300 *** | 0.027 |
| (4.803) | (2.778) | (2.892) | (4.308) | (0.479) | |
| EGP2 | −0.090 *** | −0.100 ** | −0.121 *** | −0.274 *** | −0.022 |
| (−4.475) | (−2.397) | (−3.062) | (−4.295) | (−0.456) | |
| ER | −3.353 ** | −7.854 ** | −6.056 * | −9.268 *** | −5.210 |
| (−2.386) | (−2.075) | (−1.842) | (−2.637) | (−0.998) | |
| ER×EGP | 22.235 *** | 45.549 ** | 27.406 * | 46.281 *** | 16.156 |
| (3.119) | (2.554) | (1.952) | (3.068) | (0.796) | |
| ER×EGP2 | −20.838 *** | −41.530 ** | −26.148 * | −42.892 *** | −13.737 |
| (−3.011) | (−2.217) | (−1.929) | (−2.928) | (−0.705) | |
| Fixed effects | YES | YES | YES | YES | YES |
| Control variables | YES | YES | YES | YES | YES |
| _cons | 0.841 *** | 1.417 *** | 0.833 *** | 0.106 | 0.498 |
| (7.691) | (5.954) | (5.582) | (0.367) | (0.794) | |
| R2 | 0.915 | 0.924 | 0.901 | 0.910 | 0.960 |
| F | 4.374 | 5.408 | 1.439 | 3.738 | 3.627 |
| (1) | (2) | (3) | (4) | (5) | |
|---|---|---|---|---|---|
| FTI | Eastern Region | Central Region | Western Region | Northeastern Region | |
| EGP | 0.075 *** | 0.143 *** | 0.084 ** | 0.323 *** | 0.383 *** |
| (3.676) | (3.310) | (2.256) | (3.901) | (3.380) | |
| EGP2 | −0.064 *** | −0.146 *** | −0.082 ** | −0.305 *** | −0.322 *** |
| (−3.236) | (−3.082) | (−2.280) | (−4.016) | (−3.307) | |
| FTI | 0.360 | 0.696 | 0.311 | 5.587 *** | 7.816 *** |
| (1.282) | (1.480) | (0.496) | (3.836) | (3.082) | |
| FTI×EGP | −3.611 *** | −5.930 *** | −5.460 ** | −18.495 *** | −29.972 *** |
| (−2.658) | (−2.698) | (−2.034) | (−2.997) | (−2.992) | |
| FTI×EGP2 | 4.129 *** | 7.891 *** | 7.896 *** | 18.663 *** | 25.677 *** |
| (2.866) | (3.147) | (2.583) | (2.818) | (2.685) | |
| Fixed effects | YES | YES | YES | YES | YES |
| Control variables | YES | YES | YES | YES | YES |
| _cons | 0.822 *** | 1.411 *** | 0.791 *** | 0.010 | −0.424 |
| (7.498) | (6.043) | (5.541) | (0.036) | (−0.778) | |
| R2 | 0.915 | 0.921 | 0.904 | 0.919 | 0.961 |
| F | 4.384 | 4.049 | 3.631 | 6.275 | 4.095 |
| (1) | (2) | (3) | (4) | (5) | (6) | |
|---|---|---|---|---|---|---|
| EGP | EGP2 | ULGUE | EGP | EGP2 | ULGUE | |
| First Stage | Second Stage | First Stage | Second Stage | |||
| EGP | 0.727 *** | 0.202 *** | ||||
| (0.157) | (0.066) | |||||
| EGP2 | −0.746 *** | −0.208 *** | ||||
| (0.158) | (0.064) | |||||
| Target i | 1.252 *** | 1.190 *** | ||||
| (0.146) | (0.139) | |||||
| Target i2 | 3.721 *** | 1.922 * | ||||
| (1.087) | (1.074) | |||||
| Targe ii | 4.167 *** | 4.608 *** | ||||
| (0.263) | (0.269) | |||||
| Target ii2 | 40.639 *** | 14.749 ** | ||||
| (6.749) | (6.762) | |||||
| City FE | YES | YES | YES | YES | YES | YES |
| Year FE | YES | YES | YES | YES | YES | YES |
| Anderson canon. corr. LM statistic | 48.958 *** | 137.921 *** | ||||
| Cragg-Donald Wald F statistic | 25.083 | 79.515 | ||||
| R2 | 0.564 | 0.661 | ||||
| F | 45.81 | 40.97 | 170.49 | 162.41 | 142.93 | 230.64 |
| (1) | (2) | (3) | (4) | (5) | |
|---|---|---|---|---|---|
| Shorten Research Period | Remove Municipalities | Shrink Variables | New Explained Variable | SGMM Model | |
| L.eff3 | 0.947 *** | ||||
| (16.778) | |||||
| EGP | 0.089 *** | 0.069 *** | 0.067 *** | 0.010 ** | 0.048 ** |
| (3.178) | (2.823) | (2.787) | (2.394) | (2.059) | |
| EGP2 | −0.084 *** | −0.059 *** | −0.057 ** | −0.003 ** | −0.045 ** |
| (−3.259) | (−2.629) | (−2.582) | (−2.271) | (−2.063) | |
| lnopd | 0.002 ** | 0.002 | 0.002 * | 0.002 * | −0.001 |
| (1.976) | (1.614) | (1.734) | (1.789) | (−1.101) | |
| UR | −0.000 | −0.000 ** | −0.000 *** | −0.000 ** | −0.000 |
| (−1.518) | (−2.457) | (−2.630) | (−2.573) | (−0.832) | |
| PGDP | −0.006 | −0.008 | −0.008 | −0.008 | 0.003 * |
| (−0.659) | (−1.150) | (−1.115) | (−1.108) | (1.895) | |
| DEN | −0.032 ** | 0.000 | 0.001 | 0.001 | 0.000 |
| (−2.116) | (0.035) | (0.071) | (0.072) | (0.045) | |
| GOV | −0.002 | −0.004 | −0.004 | −0.004 | −0.001 |
| (−0.110) | (−0.324) | (−0.327) | (−0.342) | (−0.093) | |
| INF | 0.000 | 0.000 | 0.000 | −0.000 | −0.000 * |
| (0.541) | (0.061) | (0.019) | (−0.039) | (−1.782) | |
| _cons | 0.897 *** | 0.723 *** | 0.718 *** | 0.733 *** | 0.007 |
| (4.869) | (5.195) | (5.199) | (5.368) | (0.062) | |
| AR(1) | 0.000 | ||||
| AR(2) | 0.191 | ||||
| Hansen test | 0.641 | ||||
| R2 | 0.578 | 0.666 | 0.667 | 0.667 | |
| F | 100.945 | 133.398 | 137.030 | 133.483 | 1.66 × 10⁵ |
| (1) | (2) | (3) | (4) | |
|---|---|---|---|---|
| Non-Resource-Based Cities | Resource-Based Cities | Softly Constrained Targets | Strongly Constrained Targets | |
| EGP | 0.048 ** | 0.074 ** | 0.083 | 0.081 *** |
| (2.166) | (2.251) | (1.510) | (3.712) | |
| EGP2 | −0.040 * | −0.065 ** | −0.078 | −0.067 *** |
| (−1.807) | (−2.124) | (−1.565) | (−3.122) | |
| Control variables | YES | YES | YES | YES |
| City FE | YES | YES | YES | YES |
| Year FE | ||||
| _cons | 0.837 *** | 0.925 *** | 0.767 *** | 0.624 *** |
| (6.657) | (4.482) | (6.168) | (2.919) | |
| Inverted U-curve extreme point | 0.596 | 0.567 | 0.601 | |
| Slope of left and right end points of the curve | 0.048 −0.032 | 0.073 −0.056 | 0.081 −0.054 | |
| R2 | 0.933 | 0.898 | 0.919 | 0.947 |
| F | 4.920 | 1.284 | 3.556 | 3.852 |
Disclaimer/Publisher’s Note: The statements, opinions and data contained in all publications are solely those of the individual author(s) and contributor(s) and not of MDPI and/or the editor(s). MDPI and/or the editor(s) disclaim responsibility for any injury to people or property resulting from any ideas, methods, instructions or products referred to in the content. |
© 2025 by the authors. Licensee MDPI, Basel, Switzerland. This article is an open access article distributed under the terms and conditions of the Creative Commons Attribution (CC BY) license (https://creativecommons.org/licenses/by/4.0/).
Share and Cite
Wang, X.; Yan, K.; Shi, Y.; Hu, H.; Mao, S. The Nonlinear Impact of Economic Growth Pressure on Urban Land Green Utilization Efficiency—Empirical Research from China. Land 2025, 14, 739. https://doi.org/10.3390/land14040739
Wang X, Yan K, Shi Y, Hu H, Mao S. The Nonlinear Impact of Economic Growth Pressure on Urban Land Green Utilization Efficiency—Empirical Research from China. Land. 2025; 14(4):739. https://doi.org/10.3390/land14040739
Chicago/Turabian StyleWang, Xinyue, Kegao Yan, Yang Shi, Han Hu, and Shanjun Mao. 2025. "The Nonlinear Impact of Economic Growth Pressure on Urban Land Green Utilization Efficiency—Empirical Research from China" Land 14, no. 4: 739. https://doi.org/10.3390/land14040739
APA StyleWang, X., Yan, K., Shi, Y., Hu, H., & Mao, S. (2025). The Nonlinear Impact of Economic Growth Pressure on Urban Land Green Utilization Efficiency—Empirical Research from China. Land, 14(4), 739. https://doi.org/10.3390/land14040739