
Fiber Hemp Biomass Yield and Quality on Shallow Stony Soil in Southwest Germany


Abstract
1. Introduction
- Ensure food and nutrition security;
- Manage natural resources sustainably;
- Reduce dependence on non-renewable, unsustainable resources;
- Limit and adapt to climate change;
- Strengthen European competitiveness and create jobs [4].
2. Material and Methods
2.1. Experimental Site and Field Trial Design
2.2. Climatic Conditions
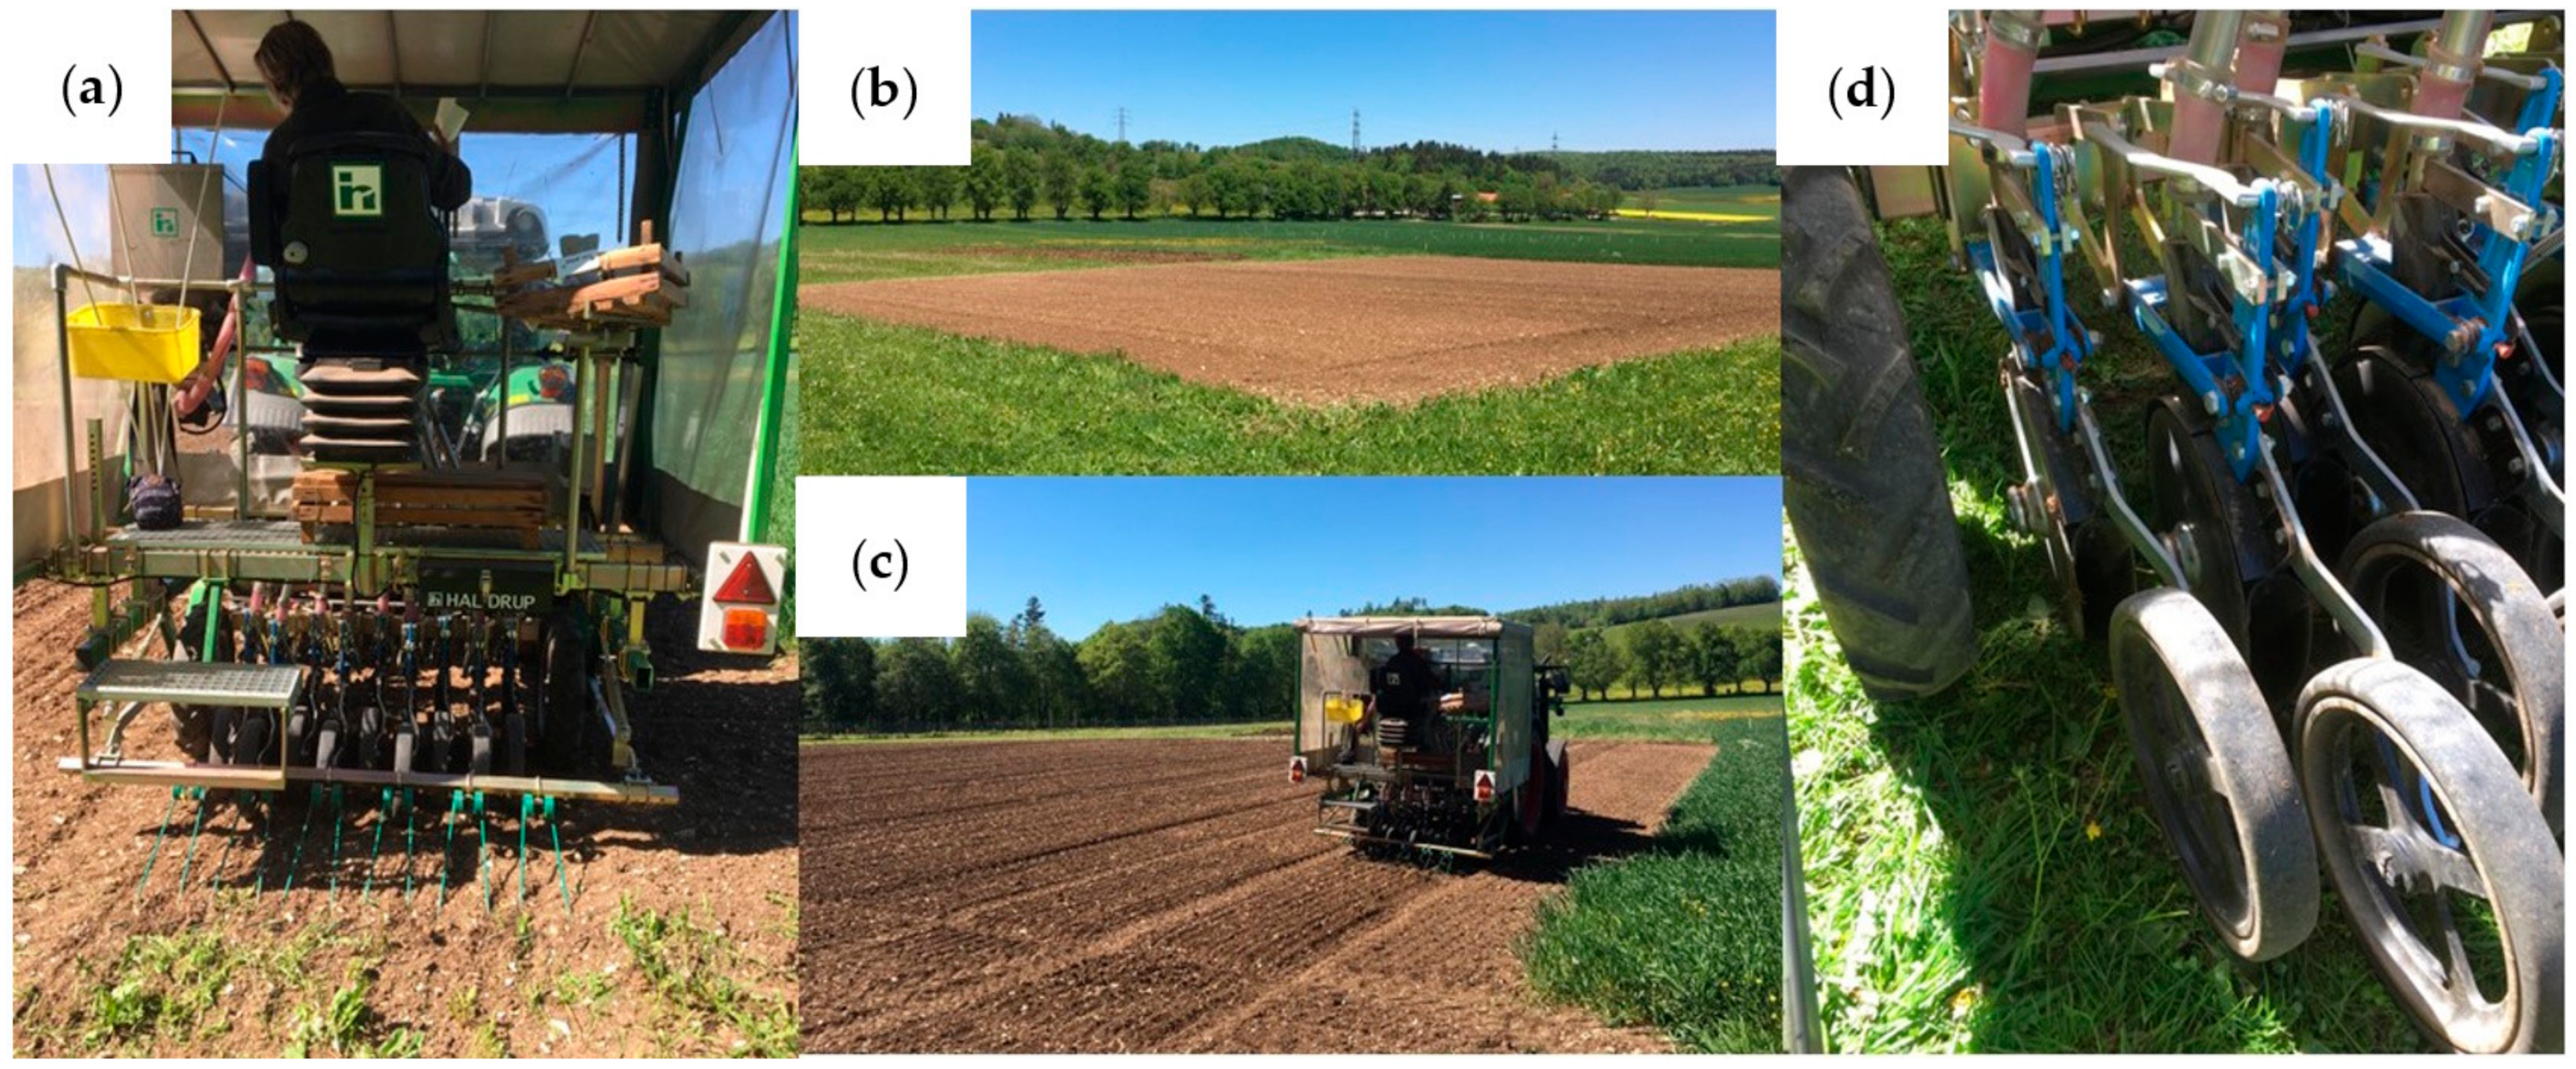
2.3. Sowing
2.4. Fertilization Strategy
2.5. Row Distance
2.6. Qualitative and Phenological Analysis Approach
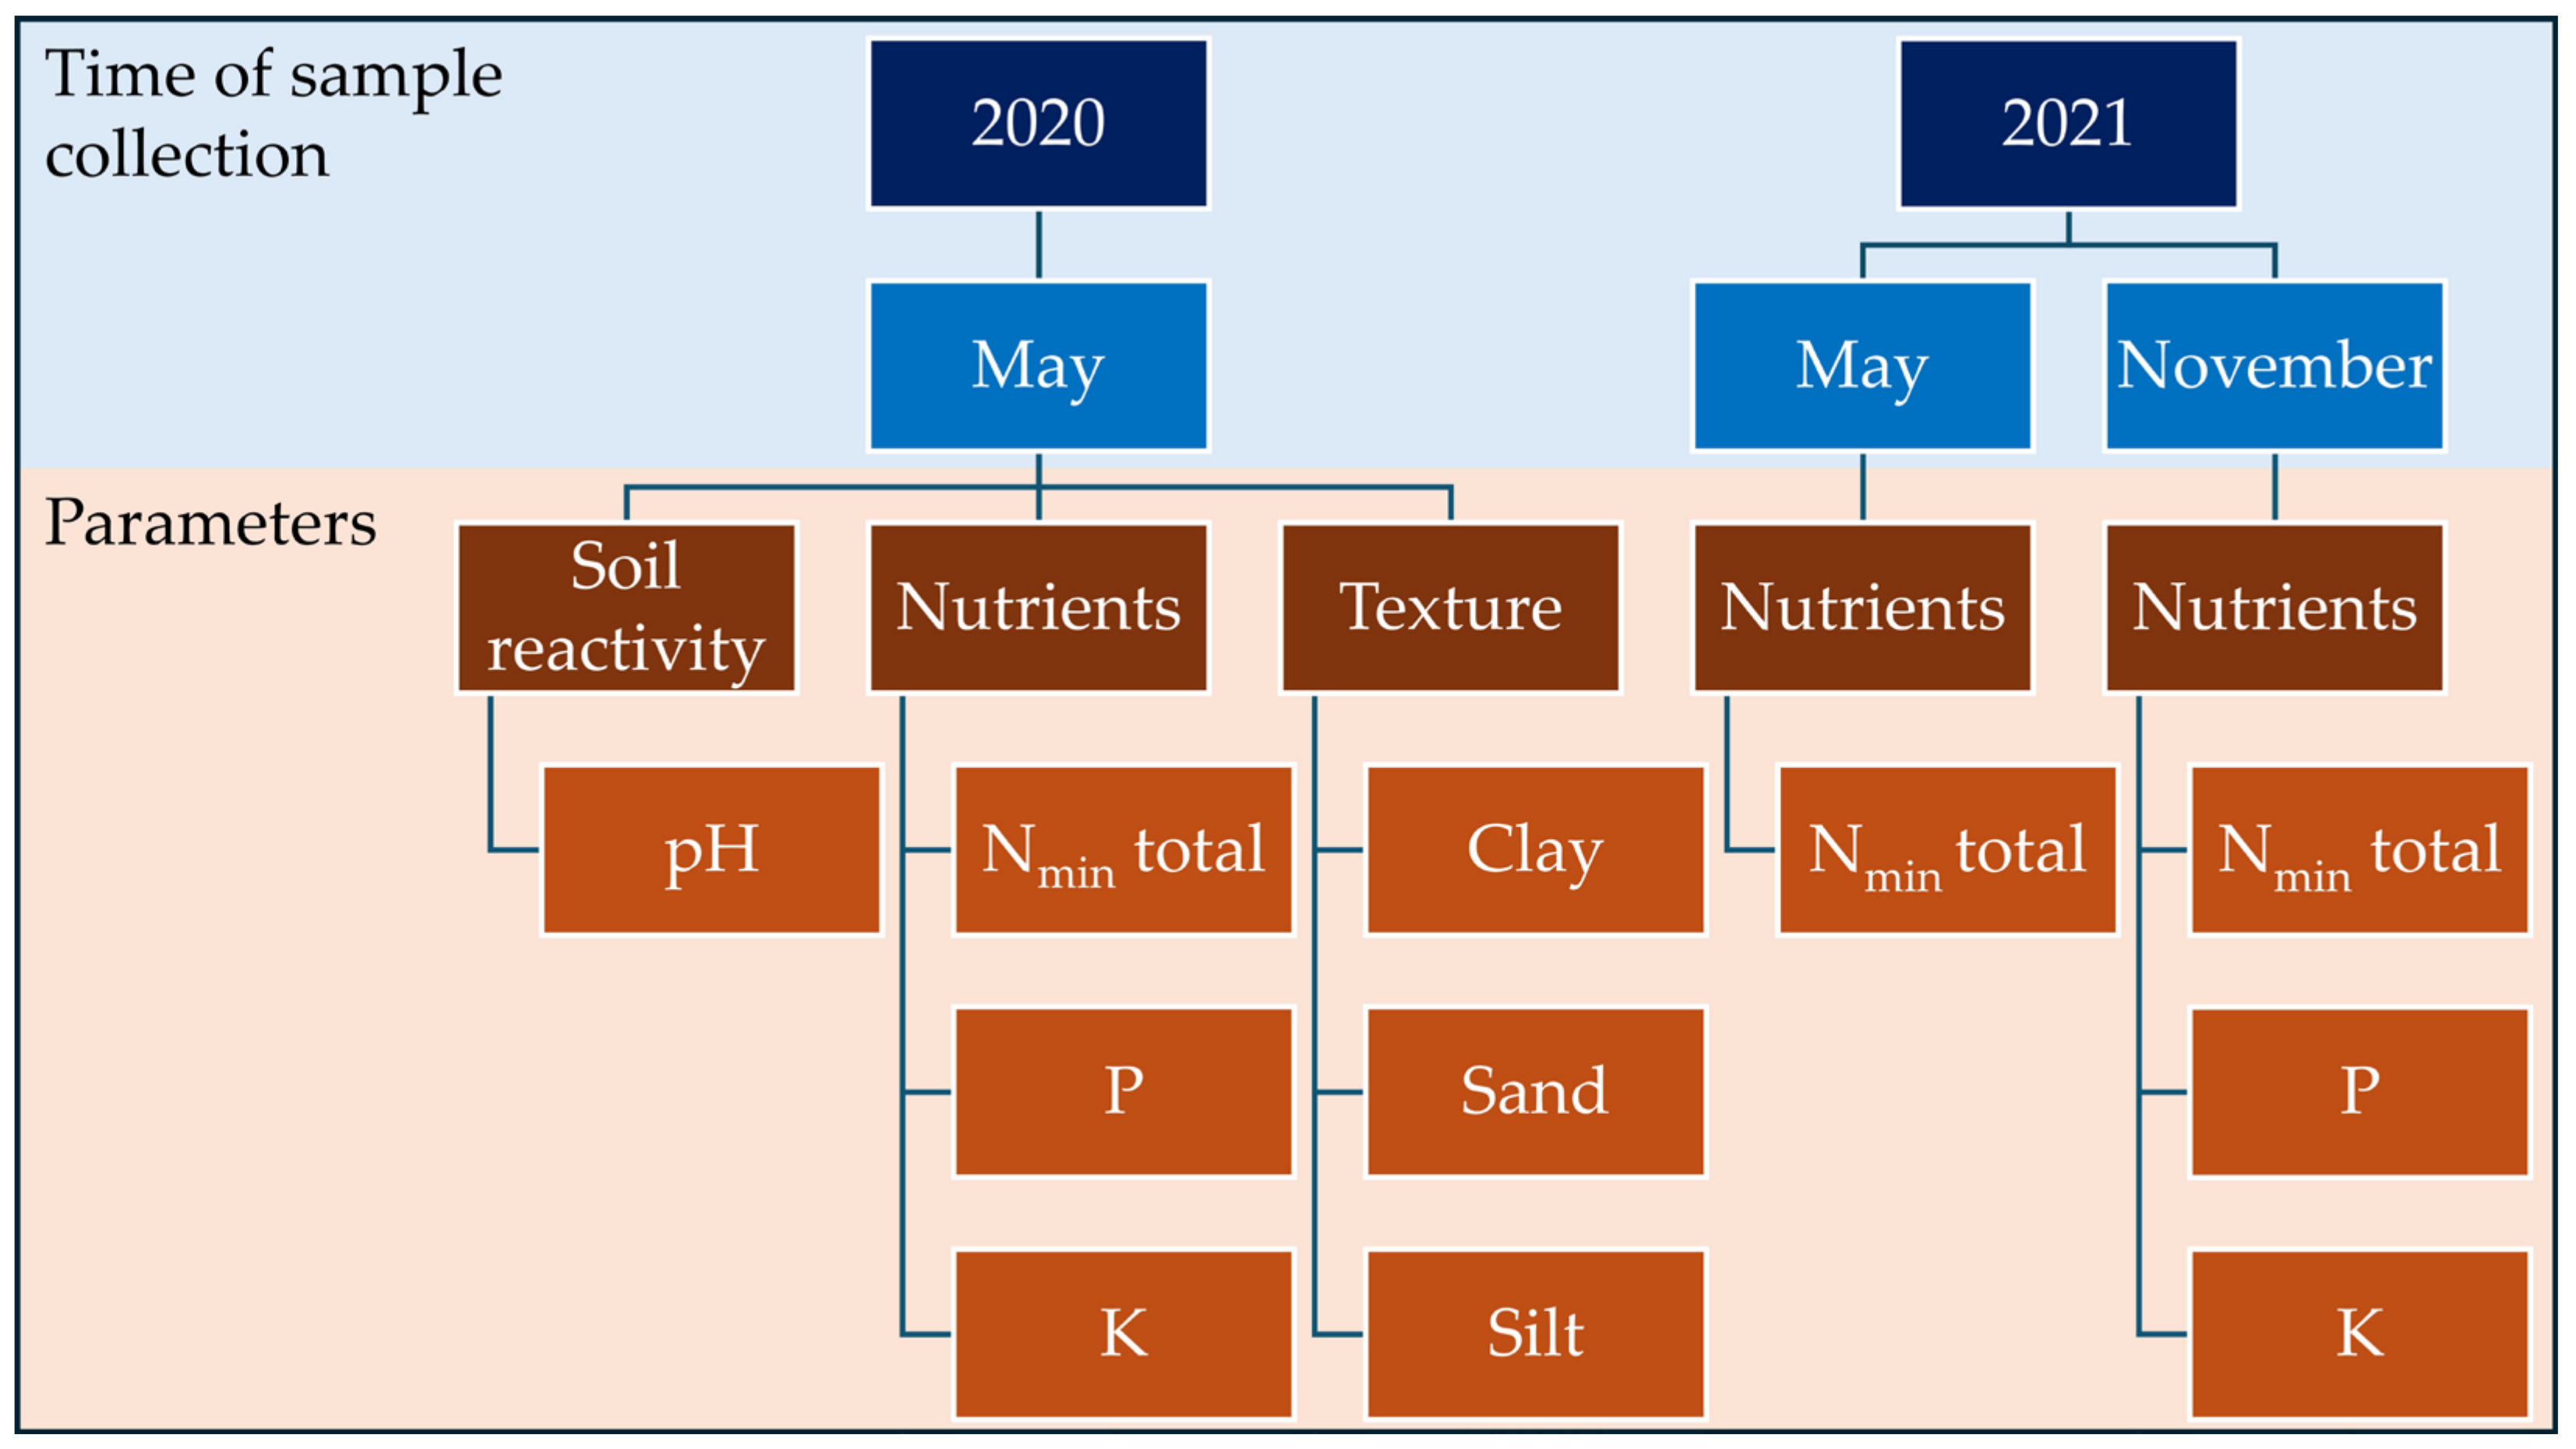
2.6.1. Soil Sample Collection and Soil Depth Determination
2.6.2. Fatty Acid Content and Pattern
- Dissolution of present oil sample in diisopropyl esther;
- 0.2 M trimethylsulfonoumhydroxide in methanol is added, which induces the methylation of the oil sample;
- The created solution is then used to perform the capillary gas chromatography.
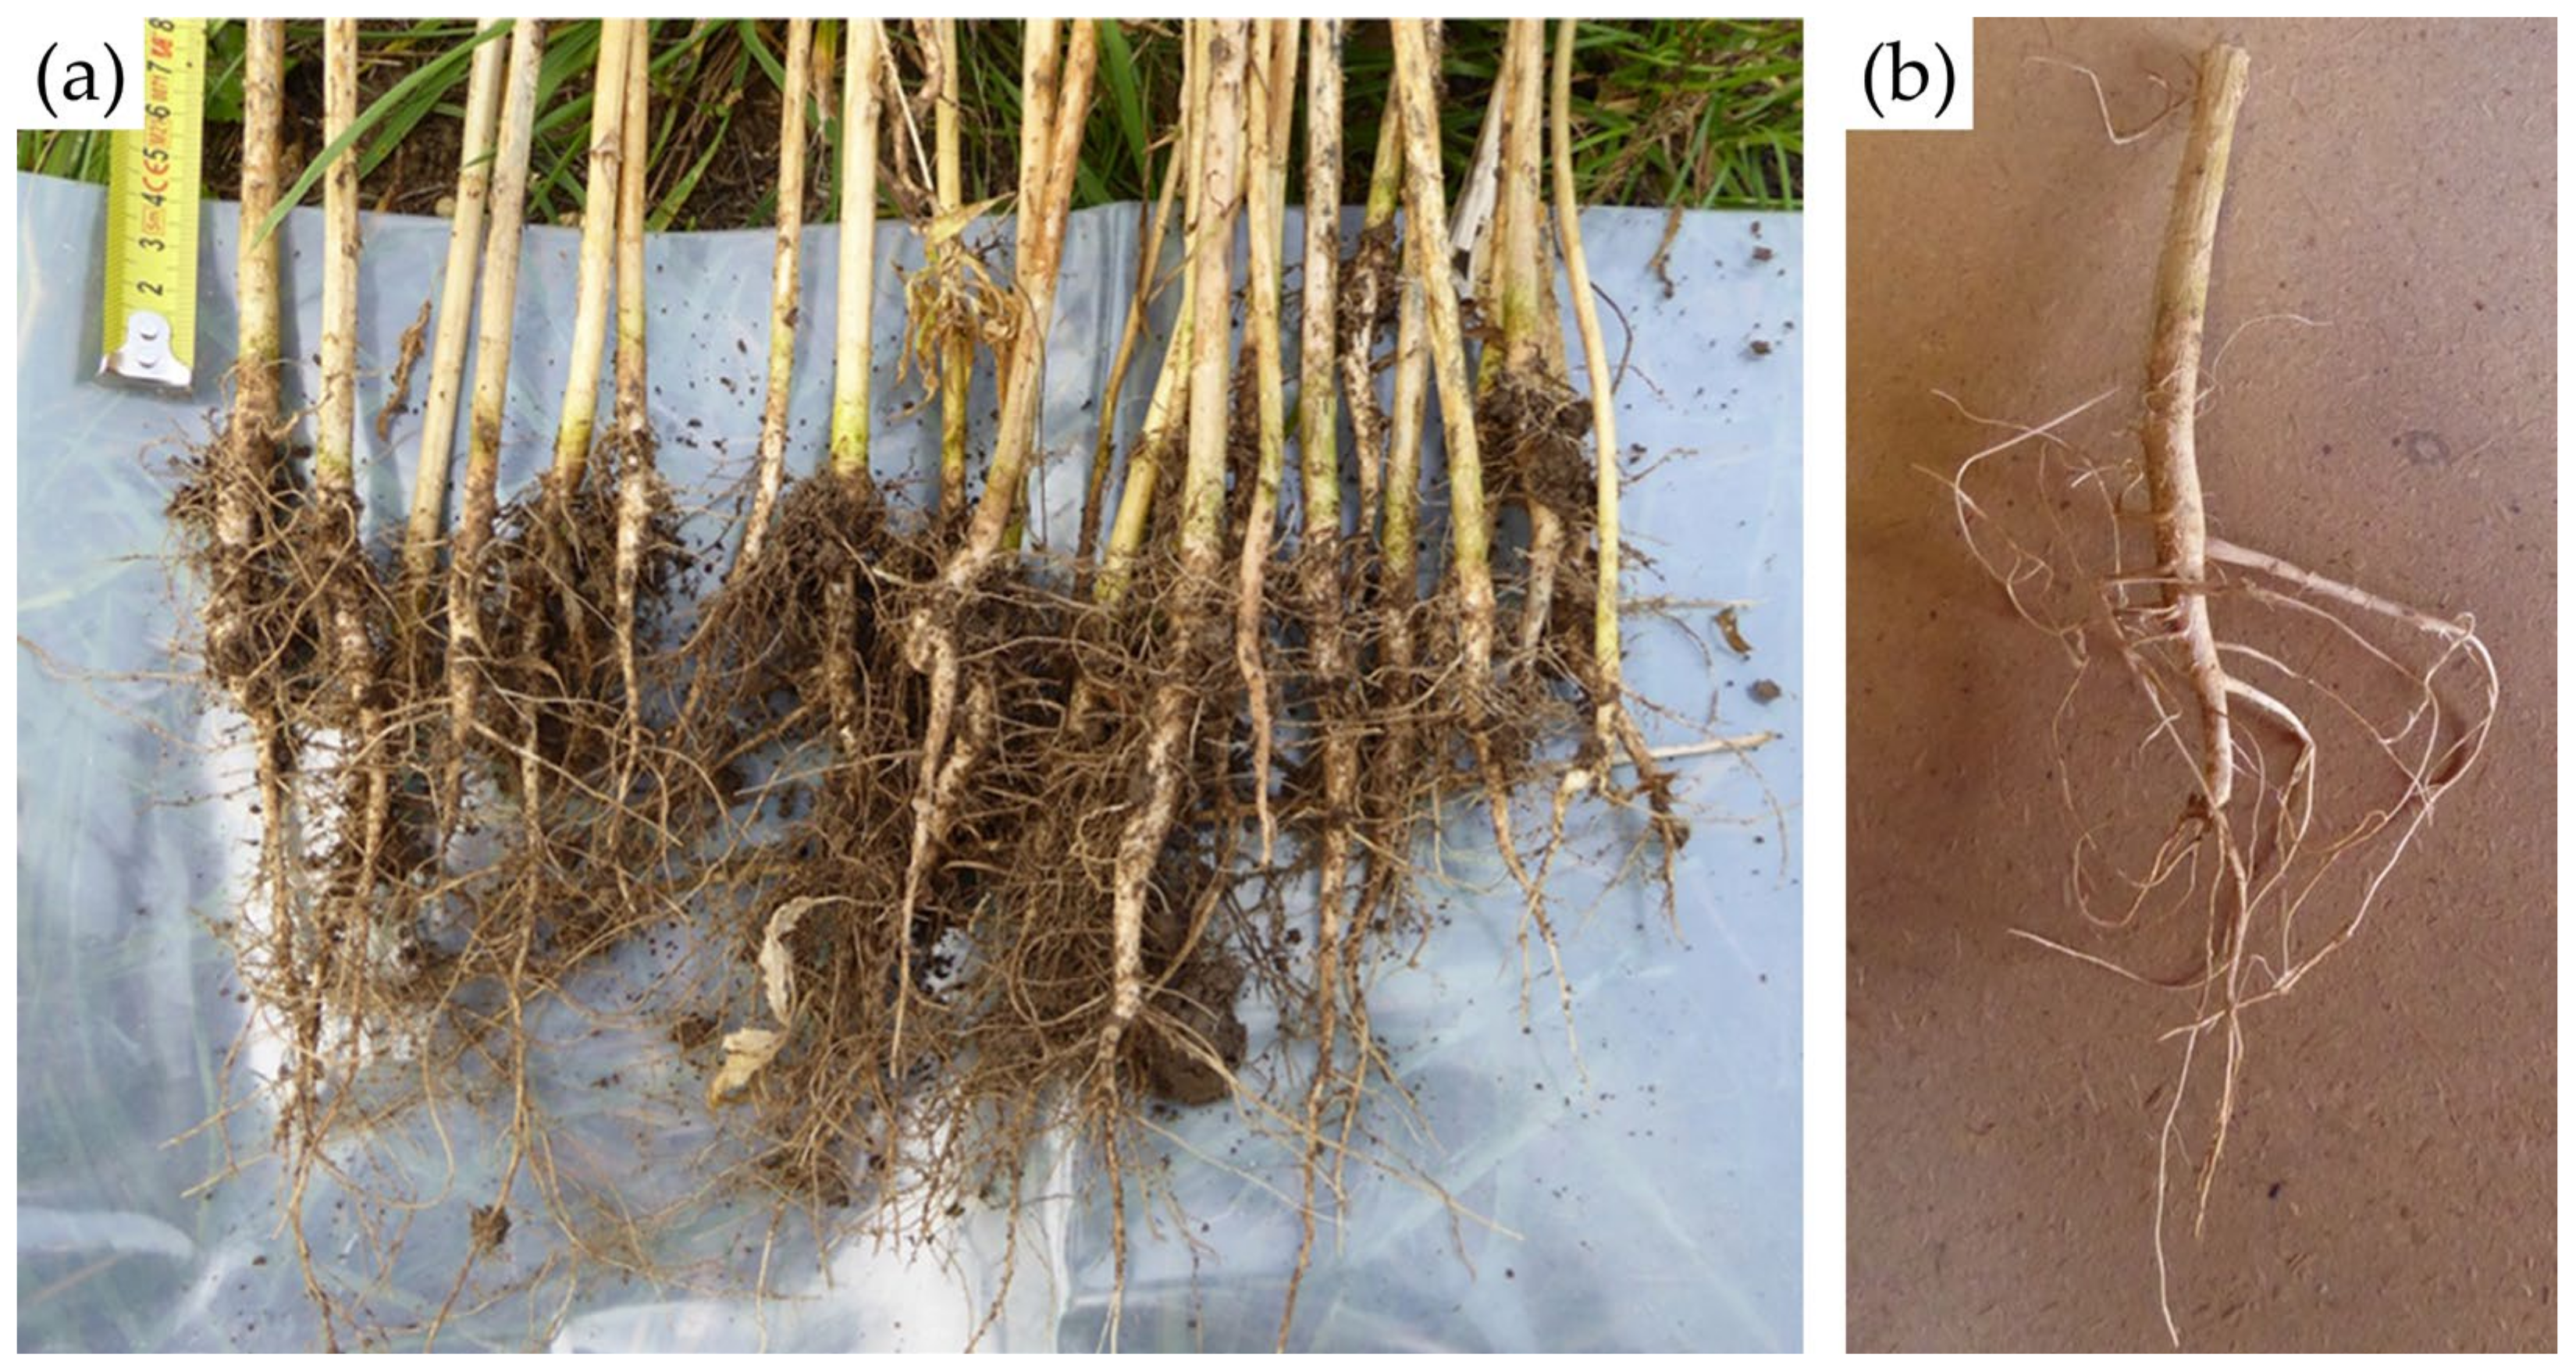
2.6.3. Root Morphology
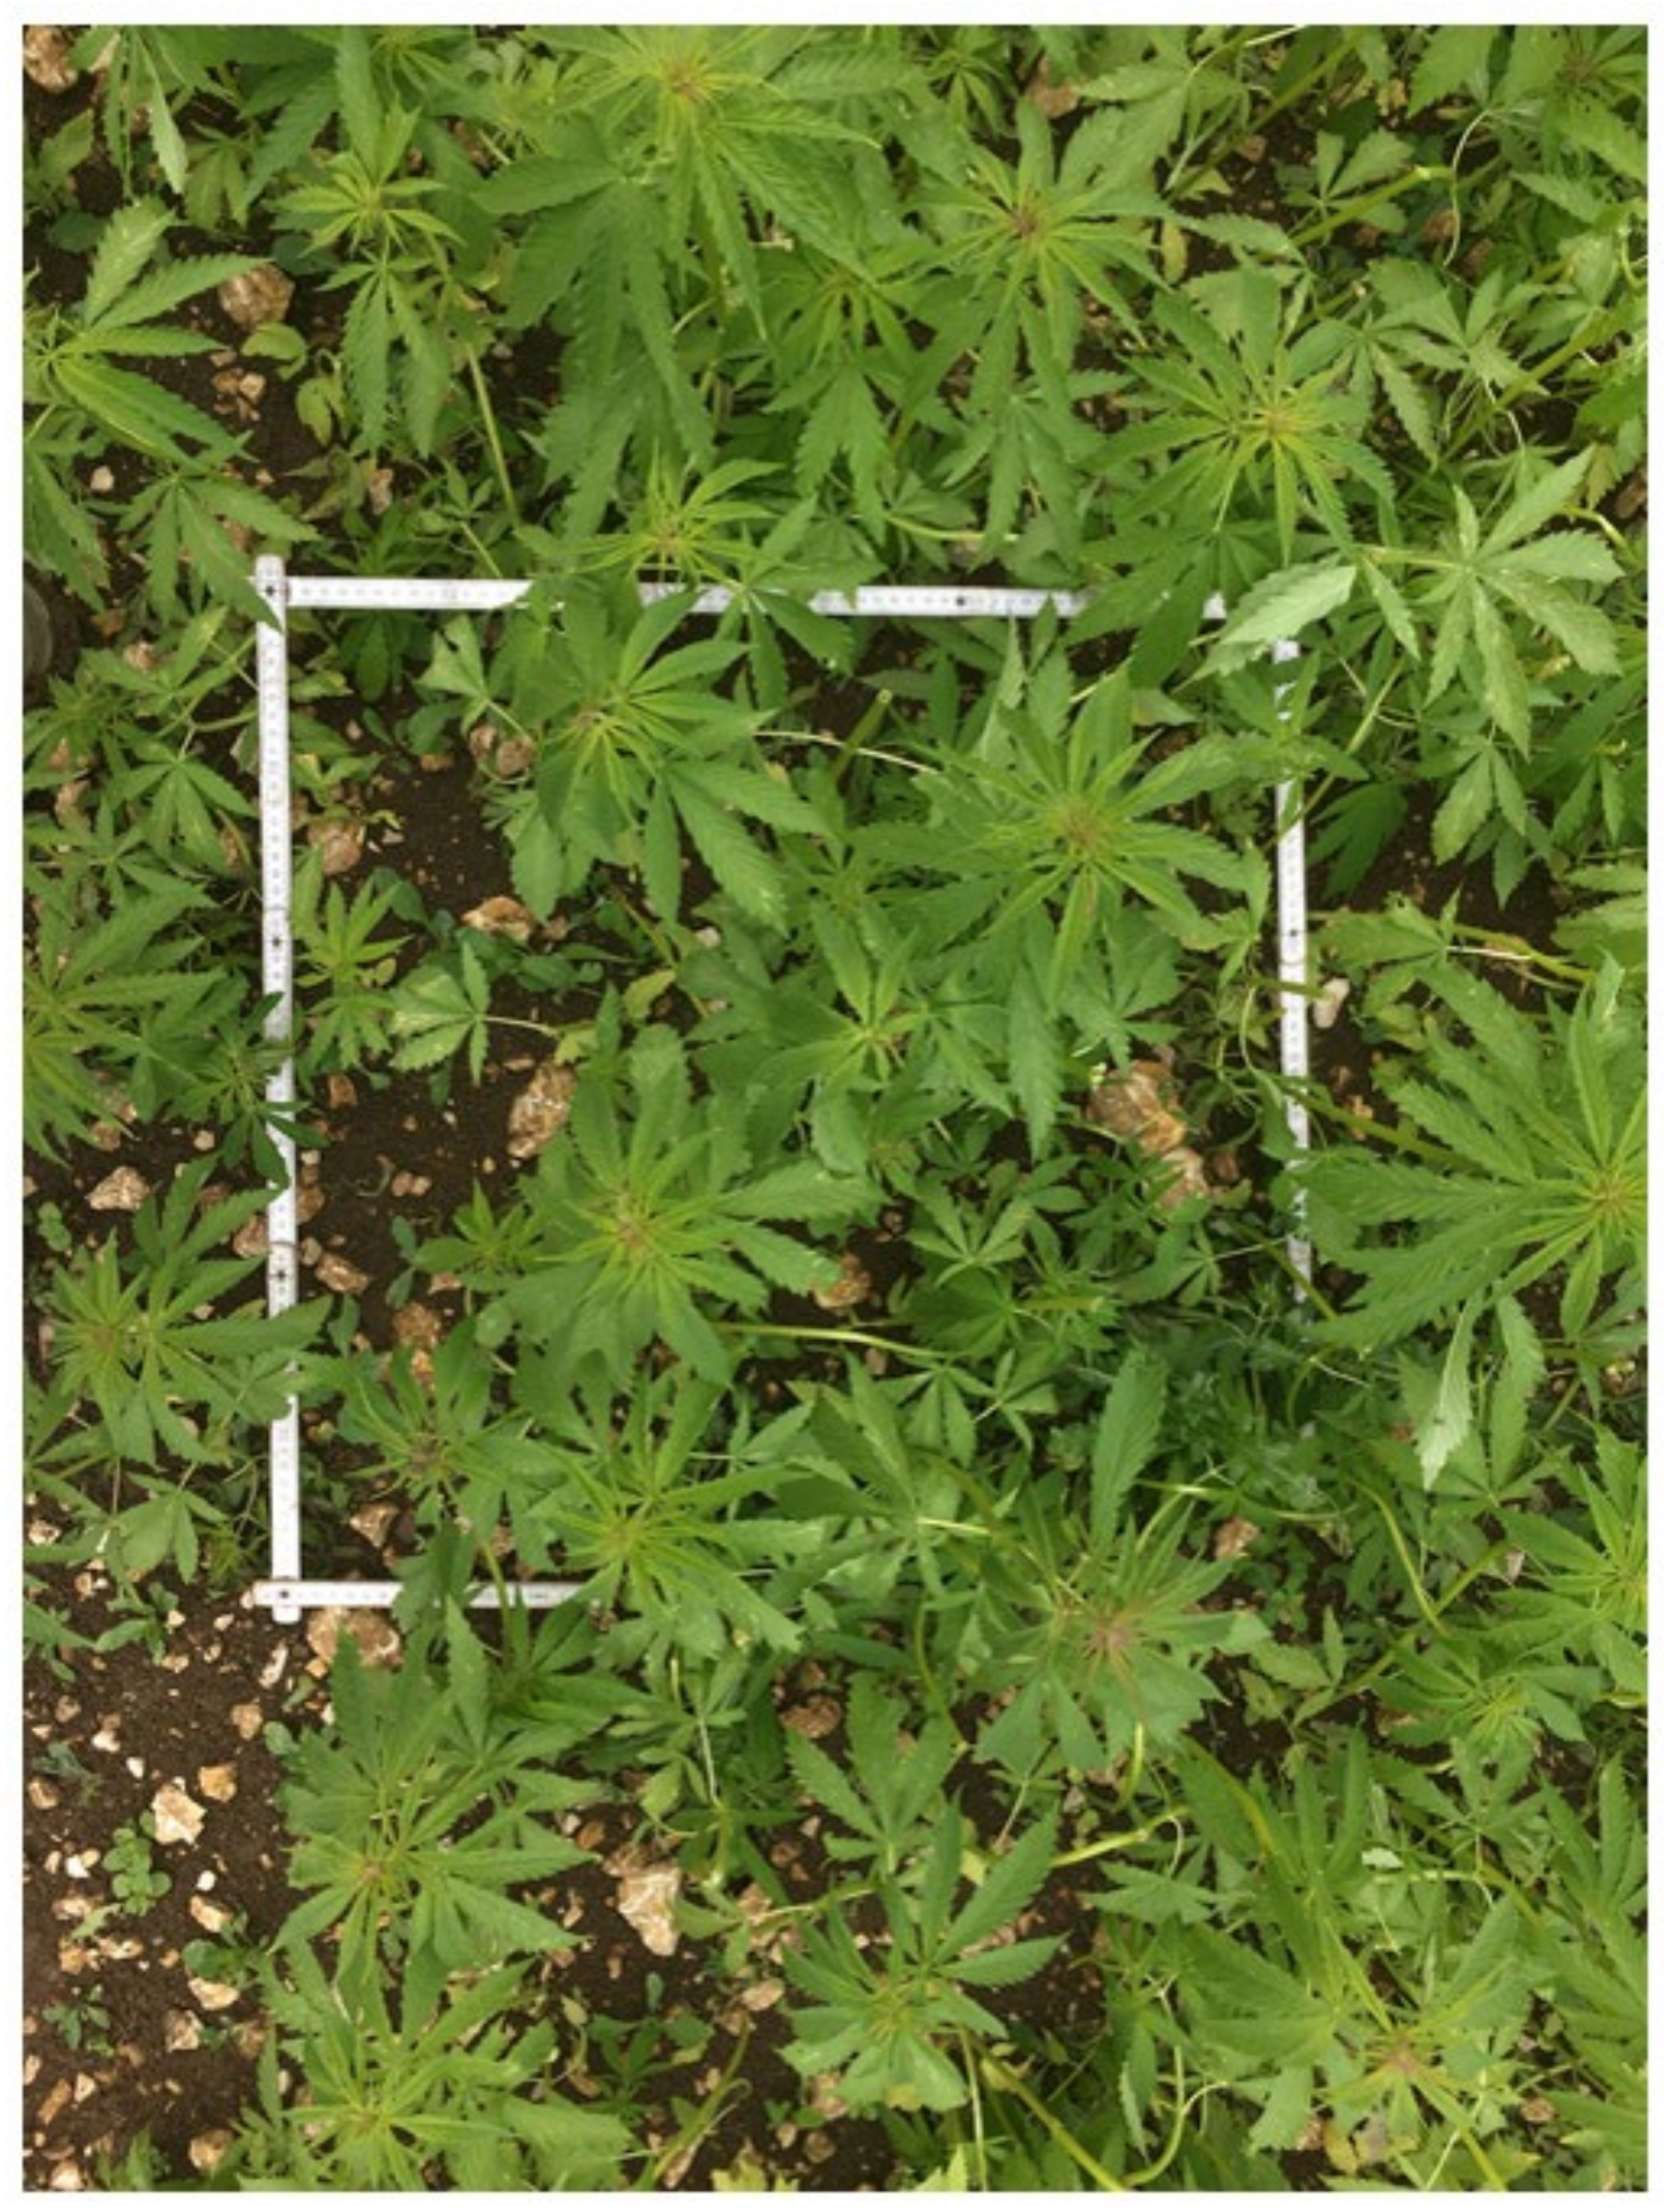
2.6.4. Stand Density
2.6.5. Self-Thinning Calculation
2.6.6. Growth Stages Determination
2.6.7. Height Measurements
2.7. Quantitative Analysis of the Results
2.7.1. Harvest
2.7.2. Deviations
2.7.3. Post-Harvest Procedures
2.8. Statistical Analysis
3. Results
3.1. Soil Characteristics
3.2. Qualitative and Phenological Analysis
3.2.1. Stem Width Observations
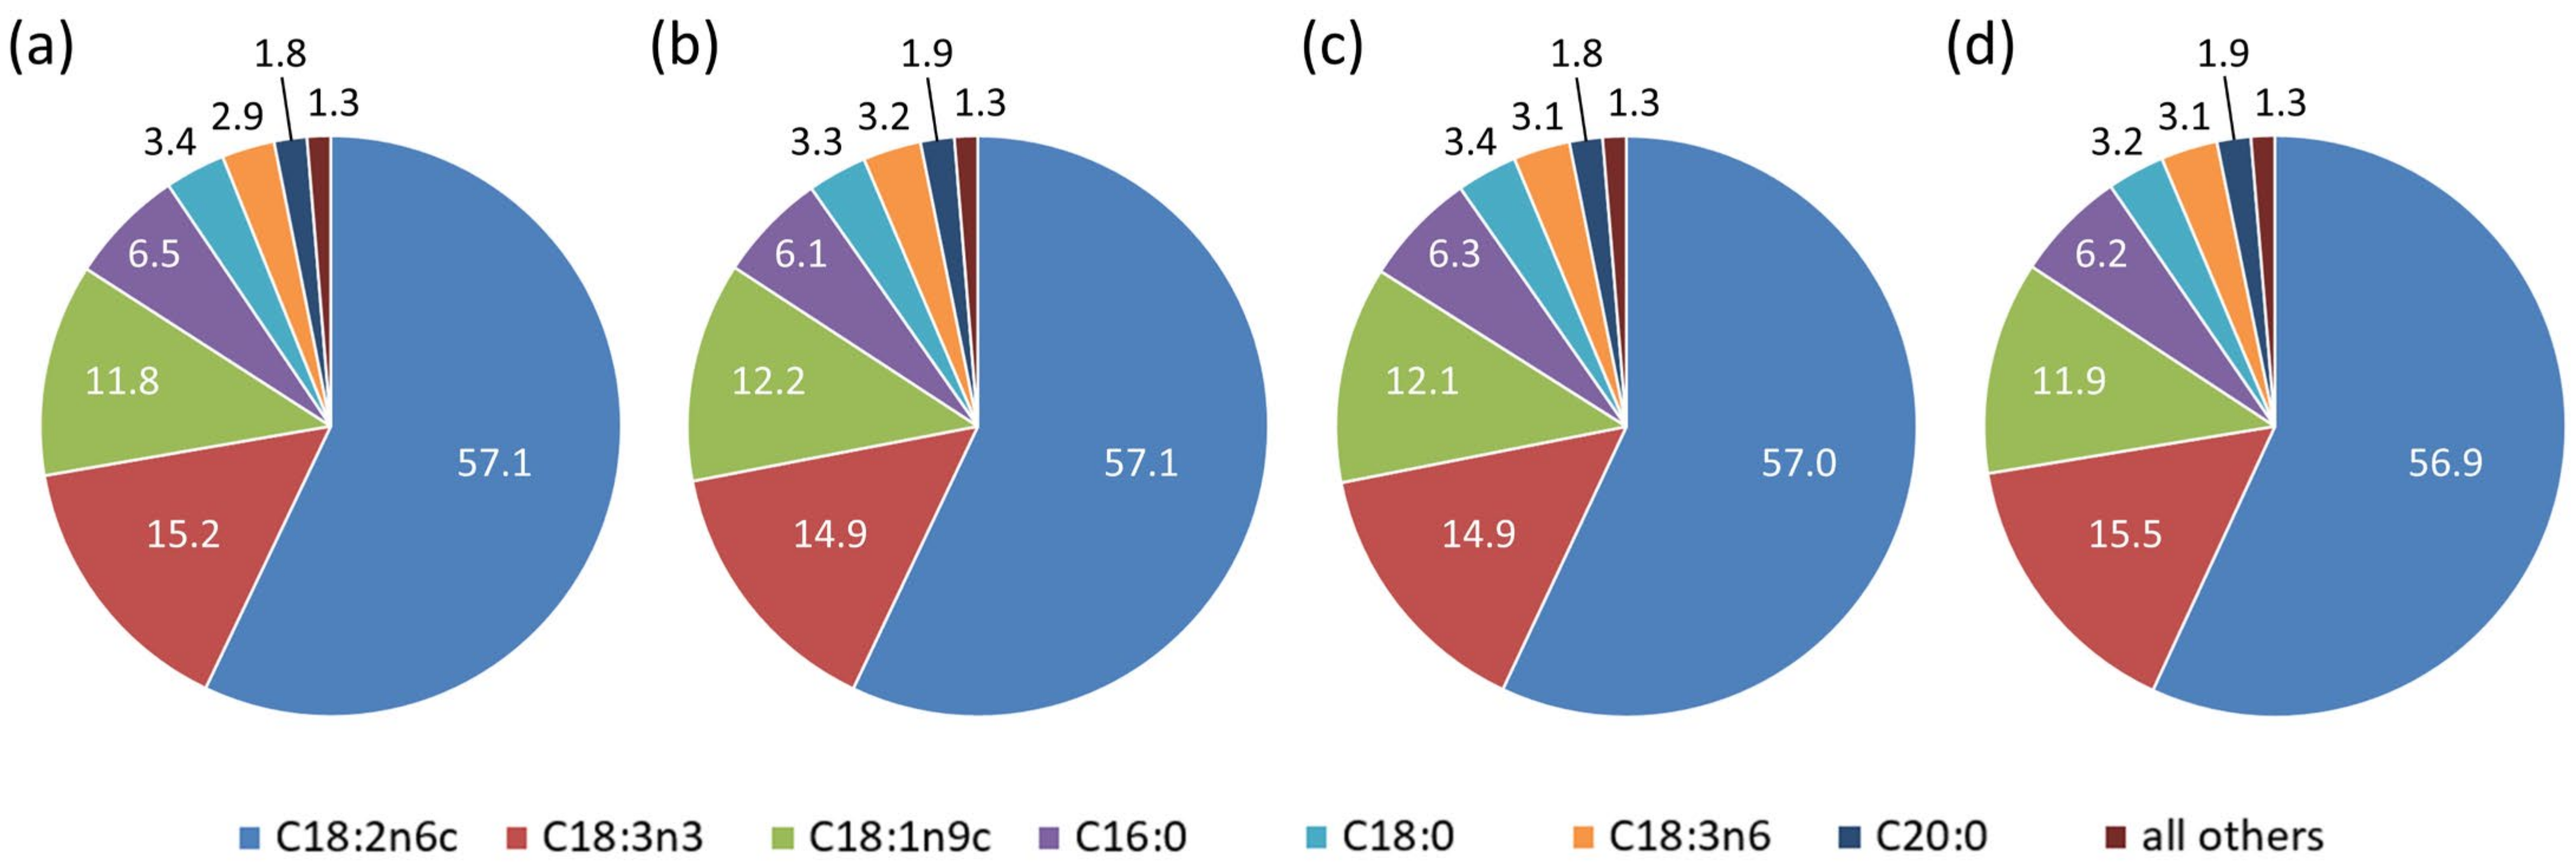
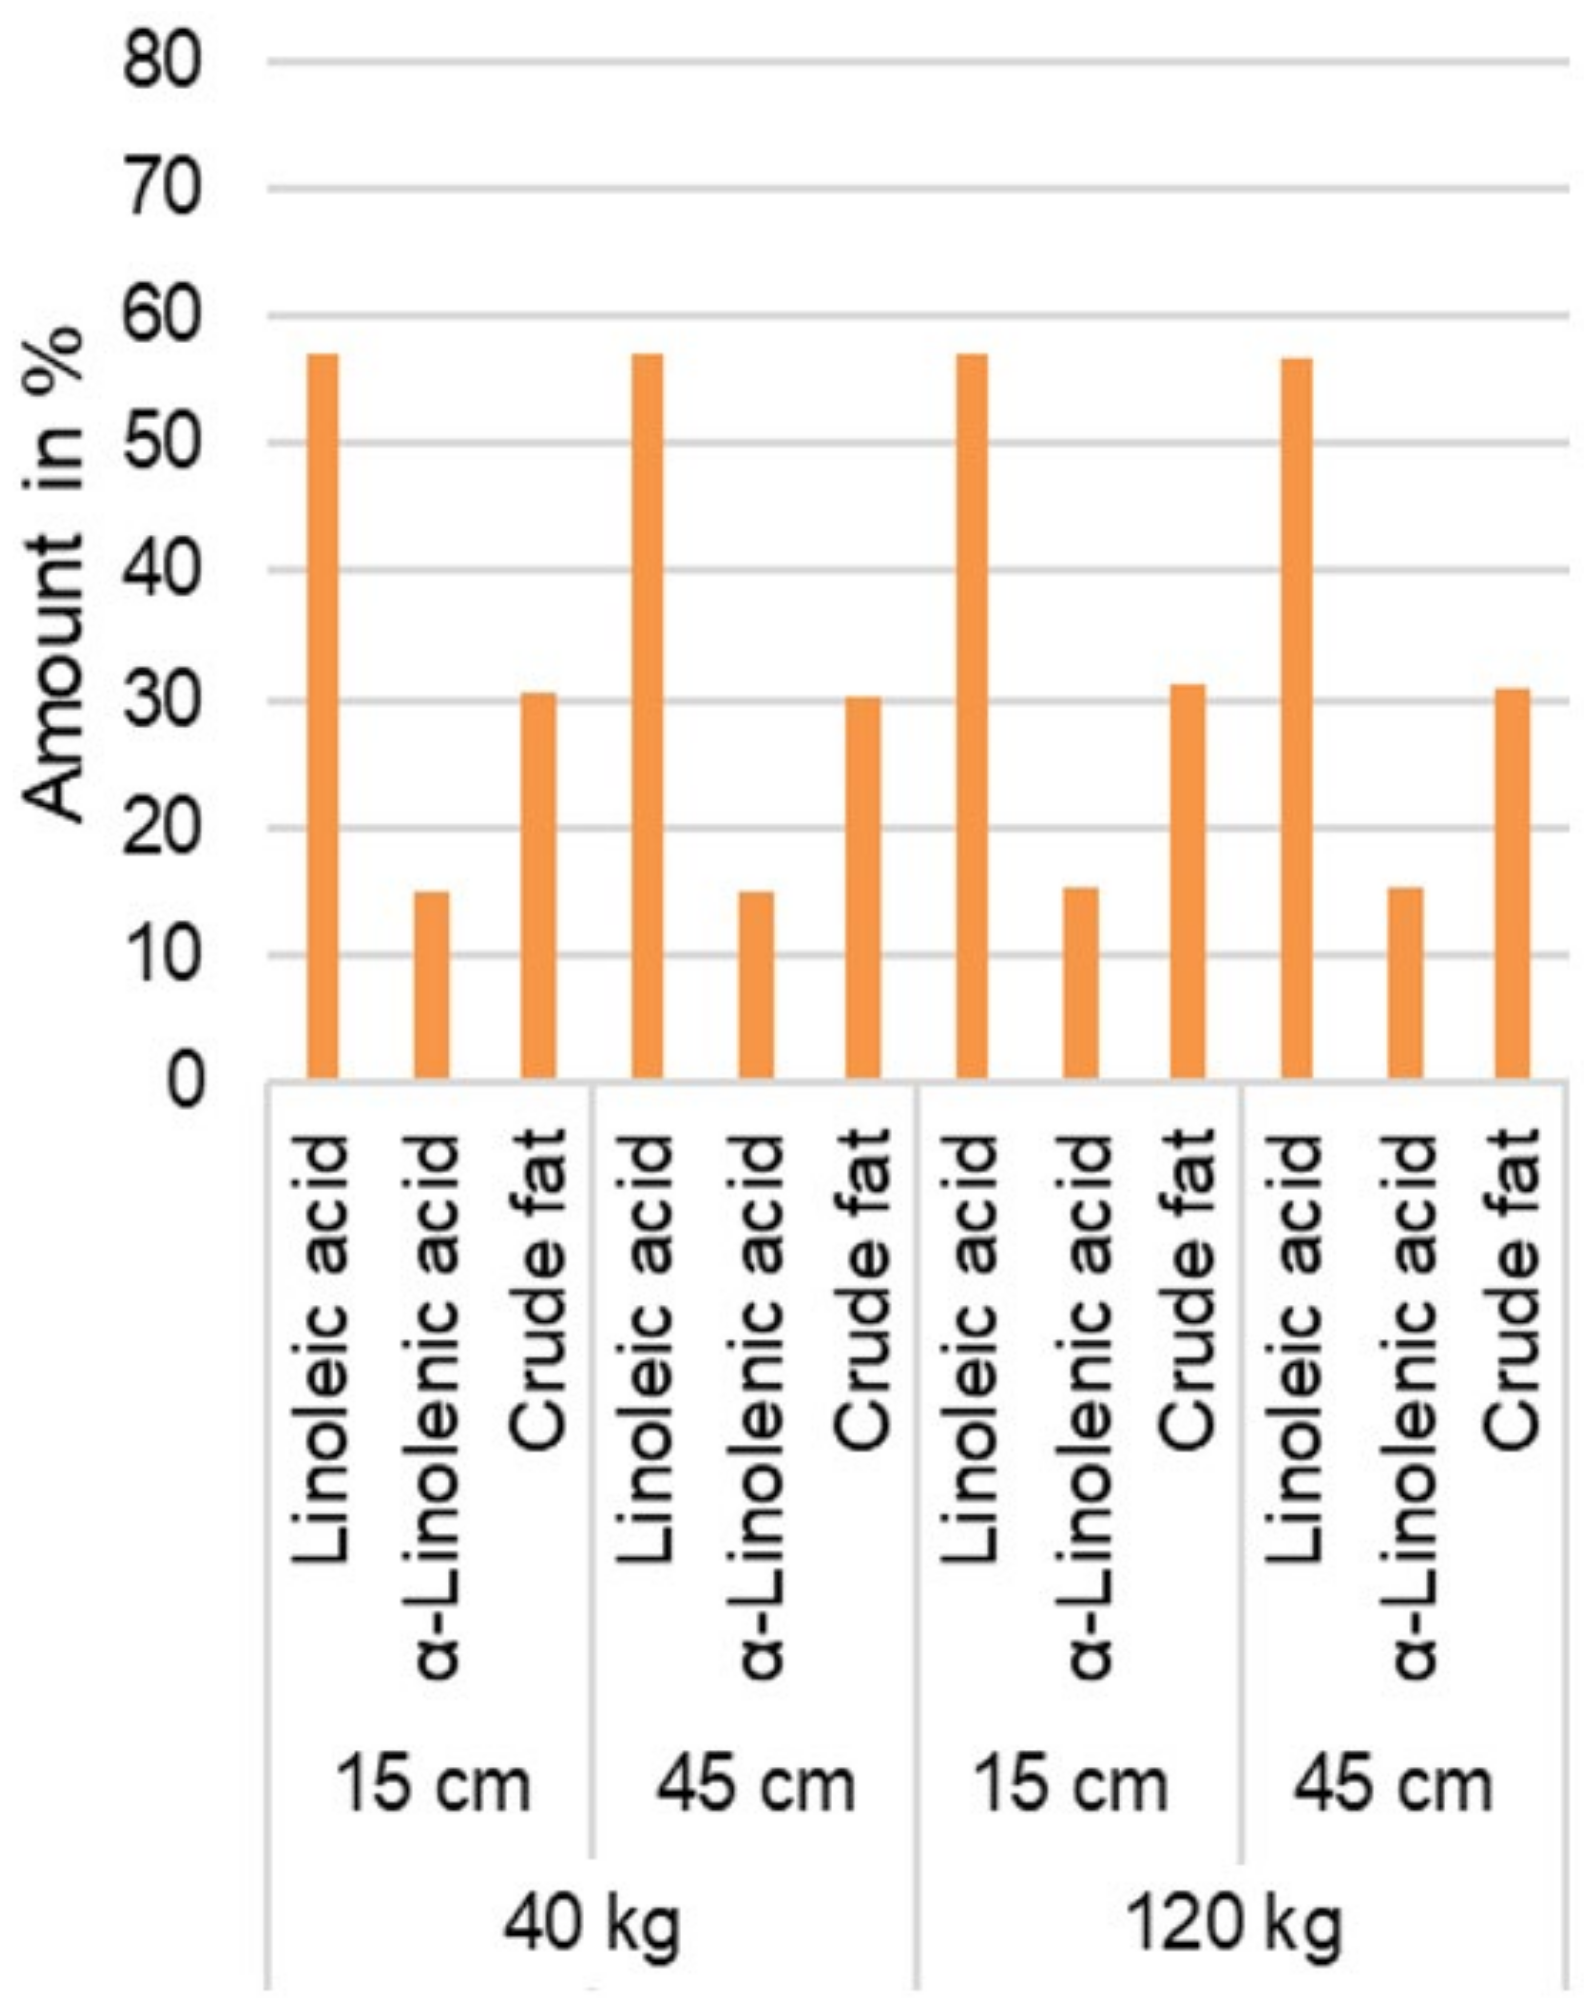
3.2.2. Fatty Acid Content Analysis
3.2.3. Hemp Root Biomass
3.2.4. Self-Thinning Effect
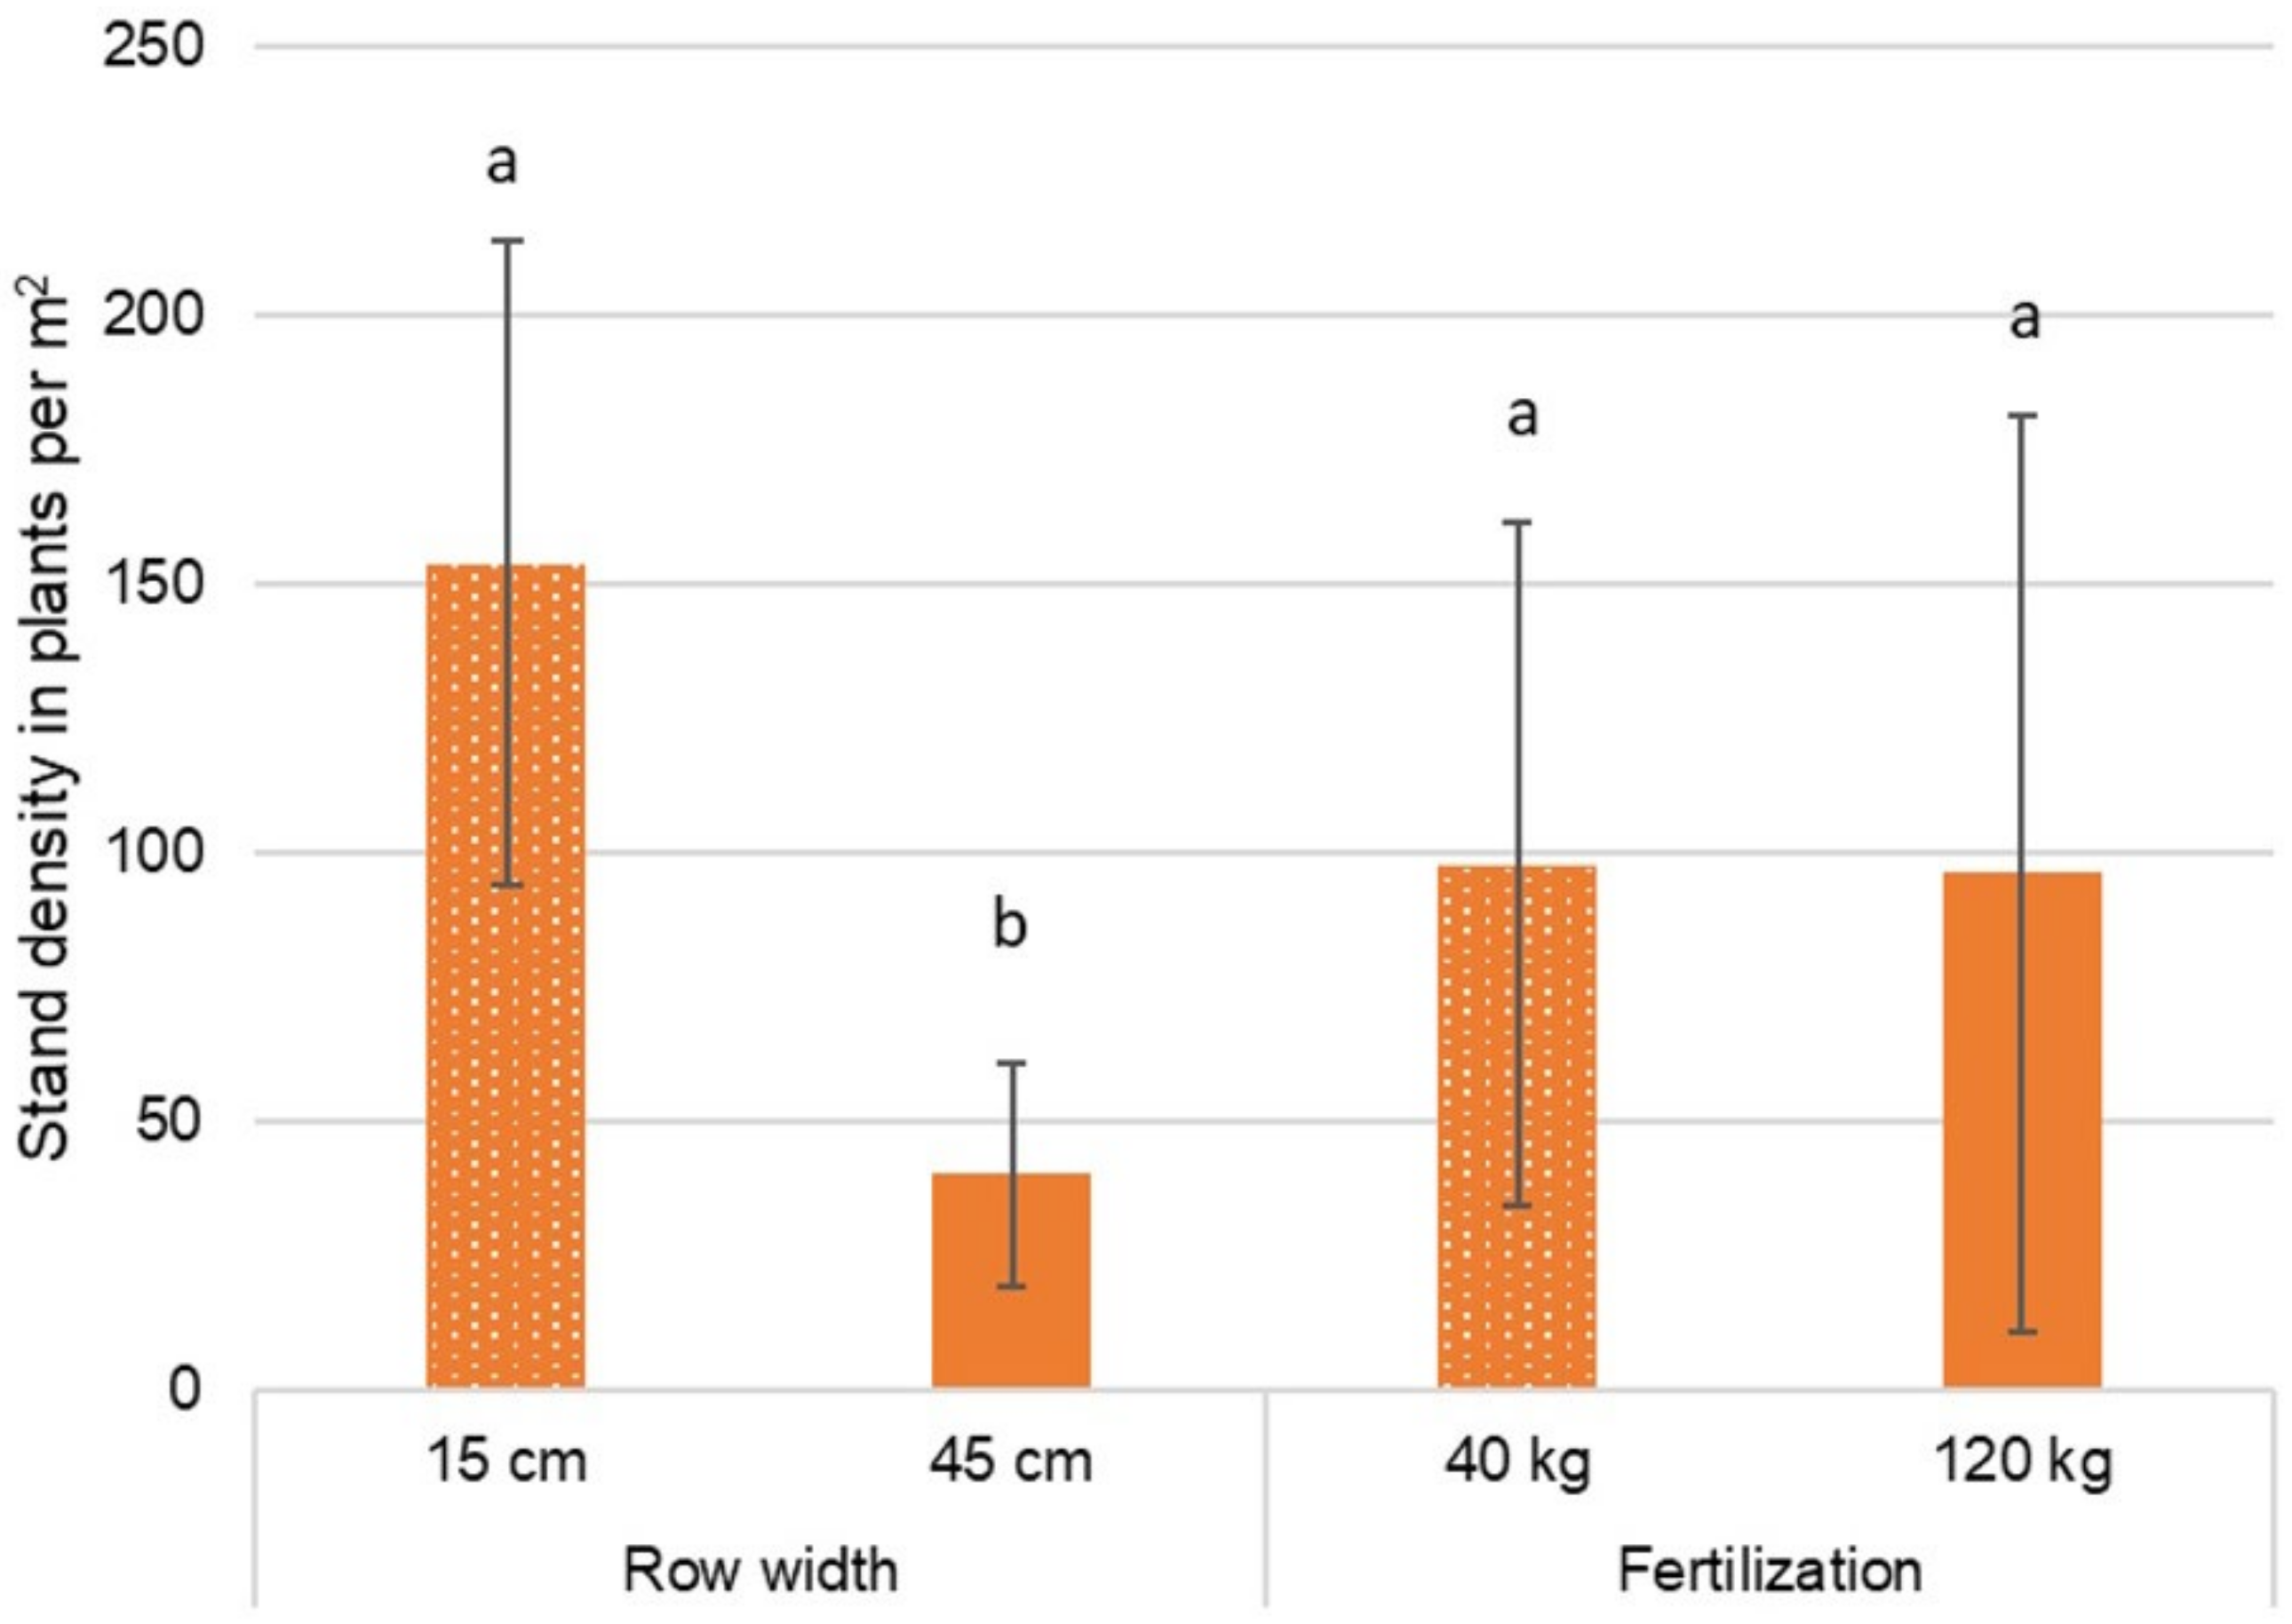
3.2.5. Stand Density of Hemp
3.2.6. Vegetative Growth Stage
- By the time hemp developed the fifth pair of leaves, 40 days, or almost 6 weeks, had passed (31 May 2021–9 July 2021).
- After that, only 2 weeks passed (23 July 2021) until phyllotaxis was observed in half of the plots. The rapid growth after the growth of the fifth leaf pair is hereby confirmed.
- The statement of Clarke [53] that hemp can grow up to 7 cm per day during this period could also be observed in this experiment. In the period between 16 July 2021 and 31 July 2021, hemp in plot 6 grew app. 4.8 cm per day.
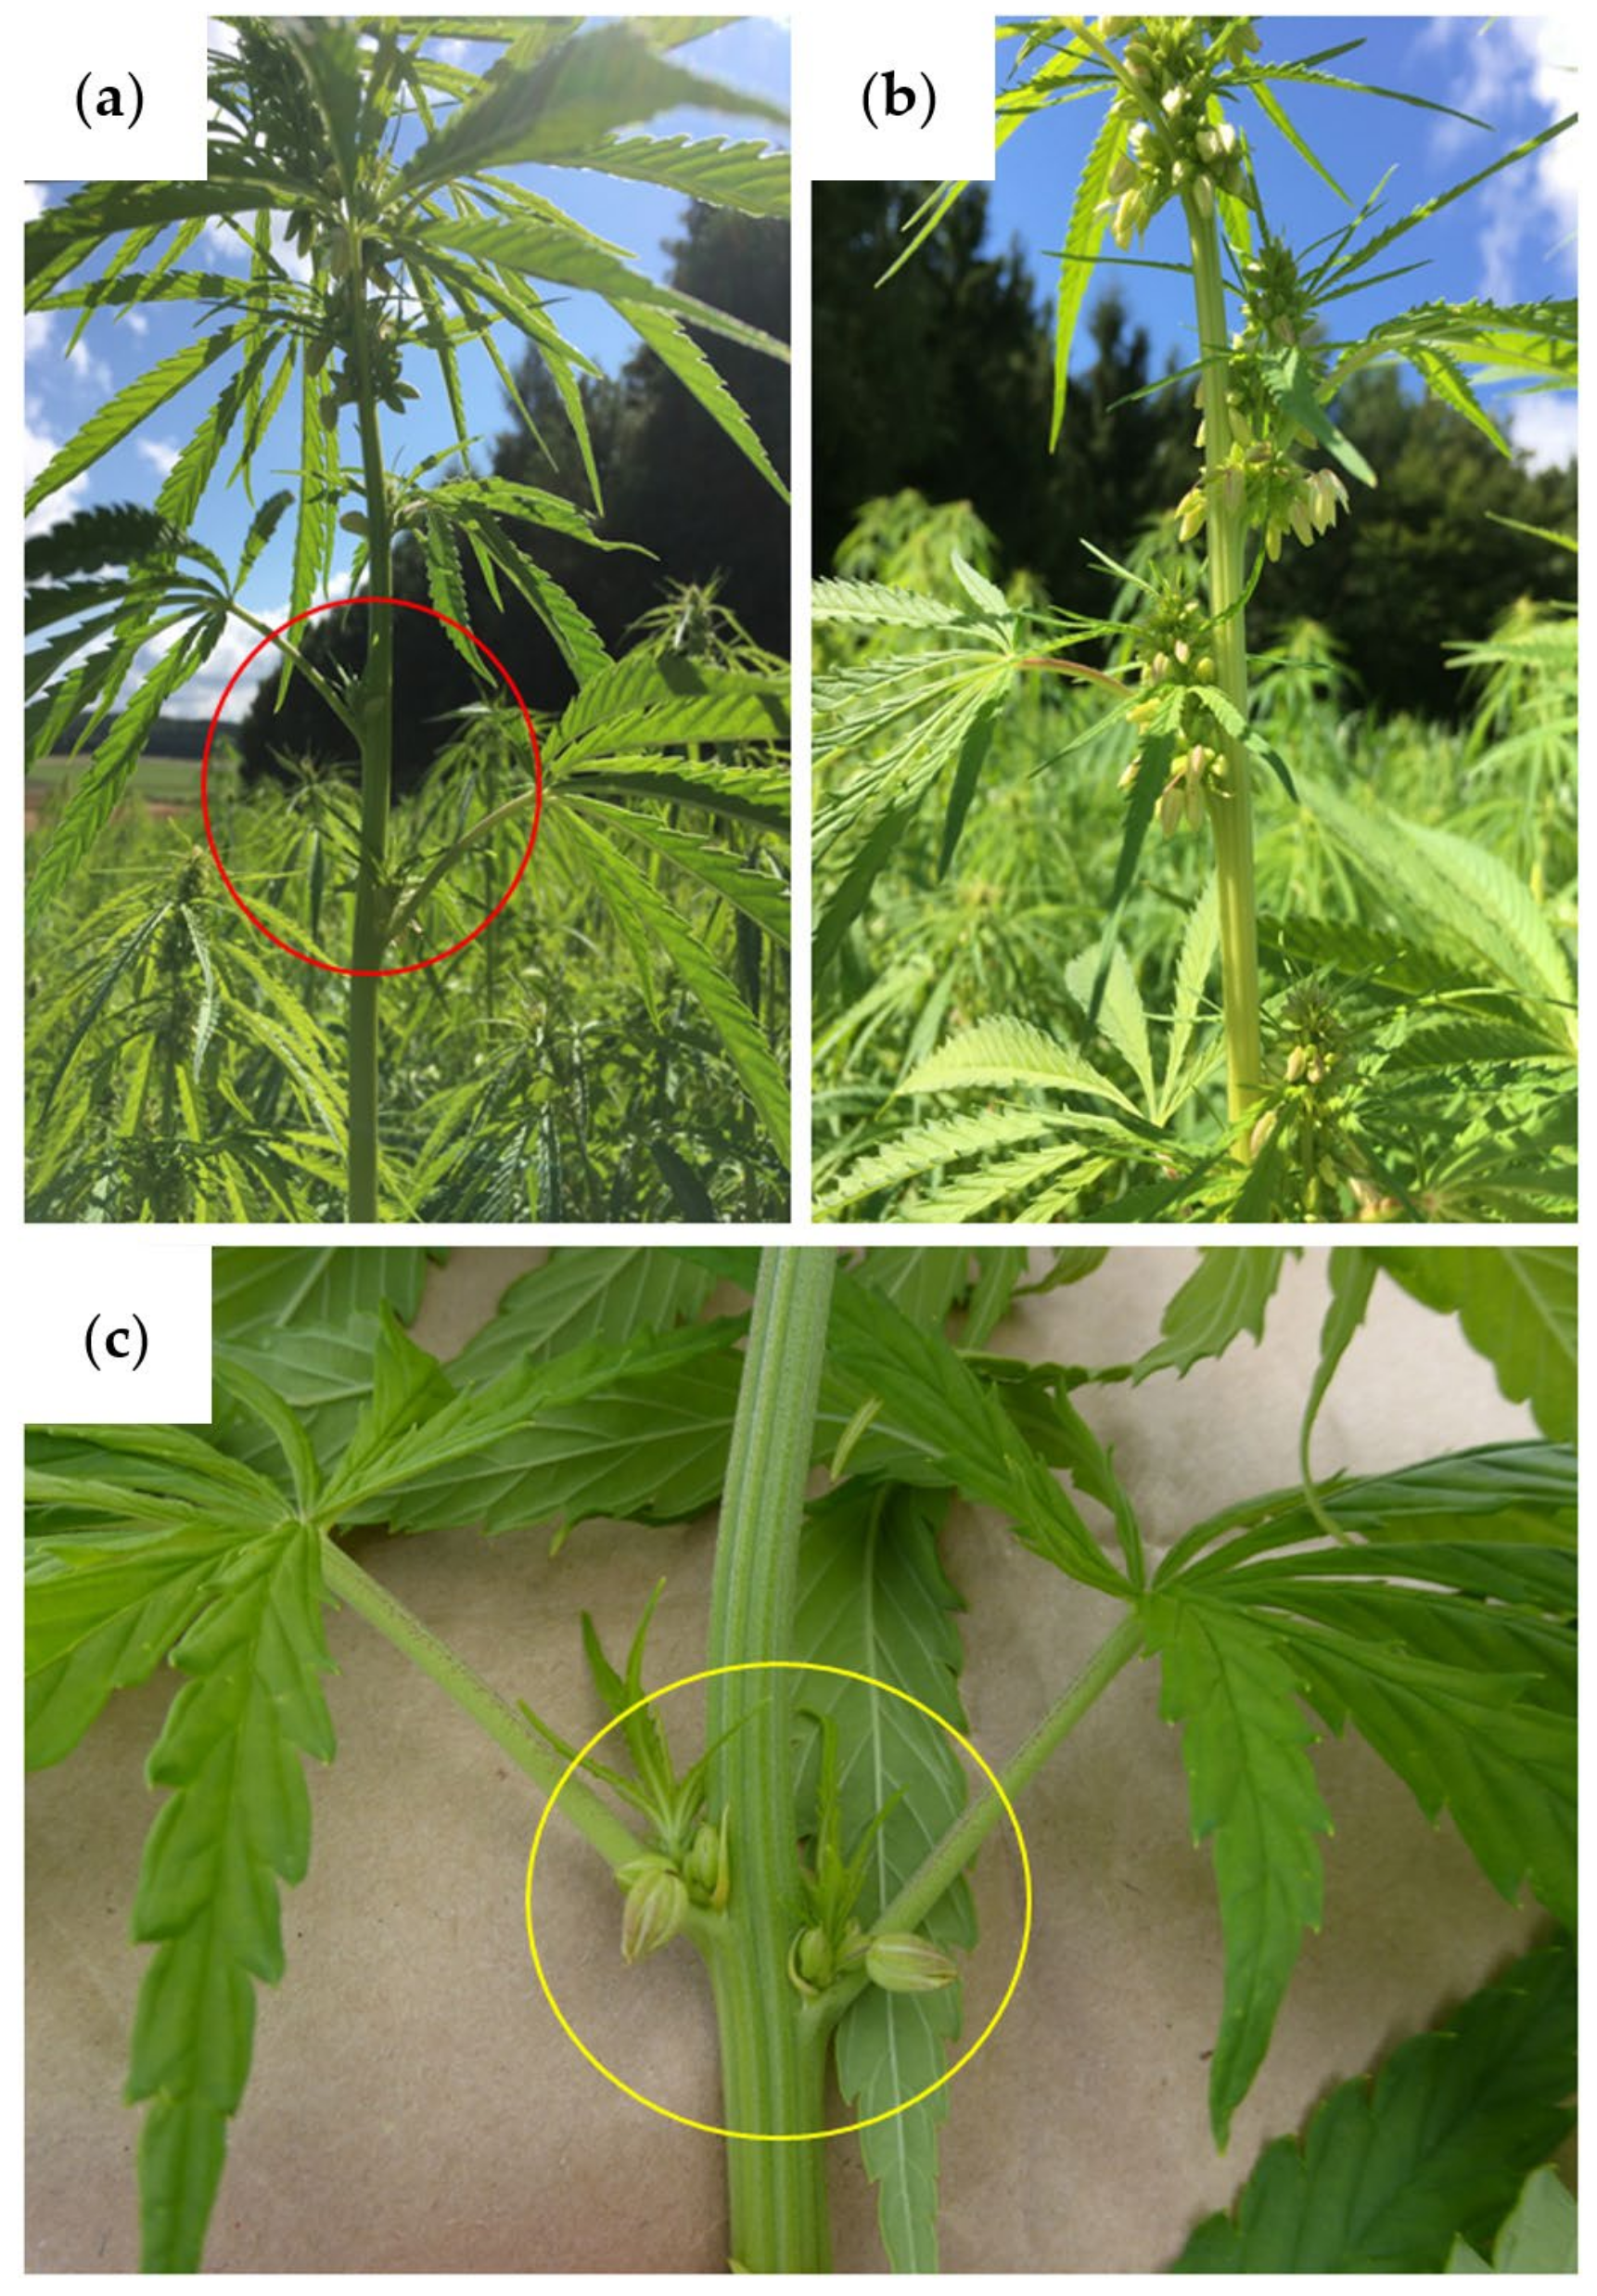
3.2.7. Generative Growth Stage
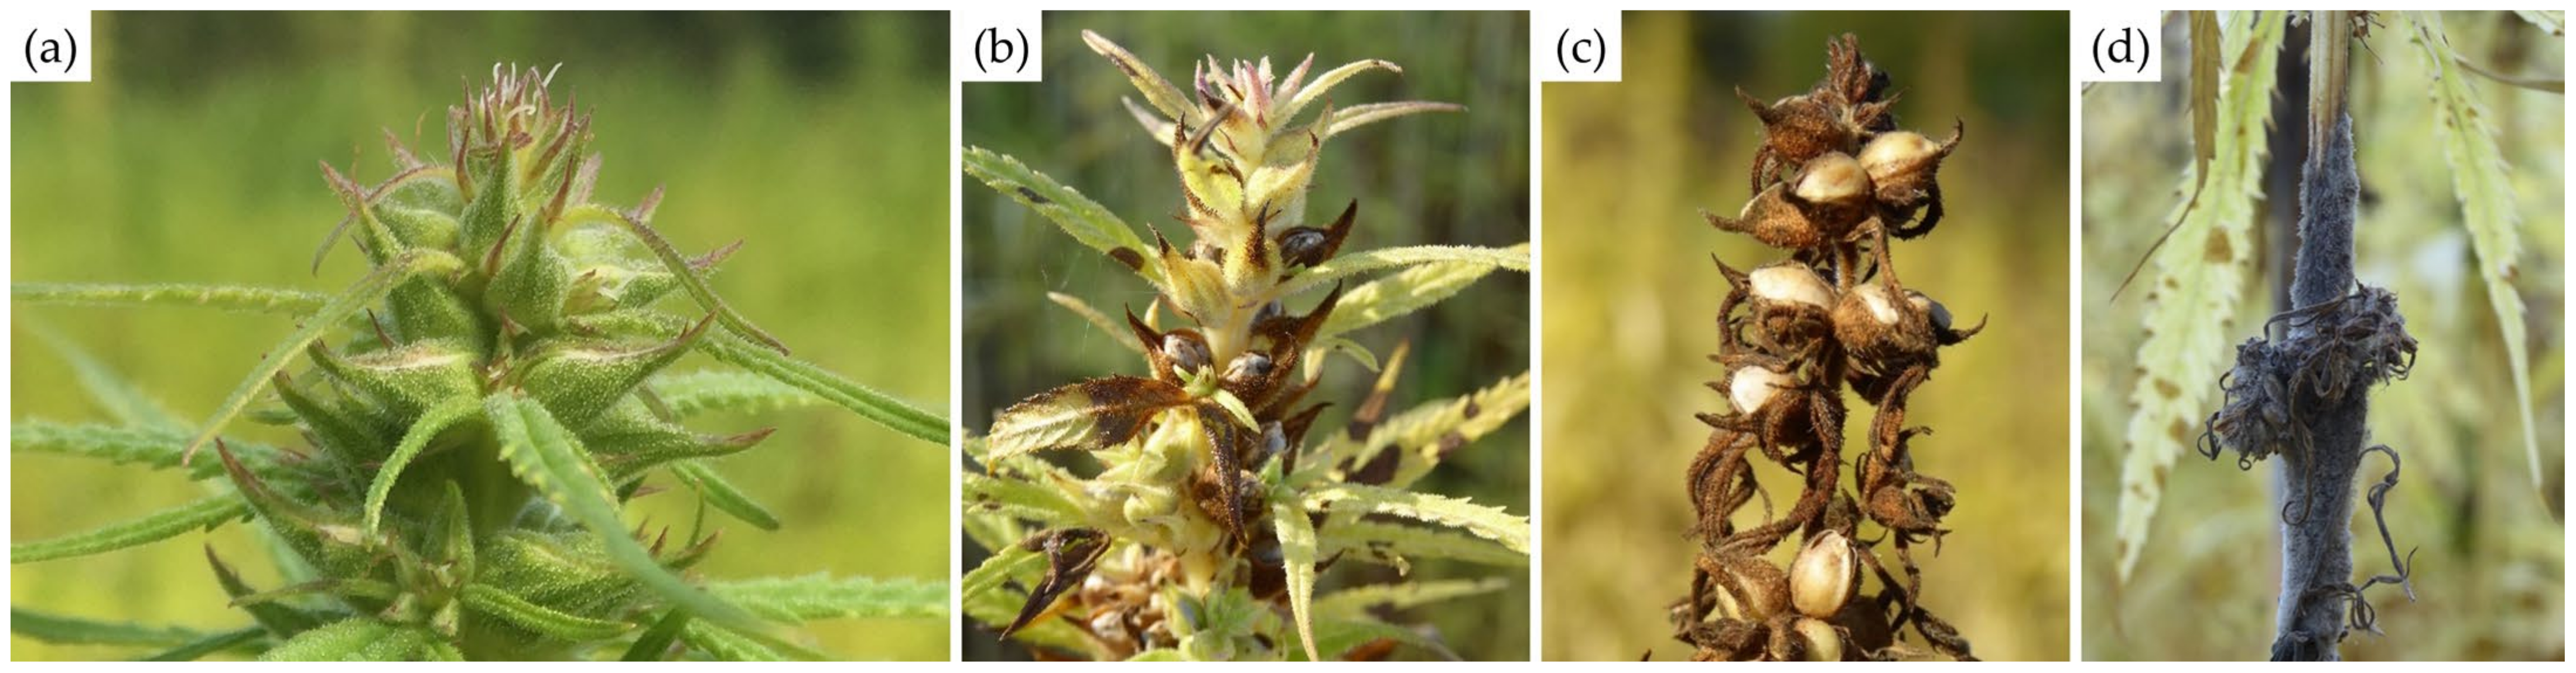
3.2.8. Flowering Stage, Seed Maturity and Senescence
3.2.9. Comparing to Monoecious Plants
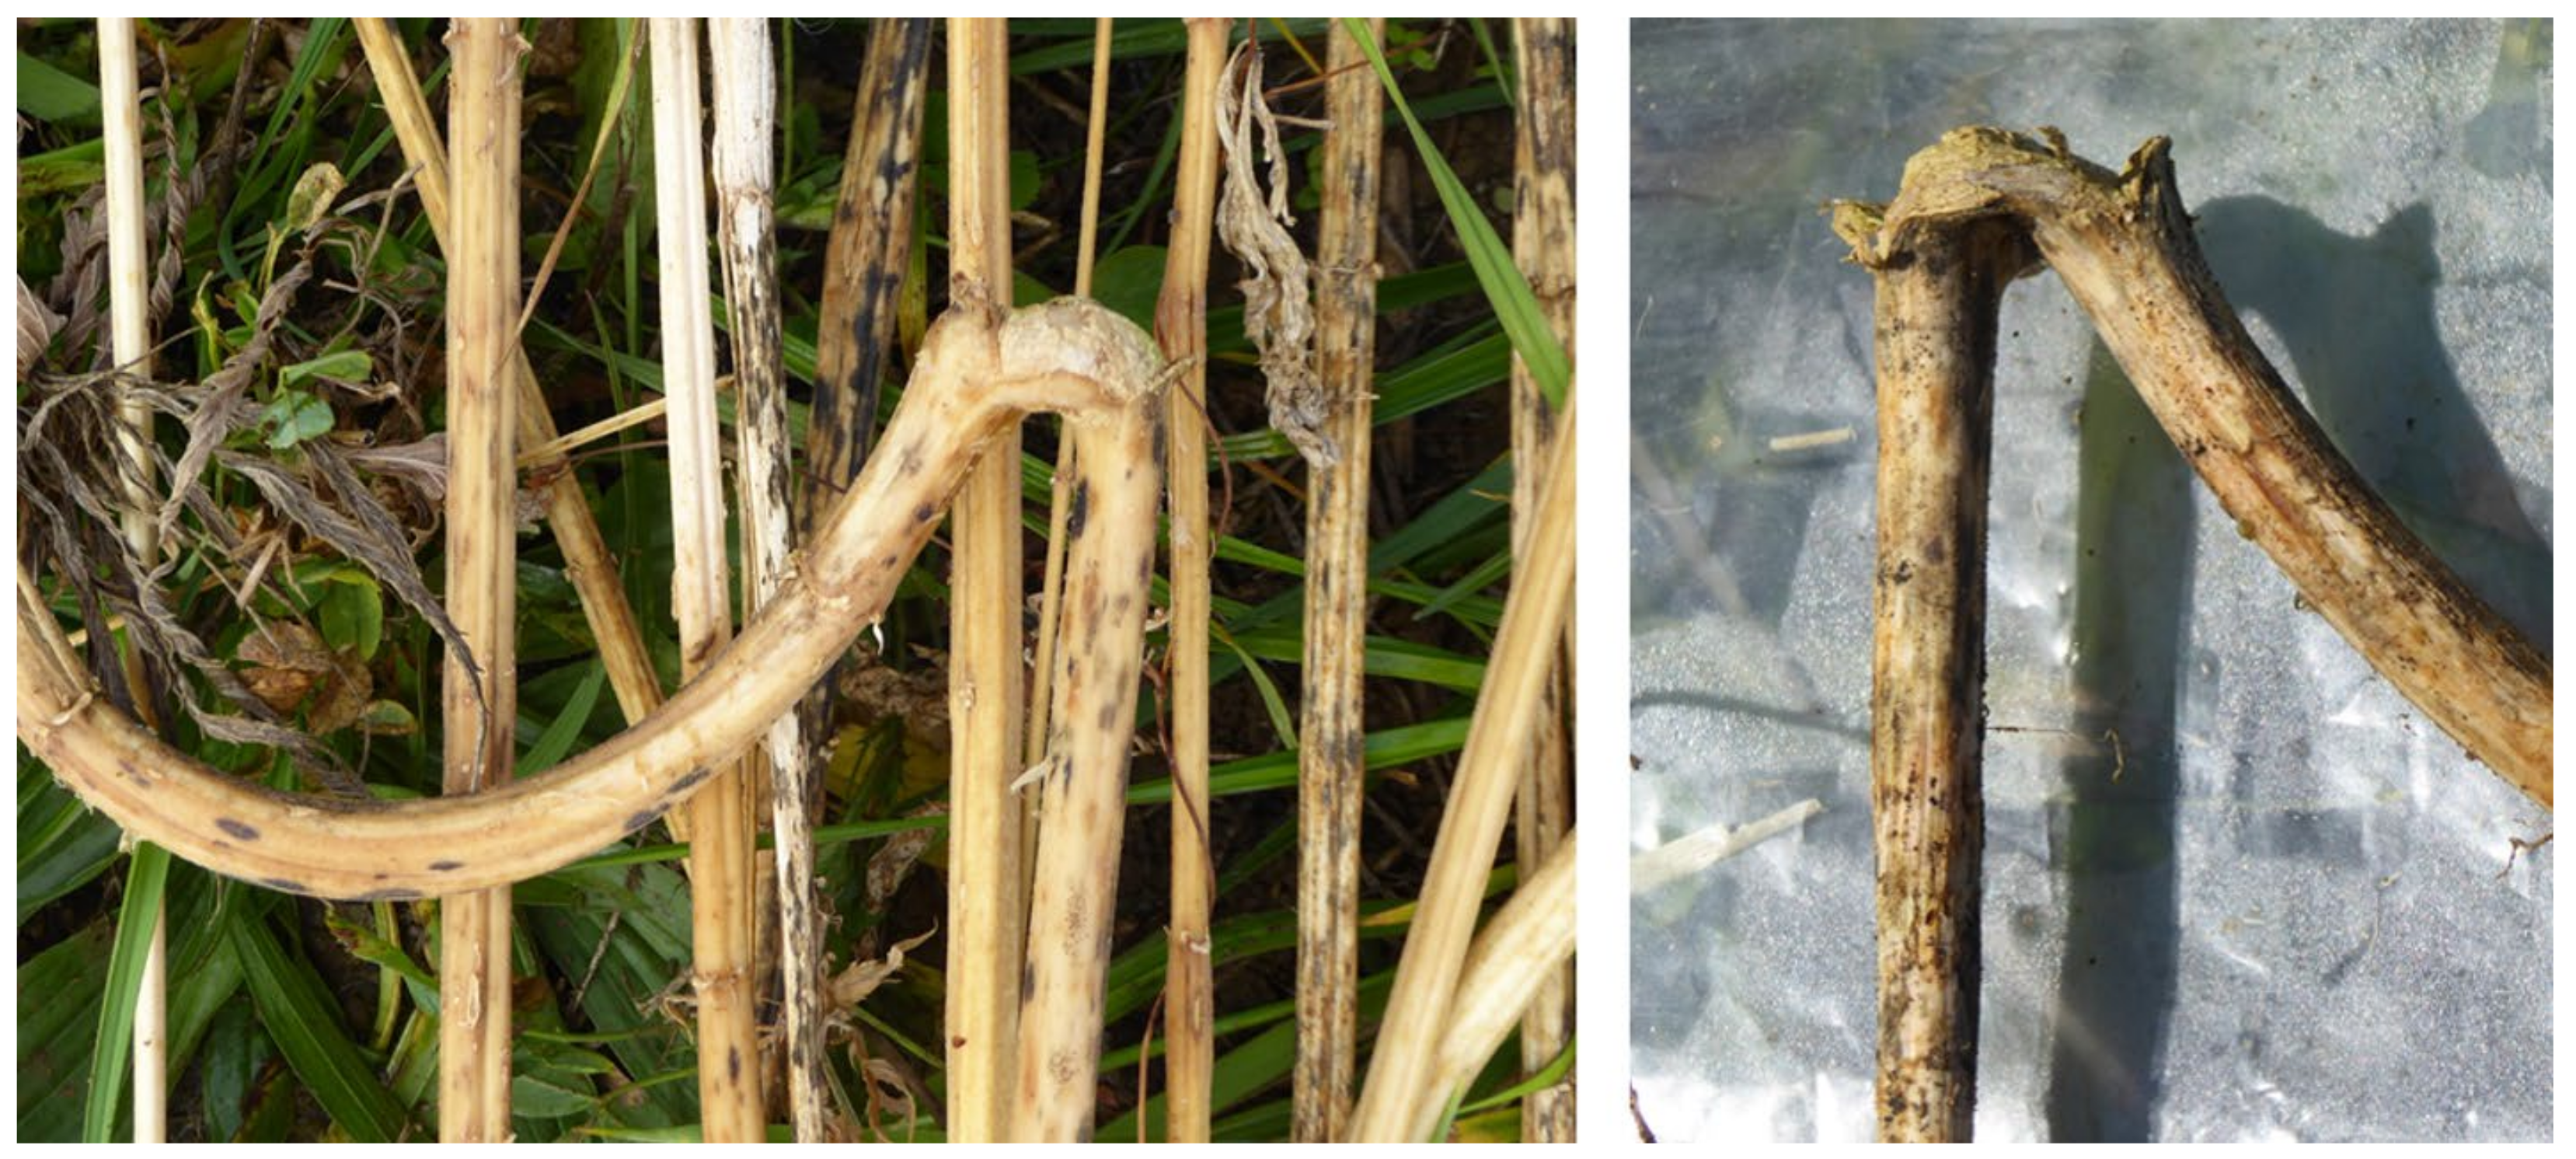
3.2.10. Diseases
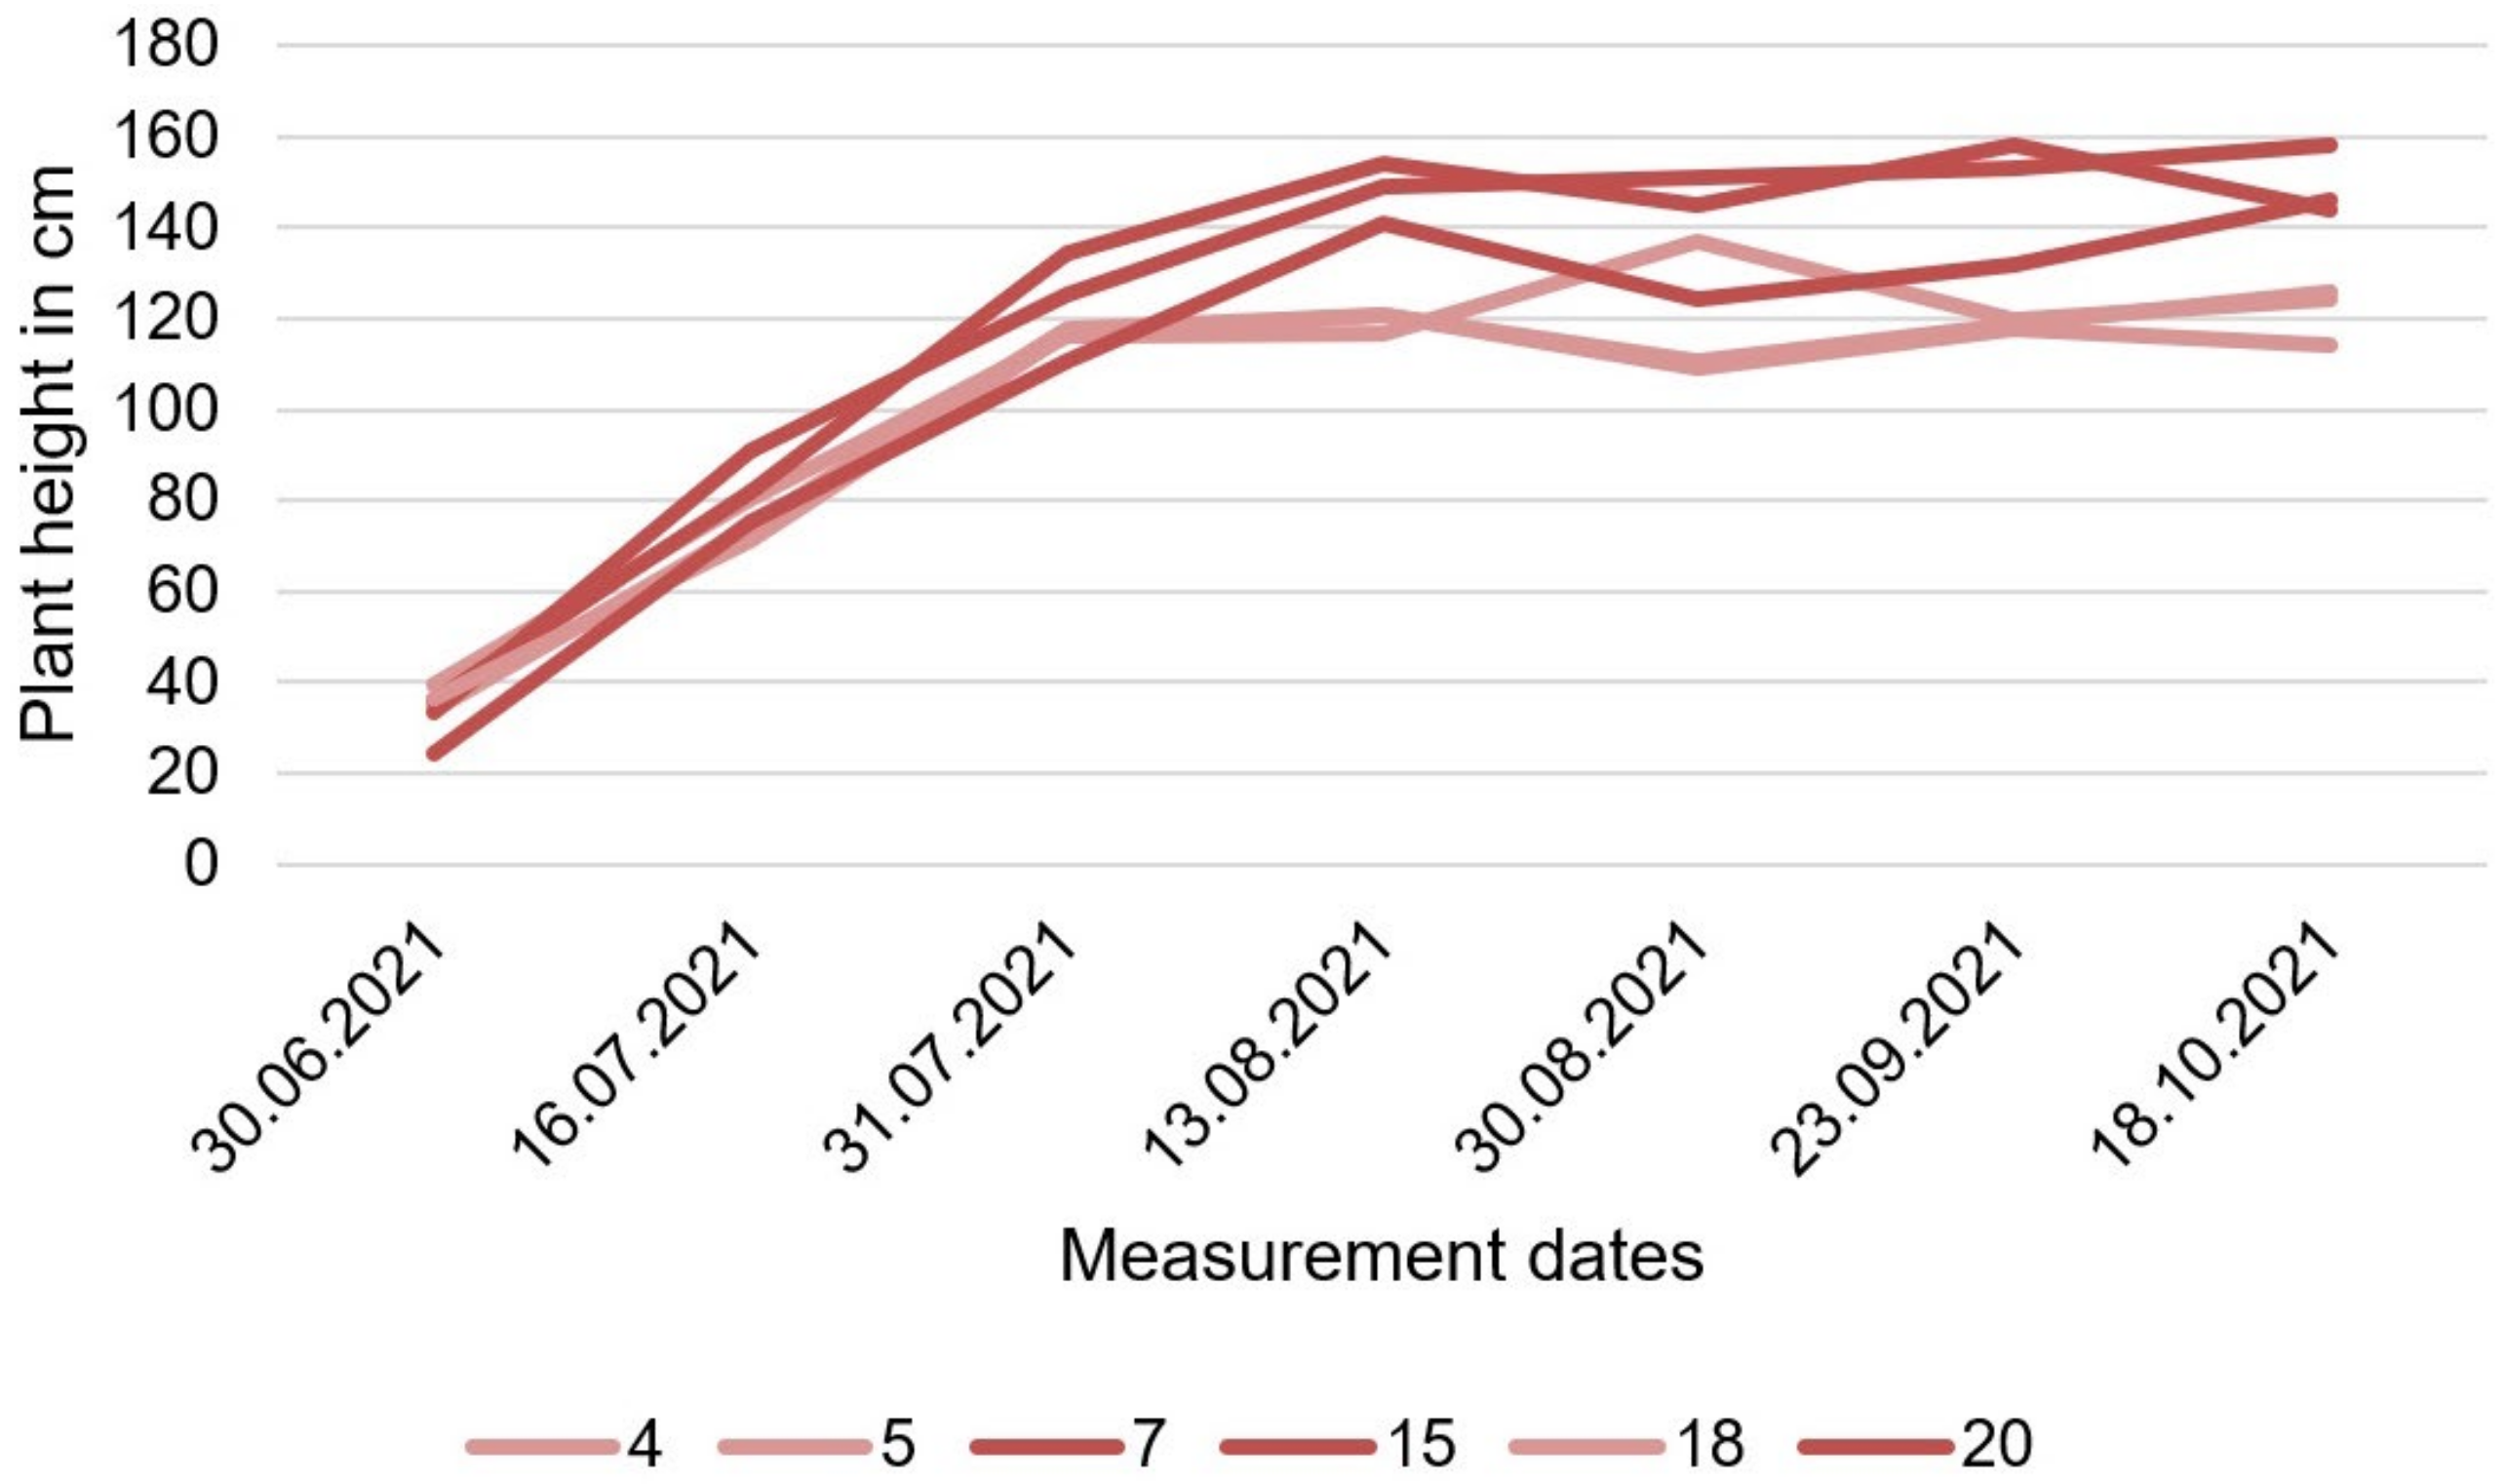
3.2.11. Height
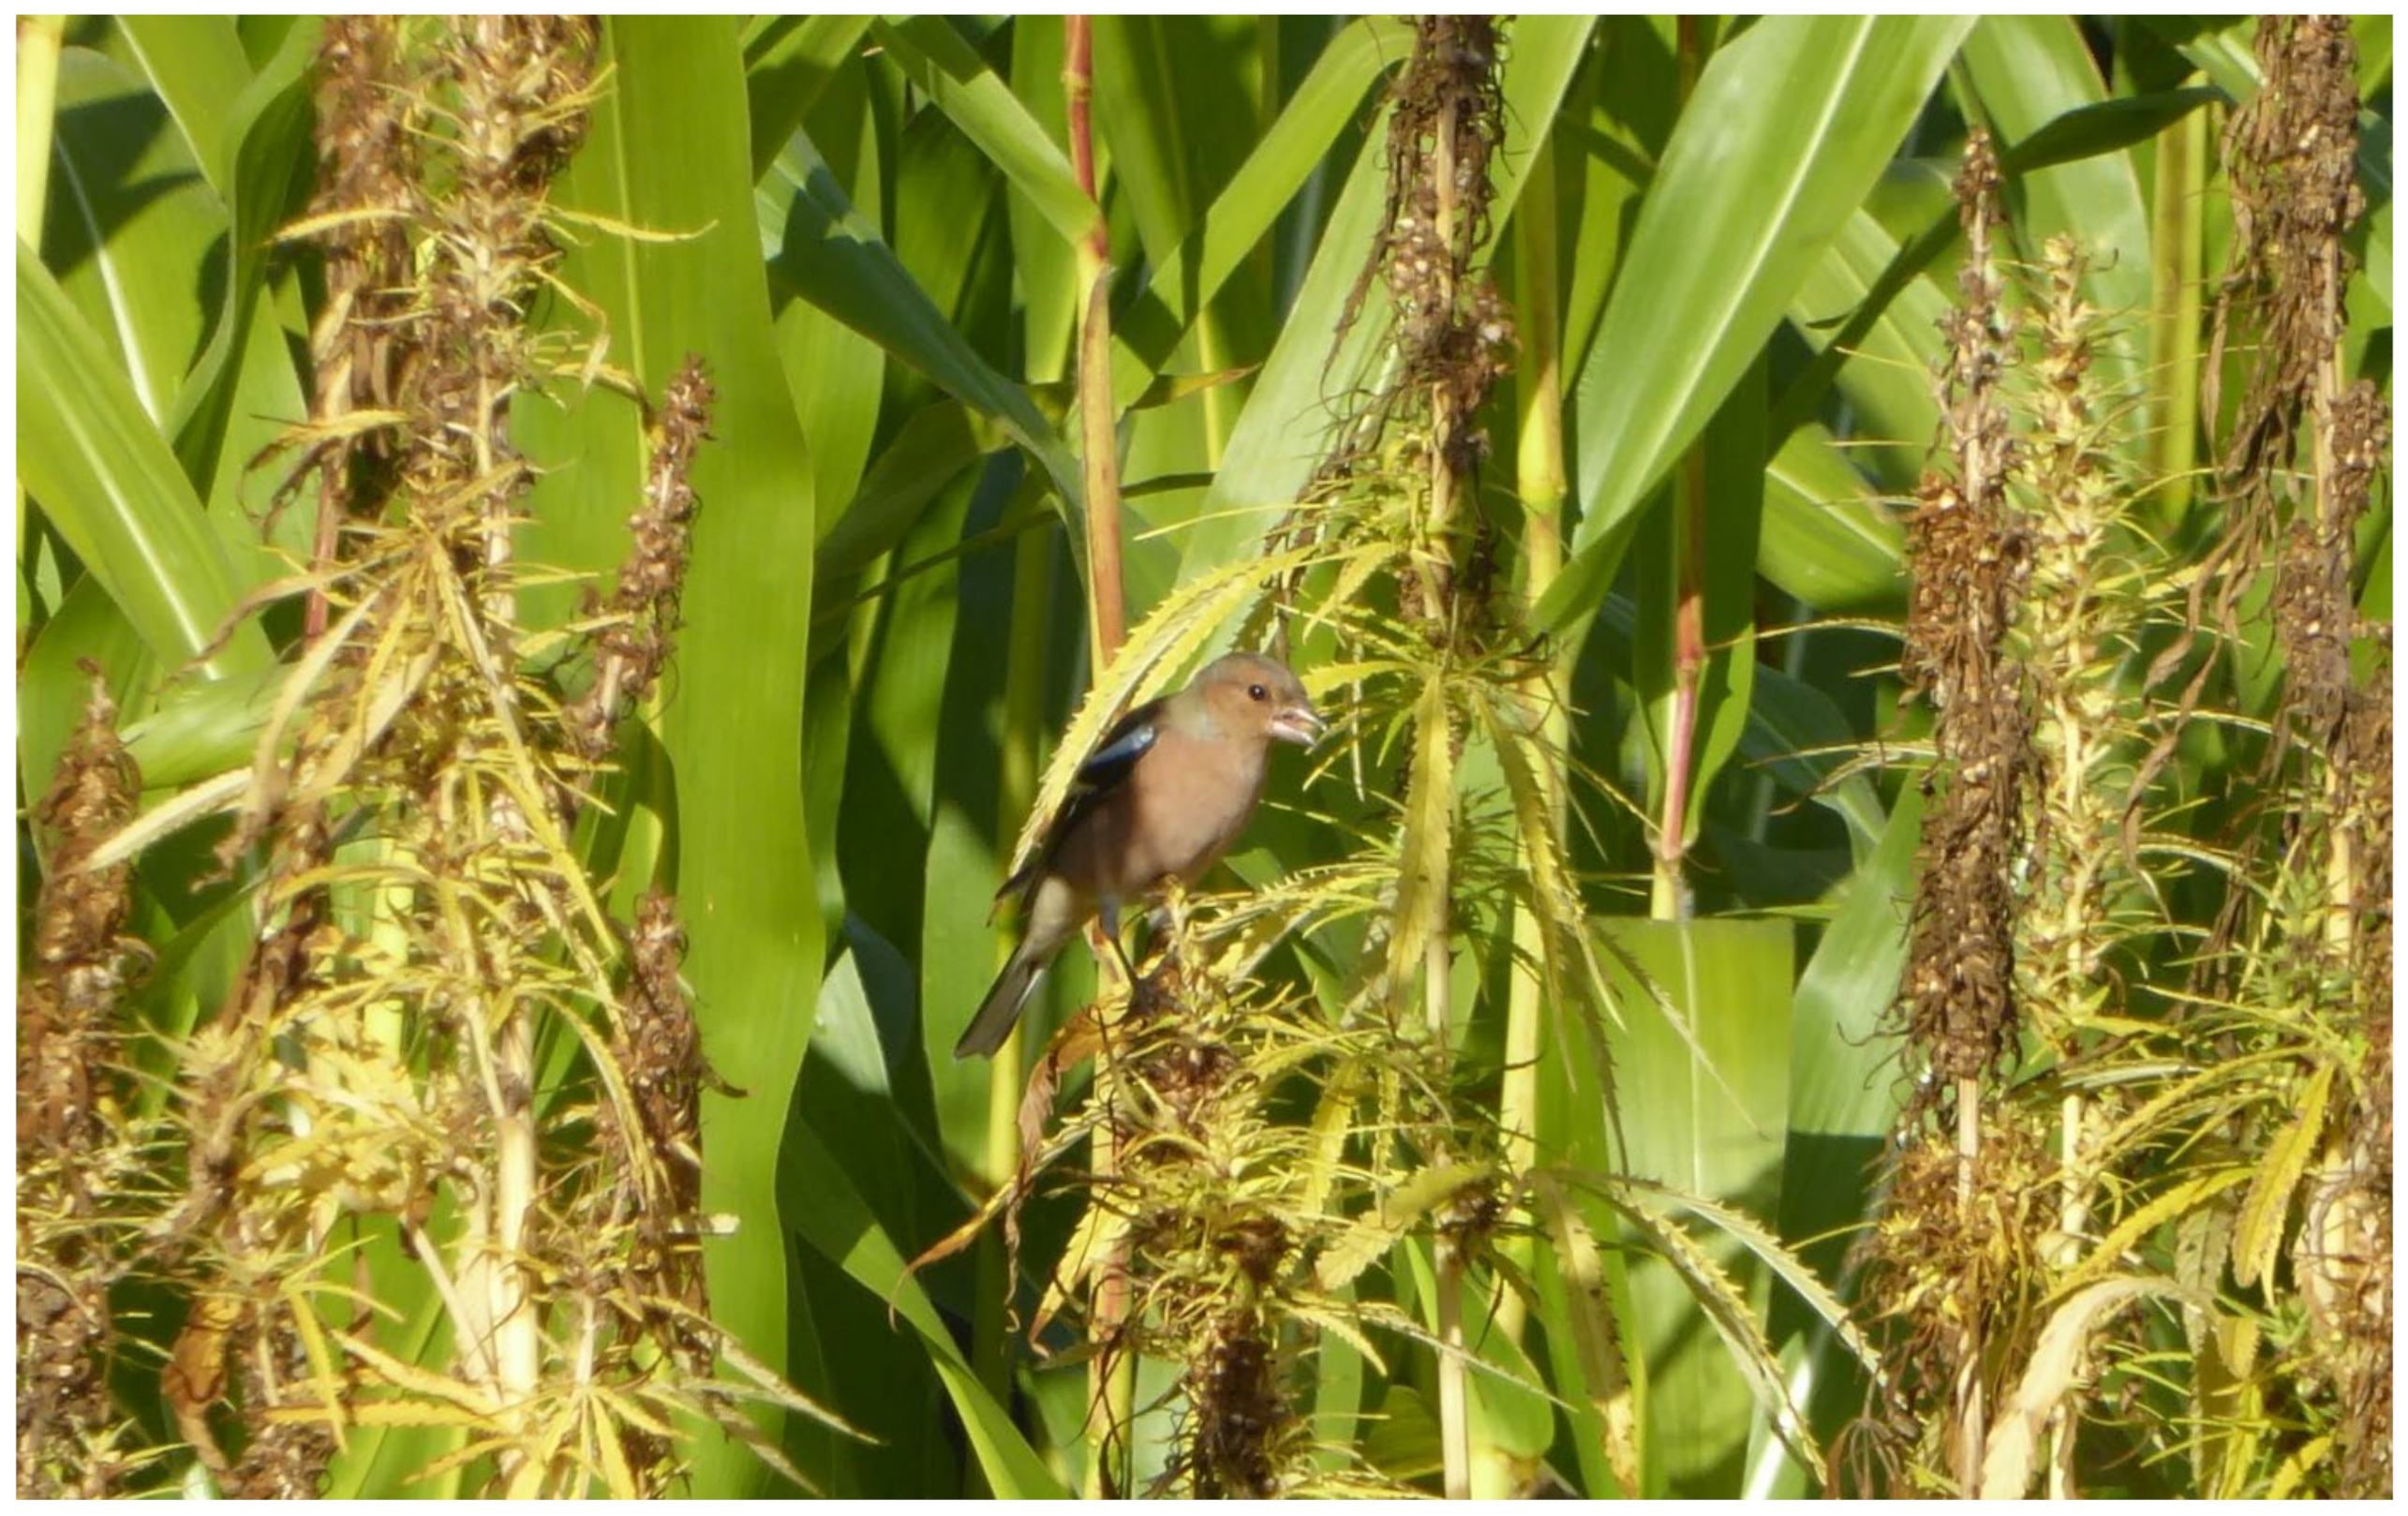
3.2.12. Wildlife
3.3. Quantitative Analysis
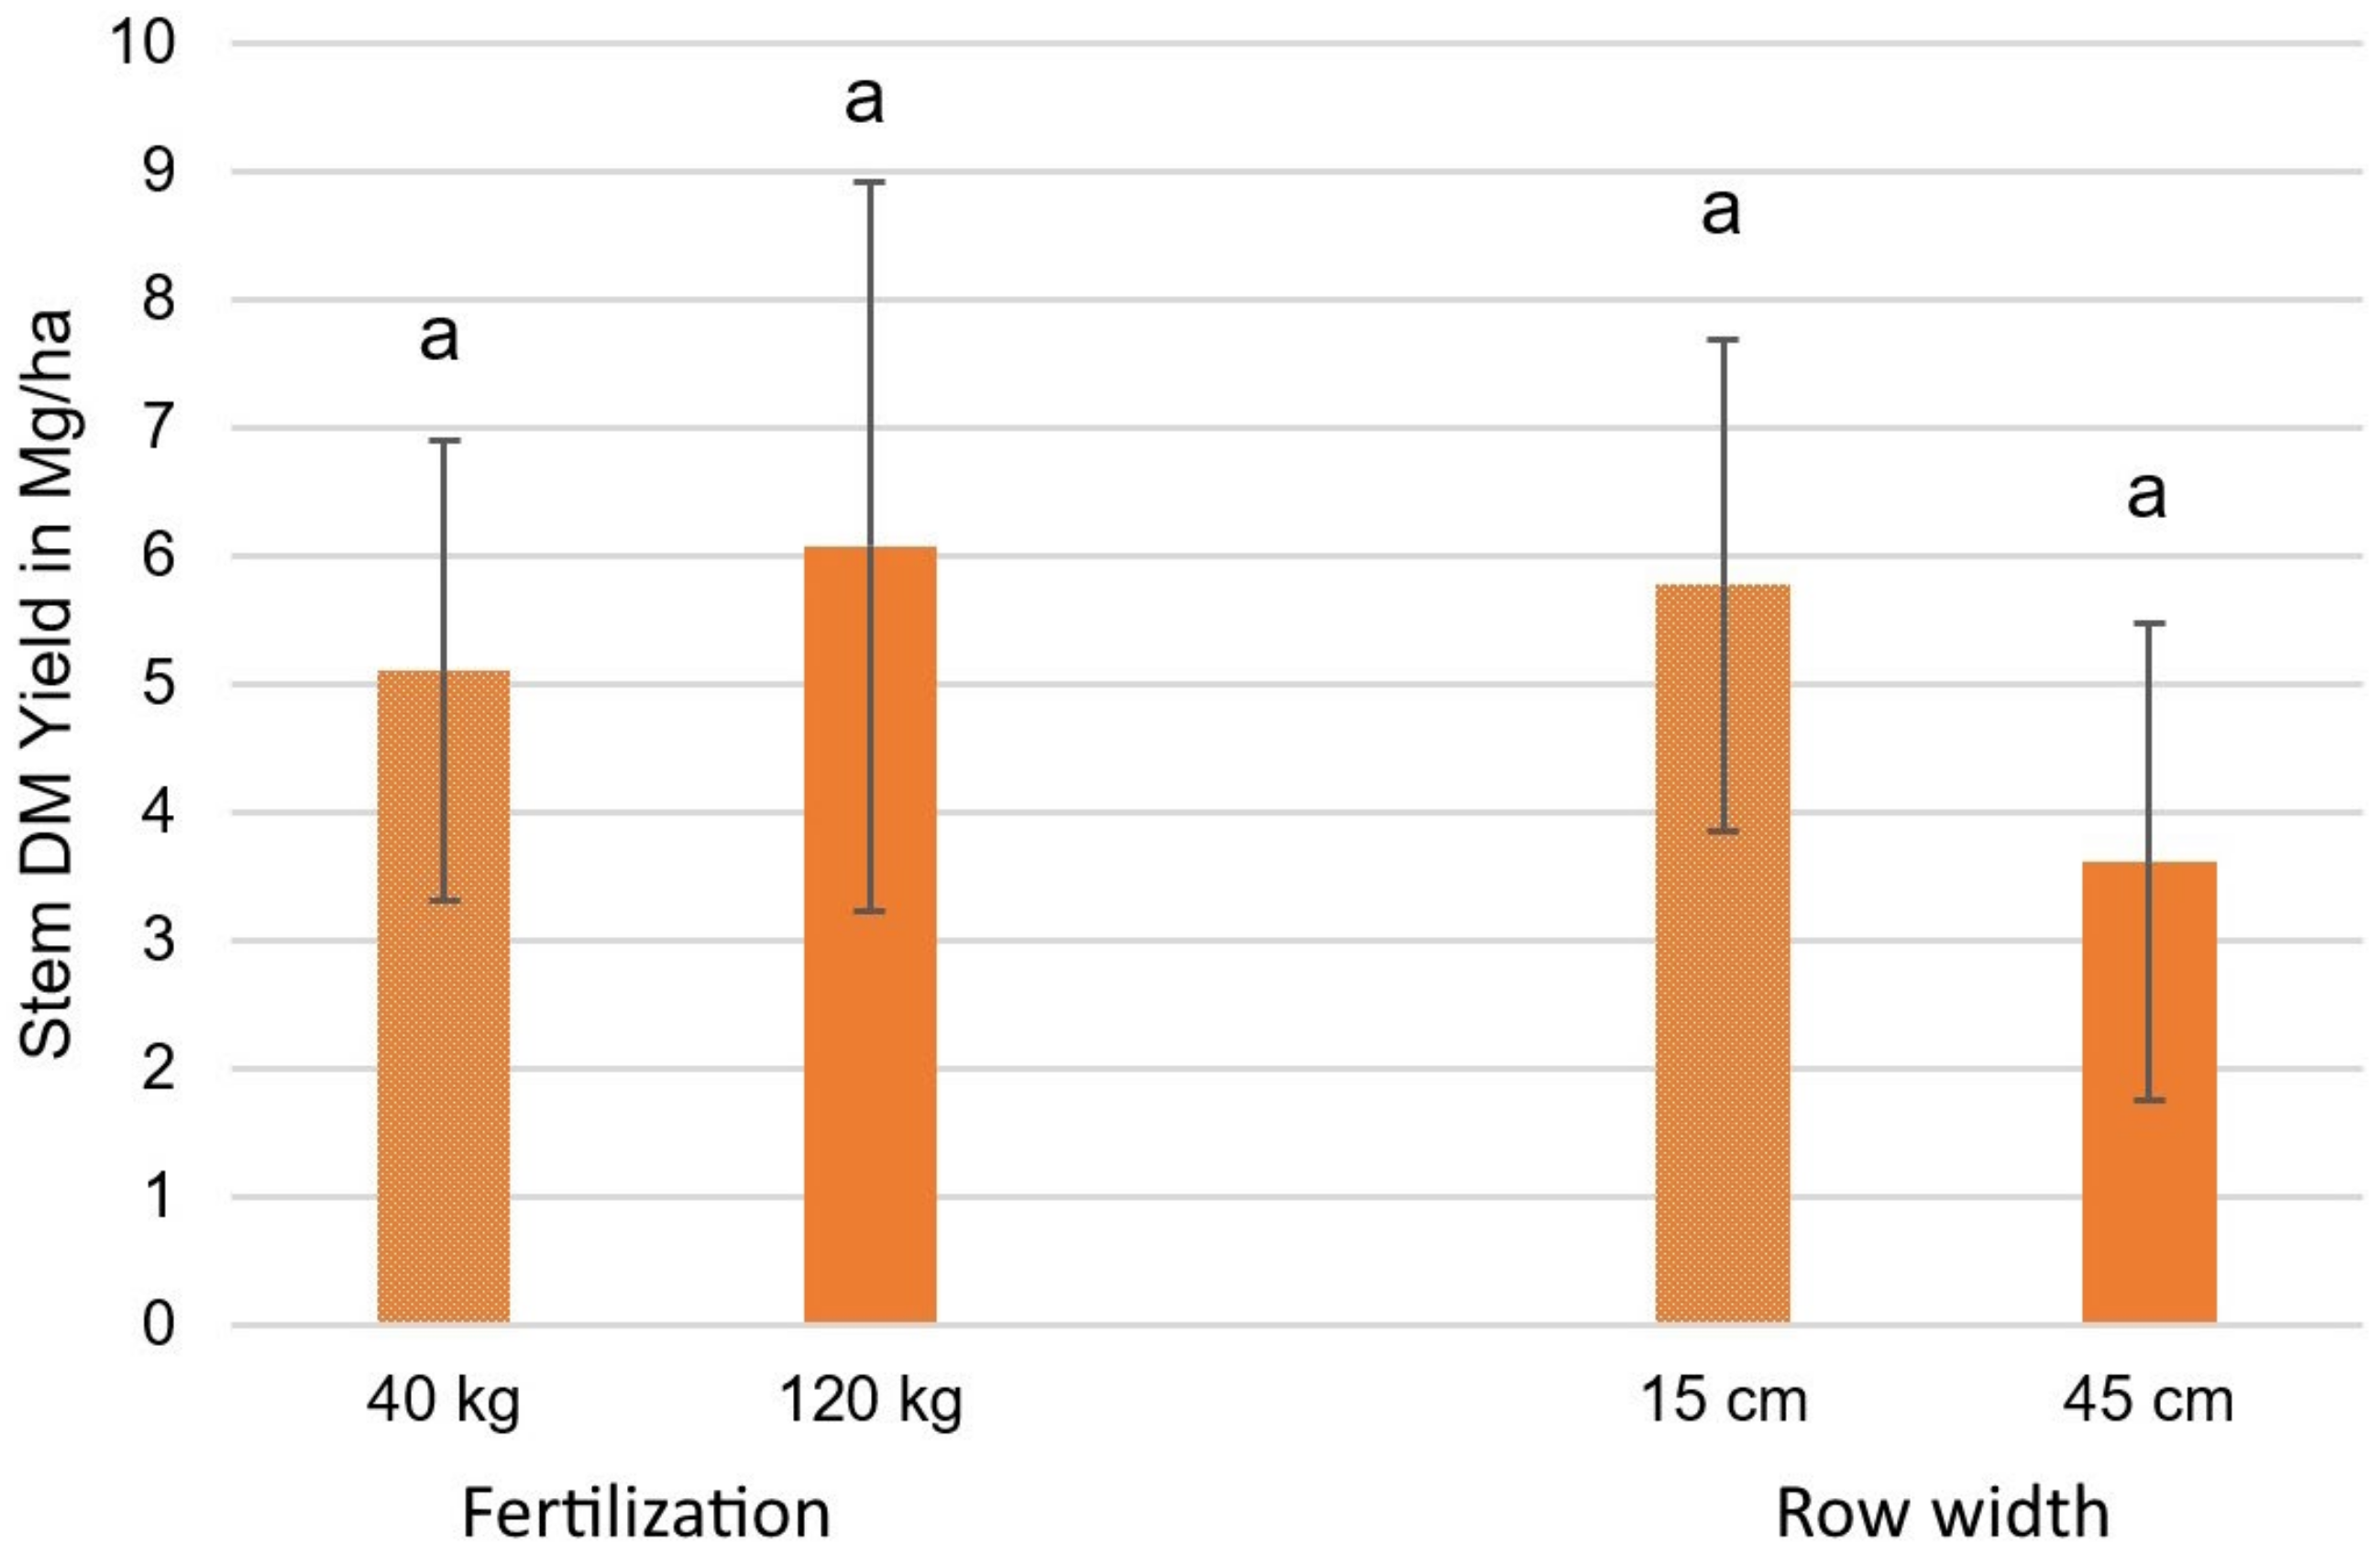
3.3.1. Stem DM Yield Results
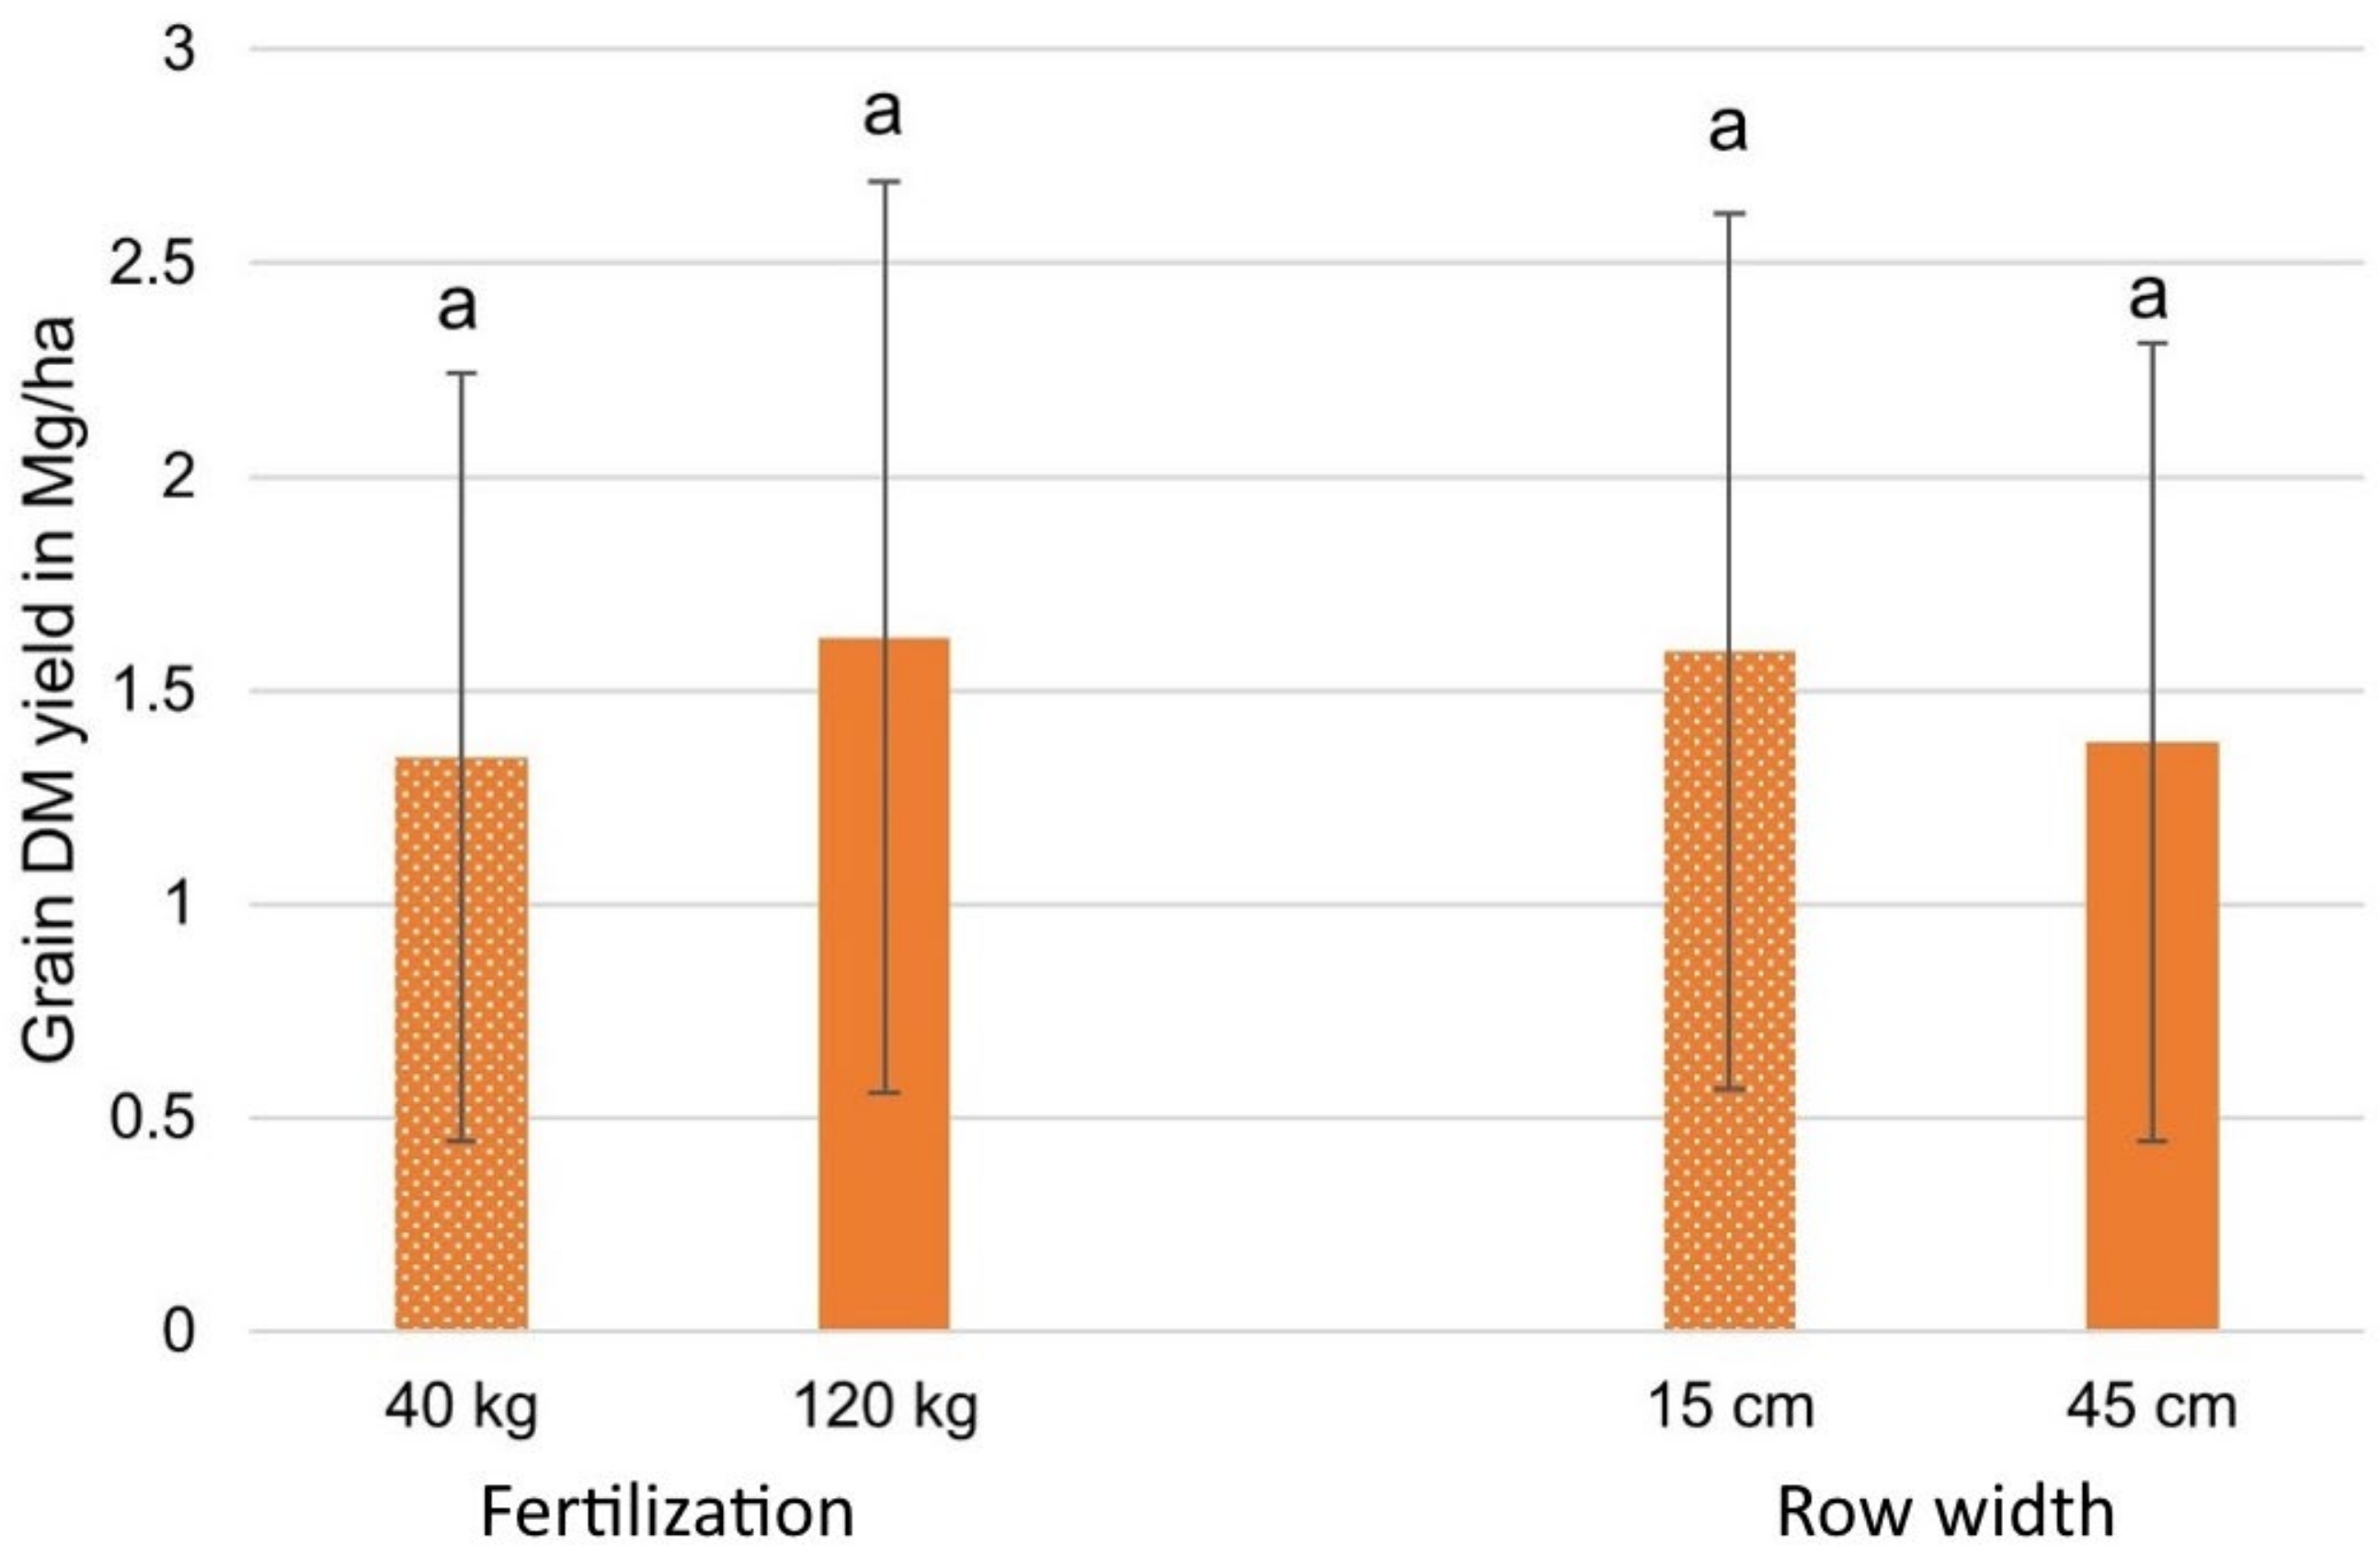
3.3.2. Grain DM Yield Results
3.3.3. Reference Crop Maize
4. Discussion
4.1. Soil Conditions and Plant Phenological Development
4.1.1. Soil
4.1.2. Stone Content
4.1.3. Stem Width
4.1.4. Fatty Acid Content

| Year of the Study | Belowground Dry Biomass Yield Hemp in Mg/ha | Root Biomass Fraction in % |
|---|---|---|
| 2021 (this study) | 0.86 | 23.72 |
| 2004 | 3.21 [77] | 18.24 (calculated with data of [77]) |
| 2005 | 2.41 [77] | 18.54 (calculated with data of [77]) |
4.1.5. Underground Biomass and Root Morphology
4.1.6. Self-Thinning and Stand Density
4.1.7. Plant Appraisal
4.1.8. Height
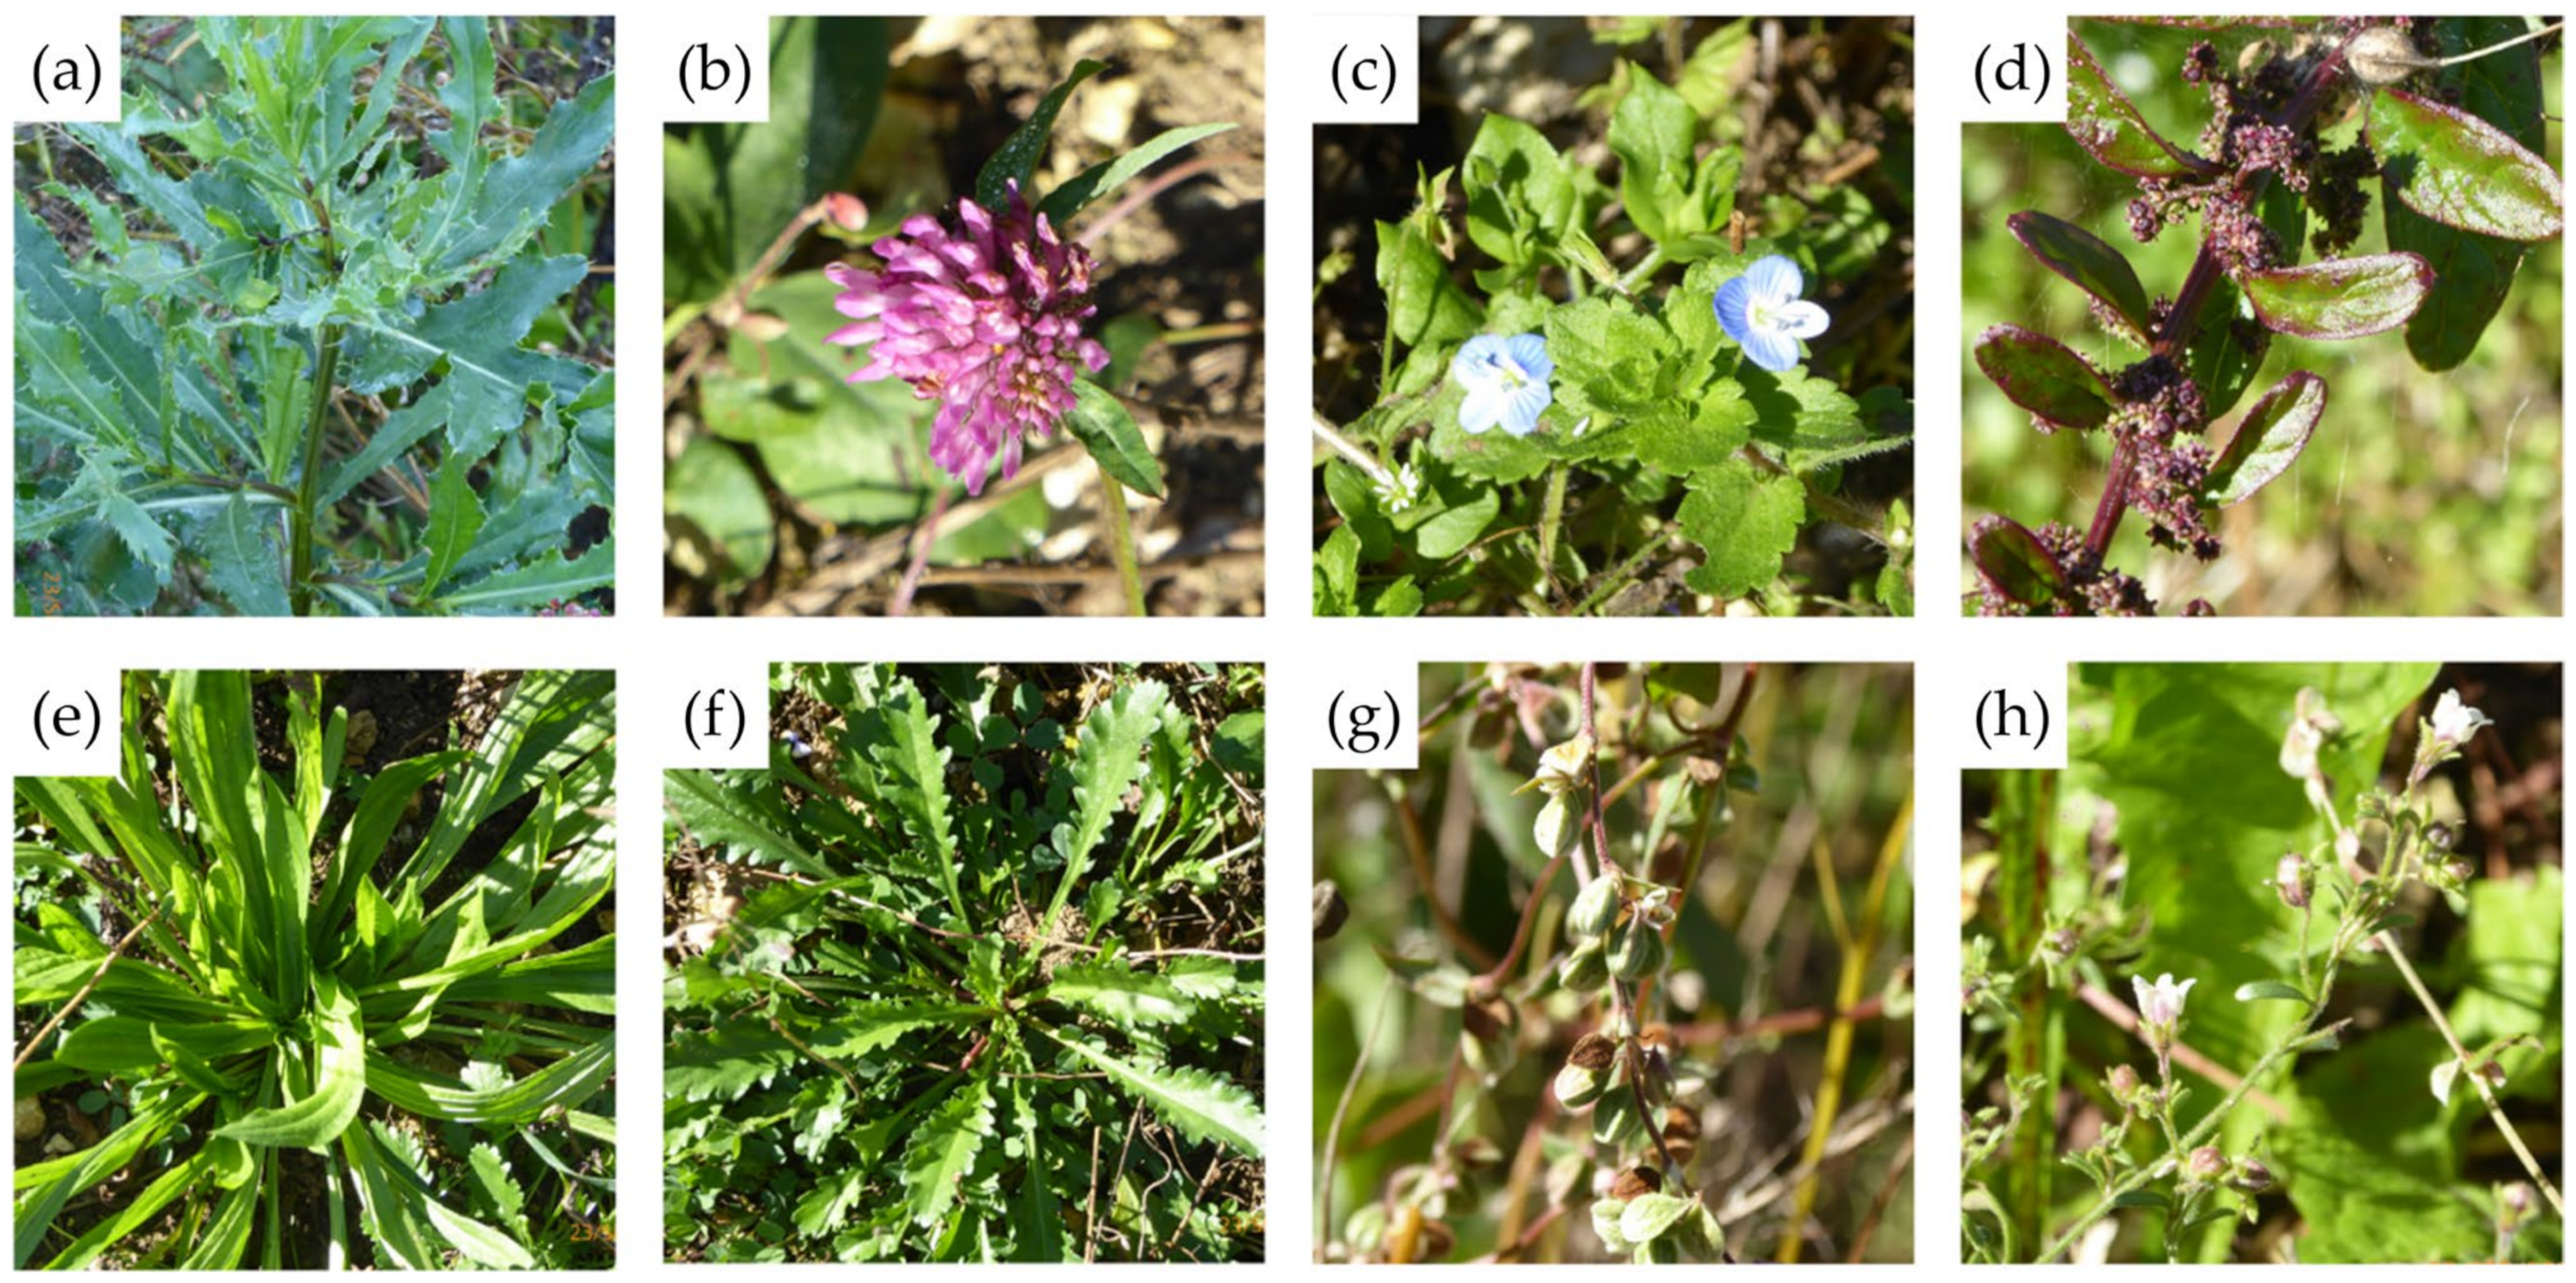
4.1.9. Weed Competition
4.2. Biomass Yield
4.2.1. Stem DM Yield
4.2.2. Grain Yield
4.2.3. Maize
4.3. Outlook and Relevance of the Results of This Study
5. Conclusions
Author Contributions
Funding
Data Availability Statement
Acknowledgments
Conflicts of Interest
Abbreviations
| BBCH | Biologische Bundesanstalt, Bundessortenamt und Chemische Industrie |
| DM | Dry matter |
| GV point | Change in phyllotaxis on the main stem from opposite to alternate |
| Nmin | Amount of mineralized nitrogen |
| MAGIC | Marginal lands for growing industrial crops: Turning a burden into an opportunity |
| MAR | Hemp variety “Markant” |
| PUFA | Polyunsaturated fatty acids |
Appendix A
References
- Hetemäki, L.; Hanewinkel, M.; Muys, B.; Ollikainen, M.; Palahí, M.; Trasobares, A.; European Forest Institute. Leading the Way to a European Circular Bioeconomy Strategy; From Science to Policy; European Forest Institute: Joensuu, Finland, 2017. [Google Scholar]
- Fritsche, U.; Brunori, G.; Chiaramonti, D.; Galanakis, C.; Hellweg, S.; Matthews, R.; Panoutsou, C. Future Transitions for the Bioeconomy towards Sustainable Development and a Climate-Neutral Economy-Knowledge Synthesis Final Report. Available online: https://publications.jrc.ec.europa.eu/repository/handle/JRC121212 (accessed on 13 June 2022).
- Dietz, T.; Börner, J.; Förster, J.J.; Von Braun, J. Governance of the Bioeconomy: A Global Comparative Study of National Bioeconomy Strategies. Sustainability 2018, 10, 3190. [Google Scholar] [CrossRef]
- Directorate-General for Research and Innovation (European Commission). A Sustainable Bioeconomy for Europe: Strengthening the Connection between Economy, Society and the Environment: Updated Bioeconomy Strategy; Publications Office of the European Union: Luxembourg, 2018; ISBN 978-92-79-94144-3. [Google Scholar]
- United Nations. The World Population Prospects: 2015 Revision; United Nations: New York, NY, USA, 2015. [Google Scholar]
- United Nations. UN World Water Development Report 2012; UN-Water 2012; United Nations: New York, NY, USA, 2012. [Google Scholar]
- FNR Bioenergy in Germany Facts and Figures 2020. 2020. Available online: https://www.fnr.de/fileadmin/allgemein/pdf/broschueren/broschuere_basisdaten_bioenergie_2020_engl_web.pdf (accessed on 13 June 2022).
- Amaducci, S.; Scordia, D.; Liu, F.H.; Zhang, Q.; Guo, H.; Testa, G.; Cosentino, S.L. Key Cultivation Techniques for Hemp in Europe and China. Ind. Crops Prod. 2015, 68, 2–16. [Google Scholar] [CrossRef]
- Karus, M.; Vogt, D. European Hemp Industry: Cultivation, Processing and Product Lines. Euphytica 2004, 140, 7–12. [Google Scholar] [CrossRef]
- Von Cossel, M.; Lewandowski, I.; Elbersen, B.; Staritsky, I.; Van Eupen, M.; Iqbal, Y.; Mantel, S.; Scordia, D.; Testa, G.; Cosentino, S.L.; et al. Marginal Agricultural Land Low-Input Systems for Biomass Production. Energies 2019, 12, 3123. [Google Scholar] [CrossRef]
- Andre, C.; Hausman, J.F.; Guerriero, G. Cannabis sativa: The Plant of the Thousand and One Molecules. Front. Plant Sci. 2016, 7, 19. [Google Scholar] [CrossRef]
- Adesina, I.; Bhowmik, A.; Sharma, H.; Shahbazi, A. A Review on the Current State of Knowledge of Growing Conditions, Agronomic Soil Health Practices and Utilities of Hemp in the United States. Agriculture 2020, 10, 129. [Google Scholar] [CrossRef]
- Oomah, B.D.; Busson, M.; Godfrey, D.; Drover, J. Characteristics of Hemp (Cannabis sativa L.) Seed Oil. Food Chem. 2002, 76, 33–43. [Google Scholar] [CrossRef]
- Burgel, L. The Bioeconomy Potential of Hemp (Cannabis sativa L.): Challenges of New Genotypes and Cultivation Systems to Meet the Rising Demand for Phytocannabinoids. Ph.D. Dissertation, University of Hohenheim, Stuttgart, Germany, 2021. Available online: https://hohpublica.uni-hohenheim.de/items/4a1b9484-7c82-41da-aeec-1b5b3aed02c5 (accessed on 23 March 2025).
- MAGIC Project Overview–Magic 2017. Available online: https://magic-h2020.eu/project-overview/ (accessed on 23 March 2025).
- MIDAS Marginal Lands and Industrial Crops for the European Bioeconomy. Available online: https://www.midas-bioeconomy.eu/ (accessed on 21 June 2023).
- Englund, O.; Börjesson, P.; Berndes, G.; Scarlat, N.; Dallemand, J.-F.; Grizzetti, B.; Dimitriou, I.; Mola-Yudego, B.; Fahl, F. Beneficial Land Use Change: Strategic Expansion of New Biomass Plantations Can Reduce Environmental Impacts from EU Agriculture. Glob. Environ. Change 2020, 60, 101990. [Google Scholar] [CrossRef]
- Fritsche, U.R.; Sims, R.E.; Monti, A. Direct and Indirect Land-Use Competition Issues for Energy Crops and Their Sustainable Production–an Overview. Biofuels Bioprod. Biorefining 2010, 4, 692–704. [Google Scholar] [CrossRef]
- Galatsidas, S.; Gounaris, N.; Vlachaki, D.; Dimitriadis, E.; Keramitzis, D.; Gerwin, W.; Repmann, F.; Rettenmaier, N.; Reinhardt, G. Revealing Bioenergy Potentials: Mapping Marginal Lands in Europe-The SEEMLA Approach. In Proceedings of the European Biomass Conference and Exhibition Proceedings 2018 26thEUBCE, Bella Center, Copenhagen, 14–17 May 2018; pp. 31–37. [Google Scholar] [CrossRef]
- Elbersen, B.; Fritsche, U.; Petersen, J.-E.; Lesschen, J.P.; Böttcher, H.; Overmars, K. Assessing the Effect of Stricter Sustainability Criteria on EU Biomass Crop Potential. Biofuels Bioprod. Biorefining 2013, 7, 173–192. [Google Scholar] [CrossRef]
- Gerwin, W.; Repmann, F.; Galatsidas, S.; Vlachaki, D.; Gounaris, N.; Baumgarten, W.; Volkmann, C.; Keramitzis, D.; Kiourtsis, F.; Freese, D. Assessment and Quantification of Marginal Lands for Biomass Production in Europe Using Soil-Quality Indicators. Soil 2018, 4, 267–290. [Google Scholar] [CrossRef]
- Rockström, J.; Gupta, J.; Qin, D.; Lade, S.J.; Abrams, J.F.; Andersen, L.S.; Armstrong McKay, D.I.; Bai, X.; Bala, G.; Bunn, S.E.; et al. Safe and Just Earth System Boundaries. Nature 2023, 619, 102–111. [Google Scholar] [CrossRef]
- Rockström, J.; Steffen, W.; Noone, K.; Persson, Å.; Chapin, F.S.; Lambin, E.F.; Lenton, T.M.; Scheffer, M.; Folke, C.; Schellnhuber, H.J.; et al. A Safe Operating Space for Humanity. Nature 2009, 461, 472–475. [Google Scholar] [CrossRef]
- Confalonieri, R.; Jones, B.; Van Diepen, K.; Van Orshoven, J. Scientific Contribution on Combining Biophysical Criteria Underpinning the Delineation of Agricultural Areas Affected by Specific Constraints: Methodology and Factsheets for Plausible Criteria Combinations; Terres, J.-M., Hagyo, A., Wania, A., Eds.; Publications Office of the European Union: Luxembourg, 2014; ISBN 978-92-79-44340-4. [Google Scholar]
- Von Cossel, M.; Iqbal, Y.; Lewandowski, I. Improving the Ecological Performance of Miscanthus (Miscanthus × Giganteus Greef et Deuter) through Intercropping with Woad (Isatis tinctoria L.) and Yellow Melilot (Melilotus officinalis L.). Agriculture 2019, 9, 194. [Google Scholar] [CrossRef]
- Burland, A.; Cossel, M. Towards Managing Biodiversity of European Marginal Agricultural Land for Biodiversity-Friendly Biomass Production. Agronomy 2023, 13, 1651. [Google Scholar] [CrossRef]
- Von Cossel, M.; Wagner, M.; Lask, J.; Magenau, E.; Bauerle, A.; Von Cossel, V.; Warrach-Sagi, K.; Elbersen, B.; Staritsky, I.; Van Eupen, M.; et al. Prospects of Bioenergy Cropping Systems for a More Social-Ecologically Sound Bioeconomy. Agronomy 2019, 9, 605. [Google Scholar] [CrossRef]
- von Cossel, M.; Iqbal, Y.; Scordia, D.; Cosentino, S.L.; Elbersen, B.; Staritsky, I.; van Eupen, M.; Mantel, S.; Prysiazhniuk, O.; Mailiarenko, O.; et al. Low-Input Agricultural Practices for Industrial Crops on Marginal Land. Project Deliverable, University of Hohenheim, Stuttgart, Germany, 2019. [CrossRef]
- Mueller, L.; Schindler, U.; Behrendt, A.; Eulenstein, F.; Dannowski, R. The Muencheberg Soil Quality Rating (SQR). 2007, p. 103. Available online: https://organic-farmknowledge.org/tool/30579 (accessed on 23 March 2025).
- Orshoven, J.V.; Terres, J.M.; Tóth, T.; Jones, R.; Bas, C.L.; Nachtergaele, F.; Rossiter, D.; van, Orshoven, J.; Schulte, R.; van, Velthuizen, H. Updated Common Bio-Physical Criteria to Define Natural Constraints for Agriculture in Europe:Definition and scientific justification for the common biophysical criteria and Technical Factsheets; Office des Publications Officielles des Communautés Européennes, 2014; Available online: https://publications.jrc.ec.europa.eu/repository/handle/JRC89982 (accessed on 23 March 2025).
- Clark, L.J.; Whalley, W.R.; Barraclough, P.B. How Do Roots Penetrate Strong Soil? Plant Soil 2003, 255, 93–104. [Google Scholar] [CrossRef]
- Place, G.; Bowman, D.; Burton, M.; Rufty, T. Root Penetration through a High Bulk Density Soil Layer: Differential Response of a Crop and Weed Species. Plant Soil 2008, 307, 179. [Google Scholar] [CrossRef]
- Staffas, L.; Gustavsson, M.; McCormick, K. Strategies and Policies for the Bioeconomy and Bio-Based Economy: An Analysis of Official National Approaches. Sustainability 2013, 5, 2751–2769. [Google Scholar] [CrossRef]
- Fernando, A.L.; Boléo, S.; Barbosa, B.; Costa, J.; Duarte, M.P.; Monti, A. Perennial Grass Production Opportunities on Marginal Mediterranean Land. Bioenerg. Res. 2015, 8, 1523–1537. [Google Scholar] [CrossRef]
- Fess, T.L.; Kotcon, J.B.; Benedito, V.A. Crop Breeding for Low Input Agriculture: A Sustainable Response to Feed a Growing World Population. Sustainability 2011, 3, 1742–1772. [Google Scholar] [CrossRef]
- Arthurson, V.; Jäderlund, L. Utilization of Natural Farm Resources for Promoting High Energy Efficiency in Low-Input Organic Farming. Energies 2011, 4, 804–817. [Google Scholar] [CrossRef]
- Dale, V.; Kline, K.; Wiens, J.; Fargione, J. Biofuels: Implications for Land Use and Biodiversity. 2010. Available online: https://www.esa.org/esa/wp-content/uploads/2014/11/ESA-Biofuels-Report-1.pdf (accessed on 1 May 2022).
- Edrisi, S.A.; Abhilash, P.C. Exploring Marginal and Degraded Lands for Biomass and Bioenergy Production: An Indian Scenario. Renew. Sustain. Energy Rev. 2016, 54, 1537–1551. [Google Scholar] [CrossRef]
- Folke, C. Resilience: The Emergence of a Perspective for Social–Ecological Systems Analyses. Glob. Environ. Change 2006, 16, 253–267. [Google Scholar] [CrossRef]
- Biala, K.; Terres, J.-M.; Pointereau, P. Low Input Farming Systems: An Opportunity to Develop Sustainable Agriculture; Publications Office of the European Union: Luxembourg, 2007; ISBN 978-92-79-08007-4. [Google Scholar]
- Tilman, D.; Hill, J.; Lehman, C. Carbon-Negative Biofuels from Low-Input High-Diversity Grassland Biomass. Science 2006, 314, 1598–1600. [Google Scholar] [CrossRef]
- Weigelt, A.; Weisser, W.W.; Buchmann, N.; Scherer-Lorenzen, M. Biodiversity for Multifunctional Grasslands: Equal Productivity in High-Diversity Low-Input and Low-Diversity High-Input Systems. Biogeosciences 2009, 6, 1695–1706. [Google Scholar] [CrossRef]
- Tang, K.; Wang, J.; Yang, Y.; Deng, G.; Yu, J.; Hu, W.; Guo, L.; Du, G.; Liu, F. Fiber Hemp (Cannabis sativa L.) Yield and Its Response to Fertilization and Planting Density in China. Ind. Crops Prod. 2022, 177, 114542. [Google Scholar] [CrossRef]
- Schöberl, V.; Grieb, M.; Fritz, M. Hanf zur stofflichen Nutzung: Stand und Entwicklungen. Available online: https://www.tfz.bayern.de/rohstoffpflanzen/projekte/217210/index.php (accessed on 21 March 2022).
- van der Werf, H.M.G.; Wijlhuizen, M.; de Schutter, J.A.A. Plant Density and Self-Thinning Affect Yield and Quality of Fibre Hemp (Cannabis sativa L.). Field Crops Res. 1995, 40, 153–164. [Google Scholar] [CrossRef]
- Berti, M.; Gesch, R.; Eynck, C.; Anderson, J.; Cermak, S. Camelina Uses, Genetics, Genomics, Production, and Management. Ind. Crops Prod. 2016, 94, 690–710. [Google Scholar] [CrossRef]
- Meier, BBCH Monografie: Monografie: Entwicklungsstadien mono- und dikotyler Pflanzen. 2001. Available online: https://www.openagrar.de/receive/openagrar_mods_00036305 (accessed on 23 March 2025).
- Tilly, N.; Aasen, H.; Bareth, G. Fusion of Plant Height and Vegetation Indices for the Estimation of Barley Biomass. Remote Sens. 2015, 7, 11449–11480. [Google Scholar] [CrossRef]
- Mediavilla, V.; Jorquera, M.; Schmid-Slembrouck, I. Dezimalcode für Wachstumsstadien von Hanf. Available online: https://www.agrarforschungschweiz.ch/1999/10/dezimalcode-fuer-wachstumsstadien-von-hanf/ (accessed on 30 January 2022).
- Mediavilla, V.; Jonquera, M.; Schmid-Slembrouck, I.; Soldati, A. Decimal Code for Growth Stages of Hemp (Cannabis sativa L.). J. Int. Hemp Assoc. 1998, 5, 65–68. [Google Scholar]
- Piepho, H.-P. An Algorithm for a Letter-Based Representation of All-Pairwise Comparisons. J. Comput. Graph. Stat. 2004, 13, 456–466. [Google Scholar] [CrossRef]
- Hall, J.; Bhattarai, S.P.; Midmore, D.J. Effect of Industrial Hemp (Cannabis sativa L.) Planting Density on Weed Suppression, Crop Growth, Physiological Responses, and Fibre Yield in the Subtropics. Renew. Bioresour. 2014, 2, 1. [Google Scholar] [CrossRef]
- Clarke, R.C. Hanf. Botanik, Anbau, Vermehrung, Züchtung (Natur-/Umwelt)-; AT Verlag: Baden, Switzerland, 1997; ISBN 3-85502-573-8. [Google Scholar]
- McPartland, J.M. A Review of Cannabis Diseases. Available online: https://druglibrary.org/olsen/hemp/iha/iha03111.html (accessed on 19 May 2022).
- O’Brien, C.; Arathi, H.S. Bee Diversity and Abundance on Flowers of Industrial Hemp (Cannabis sativa L.). Biomass Bioenergy 2019, 122, 331–335. [Google Scholar] [CrossRef]
- United States Department of Agriculture Soil Texture Calculator|NRCS Soils. Available online: https://www.nrcs.usda.gov/wps/portal/nrcs/detail/soils/survey/?cid=nrcs142p2_054167 (accessed on 29 June 2022).
- Eysholdt-Derzsó, E.; Sauter, M. Root Bending Is Antagonistically Affected by Hypoxia and ERF-Mediated Transcription via Auxin Signaling. Plant Physiol. 2017, 175, 412–423. [Google Scholar] [CrossRef]
- Ruchkina, A.; Ushakov, R.; Golovina, N.; Aseev, V.; Bobrakov, F. Prospects for the Development and Use of a Clay-Nitrogen Mixture as a Fertilizer. E3S Web Conf. 2020, 222, 02043. [Google Scholar] [CrossRef]
- Alhaj Hamoud, Y.; Guo, X.; Wang, Z.; Shaghaleh, H.; Chen, S.; Hassan, A.; Bakour, A. Effects of Irrigation Regime and Soil Clay Content and Their Interaction on the Biological Yield, Nitrogen Uptake and Nitrogen-Use Efficiency of Rice Grown in Southern China. Agric. Water Manag. 2019, 213, 934–946. [Google Scholar] [CrossRef]
- Väderstad Characteristics of Different Soil Types-from Sand to Clay. Available online: https://www.vaderstad.com/en/know-how/basic-agronomy/soil-basics/characteristics-of-different-soil-types/ (accessed on 1 May 2022).
- Williams, D.W.; Mundell, R. An Introduction to Industrial Hemp and Hemp Agronomy. 2018, p. 5. Available online: https://publications.ca.uky.edu/files/ID250.pdf (accessed on 1 May 2022).
- Ivonyi, I.; Izsoki, Z.; van der Werf, H. Influence of Nitrogen Supply and P and K Levels of the Soil on Dry Matter and Nutrient Accumulation of Fibre Hemp (Cannabis sativa L.). J. Int. Hemp Assoc. 1997, 4, 84–89. [Google Scholar]
- Elbersen, B.; Van Eupen, M.; Verzandvoort, S.; Boogaard, H.; Macher, S.; Cicareli, T.; Elbersen, W.; Bai, Z.; Iqbal, Y. D2.6 Methodological Approaches to Identify and Map Marginal Land Suitable for Industrial Crops in Europe. 2018. Available online: https://research.wur.nl/en/publications/deliverable-26-methodological-approaches-to-identify-and-map-marg (accessed on 23 March 2025).
- Amaducci, S.; Zatta, A.; Pelatti, F.; Venturi, G. Influence of Agronomic Factors on Yield and Quality of Hemp (Cannabis sativa L.) Fibre and Implication for an Innovative Production System. Field Crops Res. 2008, 107, 161–169. [Google Scholar] [CrossRef]
- Amaducci, S.; Pelatti, F.; Bonatti, P.M. Fibre Development in Hemp (Cannabis sativa L.) as Affected by Agrotechnique. J. Ind. Hemp 2005, 10, 31–48. [Google Scholar] [CrossRef]
- Amaducci, S.; Errani, M.; Venturi, G. Plant Population Effects on Fibre Hemp Morphology and Production. J. Ind. Hemp 2002, 7, 33–60. [Google Scholar] [CrossRef]
- Westerhuis, W.; van Delden, S.H.; van Dam, J.E.G.; Pereira Marinho, J.P.; Struik, P.C.; Stomph, T.J. Plant Weight Determines Secondary Fibre Development in Fibre Hemp (Cannabis sativa L.). Ind. Crops Prod. 2019, 139, 111493. [Google Scholar] [CrossRef]
- Scordia, D.; Papazoglou, E.; Kotoula, D.; Sanz, M.; Ciria, C.; Pérez, J.; Maliarenko, O.; Prysiazhniuk, O.; von Cossel, M.; Greiner, B.; et al. Towards Identifying Industrial Crop Types and Associated Agronomies to Improve Biomass Production from Marginal Lands in Europe. GCB Bioenergy 2022, 14, 710–734. [Google Scholar] [CrossRef]
- Teuling, A.J. A Hot Future for European Droughts. Nat. Clim. Change 2018, 8, 364–365. [Google Scholar] [CrossRef]
- Halker, C.A.P.; Woodley, A.L.; Reberg-Horton, S.C.; Henriquez Inoa, S.; Suchoff, D.H. Evaluating Chinese Fiber Hemp (Cannabis sativa L.) Varieties and Planting Dates in North Carolina. Agrosystems Geosci. Environ. 2024, 7, e20569. [Google Scholar] [CrossRef]
- Callaway, J.C.; Laakkonen, T.T. Cultivation of Cannabis Oil Seed Varieties in Finland. Available online: http://www.internationalhempassociation.org/jiha/iha03114.html (accessed on 21 June 2022).
- Deferne, J.; Pate, D. Hemp Seed Oil: A Source of Valuable Essential Fatty Acids. J. Int. Hemp Assoc. 1996, 3, 4–7. [Google Scholar]
- Leizer, C.; Ribnicky, D.; Poulev, A.; Dushenkov, V.; Raskin, I. The Composition of Hemp Seed Oil and Its Potential as an Important Source of Nutrition. J. Nutraceuticals Funct. Med. Foods 2000, 2, 35–53. [Google Scholar] [CrossRef]
- Tedeschi, A.; Volpe, M.G.; Polimeno, F.; Siano, F.; Maglione, G.; Di Tommasi, P.; Vasca, E.; Magliulo, V.; Vitale, L. Soil Fertilization with Urea Has Little Effect on Seed Quality but Reduces Soil N2O Emissions from a Hemp Cultivation. Agriculture 2020, 10, 240. [Google Scholar] [CrossRef]
- Stafecka, I.; Stramkale, V.; Stramkalis, A.; Kroica, I.; Ivanovs, S. Impact of the Agro-Environmental Factors on the Seed Yield and Yields Components Productivity of Latvian Original Hemp. J. Res. Appl. Agric. Eng. 2016, 61, 164–167. [Google Scholar]
- Bócsa, I.; Karus, M.; Hemptech (Firm). The Cultivation of Hemp: Botany, Varieties, Cultivation and Harvesting; Hemptech: Sebastopol, CA, USA, 1998; ISBN 978-1-886874-03-9. [Google Scholar]
- Wagner, C. Basics of Industrial Hemp Rev. DRAFT 0.2.3. 2015. Available online: https://www.researchgate.net/publication/273781857_Basics_of_Industrial_Hemp_Rev_DRAFT_023 (accessed on 23 March 2025).
- Desanlis, F.; Cerruti, N.; Warner, P.; Bouloc, P.; Allegret, S.; Arnaud, L. Hemp Agronomics and Cultivation. 2013. Available online: https://www.cabidigitallibrary.org/doi/abs/10.1079/9781845937935.0000 (accessed on 23 March 2025).
- Amaducci, S.; Zatta, A.; Raffanini, M.; Venturi, G. Characterisation of Hemp (Cannabis sativa L.) Roots under Different Growing Conditions. Plant Soil 2008, 313, 227. [Google Scholar] [CrossRef]
- Maximum Yield What Is a Taproot?—Definition from Maximum Yield. Available online: http://www.maximumyield.com/definition/1934/taproot (accessed on 27 June 2022).
- Blandinières, H.; Amaducci, S. Adapting the Cultivation of Industrial Hemp (Cannabis sativa L.) to Marginal Lands: A Review. GCB Bioenergy 2022, 14, 1004–1022. [Google Scholar] [CrossRef]
- Cromack, H.T.H. The Effect of Cultivar and Seed Density on the Production and Fibre Content of Cannabis sativa in Southern England. Ind. Crops Prod. 1998, 7, 205–210. [Google Scholar] [CrossRef]
- Struik, P.C.; Amaducci, S.; Bullard, M.J.; Stutterheim, N.C.; Venturi, G.; Cromack, H.T.H. Agronomy of Fibre Hemp (Cannabis sativa L.) in Europe. Ind. Crops Prod. 2000, 11, 107–118. [Google Scholar] [CrossRef]
- Westerhuis, W.; Amaducci, S.; Struik, P.C.; Zatta, A.; Van Dam, J.E.G.; Stomph, T.J. Sowing Density and Harvest Time Affect Fibre Content in Hemp (Cannabis sativa) through Their Effects on Stem Weight. Ann. Appl. Biol. 2009, 155, 225–244. [Google Scholar] [CrossRef]
- van der Werf, H.M.G.; van Geel, W.C.A.; van Gils, L.J.C.; Haverkort, A.J. Nitrogen Fertilization and Row Width Affect Self-Thinning and Productivity of Fibre Hemp (Cannabis sativa L.). Field Crops Res. 1995, 42, 27–37. [Google Scholar] [CrossRef]
- Amaducci, S.; Colauzzi, M.; Bellocchi, G.; Venturi, G. Modelling Post-Emergent Hemp Phenology (Cannabis sativa L.): Theory and Evaluation. Eur. J. Agron. 2008, 28, 90–102. [Google Scholar] [CrossRef]
- Campiglia, E.; Radicetti, E.; Mancinelli, R. Plant Density and Nitrogen Fertilization Affect Agronomic Performance of Industrial Hemp (Cannabis sativa L.) in Mediterranean Environment. Ind. Crops Prod. 2017, 100, 246–254. [Google Scholar] [CrossRef]
- Finnan, J.; Burke, B. Nitrogen Fertilization to Optimize the Greenhouse Gas Balance of Hemp Crops Grown for Biomass. GCB Bioenergy 2013, 5, 701–712. [Google Scholar] [CrossRef]
- Tang, K.; Struik, P.C.; Yin, X.; Thouminot, C.; Bjelková, M.; Stramkale, V.; Amaducci, S. Comparing Hemp (Cannabis sativa L.) Cultivars for Dual-Purpose Production under Contrasting Environments. Ind. Crops Prod. 2016, 87, 33–44. [Google Scholar] [CrossRef]
- Aubin, M.-P.; Seguin, P.; Vanasse, A.; Tremblay, G.F.; Mustafa, A.F.; Charron, J.-B. Industrial Hemp Response to Nitrogen, Phosphorus, and Potassium Fertilization. Crop Forage Turfgrass Manag. 2015, 1, cftm2015.0159. [Google Scholar] [CrossRef]
- Vera, C.L.; Malhi, S.S.; Phelps, S.M.; May, W.E.; Johnson, E.N. N, P, and S Fertilization Effects on Industrial Hemp in Saskatchewan. Can. J. Plant Sci. 2010, 90, 179–184. [Google Scholar] [CrossRef]
- Papastylianou, P.; Kakabouki, I.; Travlos, I. Effect of Nitrogen Fertilization on Growth and Yield of Industrial Hemp (Cannabis sativa L.). Not. Bot. Horti Agrobot. Cluj-Napoca 2018, 46, 197–201. [Google Scholar] [CrossRef]
- Botanical Life Garden Ltd. European Certified Hemp Seeds. Cannabis 5 Star. 2022. Available online: https://www.cannabis5star.com/eu-certified-industrial-seeds/ (accessed on 23 March 2025).
- Kakabouki, I.; Kousta, A.; Folina, A.; Karydogianni, S.; Zisi, C.; Kouneli, V.; Papastylianou, P. Effect of Fertilization with Urea and Inhibitors on Growth, Yield and CBD Concentration of Hemp (Cannabis sativa L.). Sustainability 2021, 13, 2157. [Google Scholar] [CrossRef]
- Weller, D.E. Self-Thinning Exponent Correlated with Allometric Measures of Plant Geometry. Ecology 1987, 68, 813–821. [Google Scholar] [CrossRef]
- Ranalli, P.; Venturi, G. Hemp as a Raw Material for Industrial Applications. Euphytica 2004, 140, 1–6. [Google Scholar] [CrossRef]
- Carus, M.; Karst, S.; Kauffmann, A.; Hobson, J.; Bertucelli, S. The European Hemp Industry: Cultivation, Processing and Applications for Fibres, Shives and Seeds. Eur. Ind. Hemp Assoc. March 2013, 2013, 1–9. [Google Scholar]
- Amaducci, S.; Errani, M.; Venturi, G. Response of Hemp to Plant Population and Nitrogen Fertilization. Ital. J. Agron. 2002, 6, 103–111. [Google Scholar]
- Prade, T.; Svensson, S.-E.; Andersson, A.; Mattsson, J.E. Biomass and Energy Yield of Industrial Hemp Grown for Biogas and Solid Fuel. Biomass Bioenergy 2011, 35, 3040–3049. [Google Scholar] [CrossRef]
- Tang, K.; Struik, P.C.; Yin, X.; Calzolari, D.; Musio, S.; Thouminot, C.; Bjelková, M.; Stramkale, V.; Magagnini, G.; Amaducci, S. A Comprehensive Study of Planting Density and Nitrogen Fertilization Effect on Dual-Purpose Hemp (Cannabis sativa L.) Cultivation. Ind. Crops Prod. 2017, 107, 427–438. [Google Scholar] [CrossRef]
- Willey, R.W.; Heath, S.B. The Quantitative Relationships Between Plant Population And Crop Yield. In Advances in Agronomy; Brady, N.C., Ed.; Academic Press: Cambridge, MA, USA, 1969; Volume 21, pp. 281–321. [Google Scholar]
- Abro, M.A.; Lecompte, F.; Bardin, M.; Nicot, P.C. Nitrogen Fertilization Impacts Biocontrol of Tomato Gray Mold. Agron. Sustain. Dev. 2014, 34, 641–648. [Google Scholar] [CrossRef]
- Abro, M.A.; Lecompte, F.; Bryone, F.; Nicot, P.C. Nitrogen Fertilization of the Host Plant Influences Production and Pathogenicity of Botrytis Cinerea Secondary Inoculum. Phytopathology 2013, 103, 261–267. [Google Scholar] [CrossRef] [PubMed]
- Giles, J. Nitrogen Study Fertilizes Fears of Pollution. Nature 2005, 433, 791–792. [Google Scholar] [PubMed]
- Legros, S.; Picault, S.; Cerruti, N. Factors Affecting the Yield of Industrial Hemp-Experimental Results from France. In Hemp: Industrial Production and Uses; Bouloc, P., Allegret, S., Arnaud, L., Eds.; CABI: Wallingford, CT, USA, 2013; pp. 72–97. ISBN 978-1-84593-793-5. [Google Scholar]
- Maļceva, M.; Vikmane, M.; Stramkale, V. Changes of Photosynthesis-Related Parameters and Productivity of Cannabis sativa under Different Nitrogen Supply. Env. Exp. Biol. 2011, 9, 61–69. [Google Scholar]
- Vera, C.L.; Malhi, S.S.; Raney, J.P.; Wang, Z.H. The Effect of N and P Fertilization on Growth, Seed Yield and Quality of Industrial Hemp in the Parkland Region of Saskatchewan. Can. J. Plant Sci. 2004, 84, 939–947. [Google Scholar] [CrossRef]
- Dan, A.; Duda, M.; Moldovan, C.; Florian, T. The Influence of Different Seeding Space and Organic Fertilization Level Upon Production and Mass of 1000 Seeds, Recorded in Some Hemp Varieties. Bull. Univ. Agric. Sci. Vet. Med. Cluj-Napoca. Agric. 2014, 71, 44–48. [Google Scholar]
- Höppner, F.; Menge-Hartmann, U. Yield and Quality of Fibre and Oil of Fourteen Hemp Cultivars in Northern Germany at Two Harvest Dates. Landbauforsch. Volkenrode 2007, 57, 219. [Google Scholar]
- Faux, A.-M.; Draye, X.; Lambert, R.; d’Andrimont, R.; Raulier, P.; Bertin, P. The Relationship of Stem and Seed Yields to Flowering Phenology and Sex Expression in Monoecious Hemp (Cannabis sativa L.). Eur. J. Agron. 2013, 47, 11–22. [Google Scholar] [CrossRef]
- Faux, A.-M.; Bertin, P. Modelling Approach for the Quantitative Variation of Sex Expression in Monoecious Hemp (Cannabis sativa L.). Plant Breed. 2014, 133, 782–787. [Google Scholar] [CrossRef]
- Deutsches Maiskomitee e.V. (DMK). Düngung-Deutsches Maiskomitee e.V. (DMK). Available online: https://www.maiskomitee.de/Produktion/D%C3%BCngung (accessed on 3 August 2022).
- Zhu, J.; Kaeppler, S.M.; Lynch, J.P.; Zhu, J.; Kaeppler, S.M.; Lynch, J.P. Topsoil Foraging and Phosphorus Acquisition Efficiency in Maize (Zea mays). Funct. Plant Biol. 2005, 32, 749–762. [Google Scholar] [CrossRef]
- Herrmann, A. Biogas Production from Maize: Current State, Challenges and Prospects. 2. Agronomic and Environmental Aspects. Bioenerg. Res. 2013, 6, 372–387. [Google Scholar] [CrossRef]
- Volkers, K. Auswirkungen einer variierten Stickstoff-Intensität auf Leistung und Stickstoff-Bilanz von Silomais in Monokultur sowie einer Ackerfutterbau-Fruchtfolge auf sandigen Böden Norddeutschlands. 2005. Available online: https://macau.uni-kiel.de/receive/diss_mods_00001507 (accessed on 23 March 2025).
- Villwock, D.; Kurz, S.; Hartung, J.; Müller-Lindenlauf, M. Effects of Stand Density and N Fertilization on the Performance of Maize (Zea mays L.) Intercropped with Climbing Beans (Phaseolus vulgaris L.). Agriculture 2022, 12, 967. [Google Scholar] [CrossRef]
- Deutsches Maiskomitee e.V. (DMK). Flächenerträge von Körnermais Und Silomais in Deutschland-Deutsches Maiskomitee e.V. (DMK). Available online: https://www.maiskomitee.de/Fakten/Statistik/Deutschland/Fl%C3%A4chenertr%C3%A4ge (accessed on 17 July 2022).
- Reynolds, W.D.; Bowman, B.T.; Drury, C.F.; Tan, C.S.; Lu, X. Indicators of Good Soil Physical Quality: Density and Storage Parameters. Geoderma 2002, 110, 131–146. [Google Scholar] [CrossRef]
- Horn, R.; Domżżał, H.; Słowińska-Jurkiewicz, A.; van Ouwerkerk, C. Soil Compaction Processes and Their Effects on the Structure of Arable Soils and the Environment. Soil Tillage Res. 1995, 35, 23–36. [Google Scholar] [CrossRef]


| Year | 2018 | 2019 | 2020 | 2021 |
|---|---|---|---|---|
| Precipitation sum (mm) | 605.7 | 1074.7 | 819.3 | 933.1 |
| Average temperature 2 m above soil (°C) | 9.1 | 8.6 | 8.9 | 7.5 |
| Global radiation (kWh/m2) | 1303 | 1244 | 815 | 1286 |
| Year | N Fertilizer Levels |
|---|---|
| 2018 | 0 kg, 40 kg, 80 kg, 120 kg |
| 2019 | 40 kg, 120 kg |
| 2020 | 40 kg, 120 kg |
| 2021 | 40 kg, 120 kg |
| Stage | Description |
|---|---|
| 0 | Germination |
| 1 | Leaf development (main shoot) |
| 2 | Growth in length (main shoot), tillering |
| 3 | Stem elongation |
| 4 | Booting |
| 5 | Inflorescence emergence, heading |
| 6 | Flowering |
| 7 | Development of fruit |
| 8 | Ripening of fruit and seeds |
| 9 | Senescence |
| Stage | Description |
|---|---|
| 0 | Germination and emergence |
| 1 | Vegetative stage |
| 2 | Flowering and seed |
| 3 | Senescence |
| Stage | Description |
|---|---|
| 0002 | Emergence of hypocotyl |
| 2000 | GV point |
| 2102 | Flowering staminate flower |
| 2202 | Flowering female flower |
| 2302 | Monoecious flowering |
| 2204 or 2306 | Seed maturity |
| Harvest Date | Row Distances | Number of Rows | Row Width | Row Length | Sample Area |
|---|---|---|---|---|---|
| 20 September 2018 | 15 cm | 4, 5, 9 | 0.15 m | 1 m | 0.56 m2, 0.7 m2, 1.26 m2 |
| 20 September 2018 | 45 cm | 1 | 0.45 m | 3 m | 1.35 m2 |
| 2 October 2019 | 15 cm | 2 | 0.15 m | 1 m | 0.28 m2 |
| 2 October 2019 | 45 cm | 2 | 0.45 m | 1 m | 0.9 m2 |
| 1 October 2020 | 15 cm | 8 (2 × 4) | 0.15 m | 0.5 m | 0.6 m2 |
| 1 October 2020 | 45 cm | 2 (2 × 1) | 0.45 m | 1 m | 0.9 m2 |
| 18 October 2021 | 15 cm | 1 | 0.15 m | 1 m | 0.15 m2 |
| 18 October 2021 | 45 cm | 4 | 0.45 m | 0.5 m | 0.9 m2 |
| Year | Height | Number of Plants | FM Sample Area | FM Weight Grain | FM Weight Stem | FM Weight Grain and Leaves | FM Weight Roots |
|---|---|---|---|---|---|---|---|
| 2018 | x | x | x | x | x | ||
| 2019 | x | x | x | x | x | ||
| 2020 | x | x | x | x | x | ||
| 2021 | x | x | x | x | x | x |
| Year | Texture (in %) | NO3-N (kg/ha) | NH4-N (kg/ha) | Nmin total (kg/ha) | K2O (mg/100 g Soil) | P2O5 (mg/100 g Soil) | pH | ||
|---|---|---|---|---|---|---|---|---|---|
| Clay | Sand | Silt | |||||||
| 2020 | 43.7 | 12.2 | 44.1 | 43.5 | 22.9 | 66.4 | 15.8 | 46.6 | 7.2 |
| 2021 | - | - | - | 53.5 | 9.1 | 62.7 | - | - | - |
| Effect | Plant Height | Stand Density | Stem DM | Grain DM | Crude Fat |
|---|---|---|---|---|---|
| Row width | 0.0412 | 0.0645 | 0.2136 | 0.9178 | 0.5896 |
| Fertilization | 0.1832 | 0.9655 | 0.2306 | 0.072 | 0.3588 |
| Row width × Fertilization | 0.3693 | 0.532 | 0.2892 | 0.453 | 0.8468 |
| Treatment | Biomass Fraction (%) | Root DM Yield (Mg/ha) |
|---|---|---|
| 15 cm—40 kg N | 25.8 | 1.2 |
| 15 cm—120 kg N | 20.9 | 1.5 |
| 45 cm—40 kg N | 25.8 | 0.3 |
| 45 cm—120 kg N | 22.4 | 0.4 |
| Average | 23.7 | 0.9 |
| Row Width 1 | Fertilization 1 | Row Width 2 | Fertilization 2 | Pr > |t| |
|---|---|---|---|---|
| 15 cm | 120 kg | 15 cm | 40 kg | 0.0313 |
| 15 cm | 120 kg | 45 cm | 120 kg | 0.0003 |
| 15 cm | 120 kg | 45 cm | 40 kg | 0.0003 |
| 15 cm | 40 kg | 45 cm | 120 kg | 0.0085 |
| 15 cm | 40 kg | 45 cm | 40 kg | 0.0090 |
| 45 cm | 120 kg | 45 cm | 40 kg | 0.9658 |
| Row Width 1 | Fertilization 1 | Row Width 2 | Fertilization 2 | Pr > |t| |
|---|---|---|---|---|
| 15 cm | 120 kg | 15 cm | 40 kg | 0.6984 |
| 15 cm | 120 kg | 45 cm | 120 kg | 0.0419 |
| 15 cm | 120 kg | 45 cm | 40 kg | 0.0455 |
| 15 cm | 40 kg | 45 cm | 120 kg | 0.0443 |
| 15 cm | 40 kg | 45 cm | 40 kg | 0.0482 |
| 45 cm | 120 kg | 45 cm | 40 kg | 0.5233 |
| Row Width 1 | Fertilization 1 | Row Width 2 | Fertilization 2 | Pr > |t| |
|---|---|---|---|---|
| 15 | 120 | 15 | 40 | 0.1476 |
| 15 | 120 | 45 | 120 | 0.0803 |
| 15 | 120 | 45 | 40 | 0.4103 |
| 15 | 40 | 45 | 120 | 0.0507 |
| 15 | 40 | 45 | 40 | 0.0370 |
| 45 | 120 | 45 | 40 | 0.2965 |
| Treatment | Percentage of Stones in Topsoil Sample (%) | Standard Deviation (%) |
|---|---|---|
| 15 cm—40 kg N/ha | 13.7 | 2.7 |
| 15 cm—120 kg N/ha | 10.4 | 2.5 |
| 45 cm—40 kg N/ha | 13.4 | 1.5 |
| 45 cm—120 kg N/ha | 16.9 | 3.5 |
| Mean value | 13.6 |
| Fatty Acids | Components (in % w/w) as Reported by [71,72] | Components (in % w/w) as Reported by [73] | Components (in % w/w) of This Study (Average Across All Treatments) |
|---|---|---|---|
| Linoleic acid (18:2ω6) | 50–70 | 52–62 | 57.0 |
| α-Linolenic acid (18:3ω3) | 15–25 | 12–23 | 15.1 |
| Palmitic acid (16:0) | 6–9 | 5–7 | 6.3 |
| Eicosanoic acid (20:0) | 0.79–0.81 | 0.39–0.79 | 1.9 |
| Eicosenoic acid (20:1) | 0.39–0.41 | 0.51 | 0.4 |
| Source | Plant Height in cm |
|---|---|
| Results (40 kg N) | ~167.75 |
| Results (120 kg N) | ~187.09 |
| Results (15 cm) | ~161.97 |
| Results (45 cm) | ~192.87 |
| Reported by [92] (0 kg N) | 166 |
| Reported by [92] (240 kg N) | 176 |
| Reported by [93] | 300–350 |
| Source | Stem DM Yield in Mg/ha |
|---|---|
| Results (40 kg N) | 5.1 |
| Results (120 kg N) | 6.1 |
| Reported by [89] in the Czech Republic | 10.9 |
| Reported by [89] in France | 7.0 |
| Reported by [89] in Italy | 4.4 |
| Reported by [89] in Latvia | 9.8 |
| Reported by [97] | 7.3 |
| Source | Grain Yield in Mg/ha |
|---|---|
| Results (40 kg N) | 1.35 |
| Results (120 kg N) | 1.62 |
| Results (15 cm) | 1.59 |
| Results (45 cm) | 1.38 |
| Reported by [89] in the Czech Republic | 1.50 |
| Reported by [89] in France | 0.50 |
| Reported by [89] in Italy | 1.10 |
| Reported by [89] in Latvia | 1.40 |
| Reported by [109] | 0.25 |
| Year | DM Yield Stem and Leaves of Maize in Mg/ha | Dry Matter Silage Maize Yields (Incl. Biogas Use) in Mg/ha in Baden-Württemberg | Dry Matter Silage Maize Yields (Incl. Biogas Use) in Mg/ha (Total Germany) |
|---|---|---|---|
| 2017 | - | 16.996 | 16.611 |
| 2018 | - | 15.323 | 12.352 |
| 2019 | - | 16.695 | 13.65 |
| 2020 | 19.189 | 15.719 | 14.837 |
| 2021 | 17.774 | 16.650 | 16.531 |
Disclaimer/Publisher’s Note: The statements, opinions and data contained in all publications are solely those of the individual author(s) and contributor(s) and not of MDPI and/or the editor(s). MDPI and/or the editor(s) disclaim responsibility for any injury to people or property resulting from any ideas, methods, instructions or products referred to in the content. |
© 2025 by the authors. Licensee MDPI, Basel, Switzerland. This article is an open access article distributed under the terms and conditions of the Creative Commons Attribution (CC BY) license (https://creativecommons.org/licenses/by/4.0/).
Share and Cite
Greiner, B.E.; Kunisch, J.; Krauße, G.; Thiel, T.; Schwadorf, K.; von Cossel, M. Fiber Hemp Biomass Yield and Quality on Shallow Stony Soil in Southwest Germany. Land 2025, 14, 720. https://doi.org/10.3390/land14040720
Greiner BE, Kunisch J, Krauße G, Thiel T, Schwadorf K, von Cossel M. Fiber Hemp Biomass Yield and Quality on Shallow Stony Soil in Southwest Germany. Land. 2025; 14(4):720. https://doi.org/10.3390/land14040720
Chicago/Turabian StyleGreiner, Beatrice E., Jana Kunisch, Galina Krauße, Theresa Thiel, Klaus Schwadorf, and Moritz von Cossel. 2025. "Fiber Hemp Biomass Yield and Quality on Shallow Stony Soil in Southwest Germany" Land 14, no. 4: 720. https://doi.org/10.3390/land14040720
APA StyleGreiner, B. E., Kunisch, J., Krauße, G., Thiel, T., Schwadorf, K., & von Cossel, M. (2025). Fiber Hemp Biomass Yield and Quality on Shallow Stony Soil in Southwest Germany. Land, 14(4), 720. https://doi.org/10.3390/land14040720