Article

Home Elevation Decisions in Post-Disaster Recovery: Social Vulnerability, Policy Gaps, and Lessons from Houston

1
Landscape Architecture & Urban Planning, Texas A&M University, 789 Ross Street, College Station, TX 77840, USA
2
Department of Landscape Architecture, University of Urbana Champaign, Cunningham, 611 Lorado Taft Dr Suite 101, Champaign, IL 61820, USA
3
Texas Housers, 20 N. Sampson St., Houston, TX 77003, USA
*
Author to whom correspondence should be addressed.
Land 2025, 14(4), 689; https://doi.org/10.3390/land14040689
Submission received: 31 January 2025 / Revised: 20 March 2025 / Accepted: 22 March 2025 / Published: 25 March 2025

Abstract

:
This study examines the factors influencing home elevation decisions among participants in Houston’s Homeowner Assistance Program (HoAP) and the Texas General Land Office’s Homeowner Assistance Program (HAP) in the aftermath of Hurricane Harvey and other flood events. Using a mixed-methods approach, we conducted surveys and semi-structured interviews with 50 homeowners, supplemented by secondary data analyses of program records and GIS-based flood risk assessments. Additionally, 25 undergraduate students engaged in a structured field trip, conducting site observations, interacting with residents, and discussing home elevation with experts. The findings reveal disparities in home elevation outcomes, with lower completion rates in socially vulnerable neighborhoods despite program eligibility. The study also identifies key factors influencing elevation decisions, including mobility concerns, financial constraints, neighborhood esthetics, and perceptions of long-term flood risk. Homeowners aged 60–79 were more likely to elevate their homes, while individuals with disabilities faced additional barriers. This research highlights the need for targeted policy interventions to improve program equity and ensure that vulnerable populations receive adequate support. Beyond its case study implications, this research contributes to broader discussions on disaster recovery, climate adaptation, and urban resilience. It also serves as a model for integrating student learning into community-based participatory research. While this study is limited in scope, it offers insights into the intersection of social vulnerability and housing adaptation, informing future policy efforts to enhance flood resilience in historically marginalized communities.

1. Introduction

Hurricane Harvey made landfall on 25 August 2017, bringing unprecedented rainfall and catastrophic flooding to Houston and the surrounding region. As one of the costliest natural disasters in U.S. history, Harvey caused widespread damage, displacing thousands of residents and affecting over 300,000 structures. Houston’s vulnerability to flooding is largely due to its low-lying topography, rapid urban development, and proximity to the Gulf of Mexico/America. The city’s extensive bayou system, which historically managed stormwater, has been strained by increasing impermeable surfaces and inadequate drainage infrastructure, exacerbating flood risks. These geographic and environmental factors make Houston an essential case study for understanding flood resilience and home elevation policies.
Disasters do not impact all communities equally, and Hurricane Harvey exposed stark disparities in recovery outcomes. Low-income and historically marginalized communities often lack the financial resources, political influence, and infrastructure necessary for effective disaster mitigation. These communities are more likely to be located in flood-prone areas and to experience barriers in accessing government assistance. Addressing these inequalities requires targeted policies that not only provide financial aid but also ensure equitable access to home elevation and reconstruction programs.
In response to Harvey, federal, state, and local agencies implemented home elevation policies to reduce future flood risk. Two major programs—the City of Houston’s Homeowner Assistance Program (HoAP) and the Texas General Land Office’s (GLO) Homeowner Assistance Program (HAP)—were established to support home repair, reconstruction, and elevation. These programs were intended to increase flood resilience by elevating homes in flood-prone areas, yet disparities in program participation and completion rates persist. This raises critical questions about the factors influencing homeowners’ decisions to elevate their homes and the extent to which these programs are effectively reaching vulnerable populations. This research addresses four key research questions:
  • How does the demographic makeup of Houston correlate with disaster vulnerability?
  • Which social, personal, and demographic factors influence home elevation among participants in home repair programs?
  • What are the practical considerations and perceptions of flood risks that influence homeowners’ decisions to elevate their homes?
Despite growing research on climate adaptation and disaster mitigation, relatively little attention has been paid to structured home elevation programs within government-funded post-disaster recovery efforts. While studies have examined large-scale flood mitigation strategies and individual homeowner resilience, there is a gap in understanding regarding how elevation programs function in practice, particularly in urban environments like Houston. This research fills that gap by analyzing how homeowners navigate these programs, assess risks, and make elevation decisions.
To explore these issues, we employed a mixed-methods approach, combining surveys and semi-structured interviews with 50 homeowners who participated in home repair programs. Additionally, 25 undergraduate students from Texas A&M University visited affected neighborhoods, engaging with residents, and asked questions of two elevation experts in a recorded lecture discussion.
The findings indicate that home repair completion rates were lower in socially vulnerable neighborhoods, highlighting disparities in program accessibility and implementation. Among the surveyed homeowners, 70.27% of those aged 60–79 opted for home elevation, particularly in frequently flooded areas. Key factors influencing elevation decisions included accessibility concerns, neighborhood esthetics, and perceptions of elevation effectiveness. While some residents viewed elevation as a crucial mitigation strategy, others were hesitant due to financial constraints, skepticism about structural integrity, or concerns over the visual impact on their neighborhood.
This study contributes to the broader discourse on climate adaptation, disaster recovery, and housing resilience by identifying policy gaps in home elevation assistance programs. It underscores the need for more tailored outreach and equitable distribution of resources to flood-prone communities. While limited in scope, this research serves as a pilot study to support future investigations into the intersection of social vulnerability and housing adaptation. These findings provide valuable insights for policymakers, planners, and scholars working to improve disaster mitigation strategies. Additionally, this study demonstrates the value of integrating student learning into community-based research, offering a model for applied, transdisciplinary engagement in urban planning and disaster resilience studies.

1.1. Literature Review

Houston’s demographic composition is highly diverse, with significant Hispanic, African American, and immigrant populations. Many of these communities reside in economically disadvantaged neighborhoods that lack adequate infrastructure and resources, making them more vulnerable to disasters. Socioeconomic disparities, language barriers, and limited access to healthcare and transportation contribute to unequal disaster preparedness, responses, and recovery efforts [1].
Research shows that low-income neighborhoods in Houston tend to be located at lower elevations, making them more susceptible to flooding. Even when accounting for latitude, longitude, and population density, these communities experience a higher flood risk due to historical patterns of development and disinvestment [2]. Using Google Maps and American Community Survey data, Lu (2017) found that lower median household incomes, higher poverty rates, and a greater percentage of ethnic minorities and non-citizens were correlated with lower neighborhood elevations [2]. This spatial inequality is not unique to Houston; similar trends are observed in other major U.S. metropolitan areas, revealing a broader pattern of environmental injustice that disproportionately exposes marginalized communities to flood hazards.
Zahran et al. (2008) further established that socially vulnerable populations in Eastern Texas suffered higher casualty rates during floods [3]. Their study highlights that while mitigation efforts can reduce risk, socioeconomic factors significantly influence survival outcomes. Communities with greater resources and political capital tend to recover faster, while low-income residents often struggle to access disaster aid and rebuilding programs.
International studies have examined individual decision-making in flood risk mitigation, particularly in relation to home elevation. Grothmann and Reusswig (2006) found that in Germany, personal risk perception and belief in the effectiveness of mitigation measures were key drivers behind decisions to elevate homes or implement flood-resistant modifications [4]. In France, Poussin et al. (2014) combined survey and preference data to analyze flood mitigation adoption rates, revealing that households were more likely to take action when they perceived a direct benefit [5].
Botzen et al. (2013) studied homeowners in the Netherlands and found that 52% were willing to invest USD 10,000 in elevation measures to protect their properties [6]. Their findings also suggest that homeowners prefer physical flood protections over financial mechanisms such as insurance, emphasizing a willingness to pay for certainty in risk reduction.
While these studies provide insights into flood mitigation behaviors globally, they do not address homeowners already enrolled in a structured reconstruction program with elevation options. Understanding these decision-making processes within government-backed programs is crucial in designing effective disaster resilience policies.
Previous research has highlighted the importance of federal and local mitigation grants in making home elevation financially feasible [7]. Programs such as FEMA’s Hazard Mitigation Grant Program (HMGP), Flood Mitigation Assistance Program (FMA), and Pre-Disaster Mitigation Grant Program (PDM) provide funding to help homeowners elevate their properties. However, access to these funds is often inequitable, with low-income homeowners facing bureaucratic barriers, a lack of information, and financial limitations that prevent them from fully utilizing the available resources [8,9].
The Homeowner Assistance Program (HAP) in Houston is an example of a large-scale government initiative aimed at flood resilience. However, disparities in program outcomes suggest the inequitable distribution of resources, with some communities benefiting more than others. This study investigates how program participants perceive and navigate home elevation decisions, contributing to a deeper understanding of the barriers and incentives within structured recovery programs.
Flooding in Houston is a combined result of natural vulnerability and urban development patterns. The city’s flat coastal geography and proximity to the Gulf of Mexico inherently expose it to high flood risks [10]. However, the rapid urban expansion since the mid-20th century has exacerbated these risks, with unchecked development reducing the natural drainage capacity and straining the existing infrastructure [11].
Hurricane Harvey (25 August–3 September 2017) serves as a landmark event in Houston’s flood history. The storm dumped an estimated 27 trillion gallons of rain over Texas, leading to catastrophic flooding that damaged over 300,000 structures and displaced more than 30,000 residents in Houston alone [12]. The economic damages reached approximately USD 125 billion, making Harvey one of the costliest disasters in U.S. history [13].
The aftermath of Harvey exposed systemic weaknesses in Houston’s flood management policies. Many affected residents struggled to access assistance programs, while outdated floodplain maps and inconsistent building regulations failed to prevent new construction in high-risk areas [14]. Although FEMA and the Texas General Land Office have since revised floodplain designations and elevation requirements, the effectiveness of these changes remains a subject of ongoing debate.
Houston’s floodplains are mapped by FEMA, and these maps are updated regularly to reflect changes in topography, hydrology, and urban development. However, the fast-changing nature of land use, climate, and storm patterns means that these maps can quickly become outdated, making flood risk assessment and management challenging. The discrepancies in mapped versus actual flood risks create uncertainty for homeowners when deciding whether to elevate their homes or take other protective measures.

1.2. Research Gap

While numerous studies have explored flood risk perception and mitigation strategies, there is limited research on how homeowners make elevation decisions within structured reconstruction programs. By examining Houston’s Homeowner Assistance Program (HoAP) and Texas General Land Office’s Homeowner Assistance Program (HAP), this study contributes to the broader discourse on climate adaptation, social vulnerability, and disaster resilience planning. Understanding who chooses to elevate, why, and what challenges they face is essential in designing equitable and effective housing recovery programs in flood-prone communities.

2. Materials and Methods

2.1. Study Site and Access

Houston, Texas, exemplifies the tension between rapid urban expansion and vulnerability to natural hazards, particularly flooding. The city’s geographic and topographic features, combined with rapid development and inadequate drainage infrastructure, have exacerbated its susceptibility to severe flood events. For this study, we purposefully selected Houston due to its frequent flooding, its diverse population, and the availability of structured home repair and elevation assistance programs following Hurricane Harvey.
Our research focused on participants in home repair programs targeting flood-prone neighborhoods. These communities are characterized by socioeconomic disparities, a mix of long-term residents and transient populations, and varying degrees of flood risk awareness. The diverse social and economic conditions in these neighborhoods influence residents’ access to recovery programs and their decision-making processes regarding home elevation.
To facilitate community engagement and research participation, we partnered with Texas Housers, a nonprofit advocating for housing justice and disaster recovery for low-income households. Their established relationships within these neighborhoods helped build trust with residents, many of whom were initially hesitant to participate in research activities. Texas Housers also assisted in identifying and recruiting program participants, ensuring that the study reflected the perspectives of those most affected by flood-related displacement and home repair challenges.

2.2. Data Collection

2.2.1. Field Trip

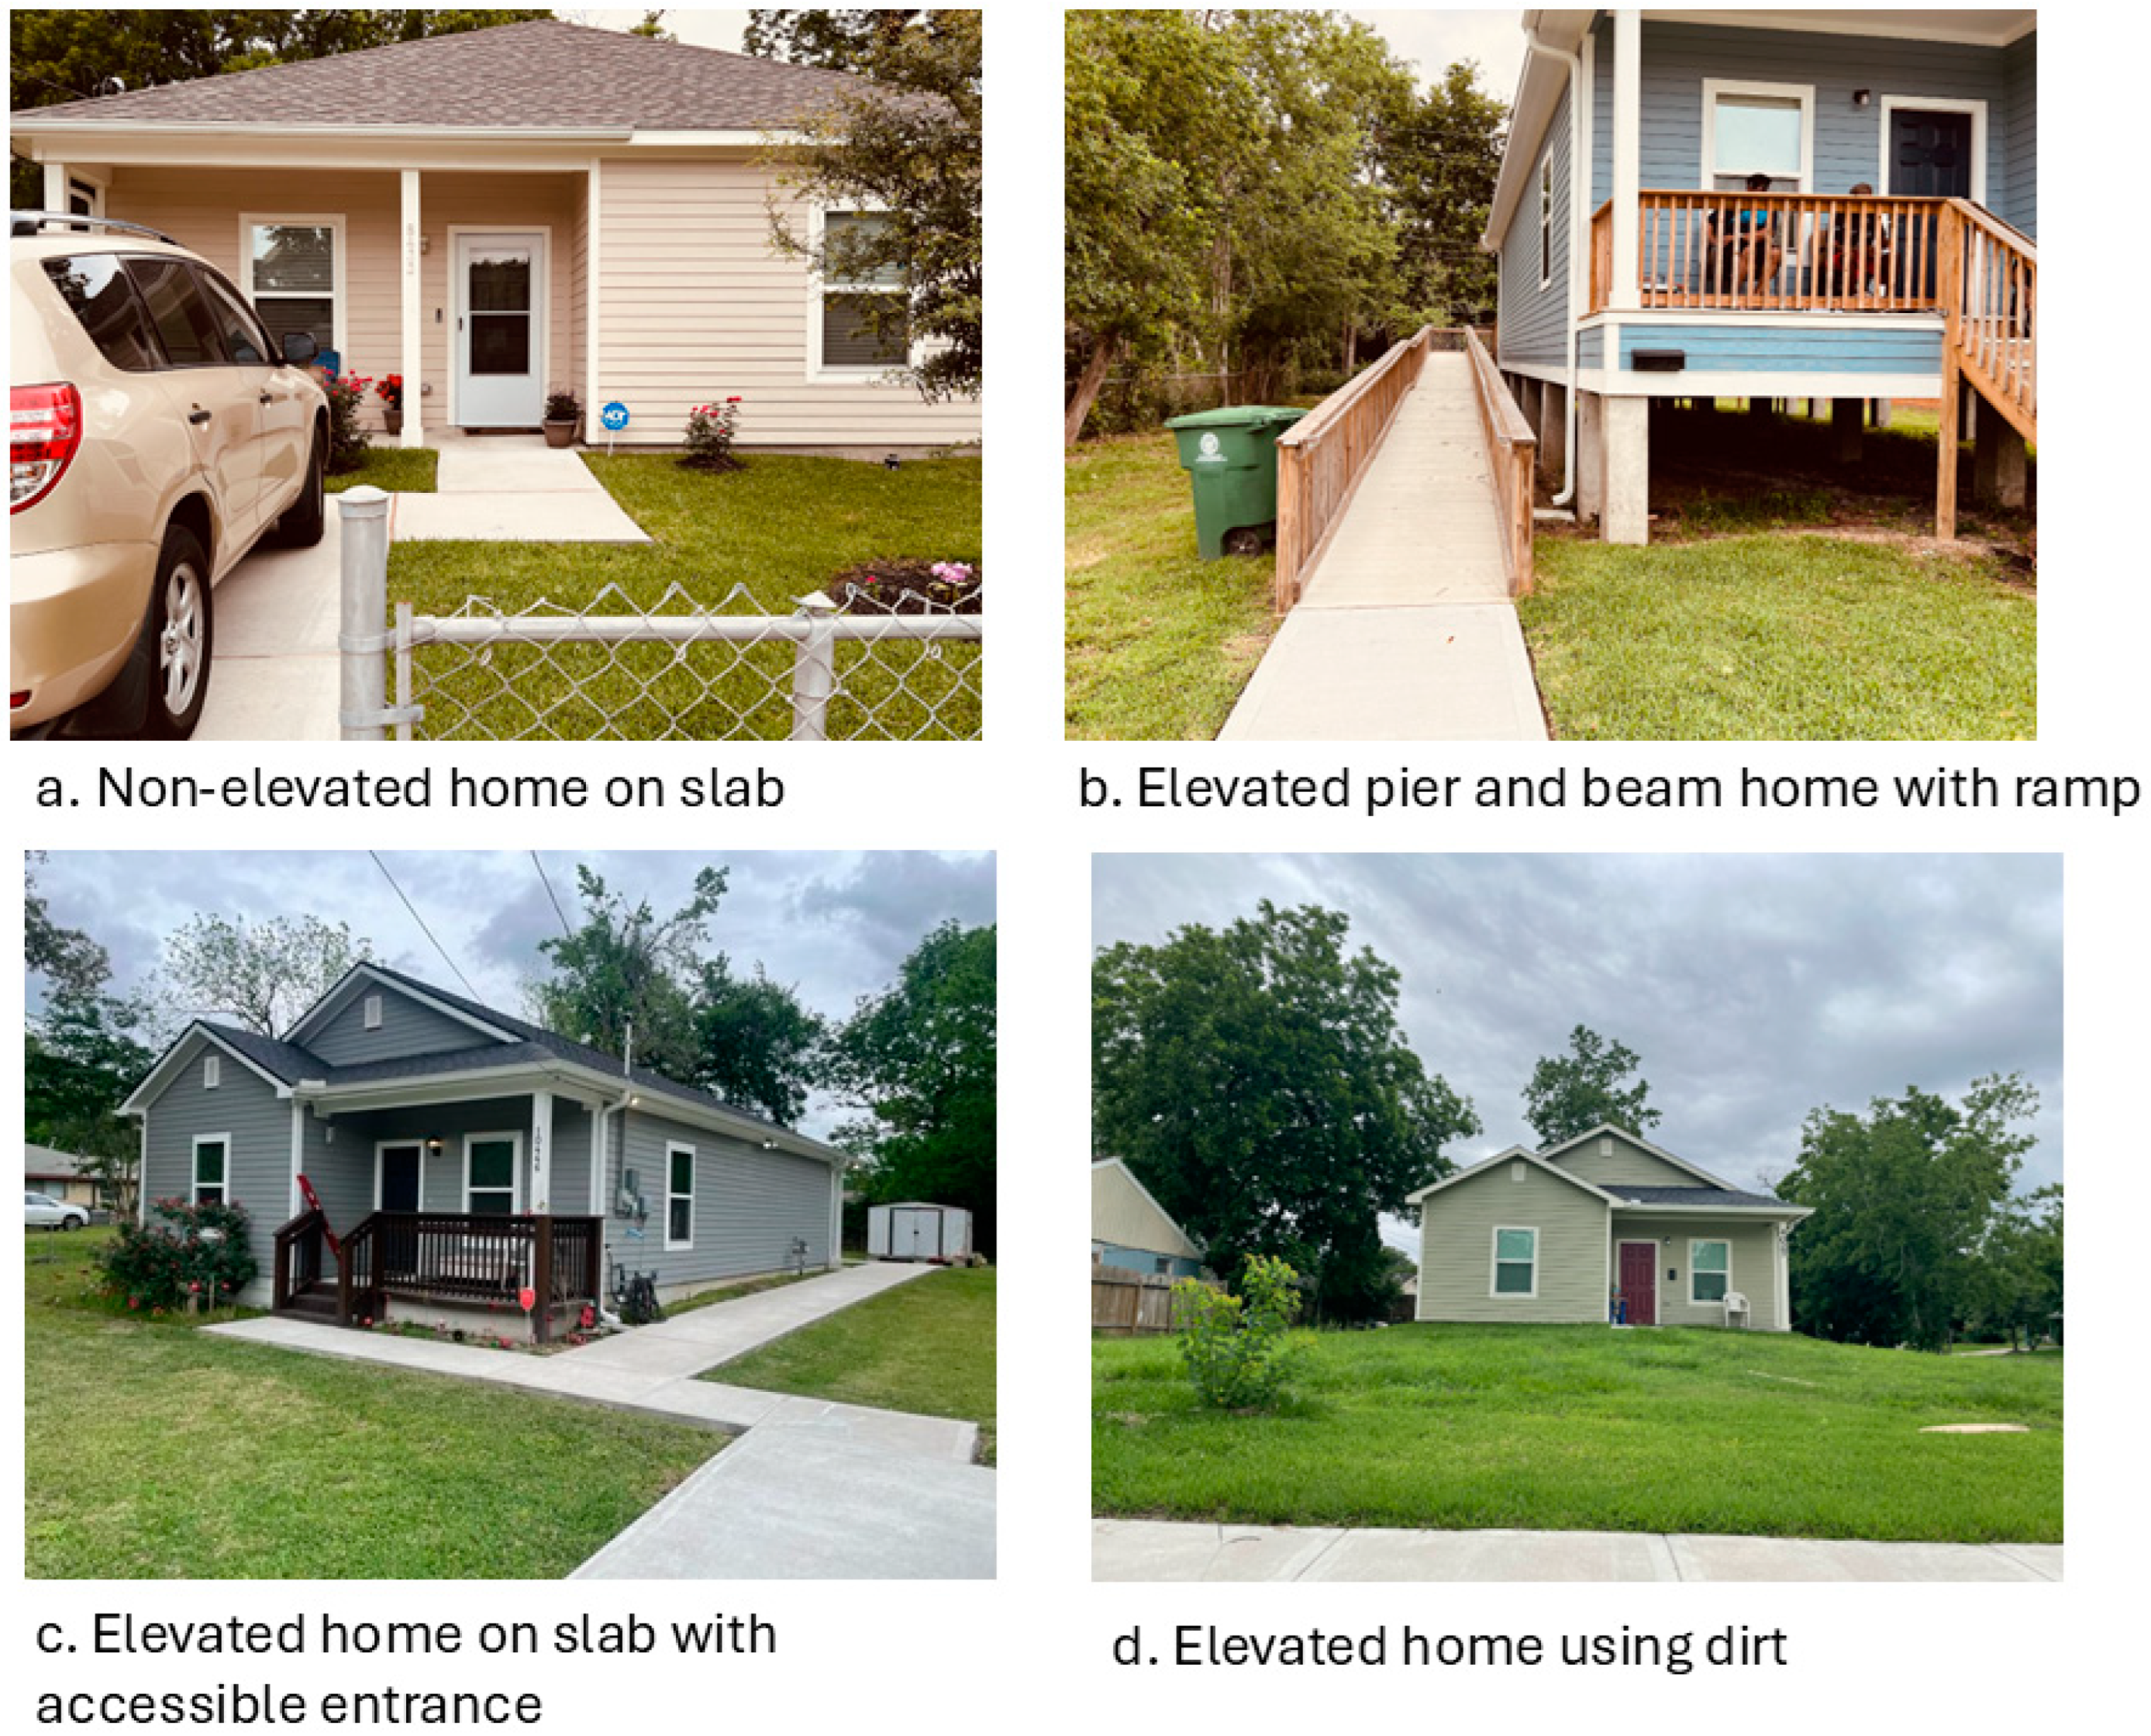
As part of this study, 25 undergraduate students from Texas A&M University’s Urban and Regional Studies Capstone Course, accompanied by two faculty members, conducted a structured field trip to one of the thirteen flood-affected neighborhoods. Neighborhoods were selected based on their proximity to flood-prone bayous and high concentrations of homes eligible for elevation programs. During this one day, 8 to 10 h field trip on 29 February 2024, students engaged in direct observations of flood-damaged homes and elevated structures. They also engaged in informal conversations (not recorded) with seven homeowners about their flood experiences and perspectives on home elevation. (Faculty members formally interviewed these participants). Faculty also involved students in a recorded lecture with two elevation specialists, who provided a technical overview of elevation methods and financial considerations for affected homeowners. Students were able to ask open-ended questions.
Students also met with representatives from Texas Housers, who facilitated access to four program participants and arranged site visits to homes undergoing elevation or reconstruction. The field trip provided valuable firsthand insights into the physical, financial, and emotional challenges related to home elevation and reinforced students’ understanding of community-based research in disaster recovery planning.

2.2.2. Secondary Data Collection and Analysis

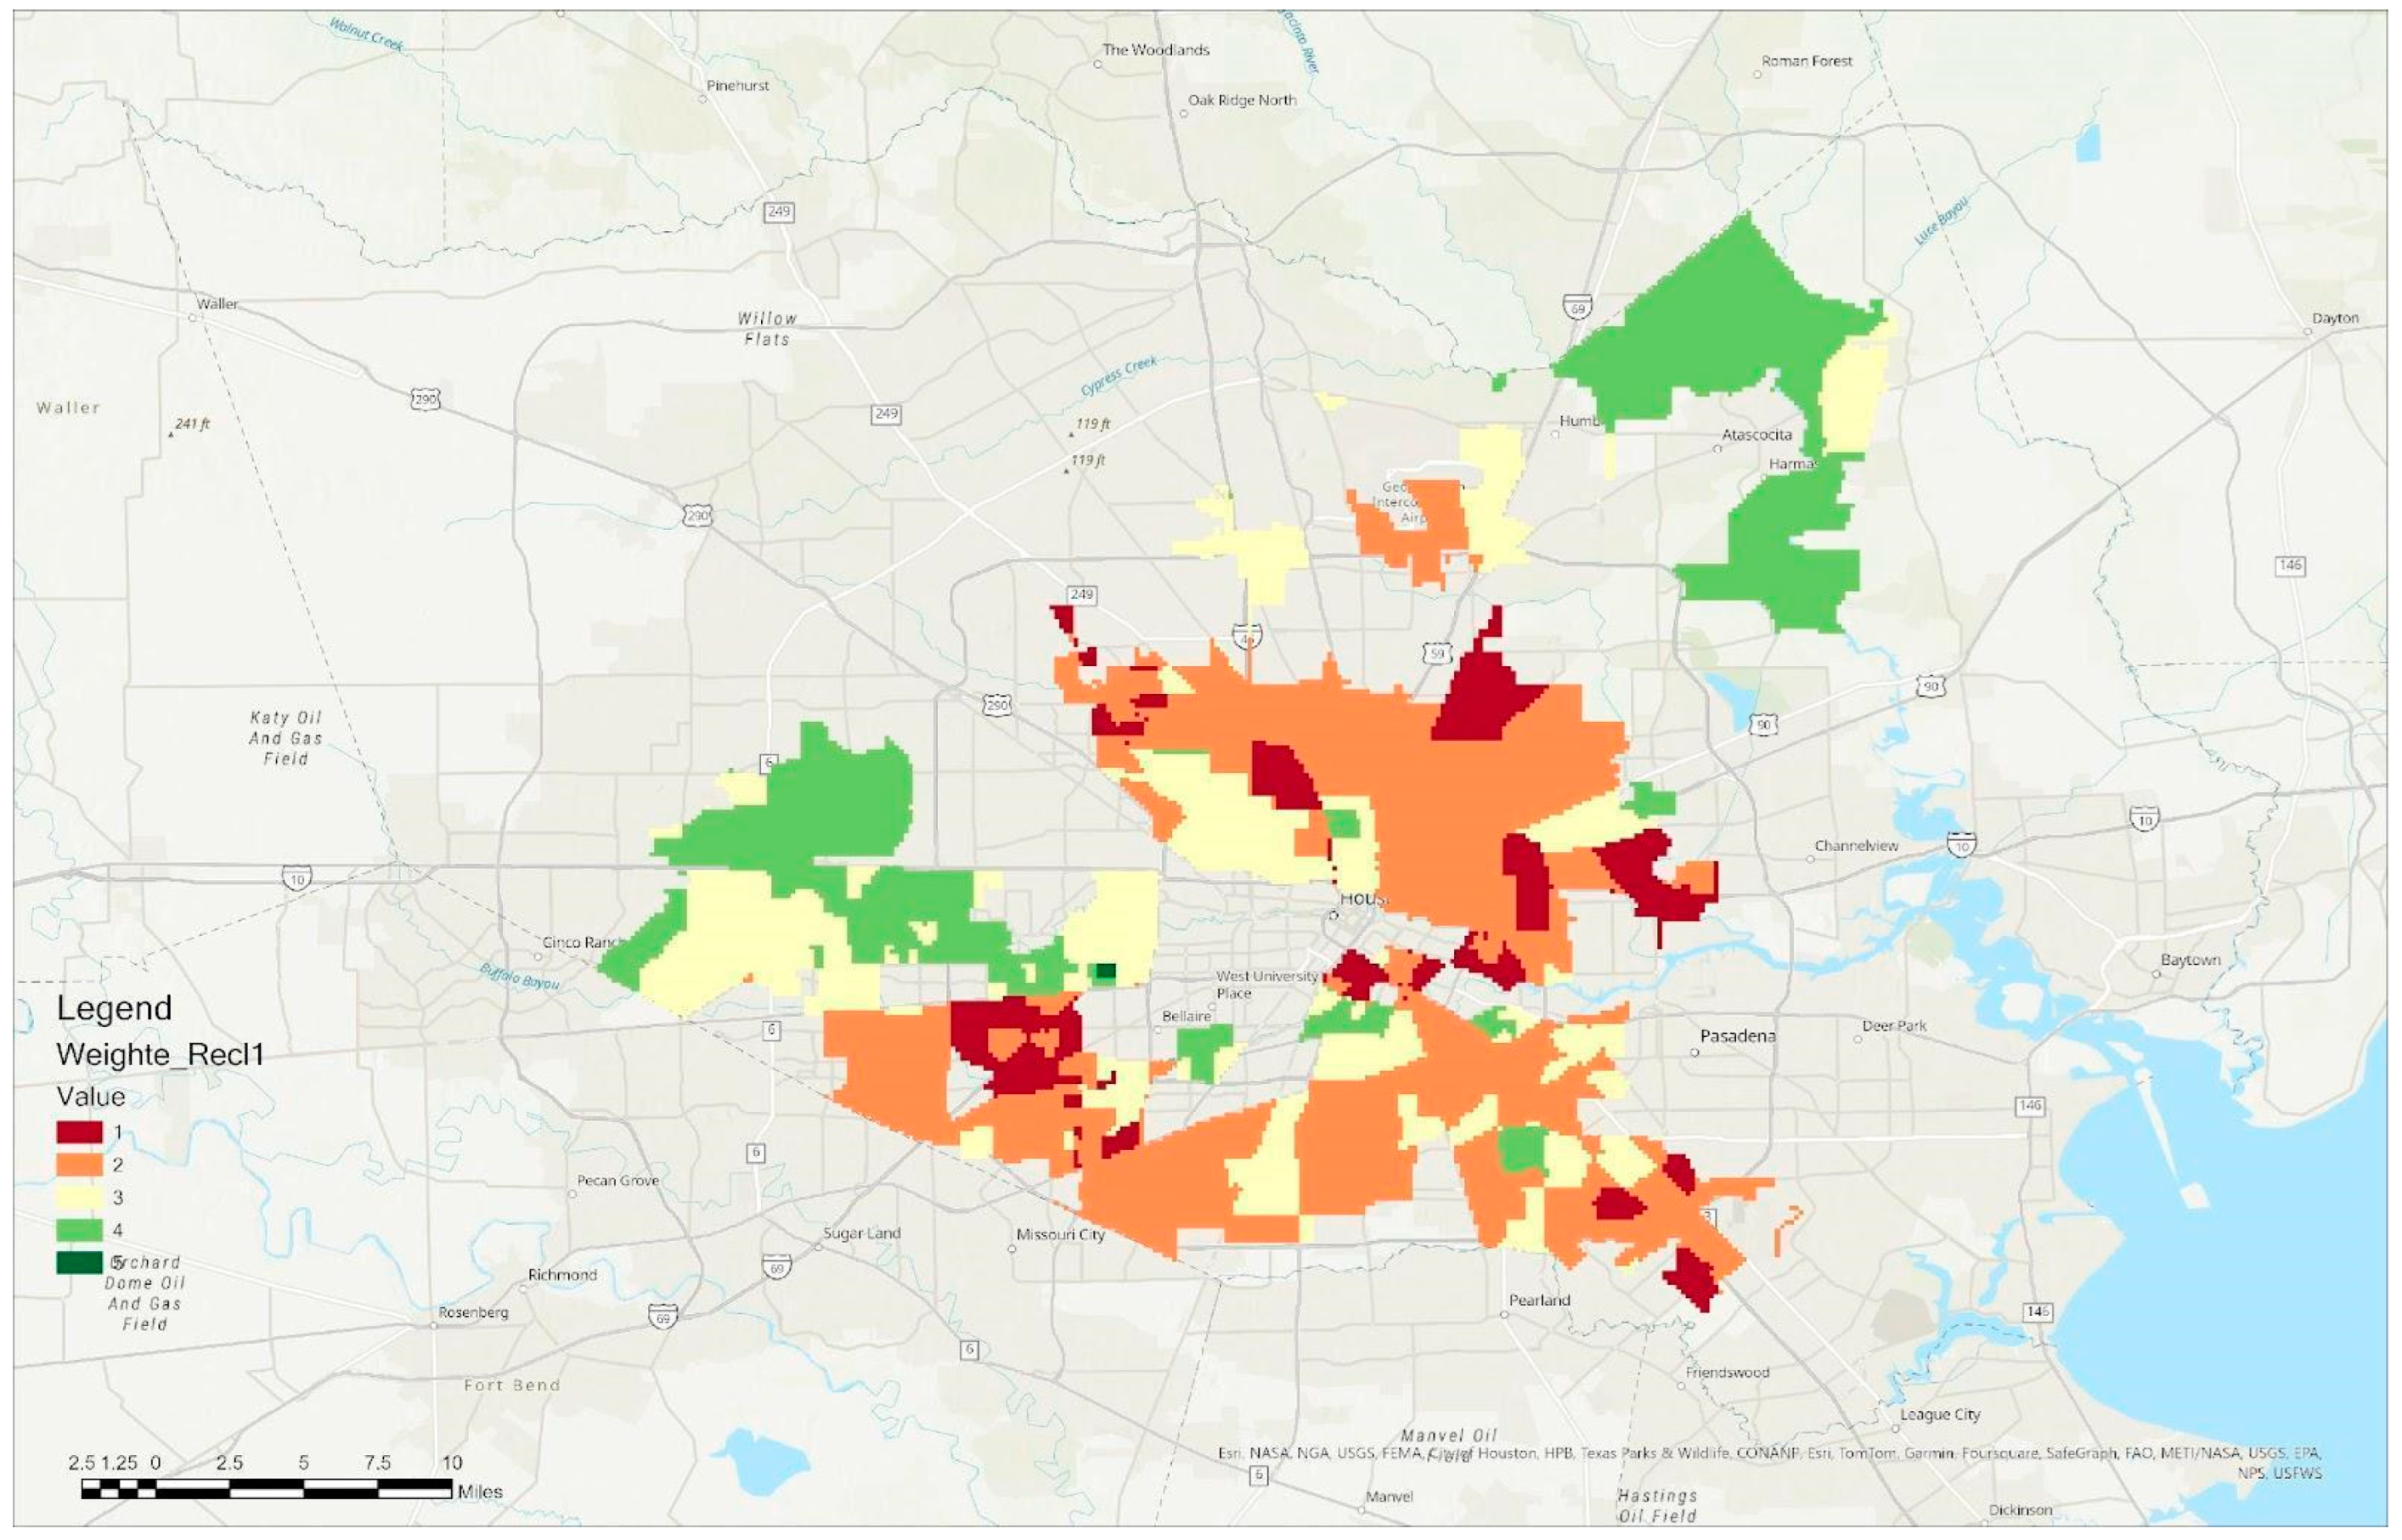
To assess the physical and social factors influencing home elevation decisions, we collected and analyzed in Geographic Information System (GIS) secondary data sources, including the following:
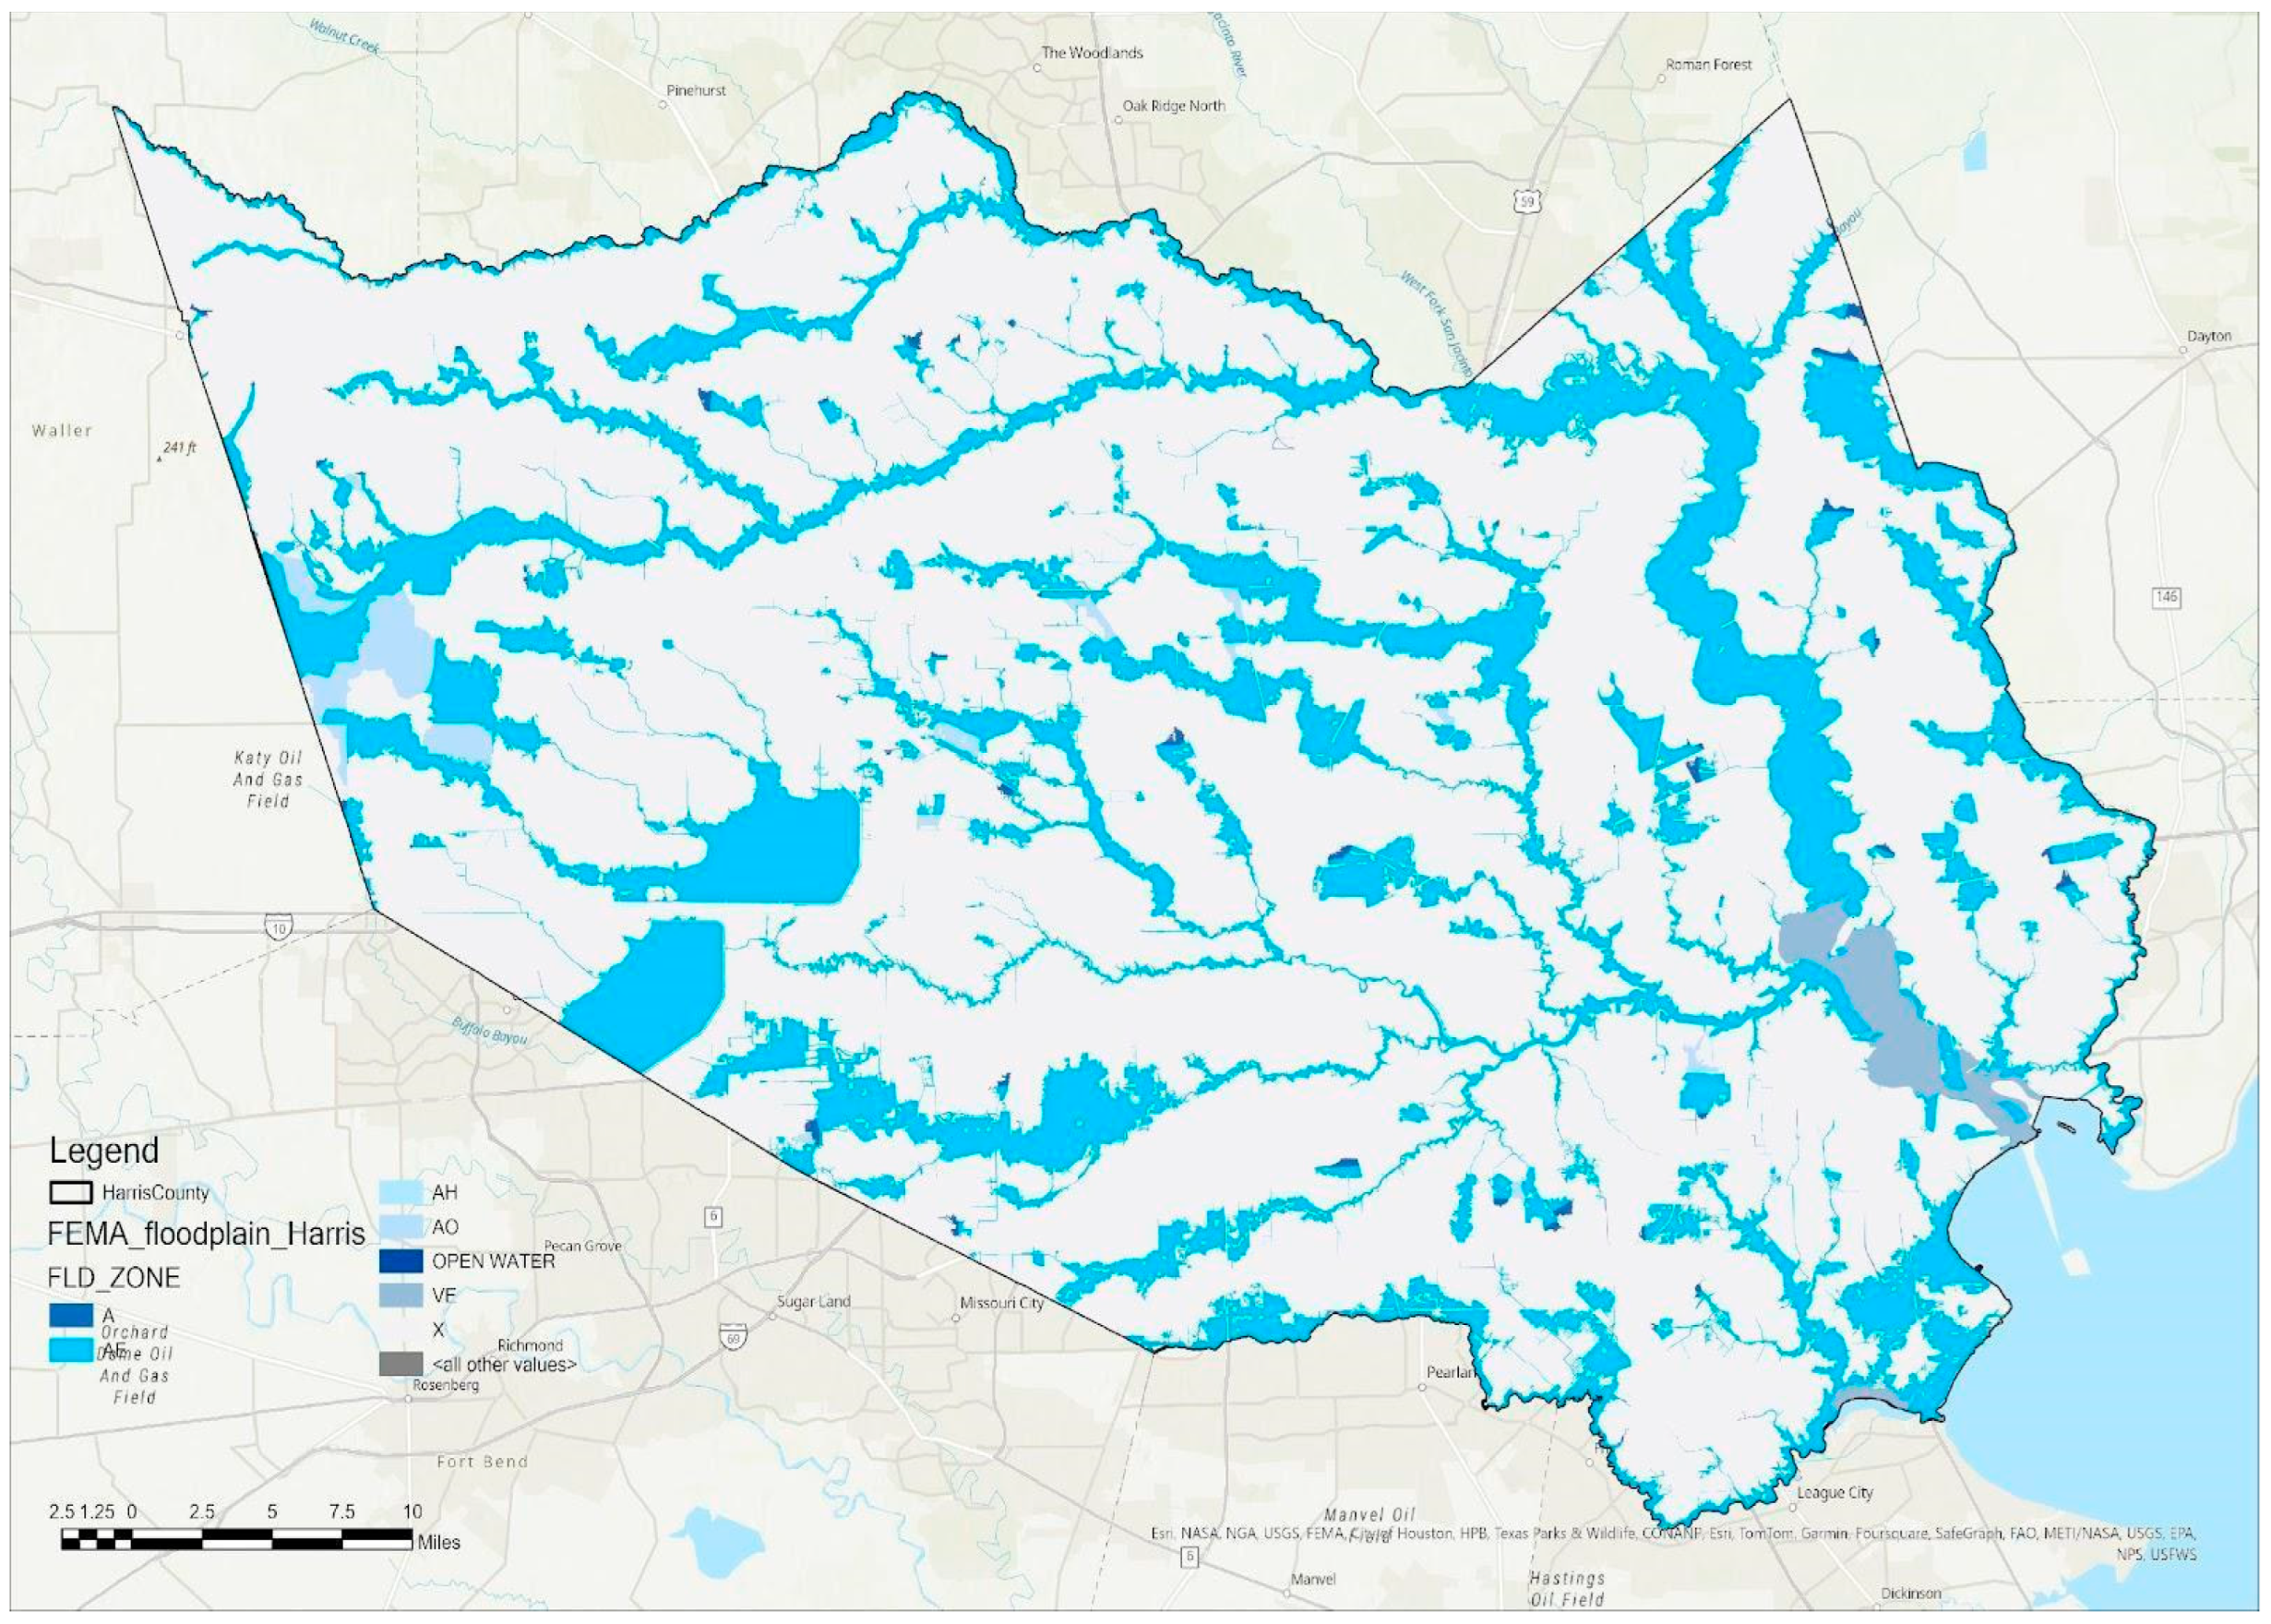
  • Flooding frequency: FEMA’s National Flood Hazard Layer (NFHL) (2024).
  • Topographic elevation data: LiDAR Elevation Data (DEM) from the Texas Natural Resources Information System (TNRIS) and Texas Geographic Information Office (TxGIO) (2023).
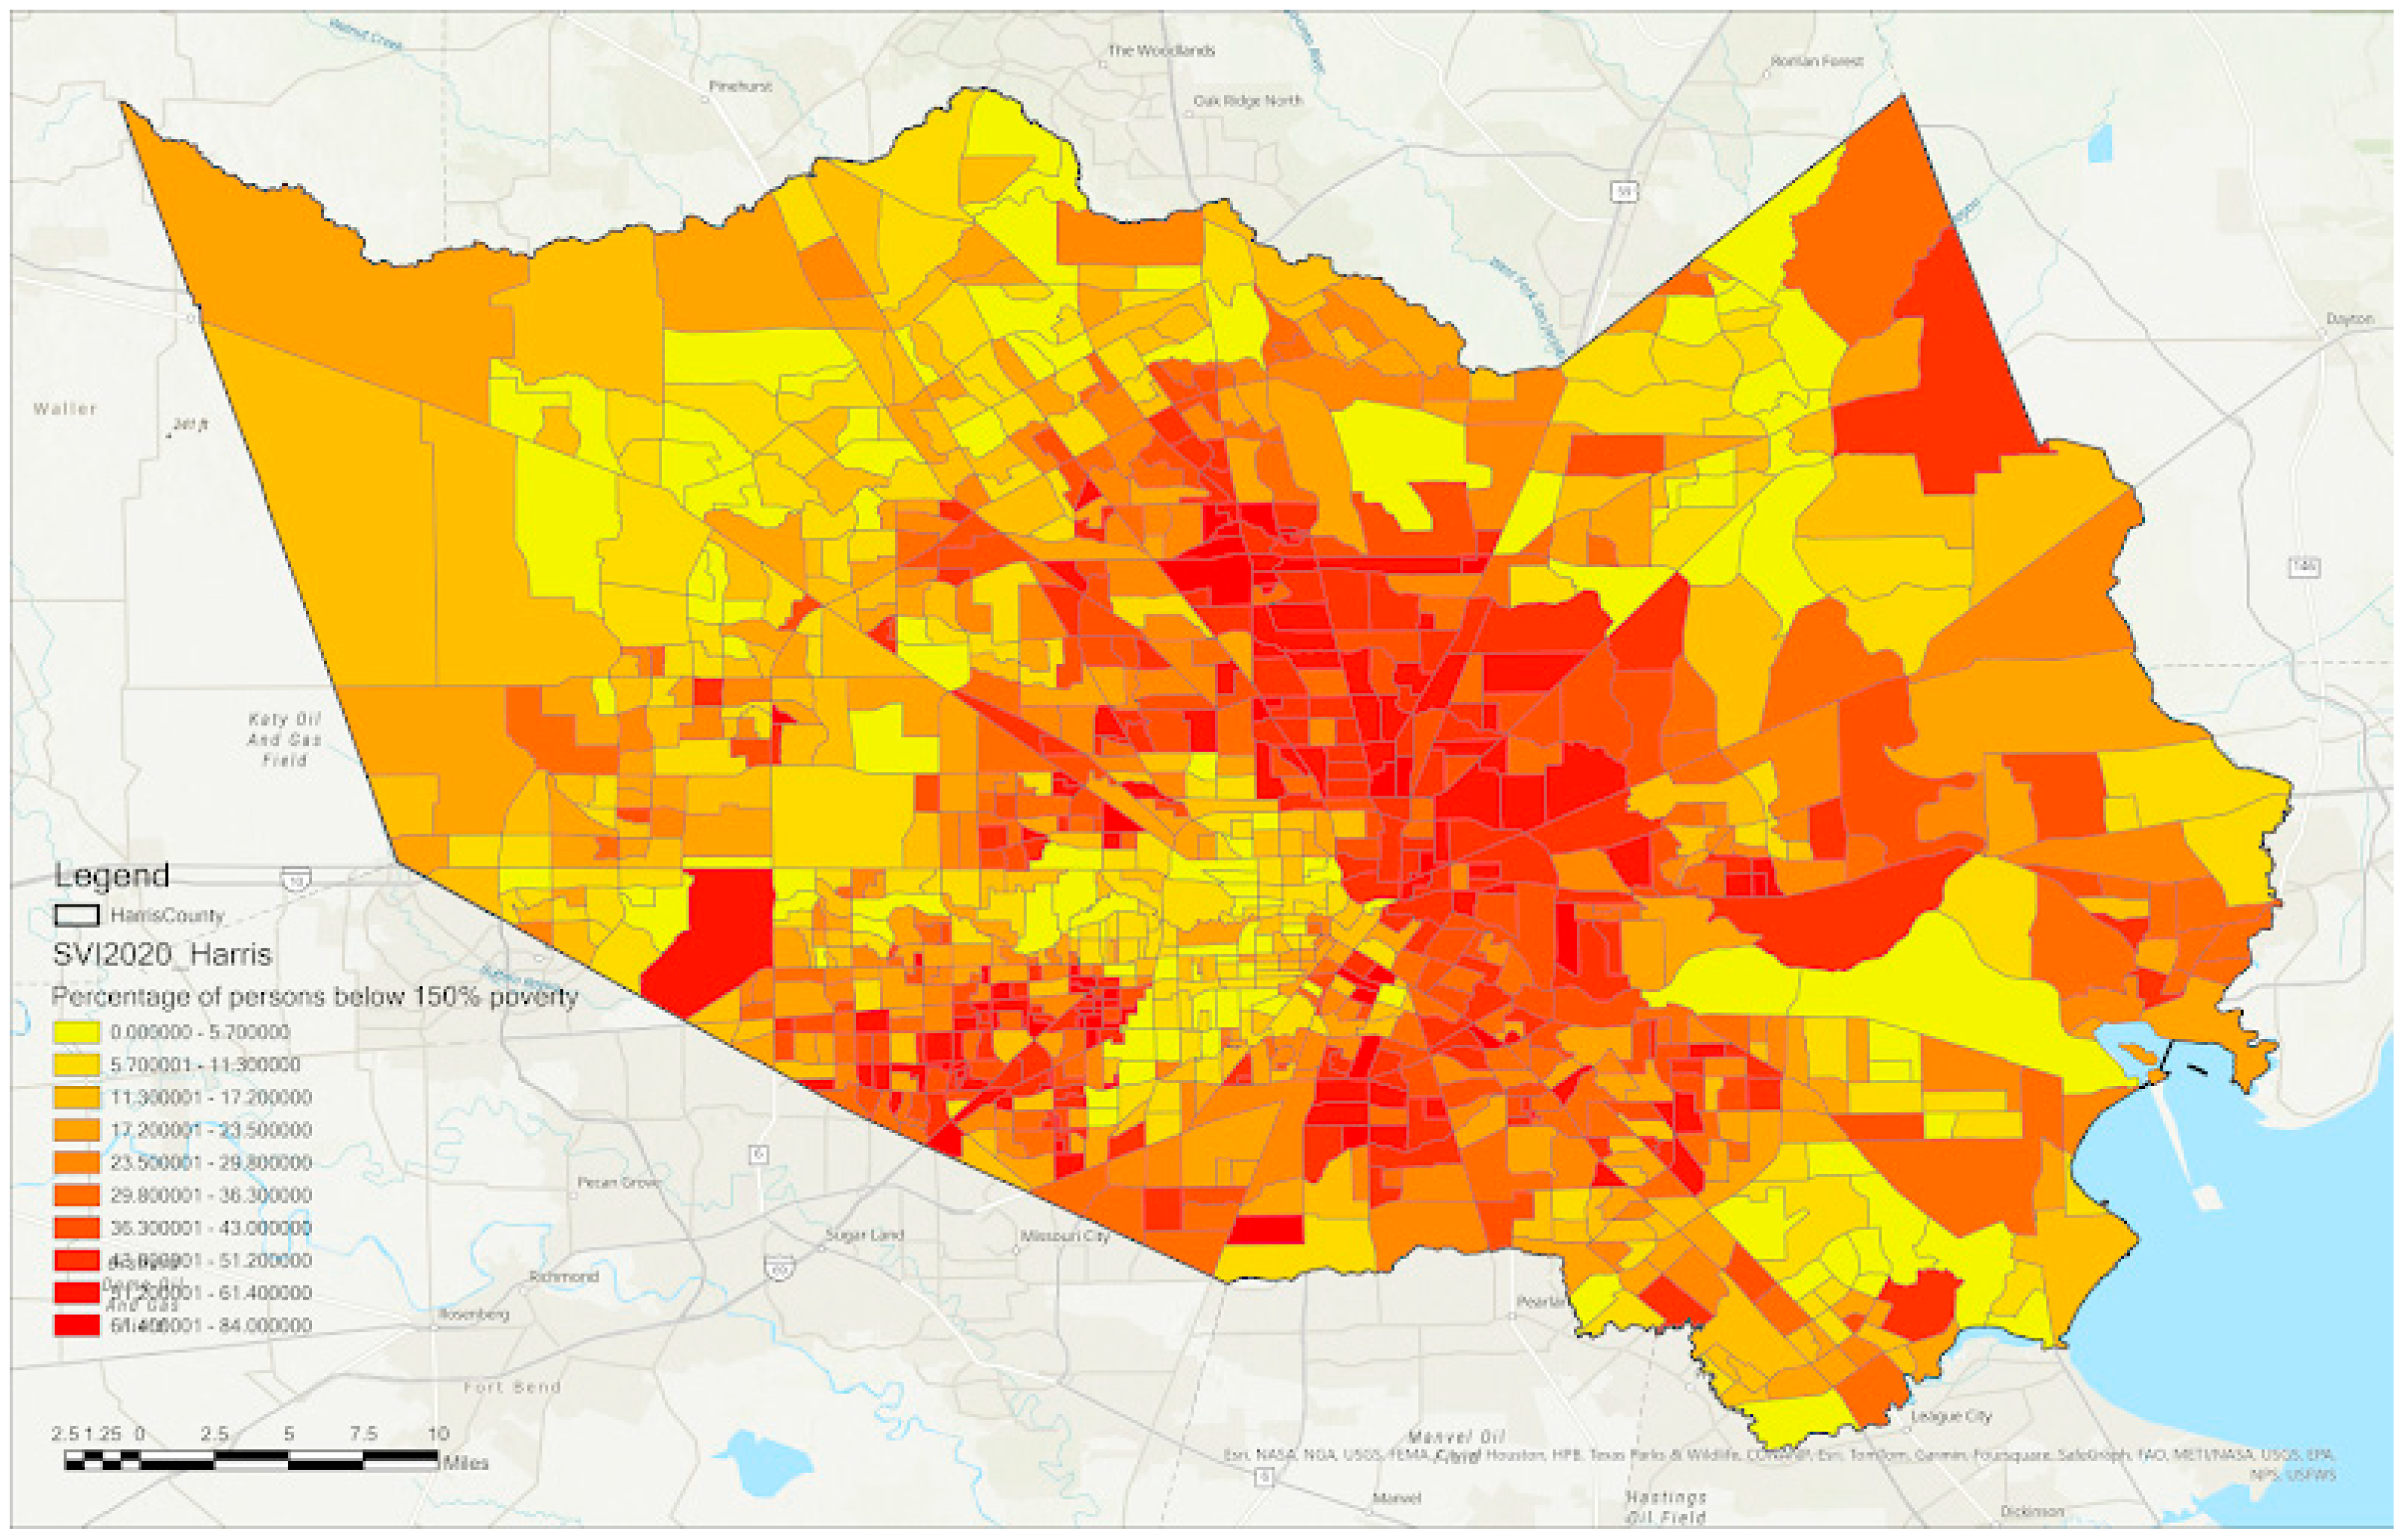
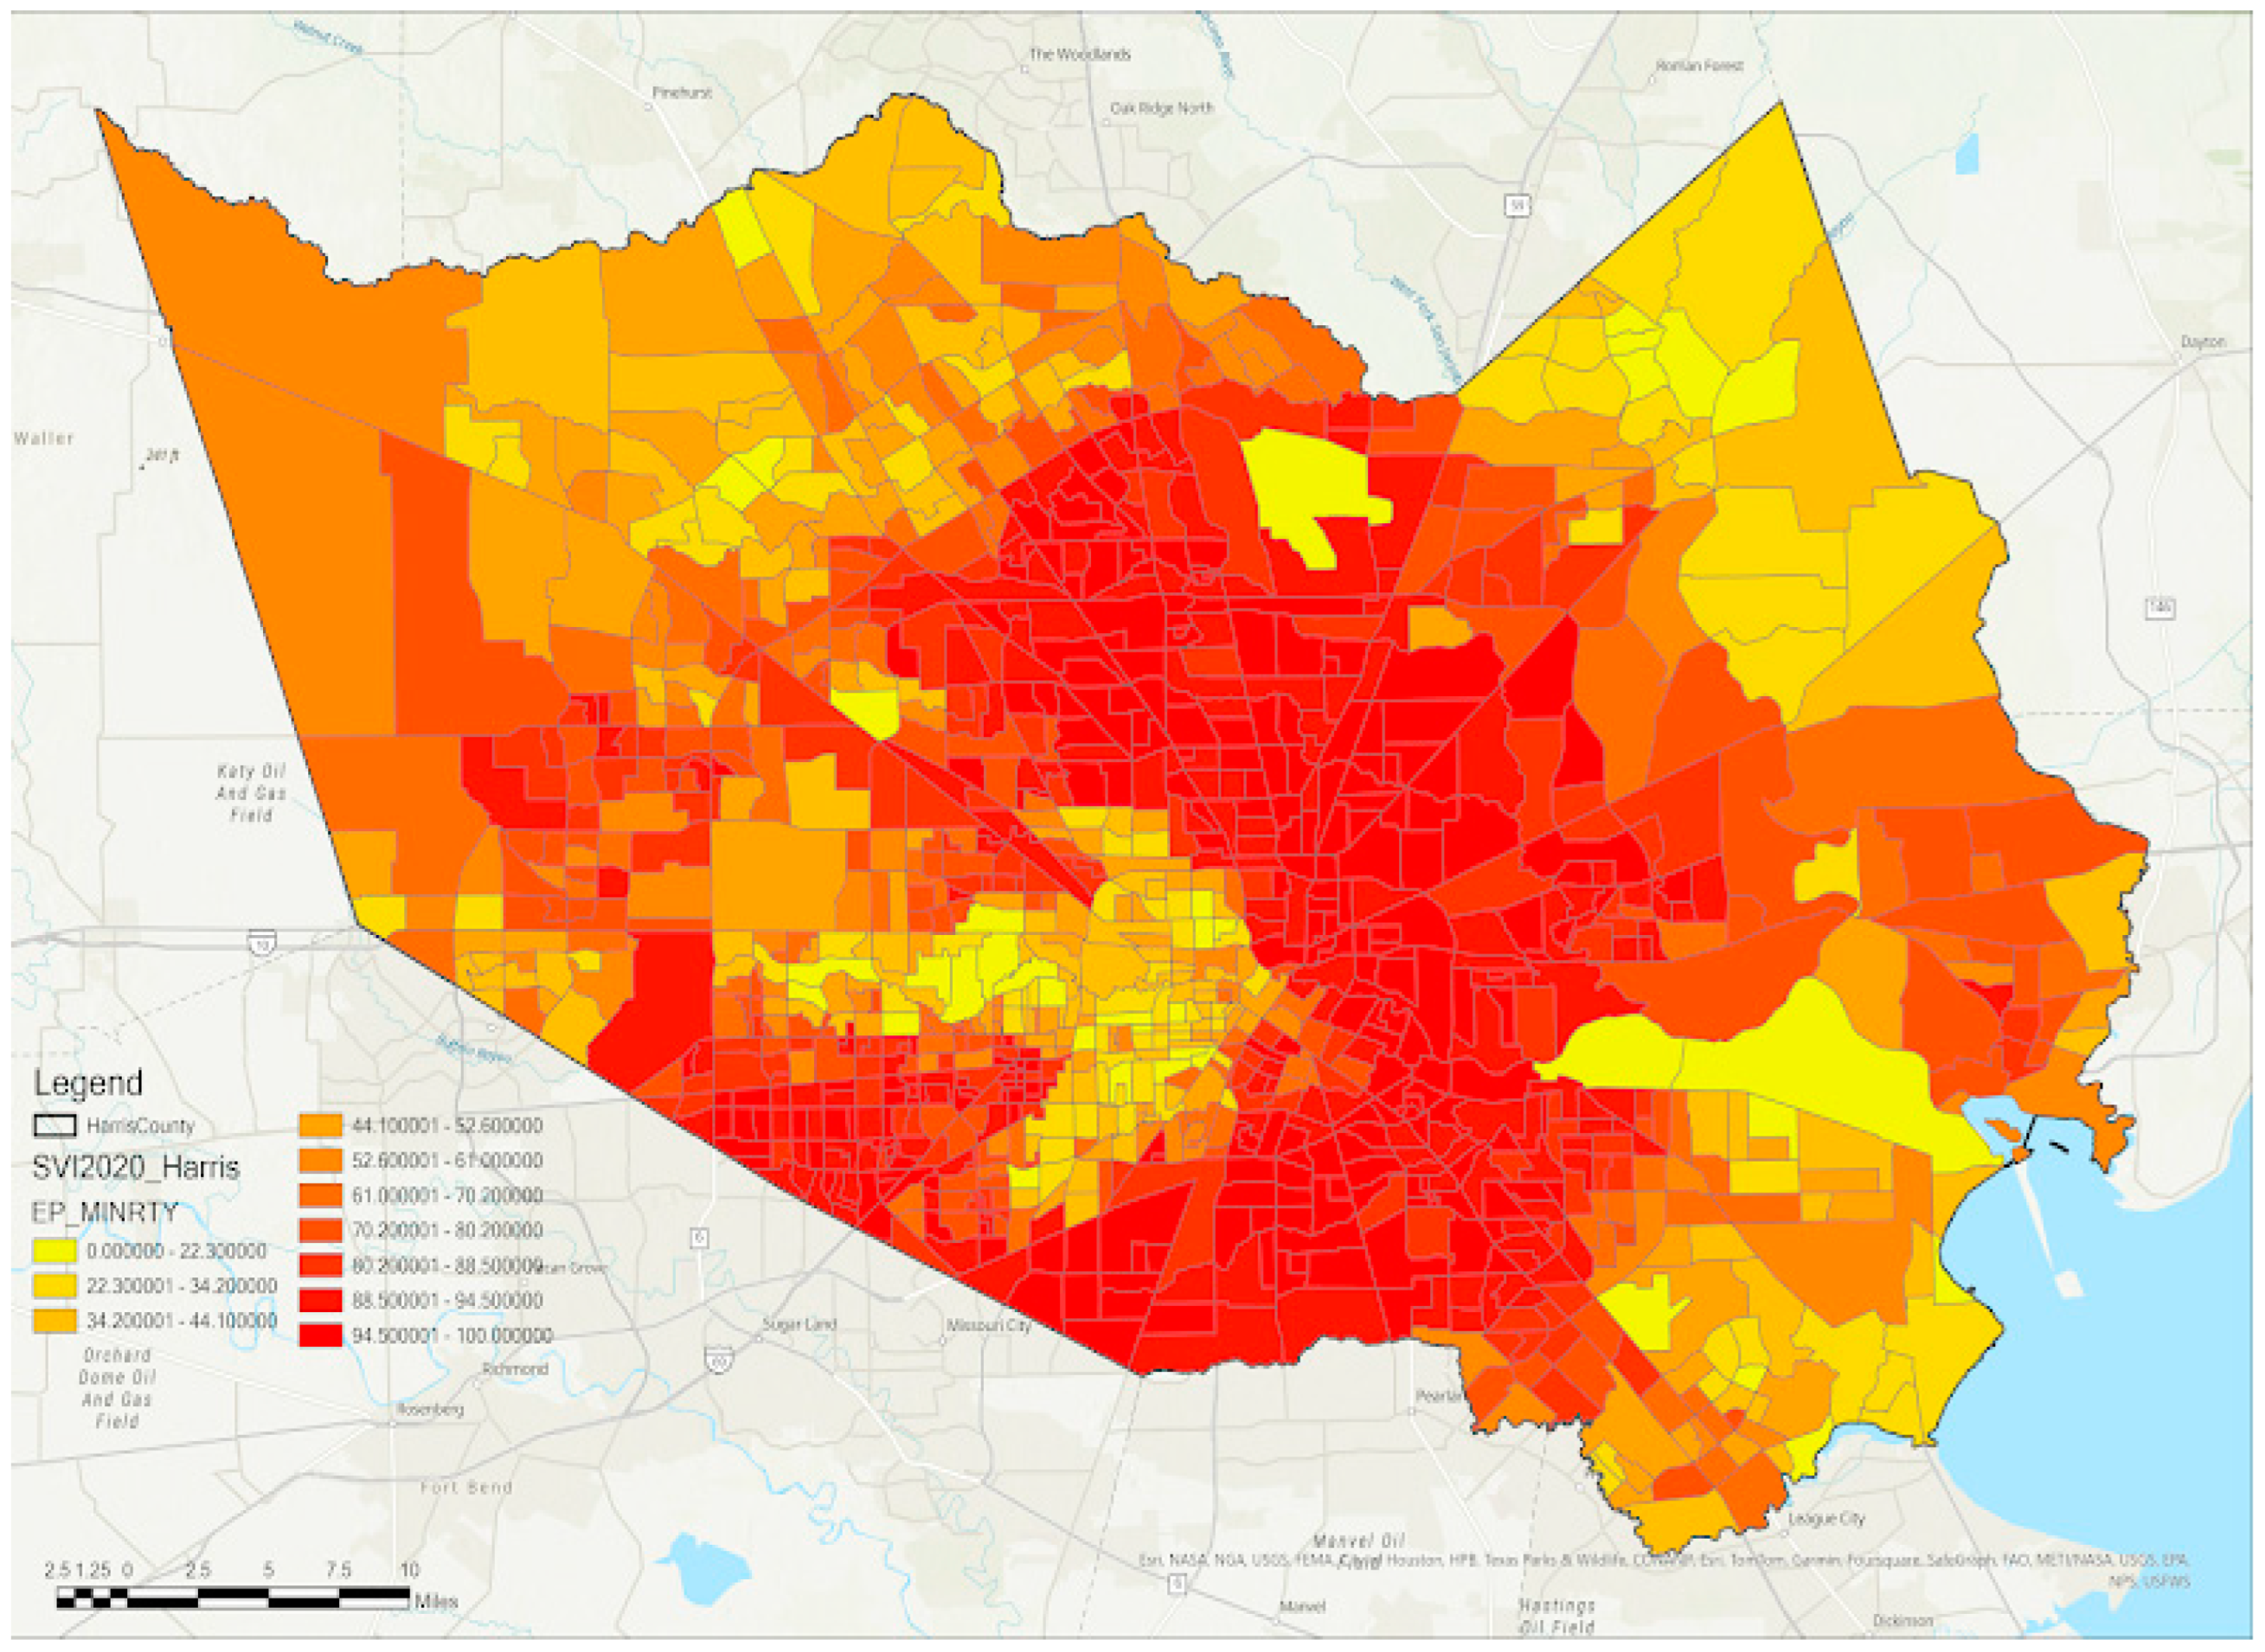
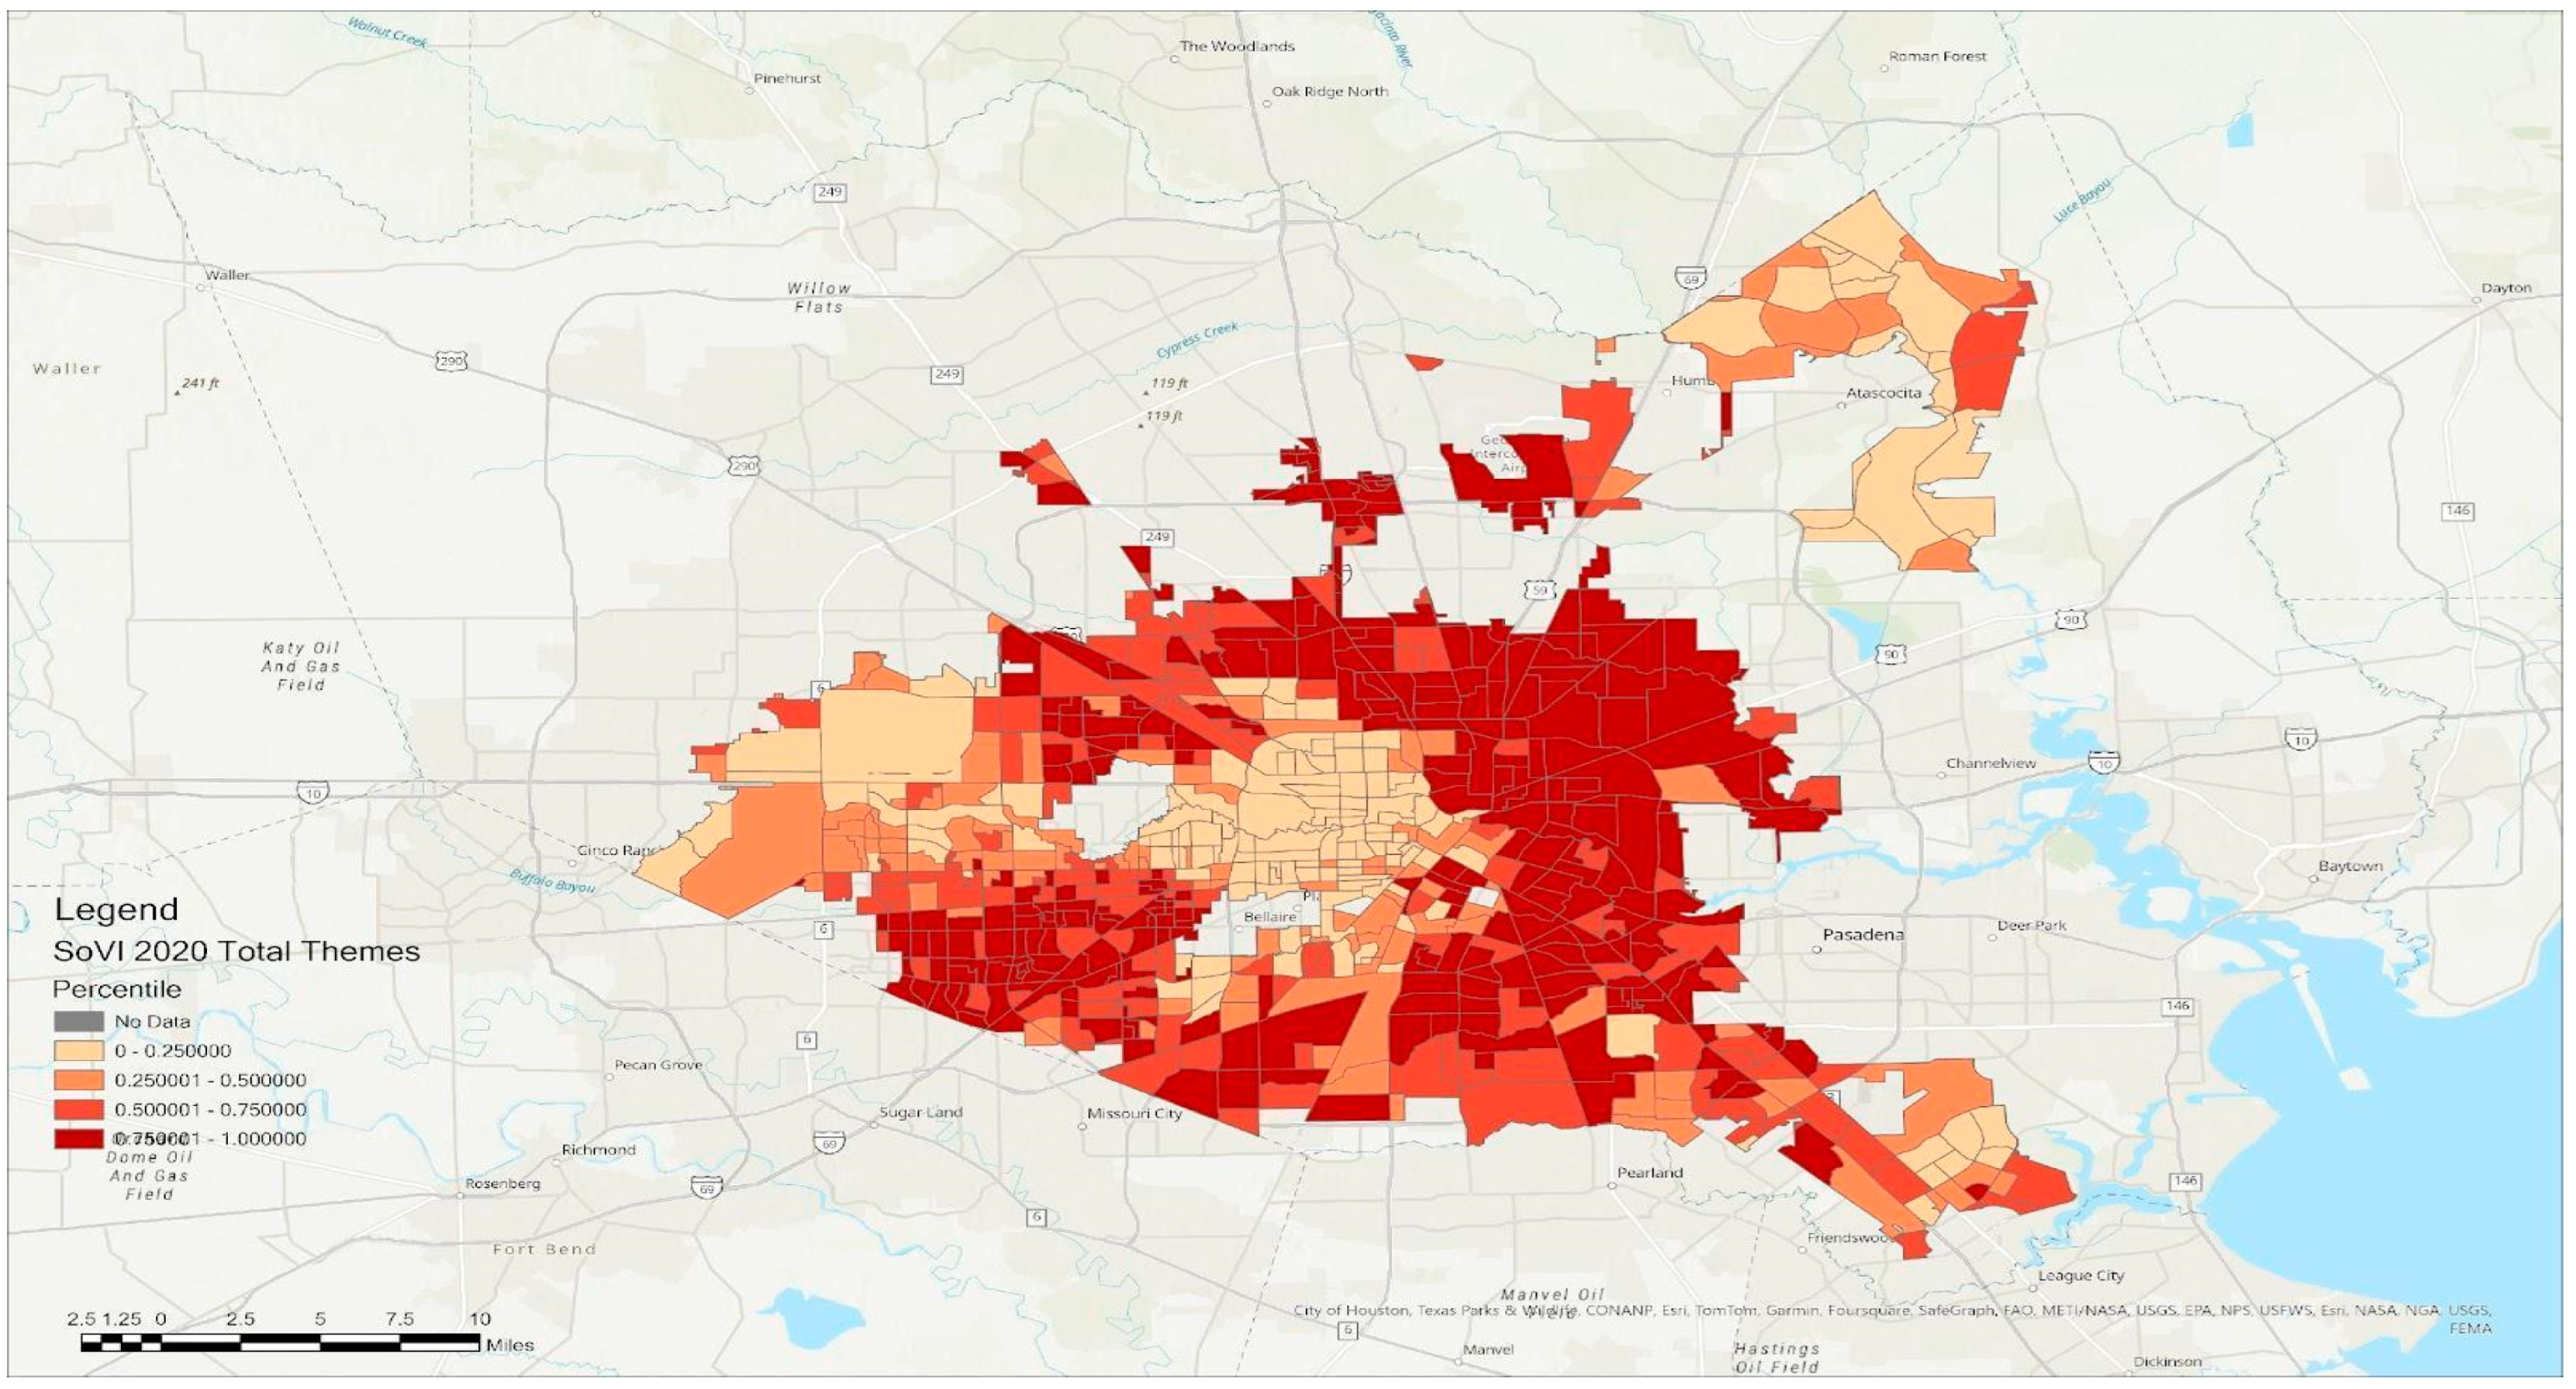
  • Social vulnerability indicators: CDC’s Social Vulnerability Index (2020) to evaluate the intersection of flood risk and socioeconomic conditions.
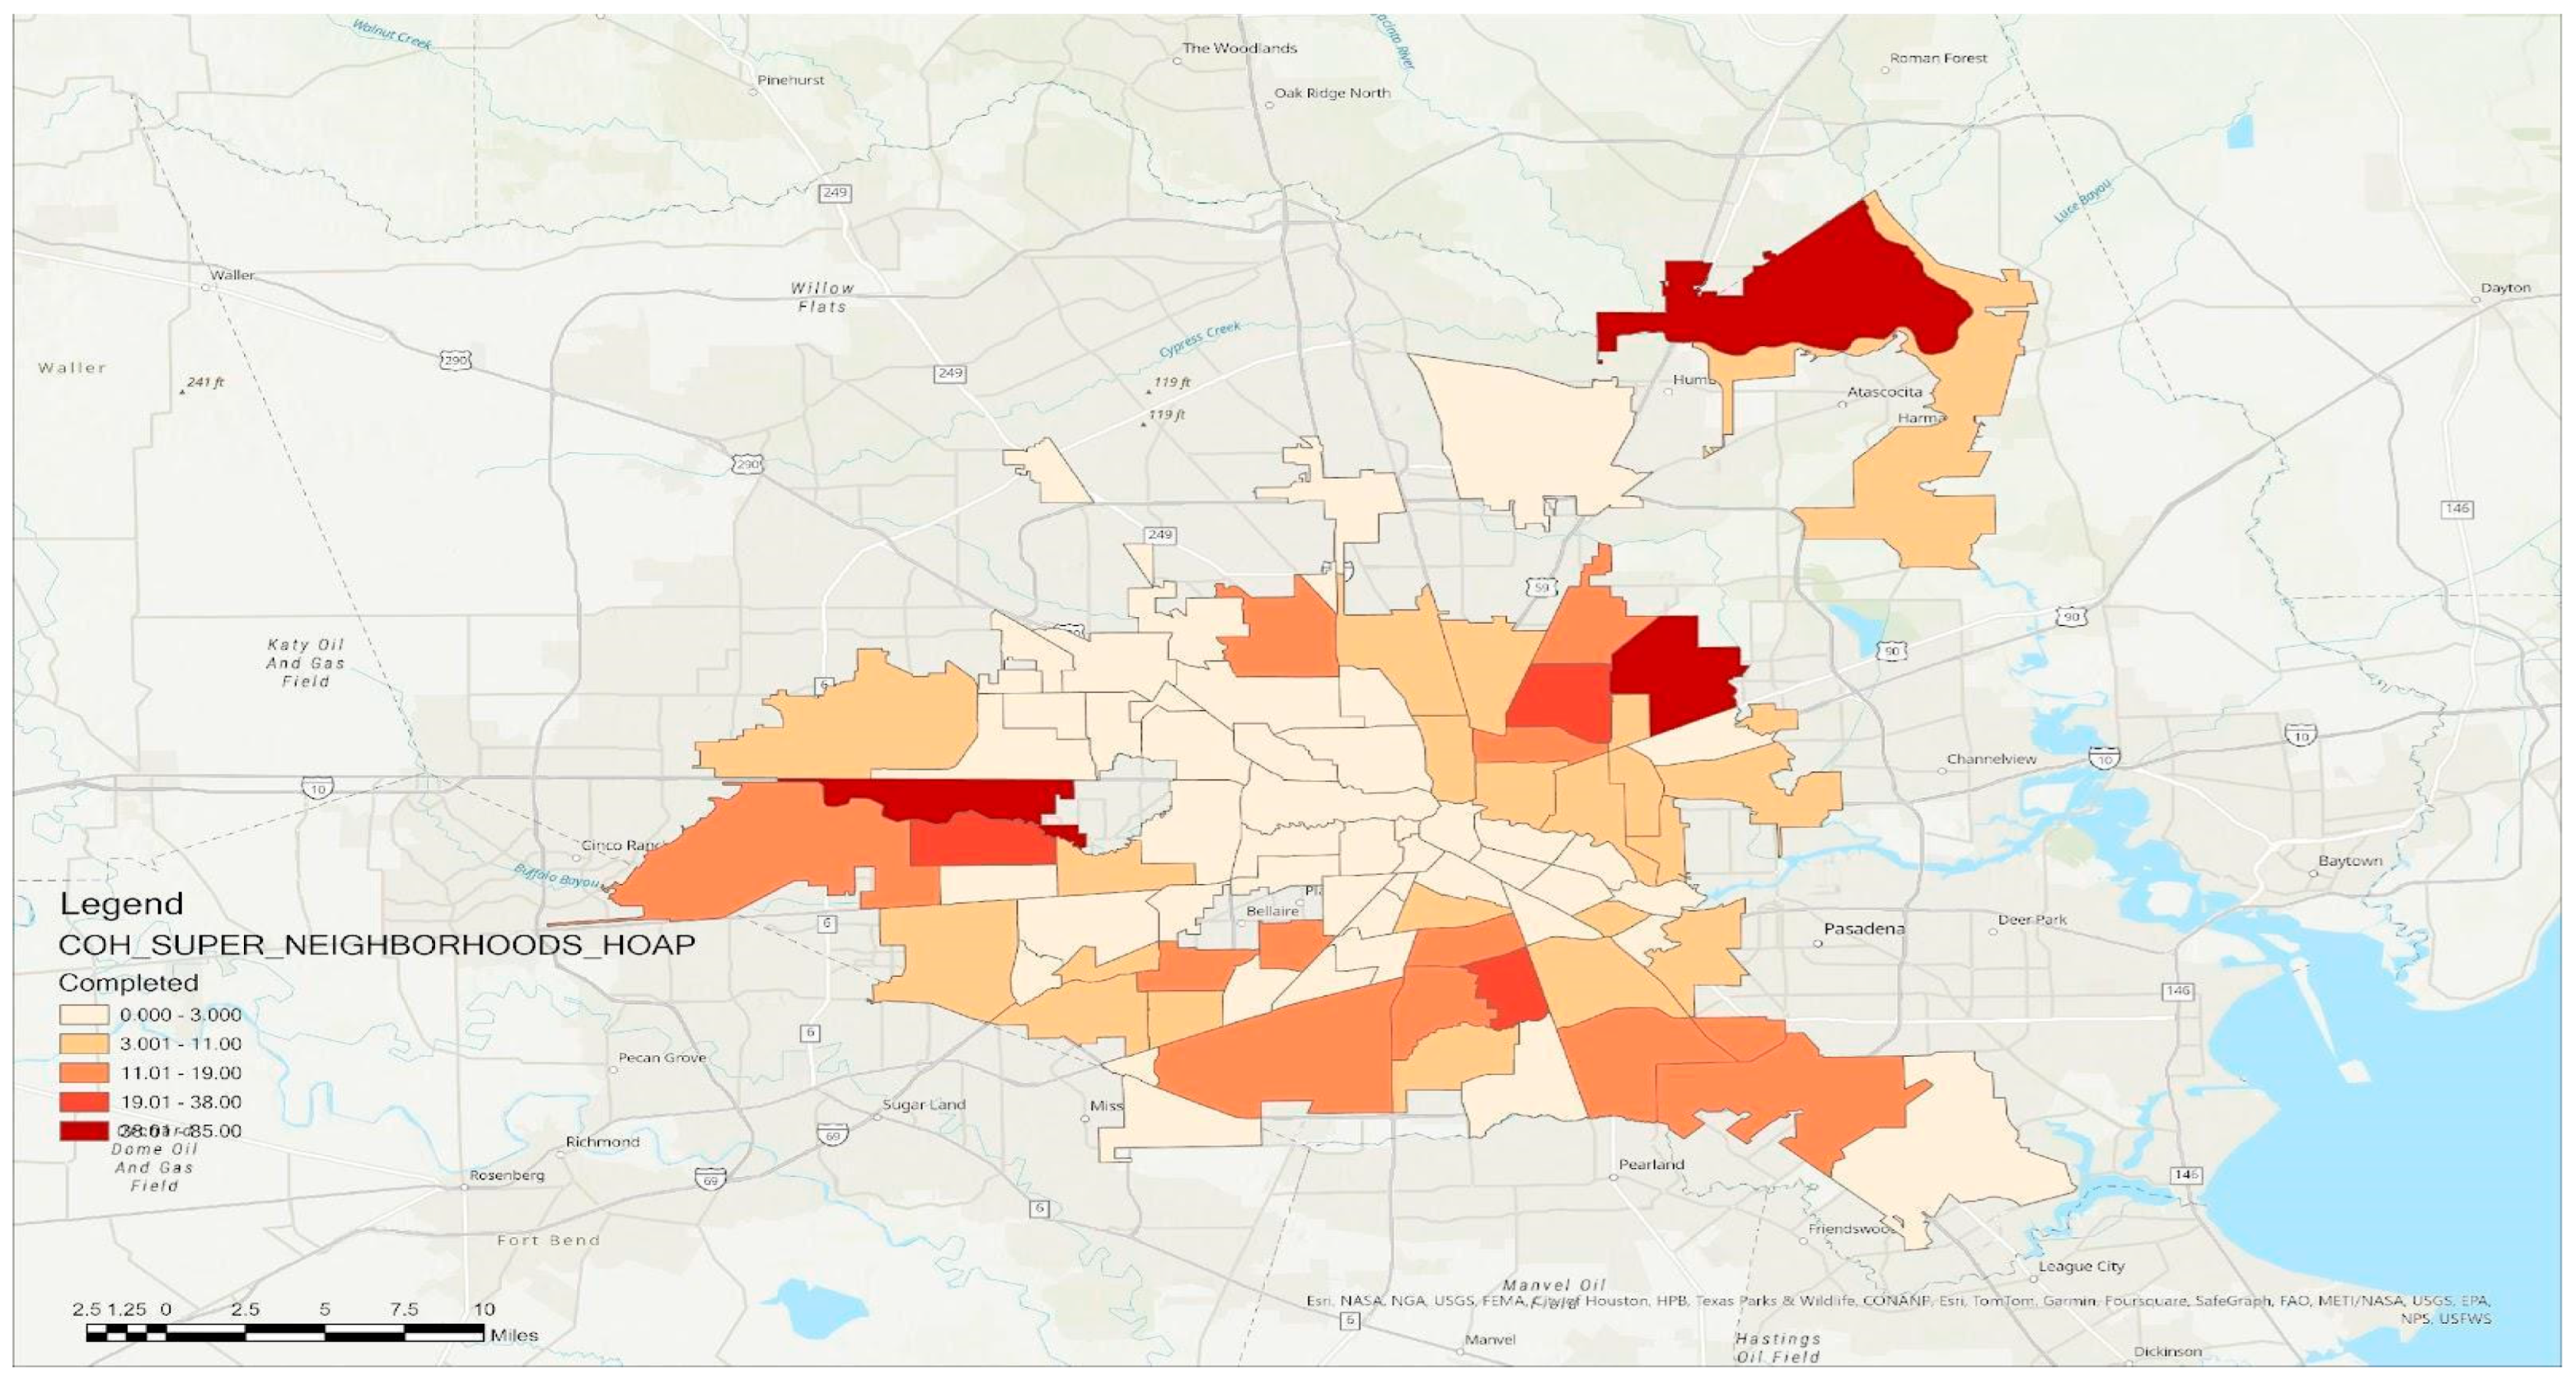
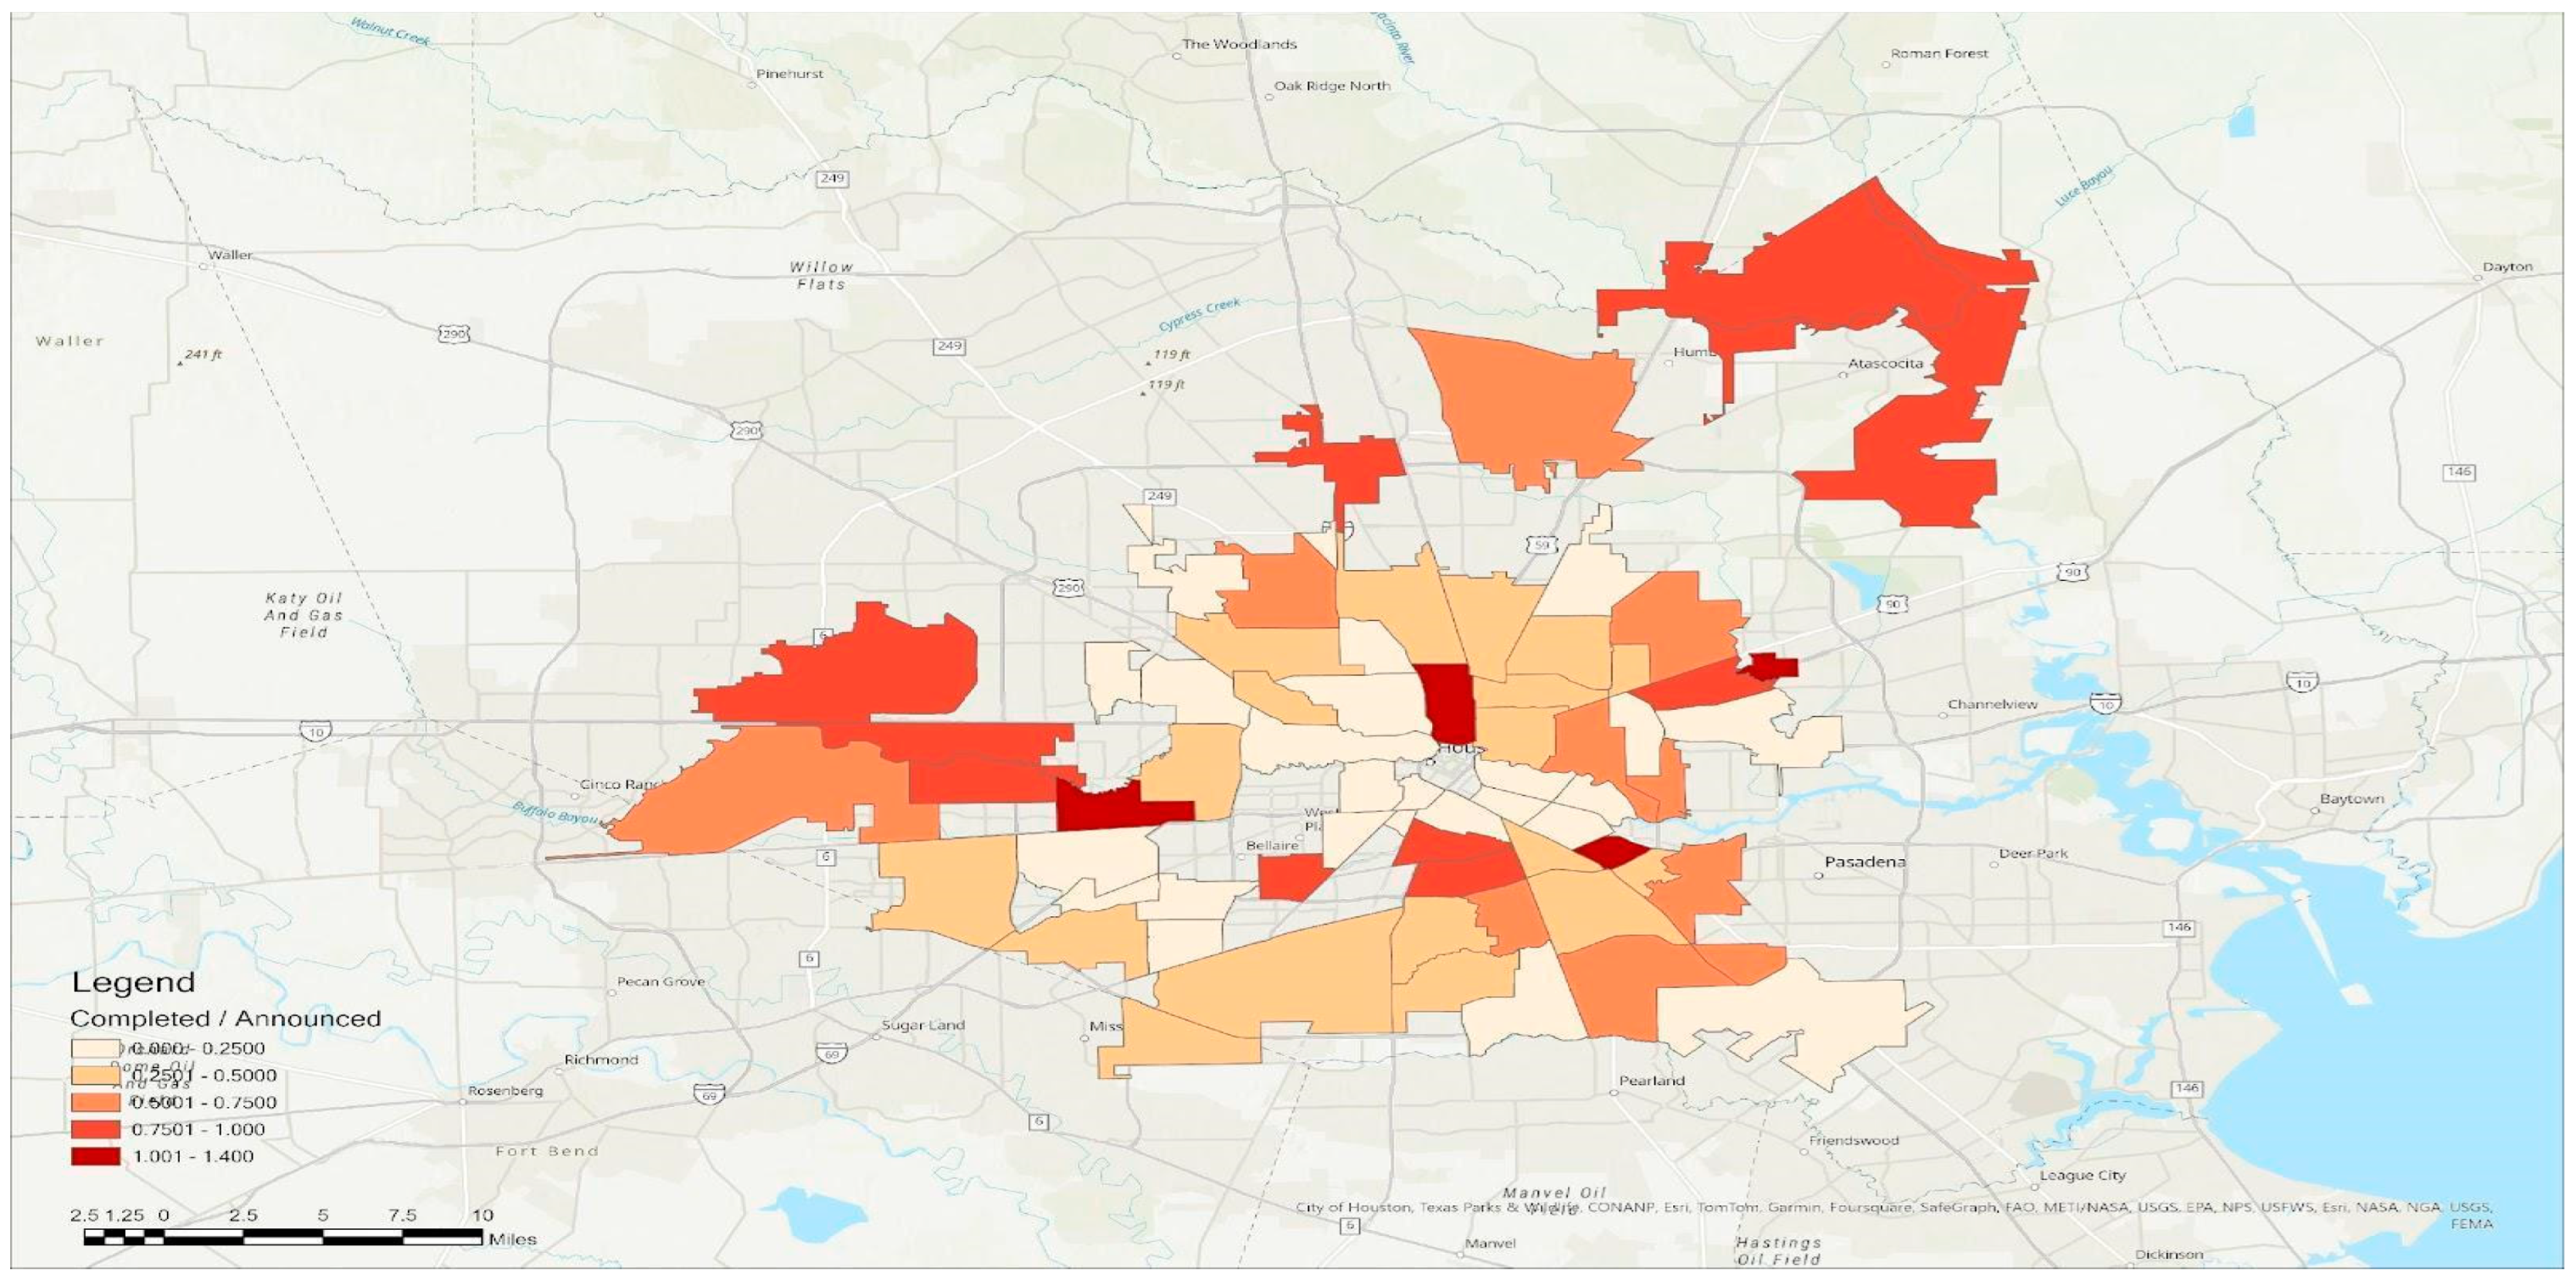
  • Home elevation program records: Publicly available data from the City of Houston’s HoAP program (2024), detailing the number and locations of elevated homes.
Additionally, we submitted a public record request to the Texas General Land Office (GLO) for program data related to elevation requirements, demographics of applicants, and home foundation types (slab, pier, or beam). These data were not received in time for inclusion in this report but will be analyzed in future research.

2.2.3. Survey and Interviews

To explore homeowners’ perceptions of home elevation, we conducted 50 surveys and in-depth interviews with participants in the City of Houston’s and Texas GLO’s home repair programs. All participants were either eligible for or had been offered home elevation assistance.
Participants were recruited from 13 neighborhoods across Houston, identified through flood impact maps and program participation records. The selected neighborhoods represented diverse geographic clusters across the north, south, east, and west of downtown Houston, capturing a range of flood experiences and recovery challenges. We visited 130 addresses; 4 people declined, and 76 people were not home or did not answer the door (we left a flyer). We were able to conduct 50 surveys/interviews. Even though the flyer included information about completing a survey online, no one did so. The participation rate was 39.7%. GLO records show that 1608 participated in the program. The sample represents approximately 3.1% of the total program participants.
Surveys were administered door-to-door, with homeowners choosing whether to complete the survey inside or outside their homes. Each visit lasted between 20 min and over an hour (most around 40 min), allowing time for in-depth discussions and site observations. Paper-based surveys measured demographic variables, flood history, decision-making factors, and perceptions of government assistance. A consent form was given to participants for them to keep for their records.
Interviews were recorded with participant consent, while detailed notes were taken for those who declined recording. A follow-up interview was conducted to validate survey responses and ensure data consistency. In addition to resident interviews, we conducted structured interviews with two elevation specialists during the field trip. These experts provided technical explanations about elevation processes and financial and regulatory challenges, offering additional context for interpreting homeowner decisions. We promised confidentiality to all participants.

2.3. Quantitative and Qualitative Data Analysis

Survey responses (N = 50) were analyzed using descriptive statistics (mean, median, and standard deviation). Chi-square tests were used to examine relationships between demographic factors (e.g., age and disability status) and home elevation decisions.
Interview transcripts were coded thematically using Dedoose web application for mixed methods research. Key themes included perceived flood risks, government assistance, mobility concerns, and neighborhood esthetics. Comparative analysis was conducted to identify common patterns across different demographic groups.

2.4. Ethical Considerations and Researcher Positionality

This study was conducted in accordance with ethical guidelines, as approved by the Institutional Review Board (IRB) (ID: STUDY2004-0011) at Texas A&M University.
Participants were informed about the study’s purpose, risks, and confidentiality protections before agreeing to participate. Participants were given a consent form for them to read and kept. Homeowners received USD 20 cash compensation for their time and were promised access to the study results. We collected the contact information of participants but de-identified the information for the data collected. All participant names were replaced with pseudonyms. Interviews and survey responses were anonymized to protect identities. Findings will be shared with participants through focus groups and follow-up presentations (in-person and via conference calls). This was designed to ensure that residents benefited from the research and could use the results to advocate for better disaster recovery policies.

3. Results

3.1. Analysis of Secondary Data

3.1.1. Floodplain Map

Approximately 20% of Texas’s land area, equating to roughly 56,000 square miles, falls within the 100-year floodplain, as identified by the Texas Water Development Board [15]. While specific percentages for Houston and Harris County are not detailed in the provided sources, it is notable that more than 7000 housing units have been constructed within Harris County’s 100-year floodplain since 2010 [15]. This development trend underscores the region’s ongoing challenges with urban expansion into flood-prone areas.
Given that Harris County encompasses a significant portion of Houston, Figure 1 highlights the city’s substantial exposure to flood risks. The concentration of flood-prone areas along Houston’s bayous and low-lying regions, such as neighborhoods near Buffalo Bayou, Brays Bayou, and Greens Bayou, further emphasizes the need for comprehensive flood management strategies.
It is important to note that existing floodplain maps, last officially updated in 2007, may not fully reflect current risk levels due to factors such as urban development and climate change. Consequently, ongoing efforts to revise these maps are designed to provide a more accurate representation of flood-prone areas, ensuring that residents and policymakers have up-to-date information to guide future development and flood mitigation strategies.

3.1.2. Social Vulnerability Index

The CDC Social Vulnerability Index (SVI) is a quantitative tool designed to assess how susceptible communities are to environmental hazards and disasters [16]. It incorporates multiple socioeconomic, demographic, and housing factors to determine the relative vulnerability of different populations. The SVI has been widely used in disaster management and resilience planning to identify communities that may require additional resources and support during emergencies [17]. By integrating these variables, the Index provides a comprehensive framework for understanding social vulnerability at a granular level.
In Houston, Texas, social vulnerability is particularly pronounced due to significant socioeconomic disparities across neighborhoods. The city’s diverse racial and ethnic composition, income inequality, and uneven access to essential services contribute to varying degrees of vulnerability. These disparities are particularly relevant in flood-prone areas, where historically marginalized communities face greater risks and challenges in recovery efforts. For example, Figure 2 illustrates the percentage of people living below 150% of the poverty line in high-risk flood zones across Harris County, emphasizing the intersection of flood exposure and economic disadvantage. Understanding these patterns is essential in distributing targeted resources and improving disaster resilience in vulnerable communities.
Figure 3 illustrates the percentage of the nonwhite population residing in each census tract within Harris County. The left map highlights census tracts with elevated poverty rates, with darker red shades indicating areas where a higher proportion of residents live below the poverty line. The right map uses the same red shading to represent areas with higher levels of social vulnerability, as measured by the CDC Social Vulnerability Index (SVI).
The relationship between poverty, racial disparities, and environmental vulnerability is particularly significant in Houston, where historically marginalized communities often face greater challenges in disaster preparedness, response, and recovery. Repeated flooding events in the city have disproportionately impacted these communities, further exacerbating socioeconomic inequalities. By mapping race, poverty, and social vulnerability together, Figure 3 underscores the systemic risks faced by nonwhite and low-income populations, reinforcing the need for equitable disaster mitigation and recovery efforts.
The Social Vulnerability Index (SVI) incorporates multiple dimensions, including socioeconomic status, household composition, racial and ethnic minority status, and housing and transportation factors. Figure 4 illustrates the spatial distribution of social vulnerability across Houston, revealing significant regional disparities.
According to the City of Houston, super neighborhoods were established to foster collaboration among residents of adjacent communities, allowing them to collectively identify, prioritize, and address local concerns. Many of these designated areas, particularly those located in eastern and southern Houston, exhibit higher levels of social vulnerability. In Figure 4, census blocks are shaded to represent varying degrees of vulnerability, with darker areas indicating higher social vulnerability percentiles. These patterns highlight the unequal distribution of risks and resources, emphasizing the need for targeted interventions to enhance resilience in the most vulnerable communities.
Interviews revealed distinct clusters of newly constructed and easily identifiable “Harvey homes” in high-risk, lower-income neighborhoods. However, new construction was noticeably absent in more affluent areas such as Meyerland and Brays Bayou, which also have lower Social Vulnerability Index (SoVI) scores. While some homes in these wealthier neighborhoods may have been elevated, they were generally not demolished and rebuilt, as observed in lower-income communities.
This disparity suggests that home reconstruction efforts vary based on income and location, with lower-income areas experiencing more extensive demolitions and replacements, whereas higher-income areas retained pre-existing housing structures with modifications. As a result, no survey respondents were identified in these wealthier neighborhoods, highlighting potential inequities in recovery efforts. This pattern underscores the geographic concentration of flood risk and social vulnerability, emphasizing the need for targeted interventions that address disparities in disaster recovery and housing resilience strategies.

3.1.3. Current Status of the Homeowner Assistance Program

As of 31 May 2024, the Homeowner Assistance Program (HoAP) had completed 158 home reconstructions, while the Texas General Land Office (GLO) had completed 1608 homes in Houston. However, completion rates varied significantly across different neighborhoods, with notable geographic disparities in project distribution.
Figure 5 presents the total number of completed home elevation projects within the study area. This map visually represents where the most home elevations have taken place, highlighting neighborhoods with higher absolute numbers of completed projects. However, this figure does not account for how many projects were initiated versus how many were completed, nor does it reflect the proportion of completed projects relative to total applications. The Kingwood, East Houston, and Memorial super neighborhoods recorded the highest number of completed projects, reflecting concentrated recovery efforts in these areas. Similarly, western and northern Houston demonstrated the highest completion rates, meaning that a greater proportion of announced projects were successfully completed.
Figure 6 focuses on completion rates, showing the percentage of projects completed out of the total number of approved or initiated projects in each neighborhood. This figure provides a clearer measure of program efficiency by illustrating where home elevation projects are more likely to be fully executed compared to areas with lower completion rates.
In contrast, southern neighborhoods of Houston, which are characterized by higher minority populations, greater poverty levels, and aging infrastructure, exhibited lower completion rates despite their heightened vulnerability. Figure 7 integrates social vulnerability data into the completion rates from Figure 6 to assess disparities in program outcomes. This map overlays program effectiveness with community-level social vulnerability indicators to identify whether more vulnerable populations are receiving the same level of support as less vulnerable ones. The figure uses a gradient scale from low vulnerability and high completion rates to high vulnerability and low completion rates, helping to pinpoint the communities most in need of targeted policy interventions.

3.2. Surveys

3.2.1. Demographics

Table 1 presents the demographic breakdown of the 50 surveyed homeowners who participated in the study. The sample was predominantly older, with 68% of respondents aged 60–79, while only 10% were under 60. Most participants (68%) were female, and 64% identified as Black or African American, followed by 20% identifying as “Other” and 10% as Mixed-Race.
Regarding ethnicity, 28% of respondents identified as Hispanic, while 66% identified as Non-Hispanic. The survey was conducted primarily in English (84%), with 16% of responses collected in Spanish, reflecting the linguistic diversity of the affected communities.
In terms of income levels, most respondents reported monthly incomes between USD 1000 and USD 2999 (50%), with 14% earning below USD 1000 per month, indicating that many participants were from lower-income households. The average monthly income among respondents was USD 1510.45.
A significant proportion of respondents (52%) reported having a disability, while 38% did not, and 10% chose not to disclose this information. This finding suggests that accessibility and mobility concerns may be important considerations in home elevation decisions.
Finally, 74% of respondents had elevated their homes, while 26% had not, highlighting varying adoption rates of home elevation across different communities. These findings provide critical insights into the socioeconomic and demographic factors influencing recovery and home elevation decisions in flood-prone neighborhoods.

3.2.2. Diverse Home Elevation Practices and Their Relationship with Flooding Frequency

Initially, our research team expected that homeowners would only consider pier and beam homes as elevated, given that this method—raising homes on stilts or pilings—is a well-established strategy for flood protection. However, fieldwork revealed that residents recognized additional methods of home elevation, broadening our understanding of how elevation is perceived and implemented in flood-prone communities.
Figure 8 categorizes the four types of home elevation identified by residents. In Figure 8a, the top left image shows a non-elevated slab home constructed directly on a concrete foundation at ground level. In Figure 8b, the top right image presents a standard pier and beam home raised above the floodplain, often with ramps or stairs for accessibility. The bottom images (Figure 8c,d) depict slab homes that residents considered elevated due to modifications made by construction companies. Figure 8c (bottom left) showcases a slab home raised by 4–6 inches, while Figure 8d (bottom right) illustrates a home elevated using fill material beneath the slab foundation to increase elevation above the flood zone. These alternative elevation techniques highlight the variety of approaches used to mitigate flood risks, demonstrating that elevation is not solely limited to traditional pier and beam construction.

3.2.3. Survey Findings on Home Elevation and Flooding Frequency

Survey responses provide additional insights into home elevation decisions and flooding experiences among homeowners. As shown in Table 2, most homeowners applied for elevation assistance between 2019 and 2021, aligning with post-Hurricane Harvey recovery efforts. Of the 37 homes that were elevated, 30% were located in designated flood zones, while 70% were not, suggesting that some homeowners pursued elevation even outside high-risk areas. Similarly, among the 13 non-elevated homes, nearly 93% were located outside of flood zones, which may indicate a perception that elevation is unnecessary unless the home is within a high-risk area.
Homeowners’ awareness of their flood risk played a role in their decision-making. While 40% of respondents were certain that their homes were in flood zones, an equal percentage was unsure of their flood zone status, pointing to gaps in public awareness and risk communication.

3.2.4. Home Elevation Heights and Flooding History

Survey data also revealed differences in elevation height based on prior flooding experiences. As Table 3 illustrates, homeowners who experienced frequent flooding raised their homes by an average height of 44.2 inches, significantly higher than those who experienced flooding only during Hurricane Harvey (31.7 inches) or from other minor events (26.4 inches). This pattern suggests that frequent flood victims are more inclined to pursue higher elevations as a long-term flood mitigation strategy.

3.2.5. Demographic Factors Influencing Home Elevation Decisions

The analysis of respondent demographics revealed statistically significant relationships between age, disability status, and home elevation decisions. The following points were indicated by chi-squared test results.
Older homeowners were more likely to elevate their homes. Approximately 70.27% of respondents aged 60–79 elevated their homes, compared to only 5.41% of those aged 40–59 and one respondent under 39. This suggests that older homeowners, possibly influenced by past flooding experiences and long-term homeownership, are more proactive about flood mitigation.
Disability status influenced elevation choices. Among respondents who did not report a disability, 96% elevated their homes, compared to 68% of those who identified as having a disability or living with someone with a disability. The disparity suggests that physical mobility concerns, financial limitations, or accessibility challenges may discourage some households from pursuing elevation. However, given the small sample size, further research with a larger dataset is recommended to validate these findings.
Other demographic factors, such as education level and income, did not show statistically significant relationships with home elevation decisions. Additionally, there was no substantial difference in the average number of years that respondents had lived in their neighborhoods—those who elevated had lived there for an average of 38.41 years, while those who did not had lived there for 39.08 years.

3.3. Interviews

3.3.1. The Role of Government Assistance in Home Elevation

Discussing the impact of government assistance programs, an elevation specialist highlighted the financial support available for homeowners’ considering elevation: “There are funds available to assist homeowners in paying for this, and a lot of the time financial assistance will cover 100% of the cost. Sometimes homeowners have a cost share, but a lot of the time it can be 100% cost for them.” This statement underscores the critical role of financial aid in making elevation accessible to homeowners, particularly those directly affected by disasters and lacking the financial resources to fund such modifications independently.

3.3.2. Perceptions of Home Elevation Effectiveness

While financial support can incentivize home elevation, community perspectives on its effectiveness remain divided. Some residents were skeptical about whether elevation would provide long-term flood protection and questioned the structural durability of elevated homes. One homeowner expressed concern, stating, “I’ve seen a couple of elevated homes around here that still experienced issues during floods. It makes you wonder how effective this is.”
Additionally, some residents worried about potential stability issues, particularly regarding water pooling beneath elevated homes and long-term foundation degradation. Others voiced concerns about future maintenance costs, particularly the need for repairs to elevated supports over time. Contrasting these doubts, a professional in elevation construction emphasized the peace of mind that elevation provides: “Once it gets their house off the ground, they’re not susceptible to flooding anymore. It brings peace of mind.”
This perspective suggests that while skepticism exists, direct experiences with flooding and assurances from professionals may influence homeowners to reconsider their stance on elevation. A growing awareness of climate change and increasing flood risks also shaped residents’ perceptions. One homeowner reflected on the uncertainty of future weather patterns, stating: “With the climate changing and all these weather patterns shifting, I’m not sure what will happen in the next few years. It makes you think if elevation might be a necessity.” Similarly, past flood experiences prompted some homeowners to actively consider elevation: “Every time it rains hard, I just brace myself because this area is known for flooding. That’s why I considered elevation now.”

3.3.3. Community Influence and Esthetic Preferences

Beyond financial and structural considerations, community esthetics played a significant role in homeowners’ decisions. Some residents were reluctant to elevate their homes due to concerns about neighborhood character. One participant expressed hesitation, stating, “I don’t want my house to stick out like a sore thumb in this neighborhood.”
This sentiment reflects a broader desire to maintain visual continuity in residential areas. Another homeowner emphasized the importance of preserving traditional architectural styles: “Most of us moved here because of the character of the houses.” Additionally, concerns arose about the cumulative effect of multiple elevated homes on neighborhood esthetics: “I worry that too many elevated homes might change the look.”
Recognizing these concerns, an elevation expert emphasized the importance of designing elevated homes to align with existing neighborhood styles: “We have to make sure that everything we do, especially if it’s visible, fits in with the character of the neighborhood.”

3.3.4. Practical and Physical Considerations Regarding Elevated Homes

Practical concerns, especially those related to accessibility and mobility, were major factors in homeowners’ elevation decisions. One resident highlighted the daily challenges of living in an elevated home: “It’s not just about flood protection; it’s about how we live day-to-day. My concern is accessing my home easily every day without strain.”
Emergency preparedness also influenced concerns, with one participant questioning how quickly they could evacuate if necessary: “What worries me is how quickly we can get out in an emergency with these elevated setups. It’s something we have to think about seriously.” Mobility challenges were particularly relevant for older residents, as one participant noted: “Getting up and down the new stairs can be daunting, especially for older folks like us who’ve lived here all our lives.”
To address accessibility concerns, ramps were frequently cited as a crucial feature. Many residents found them beneficial, as one homeowner shared, “These ramps have made a difference for my mobility. Without them, I couldn’t imagine accessing my home comfortably.”
Even for those without mobility issues, ramps were seen as a necessity for future homebuyers: “The ramps are not just a convenience; they are a necessity for many of our neighbors who would otherwise struggle with stairs.” However, some homeowners found ramps impractical due to their placement, particularly when they extended far from driveways or entrances. Additionally, wooden ramps were viewed as less desirable than concrete alternatives, which provide more stability and longevity.

4. Discussion

4.1. Synthesizing Findings: Disparities in Flood Adaptation and Policy Implications

Our findings align with existing research on flood adaptation, social vulnerability, and housing policy, reaffirming that disaster mitigation efforts must be tailored to the needs of socioeconomically disadvantaged communities. Prior studies have demonstrated that homeowners’ decisions to elevate their homes are influenced by financial constraints, risk perception, and access to government assistance [1,6]. Our study highlights the multifaceted nature of home elevation decisions and the broader implications for flood adaptation and disaster recovery. While financial incentives and risk awareness are crucial motivators, social vulnerability, accessibility concerns, and neighborhood esthetics significantly influence homeowners’ decisions. These findings underscore the fact that policy interventions must extend beyond financial support to address structural inequities in program implementation.
Disparities in home elevation completion rates reflect broader patterns of inequitable disaster recovery. The spatial analysis reveals that socially vulnerable communities, particularly those with higher proportions of minority and low-income residents, have lower completion rates for home elevation projects. This suggests that systemic barriers—such as bureaucratic complexity, lack of information, and historical disinvestment—continue to impede equitable access to resilience-building measures. While wealthier communities tend to retain existing housing structures with minor modifications, low-income neighborhoods experience more extensive demolitions and rebuilds, further exacerbating displacement and long-term housing insecurity.
Our findings align with previous research on the challenges faced by low-income communities in accessing disaster mitigation funding. Despite the availability of home elevation assistance, program uptake remains uneven, particularly among homeowners with disabilities and those uncertain about their flood risk. A significant proportion of surveyed homeowners were unaware of their flood zone status, pointing to deficiencies in public communication and outreach efforts. Addressing these gaps requires a more proactive, community-centered approach to disaster preparedness and risk mitigation.

4.2. Practical Considerations and Homeowner Decision-Making

Beyond financial and policy-related factors, homeowners’ perceptions of home elevation effectiveness vary widely. While many see elevation as a long-term flood protection strategy, others remain skeptical due to concerns about structural integrity, maintenance costs, and neighborhood esthetics. These perceptions influence program participation rates and highlight the need for clearer public messaging on the benefits and trade-offs of home elevation.
The findings also reveal important insights into mobility and accessibility concerns. While ramps and accessibility modifications are available, they are not always practical or desirable for homeowners, particularly in communities where esthetic cohesion is highly valued. Older homeowners, who make up a significant portion of those opting for elevation, often cite past flooding experiences as a primary motivator. Conversely, individuals with disabilities report hesitations due to the logistical challenges of accessing elevated homes. This suggests that current elevation programs may need to incorporate more flexible, adaptive solutions tailored to diverse household needs.

4.3. Policy Recommendations and Future Research Directions

Many homeowners remain uncertain about their flood risk status and available mitigation options. More effective communication strategies, including targeted community engagement and multilingual resources, are needed to ensure that residents can make informed decisions.
While elevation can provide crucial flood protection, accessibility remains a major barrier for individuals with disabilities. Future programs should integrate more inclusive design features and offer financial support for adaptive modifications beyond traditional ramps.
The lower completion rates in socially vulnerable neighborhoods suggest systemic inequities in program implementation. Streamlining application processes, reducing bureaucratic hurdles, and providing targeted support for historically marginalized communities can enhance accessibility and participation.
While elevation is a widely recommended flood mitigation strategy, its long-term effectiveness in different socio-economic and environmental contexts remains uncertain. Future research should examine post-elevation outcomes, including maintenance challenges, changes in property values, and shifts in community demographics.
Given the clear disparities in program outcomes, home elevation initiatives should be embedded within broader environmental justice frameworks. Policies should prioritize vulnerable communities, ensuring equitable access to flood protection resources and minimizing displacement risks.

4.4. Limitations and Opportunities for Further Study

While this study provides valuable insights, it is limited in scope and sample size. A larger dataset encompassing a wider geographic area would enhance the generalizability of findings. Additionally, future research should incorporate longitudinal analyses to track changes in home elevation adoption and effectiveness over time. Comparative studies across different cities and regions could further illuminate best practices for equitable disaster recovery and climate adaptation.

5. Conclusions

This study has underscored the complex interplay between social vulnerability, housing policy, and flood adaptation in post-disaster recovery. While home elevation programs offer critical flood mitigation opportunities, their effectiveness is constrained by systemic inequities in program implementation, accessibility, and homeowner perceptions. Older homeowners are more likely to elevate their homes, whereas individuals with disabilities face additional barriers, pointing to the need for more adaptive, inclusive solutions.
Beyond its immediate policy implications, this research contributes to broader discussions on climate resilience, disaster recovery, and equitable urban planning. Addressing disparities in home elevation outcomes requires a holistic approach that integrates financial assistance, targeted outreach, and accessibility considerations. By centering the needs of historically marginalized communities, policymakers and practitioners can develop more effective and equitable flood mitigation strategies that enhance long-term resilience for all homeowners.

Author Contributions

Conceptualization, I.G., Z.T. and J.O.; Methodology, I.G., Z.T. and J.O.; Software, I.G. and Z.T.; Validation, I.G., Z.T., J.O. and L.M.-R.; Formal analysis, I.G. and Z.T.; Investigation, I.G., Z.T., J.O. and W.W.; Resources, I.G., Z.T. and J.O.; Data curation, I.G., Z.T., J.O. and W.W.; Writing—original draft, I.G., Z.T., J.O. and L.M.-R.; Writing—review & editing, I.G., Z.T., J.O. and L.M.-R.; Visualization, I.G. and Z.T.; Supervision, I.G.; Project administration, I.G.; Funding acquisition, I.G., Z.T. and J.O. All authors have read and agreed to the published version of the manuscript.

Funding

This research received external funding from the Natural Hazard Center.

Institutional Review Board Statement

Institutional Review Board (IRB) (ID: STUDY2004-0011).

Data Availability Statement

Data are available upon request.

Acknowledgments

We thank our participants.

Conflicts of Interest

The authors declare no conflicts of interest.

Abbreviations

The following abbreviations are used in this manuscript:
FEMAFederal Emergency Management Agency
GLOTexas General Land Office
HOAHomeowner Assistance Program
HoAPHarvey Homeowner Assistance Program

References

  1. Peacock, W.G.; Zandt, S.V.; Zhang, Y.; Highfield, W.E. Inequities in Long-Term Housing Recovery After Disasters. J. Am. Plan. Assoc. 2014, 80, 356–371. [Google Scholar] [CrossRef]
  2. Lu, Y. Hurricane Flooding and Environmental Inequality: Do Disadvantaged Neighborhoods Have Lower Elevations? Socius 2017, 3, 2378023117740700. [Google Scholar] [CrossRef]
  3. Zahran, S.; Brody, S.D.; Peacock, W.G.; Vedlitz, A.; Grover, H. Social Vulnerability and the Natural and Built Environment: A Model of Flood Casualties in Texas. Disasters 2008, 32, 537–560. [Google Scholar] [CrossRef] [PubMed]
  4. Grothmann, T.; Reusswig, F. People at Risk of Flooding: Why Some Residents Take Precautionary Action While Others Do Not. Nat. Hazards 2006, 38, 101–120. [Google Scholar] [CrossRef]
  5. Poussin, J.K.; Botzen, W.J.W.; Aerts, J.C.J.H. Factors of Influence on Flood Damage Mitigation Behaviour by Households. Environ. Sci. Policy 2014, 40, 69–77. [Google Scholar] [CrossRef]
  6. Botzen, W.J.W.; Aerts, J.C.J.H.; van den Bergh, J.C.J.M. Individual Preferences for Reducing Flood Risk to near Zero through Elevation. Mitig. Adapt. Strat. Glob. Chang. 2013, 18, 229–244. [Google Scholar] [CrossRef]
  7. Danh, V.T.; Mushtaq, S. Living with Floods: An Evaluation of the Resettlement Program of the Mekong Delta of Vietnam. In Environmental Change and Agricultural Sustainability in the Mekong Delta; Stewart, M.A., Coclanis, P.A., Eds.; Advances in Global Change Research; Springer: Dordrecht, The Netherlands, 2011; pp. 181–204. ISBN 978-94-007-0934-8. [Google Scholar]
  8. Al Assi, A.; Mostafiz, R.B.; Friedland, C.J.; Rohli, R.V.; Rahim, M.A. Homeowner Flood Risk and Risk Reduction from Home Elevation between the Limits of the 100- and 500-Year Floodplains. Front. Earth Sci. 2023, 11, 1051546. [Google Scholar]
  9. Mobley, W.; Atoba, K.O.; Highfield, W.E. Uncertainty in Flood Mitigation Practices: Assessing the Economic Benefits of Property Acquisition and Elevation in Flood-Prone Communities. Sustainability 2020, 12, 2098. [Google Scholar] [CrossRef]
  10. Cohen, S.; Brakenridge, G.R.; Kettner, A.; Bates, B.; Nelson, J.M.; McDonald, R.R.; Huang, Y.-F.; Munasinghe, D.; Zhang, J. Estimating Floodwater Depths from Flood Inundation Maps and Topography. J. Am. Water Resour. Assoc. 2018, 54, 847–858. [Google Scholar] [CrossRef]
  11. Zhang, W.; Villarini, G.; Vecchi, G.A.; Smith, J.A. Urbanization Exacerbated the Rainfall and Flooding Caused by Hurricane Harvey in Houston. Nature 2018, 563, 384–388. [Google Scholar] [CrossRef] [PubMed]
  12. Texas Division of Emergency Management Hurricane Harvey DR-4332. Available online: https://www.tdem.texas.gov/disasters/hurricane-harvey (accessed on 8 March 2025).
  13. National Hurricane Center Costliest U.S. Tropical Cyclones Tables Updated. 2018. Available online: https://data.globalchange.gov/report/costliest-us-tropical-cyclones-tables-updated-2018 (accessed on 1 October 2024).
  14. Malecha, M.L.; Woodruff, S.C.; Berke, P.R. Planning to Exacerbate Flooding: Evaluating a Houston, Texas, Network of Plans in Place during Hurricane Harvey Using a Plan Integration for Resilience Scorecard. Nat. Hazards Rev. 2021, 22, 04021030. [Google Scholar] [CrossRef]
  15. Douglas, B.E. One in Five Texans Lives in a Floodplain, State’s First-Ever Analysis Shows. Available online: https://www.texastribune.org/2023/07/28/texas-floodplain-water-development-board-flood-plan/ (accessed on 8 March 2025).
  16. Flanagan, K. A Genealogy of Public Housing Production: Practice, Knowledge and the Broadacre Housing Estate. Hous. Theory Soc. 2015, 32, 407–428. [Google Scholar] [CrossRef]
  17. Ramesh, B.; Jagger, M.A.; Zaitchik, B.; Kolivras, K.N.; Swarup, S.; Deanes, L.; Hallisey, E.; Sharpe, J.D.; Gohlke, J.M. Flooding and Emergency Department Visits: Effect Modification by the CDC/ATSDR Social Vulnerability Index. Int. J. Disaster Risk Reduct. 2022, 76, 102986. [Google Scholar] [CrossRef] [PubMed]
Figure 1. Federal Emergency Management Agency floodplain map of Harris County, Texas. Note: From FEMA’s National Flood Hazard Layer (NFHL) Viewer [Dataset] by Federal Emergency Management Agency, n.d. Retrieved 1 October 2024 (https://www.fema.gov/flood-maps/national-flood-hazard-layer, accessed on 1 October 2024).
Land 14 00689 g001
Figure 2. Percentage of persons living below the 150% poverty line in Harris County, Texas, by census tract. Note: From CDC/ATSDR Social Vulnerability Index 2020 Database, Harris County, Texas, by Centers for Disease Control and Prevention ([17], https://www.atsdr.cdc.gov/place-health/php/svi/svi-data-documentation-download.html?CDC_AAref_Val=https://www.atsdr.cdc.gov/placeandhealth/svi/data_documentation_download.html, accessed on 1 October 2024).
Land 14 00689 g002
Figure 3. Percentage of nonwhite population in Harris County, Texas, by census tract. Note: From CDC/ATSDR Social Vulnerability Index 2020 Database, Harris County, Texas, by Centers for Disease Control and Prevention (https://www.atsdr.cdc.gov/placeandhealth/svi/data_documentation_download.html, accessed on 1 October 2024).
Land 14 00689 g003
Figure 4. Total social vulnerability percentiles of census tracts in Harris County, Texas. Note: From CDC/ATSDR Social Vulnerability Index 2020 Database, Harris County, Texas, by Centers for Disease Control and Prevention (https://www.atsdr.cdc.gov/placeandhealth/svi/data_documentation_download.html, accessed on 1 October 2024).
Land 14 00689 g004
Figure 5. Total number of completed home elevation projects in the Homeowner Assistance Program projects by super neighborhoods in Houston, Texas (Data accessed on 3 May 2024). Note: Map constructed by the research team using data from Transparency and Reporting Portal (https://recovery.houstontx.gov/dr17/transparency/, accessed on 1 October 2024), City of Houston Recovery Programs, n.d. Retrieved 5 March 2024. (https://recovery.houstontx.gov/dr17/transparency/, accessed on 3 May 2024). According to the City of Houston, super neighborhoods were established to encourage collaboration among residents of neighboring communities, enabling them to collectively identify, prioritize, and address the needs and concerns of the larger community.
Land 14 00689 g005
Figure 6. Completion rates of Homeowner Assistance Program projects in super neighborhoods in Houston, Texas. Note: Map constructed by the research team using data from Transparency and Reporting Portal (https://recovery.houstontx.gov/dr17/transparency.html, accessed on 3 May 2024), City of Houston Recovery Programs, n.d. Retrieved 5 March 2024. (https://recovery.houstontx.gov/dr17/transparency.html, accessed on 3 May 2024).
Land 14 00689 g006
Figure 7. Weighted overlay of total social vulnerability and completion rate of home assistance program projects. Note: Map constructed by the research team using data from Transparency and Reporting Portal (https://recovery.houstontx.gov/dr17/transparency, accessed on 5 March 2024), City of Houston Recovery Programs, n.d. Retrieved 5 March 2024. (https://recovery.houstontx.gov/dr17/transparency, accessed on 5 March 2024). The value represents a combination of social vulnerability and program completion rate. A value of 1 indicates the area with the highest social vulnerability and the lowest completion rate.
Land 14 00689 g007
Figure 8. How residents categorized types of non-elevated and elevated homes. Photographs of homes showcasing the different types of elevations that were observed as part of the fieldwork: (a) a non-elevated home on a slab; (b) a property elevated in the pier and beam style with a ramp; (c) a property elevated on a slab with an accessible entrance; and (d) a home elevated using dirt. Photographs by the research team, 2024.
Land 14 00689 g008
Table 1. Selected characteristics of research participants.
CharacteristicVariableNumber of Respondents (N)%
Age (a)20–3924%
40–5936%
60–793468%
80+918%
Not Provided24%
GenderFemale3468%
Male1428%
Not Provided24%
RaceWhite00%
Asian00%
Native Hawaiian and Other Pacific Islander00%
Black or African American3264%
American Indian or Alaska Native36%
Mixed-Race510%
Other1020%
EthnicityHispanic1428%
Non-Hispanic3366%
Not Provided36%
Survey LanguageEnglish4284%
Spanish816%
Income (b)USD 0 to USD 49924%
USD 500 to USD 999714%
USD 1000 to USD 14991122%
USD 1500 to USD 199948%
USD 2000 to USD 2499714%
USD 2500 to USD 299936%
USD 3000 to USD 349924%
USD 3500 to USD 399948%
USD 4000 to USD 449924%
USD 4500 to USD 499912%
Disability (c)Has a Disability2652%
Does Not Have a Disability1938%
Not Provided510%
Elevated HomeYes3774%
No1326%
Note: N = 50. (a) The average age of respondents was 70.1 years. (b) The average monthly income among respondents was USD 1510.45. (c) Disability was auto-designated by participants; they were simply asked whether they had a disability or someone with a disability in their household composition.
Table 2. Survey responses regarding home elevation and flooding frequency.
CategoryVariableNumber of Respondents
N%
Application Year201724%
2018816%
20191734%
2020510%
2021816%
202248%
202336%
Not Provided36%
Elevation DecisionYes (Elevated Home)3774%
No (Declined Home Elevation)1326%
Location of Elevated Homes aIn Flood Zone1130%
Not in Flood Zone2670%
Location of Non-Elevated Homes bIn Flood Zone17.69%
Not in Flood Zone1292.34%
Homeowner Knowledge of Home’s LocationCertain in Flood Zone2040%
Certain was Not in Flood Zone918%
Unsure of Whether in Flood Zone2040%
Not Provided12%
Flooding Frequency GroupFrequent Flooding Group918%
Harvey Flooding Group2958%
Other Flooding Group510%
Never-Flooded Group510%
Not Provided24%
Note: N = 50 survey and interview respondents. a N = 37 homeowners in our sample who elevated their homes. b N = 13 homeowners in our sample who did not elevate their homes.
Table 3. Average home elevation height by flooding frequency group.
Flooding Frequency GroupAverage Home Elevation HeightStandard Deviation (SD)
All Groups35 inches9.14 inches
Frequent Flooding Group44.2 inches28.6 inches
Harvey Flooding Group31.7 inches25.8 inches
Other Flooding Group26.4 inches17.3 inches
Note: N = 37 homeowners in our sample who elevated their homes.
Disclaimer/Publisher’s Note: The statements, opinions and data contained in all publications are solely those of the individual author(s) and contributor(s) and not of MDPI and/or the editor(s). MDPI and/or the editor(s) disclaim responsibility for any injury to people or property resulting from any ideas, methods, instructions or products referred to in the content.

