Article

Integrating Ecological Footprint into Regional Ecological Well-Being Evaluation: A Case Study of the Guanzhong Plain Urban Agglomeration, China

1
College of Economics and Management, Northwest Agriculture and Forestry University, Xianyang 712100, China
2
School of Public Administration, Xi’an University of Architecture and Technology, Xi’an 710055, China
*
Author to whom correspondence should be addressed.
Land 2025, 14(4), 688; https://doi.org/10.3390/land14040688
Submission received: 21 February 2025 / Revised: 13 March 2025 / Accepted: 20 March 2025 / Published: 25 March 2025

Abstract

:
This study incorporated ecological footprint (EF) consumption into a framework to assess ecological well-being. A model and implementation framework for characterizing regional net ecological well-being were then developed. Using the Guanzhong Plain Urban Agglomeration (GPUA) as a case study, land use data from 2000 to 2020 were utilized to calculate the ecosystem service value (ESV), representing the supply side of regional ecological functions. Simultaneously, the regional EF consumption was assessed as the demand side. Taking into account the level of regional economic development and the characteristics of people’s living, a regional net ecological well-being evaluation model was constructed to arrive at a deficit or surplus ecological situation. The results indicated that: (1) The overall ESV of the GPUA follows a trend of initial growth followed by a decline. Woodland, grassland, and farmland are the main contributors to the total ESV, with regulating and supporting services accounting for more than 80% of the total ecosystem value. (2) EF consumption in the GPUA shows a significant upward trend, increasing by over 70% on average. The level of ecological carrying capacity has slightly increased, with the biologically productive area that can support human activities expanding to 1909.49 million hectares. Additionally, the carrying capacity of the urban agglomeration cities has tended to stabilize since 2015. (3) Since 2010, anthropogenic consumption in the GPUA has continued to exceed the regional ecological capacity, resulting in an ecological well-being deficit. The average ecological well-being compensation per hectare in the urban agglomeration increased from 35.588 CNY to 187.110 CNY. This study offers a theoretical foundation for expanding the definition and research framework of regional ecological well-being by providing a more accurate assessment of regional ecological service supply and consumption at multiple scales. It is expected that this approach will help reduce the opportunity costs associated with ecological protection, while promoting a balanced approach to economic development and ecological preservation.

1. Introduction

Ecosystems provide essential services that underpin almost every aspect of human well-being, providing ecological goods and services through a variety of natural processes [1,2]. Ecological sustainability requires an increase in (appropriate) ecosystems, species and biodiversity to enhance resilience against fires, floods, heat waves, tornadoes, and other destabilizing events. At the beginning of the 21st century, the Millennium Ecosystem Assessment (MA), published by the United Nations Environment Programme (UNEP), provided a comprehensive ecological review of the complex links between human well-being and environmental functions [3]. Cities are a major contributor to global energy consumption, and cities around the world are trying to balance economic growth, environmental sustainability and energy use. Developed countries are faced with the challenge of modernizing aging infrastructure within their cities [4]. Rapid urbanization in developing countries and regions, including China, has greatly increased the demand for energy, water and land resources. As a result, ecological land, including agricultural land, is being rapidly converted for urban purposes, resulting in fragmented natural landscapes and a reduced capacity to provide ecosystem services [5]. This fragmentation impedes the full potential of ecosystems to deliver services, thus diminishing the supply of ecosystem services to urban areas and threatening their long-term sustainable development [6]. Furthermore, the depletion of ecological resources poses a significant risk to the ecological carrying capacity of these regions, creating substantial challenges to maintaining regional ecological security [7,8]. In response, China has increasingly incorporated ecosystem security and human well-being into its national strategy for building an ecological civilization. This includes the integration of resource consumption and ecological efficiency into the evaluation systems for both economic and social development.
Ecological well-being provides human societies with a range of ecological goods and services, both in quantity and quality, through complex ecological processes. The level of ecological well-being is commonly assessed by evaluating the value of ecosystem services [9]. In terms of assessment methodologies, Xie et al. established an ecosystem service value assessment system tailored to domestic ecosystems, building on the foundational work of earlier researchers [10,11]. The availability and accessibility of these ecosystem services influence their distribution and consumption, which in turn results in spatial disparities in service availability [12]. On this basis, scholars have conducted in-depth research on ecological compensation from a well-being perspective, examining the interplay between ecosystem service values and human well-being [13]. The EF transforms the ecological–economic process into a security issue by addressing the balance of supply and demand within ecologically productive spaces [14,15]. This process involves categorizing consumption demand based on land-use types and regional resource endowments, as well as assessing the offset and consumption of services provided by ecosystems [16].
Recent advances, including the three-dimensional EF method and the energy value EF model, combined ecosystem service values to enable comparative studies of ecological compensation across different regions [17]. These studies analyzed the impact of socio-economic activities on watershed ecosystems [18] and focused on the mechanisms of ecological compensation in watersheds through differential methods and spatial measurements [19]. The rest of the studies have been advancing in measuring indicators such as EF, ecological profit and loss, and ecological pressure, which are essential for evaluating the development of ecological environments [20,21].
While prior studies have explored ESV and EF independently, their integration to assess net ecological well-being remains underexplored. For instance, Deng et al. [12] emphasized the need for precise modeling of EF but did not address its impact on ecological well-being. In summary, while research on the value of ecosystem services and EF is relatively well-developed, several key areas remain underexplored: (1) Few studies have integrated ecosystem service values and EF to analyze net ecological well-being; (2) The current accounting of fossil fuel land use in EF, typically based on energy consumption per unit of GDP, is constrained by data limitations, necessitating further refinement for accuracy; (3) Most research has focused on national-level assessments, urban areas in economically developed eastern regions, or specific ecosystems such as rivers and lakes; (4) There is a noticeable gap in studies examining the relationship between EF and ecological well-being in urban agglomerations in the western regions of China.
This study made the following advances to address the shortcomings of existing studies: (1) The value of ecosystem services in the Guanzhong Plain Urban Agglomeration (GPUA) was measured with high precision using two key indicators: equivalent food value at the socio-economic level and vegetation cover index at the natural ecological level. (2) Nighttime lighting data from the DMSP-OLS satellite were used to estimate fossil energy consumption within the EF. These data were processed through a regression model calibrated with regional energy statistics to ensure data accuracy. (3) This study also assessed the current state of ecological security by investigating the ecological deficit or surplus, while synthesizing the regional level of economic development and people’s standard of living. The regional GDP and Engel’s coefficient were adjusted to calculate the net ecological well-being of the region, thus providing a more accurate theoretical basis for improving ecological well-being and ecological security. On this basis, targeted regional compensation programs are proposed to strengthen ecological protection and promote high-quality coordinated development of regional urban agglomerations.
This study defines ecological well-being as net ecological well-being, which refers to the value of ecosystem service provision under the constraint of EF depletion. Net ecological well-being provides a more accurate measure of the surplus or deficit in a region’s ecosystems, considering the pressures exerted by human activities and social development. The primary objective of this study was to establish a comprehensive framework for assessing regional ecological well-being by integrating ESV and EF consumption [22,23]. While this study focuses on quantifying the supply–demand relationship of biophysical resources through Ecosystem Service Value (ESV) and Ecological Footprint (EF) frameworks, it is important to clarify that our assessment does not encompass the full spectrum of ecological sustainability. Specifically, aspects including biodiversity conservation, ecological resilience to climate extremes, and the cumulative impacts of emerging contaminants (e.g., microplastics, PFAS) fall beyond the scope of this quantitative analysis. Our operational definition of ecological carrying capacity herein refers specifically to the bioproductive land’s capacity to support anthropogenic resource consumption, rather than pre-industrial biodiversity baselines [24,25]. Specifically, this research seeks to address the following scientific questions: (1) How can we define the ecological well-being of a region more precisely and establish relationships between ecological well-being, ESV and the EF? (2) How can the level of regional ecological well-being be calculated in relation to the level of economic and social development of the region?
The Guanzhong Plain Urban Agglomeration (GPUA) is the only urban cluster in China’s national strategy explicitly designated as a pioneering area for inland ecological civilization development. Situated in northwestern China, the GPUA faces an inherently fragile ecological environment, with complex natural systems such as the Qinling Mountains, the Loess Plateau, and the Weihe River Basin. The GPUA, designated as a pilot for inland ecological civilization, faces unique challenges. These include fragile ecological environments, population pressures, and insufficient valuation of ecological products. This region is characterized by a complex and diverse geological landscape, a fragile ecological environment, and unique developmental issues, making it an ideal context for examining net ecological well-being in relation to ecosystem service provision and EF depletion. This research is essential for assessing regional ecological security, stabilizing the value of ecological products, and promoting equitable access to a healthy ecological environment. Furthermore, it holds significant academic value for the construction of ecological security barriers in arid and semi-arid regions, not only in northwest China but also in similar regions worldwide.

2. Materials and Methods

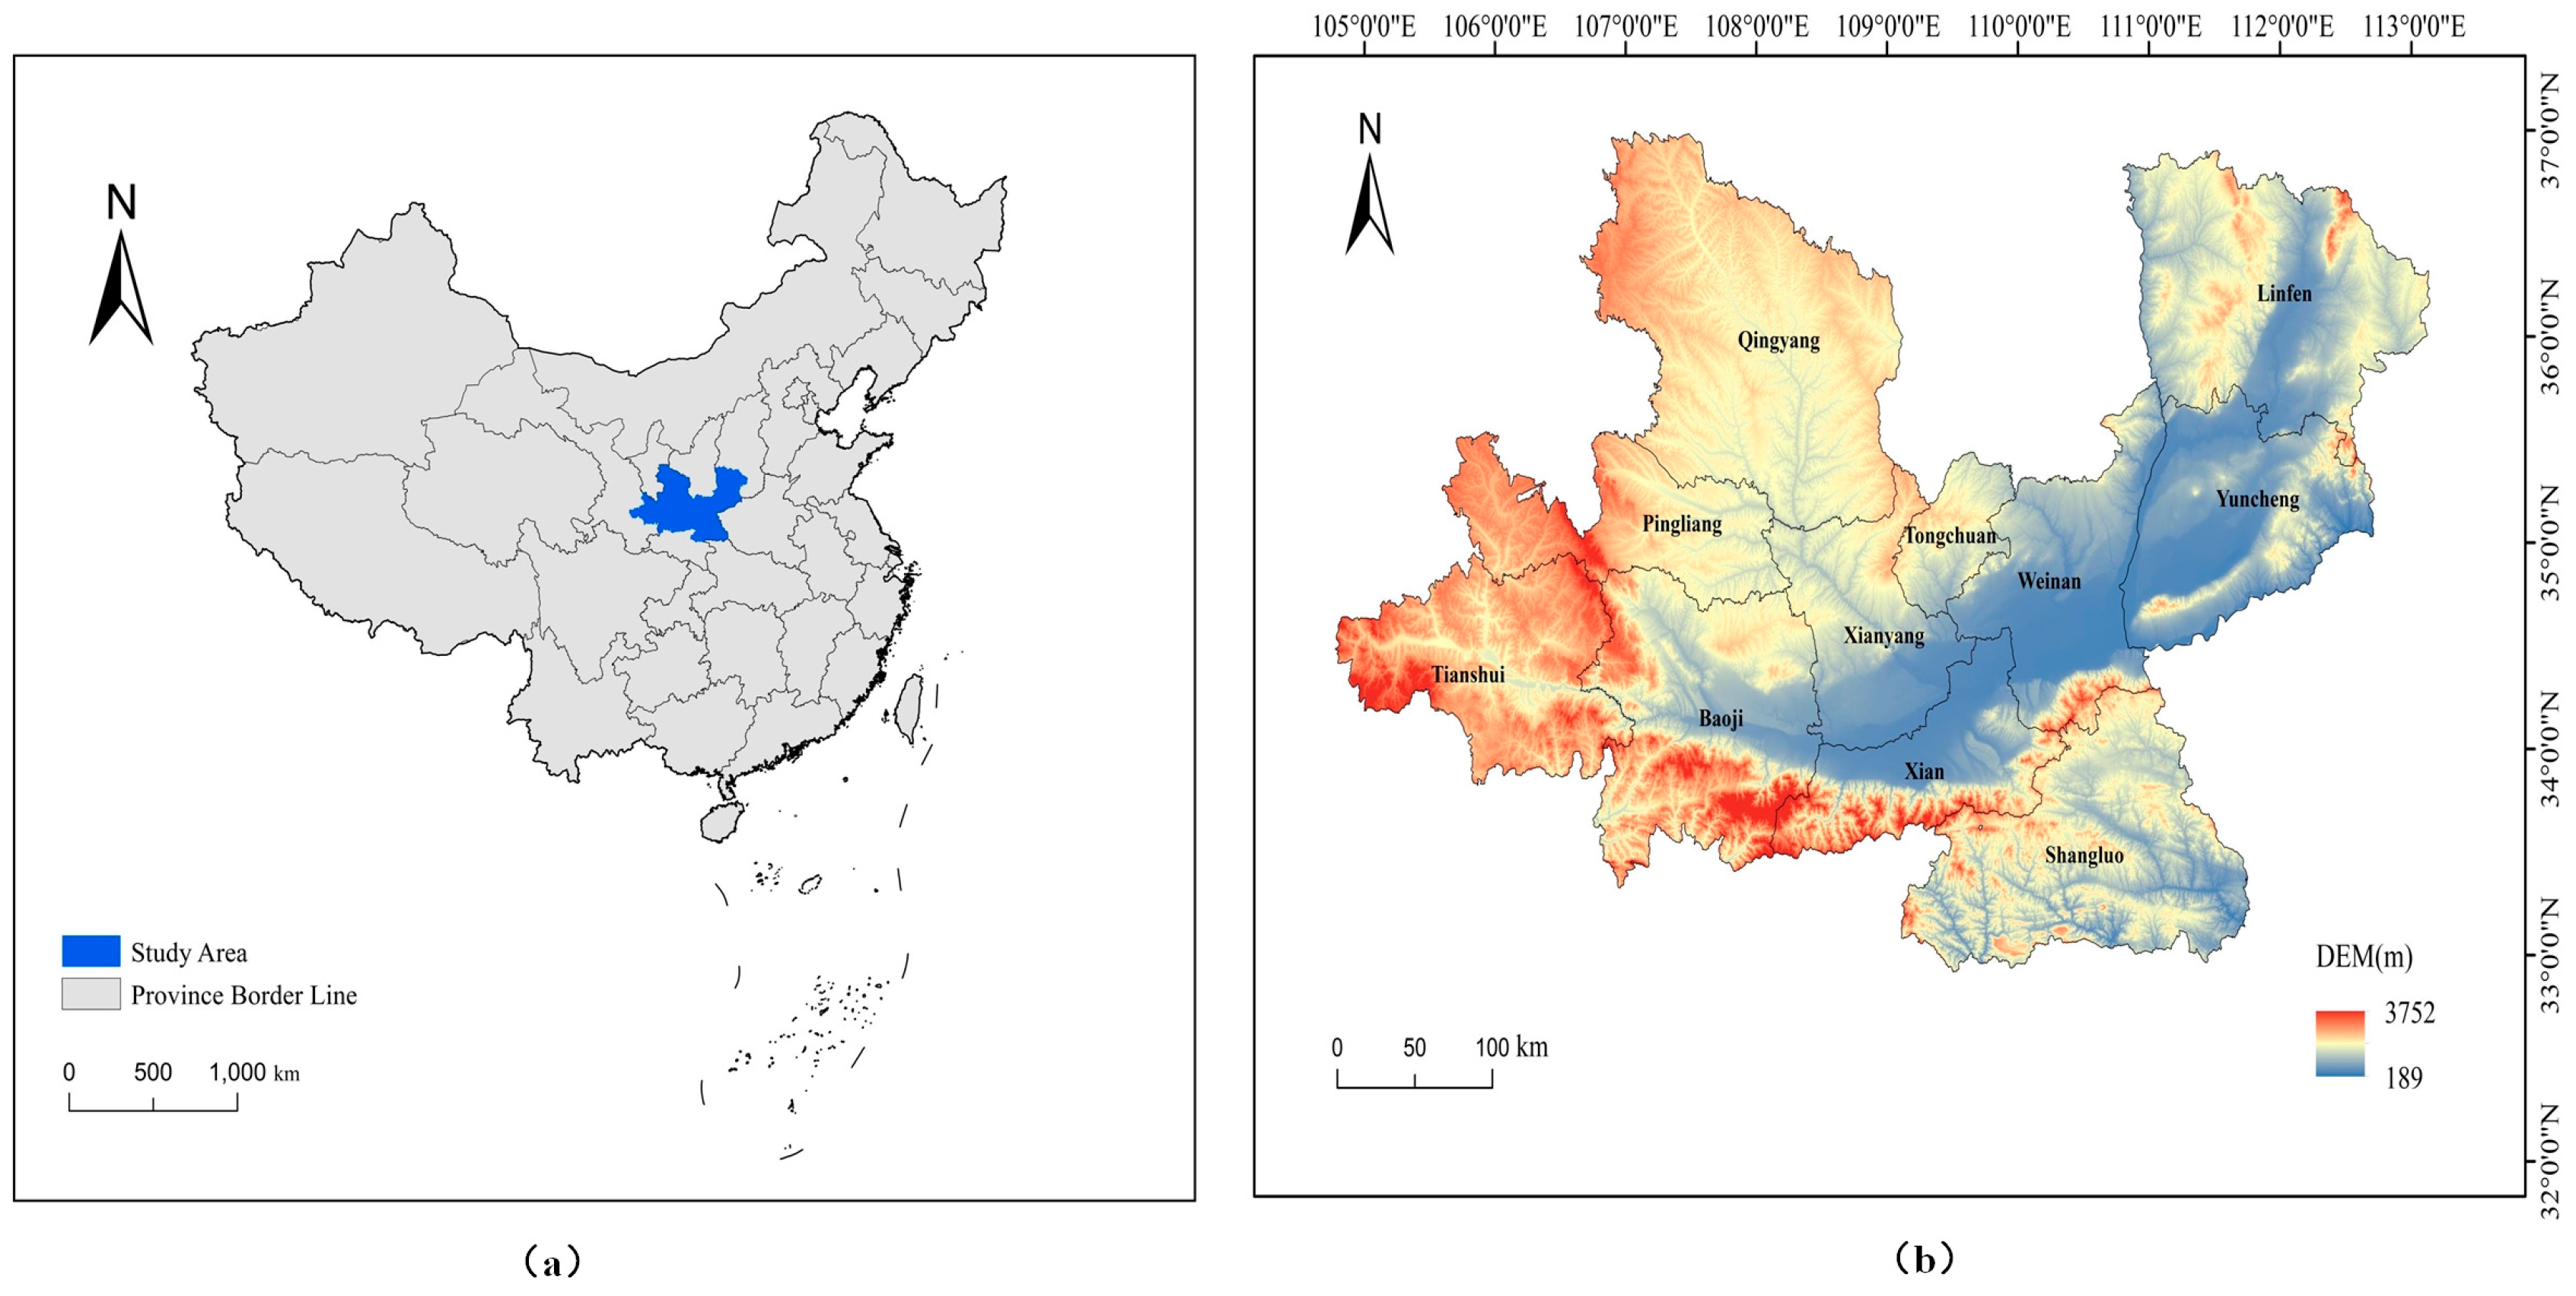
2.1. Study Area and Data Sources

The GPUA (104°34′–112°34′ E, 33°34′–36°56′ N), centered around Xi’an, is located in the inland area of northwest China and is the second largest urban agglomeration in western China. This urban agglomeration covers an area of 107,000 km2 and is in the warm temperate continental monsoon climate zone, bordered by the Qinling Mountains in the south and the Yellow River in the east, situated between the Qinba Mountains and the Loess Plateau. In 2020, the GPUA had a resident population of 38.87 million and a regional GDP of CNY 2.2 trillion [26].
The Guanzhong Plain Urban Agglomeration Development Plan officially delineated the planning area of the GPUA. This area includes Xi’an, Baoji, Xianyang, Tongchuan, Weinan, and Shangluo (Shangzhou District, Luonan County, Danfeng County, and Zhashui County) in Shaanxi Province; Yuncheng (except Pinglu County and Quanqu County) and Linfen (Yaodu District, Houma City, Xianfen County, Huozhou City, Quwo County, Yicheng County, Hongdong County, and Fushan County) in Shanxi Province; as well as Tianshui and Pingliang (Kongdong District, Huating County, Jingchuan County, Chongxin County, and Lingtai County) and Qingyang (Xifeng District) in Gansu Province. Because of data availability, this study uses the municipal area as the boundary, including the city-wide areas of Shangluo, Yuncheng, Linfen, Pingliang, and Qingyang. The study area is shown in Figure 1 [26].
The data required for this study include: (1) The vector boundaries of the study area were obtained from the 1:1,000,000 National Basic Geographic Database of the National Geographic Information Resources Catalog Service System (https://www.webmap.cn/, accessed on 15 January 2023). (2) The land use data from 2000 to 2020 were obtained from the Resource Environment and Science Data Center of the Chinese Academy of Sciences (RESDC) with a spatial resolution of 30 m. The data were based on the Landsat series of U.S. Landsat satellite imagery, and were generated by human–computer interaction interpretation and manual visual interpretation (https://www.resdc.cn/, accessed on 15 January 2023). (3) Night light data (DMSP-OLS satellite and SNPP-VIIRS satellite) are from the Earth Observation Group (https://eogdata.mines.edu/products/vnl, accessed on 15 January 2023). (4) NPP data are from the MOD17A3HGF dataset of MODIS satellite called by the Google Earth Engine platform (https://www.geodata.cn, accessed on 15 January 2023). (5) Vegetation cover index data were obtained from the Resource and Environment Science Data Center of the Chinese Academy of Sciences (https://www.resdc.cn/, accessed on 15 January 2023). (6) Corresponding social and economic data and energy consumption data were obtained from the 2001–2021 Gansu Provincial Statistical Yearbook, Shaanxi Provincial Statistical Yearbook, Shanxi Provincial Statistical Yearbook, China Urban Statistical Yearbook, and statistical bulletins of cities and towns, and grain price data were obtained from the National Compendium of Agricultural Product Costs and Benefits.

2.2. Methods

2.2.1. Ecosystem Service Value

In reference to the results of Xie et al. [27], in this study, the ESV equivalent factor of one standard unit of ESV was defined as one-seventh of the economic value of natural food production per unit area of farmland per year nationwide. ESV correction and accounting were performed.
The calculation formula is as follows:
D = 1 7 × i = 1 n P i G i S i
where D is the ESV for a standard equivalent factor, P i is the unit price of crop category i , G i is the yield of crop category i , and S i is the planted area of crop category i [26].
The ESV coefficient is calculated by the formula:
V C j = E j i × D
where V C j denotes the coefficient of ESV of the j -th land, E j i is the equivalent factor of the ESV of the i -th land use ecological service function of the j -th land, and D represents the value of a standard equivalent factor. Table 1 illustrated the ESV equivalence factors of GPUA.
In order to avoid the fluctuation of the ESV equivalent per unit area in the GPUA due to the changes in food prices in different years and the peculiarity of the correction of ESV by socio-economic factors, the Normalized Difference Vegetation Index (NDVI) was used to correct the ESV from the natural environment perspective in order to improve the accuracy of the accounting [28]. The calculation formula is as follows:
E S V = i = 1 m j = 1 n k = 1 o E e i j B i k C i k
C i k = N D V I i k N D V I i ¯
where E e i j is the equivalence factor for the j -th ecological service of the i -th land-use type and B i k and C i k are the area and NDVI coefficients of the i -th land-use type in the k -th study unit, respectively.
In Section 3.2, this study utilized the calculated ESV totals to stratify them in GIS by the natural breakpoint method and output the results.

2.2.2. EF Supply and Demand

This study adopted the ecological footprint concept proposed by William E Rees, following the accounting methodology refined by Wackemagel et al. [29]. Consumption demand is carefully divided into human consumption of natural biological and ecological resources based on land use type and regional resource endowment, and the resulting offset and consumption of services provided by ecosystems. Based on the results of existing academic research, this study used ESV as the supply side of ecological well-being and EF as the consumption side of ecological well-being, that is, the demand and depletion of ecology as manifested by human social behaviors [30,31]. Fossil energy carbon emissions, like biological resource accounts, are an important component of ecological footprint accounts, while fossil energy carbon emissions most directly affect the drivers of terrestrial ecosystem cycles [32,33].
Based on existing academic studies, in this study, in the acquisition of biologically productive land yield, based on the natural resource endowment and natural geographic and climatic conditions of the GPUA, and based on the existing research results of predecessors, the screening of biological resource types of farmland, woodland, grassland and water body was carried out in a conditional manner with 17 indicators plus 8 indicators of energy consumption, for a total of 25 indicators, and precise calculations of the required ecological capital were made in order to provide a more comprehensive and objective assessment of the state of the region’s ecosystems [34]. Specific indicators were summarized in Table 2.
In this study, the equilibrium factors of farmland, woodland, grassland and water body were measured based on the NPP data in 2000, 2005, 2010, 2015 and 2020, and the EF equilibrium factor table was derived. The yield factors used in this study were taken from the Global Ecological Footprint Network [35]. Based on existing academic studies, the EF calculation methods and formulas were selected as follows:
Formula for calculating the EF model:
E F = N × e f = N i = 1 n a a i r j = N i = 1 n C i / P i r j
Following the Global Footprint Network’s methodology, the EC in this study is defined as the biologically productive area available to provide renewable resources and absorb waste under current management practices. This should be distinguished from the broader concept of ecological sustainability that requires maintaining evolutionary potential and ecosystem integrity. The human carrying capacity component focuses on the balance between resource provisioning services and socioeconomic demands, not encompassing demographic projections or technological disruption scenarios [36].
Formula for calculating EC:
E C = N × e c = N × j = 1 n a j × r j × y j
where E F is the e f produced by the total population of the region ( h m 2 ); E C is the e c of the total population of the region ( h m 2 ); N is the total population in the study area; a a i is the converted bio-productive area per capita of the i -th consumption item; C i and P i correspond to the per capita consumption and average production capacity of the first consumption item, respectively; a j is the per capita ecologically productive area of the j -th land-use type; and r j and y j are the equilibrium factor and yield factor of the j -th land-use type, respectively.
Carbon emissions inverted with nighttime lighting data were converted to energy consumption in units of million tons of standard coal, as well as the global average energy footprint and conversion factor, which converted the heat consumed by the municipality’s energy consumption to fossil energy land area, and then the EF and EC models were used to derive the EF and EC corresponding to its energy account [32].

2.2.3. Measurement of Regional Ecological Safety Factor and Ecological Well-Being

The regional ecological security index is an important indicator for measuring regional ecological environmental problems and carrying out ecological environmental protection. Based on the EF and EC model, it can be used as a consideration for regional ecological security, and is the basis for analyzing whether regional ecological well-being is in a deficit or surplus state.
The ecological security coefficient thus determined is:
E S = E F E C
where E S is the regional ecological security index. When E S > 1, the regional ecological security belonging to the ecological consumption is beyond the carrying range, that is, the ecological well-being is in a deficit state; and when E S < 1, the regional ecological security belonging to the ecological consumption is in the ecological carrying range, that is, the ecological well-being is in a surplus state.
Considering the constraints of multiple factors, such as regional economic, social and ecosystem functions, for measuring the amount of ecological well-being, this study constructed a model for accounting for ecological well-being by using the Pearl growth curve, the regional GDP and the Engel’s coefficient, constraining it within the framework of the local economy and standard of living. The resulting regional ecological well-being measure more accurately represents the level of ecological well-being in the region.
E i = R i E S V i E C E F
R i = e ε G D P i G D P e ε + 1
where E i is the total regional ecological well-being, R i is the regional development coefficient adjusted to take into account the regional level of economic development, E S V i is the value per unit area of the regional ecosystem services, EC is the regional ecological carrying capacity, EF is the regional EF, e ε is a function of the natural logarithm of the base, ε is the regional Engel’s coefficient, G D P i is the total ecological value of the area i within the region, and G D P is the gross regional product.

3. Results

3.1. Land Use Change Analysis

Figure 2 and Table 3 illustrate the land-use types of the GPUA from 2000 to 2020. According to the land use classification standards, the GPUA is predominantly composed of farmland, grassland, and woodland, which together accounted for approximately 94.7% of the total land area in 2020. Specifically, farmland made up about 39.9%, grassland constituted around 33%, and woodland covered approximately 21.8% of the region’s total land area.
Geographically, the GPUA benefits from a diverse landscape. The northern part of the urban agglomeration features loess hilly and ravine areas with relatively high vegetation cover, as well as rich grassland and forest resources. The central region consists of the Guanzhong and Fenwei Plains, which are adjacent to the Weihe River system, making them highly suitable for agricultural development. The southern area is dominated by the Qinling Mountains, known for their ecological diversity. However, the ecological quality along the Weihe River is relatively poor, with a further reduction in biodiversity due to large-scale agricultural activities. The Guanzhong Plain Urban Agglomeration Development Plan has identified several ecological corridors, which play a critical role in maintaining the ecological barrier between the loess hills and gullies and the Qinba Mountain [7].

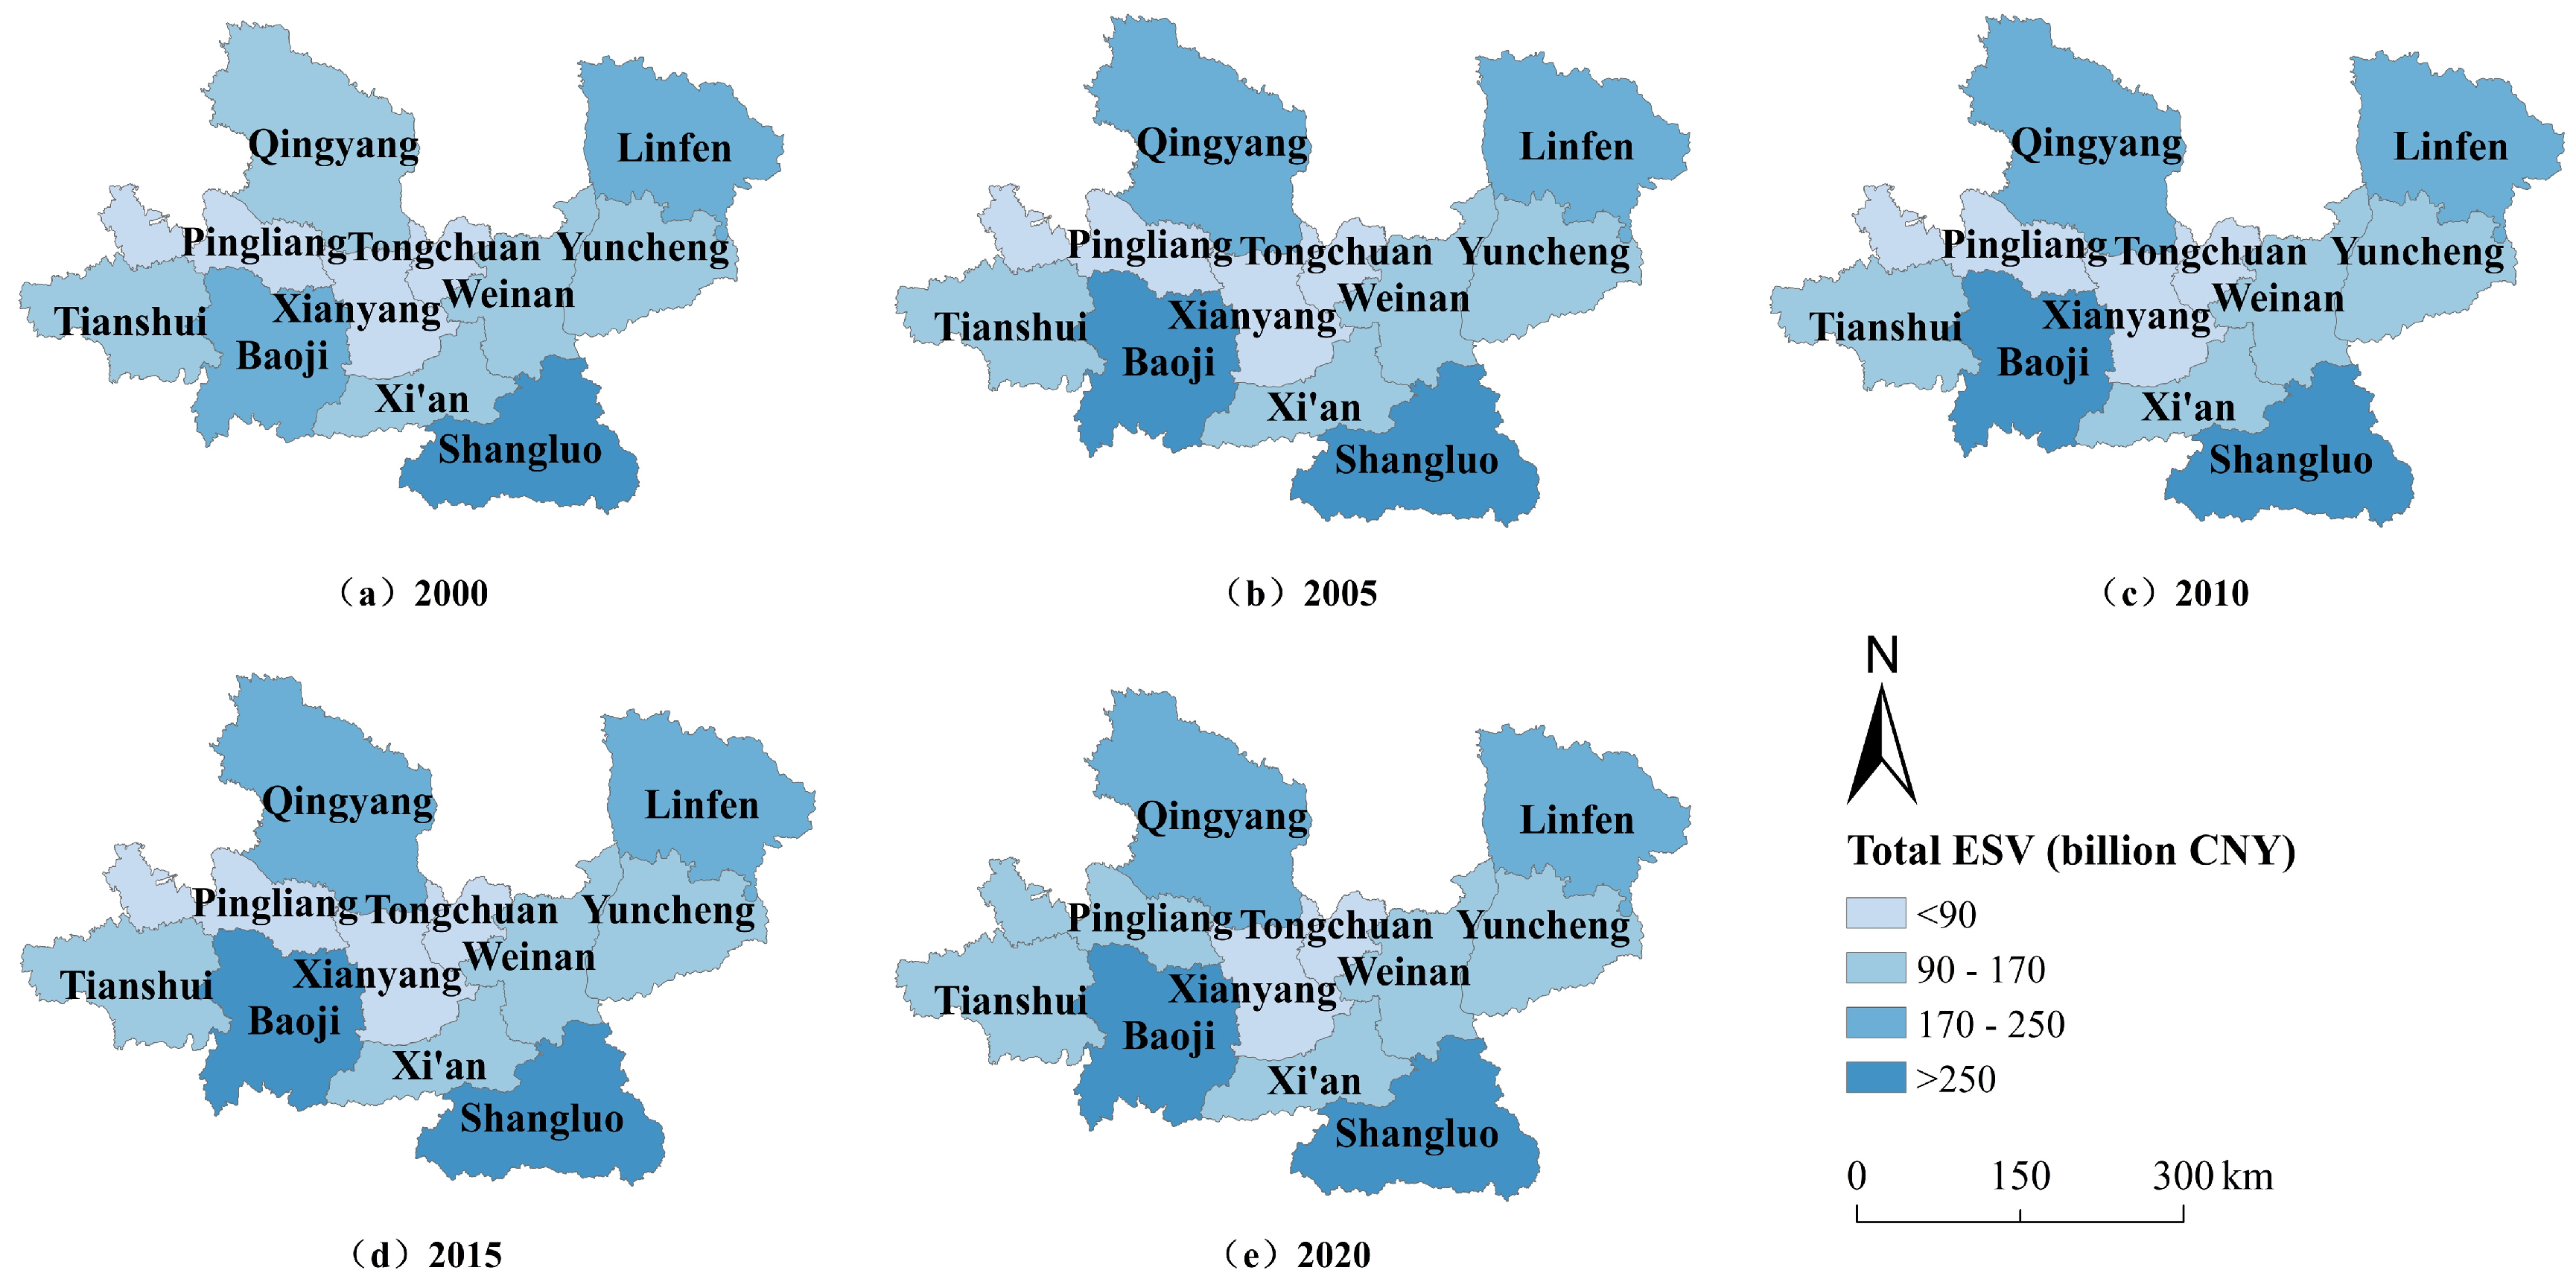
3.2. Multidimensional Analysis of ESV

To estimate the ESV of the GPUA, data on the production of major grain crops, sown area, and grain purchase prices from 2000 to 2020 were used. This allowed for the calculation of the ESV coefficient specific to the GPUA. Additionally, the natural ecosystem was corrected using the Normalized Difference Vegetation Index (NDVI), which provides a more accurate reflection of the natural environment’s influence on the ecosystem. The corresponding service-type equivalent factors for ESV were determined by processing 1 km × 1 km resolution NDVI data using ArcMap (10.8.1) software.
The results can be seen from the Table 4 that the total ESV of the GPUA exhibited fluctuating trends from 2000 to 2020, with an overall pattern of increase followed by a decrease. The peak value of ESV reached 180,472.5 million CNY in 2010, after which it declined from 169,467.2 million CNY to 167,298.3 million CNY by 2020, representing a decrease of 1.28%. In terms of ESV contributions by land-use types, woodland, grassland, and farmland were the primary contributors to the total ESV. Construction land, in contrast, was the main land-use type experiencing growth, with an increase of 2002.44 km2. Water bodies, though covering a smaller area (67.351 km2), saw a significant ESV increase of 593.2 million CNY, representing the highest percentage increase (4.48%) among land-use types. This suggests that water bodies have a high unit ESV and provide considerable provisioning services, highlighting their critical ecological importance. The fluctuations in total ESV during the study period can be attributed to land use conversions between categories [26].
The spatial and temporal distribution of total ESV is illustrated in Figure 3, with the total ESV classified into four intervals: <90, 90–170, 170–250, and >250 million CNY. The results indicate an overall upward trend in the total ESV of the GPUA. Notably, the number of cities within the <9 billion CNY range has decreased, while approximately half of the cities in the agglomeration now fall within the 9–17 billion CNY range. This change is primarily attributed to the expansion of ecological land areas, such as woodland and grassland, within the region. The total ESV exhibits a distinct spatial distribution pattern of ‘high in the surrounding areas and low in the center,’ and ‘high in the east and low in the west,’ which mirrors the overall land use structure.

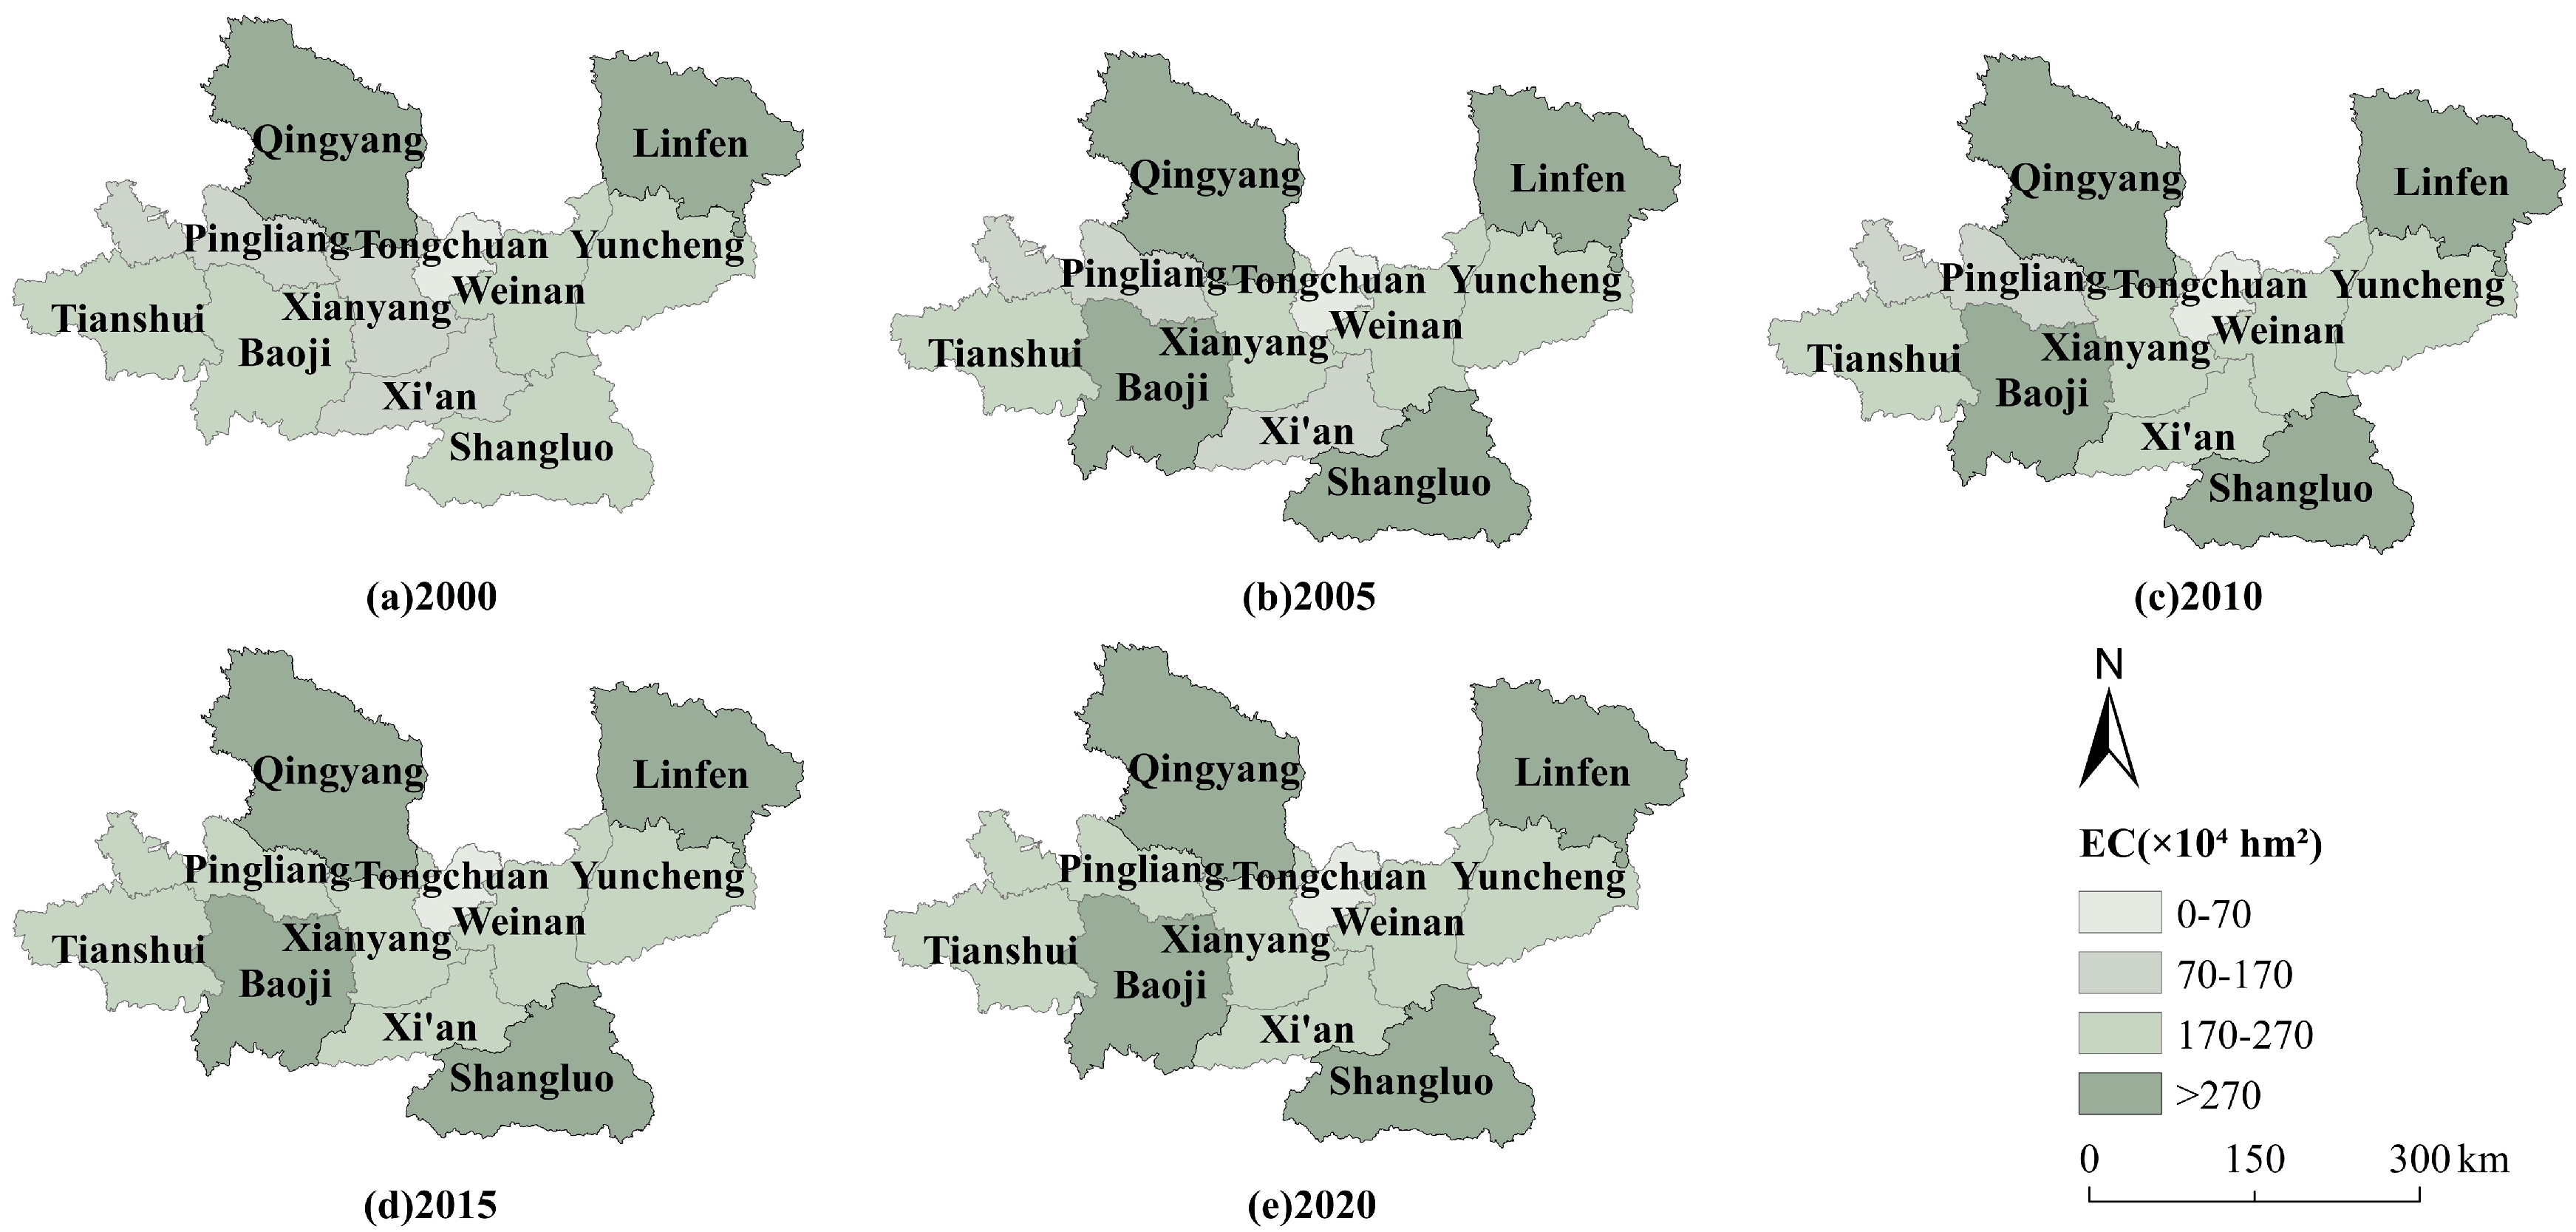
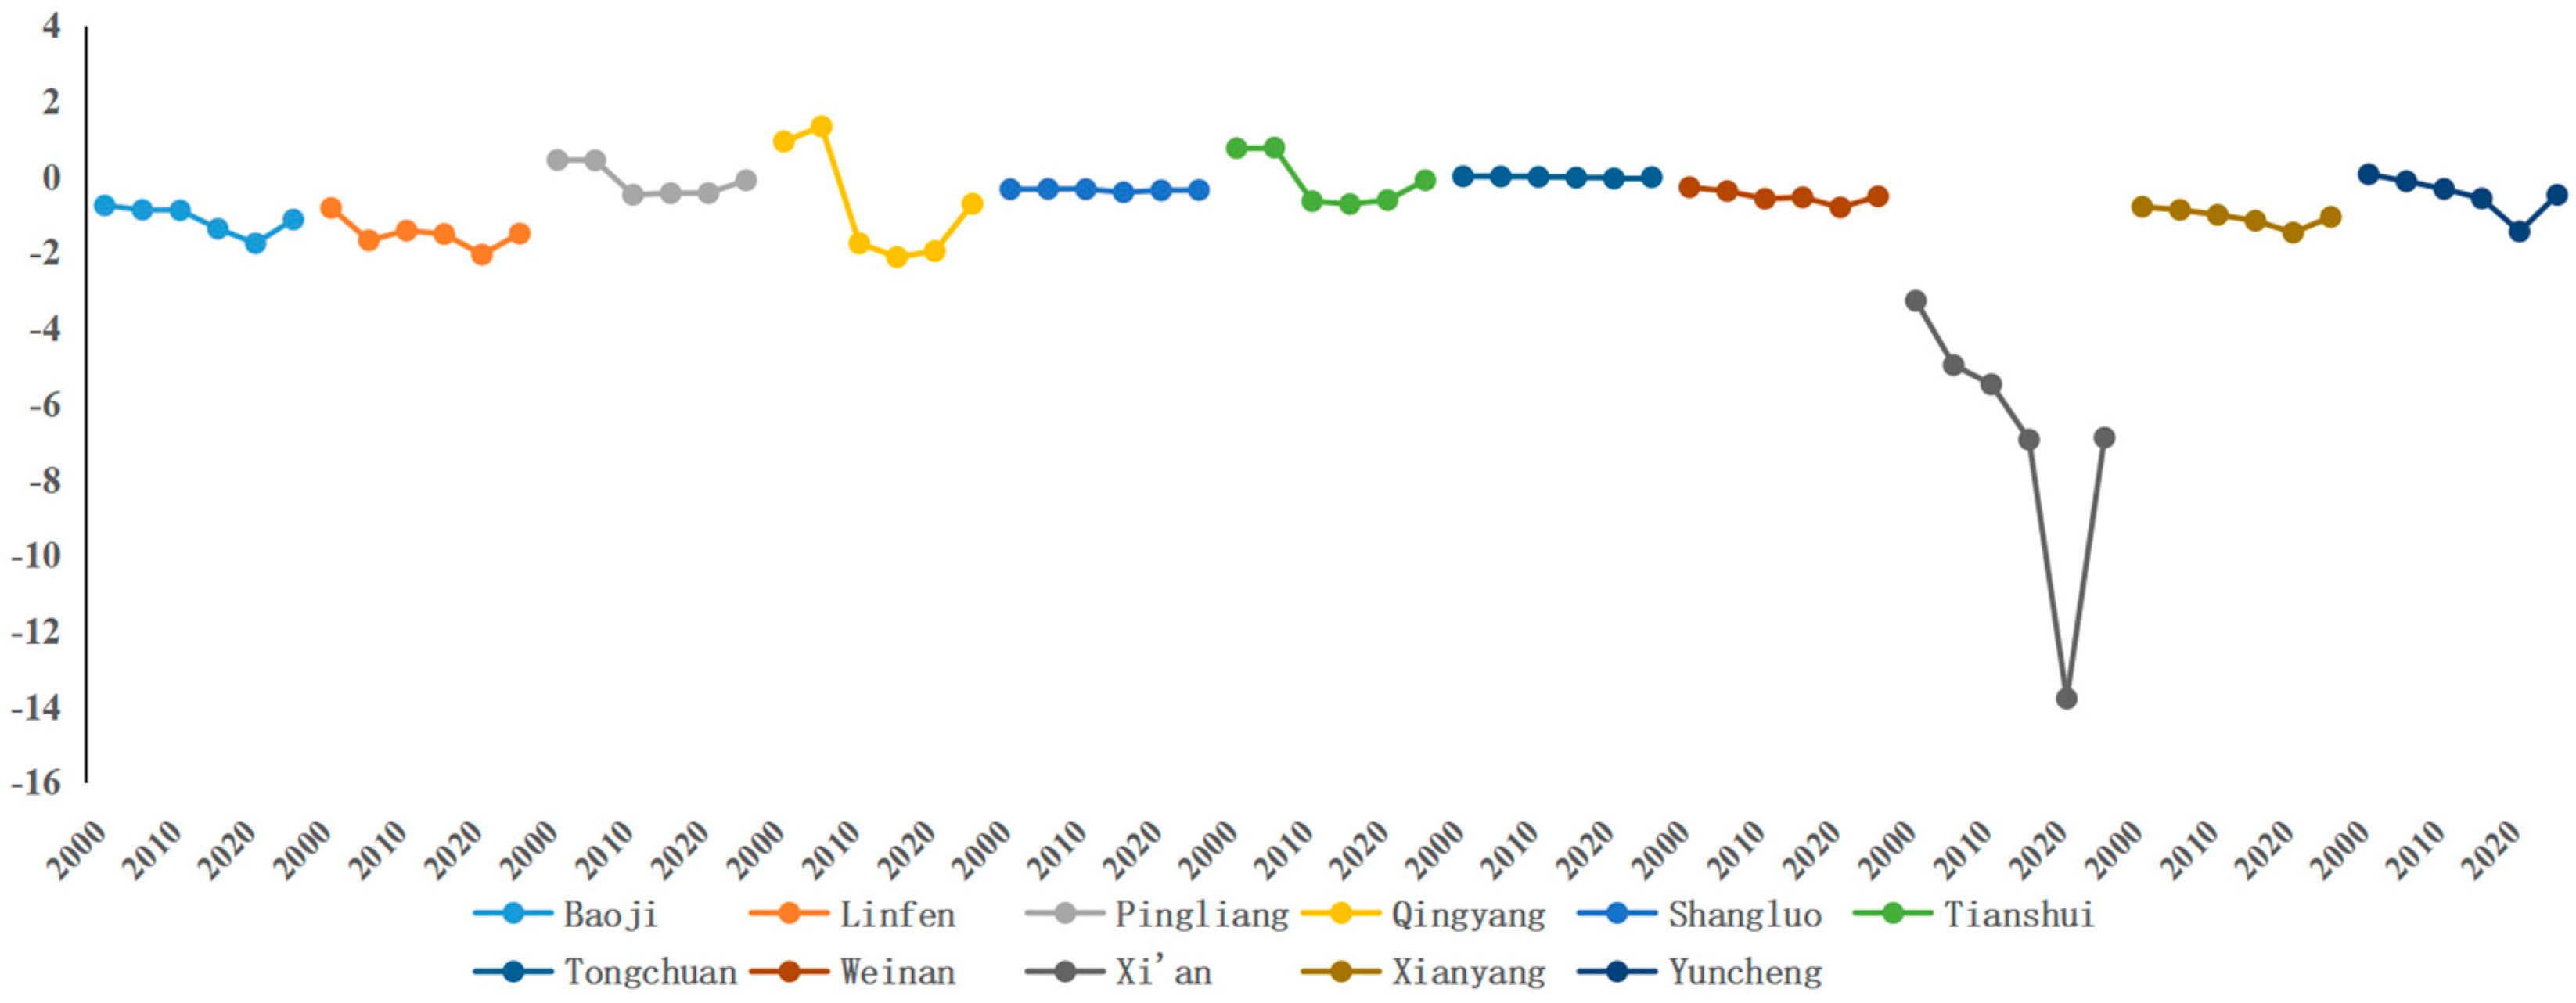
3.3. EF and EC Accounting and Spatial and Temporal Pattern Release Analyses

In this study, carbon emission data for each city were derived from nighttime lighting data and fitted, providing reasonable estimates of the carbon emission levels for each city. Based on this, the ecosystem resource consumption in both the biological resource and fossil energy sub-accounts was measured. Figure 4 depicted the EF consumption of each city in the GPUA.
The results revealed that only Shangluo, Tianshui, and Pingliang showed a slight downward trend in their EF in 2020, although the total EF remained significantly higher than at the start of the study period. The accelerated urbanization in the GPUA has led to increased land development, with construction land becoming the primary site for fossil fuel use, directly contributing to changes in carbon emissions and sequestration, and subsequently affecting the capacity of ecosystem services.
To better illustrate the total EF consumption in the GPUA and its spatial distribution over the study period, Figure 5 presents the changes in total EF across different cities, categorized into four intervals: 0–120, 120–240, 240–360, and >360. These results are detailed in Figure 5.
After 2010, the EF of the entire urban agglomeration increased sharply (Tongchuan is excluded from the regional trend analysis due to its size and population). The EF rose in the third and fourth intervals, 240–360 and >360, respectively. The distribution of total consumption shifted from a pattern of “west–central–east” to “center–surround,” reflecting a clear geographical redistribution of ecological resource consumption across the entire urban agglomeration. This pattern provides a comprehensive view of the changing ecological resource demands within the region.
From the calculations in Table 5, it can be analyzed that the level of ecological carrying capacity of the region has slightly increased in2020, and the ecological carrying capacity from 2000 to 2020 has been calculated to be: 2402.520 × 104 hm2, 2498.137 × 104 hm2, 2513.363 × 104 hm2, 2589.526 × 104 hm2 and 2593.469 × 104 hm2, respectively, an increase of 1909.49 million hectares. These fluctuations can be attributed to changes in land-use types and the long-term effects of the region’s ecological protection policies, both of which have contributed to the variations in the region’s ecological carrying capacity.
From the calculations in Figure 6, it can be analyzed that Pingliang, Xianyang and Xi’an gradually rose from the second range of 70–170 to the third range by 2020, and the distribution of ecological carrying capacity changed from the ‘high north–low middle’ and ‘high east–low west’ patterns in 2000 to a better overall distribution pattern. The distribution of ecological carrying capacity changed from the pattern of ‘high in the north–low in the middle’ and ‘high in the east–low in the west’ in 2000 to a better overall distribution pattern, and the carrying level of each city in the urban agglomeration tended to be stable after 2015. The continuous expansion of construction land has caused the areas of woodland, grassland and water bodies around urban ecosystems to shrink, impeding the functions of nourishment and regulation, reducing the ability to prevent and control environmental risks, and exacerbating the risks and pressures on regional ecological and environmental security.

3.4. Formatting of Mathematical Components

The comparative measurement of the total EF and EC of the bioresource account was used to derive the ecological security index as well as the ecological capacity of each city for the years 2000, 2005, 2010, 2015 and 2020, and the results are shown in Table 6 below.
From the analysis of the results shown in Table 7, it can be seen that the GPUA is generally in a state where ecological consumption is greater than the ecological carrying range, and is in a state of ecological capacity deficit. Consistent with the characteristics presented by the ecological safety coefficient, Pingliang, Qingyang and Tianshui in Gansu Province were in a surplus state of ecological well-being amount in 2000–2005; Tongchuan in Shaanxi Province was in a surplus state in 2000–2005; and Yuncheng in Shanxi Province was in a surplus state in 2000. In the remaining years, all cities were in deficit, with the overall deficit widening to 1378.9 million CNY in 2020, or 1364.914 CNY per hectare, in Xi’an.
It can be observed from Figure 7 that the more obvious of these showed that all cities are in a declining trend and basically reached their lowest values in 2020. Baoji, Shangluo, Xianyang, Tianshui, Pingliang and Qingyang had a small rebound, but the overall trend was still declining. It can be seen that the ecological well-being of the GPUA presents a distribution trend of high in the surrounding area and low in the center.
The southern part of Gansu Province, to which the city in question belongs, is rich in biological resources, with a relatively high proportion of grassland and woodland, and its ecosystems provide greater provisioning and regulating functions and values than other types of land. Moreover, in recent years, the local government has focused on ecological environmental protection and ‘three lines and one single’ ecological zoning control, with a total of 56 priority protection, key control and general control units in Tianshui, a total of 61 in Pingliang, and a total of 72 in Qingyang, and the control of key areas in the southern Qinba Mountains and the Gannan Plateau has achieved certain results. Baoji and Shangluo have actively implemented the key tasks of the Regulations on the Protection of the Ecological Environment of the Qinling Mountains in Shaanxi Province, as well as paying attention to the environmental protection of mining geology and land reclamation, and have implemented strong initiatives to do a good job of ecological environmental protection.

4. Discussion

4.1. Spatial and Temporal Heterogeneity in the Amount of the ESV

From 2000 to 2020, the total ESV demonstrated fluctuating growth, with two periods of significant change: from 2000 to 2010, and from 2015 to 2020. This bimodal growth pattern aligns with recent findings in China’s Yellow River Basin, where policy implementation lags and ecological project phasing were identified as key drivers of non-linear ESV trajectories [37]. This temporal pattern aligns with recent studies on China’s ecological restoration policies, which identified similar phased ESV growth driven by the “Ecological Civilization” strategy and the 13th Five-Year Plan [38]. The distribution of ESV values in the southern, western, and northwestern edges of the study area—specifically in the Qinba Mountains and along the Yellow River—can be attributed to the positive effects of forest cover and water resource protection on ESV intensity [39]. Recent remote sensing analyses demonstrated that mountainous regions with >60% forest cover (similar to the Qinba Mountains) exhibited 2–3 times higher ESV density compared to lowland urban areas, supporting our spatial observations [38]. Recent global analyses (e.g., in the Himalayas and Andes) confirmed that mountainous regions with high forest cover and water retention capacity consistently exhibit elevated ESV heterogeneity, driven by topographic gradients and conservation policies [40]. The rapid growth of the total ESV in 2005 is largely due to the expansion of woodland area, marking the largest increase during the study period. This finding contrasts with previous studies that emphasized cropland conversion as the primary driver of ESV [41], and at the same time, this finding contrasted with studies in eastern China (e.g., Yangtze River Delta), where urbanization dominated ESV declines during the same period, highlighting the unique role of the GPUA as an ecological transition zone, but was consistent with recent work showing the dominance of afforestation in China’s post-2000 ecological restoration programs [42]. Additionally, the retreat of farmland, grassland projects, and erosion control efforts provided a strong foundation for the restoration of ecosystem services. Comparative analysis revealed that the GPUA’s farmland conversion rate (8.7% during 2000–2010) exceeded the national average of 5.3% reported by Bryan et al. [37], but matched recent regional data from the Loess Plateau (8.2–9.1%) [43], suggesting localized policy prioritization. A 2022 meta-analysis of 126 global cases revealed that farmland conversion to forests in semi-arid regions (like the GPUA) increased ESV by 18–24%, exceeding the global average (12–15%), likely due to the synergistic effects of reduced soil erosion and enhanced carbon sequestration [44].
Efforts to build green barriers, such as the windbreak and sand trap forest belt, the Loess Plateau Soil and Water Conservation Ecological Zone, the Weihe River Ecological Landscape Belt, and the Qinba Mountain Biodiversity Ecological Functional Zone, have been crucial in this process [45]. These multi-scale interventions mirror the “ecological corridor” approach advocated in the 2020 National Ecological Security Strategy, but with innovations in integrating desert–loess transition management—a critical gap identified in previous studies [46]. These initiatives have strengthened the ecological security of the region and contributed to the overall increase in ESV.
The provinces and prefectural-level cities within the GPUA urban agglomeration should independently compile records and accounts detailing the functional value provided by ecosystem services, ecological product value, environmental pollution, EF consumption, ecological remediation, and carbon emission rights trading. By quantifying responsible parties and compensation standards, the problem of environmental externalities can be effectively addressed. The distribution of compensation funds and the corresponding measures will be executed accordingly. Different provinces and cities may establish separate agencies to manage ecological well-being enhancement and compensation. These agencies will be tasked with addressing and coordinating the implementation of policies, as well as resolving conflicts and disputes among the primary stakeholders within the urban agglomeration during the ecological compensation process. Under the guidance of higher-level organizations, these agencies will decompose tasks and regulate implementation actions based on account preparation and the principles of ecological well-being enhancement.
The GPUA should focus on promoting systematic management projects for mountains, rivers, forests, fields, lakes, grasslands and deserts. This approach will improve carbon sequestration in urban green landscapes and natural ecological areas, as well as enhance the regulatory functions of climate regulation, air purification, and the water conservation capabilities of watersheds, lakes, and wetlands. These efforts will contribute to the rapid development of the “Million Acres of Forests” and “Million Acres of Wetlands” projects in the GPUA. The successful construction of these projects in the Guanzhong region will help reduce the opportunity cost of ecological protection. Additionally, this approach will facilitate a coordinated division of labor between economic development and ecological protection, ensuring that ecological compensation efforts align with the region’s long-term sustainability goals. This spatial synergistic governance model can reduce the opportunity cost of ecological protection and achieve Pareto improvements in economic–ecological efficiency through differentiated division of labor.
Market mechanisms can be used to complement and improve carbon management tools and scientifically control the total amount of carbon emissions. On this basis, the initial allocation system of carbon emission rights will be used to carry out market-based environmental rights trading so as to achieve the common governance effect of diversified ecological governance and compensation for loss credits [47,48]. In the future process of urban ecosystem protection and problem management in the GPUA, in addition to satisfying basic provisioning, regulating and supporting services, it is important to focus on aesthetic creation and landscape gardening to enhance the aesthetic landscape value of urban green space, taking into account both functionality and artistry [49,50]. In 2018, China promulgated the Guanzhong Plain Urban Agglomeration Development Plan, which emphasizes ecological environmental protection as both a task and a prerequisite for the development of urban clusters. This policy provides crucial support for the rapid growth of ecosystem service values and the implementation of ecological protection and restoration projects from 2015 to 2020.

4.2. Rationality and Necessity of Calculating Ecological Well-Being Based on Ecological Footprint Depletion

Ecosystems in western China have a significant influence on sustainable development and human well-being not only in eastern China but also across broader regions of Asia [51,52,53]. From 2000 to 2020, the overall EF consumption in the study area exhibited a marked upward trend, primarily driven by fossil energy consumption, in line with urban and economic development. This aligns with global patterns reported by Wiedmann et al. (2020), who identified fossil energy as the dominant driver of EF growth in developing economies, particularly in post-industrialization regions [54]. By inverting carbon emissions using nighttime lighting data, it was found that the carbon emissions from construction land exceeded the net carbon emissions for the region [50]. Recent advances in spatial carbon accounting, such as the “light-based emission mapping” method validated by Wan et al. (2024) for Chinese cities, demonstrated that this approach can effectively capture high-resolution spatial patterns of urban CO2 emissions [55].
Human activities, particularly the intensive exploitation of land, directly impact the supply capacity of ecosystem services and functions. Taking the GPUA as a case study, the ecological footprint has risen substantially, with geographic changes in consumption expanding from the urban center to surrounding areas. Similar spatial diffusion patterns were observed in the Beijing–Tianjin–Hebei region by Chen et al. (2024), who attributed this “ecological spillover” to urban agglomeration effects and interregional resource dependencies [56]. However, since 2010, the ecological carrying capacity of the GPUA has largely stabilized, although the ecological footprint continues to exert a significant negative influence on the region’s ecological security. The decoupling of EF growth and carrying capacity stabilization reflects the “ecological redline” policy effects observed in the Beijing–Tianjin–Hebei region, though the GPUA achieved this transition 5–7 years earlier due to stricter land-use control [57].
The average compensation rate per hectare for ecological well-being in the GPUA increased substantially, from 35.59 CNY to 187.11 CNY. The correlation between the compensation price per hectare and the changes in the ecological well-being quota for each city further highlights the alignment of these two trends [32].This compensation mechanism echoes the “payment for ecosystem services” (PES) framework proposed by Salzman et al. (2018), but innovates by integrating industrial restructuring into compensation criteria—a critical advancement for urban agglomerations [58].
Xi’an, as the core of the GPUA, has accelerated urban construction and social development, driving industrial transformation and upgrading. The secondary and tertiary sectors now account for approximately 90% of the region’s GDP, which aligns with the findings of previous studies [2,59], thereby improving the accuracy and robustness of the accounting method used in this study. Notably, this industrial structure shift contrasts with the “tertiary-led decarbonization” model observed in the Pearl River Delta, where service industries contributed 75% of GDP but only 40% of EF reduction, suggesting the GPUA’s manufacturing-focused transition may yield higher ecological efficiency [60]. However, a mismatch exists between the economic space and ecological resources in the GPUA. This rapid industrialization and urbanization process have intensified this imbalance. The GPUA with Xi’an as the core has accelerated the process of industrial transformation and upgrading in the process of rapid urban construction and social development, and the output value of the secondary and tertiary industries accounts for about 90% of the regional GDP, which is basically consistent with the results of the previous relevant studies [1]. For the achievement of the rationality of regional ecological industrial division of labor and the improvement of the efficiency of ecological well-being, the GPUA should form an effective and differentiated division of labor in the ecological protection trade-offs based on the differences in the geographic locations and resources of different cities. Addressing the challenge of expanding urban development while preserving ecological integrity remains a critical issue for further exploration and policy formulation.
To reduce ecological resource consumption, particularly fossil energy use, it is recommended to establish regional carbon emission caps. For instance, Xi’an and Xianyang could implement stricter building energy efficiency codes, while Linfen and Yuncheng could prioritize the deployment of clean coal technologies. Strengthening territorial management and addressing the negative externalities of air pollutants should be prioritized. To this end, the implementation of a Joint Prevention and Control Mechanism is recommended to promote regional synergy in air quality management. This strategy should serve as a key criterion for assessing ecosystem protection and the enhancement of well-being within the region.
At the same time, innovation platforms such as the National Engineering Research Center and the Western China Innovation Port have helped to overcome the constraints of the traditional industrial chain, especially in the key areas of aerospace power, materials and research and development. The development of core technologies could be strengthened by overcoming technological bottlenecks. Traditional heavy industrial cities such as Linfen and Yuncheng should focus on exploiting their advantages in energy and chemical resources, while solving key technological difficulties in energy-intensive industries such as coal-fired power generation and coal–oil co-processing. At the same time, Xianyang should prioritize its role as the core of the Xi’an metropolitan area and play a demonstration role in developing the aviation industry, etc. Through these efforts, a differentiated division of labor can be formed based on the united relationship between ecological resources, functional product supply, and industrial development, allowing the region to capitalize on its comparative advantages within the ecological protection trade-off process. This industrial restructuring based on comparative advantages can make ecological protection an endogenous variable rather than an external constraint for high-quality development.

4.3. Research Limitations and Prospects

Three critical limitations frame the interpretation of our findings: First, the ESV-EF framework prioritizes quantifiable provisioning services over biodiversity indicators and ecological resilience. Second, the exclusion of cumulative stressors like chemical pollutants and microplastics may overestimate sustainable yields. Third, our carrying capacity calculations assume static technological conditions, whereas disruptive innovations could alter future resource equations. A significant limitation of this study is the exclusion of soil quality and precipitation variability in the correction of ESV equivalent factors. These factors are critical in regions like the GPUA, where soil erosion and water availability significantly impact ecosystem services. In the process of EF accounting, biological resources and energy consumption were considered, but carbon sink capacity was not taken into account when measuring EC. Consequently, after considering the constraints of ecosystem service provision and human resource consumption and carrying level, it is important to explore the regional ecological well-being amount and well-being enhancement compensation.
In future studies, the methodology can be further refined by incorporating more precise and accurate indicator data. Subsequent research should integrate molecular biodiversity monitoring (e.g., eDNA metabarcoding) with dynamic modeling of contaminant pathways to develop next-generation sustainability metrics. Future research should integrate high-resolution soil maps and climate data to enhance the robustness of ESV corrections. By combining land use data, researchers can scale up the measurement of regional ecological well-being and explore additional natural and socio-economic driving factors.

5. Conclusions

This study constructed a regional ecological well-being accounting and realization model focusing on GPUA. Based on land use data from 2000 to 2020, the model aimed to elucidate the relationship between the value of services provided by natural ecosystems and the consumption of urban ecosystems by human activities. The ESV and EF models were used to quantify the regional ecological service supply and human consumption and analyze their spatial distribution characteristics. By measuring ecological capacity, a regional security index was calculated. In addition, the results of ecological well-being surplus or deficit were constrained by GDP and Engel’s coefficient. The “net ecological well-being” indicator in this study represented relative progress in resource accounting rather than absolute sustainability. This has improved the accuracy of assessing regional net ecological well-being and enhanced the robustness and completeness of the results of previous studies.
(1) From 2000 to 2020, the total ESV in the GPUA exhibited fluctuating changes, with a general trend of increase followed by a decline, peaking in 2010. The distribution of ESV value across the cities within the GPUA is imbalanced. High-value areas are predominantly located in regions with high altitude and slope, such as the Yellow River and Weihe River Basin areas, which are rich in ecological resources and feature more intact ecosystems. These areas also exhibit significant positive ecological effects. Water bodies, which provide high ESV intensity per unit area, contribute substantially to the overall ESV. They play a critical role in ecosystem services, including both provisioning and regulating functions, underscoring their importance in the region’s ecological structure.
(2) Overall, the GPUA has experienced a substantial increase in its total consumption of ecological resources, with fossil energy consumption comprising more than one-third of the total consumption of bioproduction in each city. This consumption exceeds the ecological carrying capacity by five to six times. The development of many cities, such as Xi’an and Yuncheng, still relies more on regional mineral resources and traditional high-energy-consuming industries. The region’s EC capacity has shown a modest increase, with an additional 1.91 million hectares of biologically productive area capable of sustaining human activities. The distribution of EC has changed from the 2000 pattern of ‘high in the north—low in the center’ and ‘high in the east—low in the west’ to a better overall distribution pattern, and the carrying capacity levels of cities within the urban agglomeration have tended to stabilize after 2015. After 2015, the carrying capacity of each city in the urban agglomeration tended to stabilize.
(3) After 2010, the GPUA experienced a significant ecological deficit, where human consumption of ecological resources surpassed the regional ecological carrying capacity. The overall ecological well-being showed an increasing deficit, reaching its lowest value in 2020. Notably, Xi’an has a much larger ecological well-being deficit than other cities in the region, rising from −324.45 CNY in 2000 to −1364.91 CNY in 2020. The ecological well-being deficit in the GPUA follows a distinct spatial pattern: higher in the western regions, lower in the central and eastern parts, and greater in the surrounding areas compared to the urban center.

Author Contributions

X.Z.: conceptualization, conceptualization, methodology, formal analysis, investigation, data curation, writing—original draft. S.Y.: methodology, validation, supervision, and review. J.H.: methodology, validation, supervision, review and funding acquisition. All authors have read and agreed to the published version of the manuscript.

Funding

This research was funded by the National Natural Science Foundation of China (No. 42075172) and the National Social Science Foundation of China’s Western Region Project (No. 23XTJ006).

Data Availability Statement

Dataset available on request from the authors.

Acknowledgments

The authors would like to thank the anonymous reviewers for their constructive comments that helped improve this paper.

Conflicts of Interest

The authors declare no conflicts of interest.

Abbreviations

The following abbreviations are used in this manuscript:
GPUAGuanzhong Plain urban agglomeration
EFecological footprint
ESVEcosystem service value
ECecological carrying capacity

References

  1. Nie, X.; Li, X.J.; Lyu, C.; Su, Y.L.; Wang, H. Can Ecological Compensation Based on the Transfer of Development Rights (Tdr) Improve Ecosystem Service Value? A Multi-Scenario Simulation. Land Use Policy 2024, 138, 107024. [Google Scholar] [CrossRef]
  2. Cao, Y.; Kong, L.; Zhang, L.; Ouyang, Z. The Balance between Economic Development and Ecosystem Service Value in the Process of Land Urbanization: A Case Study of China’s Land Urbanization from 2000 to 2015. Land Use Policy 2021, 108, 105536. [Google Scholar]
  3. Leemans, R.; De Groot, R. Millennium Ecosystem Assessment: Ecosystems and Human Well-Being: A Framework for Assessment; World Resources Institute: Washington, DC, USA, 2003. [Google Scholar]
  4. Yatzkan, O.; Cohen, R.; Yaniv, E.; Rotem-Mindali, O. Urban Energy Transitions: A Systematic Review. Land 2025, 14, 566. [Google Scholar] [CrossRef]
  5. Frota de Albuquerque Landi, F.; Di Giuseppe, A.; Gambelli, A.M.; Palliotti, A.; Nicolini, A.; Pisello, A.L.; Rossi, F. Life Cycle Assessment of an Innovative Technology against Late Frosts in Vineyard. Sustainability 2021, 13, 5562. [Google Scholar] [CrossRef]
  6. Straffelini, E.; Pijl, A.; Otto, S.; Marchesini, E.; Pitacco, A.; Tarolli, P. A High-Resolution Physical Modelling Approach to Assess Runoff and Soil Erosion in Vineyards under Different Soil Managements. Soil Tillage Res. 2022, 222, 105418. [Google Scholar] [CrossRef]
  7. Yang, S.; Zheng, X.; Zhao, G. Study on the Spatial Ecological Environment Effect and Influencing Factors of Ecological-Production-Living Spaces in the Guanzhong Plain Urban Agglomeration. Arid Land Resour. Environ. 2023, 37, 26–35. [Google Scholar] [CrossRef]
  8. Liu, Q.; Lu, B.; Lin, W.; Li, J.; Lu, Y.; Duan, Y. An Improved Quantitative Analysis Method for the Unequal Supply and Demand of Ecosystem Services and Hierarchical Governance Suggestions. Land 2025, 14, 528. [Google Scholar] [CrossRef]
  9. Zang, Z.; Zou, X.; Wu, L.; Song, Q.; Wu, X.; Yu, W. Evaluation of Ecological Well-Being and Ecological-Economic Efficiency in Mainland China Based on Equity and Efficiency Perspectives. Acta Ecol. Sin. 2017, 37, 2403–2414. [Google Scholar]
  10. Xie, G.-d.; Chun-xia, L.; Yun-fa, L.; Du, Z.; Shuang-cheng, L. Ecosystem Assets Valuation of the Tibetan Plateau. J. Nat. Resour. 2003, 18, 189–196. [Google Scholar]
  11. Costanza, R.; De Groot, R.; Sutton, P.; Van der Ploeg, S.; Anderson, S.J.; Kubiszewski, I.; Farber, S.; Turner, R.K. Changes in the Global Value of Ecosystem Services. Glob. Environ. Change 2014, 26, 152–158. [Google Scholar]
  12. Deng, H.; Zhou, X.; Liao, Z. Ecological Redline Delineation Based on the Supply and Demand of Ecosystem Services. Land Use Policy 2024, 140, 107109. [Google Scholar]
  13. Pascual, U.; Palomo, I.; Adams, W.M.; Chan, K.M.; Daw, T.M.; Garmendia, E.; Gómez-Baggethun, E.; De Groot, R.S.; Mace, G.M.; Martín-López, B. Off-Stage Ecosystem Service Burdens: A Blind Spot for Global Sustainability. Environ. Res. Lett. 2017, 12, 075001. [Google Scholar]
  14. Rees, W.E. Ecological Footprints and Appropriated Carrying Capacity: What Urban Economics Leaves Out. In The Earthscan Reader in Rural–Urban Linkages; Routledge: London, UK, 2018; pp. 285–297. [Google Scholar]
  15. Acuña, C.; Rodríguez, R.; Acuña, E. Revitalizing Transformed Landscapes: Economic Valuation of Artificial Lake Shorelines for Hydropower Generation. Environ. Dev. 2025, 54, 101163. [Google Scholar] [CrossRef]
  16. Dam, M.M.; Durmaz, A.; Bekun, F.V.; Tiwari, A.K. The Role of Green Growth and Institutional Quality on Environmental Sustainability: A Comparison of Co2 Emissions, Ecological Footprint and Inverted Load Capacity Factor for Oecd Countries. J. Environ. Manag. 2024, 365, 121551. [Google Scholar]
  17. Cheng, B.; Li, H.E.; Cheng, W.J.; Li, J.K. Fund Allocation Modeling of Compensation Subjects for Various Protection Levels of the Ecological Flow in Rivers under Runoff Variations. J. Environ. Manag. 2024, 370, 122690. [Google Scholar] [CrossRef]
  18. Chen, Y.H.; Wu, Q.L.; Guo, L. Ecological Compensation Based on the Ecosystem Service Value: A Case Study of the Xin’an River Basin in China. Water 2024, 16, 2923. [Google Scholar] [CrossRef]
  19. Xu, H.; Chen, L.X.; Li, Q.F. Research on Two-Way Ecological Compensation Strategy for Transboundary Watershed Based on Differential Game. J. Environ. Manag. 2024, 371, 123314. [Google Scholar] [CrossRef]
  20. Guo, H.; Cai, Y.; Li, B.; Wan, H.; Yang, Z. An Improved Approach for Evaluating Landscape Ecological Risks and Exploring Its Coupling Coordination with Ecosystem Services. J. Environ. Manag. 2023, 348, 119277. [Google Scholar]
  21. Shi, G. Ideas for the Construction of Ecological Compensation Mechanism in the Yellow River Basin in the Context of High-Quality Development. Econ. Manag. Rev. 2023, 39, 49–58. [Google Scholar] [CrossRef]
  22. Chi, C.; Shen, J.Q.; Gao, X.; Hu, P.; Yi, P. Horizontal Ecological Compensation Standards Based on Ecosystem Services Flow. Ecol. Indic. 2024, 163, 112081. [Google Scholar] [CrossRef]
  23. Niu, J.J.; Mao, C.M.; Xiang, J. Based on Ecological Footprint and Ecosystem Service Value, Research on Ecological Compensation in Anhui Province, China. Ecol. Indic. 2024, 158, 111341. [Google Scholar] [CrossRef]
  24. Rega, C. Ecological Compensation in Spatial Planning in Italy. Impact Assess. Proj. Apprais. 2013, 31, 45–51. [Google Scholar] [CrossRef]
  25. Fu, Y.Y.; Xiong, K.N.; Zhang, Z.Z. Ecosystem Services and Ecological Compensation of World Heritage: A Literature Review. J. Nat. Conserv. 2021, 60, 125968. [Google Scholar] [CrossRef]
  26. Yang, S.; Zheng, X.Z. Spatio-Temporal Relationship between Carbon Emission and Ecosystem Service Value under Land Use Change: A Case Study of the Guanzhong Plain Urban Agglomeration, China. Front. Environ. Sci. 2023, 11, 1241781. [Google Scholar] [CrossRef]
  27. Xie, G.; Zhang, C.; Zhang, L.; Chen, W.; Li, S. Improvement of Ecosystem Service Valorization Method Based on Unit Area Value Equivalent Factor. J. Nat. Resour. 2015, 30, 1243–1254. [Google Scholar]
  28. Wang, Y.; Sun, X. Spatial and Temporal Evolution of Ecosystem Service Value and Influencing Factors in the Yellow River Basin. Environ. Sci. 2024, 45, 2767–2779. [Google Scholar] [CrossRef]
  29. Niccolucci, V.; Bastianoni, S.; Tiezzi, E.; Wackernagel, M.; Marchettini, N. How Deep Is the Footprint? A 3d Representation. Ecol. Model. 2009, 220, 2819–2823. [Google Scholar]
  30. Xiang, J.; Niu, J. Ecological Compensation and Comprehensive Zoning of Cultivated Land Based on Ecosystem Service Value and Extended Three-Dimensional Ecological Footprint Model: A Case Study of Shandong Province. Land 2025, 14, 316. [Google Scholar] [CrossRef]
  31. Li, L.; Li, X.; Fan, H.; Lu, J.; Wang, X.; Zhai, T. Quantifying and Zoning Ecological Compensation for Cultivated Land in Intensive Agricultural Areas: A Case Study in Henan Province, China. Land 2024, 13, 1720. [Google Scholar] [CrossRef]
  32. Ma, Y.H.; Chen, H.; Yang, M.M.; Aihemaiti, G.; Lu, W.J.; Zhao, R.J. Ecological Compensation Based on Multiscale Ecosystem Carbon Sequestration Service Flow. J. Environ. Manag. 2024, 372, 123396. [Google Scholar] [CrossRef]
  33. Siche, R.; Pereira, L.; Agostinho, F.; Ortega, E. Convergence of Ecological Footprint and Emergy Analysis as a Sustainability Indicator of Countries: Peru as Case Study. Commun. Nonlinear Sci. Numer. Simul. 2010, 15, 3182–3192. [Google Scholar]
  34. Wackernagel, M.; Rees, W. Our Ecological Footprint: Reducing Human Impact on the Earth; New Society Publishers: Gabriola Island, BC, Canada, 1998; Volume 9. [Google Scholar]
  35. Report of the World Commission on Environment and Development: Our Common Future. 1987. Available online: http://www.un-documents.net/wced-ocf.htm (accessed on 15 January 2023).
  36. Rees, W.E. Revisiting Carrying Capacity: Area-Based Indicators of Sustainability. Popul. Environ. 1996, 17, 195–215. [Google Scholar]
  37. Bryan, B.A.; Gao, L.; Ye, Y.Q.; Sun, X.F.; Connor, J.D.; Crossman, N.D.; Stafford-Smith, M.; Wu, J.G.; He, C.Y.; Yu, D.Y.; et al. China’s Response to a National Land-System Sustainability Emergency. Nature 2018, 559, 193–204. [Google Scholar] [CrossRef]
  38. Zhang, X.R.; Wang, Y.S.; Yuan, X.F.; Shao, Y.J.; Bai, Y. Identifying Ecosystem Service Supply-Demand Imbalance for Sustainable Land Management in China?S Loess Plateau. Land Use Policy 2022, 123, 106423. [Google Scholar] [CrossRef]
  39. Yang, S.; Su, H. Multi-Scenario Simulation of Ecosystem Service Values in the Guanzhong Plain Urban Agglomeration, China. Sustainability 2022, 14, 8812. [Google Scholar] [CrossRef]
  40. Jia, Z.X.; Wang, X.F.; Feng, X.M.; Ma, J.H.; Wang, X.X.; Zhang, X.R.; Zhou, J.T.; Sun, Z.C.; Yao, W.J.; Tu, Y. Exploring the Spatial Heterogeneity of Ecosystem Services and Influencing Factors on the Qinghai Tibet Plateau. Ecol. Indic. 2023, 154, 110521. [Google Scholar] [CrossRef]
  41. Bryan, B.A.; Ye, Y.Q.; Zhang, J.E.; Connor, J.D. Land-Use Change Impacts on Ecosystem Services Value: Incorporating the Scarcity Effects of Supply and Demand Dynamics. Ecosyst. Serv. 2018, 32, 144–157. [Google Scholar] [CrossRef]
  42. Ouyang, Z.; Zheng, H.; Xiao, Y.; Polasky, S.; Liu, J.; Xu, W.; Wang, Q.; Zhang, L.; Xiao, Y.; Rao, E.M.; et al. Improvements in Ecosystem Services from Investments in Natural Capital. Science 2016, 352, 1455–1459. [Google Scholar] [CrossRef]
  43. Zhang, L.F.; Fang, C.L.; Zhu, C.; Gao, Q. Ecosystem Service Trade-Offs and Identification of Eco-Optimal Regions in Urban Agglomerations in Arid Regions of China. J. Clean. Prod. 2022, 373, 133823. [Google Scholar] [CrossRef]
  44. Hansen, R.; Frantzeskaki, N.; McPhearson, T.; Rall, E.; Kabisch, N.; Kaczorowska, A.; Kain, J.H.; Artmann, M.; Pauleit, S. The Uptake of the Ecosystem Services Concept in Planning Discourses of European and American Cities. Ecosyst. Serv. 2015, 12, 228–246. [Google Scholar] [CrossRef]
  45. Zhao, Y.H.; Zhang, L.; Jia, X.; Mu, Q.; Han, L.; Liu, Z.; Zhang, P.; Zhao, M. Pattern and Trend of Ecosystem Service Value in the Loess Plateau of Northern Shaanxi. Land 2023, 12, 607. [Google Scholar] [CrossRef]
  46. Deng, Y.J.; Yan, X.H.; Hou, M.Y.; Yao, S.B. Reassessing the Ecological Effectiveness of Ecological Restoration Programs: Evidence from a Quasi-Natural Experiment in China. Ecol. Eng. 2025, 212, 107506. [Google Scholar] [CrossRef]
  47. Goodell, J.W.; Gurdgiev, C.; Karim, S.; Palma, A. Carbon Emissions and Liquidity Management. Int. Rev. Financ. Anal. 2024, 95, 103367. [Google Scholar] [CrossRef]
  48. Siyiti, M.; Yao, X. Natural Resource Assets Management and Urban Carbon Emission Efficiency: Evidence from Quasi-Natural Experiment in China. Energy Econ. 2024, 140, 107963. [Google Scholar] [CrossRef]
  49. Guo, X.M.; Fang, C.L.; Mu, X.F.; Chen, D. Coupling and Coordination Analysis of Urbanization and Ecosystem Service Value in Beijing-Tianjin-Hebei Urban Agglomeration. Ecol. Indic. 2022, 137, 108782. [Google Scholar] [CrossRef]
  50. Zhao, C.; Liu, Y.; Yan, Z. Effects of Land-Use Change on Carbon Emission and Its Driving Factors in Shaanxi Province from 2000 to 2020. Environ. Sci. Pollut. Res. 2023, 30, 68313–68326. [Google Scholar] [CrossRef]
  51. Ding, T.H.; Chen, J.F.; Fang, Z.; Wang, Y. Exploring the Differences of Ecosystem Service Values in Different Functional Areas of Metropolitan Areas. Sustain. Prod. Consum. 2023, 38, 341–355. [Google Scholar] [CrossRef]
  52. Huang, C.B.; Zhao, D.Y.; Liu, C.; Liao, Q.P. Integrating Territorial Pattern and Socioeconomic Development into Ecosystem Service Value Assessment. Environ. Impact Assess. Rev. 2023, 100, 107088. [Google Scholar] [CrossRef]
  53. Schmidt, S.; Hamidov, A.; Kasymov, U. Analysing Groundwater Governance in Uzbekistan through the Lenses of Social-Ecological Systems and Informational Governance. Int. J. Commons 2024, 18, 203–217. [Google Scholar] [CrossRef]
  54. Wiedmann, T.; Lenzen, M.; Keysser, L.T.; Steinberger, J.K. Scientists’ Warning on Affluence. Nat. Commun. 2020, 11, 31–107. [Google Scholar] [CrossRef]
  55. Wan, R.X.; Qian, S.Y.; Ruan, J.H.; Zhang, L.; Zhang, Z.; Zhu, S.Y.; Jia, M.; Cai, B.F.; Li, L.; Wu, J.; et al. Modelling Monthly-Gridded Carbon Emissions Based on Nighttime Light Data. J. Environ. Manag. 2024, 354, 120391. [Google Scholar] [CrossRef] [PubMed]
  56. Chen, Y.Z.; Zhang, S.S.; Yang, L.Z.; Zhang, X.C.; Yu, K.R.; Li, J. Ecological Footprint in Beijing-Tianjin-Hebei Urban Agglomeration: Evolution Characteristics, Driving Mechanism, and Compensation Standard. Environ. Impact Assess. Rev. 2024, 109, 107649. [Google Scholar] [CrossRef]
  57. Liu, Z.; Guan, D.B.; Wei, W.; Davis, S.J.; Ciais, P.; Bai, J.; Peng, S.S.; Zhang, Q.; Hubacek, K.; Marland, G.; et al. Reduced Carbon Emission Estimates from Fossil Fuel Combustion and Cement Production in China. Nature 2015, 524, 335–338. [Google Scholar] [CrossRef] [PubMed]
  58. Salzman, J.; Bennett, G.; Carroll, N.; Goldstein, A.; Jenkins, M. The Global Status and Trends of Payments for Ecosystem Services. Nat. Sustain. 2018, 1, 136–144. [Google Scholar] [CrossRef]
  59. Wang, F.; Gu, N.; Dang, Y.T. Measuring Ecological Effects and Policy Mechanisms of Urban Land Use Transition—A Case Study of Xi’an, China. Int. J. Urban Sci. 2024. [Google Scholar] [CrossRef]
  60. Wang, Z.X.; Li, F.H.; Xie, Z.H.; Li, Q.Y.; Zhang, Y.L.; Dai, M.L. Decoupling CO2 Emissions from Economic Growth in China’s Cities from 2000 to 2020: A Case Study of the Pearl River Delta Agglomeration. Land 2023, 12, 1804. [Google Scholar] [CrossRef]
Figure 1. (a) Location map of the GPUA, China. (b) The 11 cities in the GPUA.
Land 14 00688 g001
Figure 2. Land use changes in the GPUA over the study period.
Land 14 00688 g002
Figure 3. Spatial distribution of total ESV by city in the GPUA.
Land 14 00688 g003
Figure 4. EF of cities in the GPUA (104 hm2).
Land 14 00688 g004
Figure 5. Spatial and temporal distribution of the total EF of the GPUA.
Land 14 00688 g005
Figure 6. Spatial and temporal distribution of the total EC of the GPUA.
Land 14 00688 g006
Figure 7. Eco-well-being amount and change trend of each city in the GPUA.
Land 14 00688 g007
Table 1. The ESV equivalent factors of the GPUA (CNY/hm2·a).
Primary TypeSecondary TypeFarmlandWoodlandGrasslandWater BodyConstruction LandUnused Land
Supply serviceFood production1433.982354.710207.635850.0070.00012.977
Raw material production317.942817.564304.964473.6680.00038.932
Water supply25.954423.922168.7047059.6010.00025.954
Reconciliation serviceGas regulation1154.9722690.6081070.6201732.4570.000142.749
Climate regulation603.4408045.8692829.0313821.7880.000129.772
Environmental purification175.1922340.223934.3595937.0730.000402.293
Hydrological regulation1940.0935013.5282069.86582,061.3760.000272.521
Support serviceSoil conservation674.8153274.5821304.2092102.3080.000168.704
Nutrient maintenance201.147250.893103.818162.2150.00012.977
Biodiversity220.6132980.4321187.4156761.1250.000155.726
Cultural serviceAesthetic landscape97.3291306.372525.5774295.4560.00064.886
Table 2. Indicators for EF accounting.
Resource
Account
Account NameProductive Land-Use TypeSelected Indicators
Biological Resources AccountsAgricultural Products AccountFarmlandGrain, Cotton, Oilseeds, Tobacco, Vegetables, Pork
Forest Products AccountWoodlandApple, Pear, Grape, Peach, Apricot
Grassland Products AccountGrasslandBeef, Lamb, Goat’s wool, Poultry eggs, Honey
Water Products AccountWater bodyAquatic product
Energy Consumption AccountsEnergy Consumption AccountConstruction LandRaw coal, Coke, Petrol, Paraffin, Diesel, Fuel oil, Natural gas, Electricity
Table 3. Changes in land use structure of the GPUA.
PeriodsTypes2020
FarmlandWoodlandGrasslandWater BodyConstruction LandUnused LandTotal (km2)
2000Farmland61,607.137 805.7493724.272231.5312212.08424.30768,605.081
Woodland369.48133,318.434662.82214.22155.79210.31834,431.068
Grassland2206.4671166.47548,937.06251.787139.74021.09052,522.622
Water body146.86410.01546.8911232.45536.63813.9871486.850
Construction land389.77416.01431.0588.5934387.6680.5374833.644
Unused land12.8115.15013.49815.6144.164120.052171.289
Total64,732.53535,321.838 53,415.6021554.2016836.086190.292162,050.554
Table 4. Total ESV for different land-use types in the GPUA (billion CNY·hm2).
Land-Use TypeESV (Billion·hm2)2000–2010 Amount of
Change/Rate of Change
2010–2020 Amount of
Change/Rate of Change
2000–2020 Amount of
Change/Rate of Change
20002005201020152020
Farmland352.406352.314383.827349.791342.34931.421
/8.92%
−41.479
/−10.81%
−10.057
/−2.85%
Woodland784.878798.818828.715803.878790.13943.837
/5.59%
−38.577
/−4.65%
5.260
/0.67%
Grassland424.903438.309452.894436.554402.05927.991
/6.59%
−50.835
/−11.22%
−22.844
/−5.38%
Water body132.299144.038139.121128.923138.2316.821
/5.16%
−0.890
/−0.64%
5.932
/4.48%
Construction land0.0000.0000.0000.0000.000000
Unused land0.1860.1750.1680.1460.206−0.019
/−9.96%
0.038
/22.65%
0.019
/10.43%
Total1694.6721733.6541804.7251719.2921672.983110.052
/6.49%
−131.742
/7.30%
−21.690
/−1.28%
Table 5. EC of the total account of biological resources in the GPUA (104 hm2).
YearBaojiLinfenPingliangQingyangShangluoTian
Shui
Tong
Chuan
WeinanXi’anXianyangYuncheng
2000261.182298.029163.145373.304268.804207.70857.717161.656209.254166.026235.697
2005271.106309.606169.176388.532278.608215.17859.931169.192218.312173.188245.308
2010273.300313.426166.902388.697280.102216.04660.246172.566220.230175.237246.612
2015281.372322.623171.821399.625288.107222.47462.023178.932227.581180.802254.167
2020280.404323.809171.697398.668286.958223.07861.821179.218229.303181.983256.529
Table 6. Ecological security index and zoning of cities in the GPUA.
YearBaojiLinfenPingliangQingyangShangluoTian
Shui
Tong
Chuan
WeinanXi’anXianyangYuncheng
20001.4081.5100.2380.1101.5960.2200.9051.2601.9101.6470.950
deficitdeficitsurplussurplusdeficitsurplussurplusdeficitdeficitdeficitsurplus
20051.4891.7600.2890.1401.6200.2500.9751.3882.4361.8561.082
deficitdeficitsurplussurplusdeficitsurplussurplusdeficitdeficitdeficitdeficit
20101.5641.7861.8071.9661.6451.6551.1481.6362.6562.0451.257
deficitdeficitdeficitdeficitdeficitdeficitdeficitdeficitdeficitdeficitdeficit
20151.8361.8381.8132.1231.6541.6531.4411.5732.9182.0761.418
deficitdeficitdeficitdeficitdeficitdeficitdeficitdeficitdeficitdeficitdeficit
20202.0952.3161.8222.1701.6461.6441.8611.9144.3182.7412.124
deficitdeficitdeficitdeficitdeficitdeficitdeficitdeficitdeficitdeficitdeficit
Table 7. Total amount of ecological well-being of cities in the GPUA (billion CNY·hm2).
YearBaojiLinfenPingliangQingyangShangluoTian
Shui
Tong
Chuan
WeinanXi’anXianyanYuncheng
2000−0.763−0.8300.4380.927−0.3330.7490.007−0.280−3.277−0.7980.061
2005−0.879−1.6850.4291.327−0.3250.7650.002−0.382−4.980−0.879−0.123
2010−0.891−1.427−0.480−1.762−0.332−0.649−0.009−0.586−5.487−1.011−0.325
2015−1.378−1.518−0.436−2.127−0.413−0.727−0.026−0.546−6.950−1.166−0.579
2020−1.763−2.061−0.435−1.967−0.362−0.619−0.050−0.814−13.789−1.479−1.452
Disclaimer/Publisher’s Note: The statements, opinions and data contained in all publications are solely those of the individual author(s) and contributor(s) and not of MDPI and/or the editor(s). MDPI and/or the editor(s) disclaim responsibility for any injury to people or property resulting from any ideas, methods, instructions or products referred to in the content.

