
Effects of Urban Park Construction Period on Plant Multidimensional Diversities, Landscape Patterns of Green Spaces, and Their Associations in Changchun City, Northeast China

Abstract
1. Introduction
2. Methods
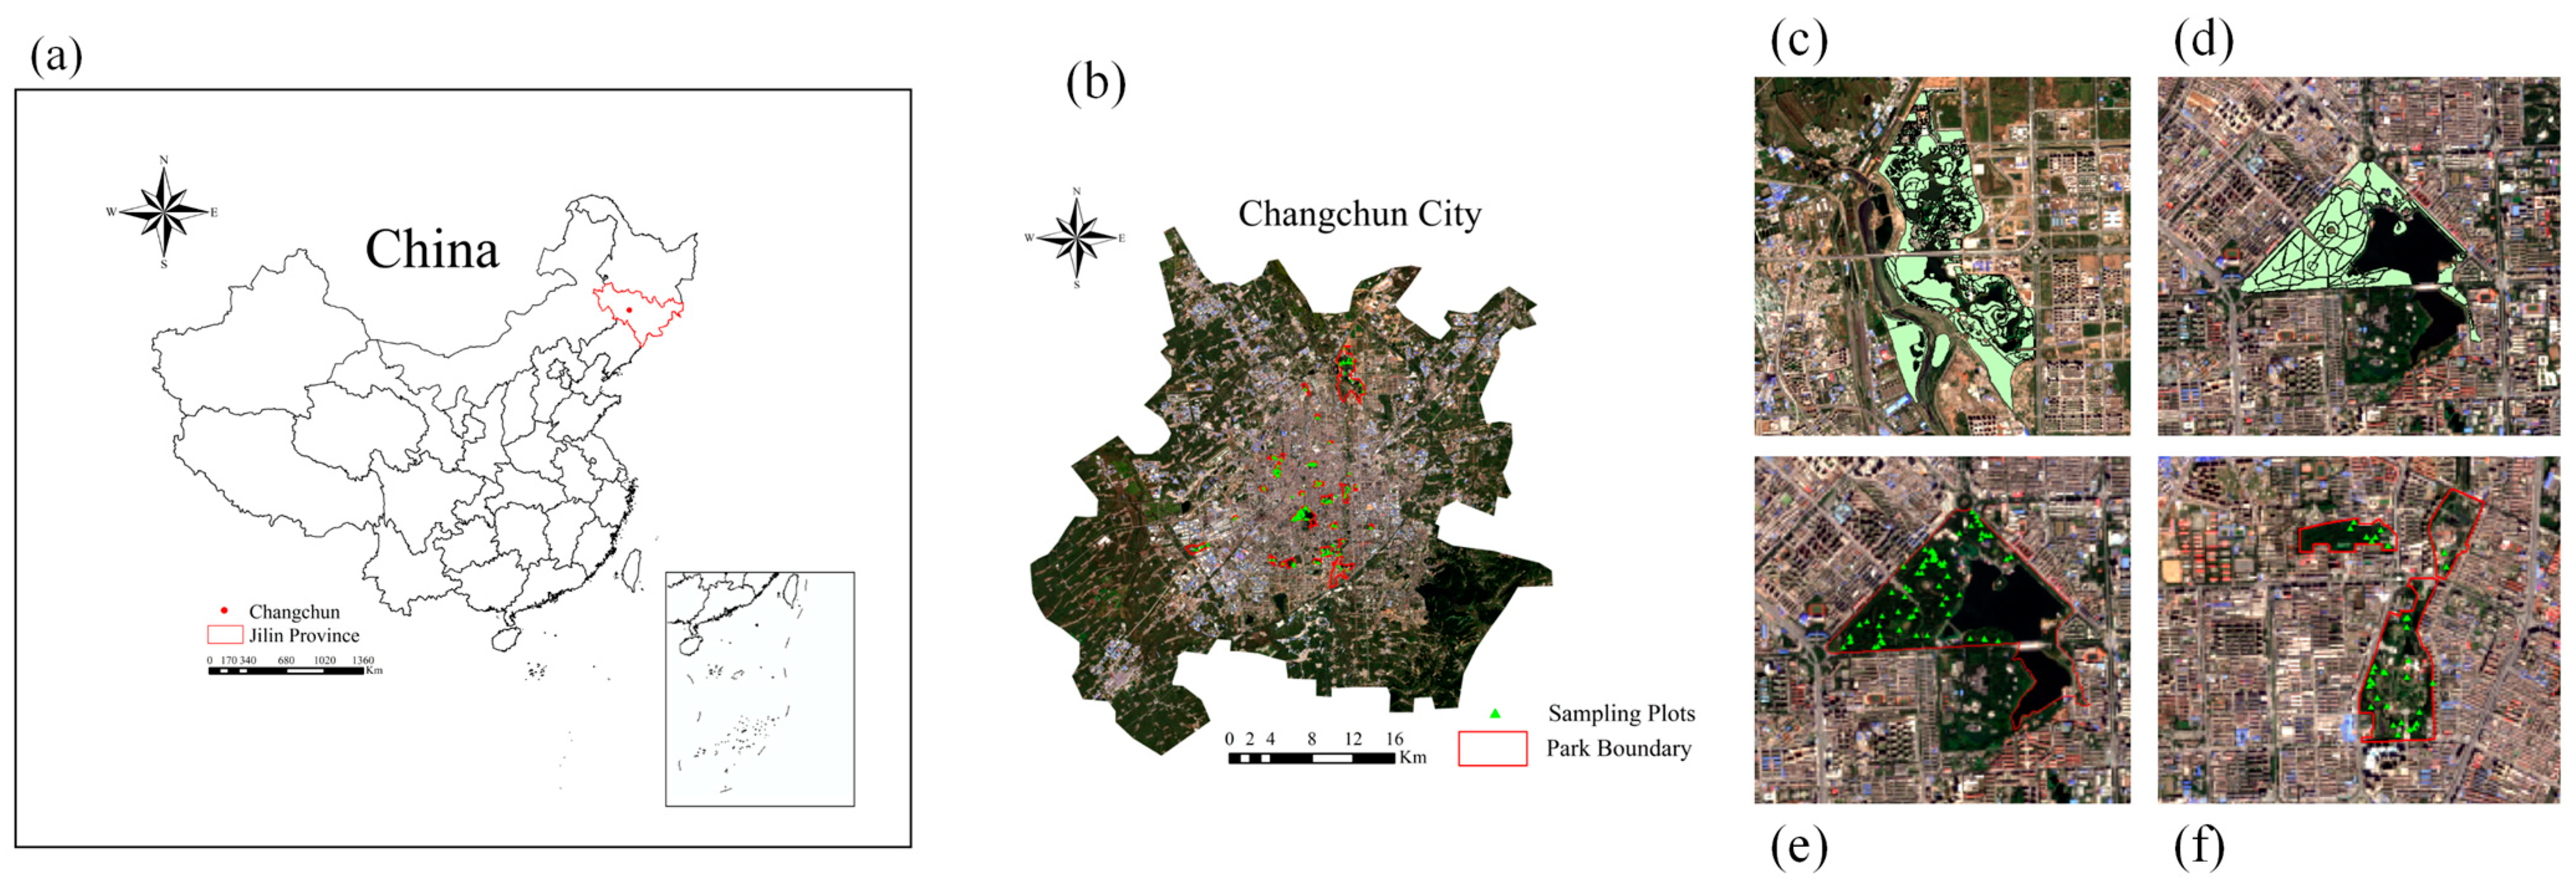
2.1. Study Area
2.2. Field Survey
2.3. Calculation of Species Diversity Indices
2.4. Calculation of Structural Diversity Indices
2.5. Calculation of Phylogenetic Diversity Indices
2.6. Analysis of UGSs Landscape Patterns
2.7. Statistical Analysis
3. Results
3.1. Species Composition
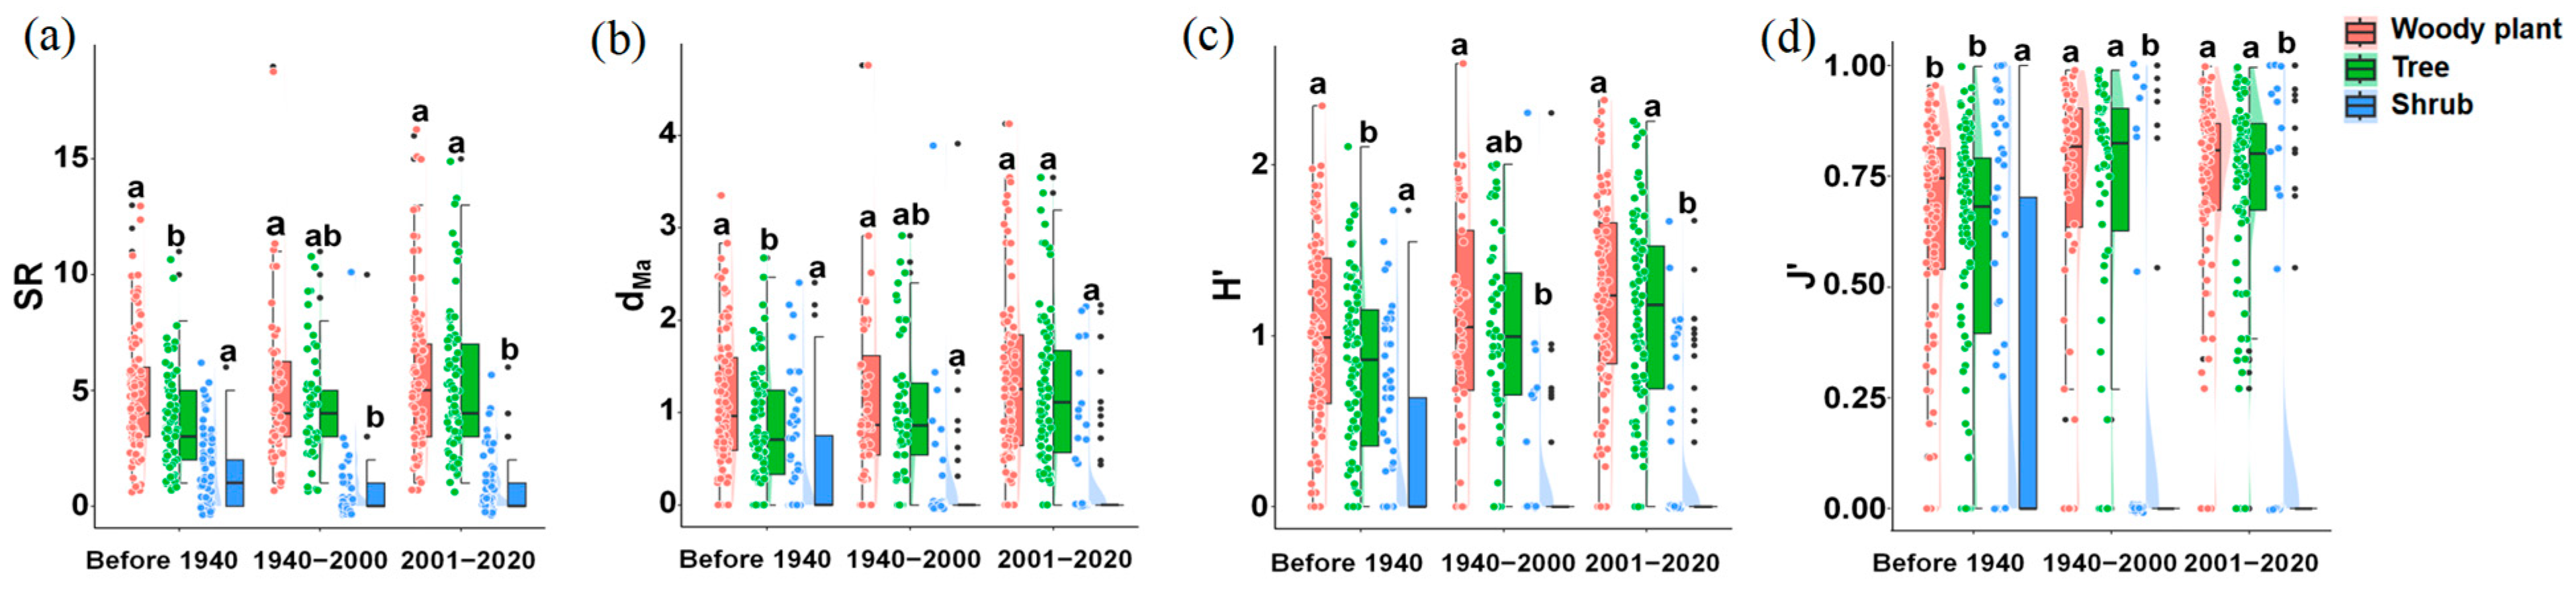
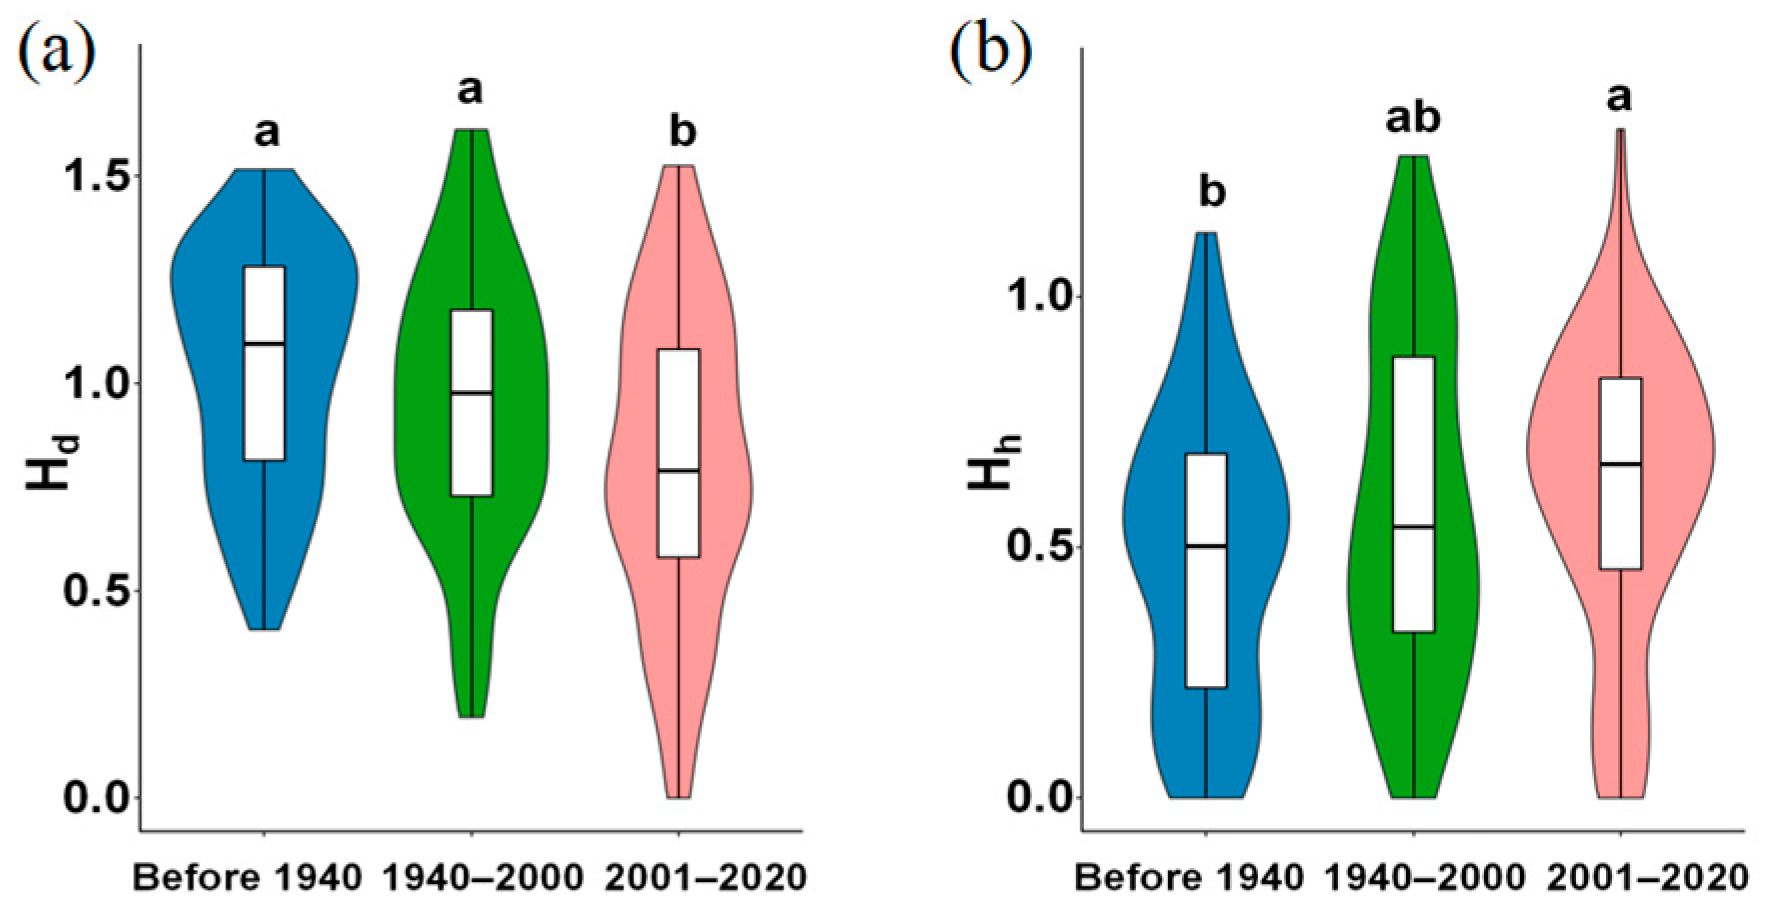
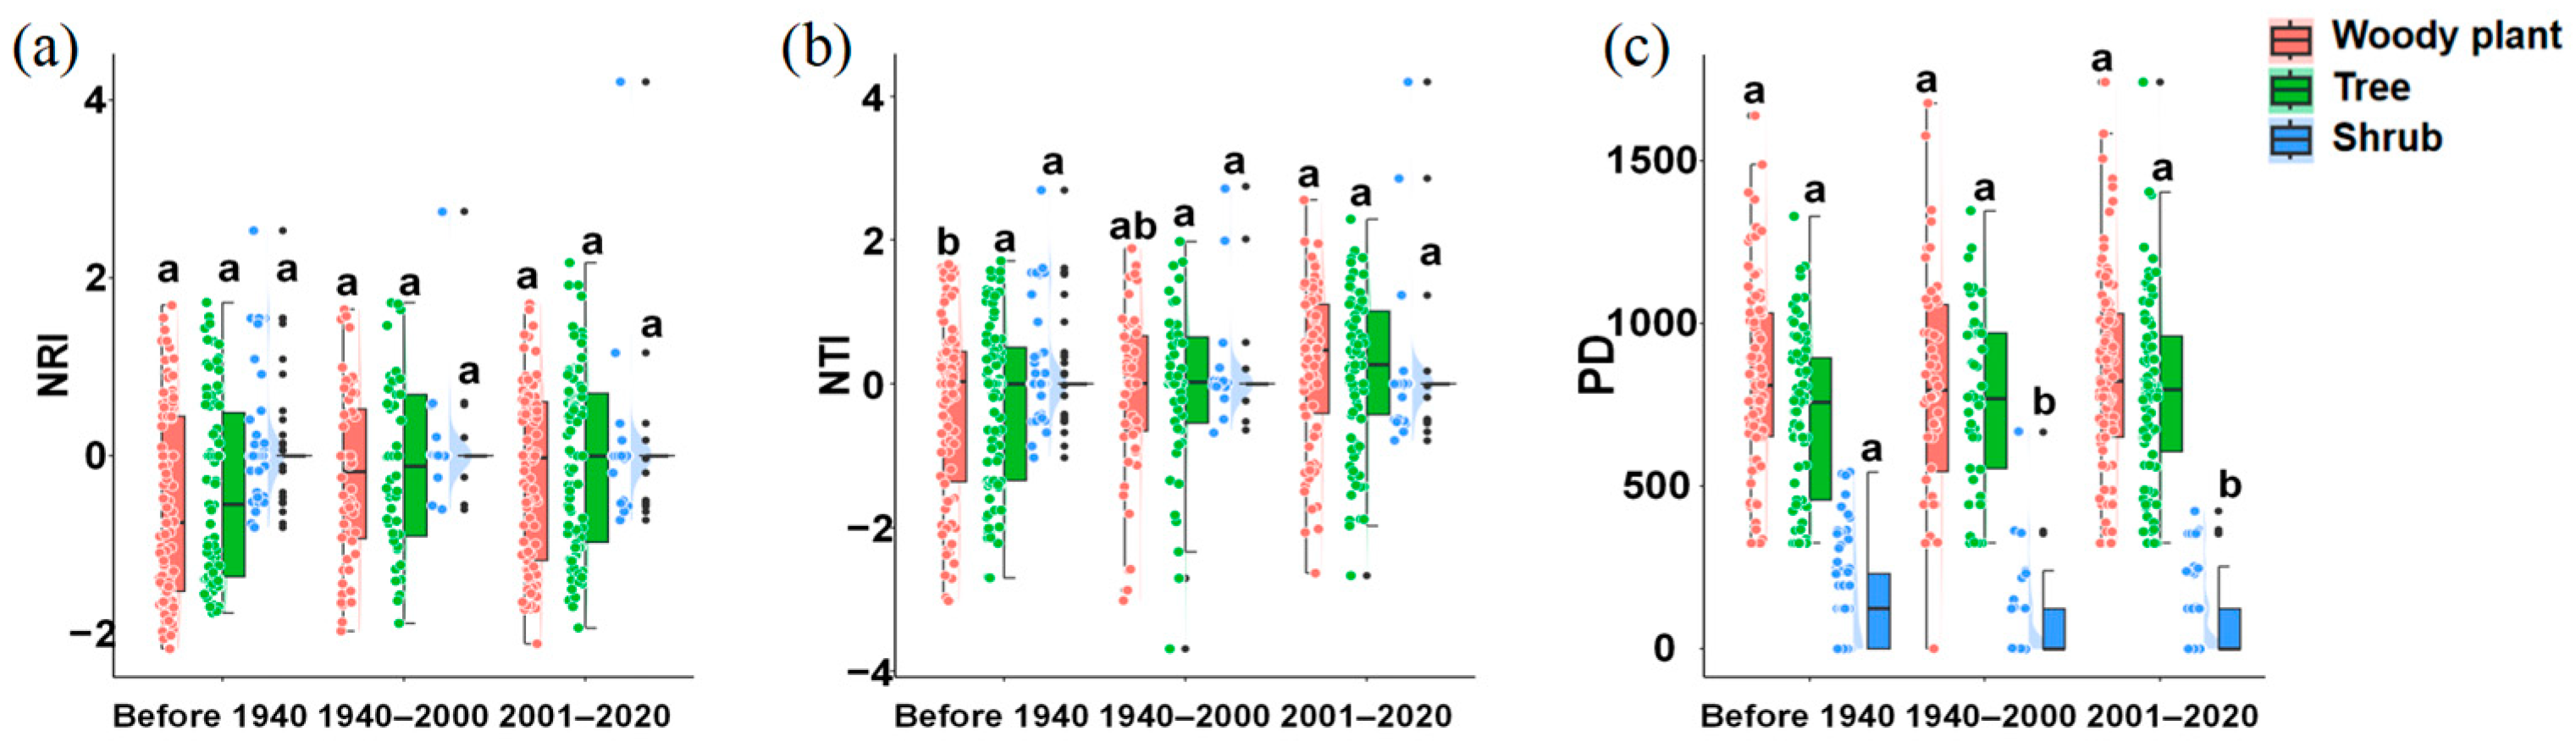
3.2. Multidimensional Diversity Attributes of Urban Parks Across Different Construction Periods
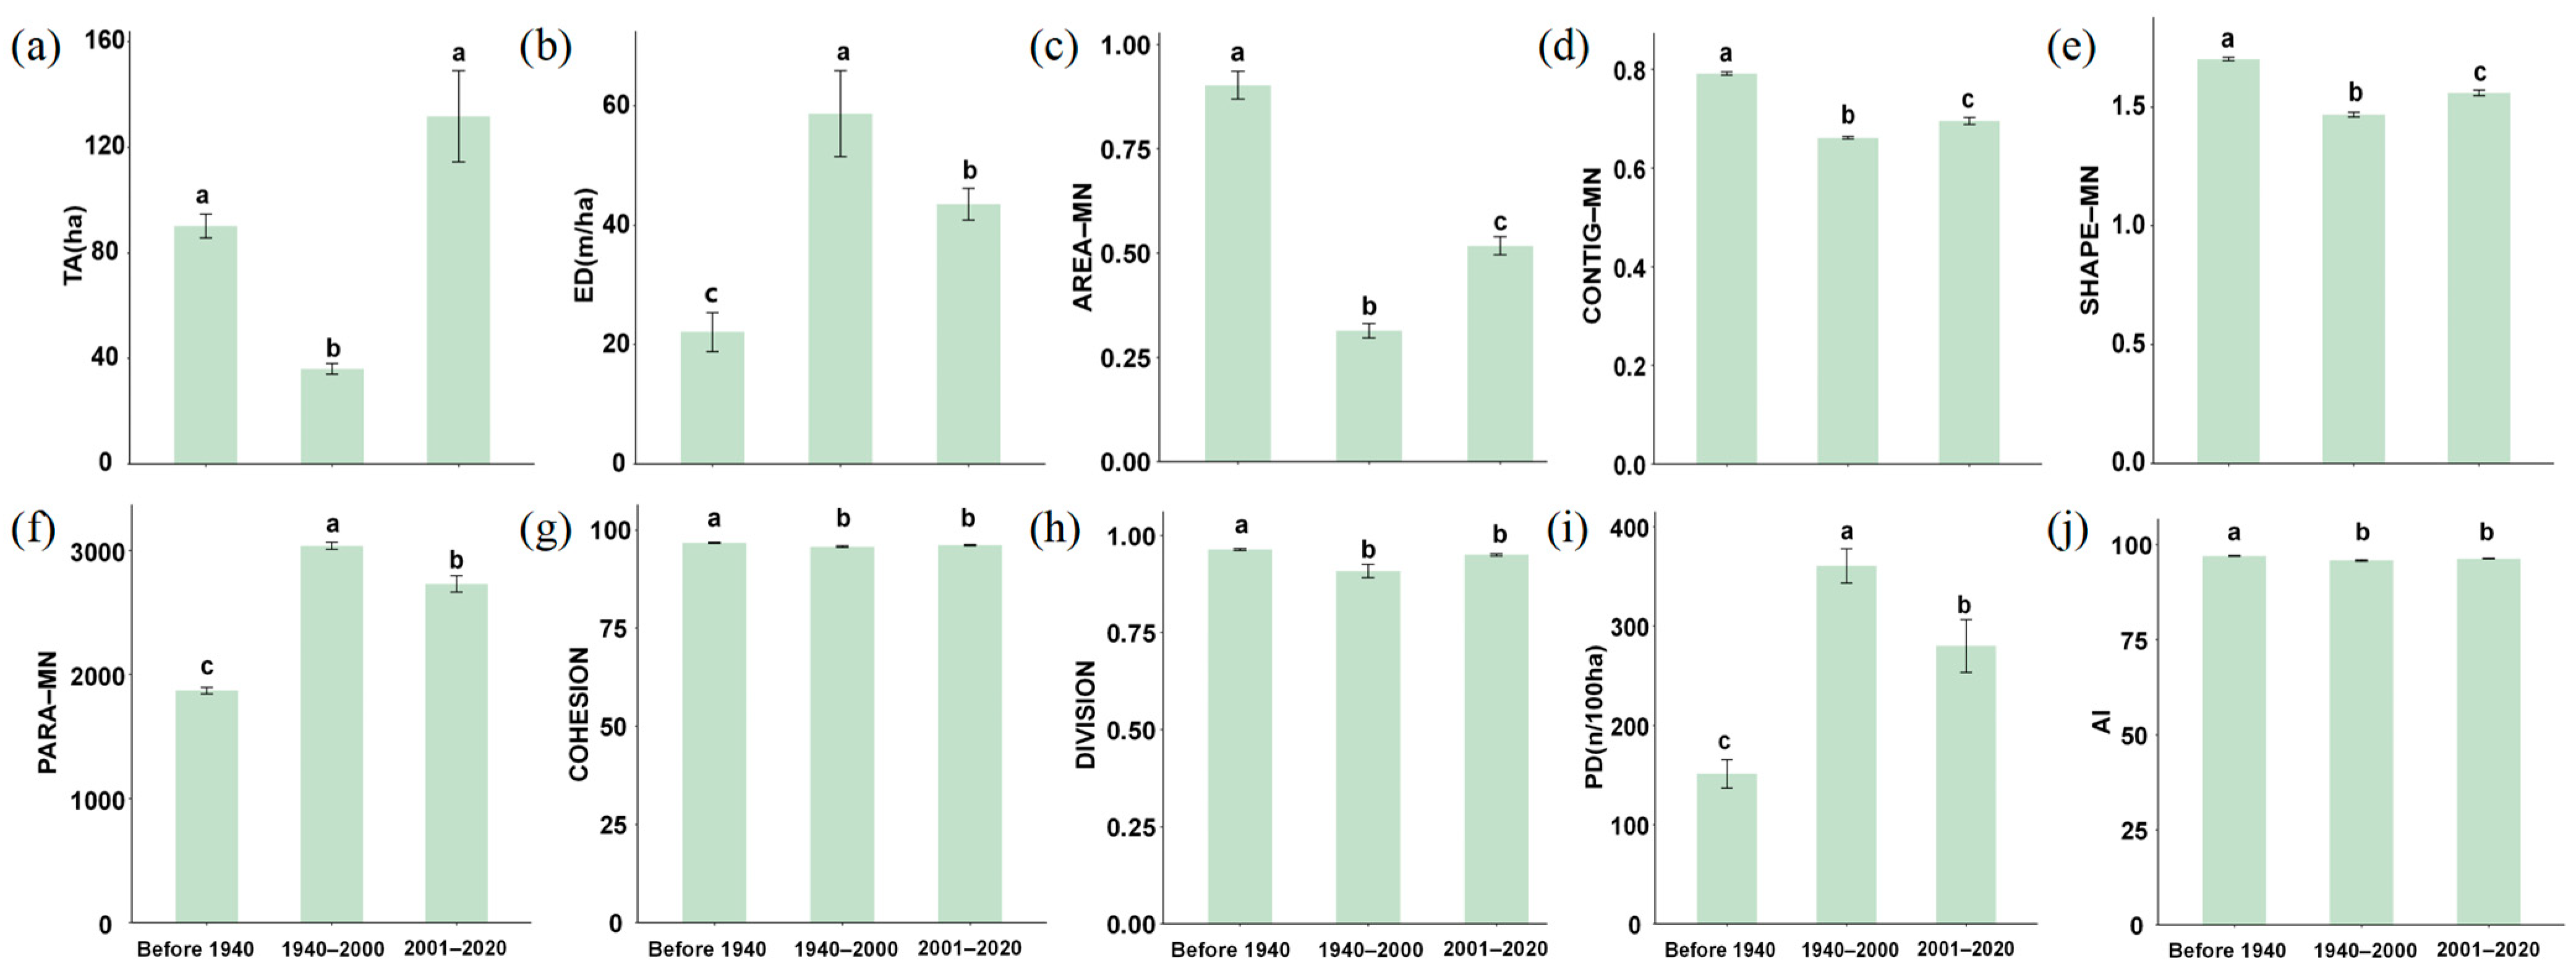
3.3. Landscape Pattern Metrics of Urban Parks Across Different Construction Periods
3.4. Associations Among Construction Period, Multidimensional Diversities and Landscape Patterns: Decoupling by SEM
4. Discussion
4.1. Effects of Construction Period of Urban Parks on Woody Plant Multidimensional Diversities
4.2. Effects of Construction Period of Urban Parks on Landscape Pattern Metrics
4.3. Associations Among Construction Period, Multidimensional Diversity Attributes and Landscape Patterns Decoupling by SEM
5. Conclusions
- (1)
- For “old” parks constructed before 1940, supplementary planting of small-diameter tree species is recommended to enhance species diversity while enriching the vertical layers of plant communities. For “new” parks constructed in the 2001–2020 period, reducing human intervention in shrub management combined with targeted replanting to increase shrub species diversity is suggested, and the management should replant medium-diameter trees to optimize the horizontal structure of plant communities.
- (2)
- From the perspective of multidimensional diversities, planting species with distant phylogenetic relationships to enhance species diversity is recommended. Additionally, increasing the Hh of communities can not only improve the species diversity of trees but also enhance the species diversity of woody plants.
- (3)
- Regulating landscape patterns can enhance both species diversity and structural diversity. Rational design of patch layout in green spaces of urban parks (e.g., decentralization, diverse shapes) may be more beneficial for biodiversity conservation than traditional centralized green spaces. This conclusion provides a novel insight into UGSs planning.
Author Contributions
Funding
Data Availability Statement
Acknowledgments
Conflicts of Interest
References
- Bongaarts, J. Summary for policymakers of the global assessment report on biodiversity and ecosystem services of the Intergovernmental Science-Policy Platform on Biodiversity and Ecosystem Services. Popul. Dev. Rev. 2019, 45, 680–681. [Google Scholar] [CrossRef]
- Weiskopf, S.R.; Lerman, S.B.; Isbell, F.; Morelli, T.L. Biodiversity promotes urban ecosystem functioning. Ecography 2024, 2024, 16. [Google Scholar] [CrossRef]
- Kaiho, K. Extinction magnitude of animals in the near future. Sci. Rep. 2022, 12, 8. [Google Scholar] [CrossRef]
- Panday, M.K.; Mittal, P.; Mehrotra, M.; Agarwal, M.B. Environmental Evolution: The Process of Ecological Changes in India; SAAR Publications: Agra, India, 2024; pp. 17–38. [Google Scholar]
- Xu, P. Avian Communities in Zijin Mountain Urban Forest of Nanjing City. Master’s Thesis, Nanjing Forestry University, Nanjing, China, 2008. [Google Scholar]
- Li, X.M.; Zhou, W.Q.; Ouyang, Z.Y. Relationship between land surface temperature and spatial pattern of greenspace: What are the effects of spatial resolution? Landsc. Urban Plan. 2013, 114, 1–8. [Google Scholar] [CrossRef]
- Ren, Z.B.; He, X.Y.; Zheng, H.F.; Zhang, D.; Yu, X.Y.; Shen, G.Q.; Guo, R.C. Estimation of the Relationship between Urban Park Characteristics and Park Cool Island Intensity by Remote Sensing Data and Field Measurement. Forests 2013, 4, 868–886. [Google Scholar] [CrossRef]
- Ma, Z.J.; Zhang, P.; Hu, N.L.; Wang, G.D.; Dong, Y.L.; Guo, Y.J.; Wang, C.C.; Fu, Y.; Ren, Z.B. Understanding the drivers of woody plant diversity in urban parks in a snow climate city of China. J. For. Res. 2023, 34, 1021–1032. [Google Scholar] [CrossRef]
- Paul, A.M.; Alfred, J. Tree Species Diversity in Makurdi Zoological Garden, Benue State, Nigeria. UMYU Sci. 2024, 3, 1–7. [Google Scholar] [CrossRef]
- Ryan, M.G.; Stape, J.L.; Binkley, D.; Fonseca, S.; Loos, R.A.; Takahashi, E.N.; Silva, C.R.; Silva, S.R.; Hakamada, R.E.; Ferreira, J.M.; et al. Factors controlling Eucalyptus productivity: How water availability and stand structure alter production and carbon allocation. For. Ecol. Manag. 2010, 259, 1695–1703. [Google Scholar] [CrossRef]
- Hardiman, B.S.; Bohrer, G.; Gough, C.M.; Vogel, C.S.; Curtis, P.S. The role of canopy structural complexity in wood net primary production of a maturing northern deciduous forest. Ecology 2011, 92, 1818–1827. [Google Scholar] [CrossRef]
- Hardiman, B.S.; Gough, C.M.; Halperin, A.; Hofmeister, K.L.; Nave, L.E.; Bohrer, G.; Curtis, P.S. Maintaining high rates of carbon storage in old forests: A mechanism linking canopy structure to forest function. For. Ecol. Manag. 2013, 298, 111–119. [Google Scholar] [CrossRef]
- Fahey, R.T.; Fotis, A.T.; Woods, K.D. Quantifying canopy complexity and effects on productivity and resilience in late-successional hemlock-hardwood forests. Ecol. Appl. 2015, 25, 834–847. [Google Scholar] [CrossRef] [PubMed]
- Fichtner, A.; Forrester, D.I.; Härdtle, W.; Sturm, K.; von Oheimb, G. Facilitative-Competitive Interactions in an Old-Growth Forest: The Importance of Large-Diameter Trees as Benefactors and Stimulators for Forest Community Assembly. PLoS ONE 2015, 10, e0120335. [Google Scholar] [CrossRef] [PubMed]
- Jucker, T.; Bouriaud, O.; Coomes, D.A. Crown plasticity enables trees to optimize canopy packing in mixed-species forests. Funct. Ecol. 2015, 29, 1078–1086. [Google Scholar] [CrossRef]
- Wang, Y.Y.; Dai, X.Z.; Chen, X.L.; Zhang, D.; Lin, G.Q.; Zhou, Y.H.; Wang, T.Y.; Cui, Y.L. Effects of urbanization and forest type on species composition and diversity, forest characteristics, biomass carbon sink, and their associations in Changchun, Northeast China: Implications for urban carbon stock improvement. J. For. Res. 2024, 35, 36. [Google Scholar]
- Mitchell, J.C.; Kashian, D.M.; Chen, X.W.; Cousins, S.; Flaspohler, D.; Gruner, D.S.; Johnson, J.S.; Surasinghe, T.D.; Zambrano, J.; Buma, B. Forest ecosystem properties emerge from interactions of structure and disturbance. Front. Ecol. Environ. 2023, 21, 14–23. [Google Scholar] [CrossRef]
- Li, W.H.; Zhao, Z.R.; Zhao, Q.L.; Wang, Q.H.; Li, J.Y.; Li, M.Y.; Xie, L. Geographical study on the phylogenetic fauna of vascular plants in Beijing. J. Beijing For. Univ. 2024, 46, 35–44. [Google Scholar]
- Bai, F.H. Study on Species Diversity and Phylogenetic Diversity of Typical Shrub Plant Communities in Henan Province. Master’s Thesis, Shangdong University, Jinan, China, 2019. [Google Scholar]
- Wu, J.J. Attributes of Woody Plant Diversity in Changchun and Its Spatial Pattern Analysis. Master’s Thesis, Changchun University, Changchun, China, 2023. [Google Scholar]
- Li, J.Y.; Yang, D.D.; Yang, F.; Zhang, Y.; Wang, H.C. Influence of landscape pattern on ecosystem service supply-demand mismatch in Tianjin within the context of urbanization. Acta Ecol. Sin. 2024, 44, 4987–5002. [Google Scholar] [CrossRef]
- Liu, Z.H.; Wei, L.; Zhou, Y. Constructing sustainable landscape patterns for enhancing urban biodiversity. Acta Ecol. Sin. 2024, 44, 5905–5913. [Google Scholar] [CrossRef]
- Lindenmayer, D.B.; Cunningham, R.B.; Donnelly, C.F.; Lesslie, R. On the use of landscape surrogates as ecological indicators in fragmented forests. For. Ecol. Manag. 2002, 159, 203–216. [Google Scholar] [CrossRef]
- Morelli, F.; Pruscini, F.; Santolini, R.; Perna, P.; Benedetti, Y.; Sisti, D. Landscape heterogeneity metrics as indicators of bird diversity: Determining the optimal spatial scales in different landscapes. Ecol. Indic. 2013, 34, 372–379. [Google Scholar] [CrossRef]
- Uuemaa, E.; Mander, Ü.; Marja, R. Trends in the use of landscape spatial metrics as landscape indicators: A review. Ecol. Indic. 2013, 28, 100–106. [Google Scholar] [CrossRef]
- Yang, J.H.; Shi, W.J.; Zhou, W.Q.; Wang, J.H.; Qian, Y.G.; Wang, W.M. A review on the driving factors and their characteristics in urban landscape pattern changes. Acta Ecol. Sin. 2024, 44, 10486–10498. [Google Scholar] [CrossRef]
- Jim, C.Y.; Chen, W.Y. Urbanization Effect on Floristic and Landscape Patterns of Green Spaces. Landsc. Res. 2009, 34, 581–598. [Google Scholar] [CrossRef]
- Yang, J.M.; Li, X.L.; Li, S.M.; Liang, H.; Lu, H.C. The woody plant diversity and landscape pattern of fine-resolution urban forest along a distance gradient from points of interest in Qingdao. Ecol. Indic. 2021, 122, 107326. [Google Scholar] [CrossRef]
- Ma, Z.J.; Zhai, C.; Ren, Z.B.; Zhang, D.; Hu, N.L.; Zhang, P.; Guo, Y.J.; Wang, C.C.; Hong, S.Y.; Hong, W.H. Spatial pattern of urban forest diversity and its potential drivers in a snow climate city, Northeast China. Urban For. Urban Green. 2024, 94, 128260. [Google Scholar] [CrossRef]
- Millward, A.A.; Sabir, S. Structure of a forested urban park: Implications for strategic management. J. Environ. Manag. 2010, 91, 2215–2224. [Google Scholar] [CrossRef]
- Chang, Y.F. Multidimensional Diversity Characteristics of Woody Plants in Changchun Parks and the Relationship with Biomass. Master’s Thesis, Changchun University, Changchun, China, 2022. [Google Scholar] [CrossRef]
- Huang, X.; Huang, X.J.; Chen, C. The Characteristic, Mechanism and Regulation of Urban Spatial Expansion of Changchun. Areal Res. Dev. 2009, 28, 68–72. [Google Scholar]
- Yan, Z.G.; Teng, M.J.; He, W.; Liu, A.Q.; Li, Y.R.; Wang, P.C. Impervious surface area is a key predictor for urban plant diversity in a city undergone rapid urbanization. Sci. Total Environ. 2019, 650, 335–342. [Google Scholar] [CrossRef]
- Chang, Y.F.; Wang, Z.H.; Zhang, D.; Fu, Y.; Zhai, C.; Wang, T.; Yang, Y.H.; Wu, J.J. Analysis of Urban Woody Plant Diversity among Different Administrative Districts and the Enhancement Strategy in Changchun City, China. Sustainability 2022, 14, 7624. [Google Scholar] [CrossRef]
- Zhang, D.; Wang, W.J.; Zheng, H.F.; Ren, Z.B.; Zhai, C.; Tang, Z.; Shen, G.Q.; He, X.Y. Effects of urbanization intensity on forest structural-taxonomic attributes, landscape patterns and their associations in Changchun, Northeast China: Implications for urban green infrastructure planning. Ecol. Indic. 2017, 80, 286–296. [Google Scholar] [CrossRef]
- Wu, F.F.; Liu, N.; He, C.M.; Yuan, Z.Q.; Hao, Z.Q.; Yin, Q.L. Elevational gradient pattern of woody plant community structure and diversity in the Qinling Mountains. Biodivers. Sci. 2024, 32, 7–25. [Google Scholar]
- Ali, A.; Yan, E.R.; Chen, H.Y.H.; Chang, S.X.; Zhao, Y.T.; Yang, X.D.; Xu, M.S. Stand structural diversity rather than species diversity enhances aboveground carbon storage in secondary subtropical forests in Eastern China. Biogeosciences 2016, 13, 4627–4635. [Google Scholar] [CrossRef]
- Chai, Y.F.; Yue, M.; Liu, X.; Guo, Y.X.; Wang, M.; Xu, J.S.; Zhang, C.G.; Chen, Y.; Zhang, L.X.; Zhang, R.C. Patterns of taxonomic, phylogenetic diversity during a long-Term succession of forest on the Loess Plateau, China: Insights into assembly process. Sci. Rep. 2016, 6, 27087. [Google Scholar] [CrossRef]
- Qian, H.; FIELD, R.; Zhang, J.L.; Zhang, J.; Chen, S.B. Phylogenetic structure and ecological and evolutionary determinants of species richness for angiosperm trees in forest communities in China. J. Biogeogr. 2016, 43, 603–615. [Google Scholar] [CrossRef]
- Gao, Y.T.; Wang, M.; Bi, X.; Liu, Y.H.; Wu, C.Y.; Chen, G.J.; Kuang, S.J.; Li, S.P.; Song, C.H.; Li, J.X. Plant phylogenetic diversity along the urban-rural gradient and its association with urbanization degree in Shanghai, China. Landsc. Ecol. 2024, 39, 166. [Google Scholar] [CrossRef]
- Zhang, R.W.; Ying, J.; Zhang, R.T.; Zhang, Y.Q. Urban green and blue infrastructure: Unveiling the spatiotemporal impact on carbon emissions in China’s Yangtze River Delta. Environ. Sci. Pollut. Res. 2024, 31, 18512–18526. [Google Scholar] [CrossRef]
- Han, Y.; Guo, X.; Jiang, Y.F.; Rao, L.; Sun, K.; Yu, H.M. Correlation analysis between cultivated land quality and landscape pattern index in south hilly areas. Jiangsu J. Agric. Sci. 2018, 34, 1057–1065. [Google Scholar]
- Li, Q.W. Study on Relationship Between Biodiversity and Landscape Pattern of Nature Reserves in Zhejiang Province. Master’s Thesis, Inner Mongolia Agricultural University, Hohhot, China, 2023. [Google Scholar] [CrossRef]
- Rosseel, Y. lavaan: An R Package for Structural Equation Modeling. J. Stat. Softw. 2012, 48, 1–36. [Google Scholar] [CrossRef]
- Cheng, X.L.; Cubino, J.P.; Balfour, K.; Zhu, Z.X.; Wang, H.F. Drivers of spontaneous and cultivated species diversity in the tropical city of Zhanjiang, China. Urban For. Urban Green. 2022, 67, 127428. [Google Scholar] [CrossRef]
- Guo, L.Y.; Nizamani, M.M.; Harris, A.; Cubino, J.P.; Johnson, J.B.; Cui, J.P.; Zhang, H.L.; Zhou, J.J.; Zhu, Z.X.; Wang, H.F. Anthropogenic factors explain urban plant diversity across three tropical cities in China. Urban For. Urban Green. 2024, 95, 128323. [Google Scholar] [CrossRef]
- Maurer, M.; Zaval, L.; Orlove, B.; Moraga, V.; Culligan, P. More than nature: Linkages between well-being and greenspace influenced by a combination of elements of nature and non-nature in a New York City urban park. Urban For. Urban Green. 2021, 61, 127081. [Google Scholar] [CrossRef]
- Li, D.L.; Wu, S.Y.; Liang, Z.; Li, S.C. The impacts of urbanization and climate change on urban vegetation dynamics in China. Urban For. Urban Green. 2020, 54, 126764. [Google Scholar] [CrossRef]
- Hooper, D.U.; Chapin, F.S.; Ewel, J.J.; Hector, A.; Inchausti, P.; Lavorel, S.; Lawton, J.H.; Lodge, D.M.; Loreau, M.; Naeem, S.; et al. Effects of biodiversity on ecosystem functioning: A consensus of current knowledge. Ecol. Monogr. 2005, 75, 3–35. [Google Scholar] [CrossRef]
- Wang, J.; Zhao, W.W.; Zhang, X.; Liu, Y.; Wang, S.; Liu, Y.X. Effects of reforestation on plant species diversity on the Loess Plateau of China: A case study in Danangou catchment. Sci. Total Environ. 2019, 651, 979–989. [Google Scholar] [CrossRef] [PubMed]
- Wang, Y.N.; Chang, Q.; Li, X.Y. Promoting sustainable carbon sequestration of plants in urban greenspace by planting design: A case study in parks of Beijing. Urban For. Urban Green. 2021, 64, 127291. [Google Scholar] [CrossRef]
- Ceplová, N.; Lososová, Z.; Zeleny, D.; Chytry, M.; Danihelka, J.; Fajmon, K.; Láníková, D.; Preislerová, Z.; Rehorek, V.; Tichy, L. Phylogenetic diversity of central-European urban plant communities: Effects of alien species and habitat types. Preslia 2015, 87, 1–16. [Google Scholar]
- Zhan, B. Functional and Phylogenetic Diversity of Shrubs Under Two Typical Mixed Forests in Zijin Mountain. Master’s Thesis, Nanjing Forestry University, Nanjing, China, 2018. [Google Scholar]
- Li, Y. Variation of Leaf Trait Network Among Different Vegetation Types and Its Influencing Factors. Master’s Thesis, Beijing Forestry University, Beijing, China, 2020. [Google Scholar] [CrossRef]
- Dadashpoor, H.; Azizi, P.; Moghadasi, M. Land use change, urbanization, and change in landscape pattern in a metropolitan area. Sci. Total Environ. 2019, 655, 707–719. [Google Scholar] [CrossRef]
- Zheng, L.; Lu, J.Z.; Liu, H.; Chen, X.L.; Yesou, H. Evidence of vegetation greening benefitting from the afforestation initiatives in China. Geo Spat. Inf. Sci. 2024, 27, 683–702. [Google Scholar] [CrossRef]
- Chen, C.; Park, T.; Wang, X.H.; Piao, S.L.; Xu, B.D.; Chaturvedi, R.K.; Fuchs, R.; Brovkin, V.; Ciais, P.; Fensholt, R.; et al. China and India lead in greening of the world through land-use management. Nat. Sustain. 2019, 2, 122–129. [Google Scholar] [CrossRef]
- Amici, V.; Rocchini, D.; Filibeck, G.; Bacaro, G.; Santi, E.; Geri, F.; Landi, S.; Scoppola, A.; Chiarucci, A. Landscape structure effects on forest plant diversity at local scale: Exploring the role of spatial extent. Ecol. Complex. 2015, 21, 44–52. [Google Scholar] [CrossRef]
- Czortek, P.; Pielech, R. Surrounding landscape influences functional diversity of plant species in urban parks. Urban For. Urban Green. 2020, 47, 126525. [Google Scholar] [CrossRef]
- Che, Y.; Jin, G.Z. Effects of species diversity and phylogenetic diversity on productivity of a mixed broad leaved-Korean pine forest. Chin. J. Appl. Ecol. 2019, 30, 2241–2248. [Google Scholar] [CrossRef]
- Wang, W.F.; Lei, X.D.; Ma, Z.H.; Kneeshaw, D.D.; Peng, C.H. Positive Relationship between Aboveground Carbon Stocks and Structural Diversity in Spruce-Dominated Forest Stands in New Brunswick, Canada. For. Sci. 2011, 57, 506–515. [Google Scholar] [CrossRef]
- Yachi, S.; Loreau, M. Does complementary resource use enhance ecosystem functioning? A model of light competition in plant communities. Ecol. Lett. 2007, 10, 54–62. [Google Scholar] [CrossRef] [PubMed]
- Lei, X.D.; Wang, W.F.; Peng, C.H. Relationships between stand growth and structural diversity in spruce-dominated forests in New Brunswick, Canada. Can. J. For. Res. 2009, 39, 1835–1847. [Google Scholar] [CrossRef]
- Browning, M.; Lee, K.; Wolf, K.L. Tree cover shows an inverse relationship with depressive symptoms in elderly residents living in U.S. nursing homes. Urban For. Urban Green. 2019, 41, 23–32. [Google Scholar] [CrossRef]
- Lyu, L.; Sho, K.; Zhao, H.; Song, Y.K.; Uchiyama, Y.; Kim, J.; Sakai, T. Construction, assessment, and protection of green infrastructure networks from a dynamic perspective: A case study of Dalian City, Liaoning Province, China. Urban For. Urban Green. 2024, 101, 128545. [Google Scholar] [CrossRef]


| Construction Period | Park Name |
|---|---|
| before 1940 | South Lake Park, Children Park, Chaoyang Park, Shengli Park |
| 1940–2000 | Daishan Park, Labour Park, Junzilan Park, Forest Park, Zoo and Botanical Garden, Mudan Garden, Xinghuacun Park, Changchun Park |
| 2001–2020 | Friendship Park, Sculpture Park, Jinjiang Park, Tianjia Park, Guanlan Lake Park, Baihua Park, Car Park, Beihai Park, Shuiwenhua Park, Changchun Industrial Trajectory Park, Kuancheng central Park, Changchun Youth Park, Nanxi Wetland Park, Yuehe Cultural Park, Binhe Park, North Lake Wetland Park, Baimu Park |
| Construction Period | Before 1940 | 1940–2000 | 2001–2020 |
|---|---|---|---|
| Family (tree) | 20 | 20 | 17 |
| Genera (tree) | 34 | 35 | 33 |
| Species (tree) | 62 | 64 | 73 |
| Family (shrub) | 11 | 9 | 9 |
| Genera (shrub) | 20 | 19 | 19 |
| Species (shrub) | 24 | 23 | 25 |
| Construction Period | Tree Species | Shrub Species |
|---|---|---|
| before 1940 | Pinus tabuliformis var. Mukdensis, Larix olgensis, Quercus mongolica | Sambucus williamsii, Lonicera japonica, Forsythia mandschurica |
| 1940–2000 | Pinus sylvestris var. Mongolica, Abies holophylla, Fraxinus mandshurica | Ligustrum quihoui, Lonicera japonica, Weigela florida |
| 2001–2020 | Pinus sylvestris var. Mongolica, Picea koraiensis, Betula platyphylla | Lonicera tatarica, Lonicera japonica, Prunus salicina |
| Response Variable | Mediate Variable | Predictor Variable | Pathway | Standard | p-Value | Significance/Total |
|---|---|---|---|---|---|---|
| Direct effects | ||||||
| Woody species diversity | Different construction periods | Direct | −0.14 | 0.024 | 90% (9/10) | |
| Tree species diversity | Different construction periods | Direct | −0.24 | 0.000 | ||
| Shrub species diversity | Different construction periods | Direct | 0.22 | 0.001 | ||
| Woody species phylogenetic diversity | Different construction periods | Direct | −0.19 | 0.003 | ||
| Tree species phylogenetic diversity | Different construction periods | Direct | −0.14 | 0.032 | ||
| Shrub species phylogenetic diversity | Different construction periods | Direct | 0.02 | 0.738 | ||
| Structural diversity | Different construction periods | Direct | −0.20 | 0.002 | ||
| landscape patterns | Different construction periods | Direct | −0.27 | 0.000 | ||
| Tree species diversity | Structural diversity | Direct | 0.04 | 0.045 | ||
| Shrub species phylogenetic diversity | Shrub species diversity | Direct | 0.21 | 0.003 | ||
| Indirect effects | ||||||
| Tree species diversity | Structural diversity | Different construction periods | Indirect | −0.0080 | 0.024 | 100% (2/2) |
| Shrub species phylogenetic diversity | Shrub species diversity | Different construction periods | Indirect | 0.0462 | 0.024 | |
| Total effects | ||||||
| Tree species diversity | Different construction periods | Total | −0.2480 | 0.024 | 50% (1/2) | |
| Shrub species phylogenetic diversity | Different construction periods | Total | 0.0662 | 0.291 | ||
Disclaimer/Publisher’s Note: The statements, opinions and data contained in all publications are solely those of the individual author(s) and contributor(s) and not of MDPI and/or the editor(s). MDPI and/or the editor(s) disclaim responsibility for any injury to people or property resulting from any ideas, methods, instructions or products referred to in the content. |
© 2025 by the authors. Licensee MDPI, Basel, Switzerland. This article is an open access article distributed under the terms and conditions of the Creative Commons Attribution (CC BY) license (https://creativecommons.org/licenses/by/4.0/).
Share and Cite
Yao, X.; Zhang, D.; Song, Y.; Zhang, H.; Zhang, X.; Chang, Y.; Ma, X.; Lu, Z.; Wang, Y. Effects of Urban Park Construction Period on Plant Multidimensional Diversities, Landscape Patterns of Green Spaces, and Their Associations in Changchun City, Northeast China. Land 2025, 14, 675. https://doi.org/10.3390/land14040675
Yao X, Zhang D, Song Y, Zhang H, Zhang X, Chang Y, Ma X, Lu Z, Wang Y. Effects of Urban Park Construction Period on Plant Multidimensional Diversities, Landscape Patterns of Green Spaces, and Their Associations in Changchun City, Northeast China. Land. 2025; 14(4):675. https://doi.org/10.3390/land14040675
Chicago/Turabian StyleYao, Xiao, Dan Zhang, Yuhang Song, Hongjian Zhang, Xiaolei Zhang, Yufei Chang, Xinyuan Ma, Ziyue Lu, and Yuanyuan Wang. 2025. "Effects of Urban Park Construction Period on Plant Multidimensional Diversities, Landscape Patterns of Green Spaces, and Their Associations in Changchun City, Northeast China" Land 14, no. 4: 675. https://doi.org/10.3390/land14040675
APA StyleYao, X., Zhang, D., Song, Y., Zhang, H., Zhang, X., Chang, Y., Ma, X., Lu, Z., & Wang, Y. (2025). Effects of Urban Park Construction Period on Plant Multidimensional Diversities, Landscape Patterns of Green Spaces, and Their Associations in Changchun City, Northeast China. Land, 14(4), 675. https://doi.org/10.3390/land14040675