Article

Land Surface Phenology Response to Climate in Semi-Arid Desertified Areas of Northern China

Key Laboratory of Ecological Safety and Sustainable Development in Arid Lands, Northwest Institute of Eco-Environment and Resources, Chinese Academy of Sciences, No. 318 West Donggang Road, Lanzhou 730000, China
*
Author to whom correspondence should be addressed.
Land 2025, 14(3), 594; https://doi.org/10.3390/land14030594
Submission received: 17 February 2025 / Revised: 10 March 2025 / Accepted: 11 March 2025 / Published: 12 March 2025

Abstract

:
In desertified regions, monitoring vegetation phenology and elucidating its relationship with climatic factors are of crucial significance for understanding how desertification responds to climate change. This study aimed to extract the spatial-temporal evolution of land surface phenology metrics from 2001 to 2020 using MODIS NDVI products (NASA, Greenbelt, MD, USA) and explore the potential impacts of climate change on land surface phenology through partial least squares regression analysis. The key results are as follows: Firstly, regionally the annual mean start of the growing season (SOS) ranged from day of year (DOY) 130 to 170, the annual mean end of the growing season (EOS) fell within DOY 270 to 310, and the annual mean length of the growing season (LOS) was between 120 and 180 days. Most of the desertified areas demonstrated a tendency towards an earlier SOS, a delayed EOS, and a prolonged LOS, although a small portion exhibited the opposite trends. Secondly, precipitation prior to the SOS period significantly influenced the advancement of SOS, while precipitation during the growing season had a marked impact on EOS delay. Thirdly, high temperatures in both the pre-SOS and growing seasons led to moisture deficits for vegetation growth, which was unfavorable for both SOS advancement and EOS delay. The influence of temperature on SOS and EOS was mainly manifested during the months when SOS and EOS occurred, with the minimum temperature having a more prominent effect than the average and maximum temperatures. Additionally, the wind in the pre-SOS period was found to adversely impact SOS advancement, potentially due to severe wind erosion in desertified areas during spring. The findings of this study reveal that the delayed spring phenology, precipitated by the occurrence of a warm and dry spring in semi-arid desertified areas of northern China, has the potential to heighten the risk of desertification.

1. Introduction

As the fundamental component of terrestrial ecosystems, vegetation serves as the natural bridge that connects the atmosphere, hydrosphere, soil cycle, and other elements [1,2]. The phenomenon of vegetation adapting to cyclical changes in climate and environmental factors over a long period of time to form growth and development rhythms that are compatible with this phenomenon is known as vegetation phenology [3]. Vegetation phenology is intimately connected with external environmental factors such as temperature, precipitation, and sunshine [4], and thus it can be employed to reflect the rapid response of vegetation to climate change [5,6,7]. The ease with which vegetation phenology can be observed has rendered it a sensitive indicator of the response of terrestrial ecosystems to climate change [8,9]. Furthermore, changes in vegetation phenology have significant impacts and feedback on climate though influencing terrestrial ecosystem carbon and water cycles by altering the length and duration of vegetation photosynthesis and respiration [10,11]. Currently, vegetation phenology is a significant factor in climate–vegetation energy exchange models, vegetation net primary productivity estimation models, and carbon cycle balance models [12]. It is also employed extensively in the study of vegetation growth, the monitoring of the ecological environment, and the investigation of the response mechanisms of vegetation changes to climate.
The principal techniques currently used to monitor vegetation phenology encompass in situ phenological observation, the utilization of phenology cameras, the application of bio-climatic models, and the implementation of remote sensing-based estimation [13,14]. Land surface phenology (LSP) is employed to describe the vegetation phenology that is obtained through remote sensing, which is estimated by vegetation index (VI) time series, with the objective of obtaining phenological phases and phenological metrics [15,16]. Satellite observational records provide a dense temporal and long time series of surface reflectance data that objectively reflect vegetation growth. Consequently, remote sensing data are frequently used to monitor the phenology of vegetation communities over extended times at regional scales. VIs calculated from the land surface reflectance from several satellite sensors are used to monitor vegetation phenology, including AVHRR, MODIS, and SPOT Vegetation [16]. The quality information of the data provided by MODIS can effectively improve the quality of the vegetation index data by adjusting the weights in the reconstruction process of the vegetation indices, thus circumventing the degradation of the data quality due to atmospheric conditions, clouds, snow, etc. [17,18,19,20,21]. With the high spatial and temporal resolution of MODIS, VIs calculated using MODIS surface reflectance(NASA, Greenbelt, MD, USA) are a widely used tool in vegetation phenology monitoring. Among the numerous VIs, the NDVI is a particularly useful tool for monitoring vegetation phenology due to its capacity to detect seasonal and inter-annual variations in vegetation growth status, leaf cover, and canopy structures [22].
China is one of the most vulnerable countries in the world to desertification [23]. It is widely acknowledged that the most effective means of reducing the risk of aeolian erosion, combating desertification, and improving the ecological environment, is to increase vegetation cover as rapidly and extensively as possible [24,25,26,27]. Nevertheless, the vulnerability of ecosystems in desertified areas is compounded by water scarcity resulting from the expansion of vegetation cover, particularly forested land, and the adverse impacts of climate change, which may cause irreversible damage to ecosystems once thresholds are exceeded [28,29,30]. Consequently, an investigation into the dynamics of vegetation phenology and its response to climate change in desertified regions is crucial for understanding the feedback mechanisms of vegetation in response to climate change, reducing the associated risks, and informing strategies for the control of desertification and the construction and maintenance of ecological barriers in northern China.
In this study, we employed a reconstructed MODIS NDVI data series from 2001 to 2020, generated through a Savizky–Golay filtering reconstruction method, to extract LSP metrics utilizing a dynamic threshold method. Subsequently, we analyzed the spatial and temporal patterns of LSP. The study aimed to identify trends in LSP in the semi-arid desertification area in northern China and to compare the different impacts of various climatic factors on the LSP. This would enable an exploration of the mechanisms underlying the response of vegetation phenology dynamics in the desertification area to climatic change.

2. Materials and Methods
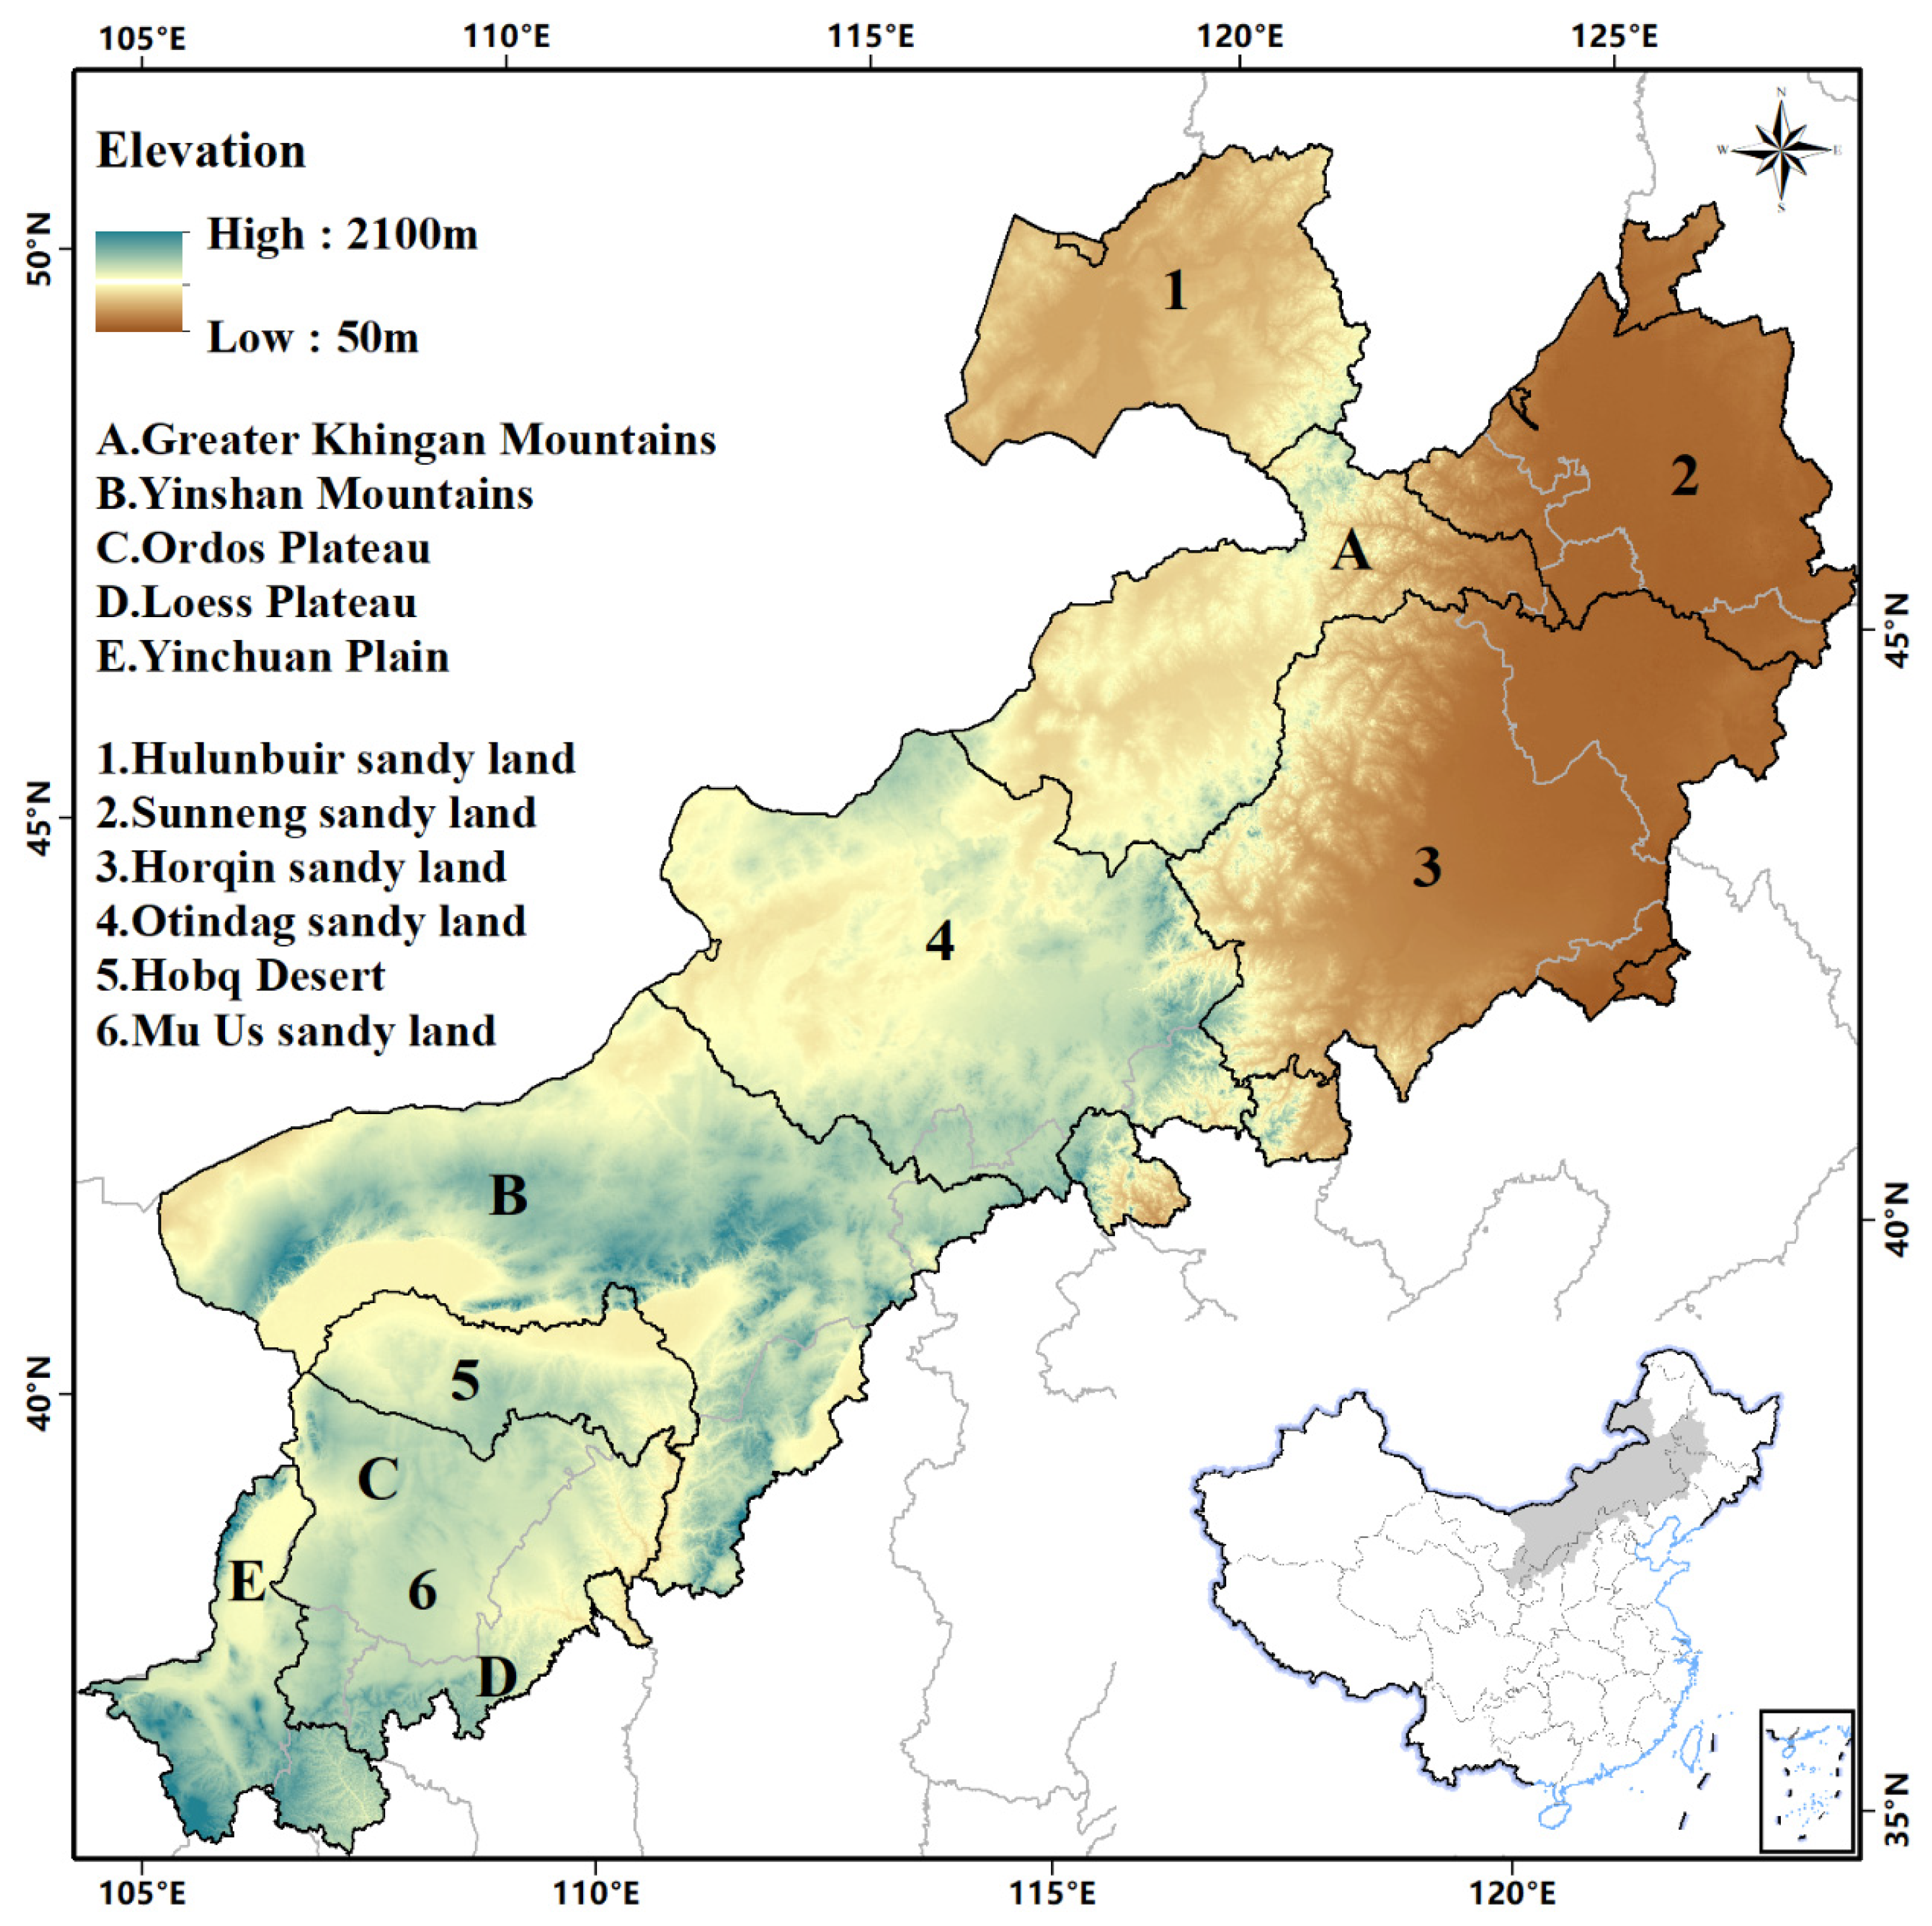
2.1. Study Area

The scope of the study area was selected with reference to the boundary of the Three North Protective Forest Project, the 400 mm precipitation line, and the counties (banners) involved in Zhu and Liu’s study on desertification in semi-arid areas of the agricultural and pastoral intertwined zone [31]. Furthermore, to ensure the connectivity of the study area, several counties in the Greater Khingan Mountains, which are in the semi-humid zone, were also included in the study area (Figure 1). The study area is located at longitude 10.24–126.9° E and latitude 35.8–50.1° N, with a total area of about 101.97 × 10⁴ km2, covering Hulunbuir Sandy Land (HLBR), Horqin Sandy Land (KRQ), Otindag Sandy Land (HSDK), Hobq Desert (KBQ), Mu Us Sandy Land (MWS), and other major desertified areas.
The temperature and precipitation patterns observed in the study area exhibit typical zonal characteristics. The average multi-year temperatures range from −1.5 to 8.5 °C, with a decrease from the southern to the northern regions. Similarly, the average annual precipitation varies from 100 to 500 mm, with an increase from west to east. The average multi-year wind speed is 2.5~3.4 m/s, and dust storms are frequent in spring, with dusty weather lasting 35~60 days. It is evident that the study area has undergone climate change in the past 100 years. The overall warming of the climate has resulted in a trend of increasing precipitation in the west and decreasing precipitation in the east [32]. Furthermore, evapotranspiration is observed to decrease in the west and increase in the east, resulting in the study area becoming warmer and more humid in the west and warmer and drier in the east [33]. Additionally, there is a notable decline in summer precipitation, drier warm seasons, and a significant increase in the frequency of extreme droughts across the study area [34,35].

2.2. Data Acquisition and Pre-Processing

To achieve more accurate monitoring of LSP, the MODIS land surface reflectance products MOD09Q1.061(NASA, Greenbelt, MD, USA) were selected as the data source for the calculation of NDVI time series. This dataset offered a higher spatial and temporal resolution (250 m and 8 d, respectively) in comparison to other available options. The MOD09Q1.061 was obtained from the NASA Land Processes Distributed Active Archive Center (https://ladsweb.modaps.eosdis.nasa.gov/, accessed on 12 April 2024) and employed in this study for the time spanning from 2001 to 2020. Once the NDVI calculations had been completed, a method for reconstructing a high-quality NDVI time-series dataset based on Savizky–Golay filtering was employed to remove the effects of atmospheric conditions, view angles, clouds and shadows, maximum synthesis and other noise, on the NDVI. The presence of ice and snow at the surface reduces the NDVI, and the rapid increase in NDVI that occurs with the melting of snow and ice can introduce errors in the monitoring of LSP [36,37,38]. To address this issue, the MODIS land surface temperature product, MOD11A2, was employed to remove the effect of snow and ice on NDVI. Given that 10 °C represents the threshold temperature for thermophilic plant growth, it also marks the point at which cool-loving plants flourish and perennials accelerate their dry matter accumulation [39]. To distinguish NDVI values affected by snow cover, the NDVI value was labeled as snow-covered when the average of daytime and nighttime land surface temperature was below 5 °C and the NDVI value was below 0.1. In the event that NDVI values are identified as snow-covered, the values will be replaced with the mean of the non-snow-covered NDVI values at diurnal surface temperatures below 5 °C.
The growth and development of vegetation in semi-arid zones is primarily influenced by climatic factors, with temperature and precipitation being the most significant. In light of the prevalence of desertification in the region, it is crucial to consider the impact of wind on vegetation as it represents a significant contributing factor to the phenomenon of desertification. The monthly climate records, including mean temperature (Tmean), min temperature (Tmin), max temperature (Tmax), precipitation, and mean wind velocity, were obtained from the China Meteorological Administration (https://data.cma.cn/, accessed on 18 April 2024). Given that AuSPLIN interpolation exhibits superior accuracy compared to inverse distance weighting and ordinary kriging [40,41], these climate data were interpolated to a 250 m spatial resolution using the Partial Thin Plate Smoothing Splines model provided by AuSPLIN 4.2 software.
Furthermore, as desertification is exclusive to grassland, a comprehensive land cover dataset of China, provided by the National Cryosphere Desert Data Center (http://www.ncdc.ac.cn, accessed on 21 May 2024), has been employed to identify areas where desertification has already occurred, as well as those where it may potentially occur in the future. This dataset has also been used to determine the distribution of different types of grassland. The present study is confined to areas where the dominant vegetation type is grassland and the median annual maximum NDVI value from 2001 to 2020 is greater than 0.1.

2.3. Methods

2.3.1. Extraction of LSP Metrics

The LSP metrics are typically obtained through remote sensing methods, which include the start of the growing season (SOS), the end of the growing season (EOS), and the length of the growing season (LOS). Various methods exist for extracting LSP metrics based on NDVI time series data. These include the threshold method, median method, maximum slope method, derivative method, and cumulative frequency method [42,43,44,45]. Among these, the threshold method is divided into two categories: the fixed threshold method and dynamic threshold method. The dynamic threshold method considers the differences between vegetation types and the dynamic changes in vegetation and is widely used to extract LSP metrics [46]. The 8 d resolution NDVI year evolutions, reconstructed by a Savizky–Golay filtering, are fitted to the following double logistic function [47] to obtain the 1 d resolution NDVI year evolutions:
N D V I t = w N D V I + ( m N D V I w N D V I ) × 1 1 + e m S ( t S ) + 1 1 + e m A ( t A ) 1
where the NDVI (t) value is the NDVI observed by remote sensing for a given year (t = 1 to 365). The wNDVI refers to the winter NDVI value, which is the average NDVI value for which the diurnal mean temperature is less than 5 °C. mNDVI refers to the maximum NDVI; S is the inflection point of NDVI increase; A is the inflection point of NDVI decrease; mS is the rate of increase at the S inflection point; and mA is associated with the decrease at the A inflection point. All these parameters were retrieved on a pixel-by-pixel basis, year by year, based on a 20-year MODIS NDVI time series.
Next, the dynamic threshold was used to extract the start date and the end date of the LSP. Each pixel time-series NDVI for a given year was evaluated through a transformation, as detailed in the following equation:
N D V I r a t i o = ( N D V I N D V I m i n ) / ( N D V I m a x N D V I m i n )
where NDVI represents the daily NDVI values obtained through interpolation. Similarly, NDVImax is defined as the mean of the fifth-maximum daily NDVIs, while NDVImin is the mean of the fifth-minimum daily NDVIs. The rationale behind utilizing the mean is to mitigate the impact of outliers. The thresholds for the extraction of LSP metrics using the dynamic threshold method are subject to variation [48,49,50,51]. In this study, the most used thresholds of 20% and 50% are employed to extract the SOS and EOS. A comparison of the extracted SOS and EOS in other studies reveals that the use of 20% as a threshold is comparable to the results in other studies. Consequently, the SOS and EOS extracted using the 20% threshold are utilized for the analyses. LOS is then determined by the difference between the EOS and SOS.

2.3.2. Trend Analysis

To analyze the trend of LSP metrics and climatic factors in the study area from 2001 to 2020, the Theil–Sen (TS) median slope estimator was employed. This estimator is more robust, effective, accurate, and less susceptible to outliers and noise than the linear regression slope [52,53]. The TS estimator calculated the slope for all pairs of samples and selected the median value as the trend slope, which represents the amount of inter-annual variation over multiple years. The equation is as follows:
β = m e d i a n x j x i j i , j > i
where xi and xj are the values of the LSP metrics in year i and j, respectively, with 2001 ≤ i < j ≤ 2020. When β > 0, it indicates an increasing trend and vice versa.
The Mann–Kendall (M-K) trend test was employed to ascertain the significance of the TS slope at a significance level of 0.1 [54]. The test statistic S is calculated by the following:
S = k = 1 n 1 j = k + 1 n s g n ( x j x k )
s g n x j x k = 1 ,   x j x k > 0 0 ,   x j x k = 0 1 , x j x k < 0
When n > 10, the standard normal variable Z is calculated by the following equation:
Z = S 1 V a r ( S ) , S > 0 0 , S = 0 S + 1 V a r ( S ) , S < 0
V a r S = n ( n 1 ) ( 2 n + 5 ) / 18
The significance of the TS slope can be classified into three categories based on its Z value. A positive slope indicates a significant increasing trend when Z is > 1.64 and a negative slope indicates a significant decreasing trend when Z < −1.64. If Z is between −1.64 and 1.64, the change shown is not significant.

2.3.3. Climate Factor Driving Analysis

The partial least squares regression (PLS) was selected for the analysis of the response of LSP to climate change due to the extensive range of climate factors included in this study. In comparison to principal component analysis and multiple linear regression, the PLS exhibits several advantages, including the avoidance of multicollinearity, particularly when there are numerous explanatory variables. Its outstanding performance in multivariate analysis has led to its extensive use in the study of vegetation response to climate change recently [42,55,56,57]. The variable importance in the projection (VIP) was employed to quantify the contribution of each independent variable in the PLS retention components. When the VIP of an independent variable exceeds 1, it indicates that the independent variable has a significant effect on the dependent variable. The model coefficient (MC) indicates the direction and strength of the impact of each explanatory variable in the PLS model. To create a PLS model for the standardized LSP and meteorological data across the entire study area as well as each typical sandy land/desert, the monthly values of climatic factors were used as independent variables. These factors encompassed Tmean, Tmax, Tmin, precipitation, and wind velocity. Given the existence of the time-lagged effect of climate factors on LSP metrics, specific time series of the monthly values of the five climate factors were carefully selected as independent variables in the construction of the PLS model for different analyses. Specifically, for the analysis concerning the impact of climate change on the SOS, the monthly values of the five climate factors spanning from July of the previous year to June of the current year were utilized as independent variables. Simultaneously, when focusing on the analysis of the effects of climate change on the EOS and LOS, the monthly values of the five climate factors from July of the previous year to December of the current year were employed as independent variables. In the context of the climate-factor variables, those with a VIP > 1 and a high absolute value of the MC have a significant influence on the timing of LSP metrics. The calculation process was completed using the Scikit-learn library in the Python 3.12 software.

3. Results

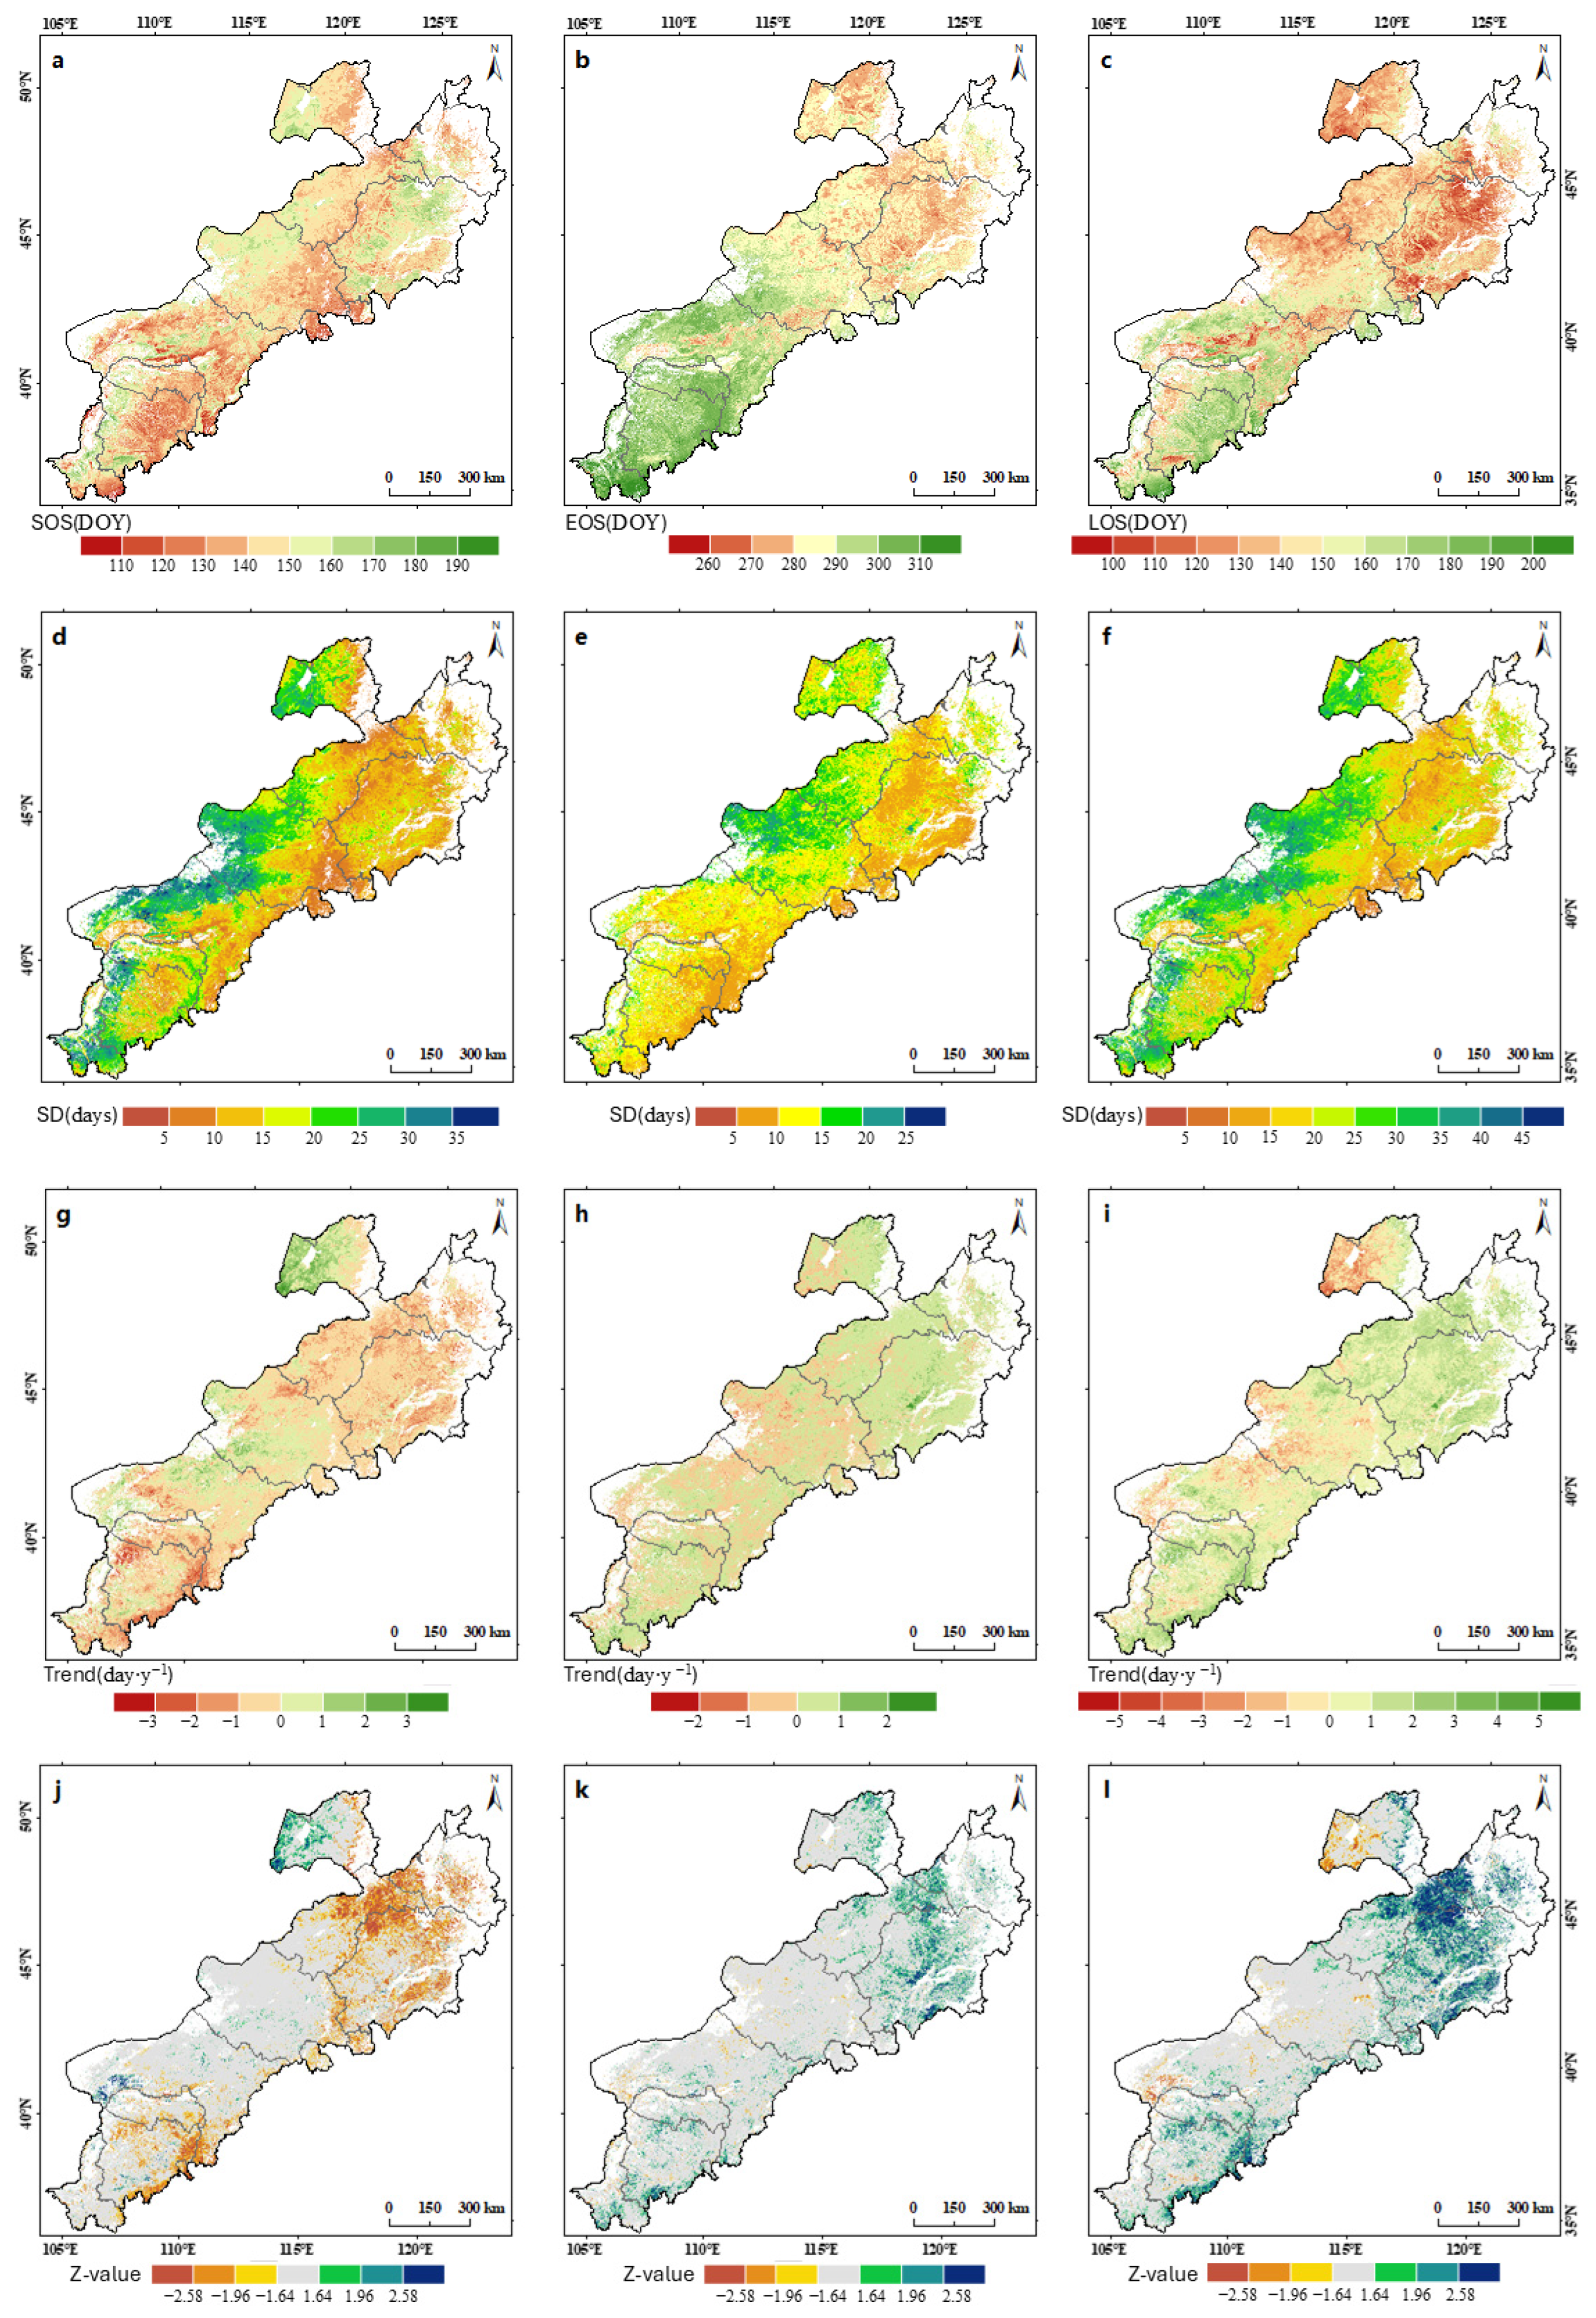
3.1. Spatial Pattern of LSP Metrics

Figure 2a–f, respectively, illustrate the spatial distribution patterns of the mean and standard deviation (SD) of the SOS, EOS, and LOS during the period from 2001 to 2020.
The mean and SD of the LSP present a scattered appearance with notable spatial heterogeneity. The mean SOS is situated predominantly between the 130th and 170th days of the year (day of year, abbreviated as DOY), encompassing 95.25% of grassland pixels. Furthermore, 2.61% of the grassland pixels exhibit an earlier SOS (with a value less than 120 DOY). These pixels are predominantly located in the central region of the Mu Us Sandy Land, as well as in areas in close proximity to both the Mu Us Sandy Land and the Hobq Desert. Conversely, approximately 2.14% of the grassland pixels exhibit a delayed SOS (exceeding 170 DOY), particularly in the Horqin Sandy Land, the southern portion of the Hulunbuir Sandy Land, and the southernmost region of the entire area (Figure 2a). It is noteworthy that the spatial distribution patterns of the EOS and LOS exhibit a notable similarity, characterized by a distinct zonal distribution. This is corroborated by the observation that the EOS demonstrates a gradual decline from the southern to the northern regions, accompanied by a corresponding reduction in the LOS. In particular, 95.22% of the grassland pixels exhibit an EOS within the range of DOY 270 to 310 (Figure 2b). Furthermore, 91.97% of the pixels have an LOS ranging from 120 to 180 days (Figure 2c). Only 4.44% of the grassland pixels have an LOS of less than 120 days, while 3.59% of the grassland pixels have an LOS greater than 180 days.
Regarding the SD, it was observed that 51.50% of the SOS and 80.52% of the EOS for grassland pixels exhibited a relatively low SD value, ranging from 0 to 15 days (Figure 2d,e). Conversely, the LOS exhibited a more pronounced variation in SD value. Only 23.22% of the grassland pixels exhibited a small SD, while 71.35% of the LOS exhibited SD values between 20 and 35 days (Figure 2f). The area where the EOS exhibits the largest SD values is primarily concentrated in the northwestern region of the Otindag Sandy Land. In contrast, the spatial distribution patterns of the SD for the SOS and the LOS are similar. This indicates that the variability of the LOS is primarily influenced by changes in the SOS. Furthermore, the majority of areas with elevated SD values for both the SOS and the LOS are concentrated in the northwestern region of the entire area.

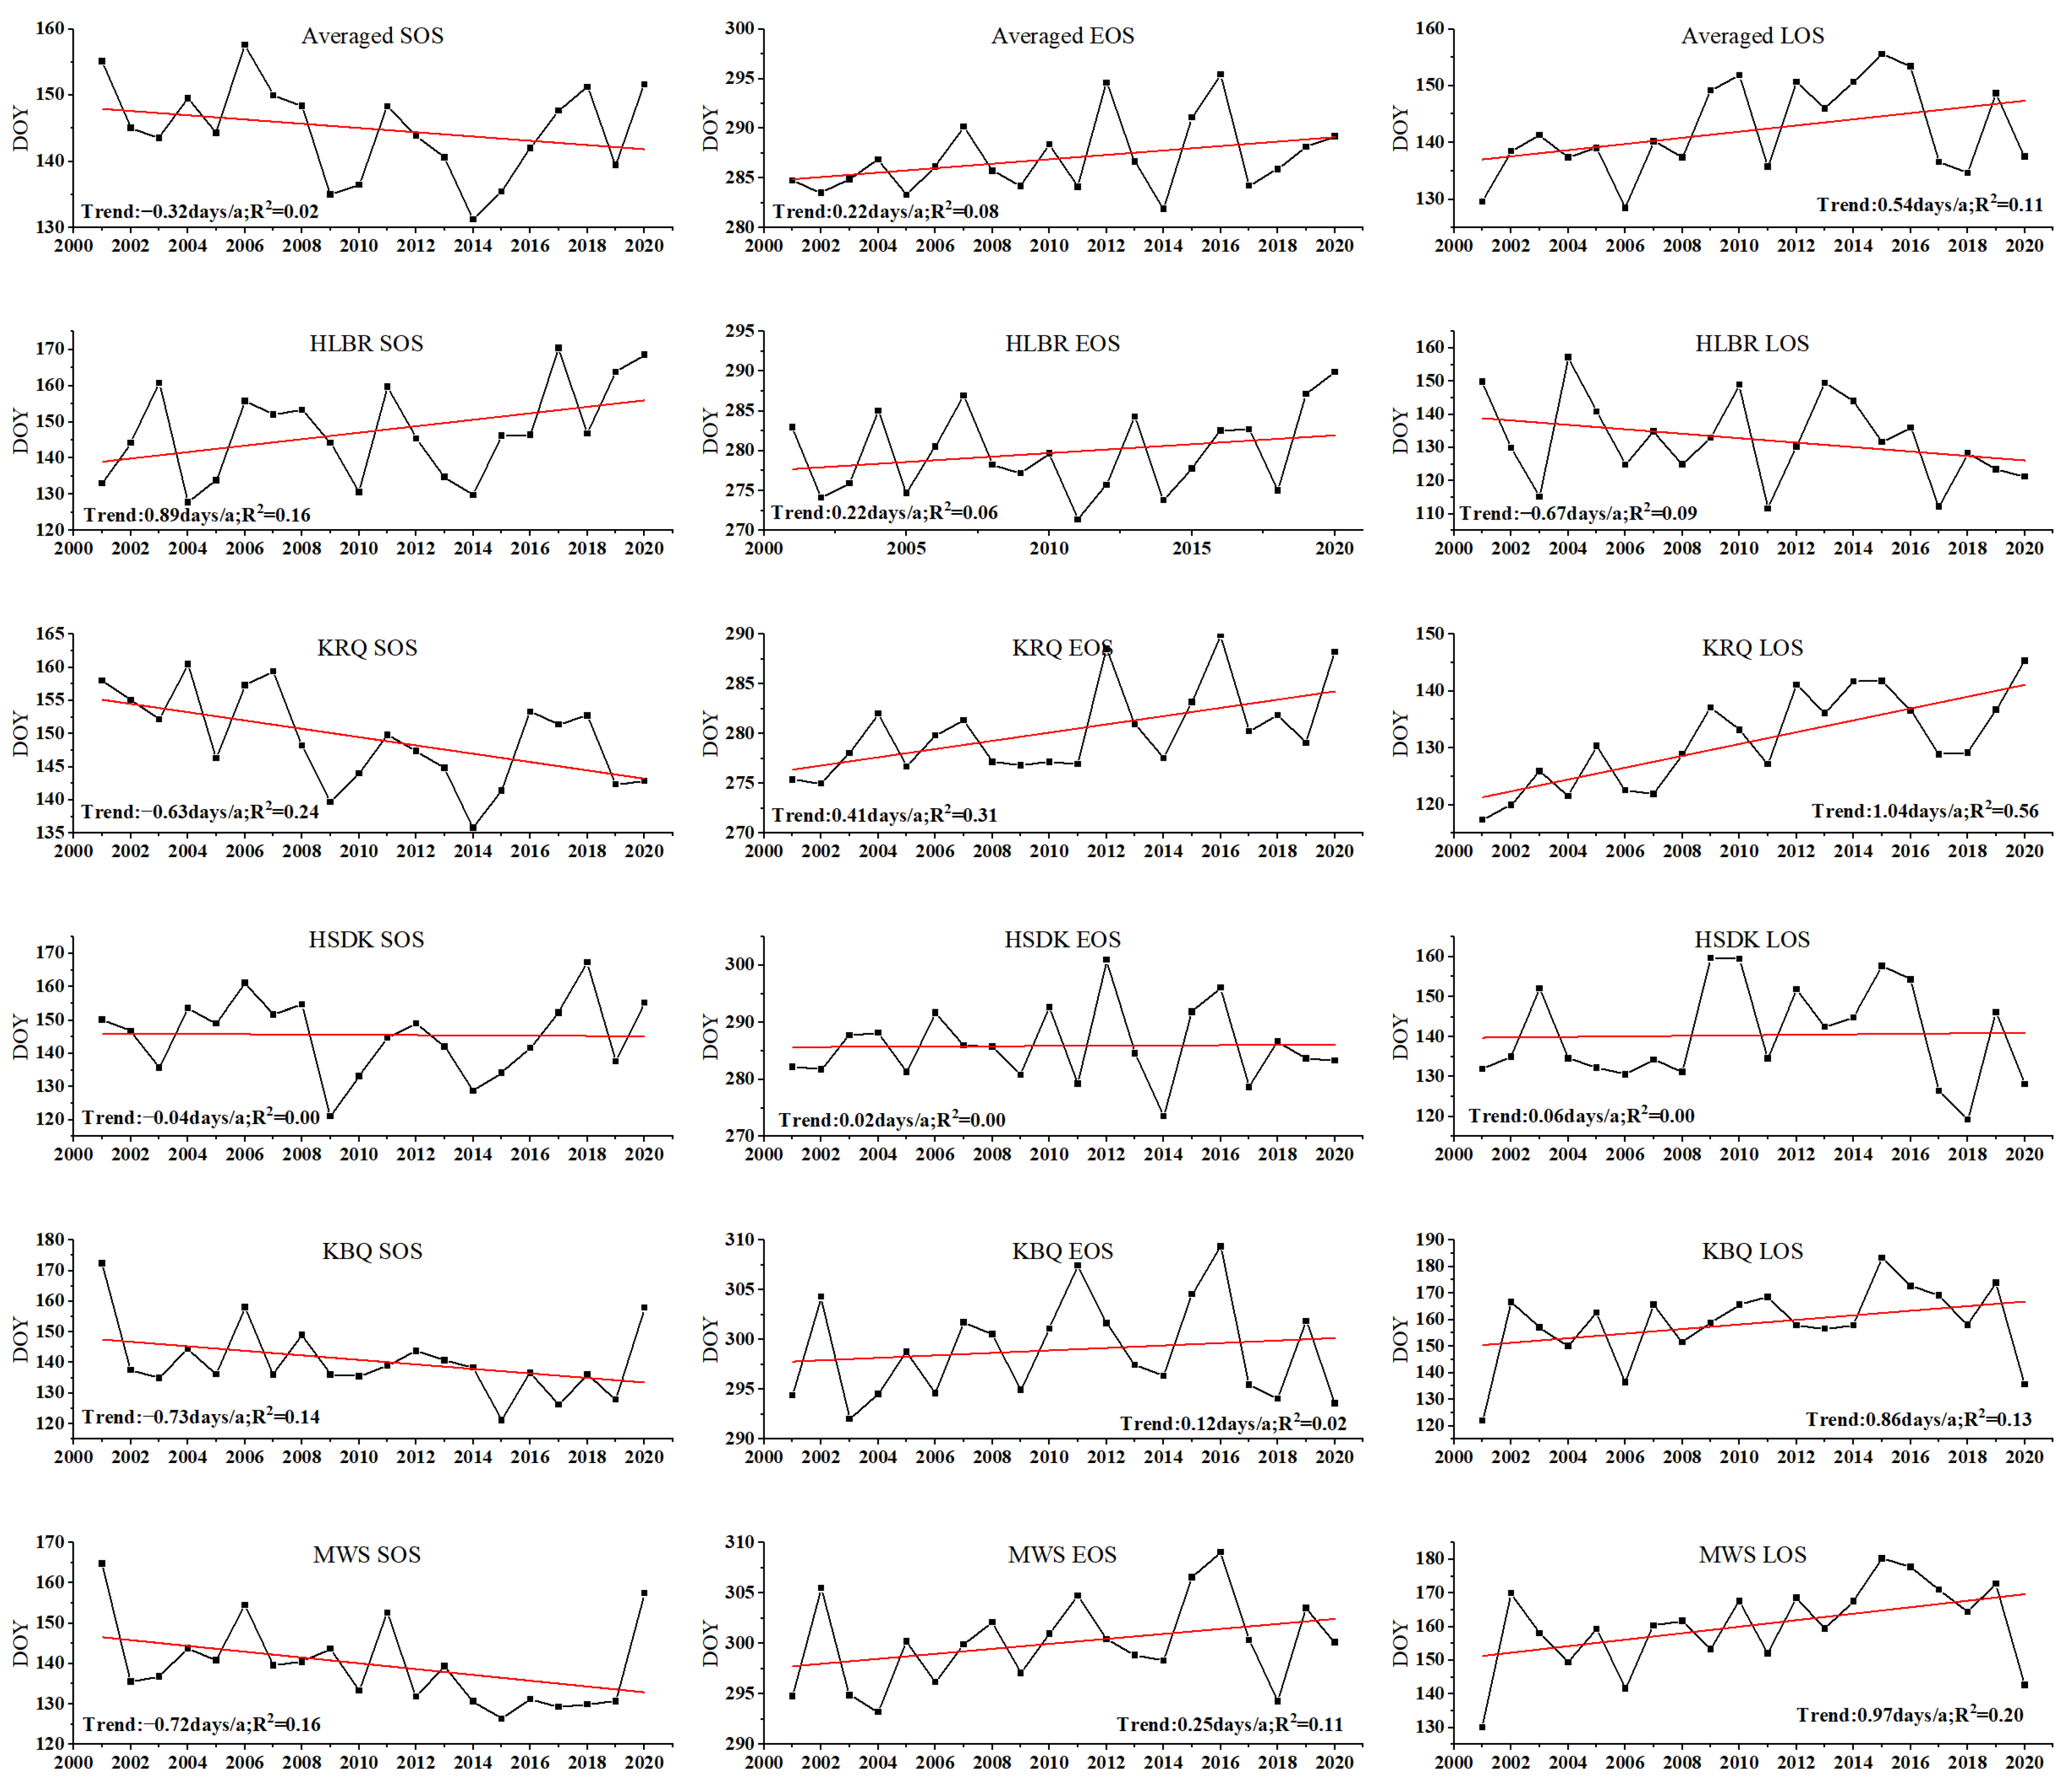
3.2. Change Trends of LSP Metrics

To analyze changes in LSP in the study area, we calculated the average trend for the entire study area as well as for five representative sandy lands/deserts (Figure 3).
From 2001 to 2020, a discernible advancing trend in SOS was observed throughout the study area. The SOS exhibited a mean rate of change of −0.32 d/a, indicating an earlier onset over time. It is noteworthy that the trends in SOS variation diverged between the various typical sandy regions. In the KRQ, KBQ, and MWS, the SOS exhibited markedly advancing trends, with average rates of change of −0.63 d/a, −0.73 d/a, and −0.72 d/a, respectively. In contrast, the HLBR exhibited a divergent pattern, displaying a declining trend in SOS with an average rate of change of 0.89 d/a. The HSDK region, while also demonstrating an advancing SOS trend, exhibited a markedly subdued rate of change of only −0.04 d/a.
The EOS exhibited a delayed trend across the entire study area, with an average rate of change of 0.22 d/a. The trends observed in the five typical sandy lands were found to be in accordance with the overall trend observed in the entire study area, exhibiting a delayed tendency in their respective EOS. However, the magnitude of this delay differed significantly among the sandy lands in question. In particular, the EOS of the HSDK exhibited an extremely low delay rate of only 0.02 d/a. In contrast, the remaining sandy lands, namely HLBR, KRQ, KBQ, and MWS, exhibited more pronounced rates of change, which were 0.22 d/a, 0.41 d/a, 0.12 d/a, and 0.25 d/a, respectively.
The data indicated a notable prolongation in the LOS within the study area. In quantitative terms, the LOS in the entire study area exhibited a prolongation rate of 0.54 d/a, thereby indicating an overall prolongation of the relevant seasonal period over time. The trends of the LOS in the five typical sandy lands were found to be closely correlated with their respective SOS trends. In the case of KRQ, HSDK, KBQ, and MWS, the LOS exhibited an extended trend. The rate of change in the LOS exhibited considerable variation across the different regions. The HSDK exhibited a relatively modest rate of change, with an increase in the LOS at a rate of 0.06 d/a. In contrast, the KRQ, KBQ, and MWS demonstrated more pronounced prolongations, with LOS change rates of 1.04 d/a, 0.86 d/a, and 0.94 d/a, respectively. In contrast, the HLBR exhibited a deviation from the prevailing prolongation trend. Here, the LOS demonstrated a shortening trend, indicating that the delay in the EOS was insufficient to counteract the impact of the delay in the SOS. Quantitatively, the HLBR LOS shortened at a rate of −0.67 d/a.
Figure 2g–i illustrates the spatial distribution trend of the LPS pixel scale. Between the years 2001 and 2020, the number of pixels exhibiting an advanced SOS (71.89%) was greater than the number of pixels displaying a delayed SOS (28.11%). Of these, 19.21% of the pixels exhibited a notable advancement (at a significance level of α = 0.1), with a predominant distribution observed in KRQ, MWS, and the Greater Khingan Mountains. A mere 3.19% of the pixels exhibited a significant delay trend (α = 0.1), with the majority of these concentrated in the HLBR. The number of pixels exhibiting a delayed EOS was greater than the number of pixels displaying an advanced EOS. Among these, 12.4% of the pixels exhibited a significant delay trend (α = 0.1), predominantly in the KRQ, Greater Khingan Mountains, and northeastern region of the study area, with a limited number of pixels observed in the MWS and its southern area. A mere 1.86% of the pixels exhibited a notable advancement in the EOS (α = 0.1), with a somewhat dispersed distribution observed in the northern reaches of KBQ. The number of pixels with a prolonged LOS (68.96%) was larger than that of pixels with a shortened LOS (31.04%). Among these, 22.03% exhibited a significant lengthening trend for the LOS (α = 0.1), while 2.96% demonstrated a significant shortening trend for the LOS (α = 0.1). The spatial distribution of significant LOS changes was analogous to that of the SOS.

3.3. Correction Analysis Between LSP Metrics and Climate Factors

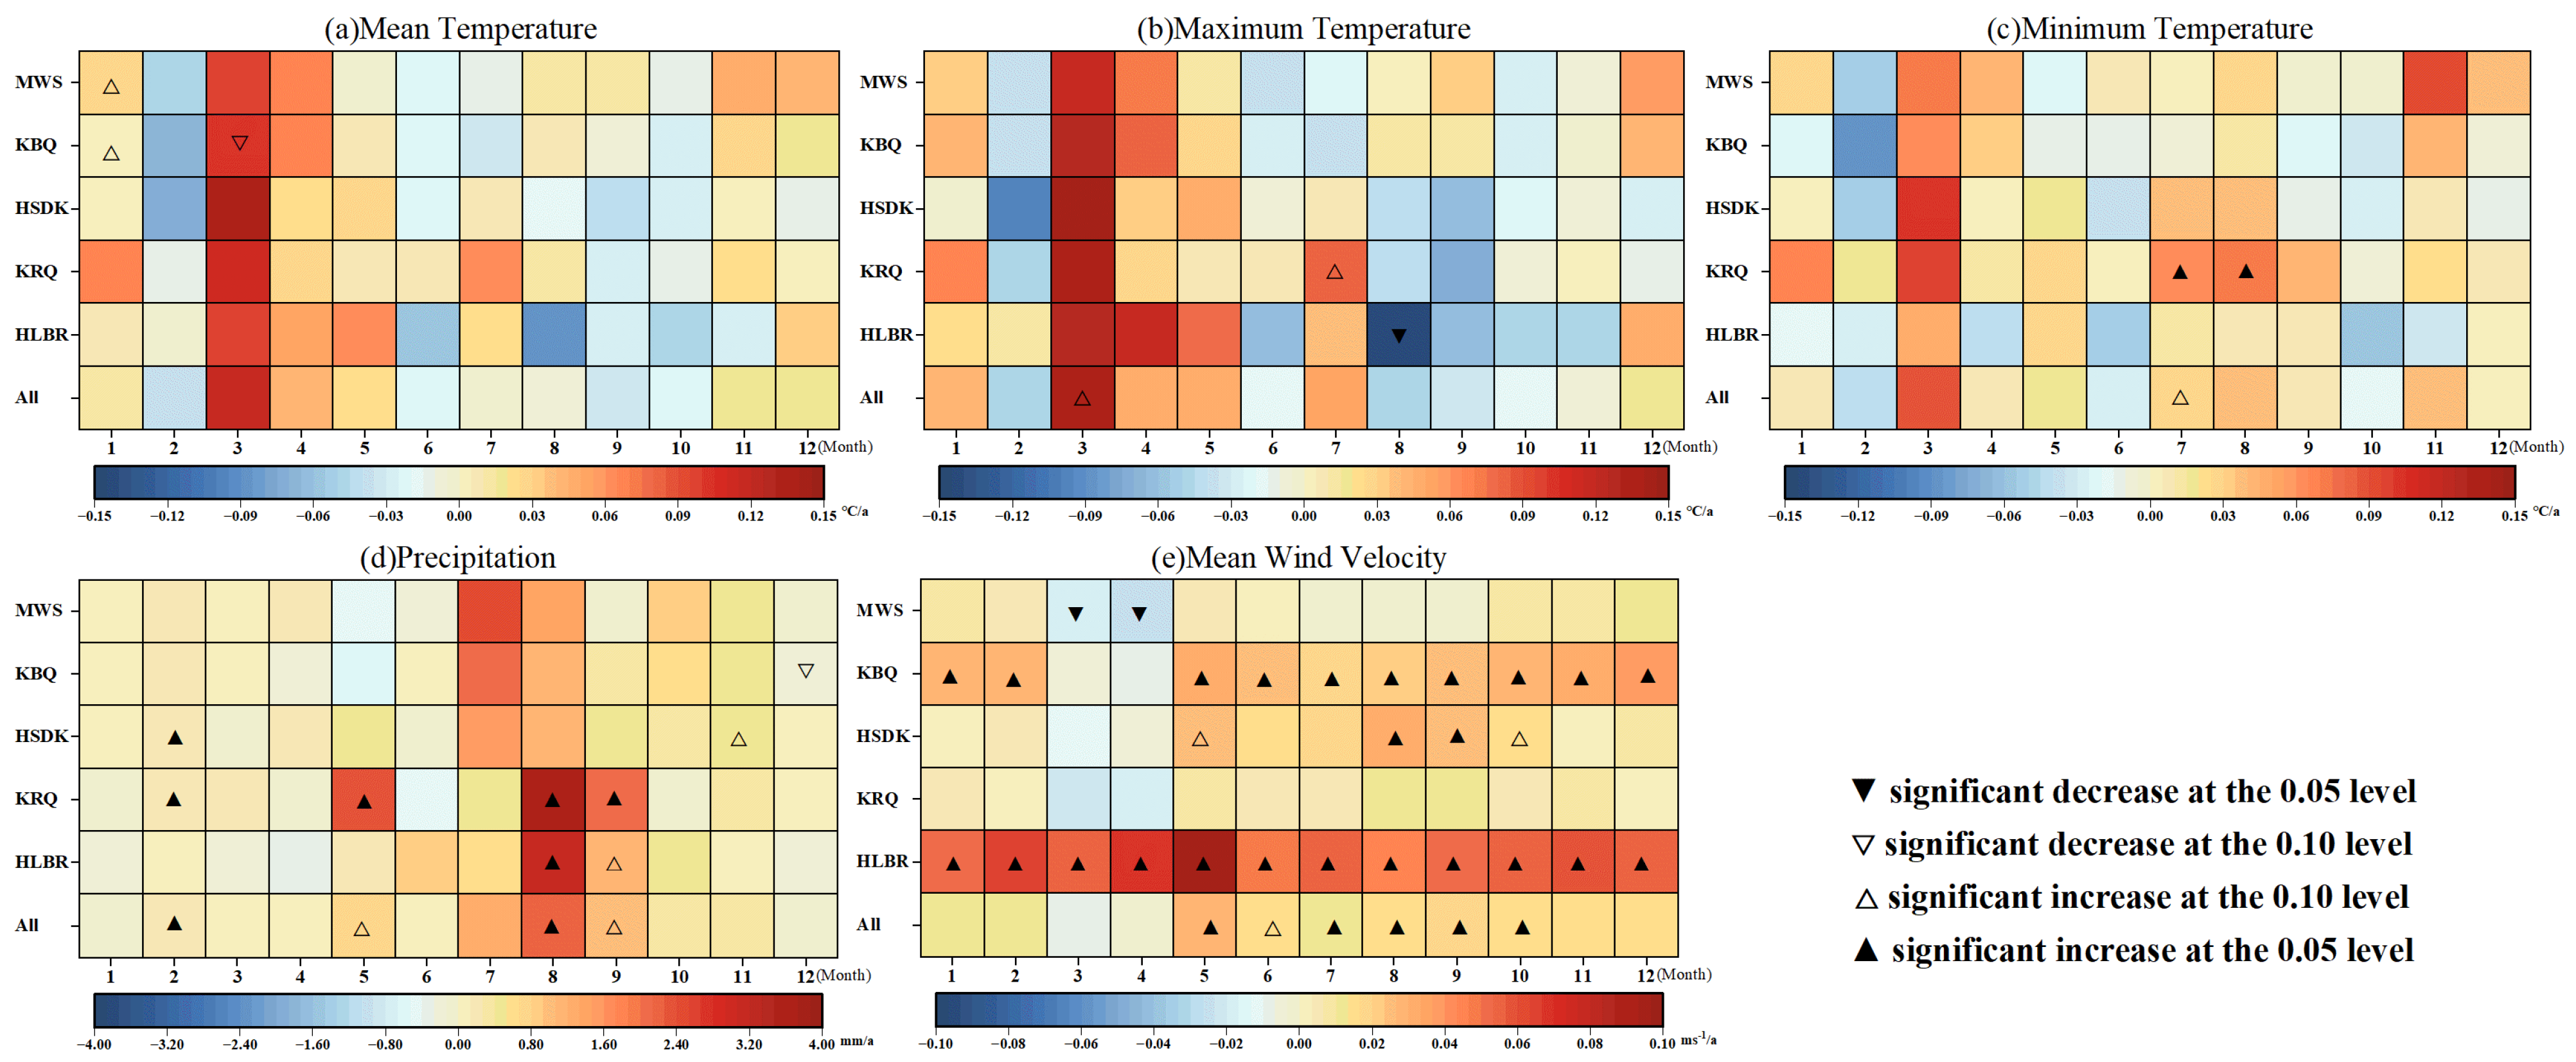
3.3.1. Trends in Climate Factors from 2001 to 2020

Figure 4 illustrates the magnitude as well as the significance of variations in the monthly mean values of several climatic factors that impact vegetation growth across the entire study area and within typical sandy lands/deserts. These climatic factors encompass the mean temperature (Tmean), maximum temperature (Tmax), minimum temperature (Tmin), precipitation, and mean wind velocity.
Regarding temperature variations, it is observed that the changes in Tmean, Tmax, and Tmin do not show an increase every month. Specifically, only in March, April, and May do the temperatures display a relatively substantial upward trend. Notably, the Tmax in March experiences a relatively large upward trend, with an increase magnitude of 0.15 °C/a. In January, November, and December, the temperatures show a slight increase; however, the majority of these upward trends are not statistically significant. Moreover, in most of the typical sandy lands/deserts, Tmean and Tmax demonstrate a decreasing trend during February, June, August, September, and October. Among them, only the Tmax in the HLBR exhibits a significant decrease in August, while the changes in other regions are not significant. Additionally, although the warming of the Tmin in March is less pronounced compared to that of the Tmean and Tmax, Tmin reveals a warming trend in July, August, and September. This trend is contrary to that of the Tmax and Tmean, yet the warming is not significant.
Precipitation has been observed to exhibit an increasing pattern in the majority of regions throughout most months, with particularly pronounced increments witnessed in July, August, and September. This upward trend is conspicuously manifested in KRQ, HLBR, and the entire study region. Notably, substantial augmentations in precipitation are discernible during August and September. However, within certain typical sandy lands/deserts, a decreasing propensity in precipitation has been detected in January, March, April, and December. It should be emphasized that none of these downward fluctuations have attained statistical significance.
Regarding the mean wind velocity, an ascending trend has been identified across all months, with the exceptions of March and April. In HLBR specifically, the mean wind velocity has registered a remarkable increase, which is not only quantitatively substantial but also statistically highly significant. In sharp contrast to HLBR, the mean wind velocity in other regions has demonstrated a downward trajectory during March and April. Of particular note is that the mean wind velocity in MWS has experienced a significant decline during these months.

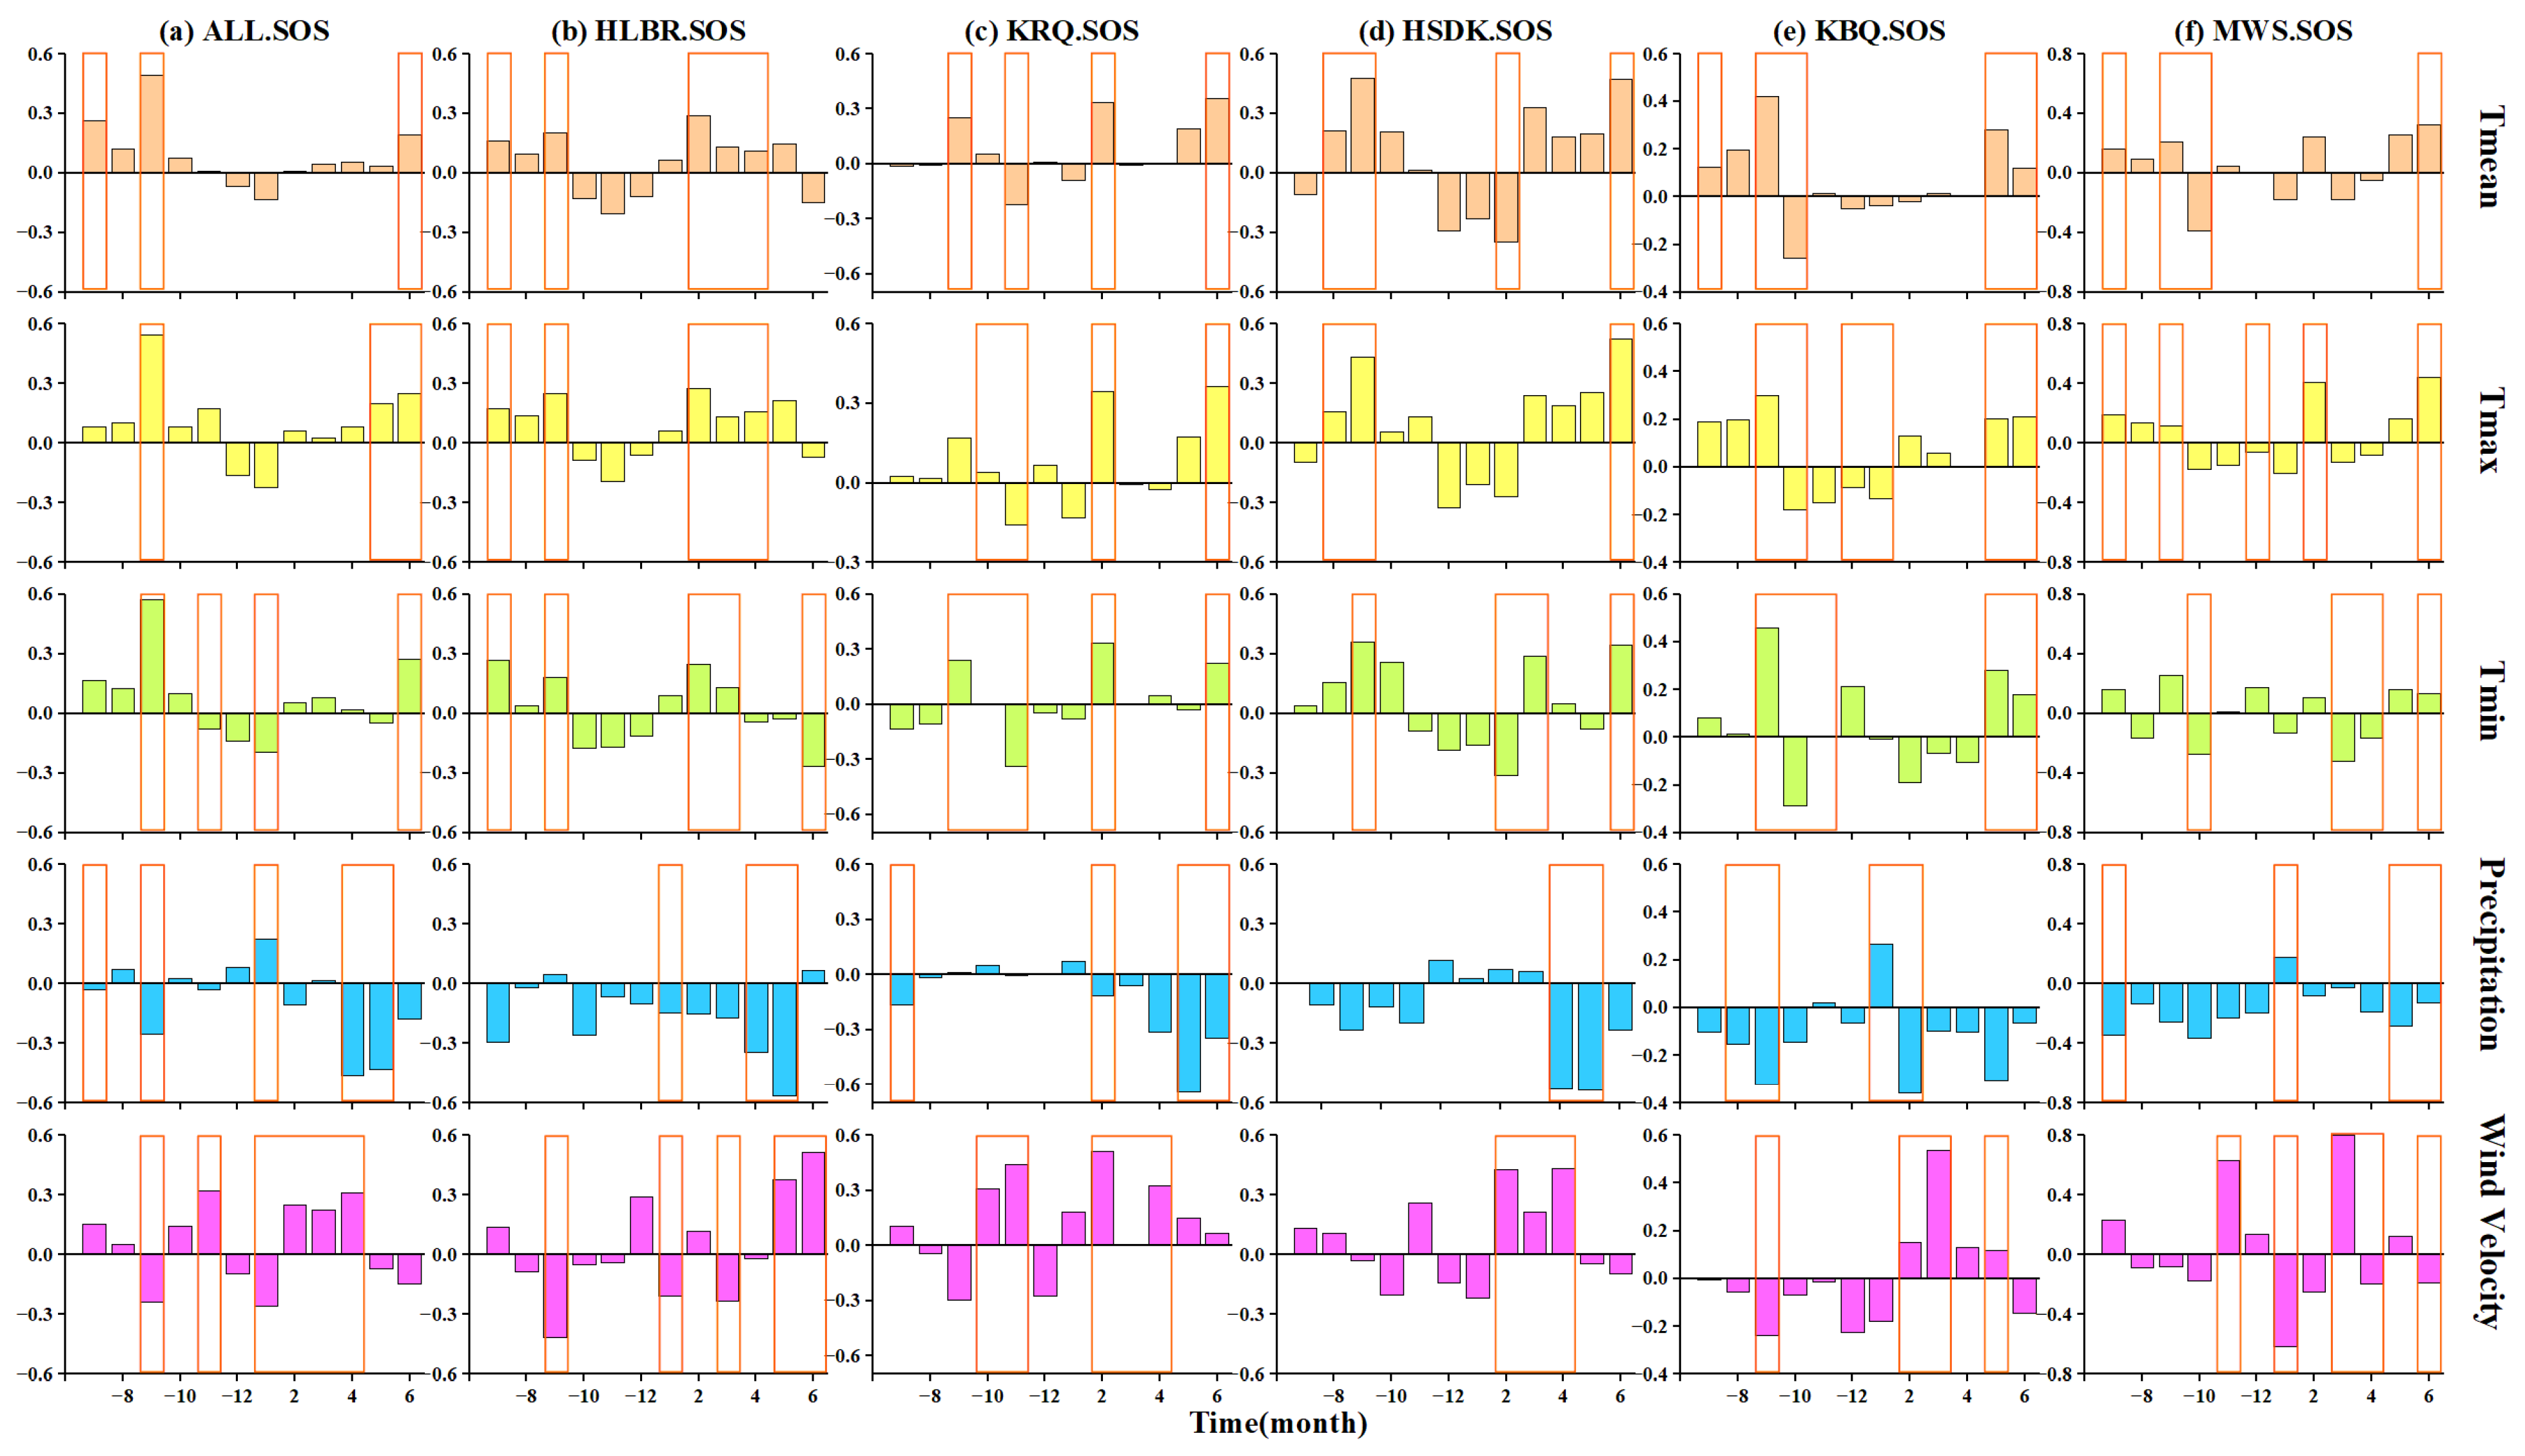
3.3.2. Relationships Between Climatic Factors and the SOS

It was ascertained that the effects of Tmean, Tmax, and Tmin on the spring phenological characteristics of vegetation exhibited similarities. Generally, a warming climatic condition might potentially expedite the attainment of the cumulative temperature prerequisites essential for the growth and maturation of vegetation, which would instigate enzymatic actions and accelerate the phenological progression of vegetation. However, as Figure 5 illustrates, the results of this research divulged that the elevated temperatures during the period spanning February to June did not consistently demonstrate a negative correlation with the SOS, thereby not invariably leading to an earlier SOS. Instead, particular increments in spring temperatures were detected to possess a positive correlation with the SOS, notably within the months of February to May in HLBR and March to June in HSDK. This intimates that the augmentations in spring temperatures, especially Tmean and Tmax, might potentially contribute to a deferment in the SOS. Combined with Figure 3, there was a negative correlation between the Tmin and the SOS in the months in which the SOS occurred, with the effect of the Tmin on the SOS only significant in June for HLBR and in March and April for MWS. Hence, it can be inferred that, notwithstanding the increased temperatures in the months antecedent to the onset of the SOS, they still failed to fulfill the essential precondition for the initiation of the SOS, which is a Tmin exceeding 0 °C. In conclusion, although warmer temperatures contributed to an earlier start to the growing season, especially if the Tmin was elevated, increased spring maximum and mean temperatures impeded SOS development to some extent. This phenomenon might be attributed to the elevated Tmean and Tmax, which resulted in the accelerated thawing of spring snow and an expansion of soil evapotranspiration [58]. Conversely, heightened temperatures frequently engendered drought scenarios during the spring. This can be ascribed to the inferior soil quality prevalent in typical sandy lands/deserts due to desertification, which culminated in restricted water retention capabilities. Furthermore, our findings indicate that precipitation exerts a more pronounced influence on the SOS than temperature. As Figure 5 illustrates, precipitation exhibits an inverse and statistically significant correlation with the SOS from February to May. This indicates that adequate precipitation can mitigate the spring drought and advance the SOS. Previous investigations have commonly neglected the impact of wind on the SOS. In the typical sandy lands/deserts of semi-arid China, excessive wind velocities have been observed to heighten soil evapotranspiration and precipitate severe wind-induced surface erosion during the spring when vegetation cover is scarce. As Figure 5 depicts, it is evident that the spring wind speed is positively correlated with the SOS, signifying that an increased wind speed restricts the SOS, especially in HSDK and KBQ where the desertification levels are more pronounced.

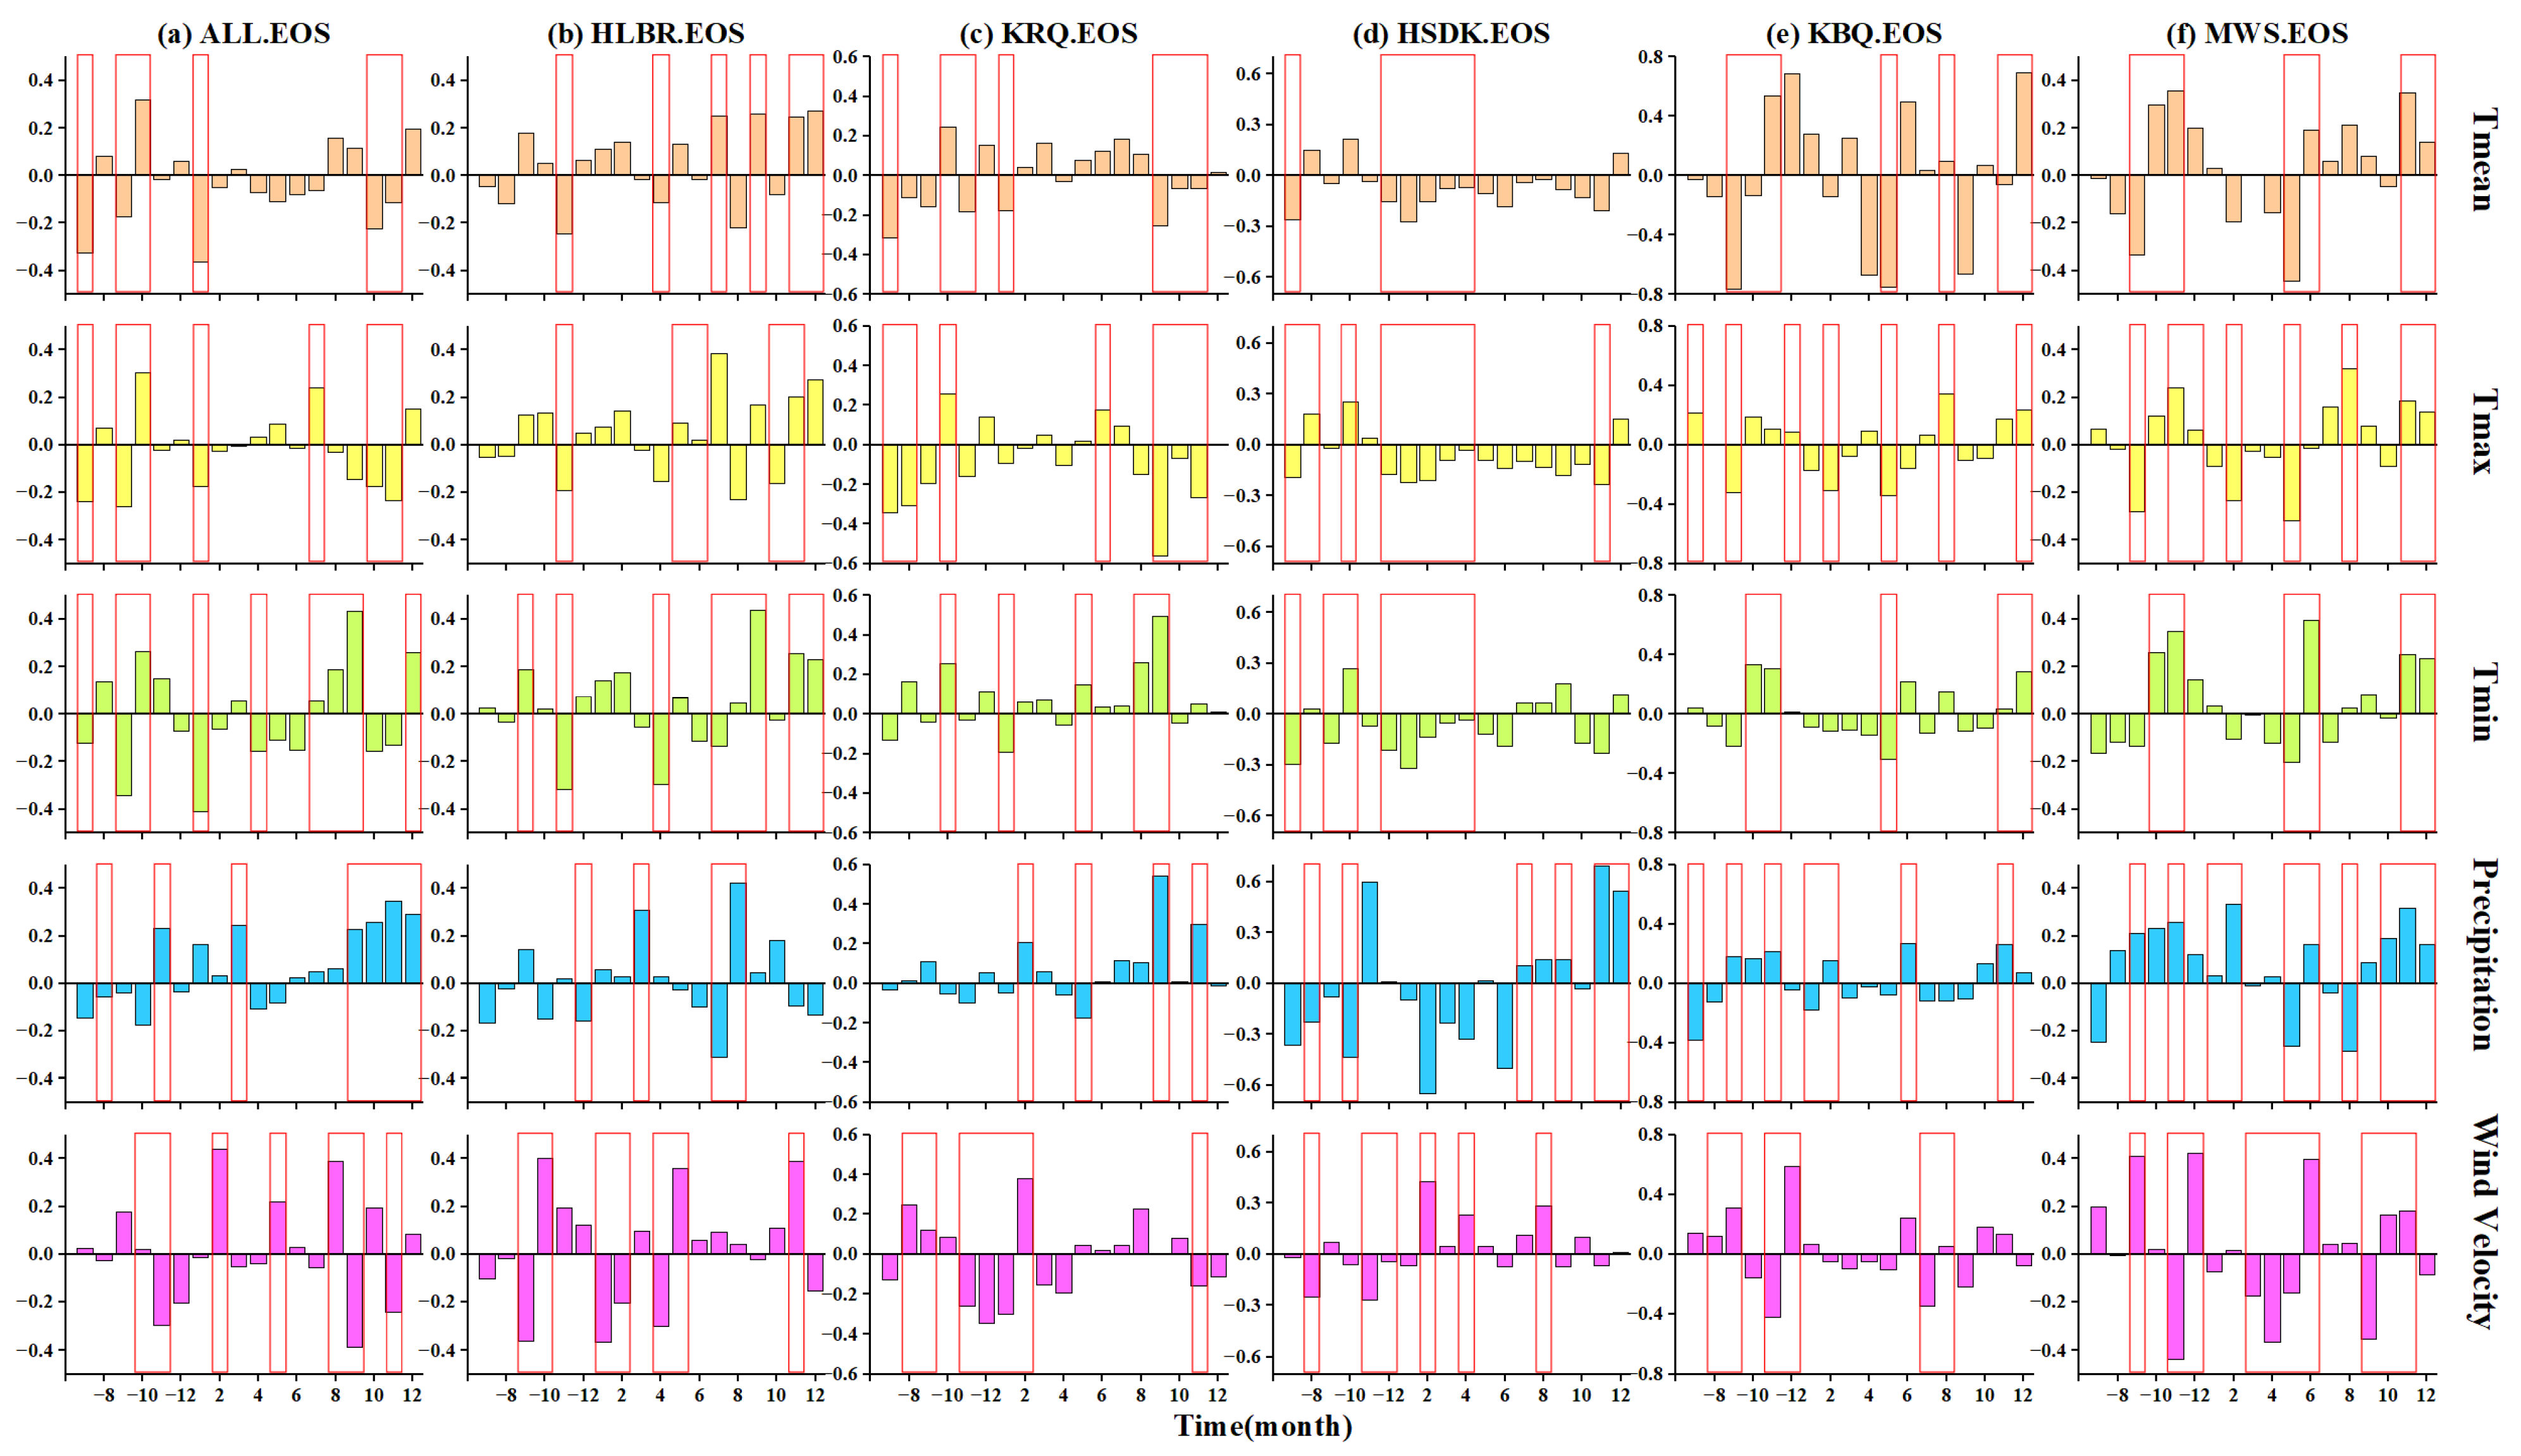
3.3.3. Relationships Between Climatic Factors and the EOS

Temperature continues to play a crucial role in influencing the EOS, with the Tmean exerting a more conspicuous effect on the EOS than both the Tmin and the Tmax. The impact of temperature on the EOS was mainly observable during the autumn and early winter months, specifically from late September to late October, which aligns with the conclusion of the vegetation growth period. As Figure 6 depicts, excluding the HLBR region, both the Tmax and Tmean showed a predominantly negative correlation with the EOS during autumn in typical sandy lands/deserts. This pattern was especially prominent in the KRQ region, implying that increased temperatures during autumn led to an earlier EOS. In HLBR and KRQ, where plant growth was restricted by the minimum temperature, the Tmin at the end of the growing season presented a positive correlation with the EOS. In other words, a higher Tmin at the end of the growth phase contributed to a postponed EOS. Moreover, temperature fluctuations during the summer months exhibited a positive correlation with the EOS, particularly in August. This correlation was due to the relatively high precipitation levels in August within the study area, which was characterized by favorable water conditions. The elevated temperatures enhanced vegetative photosynthesis. The majority of precipitation changes throughout the entire growing season demonstrated a positive association with the EOS. This is because the study area is located in a semi-arid zone, where moisture is a vital limiting factor for vegetation productivity. The increase in precipitation led to enhanced moisture availability for vegetation, effectively relieving the moisture constraint caused by the augmented evapotranspiration resulting from warmer temperatures. This is also the principal factor accounting for the significant delay in the EOS observed with the increase in precipitation in late summer and autumn.

3.3.4. Relationships Between Climatic Factors and the LOS

In contrast to the SOS and the EOS, precipitation variability exerts a substantially greater influence on the LOS compared to temperature (Figure 7). Precisely, precipitation during spring and autumn exhibits a positive correlation with the LOS. That is, an augmentation in precipitation amount leads to a lengthened LOS. Except for the HLBR at higher latitudes, where vegetation phenology is predominantly constrained by temperature, both the Tmean and the Tmax display a negative correlation with the LOS during spring and autumn. Only in the months when the SOS and EOS occur does a positive correlation exist between the Tmin and LOS, signifying that Tmin serves as a critical determinant for vegetation phenology. Moreover, in the typical sandy lands/deserts within the semi-arid regions of northern China, which are marked by a high degree of desertification, the sand surface heats up rapidly during the day. The dominant vegetation type here is desert steppe, which is mainly composed of short-lived plants, and moisture constitutes a key limiting factor for vegetation growth. Consequently, elevated temperatures cause an increase in evapotranspiration during the SOS and EOS of vegetation, thereby reducing the available water for vegetation. However, the rise in precipitation during spring and autumn furnishes sufficient water resources for vegetation growth, effectively mitigating the meteorological drought induced by high temperatures. Furthermore, wind effects on the LOS are particularly prominent during spring and autumn. The inverse relationship between wind speed and the LOS in spring can be ascribed to the fact that lower wind speeds attenuate surface wind erosion, leading to an earlier SOS. Besides HLBR, autumn wind speed demonstrates a positive correlation with the LOS, which might be related to the autumn monsoon. The stronger autumn monsoon transports ample water vapor, thus augmenting precipitation and delaying the EOS. For HLBR, due to its higher latitude, higher wind speeds in autumn are often accompanied by cold waves that hasten the EOS and consequently shorten the LOS.

4. Discussion

4.1. Changes in the LSP in Space and Time

In the present study, the NDVI data, reconstructed via the Savizky–Golay filtering method from satellite records, was utilized as the data source. The NDVI time series were fitted using double logistic regression curves, and the LSP metrics of grasslands in the desertified regions of semi-arid areas in northern China were extracted through the threshold approach.
The results of this study revealed that the SOS was primarily detected between the 130th and 170th DOY, the EOS occurred during the 270th to 310th DOY, and the LOS ranged from 120 to 180 days. The outcomes for the SOS and LOS were generally in line with those of previous investigations [41,59,60,61]. However, the EOS results were approximately 10 days later than those reported in prior studies, which could be attributed to the decision to set the EOS extraction threshold at 20%.
The spatial distribution pattern of the trends in LSP metrics was also largely comparable to that of existing research [41,62,63,64], although the rate of change was less pronounced than what had been documented. The mean rate of alteration in the study area was 3.2 days per decade for the SOS and 2.2 days per decade for the EOS. This was generally consistent with the findings of Kang et al. [41], which reported 3 days/decade for the SOS and 2 days/decade for the EOS, and was greater than the monitoring results of Luo et al. [65], which were 0.41 days/decade for the SOS and 0.31 days/decade for the EOS.
In contrast to previous studies, our findings also suggested a propensity for a delayed SOS and a tendency towards a shorter LOS in the HLBR. Moreover, the study area’s grasslands persist due to trends of the SOS advancing and trends of the EOS being delayed. However, only a small proportion of these trends are statistically significant. This finding aligns with the stagnation in warming over the past two decades. During this period, temperatures have fluctuated markedly, and the overall increase has not reached statistical significance, as Figure 4 clearly illustrates. This outcome is consistent with the findings from the Northern Hemisphere reported by Wang et al. [66].

4.2. Relationships Between LSP and Climatic Factors

Temperature, especially the Tmean and the Tmax, has been demonstrated in multiple studies to exert a robust and significant influence on LSP metrics [56,57,60,61,67,68]. In contrast to prior investigations, within the semi-arid desertified region of northern China, both the Tmean and Tmax during the pre-SOS and SOS period exhibited a delaying effect on the SOS. Only the Tmin during the month of SOS occurrence had a positive impact on the advancement of the SOS. This implies that in the semi-arid zone, elevated temperatures lead to earlier snowmelt and enhanced soil evapotranspiration, thereby reducing the available water during the vegetation rejuvenation phase, particularly in the desertified area with inferior soil texture. Moreover, precipitation in both the pre-SOS and SOS periods provides a better explanation for the advancement of the SOS, suggesting that soil moisture is the principal factor governing the SOS. These findings are congruent with previous studies [59,69,70,71].
An increase in temperature had a positive influence on the advancement of the EOS, especially the Tmean and Tmax at the conclusion of the growing season. A significant effect of temperature at the end of the growing season on the delay of the EOS was only observed in the HLBR at higher latitudes. In other regions, the Tmin during the month of EOS emergence had a significant impact on the EOS delay. Similarly to the SOS, precipitation was the primary factor controlling the EOS, and precipitation at the end of the growing season demonstrated a significant positive correlation with the EOS, further indicating that moisture is the main factor governing vegetation phenology in the semi-arid desert areas of northern China.
Furthermore, in desertified areas, wind has a non-trivial impact on the progression of desertification. Windy conditions augment soil evapotranspiration, and severe wind erosion inflicts damage on the soil surface. The sandy and gravelly materials it transports not only bury the vegetation but also harm the branches and buds. Hence, this study also examined the effect of wind on LSP metrics. The results of this study indicated that increased spring winds led to a delayed SOS and a shorter LOS, and this effect was more pronounced and significant in areas with more severe desertification, which had not been documented in previous studies.

4.3. Limitations and Future Work

The limitations of this work are mainly in the following three aspects:
Firstly, multiple methods exist for extracting LSP metrics from NDVI sequences. However, the results obtained by different methods exhibit variability. For instance, the average SOS extracted via the threshold method is approximately 10 days earlier than that derived from the derivative method, while the EOS is, on average, 10 days later. The scarcity of ground-based validation data regarding vegetation phenology precludes the determination of the applicability of diverse methods to distinct climate zones and vegetation types. Nevertheless, the vegetation phenology within the same study area extracted by different methods demonstrates a general consistency in both spatial distribution and temporal trend. This consistency in phenology is beneficial as it guarantees that subsequent analyses of the vegetation’s response to climate change remain unaffected.
Secondly, the spatial resolution of the NDVI series employed to extract LSP metrics is relatively coarse (e.g., 250 m for MODIS NDVI, and 8 km for GIMMS NDVI3g). Such coarse resolution is due to variations in microtomography and vegetation types, which impede the comprehensive elucidation of the impacts of climatic factors on climate and the validation of the extracted LSPs using ground observation data.
Finally, it is important to note that this study has solely concentrated on the effects of climatic factors on vegetation phenology. However, the roles of non-climatic factors, such as overgrazing, air pollution, latitude, longitude, altitude, etc., in influencing vegetation phenology cannot be disregarded.
Furthermore, this study has uncovered a trend of delayed spring phenology with increasing temperature in the HLBR, which is located in the higher latitude’s regions. Future research is planned to verify whether this trend can be generalized on a broader scale.

5. Conclusions

In the present paper, the grassland LSP metrics within the desertified area of the semi-arid region in northern China from 2001 to 2020 were extracted by utilizing MODIS NDVI products. Subsequently, the responses and lagged responses of the LSP metrics to various climatic factors, namely mean temperature, maximum temperature, minimum temperature, precipitation, and wind speed, were analyzed. The conclusions drawn from this study are summarized as follows:
  • The annual mean SOS falls between DOY 130 and 170, the annual mean EOS is within the range of DOY 270 to 310, and the annual mean LOS lies between day 120 and 180. The majority of the desertified areas exhibit a tendency towards an advanced SOS, postponed EOS, and prolonged LOS, while only a small fraction of the area displays an opposite trend.
  • The regional average SOS has advanced at a rate of 3.2 d/decade, the EOS has been delayed by 2.2 d/decade, and the LOS has been extended by 5.4 d/decade. With the exception of the HLBR, the trends observed in typical sandy land/deserts are in line with the regional average, differing only in the magnitudes of the change rates. However, in the case of the HLBR, the trends deviate, with the SOS being delayed by 8.9 d/decade, the EOS being delayed by 2.2 d/decade, and the LOS being shorted by 6.7 d/decade. The trend of LSP metrics change was not pronounced in either the study area or the typical sandy area.
  • PLS analyses suggest that different climatic factors have disparate impacts on LSP metrics. Precipitation during the pre-growing season and the growing season significantly influences the advancement of the SOS, the postponement of the EOS, and the elongation of the growing season. Conversely, the moisture deficit resulting from increased temperature leads to a delayed SOS, an early EOS, and a shortened LOS. Moreover, the wind speed during the pre-SOS period has a non-trivial effect on the postponement of the SOS.

Author Contributions

Conceptualization, X.S.; methodology, S.Z. and X.S.; software, X.S.; validation, J.L. and H.D.; investigation, J.L. and H.D; resources, J.L. and H.D.; data curation, X.S.; writing—original draft, X.S.; writing—review and editing, J.L., S.Z., H.D. and X.S.; project administration, X.S.; funding acquisition, X.S. All authors have read and agreed to the published version of the manuscript.

Funding

This study was supported by the Nation Key Research and Development Program (Grant No. 2020YFA0608401), the National Natural Science Foundation of China (Grant No. 41801072), and the Open Fund Project of the Key Laboratory of Desert and Desertification, Chinese Academy of Sciences (KLDD-2018-001).

Data Availability Statement

The original contributions presented in the study are included in the article, further inquiries can be directed to the corresponding author.

Acknowledgments

The authors appreciate the constructive reviews by two anonymous reviewers, which noticeably improved our paper quality. We would like to thank the MODIS science team for providing accessible NDVI products.

Conflicts of Interest

The authors declare no conflicts of interest.

References

  1. He, J.; Lyu, D.; He, L.; Zhang, Y.; Xu, X.; Yi, H.; Tian, Q.; Liu, B.; Zhang, X. Combining object-oriented and deep learning methods to estimate photosynthetic and non-photosynthetic vegetation cover in the desert from unmanned aerial vehicle images with consideration of shadows. Remote Sens. 2022, 15, 105. [Google Scholar] [CrossRef]
  2. Mahmood, R.; Pielke Sr, R.A.; Hubbard, K.G.; Niyogi, D.; Dirmeyer, P.A.; McAlpine, C.; Carleton, A.M.; Hale, R.; Gameda, S.; Beltrán-Przekurat, A. Land cover changes and their biogeophysical effects on climate. Int. J. Climatol. 2014, 34, 929–953. [Google Scholar] [CrossRef]
  3. Zhu, K.; Wan, M. Phenology; Science Press: Beijing, China, 1973. [Google Scholar]
  4. White, M.A.; de Beurs, K.M.; Didan, K.; Inouye, D.W.; Richardson, A.D.; Jensen, O.P.; O’keefe, J.; Zhang, G.; Nemani, R.R.; van Leeuwen, W.J. Intercomparison, interpretation, and assessment of spring phenology in North America estimated from remote sensing for 1982–2006. Glob. Change Biol. 2009, 15, 2335–2359. [Google Scholar] [CrossRef]
  5. Piao, S.; Liu, Q.; Chen, A.; Janssens, I.A.; Fu, Y.; Dai, J.; Liu, L.; Lian, X.; Shen, M.; Zhu, X. Plant phenology and global climate change: Current progresses and challenges. Glob. Change Biol. 2019, 25, 1922–1940. [Google Scholar] [CrossRef] [PubMed]
  6. Fu, Y.H.; Zhou, X.; Li, X.; Zhang, Y.; Geng, X.; Hao, F.; Zhang, X.; Hanninen, H.; Guo, Y.; De Boeck, H.J. Decreasing control of precipitation on grassland spring phenology in temperate China. Glob. Ecol. Biogeogr. 2021, 30, 490–499. [Google Scholar] [CrossRef]
  7. Richardson, A.D.; Keenan, T.F.; Migliavacca, M.; Ryu, Y.; Sonnentag, O.; Toomey, M. Climate change, phenology, and phenological control of vegetation feedbacks to the climate system. Agric. For. Meteorol. 2013, 169, 156–173. [Google Scholar] [CrossRef]
  8. Porter, J.R.; Challinor, A.J.; Henriksen, C.B.; Howden, S.M.; Martre, P.; Smith, P. Invited review: Intergovernmental Panel on Climate Change, agriculture, and food—A case of shifting cultivation and history. Glob. Change Biol. 2019, 25, 2518–2529. [Google Scholar] [CrossRef]
  9. Xu, X.; Riley, W.J.; Koven, C.D.; Jia, G.; Zhang, X. Earlier leaf-out warms air in the north. Nat. Clim. Change 2020, 10, 370–375. [Google Scholar] [CrossRef]
  10. Keenan, T.F. Spring greening in a warming world. Nature 2015, 526, 48–49. [Google Scholar] [CrossRef]
  11. Zhao, L.; Li, Y.; Xu, S.; Zhou, H.; Gu, S.; Yu, G.; Zhao, X. Diurnal, seasonal and annual variation in net ecosystem CO2 exchange of an alpine shrubland on Qinghai-Tibetan plateau. Glob. Change Biol. 2006, 12, 1940–1953. [Google Scholar] [CrossRef]
  12. Cui, H.; Chu, L.; Yin, Y.; Pan, Y.; Meng, H.; Wang, T. Spatio-temporal patterns of vegetation phenology and their evolutionary mechanisms in the Three Gorges Reservoir Area from 1990 to 2020. Acta Ecol. Sin. 2024, 44, 3775–3790. [Google Scholar]
  13. Thompson, J.A.; Paull, D.J. Assessing spatial and temporal patterns in land surface phenology for the Australian Alps (2000–2014). Remote Sens. Environ. 2017, 199, 1–13. [Google Scholar] [CrossRef]
  14. Luo, Z.; Song, Q.; Wang, T.; Zeng, H.; He, T.; Zhang, H.; Wu, W. Direct impacts of climate change and indirect impacts of non-climate change on land surface phenology variation across Northern China. ISPRS Int. J. Geo-Inf. 2018, 7, 451. [Google Scholar] [CrossRef]
  15. Friedl, M.; Henebry, G.; Reed, B.; Huete, A.; White, M.; Morisette, J.; Nemani, R.; Zhang, X.; Myneni, R. Land Surface Phenology. A Community White Paper Requested by NASA. 10 April 2016. Available online: https://cce.nasa.gov/mtg2008_ab_presentations/Phenology_Friedl_whitepaper.pdf (accessed on 15 August 2024).
  16. Caparros-Santiago, J.A.; Rodriguez-Galiano, V.; Dash, J. Land surface phenology as indicator of global terrestrial ecosystem dynamics: A systematic review. ISPRS J. Photogramm. Remote Sens. 2021, 171, 330–347. [Google Scholar] [CrossRef]
  17. Kübert, C.; Conrad, C.; Klein, D.; Dech, S. Land Surface Phenology from MODIS data in Germany. In Proceedings of the MultiTemp 2013: 7th International Workshop on the Analysis of Multi-temporal Remote Sensing Images, Banff, AB, Canada, 25–27 June 2013. [Google Scholar]
  18. Zhou, J.; Jia, L.; Menenti, M. Reconstruction of global MODIS NDVI time series: Performance of Harmonic ANalysis of Time Series (HANTS). Remote Sens. Environ. 2015, 163, 217–228. [Google Scholar] [CrossRef]
  19. Chu, D.; Shen, H.; Guan, X.; Chen, J.M.; Li, X.; Li, J.; Zhang, L. Long time-series NDVI reconstruction in cloud-prone regions via spatio-temporal tensor completion. Remote Sens. Environ. 2021, 264, 112632. [Google Scholar] [CrossRef]
  20. Li, S.; Xu, L.; Jing, Y.; Yin, H.; Li, X.; Guan, X. High-quality vegetation index product generation: A review of NDVI time series reconstruction techniques. Int. J. Appl. Earth Obs. Geoinf. 2021, 105, 102640. [Google Scholar] [CrossRef]
  21. Zeng, L.; Wardlow, B.D.; Hu, S.; Zhang, X.; Zhou, G.; Peng, G.; Xiang, D.; Wang, R.; Meng, R.; Wu, W. A novel strategy to reconstruct NDVI time-series with high temporal resolution from MODIS multi-temporal composite products. Remote Sens. 2021, 13, 1397. [Google Scholar] [CrossRef]
  22. Streher, A.S.; Sobreiro, J.F.F.; Morellato, L.P.C.; Silva, T.S.F. Land surface phenology in the tropics: The role of climate and topography in a snow-free mountain. Ecosystems 2017, 20, 1436–1453. [Google Scholar] [CrossRef]
  23. Wang, T.; Song, X.; Yan, C.; Li, S.; Xie, J. Remote sensing analysis on aeolian desertification trends in northern China during 1975–2010. J. Desert Res. 2011, 31, 1351–1356. [Google Scholar]
  24. Chen, L.; Wei, W.; Fu, B.; Lü, Y. Soil and water conservation on the Loess Plateau in China: Review and perspective. Prog. Phys. Geogr. 2007, 31, 389–403. [Google Scholar] [CrossRef]
  25. Mohammad, A.G.; Adam, M.A. The impact of vegetative cover type on runoff and soil erosion under different land uses. Catena 2010, 81, 97–103. [Google Scholar] [CrossRef]
  26. Li, X.; Zhang, Z.; Huang, L.; Wang, X. Review of the ecohydrological processes and feedback mechanisms controlling sand-binding vegetation systems in sandy desert regions of China. Chin. Sci. Bull. 2013, 58, 1483–1496. [Google Scholar] [CrossRef]
  27. Qi, L.; Li, J.; Li, X.; Yang, Y.; Wang, F. China’s combating desertification: National solutions and global paradigm. Bull. Chin. Acad. Sci. Chin. Version 2020, 35, 655–664. [Google Scholar]
  28. Feng, X.; Fu, B.; Piao, S.; Wang, S.; Ciais, P.; Zeng, Z.; Lü, Y.; Zeng, Y.; Li, Y.; Jiang, X. Revegetation in China’s Loess Plateau is approaching sustainable water resource limits. Nat. Clim. Change 2016, 6, 1019–1022. [Google Scholar] [CrossRef]
  29. Menz, M.H.; Dixon, K.W.; Hobbs, R.J. Hurdles and opportunities for landscape-scale restoration. Science 2013, 339, 526–527. [Google Scholar] [CrossRef]
  30. Zhang, R.; Liang, T.; Guo, J.; Xie, H.; Feng, Q.; Aimaiti, Y. Grassland dynamics in response to climate change and human activities in Xinjiang from 2000 to 2014. Sci. Rep. 2018, 8, 2888. [Google Scholar] [CrossRef] [PubMed]
  31. Zhu, Z.; Liu, S. A Study on Strategy of the Development of Agriculture of Desertified Lands in the Interlacing Pastoral-Agricultural in North China. J. Desert Res. 1982, 2, 1–5. [Google Scholar]
  32. Huang, J.; Ma, J.; Guan, X.; Li, Y.; He, Y. Progress in semi-arid climate change studies in China. Adv. Atmos. Sci. 2019, 36, 922–937. [Google Scholar] [CrossRef]
  33. Ran, J.; Ji, M.; Huang, J.; Qi, Y.; Li, Y.; Guan, X. Characteristics and factors of climate change in arid and semi-arid areas over Northern China in the recent 60 years. J. Lanzhou Univ. Nat. Sci. 2014, 50, 46–53. [Google Scholar]
  34. Hu, S.; Mo, X.; Lin, Z. Projections of spatial-temporal variation of drought in north China. Arid Land Geogr. 2015, 38, 239–248. [Google Scholar]
  35. Hu, Z.; Zhou, J.; Zhang, L.; Wei, W.; Cao, J. Climate dry-wet change and drought evolution characteristics of different dry-wet areas in northern China. Acta Ecol. Sin 2018, 38, 1908–1919. [Google Scholar]
  36. Shen, M.; Zhang, G.; Cong, N.; Wang, S.; Kong, W.; Piao, S. Increasing altitudinal gradient of spring vegetation phenology during the last decade on the Qinghai–Tibetan Plateau. Agric. For. Meteorol. 2014, 189, 71–80. [Google Scholar] [CrossRef]
  37. Qi, Y.; Wang, H.; Ma, X.; Zhang, J.; Yang, R. Relationship between vegetation phenology and snow cover changes during 2001–2018 in the Qilian Mountains. Ecol. Indic. 2021, 133, 108351. [Google Scholar] [CrossRef]
  38. Wang, J.; Zhang, X. Investigation of wildfire impacts on land surface phenology from MODIS time series in the western US forests. ISPRS J. Photogramm. Remote Sens. 2020, 159, 281–295. [Google Scholar] [CrossRef]
  39. Dai, S.; Li, H.; Luo, H.; Zhao, Y. The spatio-temporal change of active accumulated temperature≥ 10° C in Southern China from 1960 to 2011. Acta Geogr. Sin. 2014, 69, 650–660. [Google Scholar]
  40. Qian, Y.; Lv, H.; Zhang, Y. Application and assessment of spatial interpolation method on daily meteorological elements based on ANUSPLIN software. J. Meteorol. Environ. 2010, 26, 7–15. [Google Scholar]
  41. Kang, W.; Wang, T.; Liu, S. The response of vegetation phenology and productivity to drought in semi-arid regions of northern China. Remote Sens. 2018, 10, 727. [Google Scholar] [CrossRef]
  42. Yu, H.; Luedeling, E.; Xu, J. Winter and spring warming result in delayed spring phenology on the Tibetan Plateau. Proc. Natl. Acad. Sci. USA 2010, 107, 22151–22156. [Google Scholar] [CrossRef]
  43. Piao, S.; Cui, M.; Chen, A.; Wang, X.; Ciais, P.; Liu, J.; Tang, Y. Altitude and temperature dependence of change in the spring vegetation green-up date from 1982 to 2006 in the Qinghai-Xizang Plateau. Agric. For. Meteorol. 2011, 151, 1599–1608. [Google Scholar] [CrossRef]
  44. Ge, Q.; Dai, J.; Cui, H.; Wang, H. Spatiotemporal variability in start and end of growing season in China related to climate variability. Remote Sens. 2016, 8, 433. [Google Scholar] [CrossRef]
  45. Ding, M.; Li, L.; Zhang, Y.; Sun, X.; Liu, L.; Gao, J.; Wang, Z.; Li, Y. Start of vegetation growing season on the Tibetan Plateau inferred from multiple methods based on GIMMS and SPOT NDVI data. J. Geogr. Sci. 2015, 25, 131–148. [Google Scholar] [CrossRef]
  46. White, M.A.; Thornton, P.E.; Running, S.W. A continental phenology model for monitoring vegetation responses to interannual climatic variability. Glob. Biogeochem. Cycles 1997, 11, 217–234. [Google Scholar] [CrossRef]
  47. Beck, P.S.; Atzberger, C.; Høgda, K.A.; Johansen, B.; Skidmore, A.K. Improved monitoring of vegetation dynamics at very high latitudes: A new method using MODIS NDVI. Remote Sens. Environ. 2006, 100, 321–334. [Google Scholar] [CrossRef]
  48. Yang, Y.; Fan, F. Land surface phenology and its response to climate change in the Guangdong-Hong Kong-Macao Greater Bay Area during 2001–2020. Ecol. Indic. 2023, 154, 110728. [Google Scholar] [CrossRef]
  49. Shi, S.; Yang, P.; van der Tol, C. Spatial-temporal dynamics of land surface phenology over Africa for the period of 1982–2015. Heliyon 2023, 9, e16413. [Google Scholar] [CrossRef]
  50. Du, H.; Wang, M.; Liu, Y.; Guo, M.; Peng, C.; Li, P. Responses of autumn vegetation phenology to climate change and urbanization at northern middle and high latitudes. Int. J. Appl. Earth Obs. Geoinf. 2022, 115, 103086. [Google Scholar] [CrossRef]
  51. Luo, Q.; Song, J.; Yang, L.; Wang, J. Improved spring vegetation phenology calculation method using a coupled model and anomalous point detection. Remote Sens. 2019, 11, 1432. [Google Scholar] [CrossRef]
  52. Sen, P.K. Estimates of the regression coefficient based on Kendall’s tau. J. Am. Stat. Assoc. 1968, 63, 1379–1389. [Google Scholar] [CrossRef]
  53. Theil, H. A rank-invariant method of linear and polynomial regression analysis. Indag. Math. 1950, 12, 173. [Google Scholar]
  54. Parmesan, C. Influences of species, latitudes and methodologies on estimates of phenological response to global warming. Glob. Change Biol. 2007, 13, 1860–1872. [Google Scholar] [CrossRef]
  55. Guo, L.; Dai, J.; Wang, M.; Xu, J.; Luedeling, E. Responses of spring phenology in temperate zone trees to climate warming: A case study of apricot flowering in China. Agric. For. Meteorol. 2015, 201, 1–7. [Google Scholar] [CrossRef]
  56. Zhang, Q.; Kong, D.; Shi, P.; Singh, V.P.; Sun, P. Vegetation phenology on the Qinghai-Tibetan Plateau and its response to climate change (1982–2013). Agric. For. Meteorol. 2018, 248, 408–417. [Google Scholar] [CrossRef]
  57. Li, C.; Wang, R.; Cui, X.; Wu, F.; Yan, Y.; Peng, Q.; Qian, Z.; Xu, Y. Responses of vegetation spring phenology to climatic factors in Xinjiang, China. Ecol. Indic. 2021, 124, 107286. [Google Scholar] [CrossRef]
  58. Tian, R.; Li, J.; Zheng, J.; Liu, L.; Han, W.; Liu, Y. Changes in vegetation phenology and its response to different layers of soil moisture in the dry zone of Central Asia, 1982–2022. J. Hydrol. 2025, 646, 132314. [Google Scholar] [CrossRef]
  59. Ren, S.; Yi, S.; Peichl, M.; Wang, X. Diverse responses of vegetation phenology to climate change in different Grasslands in Inner Mongolia during 2000–2016. Remote Sens. 2018, 10, 17. [Google Scholar] [CrossRef]
  60. Zhu, Y.; Qin, S.; Zhang, Y.; Zhang, J.; Shao, Y.; Gao, Y. Vegetation phenology dynamic and its responses to meteorological factor changes in the Mu Us Desert of northern China. J. Beijing For. Univ. 2018, 40, 98–106. [Google Scholar]
  61. Shen, X.; Liu, B.; Henderson, M.; Wang, L.; Wu, Z.; Wu, H.; Jiang, M.; Lu, X. Asymmetric effects of daytime and nighttime warming on spring phenology in the temperate grasslands of China. Agric. For. Meteorol. 2018, 259, 240–249. [Google Scholar] [CrossRef]
  62. Wu, C.; Hou, X.; Peng, D.; Gonsamo, A.; Xu, S. Land surface phenology of China’s temperate ecosystems over 1999–2013: Spatial–temporal patterns, interaction effects, covariation with climate and implications for productivity. Agric. For. Meteorol. 2016, 216, 177–187. [Google Scholar] [CrossRef]
  63. Liu, Q.; Fu, Y.H.; Zeng, Z.; Huang, M.; Li, X.; Piao, S. Temperature, precipitation, and insolation effects on autumn vegetation phenology in temperate China. Glob. Change Biol. 2016, 22, 644–655. [Google Scholar] [CrossRef]
  64. Cong, N.; Wang, T.; Nan, H.; Ma, Y.; Wang, X.; Myneni, R.B.; Piao, S. Changes in satellite-derived spring vegetation green-up date and its linkage to climate in China from 1982 to 2010: A multimethod analysis. Glob. Change Biol. 2013, 19, 881–891. [Google Scholar] [CrossRef] [PubMed]
  65. Luo, M.; Meng, F.; Sa, C.; Duan, Y.; Bao, Y.; Liu, T.; De Maeyer, P. Response of vegetation phenology to soil moisture dynamics in the Mongolian Plateau. Catena 2021, 206, 105505. [Google Scholar] [CrossRef]
  66. Wang, X.; Xiao, J.; Li, X.; Cheng, G.; Ma, M.; Zhu, G.; Altaf Arain, M.; Andrew Black, T.; Jassal, R.S. No trends in spring and autumn phenology during the global warming hiatus. Nat. Commun. 2019, 10, 1–10. [Google Scholar] [CrossRef]
  67. Piao, S.; Tan, J.; Chen, A.; Fu, Y.H.; Ciais, P.; Liu, Q.; Janssens, I.A.; Vicca, S.; Zeng, Z.; Jeong, S.-J. Leaf onset in the northern hemisphere triggered by daytime temperature. Nat. Commun. 2015, 6, 6911. [Google Scholar] [CrossRef]
  68. Peng, S.; Piao, S.; Ciais, P.; Myneni, R.B.; Chen, A.; Chevallier, F.; Dolman, A.J.; Janssens, I.A.; Penuelas, J.; Zhang, G. Asymmetric effects of daytime and night-time warming on Northern Hemisphere vegetation. Nature 2013, 501, 88–92. [Google Scholar] [CrossRef] [PubMed]
  69. Shen, X.; Liu, B.; Xue, Z.; Jiang, M.; Lu, X.; Zhang, Q. Spatiotemporal variation in vegetation spring phenology and its response to climate change in freshwater marshes of Northeast China. Sci. Total Environ. 2019, 666, 1169–1177. [Google Scholar] [CrossRef] [PubMed]
  70. Shen, X.; Xue, Z.; Jiang, M.; Lu, X. Spatiotemporal change of vegetation coverage and its relationship with climate change in freshwater marshes of Northeast China. Wetlands 2019, 39, 429–439. [Google Scholar] [CrossRef]
  71. Wei, D.; Zhang, X.; Wang, X. Strengthening hydrological regulation of China’s wetland greenness under a warmer climate. J. Geophys. Res. Biogeosci. 2017, 122, 3206–3217. [Google Scholar] [CrossRef]
Figure 1. The location and elevation of study area.
Land 14 00594 g001
Figure 2. Mean values (ac), standard deviations (df), and trends (gl) in the SOS, EOS and LOS, respectively, from 2001 to 2020.
Land 14 00594 g002
Figure 3. Trends and temporal variations in LSP metrics in the study area and each typical sandy land/desert from 2001 to 2020.
Land 14 00594 g003
Figure 4. Trend of mean temperature, maximum temperature, minimum temperature, precipitation, and mean wind velocity from 2000 to 2020.
Land 14 00594 g004
Figure 5. The MC of the PLS model for the standardized SOS and meteorological data for the entire study area and each typical sandy land/desert. Months where the MC value is marked by a red box indicate that the VIP ≥ 1; the month marked with a negative sign is the month of the previous year.
Land 14 00594 g005
Figure 6. The MC of the PLS model for the standardized EOS and meteorological data for the entire study area and each typical sandy land/desert. Months where the MC value is marked by a red box indicate that the VIP ≥ 1; the month marked with a negative sign is the month of the previous year.
Land 14 00594 g006
Figure 7. The MC of the PLS model for the standardized LOS and meteorological data for the entire study area and each typical sandy land/desert. Months where the MC value is marked by a red box indicate that the VIP ≥ 1; the month marked with a negative sign is the month of the previous year.
Land 14 00594 g007
Disclaimer/Publisher’s Note: The statements, opinions and data contained in all publications are solely those of the individual author(s) and contributor(s) and not of MDPI and/or the editor(s). MDPI and/or the editor(s) disclaim responsibility for any injury to people or property resulting from any ideas, methods, instructions or products referred to in the content.

