Abstract
Improving solar availability in urban blocks is vital to promoting energy conservation and emissions reduction. However, there are very few studies on the impact of block morphology on solar energy availability in high-density cities based on the particularities of climate and solar energy resources in severe cold regions at higher latitudes. This study took 434 block models generated through seven orientation conditions of 62 residential blocks in Harbin, China, as its research object. Through numerical simulations and statistical analysis, it revealed the quantitative relationship between block morphology and the availability of active photovoltaic and solar thermal collector technologies and passive thermal heating technologies. The results show that active solar technology has the highest availability in multi-story enclosed residential blocks, and passive thermal heating has the highest availability in the multi-high-level mixed-row type. The south façade of the building has the greatest active and passive solar availability. The overall active solar availability of the residential block is significantly negatively correlated with the mean building height, floor area ratio, and volume area ratio; it is significantly positively correlated with site coverage and the standard deviation of the building height. Controlling the block’s orientation between 15° south by west and 15° south by east can increase the active solar availability of the façade. This study provides a reference and evaluation basis for the sustainable planning and design of high-density cities in severely cold regions.
1. Introduction
The world’s population is expected to grow to 10 billion by 2050 [1], with the proportion of people living in cities increasing from 50% to 68% [2]. With the advancement of urbanization, the deterioration of the human settlement environment and the increase in energy consumption have become prominent problems in urban construction and development. In addition, conventional energy shortages are putting extreme pressure on urban areas, which means that effective measures must be taken to meet the growing energy demand. Increasing the use of renewable energy is considered a highly promising approach. Solar energy is one of the most important renewable energy sources; it is therefore of great significance to fully tap the availability of solar energy for urban energy conservation and emissions reduction [3]. By the end of 2023, nearly 37% of global renewable energy came from solar resources [4]. By 2050, solar energy will account for 16% of total global energy production, resulting in significant reductions in conventional energy consumption and greenhouse gas emissions [5].
The growing population has led to urban sprawl and an increasing intensity of compact cities, with a growing number of buildings in cities. Statistics show that buildings in cities consume about 45% of urban energy [6], so it has become an inevitable requirement that urban buildings reduce their energy consumption [7]. Solar energy is the most abundant renewable energy source available in the architectural field. Technologies such as photovoltaic technology and solar thermal collectors can be converted into usable energy, such as electricity or heat, to meet the energy needs of buildings [8]. Since 93% of the global population lives in countries with an average daily PV potential between 3 and 5 kWh/kWp [9], its widespread feasibility has led to an average annual growth rate of the PV industry of more than 35% over a decade [10]. In addition, PT technology is mainly used for the hot water supply and internal heating in buildings [11], with solar water heating systems being widely adopted by households worldwide due to their cost-effectiveness [12]. SWHS can typically meet 40–80% of domestic hot water demand in temperate regions and almost 100% in tropical regions [13]. With the advancement of solar energy technology and industrial upgrading, many studies have been conducted on the relationship between urban buildings and solar energy performance [14,15]. Research on building-integrated photovoltaic technology, net-zero-energy buildings, and zero-carbon buildings has achieved certain results, promoting the use of solar energy resources in buildings [16,17,18]. In recent years, the study of solar availability in buildings has expanded from exploring the solar availability of the rooftops and façades of individual buildings to the study of the entire building envelope. Some scholars have evaluated the relationship between different urban morphologies composed of building clusters and solar energy resources [19,20,21,22]. Urban morphology significantly affects buildings’ energy consumption and solar energy utilization potential due to changes in parameters such as density, height, and orientation [23]. Fewer building floors and a lower volume area ratio (Volume area ratio is the ratio of total building volume to site area) tend to allow the building’s surface to receive more abundant solar energy resources [19]. Exploring the relationship between solar availability and urban morphology is crucial for the optimal development of urban energy in the future.
An urban block is a building cluster composed of several buildings with similar functions and spatial relations that are closely connected in terms of spatial organization. An urban block is a fundamental part of a city, so it is important to conduct accurate solar availability assessments based on block morphology [24]. Therefore, many scholars have conducted studies on the relationship between urban block morphology and the utilization of available solar energy resources [25,26,27]. The solar availability of urban blocks is mainly influenced by their layout type and morphological parameters. Research on the diversity of block layout types has been carried out in two dimensions: plan layout diversity and height diversity [28]. Starting by considering the diversity of block plan layouts, Simone et al. studied the difference between the active and passive solar availability of three main block layout types: the tower type, the enclosed type, and the row type, based on the climatic conditions of New York. They found that the enclosed type had the best solar availability [29]. In contrast, most of the studies conducted on block height diversity have found that low-rise and low-density blocks have the best solar potential, low-rise and high-density blocks have the second best, and high-rise and high-density blocks have the worst overall solar performance [30,31]. Building density, floor area ratio, building height, compactness, orientation, etc., are often chosen as research variables in studies of the impact of block form parameters on solar availability. For example, Lan et al. [32] selected six morphological indicators, namely, building density, floor area ratio, building height, building floor, height variance, and volume variance, to explore the relationship between the morphology of the urban blocks and solar availability in a non-linear relationship. Appropriate compactness and density were found to positively affect solar energy utilization [33]. In addition, some scholars have studied the prediction model of solar availability based on block morphology to provide a basis for the optimized design of urban block morphology. Veisi et al. [34] used a multi-objective genetic algorithm to simulate 34 urban blocks with different layout types. They obtained a prediction model of solar radiation reception based on the block orientation, mean building height, and other parameters. Numerous studies have shown that reasonable urban block morphology design is conducive to improving solar availability, promoting the more efficient and flexible application of solar energy technology and enhancing the driving role of solar energy in building new green and low-carbon cities [35].
Urban blocks have a variety of functional categories, including residential, commercial, office, industrial, and so on, and residential blocks occupy the leading position. People are highly concentrated in urban residential blocks, and their activity time is longer, so they consume more energy. The solar availability of urban residential blocks has broad development prospects. With the development of solar energy technology, more effective solar energy utilization methods are needed to meet the energy demands of urban residential blocks [36]. Therefore, it is important to explore the relationship between residential block morphology and solar availability for energy conservation and emissions reduction in the building field and in the sustainable development of cities. Many scholars have conducted relevant studies on the solar availability of urban residential blocks [37,38,39]. When studying how to promote the balance of energy supply and demand in traditional buildings, Natanian et al. [40] built typical models based on the layout types of 12 residential blocks in Tel Aviv city, considering the practical conditions of local density constraints; they evaluated the impact of block morphology on solar availability. Mahaya et al. [7] analyzed morphology and solar availability in ten representative residential blocks of Banta collective housing. By conducting numerical simulations and evaluations of four active and passive solar performance indicators, they concluded that, when the building height was consistent, blocks with a low volume area ratio and low site coverage had better solar availability. Tian et al. [41] studied the influence of residential block morphological parameters on solar availability, and the research results promoted the implementation and optimization of photovoltaic policies in residential blocks in China. Xia et al. [42] found that the floor area ratio, density, and building height significantly impact the solar availability of urban residential blocks, and, because high-rise buildings block each other, blocks with a large number of buildings with fewer than 15 stories have better overall solar availability.
To sum up, very few studies focus on residential blocks in cities with high-density layouts and high-intensity development [43]. Moreover, the research sites of the above studies are mainly located in low-latitude tropical climate zones or mid-latitude temperate marine climate zones and continental climate zones. Since the distribution of solar energy resources varies considerably with latitude, the results of studies in different latitudinal regions are not the same. At low latitudes, it has been shown that orientation has a significant effect on the amount of solar radiation received by a building [44], with the most solar radiation received when the average height is controlled at 10–15 m [34], and the standard deviation of the building height tends to be negatively related to solar energy availability. Adjusting block forms such as the building layout and building spacing also affects the reception of solar radiation, with the enclosed layout type having the best potential for solar technology. However, at high latitudes, building density is often considered to be the parameter that has the greatest impact on the amount of solar radiation received [45]. Lee et al. found that building density is negatively correlated with building façade’s solar availability [46], whereas Sattrup and Strømann confirmed that urban density and compactness do not necessarily correlate linearly with solar radiation reception [47], so the same high-latitude region still needs to be analyzed in the context of each location. In addition, the building length–width ratio and façade material had the second highest impact on solar radiation reception, with Lobaccaro et al. increasing the solar energy potential by 25% by optimizing the building form and materials [48]. The effect of orientation on solar availability was found to be more limited. Additionally, a study conducted by Chatzipoulka et al. [49] found that the standard deviation of building heights has a positive effect on solar energy availability on block façades. For different layout types, the row layout can better utilize the solar energy potential, followed by the enclosed layout [50].
In addition, the existing studies mainly consider the performance of active photovoltaic or solar thermal collector technologies; otherwise, they solely target passive heating and cooling technologies. The performance of active and passive solar technology should be studied synthetically to better utilize solar availability. Moreover, since most research objects are either ideal block cases generated by control variables or a few built block cases, the research results cannot accurately reflect the general rules of block solar energy potential and cannot effectively guide urban construction.
China’s severely cold regions have higher latitudes, and the accelerated urbanization process has led to the high-density and high-intensity development of urban blocks, especially residential blocks. Therefore, it is even more necessary to fully utilize the positive role of solar energy resources by increasing solar availability [51]. This study investigates the effect of urban residential block morphology on solar availability in severely cold regions. Taking Harbin City, China, as an example, this study quantitatively analyzes the relationship between the block layout type and solar availability, as well as the influence of block morphological parameters on the overall solar availability of blocks and the solar availability of each building envelope surface, by simulating the solar radiation received by typical residential blocks. This study provides scientific guidance for improving urban solar potential and urban energy conservation and emissions reduction.
2. Methodology
2.1. Workflow
The workflow of this study includes three steps, as shown in Figure 1. First, according to the collection and analysis of the study area’s primary data, typical urban residential blocks were selected as study cases, and their morphological parameters were calculated. Second, Rhino and Grasshopper were used to construct a digital model of the study case. Ladybug was applied to simulate the solar radiation received by the building envelope surfaces, and the solar performance indicators’ values were calculated. Finally, the relationship between the morphology of the urban residential blocks and solar availability was statistically and analytically investigated [52].
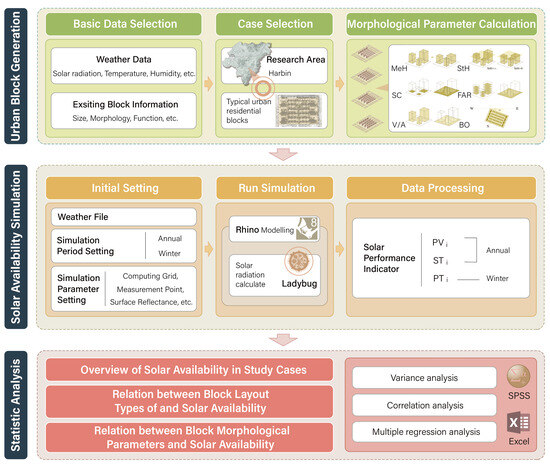
Figure 1.
The workflow of this study.
2.2. Research Site
Harbin, also known as ‘Ice City’, is located in the frigid region of northeastern China, with a geographic location of 45°46′ N latitude and 126°37′ E longitude. Harbin is the capital of Heilongjiang Province, its largest megacity with the largest land jurisdiction and the third largest household population among the provincial municipalities in China; it has been approved by the State Council as an important central city in Northeast China [53]. Harbin has an area of land of about 53,100 km2 and a population of about 9.4 million. It has a mid-temperate continental monsoon climate with four distinct seasons: a long and cold winter, a short and hot summer, and a short transition season. The average temperature of the hottest month of July in Harbin is 23.8 °C, and the average temperature of the coldest month of January is −17.5 °C. August is the wettest month, with an average relative humidity of 75.6%, and April is the driest month, with an average relative humidity of 48.3%. Precipitation is mainly concentrated from June to September, with a concentrated snowfall period from November to January [54].
Northeast China is rich in solar energy resources, with total annual solar radiation ranging from 14,461.2 to 19,306.8 kWh/m2, and solar radiation is significantly higher in spring and summer than in autumn and winter, as shown in Figure 2. According to the GB/T 37526-2019 standard [55], the degree of richness of Harbin’s solar energy resources makes it a highly resource-rich area, and the degree of stability of its solar energy resources is good, which is highly favorable for the comprehensive development and utilization of solar energy resources in Harbin. The average annual total solar radiation in Harbin is 1426.18 kWh/m2, and the average annual sunshine hours are 2641–2732 h. There are the most total solar radiation and sunshine hours in May and June, when the total solar radiation can reach 177.21 kWh/m2 and 163.89 kWh/m2 and the sunshine hours can reach 255.2 and 201.4 h, respectively. The total solar radiation is relatively low in November, December, and January, which all have values below 800 kWh/m2, and the sunshine hours in January are the shortest, below 150 h [54].
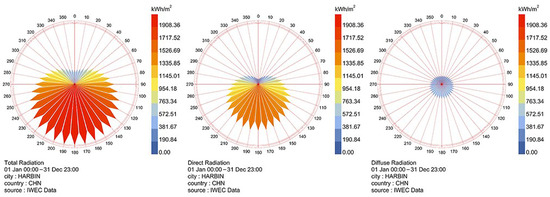
Figure 2.
Annual solar radiation in Harbin.
2.3. Assessment of Solar Availability in Residential Blocks
Solar performance indicators can quantify the solar radiation reaching the building envelope and quantitatively evaluate the solar availability of urban residential block sites, thus guiding the construction of blocks that can maximize the use of solar energy [7]. Compagnon has developed a series of solar performance indicators to evaluate the availability of solar techniques, comprising photovoltaic systems, solar thermal collectors, passive thermal heating, and daylighting systems [55]. These indicators have been used in several studies on solar availability in the urban fabric [46].
Due to the unique climate conditions in Harbin, this study selected three solar performance indicators, namely, the photovoltaic availability indicator (PVi), the solar thermal collector availability indicator (STi), and the passive thermal heating availability indicator (PTi), to evaluate active photovoltaic techniques, active solar techniques for heating, and passive solar techniques for heating during winter [7,36,46,55]. These indicators are calculated by first determining the threshold for each solar technology, then calculating the solar radiation reaching the building envelope, and finally calculating the percentage of the envelope area that meets the threshold conditions out of the total building envelope area. The formulas for the three solar performance indicators are shown below:
where APVsolar is the area of the envelope above the photovoltaic technology threshold. ASTsolar is the area of the envelope above the solar thermal collector technology threshold. APTsolar is the area of the envelope above the passive thermal heating technology threshold. Ae is the total area of the corresponding building roof or façade envelope.
The solar radiation thresholds for photovoltaic systems and solar collectors on the façade and roof were determined with reference to Compagnon’s findings [55]. In addition, the threshold for passive solar technology is the amount of solar radiation needed to bring solar gains and heat losses into balance during the heating season [55]. Since windows are the unique and essential part of buildings that take advantage of passive solar energy, the PTi threshold mainly depends on the corresponding climate in different regions and the characteristics of the window glass. The research location of this study is in Harbin city, a severely cold region in China. Considering the special characteristics of the cold climate zone in which Harbin is located, based on the GB 50176-2016 standard [56] and the JGJ 26-2018 standard [57], we use the values of the HDD (heating degree day), K (heat transfer coefficient), and g (solar heat gain coefficient) in Equation (4).
HDD = 5032 °C·d [56], K = 1.6 W/(m2·K) [58], g = 0.45 [56], η as a utilization factor takes 1 [7,55].
The definitions and related thresholds of the three solar performance indicators are shown in Table 1.

Table 1.
Definition and threshold values of the proposed solar performance indicators.
2.4. Models and Morphological Parameters of Urban Residential Blocks
2.4.1. Urban Residential Block Model Generation
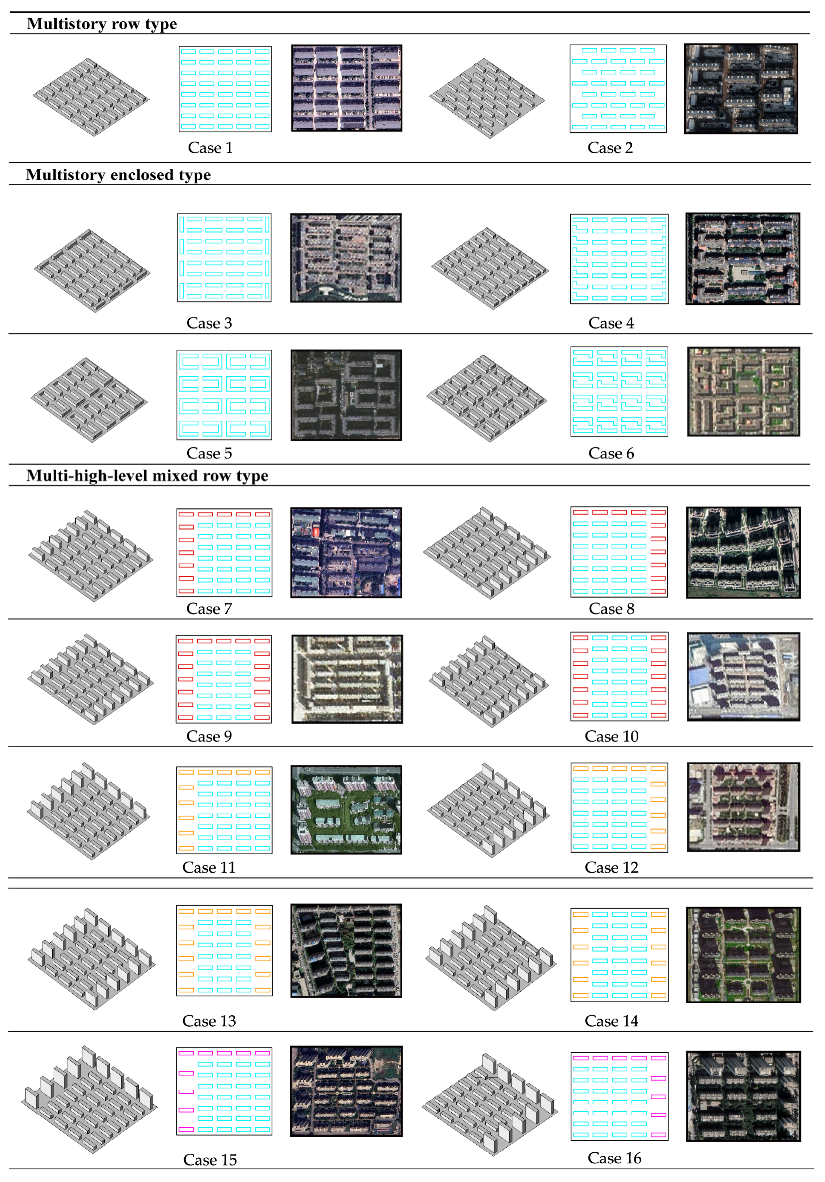
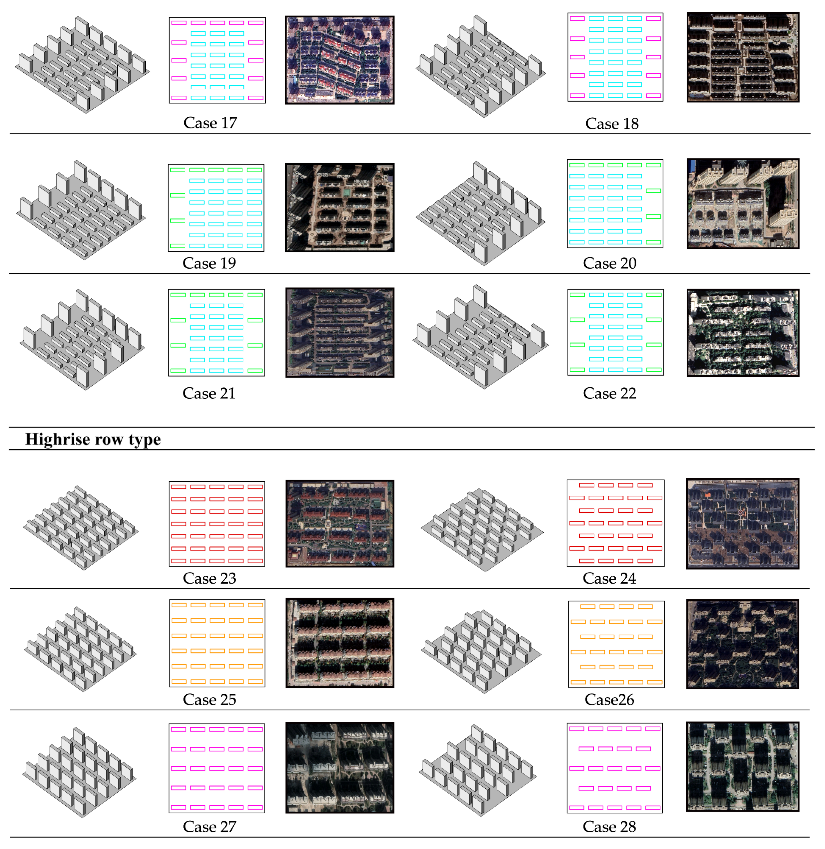
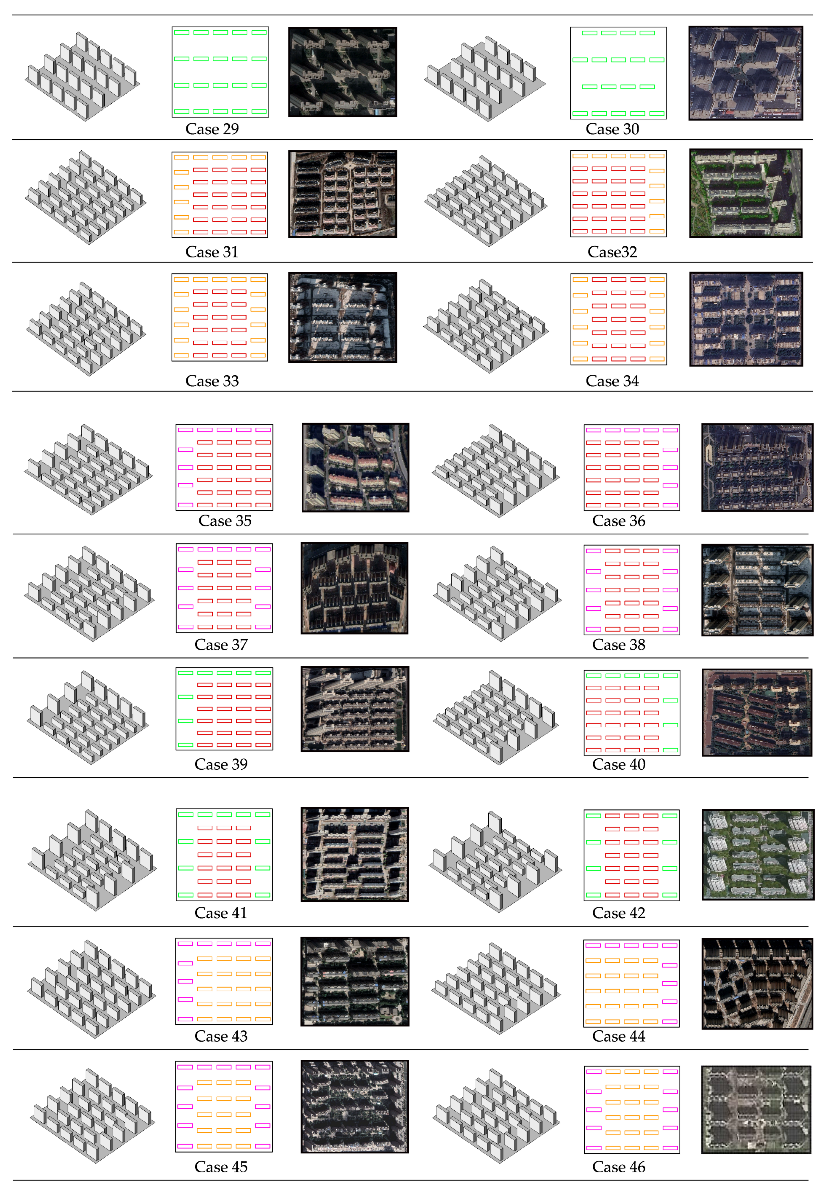
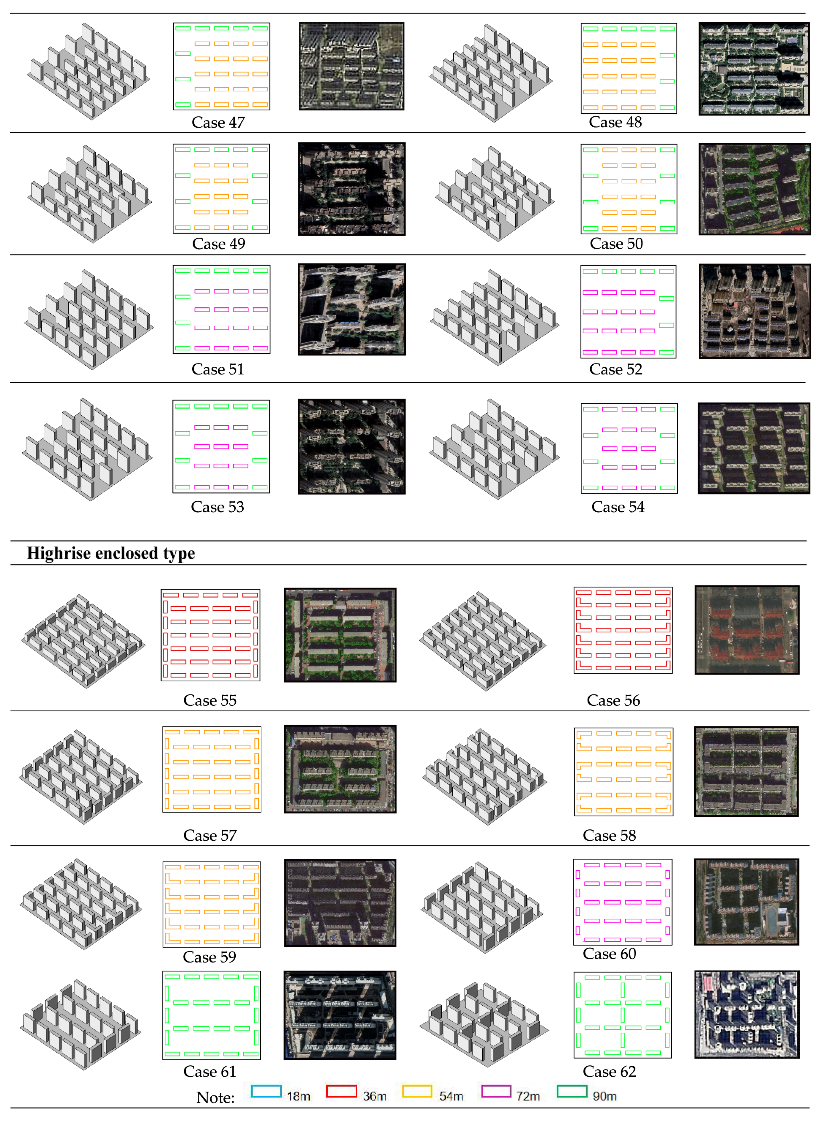
In order to make the selected research samples reflect the current construction status of urban settlements and to ensure that they have sufficient representativeness and reasonableness, the research samples’ locations are restricted to six main urban areas in Harbin City; all of them were built in the past 20 years. Residential blocks in the cold regions of China are dominated by multi-story buildings and high-rise buildings, and the layout types are mainly rows and enclosures [59]. Therefore, in combination with the relevant requirements of the Code for Compiling Regulatory Planning [60], this study takes into account the layout type of the residential blocks, the floor area ratio, site coverage, building height, and other major morphological factors. We selected 62 typical residential blocks in Harbin City as the study cases; their five typical layout types include the multi-story row type, the multi-story enclosed type, the multi-high-level mixed-row type, the high-rise row type, and the high-rise enclosed type [51].
To ensure the research results are representative and widely applicable, the case model was streamlined following the governing aspects of the design standards, such as the sunlight spacing, fire spacing, and floor area ratio, for urban residential blocks in Harbin [61,62]. The building plans primarily adopt rectangular and L-shape configurations, with a floor height of 3 m and a depth of 15 m [63]. The building heights vary: 18 m, 36 m, 54 m, 72 m, and 90 m. Additionally, to account for the impact of block orientation on solar availability, each case’s orientation was changed in steps of 15°, resulting in seven block orientations: south, 45°, 30°, and 15° south by east, and 45°, 30°, and 15° south by west. Consequently, a total of 434 case models were generated for this study.
An urban block is a fundamental urban unit encompassed by urban roads, and the size of a block is dictated by the density of the urban road grid [20]. In this study, the site size was set to the more common 360 m × 400 m size based on the statistical data pertaining to the density of the road grid and residential block size in Harbin [64]. Considering the obstructing effect of the surrounding buildings, the layout and height of the buildings around the model were standardized to the most common six-story determinant layout in Harbin [64]. The width of the peripheral road was 20 m, the boundary line of the site area was set back from the red line of the road by 5 m, and the building control line was set back from the boundary line of the site area by 10 m. The study case model is detailed in Appendix A.
2.4.2. Calculation of Morphological Parameters
The morphological parameters of the residential blocks have a remarkable impact on solar availability [42], and the options for the morphological parameters depend on the study’s objectives, the scale, and the climatic conditions [65]. This study, based on the eight principles of environmental performance correlation analysis proposed by Luc [52], selected six block morphological parameters: mean building height, standard deviation of building height, site coverage, block orientation, floor area ratio, and volume area ratio. The above parameters described the block morphology in three dimensions: vertical, horizontal, and holistic.
The mean building height and standard deviation of building height describe the vertical morphology of the blocks. The mean building height reflects the vertical spatial variation in the block under the influence of different building footprint areas. The standard deviation of building heights reflects the degree of discrepancy in height between buildings in the blocks. Site coverage and block orientation describe the horizontal morphology of the blocks. Site coverage reflects the degree of building coverage in a block. Block orientation is crucial to ensuring the energy efficiency of buildings and the thermal comfort of spaces. The floor area ratio and volume area ratio describe the morphology of the blocks. The floor area ratio is an essential technical and economic indicator for monitoring the intensity of spatial development in urban blocks, which can effectively reflect the degree of land utilization. In contrast to the floor area ratio, the volume area ratio shows the building height to a certain extent [7,58,66]. The definitions of the morphological parameters are shown in Table 2.
Table 2.
Definition and graphical representation of morphological parameters.
2.5. Solar Radiation Simulation
2.5.1. Simulation Software
In this research, the morphology of the residential block was first modeled based on the Rhino and Grasshopper platforms. To achieve accuracy in the solar radiation simulation, Ladybug 1.6.0, a plugin for Grasshopper that simulates microclimate performance, was used to calculate the solar radiation receipts. The solar radiation function in Ladybug is generated using the cumulative sky method [67], which uses the Gen-cumulative Sky module to create an annual cumulative sky illumination model that uses Radiance to run global and diffuse radiation simulations [35]. This simulation and analysis platform is widely used to study solar radiation in buildings and has been confirmed to have satisfactory precision and accuracy in related studies [35,68].
2.5.2. Simulation Settings
This study uses the Harbin (126.41° E, 45.45° N) weather file of EnergyPlus Weather [69], with the initial settings shown in Table 3. The cumulative solar radiation received by the east, south, west, and north façades, roofs, and blocks is calculated. The whole year and winter (1 December–28 February) are simulated to calculate the potential indicators of active and passive solar energy utilization. The simulation grid sizes commonly used in previous related studies are 1 m × 1 m [35], 2 m × 2 m [41], and 3 m × 3 m [69]. This study sets the grid size to 2 m × 2 m [41] to balance simulation efficiency and accuracy. Considering the reflection of radiation in the building environment, the diffuse reflectance values of the building surface and the ground surface are set to 0.2 [35,70].
Table 3.
Solar radiation simulation parameter settings.
2.5.3. Simulation Verification
In this study, field-measured data were used to verify the accuracy of the solar radiation simulation results. Data from the rooftop solar radiation monitoring system of the Cold Region Building Science Experimental Building of the Harbin Institute of Technology, on 19 December 2015, 6 July 2016, and 20 September 2017, were selected to verify the rooftop solar radiation simulation results (Figure 3a). In addition, the solar radiation of the south and north façades of the 11th floor of Building 5 in Aida No. 1 Community, Harbin, was tested using a JTR05T solar radiometer on 14 January 2023, 23 September 2023, and 9 July 2024. The solar radiation was tested synchronously outdoors without shielding to serve as background meteorological data for the simulation (Figure 3b). The daily test time was 8:00–18:00, and the weather was good during the test, with clear skies and excellent air quality. The measured object was simplified and modeled using Rhino, i.e., detailed components such as building roof components and bay windows were ignored. Ladybug was used to simulate the solar radiation of the measured object, and the computational grid resolution was set to 2 m × 2 m. In addition, the accuracy of the simulation results was evaluated according to the mean absolute percentage error (MAPE) and consistency index (d), as shown in Table 4. The MAPE and d values of the roof and façade solar radiation were within the acceptable range, proving that the simulated values were highly consistent with the measured values and the solar radiation intensity simulation model was relatively reliable.
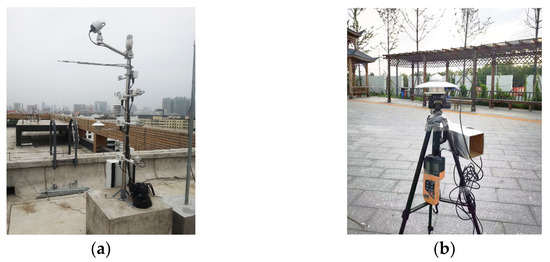
Figure 3.
Solar radiation field measurement instrument. (a) Solar radiation detection system (b) JTR05T Solar Radiometer.
Table 4.
Mean absolute percentage error (MAPE) and consistency index (d) between measured and simulated values.
2.6. Statistical Analysis
This study used SPSS 18 statistical software to conduct the variance analysis, correlation analysis, and multiple regression analysis in order to study the relationship between urban residential block morphological parameters and solar availability in severely cold regions.
First, the significance of the influence of residential block morphological parameters and solar performance indicators was judged using single-factor variance analysis, and the Sig. value was used as the basis. When the Sig. value is <0.05, it indicates that the impact is significant. Secondly, Pearson correlation analysis was conducted between the dependent variable (solar performance indicators) and the independent variable (morphological parameters of urban residential blocks) to determine whether there is a significant correlation between the dependent variable and the independent variable through the Sig. value [35]. When the Sig. value is <0.05, this indicates that there is a significant correlation between the dependent and independent variables. The correlation coefficient (r) was used to determine the linear trend and degree of correlation between the dependent and independent variables. When r > 0, there is a positive correlation between the variables. The larger the |r|, the higher the correlation. On this basis, morphological parameters with significant effects were selected as independent variables and solar performance indicators as dependent variables for the multiple linear regression analyses to predict changes in solar availability through combinations of morphological parameters.
3. Results
3.1. Overview of Solar Availability in Residential Block Cases
Figure 4 shows the statistical results of solar availability in the building envelope of a sample of 434 residential blocks. The height of the bar represents the average of the solar performance indicators of the surfaces for all samples, and the error bars indicate the standard deviation of the solar performance indicators of the surfaces. The results show that the STi, PVi, and PTi of the building envelope decrease successively, with values of 77%, 54%, and 23%, respectively, indicating that the surface of the blocks had the most significant area available for the utilization of PVi, accounting for 77% of the total surface area of the blocks. Regarding the east, west, south, and north façades, the STi, PVi, and PTi values of the south façade are all the largest, at 100%, 96%, and 60%, respectively. The STi, PVi, and PTi of the east and west façades are the second largest and similar, about 93%, 48%, and 13%, respectively. In addition, the standard deviations of PVi and PTi for the east and west façades are relatively large, indicating the significantly different availability of photovoltaic technology and passive thermal heating in the east and west façades of buildings in different morphology blocks. The north façade has the lowest solar availability and is only suitable for the solar thermal collector. Moreover, the standard deviation of STi on the north façade is large, indicating that different block morphologies have a significant impact on the solar thermal collector utilization potential of the north façade of the building. In addition, more than 99% of the rooftop can be used for photovoltaic technology and solar thermal collector technology, and the rooftop cannot be used for passive thermal technology.
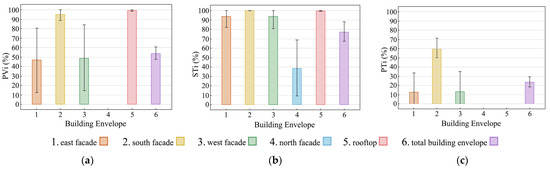
Figure 4.
Solar availability in the building envelope of the residential blocks. (a) PVi; (b) STi; (c) PTi.
3.2. Relationship Between the Residential Block Layout Type and Solar Availability
The solar energy availability of the five residential block layout types is shown in Figure 5. The visualization results of the annual cumulative solar radiation intensity for typical cases of each block layout type are shown in Table 5. The difference trends of PVi and STi are basically the same among different block layout types. For PVi and STi, the median values of the multi-story enclosed type, multi-high-level mixed-row type, and high-rise enclosed type decrease successively, and the median values of the multi-story determinant layout are at a moderate level, slightly higher than the high-rise row type. For PTi, the median value of the multi-high-level mixed-row type is the largest, followed by the high-rise row type, and the median value of the high-rise enclosed type is the smallest. The multi-story determinant layout and multi-story enclosed type are at a moderate level, and the multi-story enclosed type is slightly lower than the multi-story determinant layout.
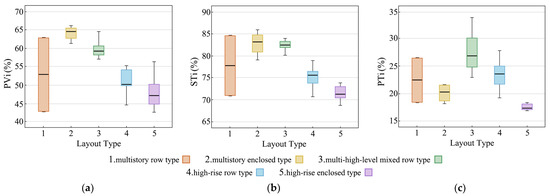
Figure 5.
Solar availability of residential block layout types. (a) PVi; (b) STi; (c) PTi.
Table 5.
Visualization of the annual accumulated solar radiation intensity on residential surfaces for typical cases of each block layout type.
3.3. Relationship Between Residential Block Morphological Parameters and Overall Solar Availability
3.3.1. Correlation Between Morphological Parameters
Table 6 shows the results of the correlation analysis of the urban residential block morphological parameters. There is no significant correlation between BO and the other parameters. StH only has a significant negative correlation with MeH and V/A, and the degree of correlation is very low. There is a high positive correlation between FAR and StH, and the FAR; r is 0.912 and 0.965. There is a strong negative correlation between SC and MeH (|r| = 0.935), FAR (|r| = 0.778), and V/A (|r| = 0.809). In addition, MeH and V/A show a significantly high positive correlation.
Table 6.
Correlation test between block morphological parameters.
3.3.2. Relationship Between the Morphological Parameters and Overall Solar Availability of Residential Blocks
To investigate the quantitative relationship between morphological parameters and the overall solar availability of the residential blocks, a one-way ANOVA was first used to determine the significance of the effect of morphological parameters on the overall solar availability. On this basis, linear correlation analyses were conducted to determine the linear trends and the degree of correlation between the morphological parameters with significant effects and solar availability.
The results of the one-way ANOVA of each morphological parameter with the overall solar performance indicators of the residential block showed that the Sig. values of MeH, StH, SC, FAR, V/A, and BO were all less than 0.05. This indicates that all of the above morphological parameters significantly affected PVi, STi, and PTi.
Table 7 shows the results of the correlation analysis of each morphological parameter with the overall solar availability. StH was significantly and positively correlated with PVi, STi, and PTi in increasing order, which indicates that increasing StH increases PVi, STi, and PTi in turn. FAR was significantly negatively correlated with PVi, STi, and PTi in decreasing order of correlation, indicating that increasing FAR had a decreasing inhibiting effect on the availability of the overall photovoltaic technology, solar thermal collector, and passive thermal heating technologies in the blocks. Additionally, MeH and V/A exhibited significant negative correlations with PVi and STi, whereas SC showed a significant positive correlation with PVi and STi. Moreover, MeH, SC, and V/A were strongly correlated with PVi but weakly correlated with STi.
Table 7.
Correlation analysis results between the morphological parameters and solar performance indicators of the total building envelope in residential blocks.
Based on the results of the one-way ANOVA, the morphological parameters with significant effects on PVi, STi, and PTi were used as independent variables, and PVi, STi, and PTi were used as dependent variables in multiple linear regression analyses to construct the prediction models of the overall PVi, STi, and PTi in residential blocks.
First, to describe the quantitative relationship between variables more accurately, the curve estimation method was applied to fit multiple curve types to the selected morphological parameters with PVi, STi, and PTi. Then, the curvilinear relationship between variables was assessed based on the Sig. value. This study focused on four common curve models, including the linear model, the quadratic model, and the triadic model. To comprehensively consider the interaction between morphological parameters in the regression model and to pursue the optimal combination of morphological parameters that could explain the variation rule of solar performance indicators, we finally selected the statistically significant curve-fitting model between each morphological parameter and each solar energy performance indicator as the independent variable comprehensively applied to the regression analysis. The multiple linear regression stepwise method was used to conduct several iterations of regression analysis for different combinations of variables. Finally, the optimal variable combination was selected, and the prediction model was constructed. The regression equations of PVi, STi, and PTi for the total building envelope of the residential blocks are as follows:
PVi = 0.003·StH2 + 0.008·SC2 − 0.002·BO2 − 1.753·(V/A) + 67.923
STi = 0.001·MeH2 + 0.008·Sth2 + 0.01·SC2 + 0.01·BO2 − 1.742·(V/A) + 75.386
PTi = 0.204·MeH + 0.312·StH − 1.889·(V/A) + 27.432
The adjusted R2 of the multiple linear regression models for PVi, STi, and PTi were 0.776, 0.772, and 0.452, respectively, indicating that the models explained PVi and STi to a high degree. However, the goodness of fit of the regression model for PTi is relatively low. This is because, as studies have shown, PTi is mainly affected by the building envelope assemblies’ U-values and the building shape factor [71], while parameters such as the building density, floor area ratio, and building orientation have relatively little influence on it [72]. However, in this study, only the effect of block morphological parameters on solar technology is investigated, so the extent to which PTi is explained by morphological parameters is only 45.2%. The significant values (Sig.) of the regression models in the variance analysis were all less than 0.05, indicating that all the established regression models were statistically significant. The Sig. values in the t-test were all less than 0.05, indicating that the regression coefficients were all significant and there was a significant correlation between the independent and dependent variables. In addition, the independent variables’ variance inflation factor (VIF) values were all less than 10, suggesting no multicollinearity in any of the models.
Furthermore, according to the standardized regression coefficients, the V/A had the greatest influence on PVi, followed by the BO2 and the SC2, as shown in Table 8. For STi, the BO2 had the most significant positive influence, followed by the MeH2 and the StH2. STi decreased as the V/A grew. SC2 had little influence. PTi was negatively affected by the StH. Moreover, V/A and MeH had a large positive effect on PTi.
Table 8.
Results of the comprehensive analysis of multiple regression models for the PVi, STi, and PTi of building envelopes in residential blocks.
3.4. Relationship Between Residential Block Morphological Parameters and the Solar Availability of Each Building Envelope Surface
In this study, linear correlation analyses were carried out between six morphological parameters of the residential blocks, including MeH, StH, SC, and FAR, with the PVi, STi, and PTi of each building envelope surface. Table 9 shows the results of the correlation analyses. According to the definition of significant correlation, independent variables and dependent variables are significantly correlated when the significance value (Sig.) is less than 0.05. In addition, the correlation coefficient (r) indicates the intensity of closeness between the independent and dependent variables. The greater the absolute value of the correlation coefficient, the closer the relationship.
Table 9.
Correlation analysis results of the morphological parameters of urban residential blocks with the PVi, STi, and PTi of each building envelope surface of the buildings.
MeH, FAR, and V/A were all significantly negatively correlated with PVi and STi for the east, south, and west façades, and SC was significantly positively correlated with PVi and STi for the east, south, and west façades, suggesting that MeH, FAR, and V/A had an inhibitory effect on PVi and STi, while SC had a positive impact. The linear correlation of the other parameters with the PVi, STi and PTi of each façade or rooftop varied. StH has a significant correlation with the STi of each orientation façade and rooftop: specifically, it has a significant positive correlation with the STi of each orientation façade and a significant negative correlation with the STi of the rooftop. BO has significant correlations with the PVi and STi of the east, south and west façades, with the lowest degree of correlation for the south façade. It exhibits the opposite trend but with a higher degree of correlation for the east and west façades, which indicates that changes in BO have a stronger impact on the PVi and STi of the east and west façades.
In addition, the east façade PTi had a significant negative correlation with BO only. For the south façade PTi and the north façade STi, MeH, FAR, and V/A were significantly negatively correlated with them, while the opposite was true for StH and SC. FAR and V/A have an inhibitory effect on PTi on the west façade, but both have a minimal effect, and BO is significantly positively correlated with it and has a greater effect. In addition, there were fewer significant correlations between the parameters and the solar performance indicators of the rooftop: only StH was negatively correlated with the STi of the rooftop, and the effect was not significant.
The relationship between the values of the solar performance indicators and morphological parameters with significant correlations for each building envelope surface of the residential blocks was further analyzed utilizing box-and-line plots. The lines in the box are the medians; the top and bottom edges of the box represent the 75th and 25th percentiles of all values sorted from smallest to largest; and the top and bottom T-bars indicate the maximum and minimum, respectively.
In terms of the MeH, the median values of PVi, STi, and PTi of each building envelope surface show a decreasing trend with the increase in MeH, as shown in Figure 6. With the gradual rise in MeH in the range of 18.0–49.0 m, the PVi of the south façade is close to 100% with minimal change, and the decrease in the median value of the PVi of the east and west façades gradually decreases. Afterward, as MeH continues increasing, the median value of PVi is relatively stable, with the PVi of the south façade being about 90% and the PVi of the east and west façades fluctuating around 45%. With the gradual increase in MeH in the range of 18–90 m, the STi of the south façade is always basically maintained at 100%, and the median values of the STi of the east and west façades are slightly decreasing in the range of 96–99%. As MeH increases incrementally in the range of 18.0–39.0 m, the median STi value in the north façade decreases by about 15%. After that, as MeH continues increasing, the median STi value of the north façade flattens out to about 35%. As MeH increases gradually in the range of 18.0–49.0 m, the median PTi value of the south façade decreases gradually and finally stabilizes at about 55%.
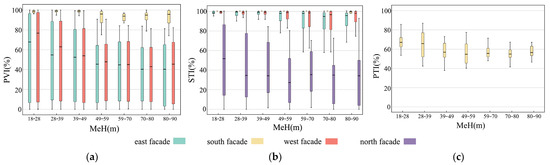
Figure 6.
The analysis results of the distribution interval between MeH and PVi, STi, PTi: (a) PVi; (b) STi; (c) PTi.
In terms of StH, the solar availability on the building façade is enhanced as the building heights within the residential blocks become more disparate from each other, as shown in Figure 7. When StH increases gradually in the range of 0–35 m, the median values of PVi and STi for the south façade tend to be close to 100%, and the median value of PTi for the south façade increases gradually in the range of about 55–85%. The STi of the east and west façades slightly increases, and then it reaches 100% and levels off when the StH is in the range of 22–35 m. In addition, the rooftop STi is always close to 100%, with the median rooftop STi slightly decreasing when StH gradually increases in the range of 27–35 m.
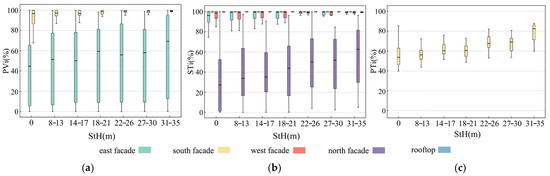
Figure 7.
The analysis results of the distribution interval between StH and PVi, STi, PTi: (a) PVi; (b) STi; (c) PTi.
In terms of SC, as SC increases gradually in the range of 11–31%, the PVi, STi, and PTi of each building envelope surface show a trend of first increasing and then decreasing, as shown in Figure 8. However, for different solar energy utilization technologies, when they reach the peak value, the SC value corresponding to different envelope surfaces is different. When SC is between 24% and 29%, the PVi on the south façade reaches its peak and approaches 100%. When SC gradually increases in the range of 11–29%, the median increase in PVi on the east and west façades gradually increases. Moreover, when SC is between 26% and 29%, the median PVi on the east and west façades reaches its peak at about 75%. The STi on the south façade is consistently around 100%. When SC is between 20% and 26%, the median values of STi on the east and west façades reach their peak and approach 100%. When SC is between 27% and 29%, the STi on the north façade reaches its peak, while the PTi on the south façade also reaches its peak, approaching 70%.
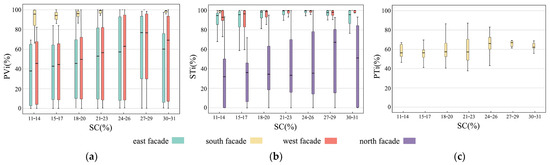
Figure 8.
The analysis results of the distribution interval between SC and PVi, STi, PTi: (a) PVi; (b) STi; (c) PTi.
In terms of FAR, as FAR increases, the median values of the PVi, STi, and PTi of each enclosure interface show a downward trend, as shown in Figure 9. When FAR gradually increases within the range of 1.4–2.6, the median PVi value on the south façade approaches 100% with minimal change, and the decrease in the median value of PVi in the east and west façades gradually increases. Afterwards, as FAR continues to increase, the decrease in the median PVi value of the south façade gradually increases, and the median PVi values of the east and west façades stabilize at around 45%. The median value of STi on the south façade remains around 100%, while the median values of STi on the east and west façades gradually decrease within the range of 90–100%. When FAR is 1.4–3.5, the median values of STi on the east and west façades approach 100% and show minimal variation. Although the median value of PTi on the southern façade fluctuates somewhat, it maintains a downward trend overall.
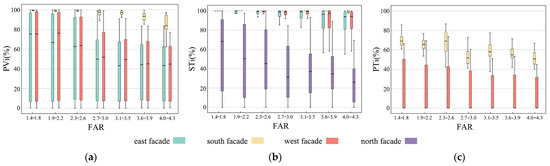
Figure 9.
The analysis results of the distribution interval between FAR and PVi, STi, PTi: (a) PVi; (b) STi; (c) PTi.
In terms of V/A, as V/A increases, the decline in the median PVi value on the south façade gradually increases, while the decline in the median PVi values on the east and west façades gradually decreases and eventually becomes stable, as shown in Figure 10. When V/A is 3.5–8.0, the south façade PVi is close to 100%. The decline in the east and west façades’ median STi value gradually increases, while the decline in the median STi value on the north façade gradually decreases and finally stabilizes. When V/A is 3.5–9.5, the median STi values of the east and west façades are close to 100%. The effect of V/A on PTi on the south and west façades is similar to that of FAR.
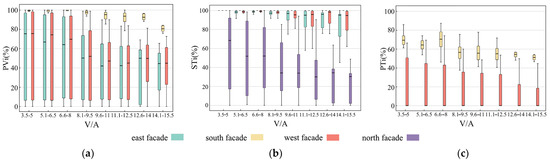
Figure 10.
The analysis results of the distribution interval between V/A and PVi, STi, PTi: (a) PVi; (b) STi; (c) PTi.
In terms of BO, in the process of the residential block rotating from south to east or south to west, the image presents an approximate mirror relationship; thus, this paper takes the block rotating from south to east as an example to analyze, as shown in Figure 11. When BO gradually increases in the range of 0–45°, the median PVi value of the south façade slightly decreases, the median PVi value of the west façade gradually increases, and the median PVi value of the east façade significantly decreases. When BO is 15–30°, the PVi value of the east façade decreases the most. The median STi values of the south and west façades are close to 100% as BO increases, and the change is minimal. When BO is between 30° and 45°, the STi value of the east façade decreases the most. When BO gradually increases in the range of 15–30°, the median value of Pti on the west façade rapidly increases by about 50%. After that, as BO continues to increase, the median value of Pti on the west façade shows an upward trend and finally approaches 60%.
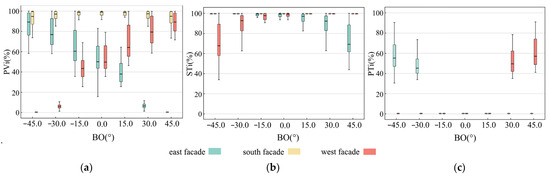
Figure 11.
The analysis results of the distribution interval between BO and PVi, STi, PTi: (a) PVi; (b) STi; (c) PTi.
4. Discussion
4.1. Effect of Residential Block Layout on Solar Availability
This study explored the relationship between five different layout types, namely, the multi-story determinant layout, the multi-story enclosed type, the multi-high-level mixed-row type, the high-rise row type, and the high-rise enclosed type, and the availability of active and passive solar technologies. Overall, the availability of active solar technologies in residential blocks was much higher than that of passive solar technology. For active solar technology, the multi-story enclosed type could receive maximum solar radiation on the southern, eastern, and western façades of the building due to its low MeH and FAR. This meant that the surface area of the envelope that met the solar radiation threshold of photovoltaic technology and solar thermal collector could reach up to 67% and 86.5%, respectively. This finding is consistent with the results of Zhang et al. [29], who found that the courtyard building cluster had the highest surface proportion meeting the radiance threshold, indicating that multi-story residential blocks had significant advantages in the installation of active solar technology [41]. Mahaya et al. [7] found that a multi-high-level mixed layout would result in lower buildings being shaded by taller buildings, thereby reducing the solar availability of the multi-high-level mixed block type. The results of this study showed that the active solar technologies with the multi-high-level mixed-row type had better availability, second only to the multi-story enclosed type; this was due to the different locations of the high-rise and multi-story buildings in this study and in the study conducted by Mahaya et al. The placement of the high-rise buildings on the north side could prevent the shading of the solar radiation received by the multi-story building envelope on the south side, thus improving the availability of active solar technologies. The utilization effect of active solar technology in the high-rise enclosed type was the worst because the buildings were shielded from each other in these high-rise enclosed blocks, which was not conducive to the surface of the building receiving solar radiation. Therefore, when conditions permit, a multi-story enclosed type or a multi-high-level mixed-row type with multi-story buildings on the south side and high-rise buildings on the north side should be used, so as to maximize the utilization availability of active solar technologies.
For residential blocks with different layout types, the availability of passive solar heating technology was slightly different from that of active solar technologies. Because the multi-high-level mixed-row type of high-rise buildings were on the north side and the multi-story buildings were on the south side, and the building spacing was reasonable, the passive solar heating technology had the best effect in winter, and the envelope surface area that met the solar radiation threshold of passive heating technology could reach 33.5%. The results of this study show that a reasonable layout type can effectively reduce the mutual occlusion between buildings, which also confirmed the conclusion of Tian et al. [41]. Passive solar heating technology was less effective in residential blocks of the multi-story enclosed type and high-rise enclosed type; Li et al. conducted a study [35] of solar availability in Nanjing, a temperate city in China; they also showed that the courtyard layout type received the least solar radiation in winter. This was due to the low solar height angle in winter. Moreover, the mutual shading of the buildings inside the enclosed layout blocks significantly affected the solar availability on the surface of the buildings. The above research findings can provide a reference for the evaluation of the active and passive solar utilization availability of the building envelopes of different layout types of residential blocks, so that solar energy technologies with higher utilization value can be incorporated in the design.
4.2. Effect of Residential Block Morphological Parameters on Solar Availability
4.2.1. Active Solar Availability
This study began by analyzing the photovoltaic technology system and the solar thermal collector system to investigate the relationship between each morphological parameter of the residential block and the active solar availability of each building envelope surface. Overall, each morphological parameter mainly affected the active solar availability of the blocks by influencing the solar radiation received on the east, south, and west façades of the buildings. Among these, the south façade had the highest active solar availability, with a slight difference between the east and west façades. With the variation in the morphological parameters, the trends of active solar availability were similar for the whole block and each building envelope surface. The solar radiation threshold was lower for solar thermal collector systems than for photovoltaic technology systems. Therefore, the solar thermal collector availability was generally higher than the photovoltaic technology availability. As a result, the north façade, which received less solar radiation due to the solar azimuth in the northern hemisphere, was not able to meet the requirements for photovoltaic power generation. Still, part of the area was able to meet the thresholds for solar thermal collectors. The study conducted by Tian et al. [41] similarly found that solar radiation on the north façade was below 500 kWh/y·m2 for photovoltaic technology, but some areas could be fitted with solar thermal collectors. Nearly 100% of the rooftop could be utilized for both photovoltaic technology and solar thermal collectors. This is because, in the case of the blocks analyzed in this study, the building heights followed the principle of a low south and high north arrangement, so that there was little or no shading of the rooftops or the shading area was negligible. Furthermore, the solar availability of rooftops was primarily influenced by climatic conditions [46].
MeH and StH characterize the morphology of the residential blocks in the vertical direction. MeH showed a significant negative correlation with the active solar availability in the whole blocks and the east, south, and west façades of the buildings, and the active solar availability at the building envelope surfaces decreased and then stabilized as the MeH increased. The solar radiation received by building surfaces is divided into three components: direct, diffuse, and reflected radiation. Mutual shading between buildings affects the intensity of direct radiation reaching the building envelope surfaces and, thus, the total solar radiation [73]. As the height of buildings in blocks increases, mutual shading between buildings increases, the total solar radiation reaching the building façade decreases, and the active solar availability decreases. When MeH reaches a particular value within a certain solar azimuth angle, the east and west façades are almost entirely covered by shadows. At this point, only more stable diffuse and ambient reflected radiation can reach the façade, while the active solar availability is stable.
The greater the StH, the greater the stochasticity of building height within the blocks. Our results showed that, with the increase in StH, the photovoltaic technology availability and solar thermal collector availability of the whole blocks and the east and south façades of the buildings gradually increased, while the solar thermal collector availability of the rooftops decreased significantly. Cheng et al. [74] found that the stochastic skyline model performs the best by comparing the solar availability of the three different forms of models: the uniform skyline, the pyramidal skyline, and the stochastic skyline. This finding was in line with the results of the present study. In London, which is at a similar latitude to Harbin, Chatzipoulka et al. [49] similarly confirmed a positive relationship between the StH and solar availability on building façades. However, by analyzing ten representative residential blocks in Algeria, Mahaya et al. [7] found that solar availability was highest when building heights were uniform. The results of their study differ from ours due to the complexity of the urban fabric of the Algerian region and the variety of building layouts and orientations of its selected blocks in the horizontal direction. Chatzipoulka et al. [49] used the standard deviation of the building footprint area to measure the uniformity of building distribution within the site and directionality to measure the horizontal permeability of the residential block; they further used a combination of the two as a variable to measure horizontal stochasticity. The results of the study showed that horizontal stochasticity had a detrimental effect on solar availability as compared to vertical stochasticity. Therefore, the study of vertical stochasticity and the solar availability of residential blocks conducted by Mahaya et al. [7] might have been more strongly disturbed by horizontal stochasticity, leading to discrepancies between their results and ours. In addition, the latitude of their research site was significantly different from ours. The difference in the solar altitude angle might similarly lead to significant variance in the results of the study. In addition, as StH increased, the height difference between buildings increased, resulting in the rooftops becoming more heavily covered by shadows. Therefore, the availability of solar thermal collectors on rooftops decreased.
SC describes the morphological characteristics of a block in the horizontal direction. With the lifting in SC, the active solar availability on the east, south, and west façades of a building increased and then decreased. Lee et al. [46] selected four settlement types in New York as the object of study, and, by varying their FAR, they finally constructed 32 generic settlement models. After simulating and analyzing them, they found that the SC had a significant negative correlation with the façade solar availability, a finding that differs from the results of this study. This is because the study conducted by Lee et al. used an idealized model, whereas this research used real blocks, and the relevant residential insolation distance standard ensured that there was sufficient space between buildings to obtain solar energy even in high-density areas. Moreover, there was a robust negative correlation between the SC and MeH modeled in this study, which meant that, as the SC increased, the MeH of the block decreased; meanwhile, the mutual shading between buildings decreased, and the solar availability rose. However, when SC increased to a specific value and the MeH diminished to a constant value, if the SC continued to increase, mutual shading between buildings would be more prominent, and the active solar availability in the blocks would decrease.
FAR is a three-dimensional description of block morphology. This study showed a significant negative correlation between the FAR and the active solar availability, both for the whole residential block and for the east, south, and west façades of the building. In addition, the availability of photovoltaic technology and solar thermal collector of each building envelope surface decreased and then stabilized as the volume ratio increased. Many previous studies have reached similar conclusions [7,29,49,66]. In addition, this research also found that FAR had a more significant impact on the whole block and the photovoltaic technology and solar thermal collector availability for each building envelope surface, compared to SC. In the study conducted by Lee et al. [46], it was noted that SC negatively affected façade solar thermal collector availability, and the effect of FAR was higher than that of SC; this finding is in line with our results. Morganti et al. [58] found by studying 16 blocks in Geneva that, for façade PVi, SC has a greater impact than FAR. The results of this study differ from ours because, although the latitude of Geneva is similar to that of Harbin, there are significant differences in the settlement patterns of the two regions. In addition, drawing on our findings, in order to increase the availability of photovoltaic technology and solar thermal collectors, priority should be given to reducing FAR. When the FAR cannot be altered, the solar availability on the façade of the residential blocks can be increased by moderately increasing SC and, at the same time, decreasing MeH.
The V/A was negatively correlated with the active solar availability of the entire residential blocks and the east, south, and west façades of the buildings, in the sense that, the larger the volume of the building in a given site, the less solar radiation would reach the surface of the building. Similar results have been derived from previous studies [7,58,66]. There was a significant correlation between BO and active solar availability on the east, south, and west façades of the building. In addition, the BO can be controlled between 15° south by west and 15° south by east for the overall high availability of photovoltaic technology for the façade. The blocks could be orientated between 30° south by west and 30° south by east to achieve high solar thermal collector technology availability on the façade.
4.2.2. Passive Thermal Heating Availability
Although the thresholds for passive solar technology are smaller than those for active solar technologies, the heating season is the season with the lowest solar radiation intensity and solar altitude angle of the year, resulting in the overall passive solar availability in residential blocks being significantly lower than the active solar availability. In addition, the lower solar radiation intensity and solar altitude angle also result in the unavailability of passive solar technology on the rooftops. After studying the passive solar availability of a cluster of residential buildings in Austria located at a similar latitude to Harbin, Lee et al. [46] found that passive solar utilization was not possible on these roofs. However, in the cluster of residential blocks in the Algerian region studied by Mahaya et al. [7], the rooftops were one of the main contributors to passive solar energy due to the low latitude.
The morphological parameters were mainly significantly related to passive solar availability on the south façades, with a similar mechanism of influence as for active solar availability. The change in BO had no significant effect on passive solar availability on the south façades of the buildings; a similar finding was produced by Li et al. in their study of the Beijing area [75]. However, BO was significantly associated with passive solar availability on the east and west façades of the buildings. When BO was between 15° south by west and 15° south by east, the east and west façades were mainly affected by direct sunlight in the morning and evening, but the intensity of solar radiation and the solar altitude angle are low at this time, so the east and west façades could not be utilized for passive thermal heating technology. When BO was greater than 15° south by west and 15° south by east, the availability of passive thermal heating technology on the east and west façades rose rapidly, respectively. Therefore, when the block orientation is greater than 15° south by west and 15° south by east, passive thermal heating technology can be utilized on the east and south façades and the west and south façades, respectively, thereby maximizing the availability of passive heating technology.
4.3. Design Strategy
Based on the above research results, we propose the following design strategies for residential morphological parameters and layout types.
For multi-story blocks (MeH ≤ 18 m), controlling the SC at 25–27%, the FAR at 1.35–1.63, and the V/A at less than 4.9 is recommended. Multi-story blocks should adopt an enclosed type to maximize the potential for photovoltaic and solar thermal collectors. At the same time, when the BO is controlled between 15° south by west to 15° south by east, the overall photovoltaic potential of the building façade is high; when the BO is controlled between 45° south by west to 15° south by west or 15° south by west to 15° south by east, the overall solar thermal collector potential of the east and south façades or the west and south façades can be high.
For medium- and high-rise blocks (18 m < MeH ≤ 27 m), controlling the FAR between 1.95 and 2.18 is recommended, the SC should be increased as much as possible, and V/A should be kept at around 5.8. In addition, it is advisable to adopt a multi-high-level mixed-row type. At the same time, when the BO is controlled between 30° south by west and 15° south by west or between 15° south by east and 30° south by east, the east and south façades or the west and south façades can obtain higher photovoltaic potential; when the BO is controlled between 45° south by west and 15° south by west or 15° south by east and 45° south by east, the east façade or the west façade can be used together with the south façade for solar thermal technology.
For high-rise residential areas (MeH > 27 m), it is recommended to control the SC at 21–24% while reducing the volume ratio and V/A as much as possible, and the StH should be controlled below 26 m. In addition, high-rise residential areas should adopt a row type. At the same time, when the BO is controlled between 15° south by west and 15° south by east, the overall photovoltaic potential of the building façade is relatively high; when the BO is controlled between 30° south by west and 30° south by east, the overall solar thermal potential of the building façade is relatively high.
In addition, photovoltaic, solar thermal, and passive heating technologies can all be used on the south façades of residential blocks, and the south façades have the highest solar energy availability. The solar thermal technology availability on the east and west façades is high and can be fully developed, but the availability of photovoltaic technology on the east and west façades is moderate. Only solar thermal technology can be used on the north façades. In addition, roofs are highly suitable for the use of photovoltaic and solar thermal technologies, but they are not suitable for passive heating technology.
According to statistics, about 80% of PV systems are currently installed on rooftops, while the remaining 20% of PV systems are used on building façades [5,76]. Since the energy provided by roof-mounted PV systems is only sufficient for zero-energy buildings of three stories and below [77], and as urbanization accelerates and the population increases dramatically, urban buildings are tending to become high-rise buildings, there is an urgent need to develop the PV potential of building façades to realize zero-energy buildings. Solar thermal technology had an early start and has rapidly developed in the field of supplying buildings with hot water. However, the installation of solar thermal systems in the early days was almost always restricted to roofs [78], and solar thermal resources on building façades did not receive much attention until recently. The GB 50364-2018 standard [79] proposes that solar water heating systems are suitable for installation on south-facing building façades, but this may conflict with the installation locations of photovoltaic systems; in this case, trade-offs should be made according to the principle of maximizing the use of solar energy resources. For power generation using hydro, wind and other renewable resources in more developed areas, or for thermal energy demand, it is suitable to install more solar thermal systems on south façades; the east façades and the west façades can be used for photovoltaic systems. In areas with lower thermal energy demand, solar photovoltaic technology can be utilized more on the south façades and solar thermal technology can be fully utilized on the east and west façades [78]. This study provides a theoretical foundation and scientific basis for maximizing the use of solar energy by optimizing block morphology and selecting appropriate solar technologies [80].
4.4. Limitations and Future Studies
Regarding the limitations of this study, it should first be noted that the research site is Harbin, and a limited number of typical residential block cases were selected for analysis, so the results of this study may struggle to provide a reference for areas that differ significantly from Harbin in terms of their climate or block layout types. In the simulation process, this study only considered the relationship between the spatial morphology of building clusters and the availability of solar energy; it simplified the block sample models, and ignored other spatial components, affecting the results’ authenticity. In addition, building energy efficiency needs to be assessed in a comprehensive manner that incorporates energy gain and loss [81,82]. The conclusions and recommendations of this study were intended only to enhance solar availability at the surface. They were not intended as a strategy to improve the energy efficiency of blocks. The mechanisms by which urban morphology affects building energy consumption are more complex. In the case of V/A, for example, although there was a significant negative correlation with solar availability in residential blocks, a decrease in V/A also implied an increase in the area of the building envelope, and the energy consumption of the building tended to increase. Therefore, in the future, the research site will be expanded to other climate zones, the number of residential block study cases will be increased, and the information about the types of background climatic conditions and block layout types will be supplemented. At the same time, in the future, more spatial components of the blocks will be considered in the solar availability study, such as building surface components, the shape and size of residential block sites, and greening; this will improve the influencing factors and improve the accuracy and scientific value of the research results. In addition, a comprehensive study will be conducted in conjunction with the energy consumption of buildings and other related content to develop more comprehensive design recommendations.
Due to the long and cold winters in severely cold regions, future studies should consider the matter of how to improve the performance stability and solar energy collection efficiency of solar energy equipment in low-temperature environments through urban and architectural design. In addition, to better realize solar building integration, it is necessary to consider how to realize the perfect integration of solar equipment and buildings without affecting the esthetics and structural safety of the buildings.
5. Conclusions
This study took Harbin as an example to quantitatively study the impact on the solar availability of residential block layout types and morphological parameters in high-density cities in severely cold regions; it did so by conducting numerical simulations and statistical analysis. This study can provide a reference for the optimization of urban block form design and provide a theoretical basis for enhancing urban solar energy use and energy conservation. The conclusions are as follows.
(1) Roof PVi and STi mean values are the highest and close to 100%. The mean values of PVi, Sti, and PTi for the south façade are 96%, 100%, and 60%, respectively, making it more suitable for photovoltaic and solar thermal technologies. The mean values of PVi, STi and PTi for the east and west façades are similar, at about 48%, 93%, and 13%, respectively; thus, the east and west façades are more suitable for photovoltaic and solar thermal technologies. The north façade can only use solar thermal technology with an average STi value of 39%.
(2) The highest PVi and Sti values are found in residential blocks of the multi-story enclosed type, with an average of up to 64% and 83% of the available area, respectively. The highest PTi is found in residential blocks of the multi-high-level mixed-row type, with an average of up to 27% of the available area.
(3) For active solar technologies, PVi and STi are significantly negatively correlated with V/A, FAR, and MeH and significantly positively correlated with StH and SC. For passive solar technologies, PTi only shows significant positive and negative correlations with StH and FAR, respectively.
(4) The multiple regression model based on block morphology parameters was able to predict PVi (R2 = 0.776) and STi (R2 = 0.772) for the settlement as a whole relatively well, with a relatively poor fit for PTi (R2 = 0.452).
(5) For active solar technologies, PVi and STi for the east and south façades and STi for the west and north façades were significantly negatively correlated with MeH, FAR, and V/A, and they were significantly positively correlated with StH. The highest PV technology availability was found on the south, east, and west façades of the building when SC was controlled between 27% and 29%, and the best utilization of solar and thermal technologies was found when it was controlled between 24% and 26%. BO PVi and STi were higher overall on the south, east, and west façades when controlled between 15° south by west and 15° south by east. The roof STi showed only a significant weak negative correlation with the StH.
(6) For passive solar technology, PTi on the south façade was significantly negatively correlated with the V/A, FAR, and MeH and significantly positively correlated with the StH and SC. When the BO is greater than 15° south by west and 15° south by east, the east and south façades or west and south façades can work together for passive heating technologies
In order to realize the efficient use of urban solar energy resources, future research will supplement the influencing factors and improve the influencing mechanism. Comprehensive research will be conducted on the combination of solar energy availability and building energy consumption, to improve the scientific validity of the results of the research and their reference value. At the same time, we will consider the integrated design of solar energy buildings in the light of regional climatic peculiarities, to ensure the stability of the performance of solar energy equipment and improve the efficiency of the equipment without affecting the esthetics and structural safety of the buildings. This will assist in realizing the perfect integration of solar energy technology and urban and architectural design.
Author Contributions
Z.L. and Y.F. contributed to the paper equally and should be regarded as co-first authors. Z.L.: Writing—original draft, review and editing, Investigation, Resources, Methodology, Supervision, Project administration, Funding acquisition, Conceptualization. Y.F.: Writing—original draft, Visualization, Methodology, Resources, Investigation, Formal analysis, Data curation, Conceptualization. Y.J.: Writing—original draft, Visualization, Methodology, Investigation, Formal analysis, Data curation, Conceptualization. M.K.: Writing—Visualization, Methodology, Investigation, Data curation, Conceptualization. R.Y.: Writing—Visualization, Investigation, Data curation, Conceptualization. Y.C.: Writing—Visualization, Investigation, Data curation, Conceptualization. All authors have read and agreed to the published version of the manuscript.
Funding
This work was funded by the Ministry of Education of Humanities and Social Science Project (Grant Number: 24YJCZH192), the Liaoning Provincial Natural Science Foundation Joint Fund Project (Grant Number: 2023-MSBA-094), the National Training Program of Innovation and Entrepreneurship for Undergraduates (Grant Number: 240255), the China Postdoctoral Science Foundation (Grant Number: 2024T171159), the Heilongjiang Postdoctoral Financial Assistance (Grant Number: LBH-Z23196), and the Heilongjiang Province Key Research and Development Plan Project (Grant Number: 2022ZX01A33).
Data Availability Statement
Data will be made available on request.
Conflicts of Interest
Zheming Liuis employed by The Architectural Design and Research Institute of HIT Co., Ltd. The authors declare that they have no known competing financial interests or personal relationships that could have appeared to influence the work reported in this paper.
Appendix A
Illustration of the case studies modeled in this research and images of the residential blocks from Google Earth.
 |
 |
 |
 |
References
- Alsema, E.A.; Anink, D.; Meijer, A.; Straub, A.; Donze, G. Integration of energy and material performance of buildings: I= E+ M. Energy Procedia 2016, 96, 517–528. [Google Scholar] [CrossRef]
- Mirzabeigi, S.; Razkenari, M. Design optimization of urban typologies: A framework for evaluating building energy performance and outdoor thermal comfort. Sustain. Cities Soc. 2022, 76, 103515. [Google Scholar] [CrossRef]
- Elliott, D. Cities and Renewable Energy, 1st ed.; Routledge: Oxfordshire, UK, 2019; pp. 289–315. [Google Scholar]
- Abu, D. Renewable Capacity Statistics 2024, 1st ed.; International Renewable Energy Agency (IRENA): Abu Dhabi, United Arab Emirates, 2024. [Google Scholar]
- Maghrabie, H.M.; Elsaid, K.; Sayed, E.; Abdelkareem, M.A.; Wilberforce, T.; Olabi, A.G. Building-integrated photovoltaic/thermal (BIPVT) systems: Applications and challenges. Sustain. Energy Technol. Assess. 2021, 45, 101151. [Google Scholar] [CrossRef]
- IEA Energy Efficiency 2023. Available online: https://www.iea.org/reports/energy-efficiency-2023 (accessed on 22 February 2025).
- Mahaya, C.; Zemmouri, N.; Benharra, H.; Elnokaly, A. Solar access assessment in semi-arid urban context: An application study for ten urban forms of existing apartment buildings districts in Batna City, Algeria. Sustain. Cities Soc. 2022, 83, 103909. [Google Scholar] [CrossRef]
- Machete, R.; Falcão, A.P.; Gomes, M.G.; Rodrigues, A.M. The use of 3D GIS to analyse the influence of urban context on buildings’ solar energy potential. Energy Build. 2018, 177, 290–302. [Google Scholar] [CrossRef]
- Penman, J. Performance Evaluation of the Photovoltaic System. Ph.D. Thesis, University of Exeter, Exeter, UK, 6 February 2023. [Google Scholar]
- Wilson, G.M.; Al-Jassim, M.; Metzger, W.K.; Glunz, S.W.; Verlinden, P.; Xiong, G.; Mansfield, L.M.; Stanbery, B.J.; Zhu, K.; Yan, Y. The 2020 photovoltaic technologies roadmap. J. Phys. D Appl. Phys. 2020, 53, 493001. [Google Scholar] [CrossRef]
- Xiao, H.; Lai, W.; Chen, A.; Lai, S.; He, W.; Deng, X.; Zhang, C.; Ren, H. Application of photovoltaic and solar thermal technologies in buildings: A mini-review. Coatings 2024, 14, 257. [Google Scholar] [CrossRef]
- Khargotra, R.; Kumar, R.; Sharma, A.; Singh, T. Design and performance optimization of solar water heating system with perforated obstacle using hybrid multi-criteria decision-making approach. J. Energy Storage 2023, 63, 107099. [Google Scholar] [CrossRef]
- Veilleux, N.; Koo, J.; Rickerson, W.; Waggoner, E.; Curti, J. Solar Water Heating: A Strategic Planning Guide for Cities in Developing Countries; UNEP: Paris, France, 2015. [Google Scholar]
- Han, Y.; Pan, Y.; Zhao, T.; Sun, C. Evaluating Buildings’ Solar Energy Potential Concerning Urban Context Based on UAV Photogrammetry; Building Simulation 2019; IBPSA: Italy, Rome, 2019; Volume 16, pp. 3610–3617. [Google Scholar]
- Yu, Y.; Chou, J.; Xiao, Y.; Yang, L. Classification of building complex for the large-scale construction of distributed photovoltaics in urban buildings. Energy Build. 2023, 300, 113677. [Google Scholar] [CrossRef]
- Barman, A.; Islam, M.; Mannan, M.; Bhuian, M.B. Energy Payback Analysis of Building Integrated Photovoltaic of High-rise Buildings in Urban Areas. In Proceedings of the 2022 International Conference on Energy and Power Engineering (ICEPE), Dhaka, Bangladesh, 24–26 November 2022; IEEE: New York, NY, USA, 2022; pp. 1–5. [Google Scholar]
- Liu, C.; Zhang, S.; Chen, X.; Xu, W.; Wang, K. A comprehensive study of the potential and applicability of photovoltaic systems for zero carbon buildings in Hainan Province, China. Sol. Energy 2022, 238, 371–380. [Google Scholar] [CrossRef]
- Ohene, E.; Hsu, S.C.; Chan, A.P. Feasibility and retrofit guidelines towards net-zero energy buildings in tropical climates: A case of Ghana. Energy Build. 2022, 269, 112252. [Google Scholar] [CrossRef]
- Ahmadian, E.; Sodagar, B.; Mills, G.; Bingham, C. Correlation of urban built form, density and energy performance. In Proceedings of the CISBAT 2019-Climate Resilient Cities—Energy Efficiency & Renewables in the Digital Era, EPFL Lausanne, Switzerland, 4–6 September 2019; IOP: Bristol, UK, 2019; Volume 1343, p. 012005. [Google Scholar]
- Liu, K.; Xu, X.; Zhang, R.; Kong, L.; Wang, W.; Deng, W. Impact of urban form on building energy consumption and solar energy potential: A case study of residential blocks in Jianhu, China. Energy Build. 2023, 280, 112727. [Google Scholar] [CrossRef]
- Quan, S.J.; Wu, J.; Wang, Y.; Shi, Z.; Yang, T.; Yang, P.P. Urban form and building energy performance in Shanghai neighborhoods. Energy Procedia 2016, 88, 126–132. [Google Scholar] [CrossRef]
- Shi, Z.; Hsieh, S.; Sreepathi, B.K.; Fonseca, J.A.; Marechal, F.; Schlueter, A. Pilot studies on optimizing land use, building density and solar electricity generation in dense urban settings. In Proceedings of the 24th ISUF 2017-City and Territory in the Globalization Age, Valencià, Spain, 27–29 September 2017; pp. 641–648. [Google Scholar]
- Silva, M.; Oliveira, V.; Leal, V. Urban form and energy demand: A review of energy-relevant urban attributes. J. Plan. Lit. 2017, 32, 346–365. [Google Scholar] [CrossRef]
- Wu, P.; Liu, Y. Impact of urban form at the block scale on renewable energy application and building energy efficiency. Sustainability 2023, 15, 11062. [Google Scholar] [CrossRef]
- An, Y.; Chen, T.; Shi, L.; Heng, C.K.; Fan, J. Solar energy potential using GIS-based urban residential environmental data: A case study of Shenzhen, China. Sustain. Cities Soc. 2023, 93, 104547. [Google Scholar] [CrossRef]
- Xie, M.; Wang, M.; Zhong, H.; Li, X.; Li, B.; Mendis, T.; Xu, S. The impact of urban morphology on the building energy consumption and solar energy generation potential of university dormitory blocks. Sustain. Cities Soc. 2023, 96, 104644. [Google Scholar] [CrossRef]
- Zhu, R.; Wong, M.S.; You, L.; Santi, P.; Nichol, J.; Ho, H.C.; Lu, L.; Ratti, C. The effect of urban morphology on the solar capacity of three-dimensional cities. Renew. Energy 2020, 153, 1111–1126. [Google Scholar] [CrossRef]
- Xu, S.; Li, Z.; Zhang, C.; Huang, Z.; Tian, J.; Luo, Y.; Du, H. A method of calculating urban-scale solar potential by evaluating and quantifying the relationship between urban block typology and occlusion coefficient: A case study of Wuhan in Central China. Sustain. Cities Soc. 2021, 64, 102451. [Google Scholar] [CrossRef]
- Giostra, S.; Masera, G.; Monteiro, R. Solar Typologies: A Comparative Analysis of Urban Form and Solar Potential. Sustainability 2022, 14, 9023. [Google Scholar] [CrossRef]
- Zhao, K.; Gou, Z. Influence of urban morphology on facade solar potential in mixed-use neighborhoods: Block prototypes and design benchmark. Energy Build. 2023, 297, 113446. [Google Scholar] [CrossRef]
- Geng, X.T.; Xie, D.; Gou, Z.H. Optimizing urban block morphologies for net-zero energy cities: Exploring photovoltaic potential and urban design prototype. Build. Simul. 2024, 17, 607–624. [Google Scholar] [CrossRef]
- Lan, H.; Gou, Z.; Hou, C. Understanding the relationship between urban morphology and solar potential in mixed-use neighborhoods using machine learning algorithms. Sustain. Cities Soc. 2022, 87, 104225. [Google Scholar] [CrossRef]
- Loeffler, R.; Oesterreicher, D.; Stoeglehner, G. The energy implications of urban morphology from an urban planning perspective—A case study for a new urban development area in the city of Vienna. Energy Build. 2021, 252, 111453. [Google Scholar] [CrossRef]
- Veisi, O.; Shakibamanesh, A.; Rahbar, M. Using intelligent multi-objective optimization and artificial neural networking to achieve maximum solar radiation with minimum volume in the archetype urban block. Sustain. Cities Soc. 2022, 86, 104101. [Google Scholar] [CrossRef]
- Li, J.; Wang, Y.; Xia, Y. A novel geometric parameter to evaluate the effects of block form on solar radiation towards sustainable urban design. Sustain. Cities Soc. 2022, 84, 104001. [Google Scholar] [CrossRef]
- Shanmugavalli, K.R.; Vedamuthu, R. Solar energy and its estimated contribution to the energy demand of residential apartments in India through their envelopes: A technical and commercial approach. Energy Sources Part A Recovery Util. Environ. Eff. 2023, 45, 4398–4413. [Google Scholar] [CrossRef]
- Enongene, K.E.; Abanda, F.H.; Otene, I.J.; Obi, S.I.; Okafor, C. The potential of solar photovoltaic systems for residential homes in Lagos city of Nigeria. J. Environ. Manag. 2019, 244, 247–256. [Google Scholar] [CrossRef]
- Li, J.; Wang, Y.; Xia, Y.; Song, Y.; Xie, H. Optimization of urban block form by adding new volumes for capacity improvement and solar performance using a multi-objective genetic algorithm: A case study of Nanjing. Buildings 2022, 12, 1710. [Google Scholar] [CrossRef]
- Lu, M.; Zhang, Y.; Xing, J.; Ma, W. Assessing the solar radiation quantity of high-Rise Residential Areas in typical layout patterns: A case in North-East China. Buildings 2018, 8, 148. [Google Scholar] [CrossRef]
- Natanian, J.; Wortmann, T. Simplified evaluation metrics for generative energy-driven urban design: A morphological study of residential blocks in Tel Aviv. Energy Build. 2021, 240, 110916. [Google Scholar] [CrossRef]
- Tian, J.; Xu, S. A morphology-based evaluation on block-scale solar potential for residential area in central China. Sol. Energy 2021, 221, 332–347. [Google Scholar] [CrossRef]
- Xia, B.; Li, Z. Optimized methods for morphological design of mesoscale cities based on performance analysis: Taking the residential urban blocks as examples. Sustain. Cities Soc. 2021, 64, 102489. [Google Scholar] [CrossRef]
- Yuanqi, T.; Honghong, Z. A Review of Chinese and Western Cityscape Research. Planners 2018, 34, 77–85. [Google Scholar]
- Shareef, S. The impact of urban morphology and building’s height diversity on energy consumption at urban scale. The case study of Dubai. Build. Environ. 2021, 194, 107675. [Google Scholar] [CrossRef]
- Formolli, M.; Kleiven, T.; Lobaccaro, G. Assessing solar energy accessibility at high latitudes: A systematic review of urban spatial domains, metrics, and parameters. Renew. Sustain. Energy Rev. 2023, 177, 113231. [Google Scholar] [CrossRef]
- Lee, K.S.; Lee, J.W.; Lee, J.S. Feasibility study on the relation between housing density and solar accessibility and potential uses. Renew. Energy 2016, 85, 749–758. [Google Scholar] [CrossRef]
- Sattrup, P.A.; Strømann-Andersen, J. Building typologies in Northern European cities: Daylight, solar access, and building energy use. J. Archit. Plan. Res. 2013, 30, 56–76. [Google Scholar]
- Lobaccaro, G.; Carlucci, S.; Croce, S.; Paparella, R.; Finocchiaro, L. Boosting solar accessibility and potential of urban districts in the Nordic climate: A case study in Trondheim. Sol. Energy 2017, 149, 347–369. [Google Scholar]
- Chatzipoulka, C.; Compagnon, R.; Nikolopoulou, M. Urban geometry and solar availability on façades and ground of real urban forms: Using London as a case study. Sol. Energy 2016, 138, 53–66. [Google Scholar] [CrossRef]
- Merollari, J.; Dervishi, S. Analyzing the impact of urban morphology on solar potential for photovoltaic panels: A comparative study across various European climates. Sustain. Cities Soc. 2024, 115, 105854. [Google Scholar] [CrossRef]
- Liu, Z.; Jin, Y.; Jin, H. The effects of different space forms in residential areas on outdoor thermal comfort in severe cold regions of China. Int. J. Environ. Res. Public Health 2019, 16, 3960. [Google Scholar] [CrossRef]
- Adolphe, L. A simplified model of urban morphology: Application to an analysis of the environmental performance of cities. Environ. Plan. B Plan. Des. 2001, 28, 183–200. [Google Scholar] [CrossRef]
- Harbin Municipal People’s Government. Available online: https://www.harbin.gov.cn/ (accessed on 22 February 2025).
- Kubota, T.; Kono, K. Native Build System for Unity Builds with Sophisticated Bundle Strategies. IEICE Trans. Inf. Syst. 2021, 104, 126–137. [Google Scholar] [CrossRef]
- GB/T 37526-2019; Assessment Method for Solar Energy Resource. Standardization Administration of China: Beijing, China, 2019.
- GB 50176-2016; Code for Thermal Design of Civil Building. Beijing China Planning Publishing House: Beijing, China, 2016.
- JGJ 26-2018; Energy-Saving Design Standards for Residential Buildings in Severe Cold and Cold Regions. China Architecture & Building Press: Beijing, China, 2018.
- Morganti, M.; Salvati, A.; Coch, H.; Cecere, C. Urban morphology indicators for solar energy analysis. Energy Procedia 2017, 134, 807–814. [Google Scholar] [CrossRef]
- Jin, H.; Liu, Z.M.; Jin, Y.M.; Kang, J.; Liu, J. The Effects of Residential Area Building Layout on Outdoor Wind Environment at the Pedestrian Level in Severe Cold Regions of China. Sustainability 2017, 9, 2310. [Google Scholar] [CrossRef]
- DB23/T744-2004; Code for Compiling Regulatory Planning. Harbin Urban Planning and Design Institute: Harbin, China, 2004.
- Medgyasszay, P. Comparative analysis of an existing public building made from natural building materials and reference buildings designed from common building materials. Earth Environ. Sci. 2019, 323, 12140. [Google Scholar] [CrossRef]
- Wang, W.; Chen, J.Y. Investigation on correlation of energy consumption of multi-buildings on campus area. Energy Procedia 2019, 158, 3559–3564. [Google Scholar] [CrossRef]
- Yuan, J.; Farnham, C.; Emura, K. Inter-Building Effect and Its Relation with Highly Reflective Envelopes on Building Energy Use: Case Study for Cities of Japan. Atmosphere 2017, 8, 211. [Google Scholar] [CrossRef]
- Liu, Z.M. Optimization of Spatial Configurations of Urban Residential Areas Based on Thermal Environment and Energy Saving in Severe Cold Regions: Case Study of Harbin. Ph.D. Thesis, Harbin Institute of Technology, Harbin, China, 2020. [Google Scholar]
- Aghamolaei, R.; Ghaani, M.R.; Tahsildoost, M.; Zandi, M. A comprehensive energy-oriented approach for optimization of solar potential in urban contexts: An application study for residential districts. Adv. Build. Energy Res. 2019, 13, 205–219. [Google Scholar] [CrossRef]
- Mohajeri, N.; Upadhyay, G.; Gudmundsson, A.; Assouline, D.; Kaempf, J.; Scartezzini, J.-L. Effects of urban compactness on solar energy potential. Renew. Energy 2016, 93, 469–482. [Google Scholar] [CrossRef]
- Sadeghipour Roudsari, M.; Pak, M.; Viola, A. Ladybug: A parametric environmental plugin for grasshopper to help designers create an environmentally-conscious design. In Proceedings of the Building Simulation 2013: 13th Conference of IBPSA, Chambery, France, 26–28 August 2013; Volume 13, pp. 3128–3135. [Google Scholar]
- Xu, S.; Jiang, H.H.; Xiong, F.; Zhang, C.; Xie, M.J.; Li, Z.X. Evaluation for block-scale solar energy potential of industrial block and optimization of application strategies: A case study of Wuhan, China. Sustain. Cities Soc. 2021, 72, 103000. [Google Scholar] [CrossRef]
- Zhang, J.; Li, R.Y. Design and development of Building energy simulation Software for prefabricated cabin type of industrial building (PCES). In Proceedings of the 2018 4th International Conference on Energy Materials and Environment Engineering (ICEMEE 2018), E3S Web of Conferences 2018, Semarang, Indonesia, 14–15 August 2018; Maryono, H., Warsito, B., Eds.; EDP Sciences: Les Ulis, France, 2018; Volume 38, p. 03019. [Google Scholar]
- Zhang, L. Research on Layout and Form Optimization Design of University Students’ Apartments in Jinan Based on Solar Energy Utilization Potential. Ph.D. Thesis, Shandong Jianzhu University, Jinan, China, 2019. [Google Scholar]
- Luo, Q.; Qing, Y.; Fang, X.; Wang, H.; Sulala, A.H. Solution of integrated reflection for cities. Archit. Environ. Eng. 2015, 37, 7–11. [Google Scholar]
- Braulio-Gonzalo, M.; Bovea, M.D.; Ruá, M.J.; Juan, P. A methodology for predicting the energy performance and indoor thermal comfort of residential stocks on the neighbourhood and city scales—A case study in Spain. J. Clean. Prod. 2016, 139, 646–665. [Google Scholar] [CrossRef]
- Zhang, J.; Xu, L.; Shabunko, V.; Tay, S.; Sun, H.; Lau, S.; Reindl, T. Impact of urban block typology on building solar potential and energy use efficiency in tropical high-density city. Appl. Energy 2019, 240, 513–533. [Google Scholar] [CrossRef]
- Gholami, H.; Nils Rostvik, H. The Effect of Climate on the Solar Radiation Components on Building Skins and Building Integrated Photovoltaics (BIPV) Materials. Energies 2021, 14, 1847. [Google Scholar] [CrossRef]
- Chen, V.; Steemers, K.; Montavon, M.; Compagnon, R. Compact Cities in a sustainable manner. In Proceedings of the 2nd International Solar Cities Congress, Oxford, UK, 3–6 April 2006. [Google Scholar]
- Li, D.; Liu, G.; Liao, S. Solar potential in urban residential buildings. Sol. Energy 2015, 111, 225–235. [Google Scholar] [CrossRef]
- Wilson, R.; Young, A. The embodied energy payback period of photovoltaic installations applied to buildings in the U.K. Build. Environ. 1996, 31, 299–305. [Google Scholar] [CrossRef]
- Li, C. Feasibility Research on Realizing Net Zero Energy Consumption of Residential Buildings in Beijing. Ph.D. Thesis, Harbin Institute of Technology, Harbin, China, 2018. [Google Scholar]
- Yu, S.; Zhu, X.H.; Mai, Y.Q. The integration of solar thermal photovoltaic and multi-high-rise residential buildings. Eng. Technol. Res. 2023, 5, 280–288. [Google Scholar]
- GB 50364-2018; Technical Standard for Solar Water Heating System of Civil Buildings. China Architecture & Building Press: Beijing, China, 2018.
- Kang, Y.; Wu, J.; Liu, R.; He, L.; Yu, Z.; Yang, Y. Handshaking towards zero-concept analysis and technical measures of LEED zero-energy building in connection with technical standard of nearly zero-energy building in China. Energy Explor. Exploit. 2021, 39, 669–689. [Google Scholar] [CrossRef]
- Karteris, M.; Slini, T.; Papadopoulos, A.M. Urban solar energy potential in Greece: A statistical calculation model of suitable built roof areas for photovoltaics. Energy Build. 2013, 62, 459–468. [Google Scholar] [CrossRef]
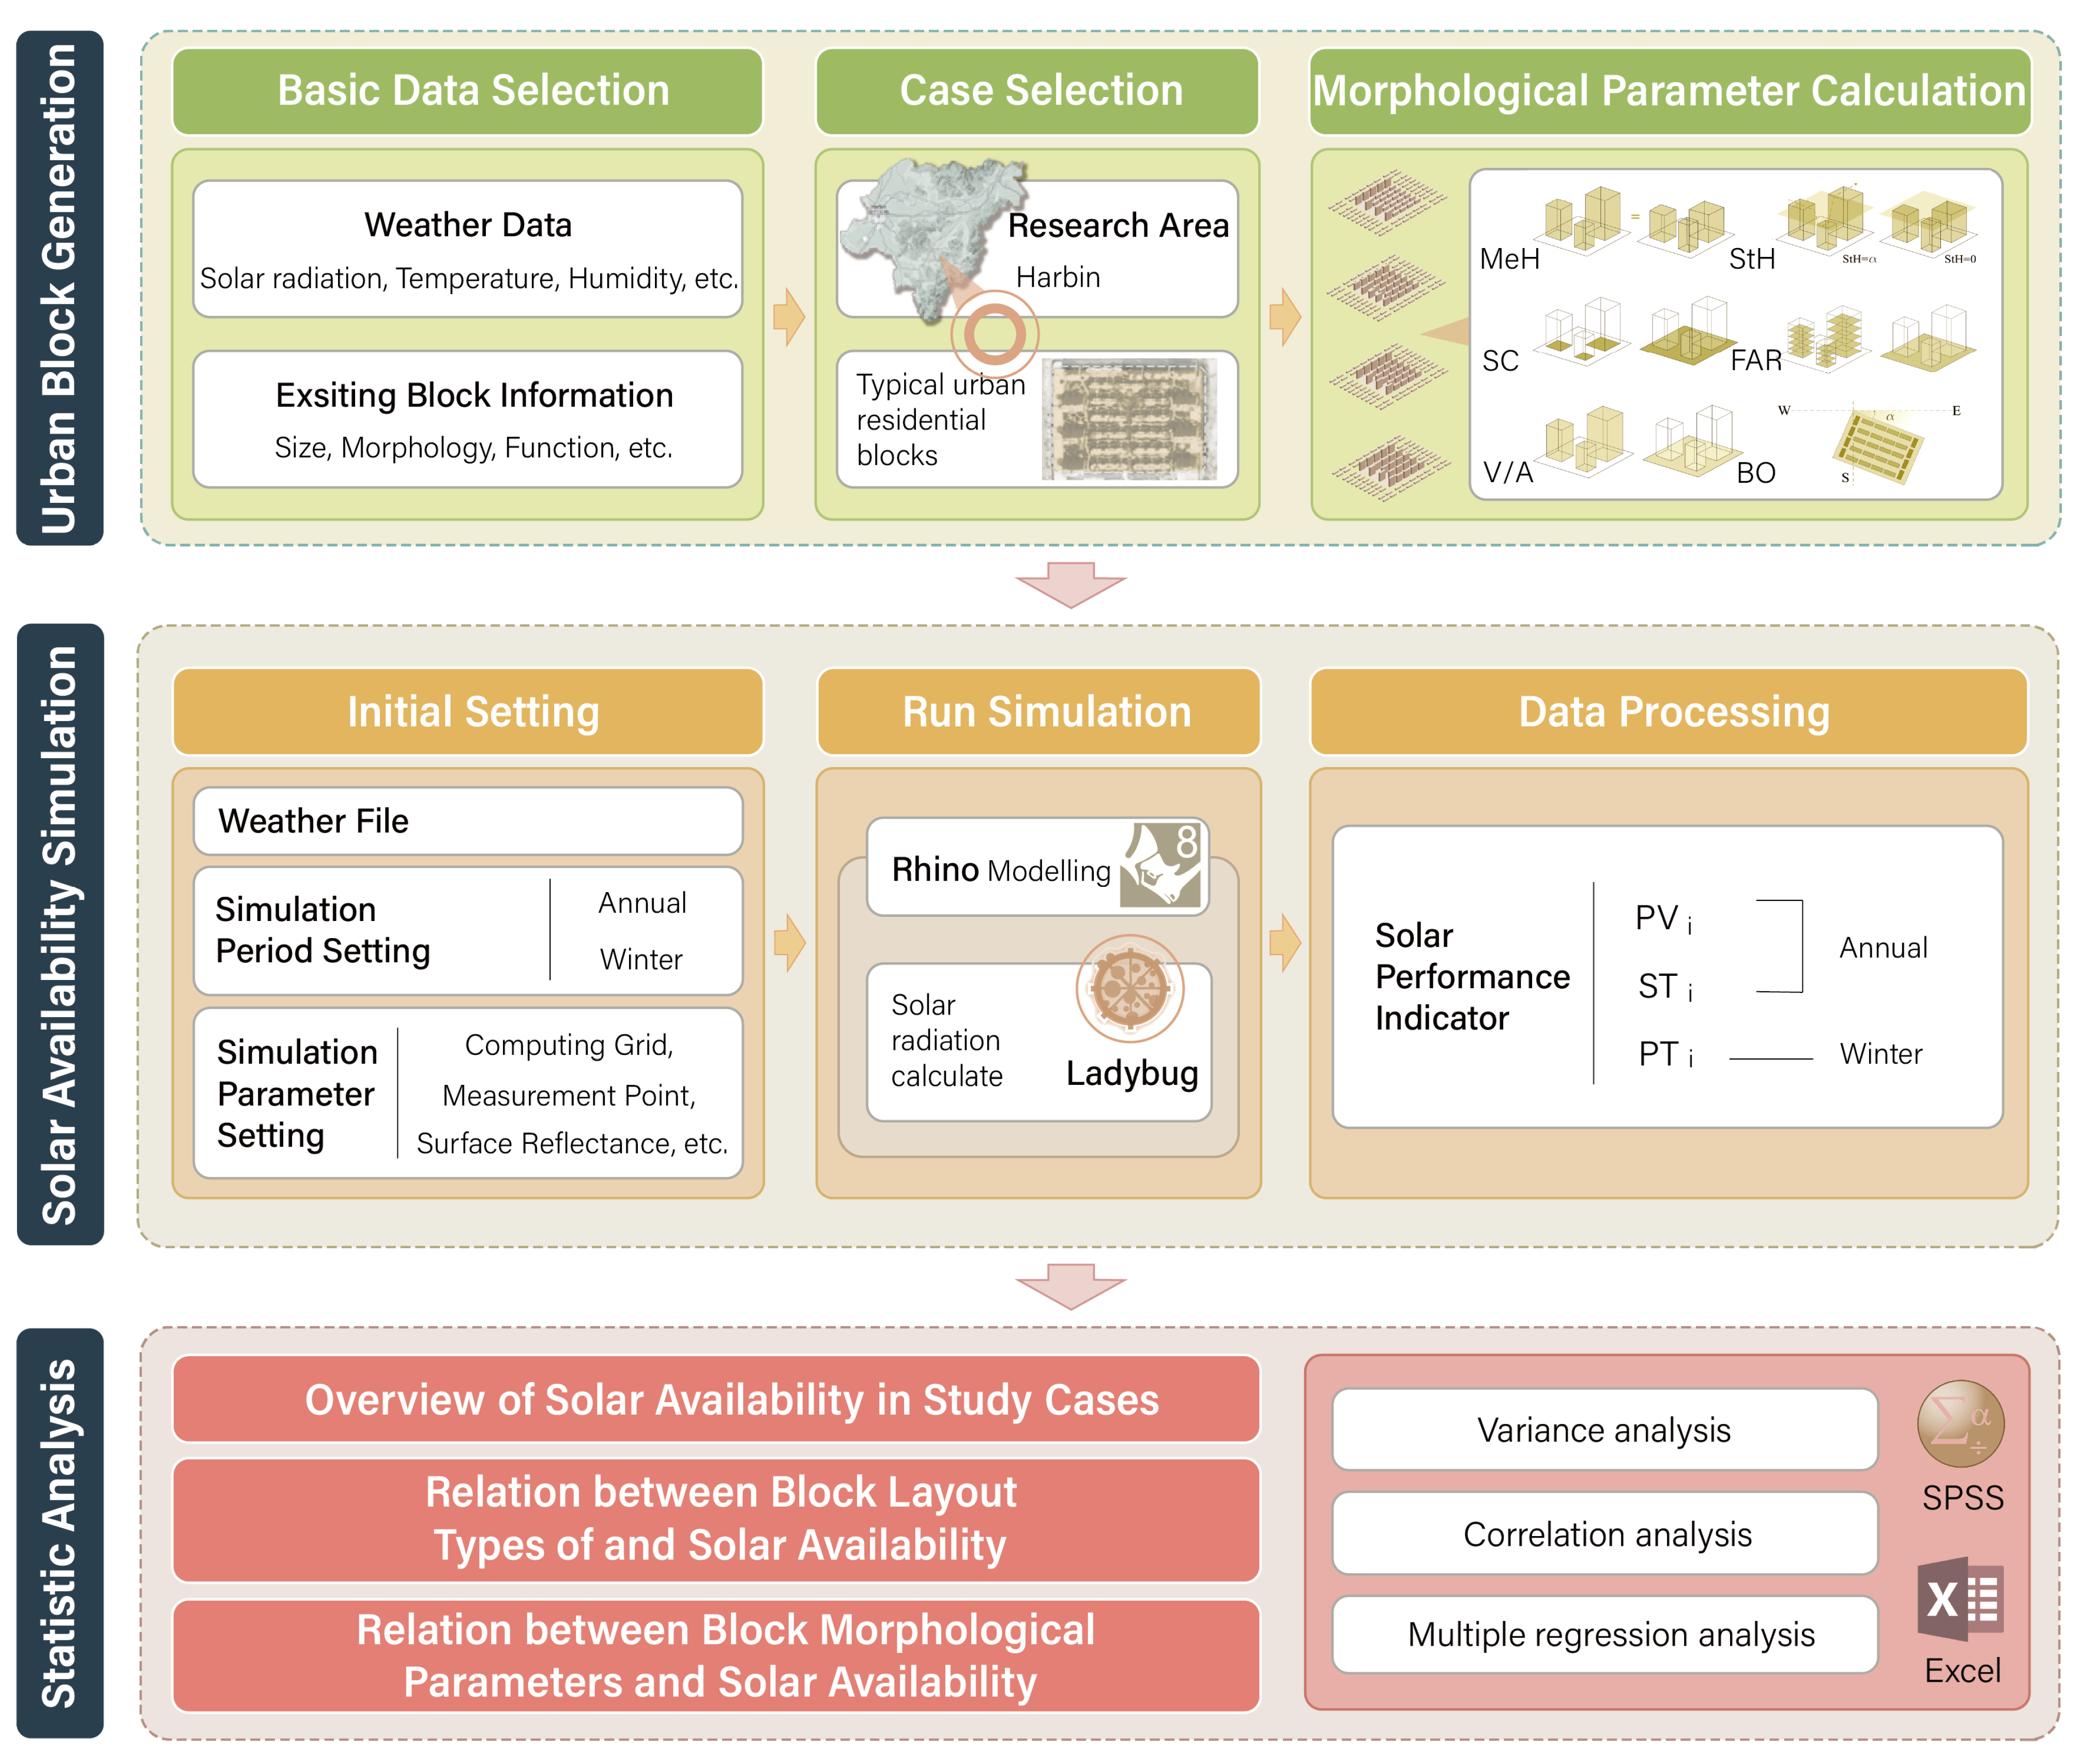
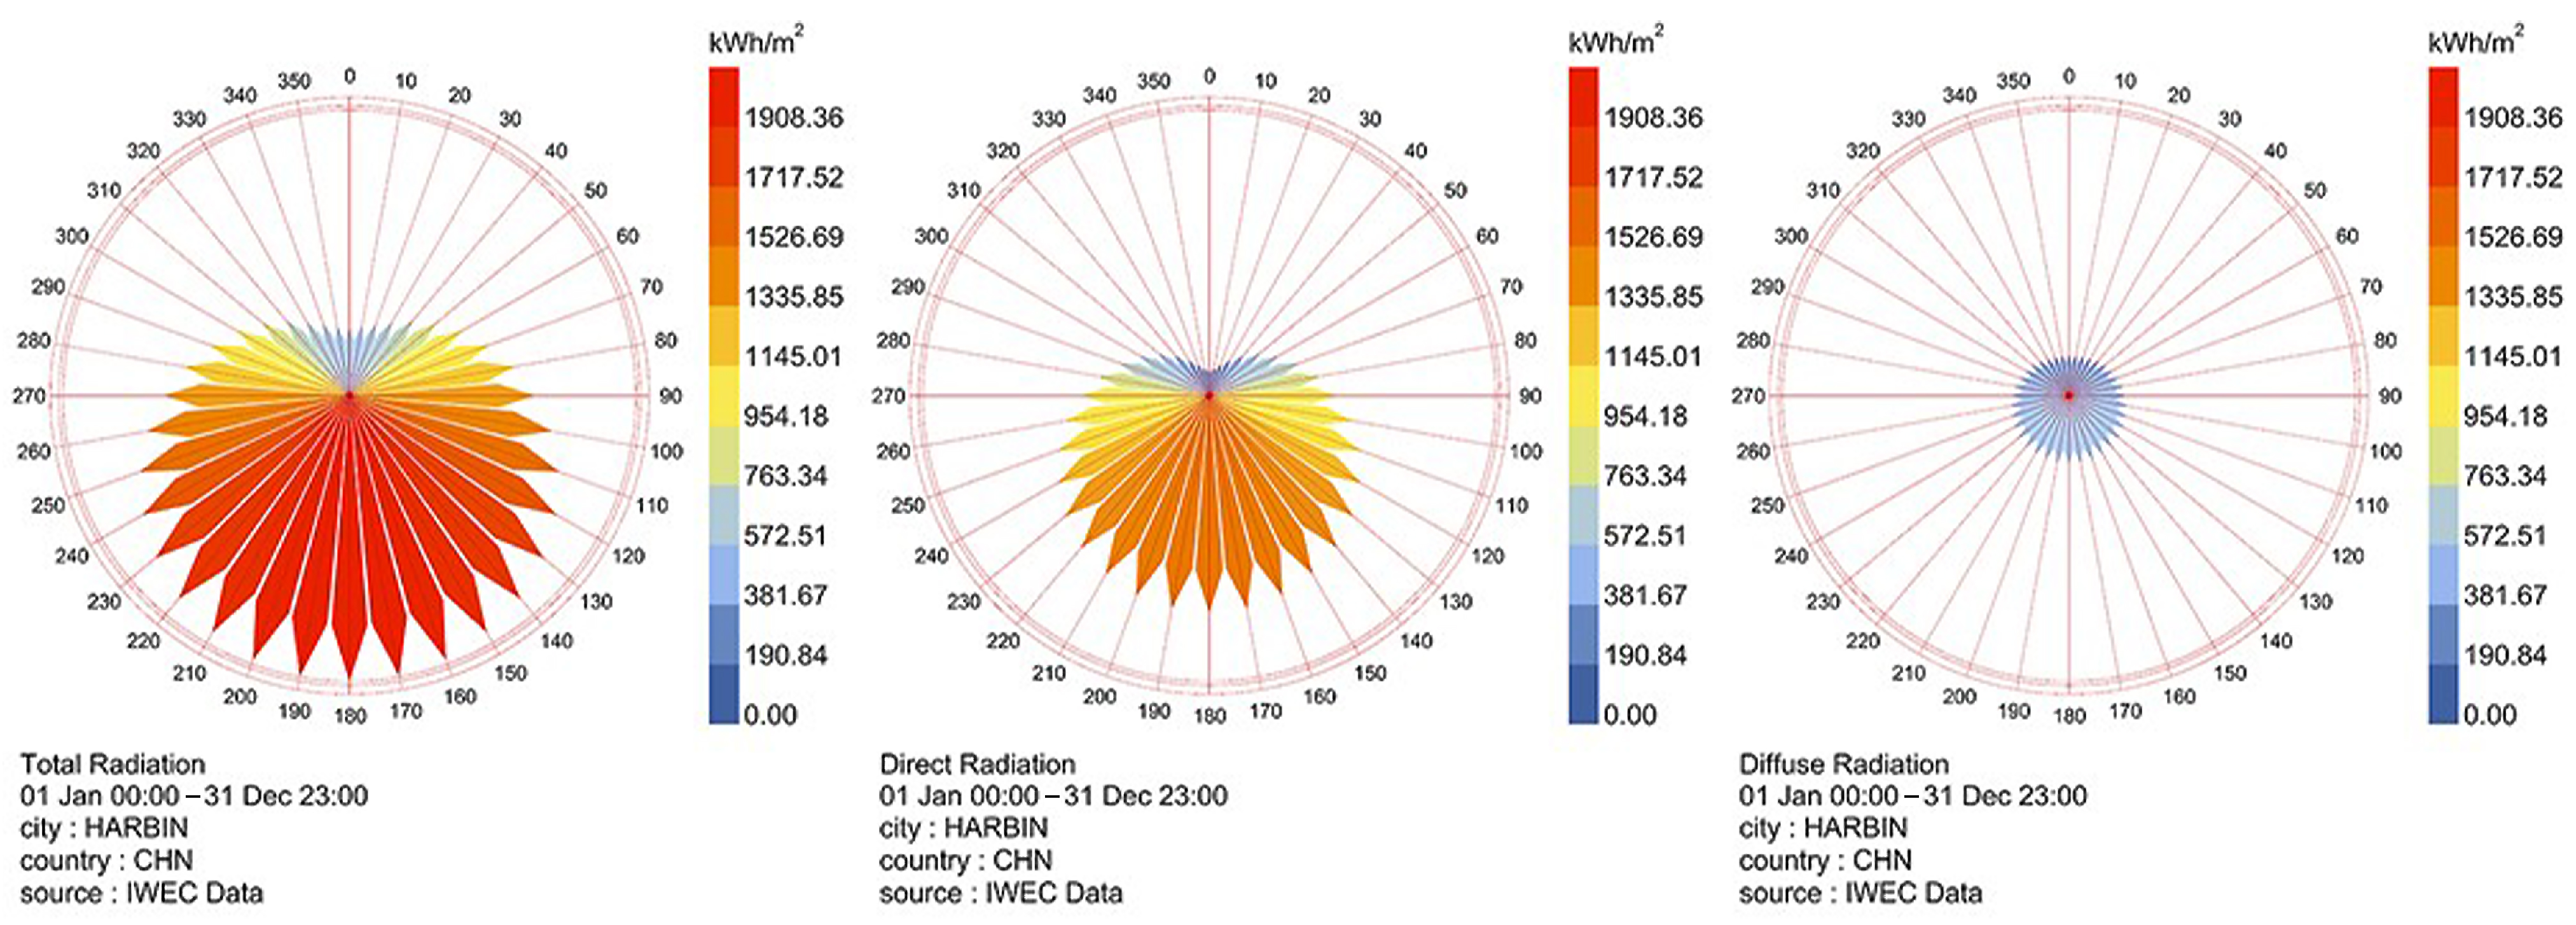

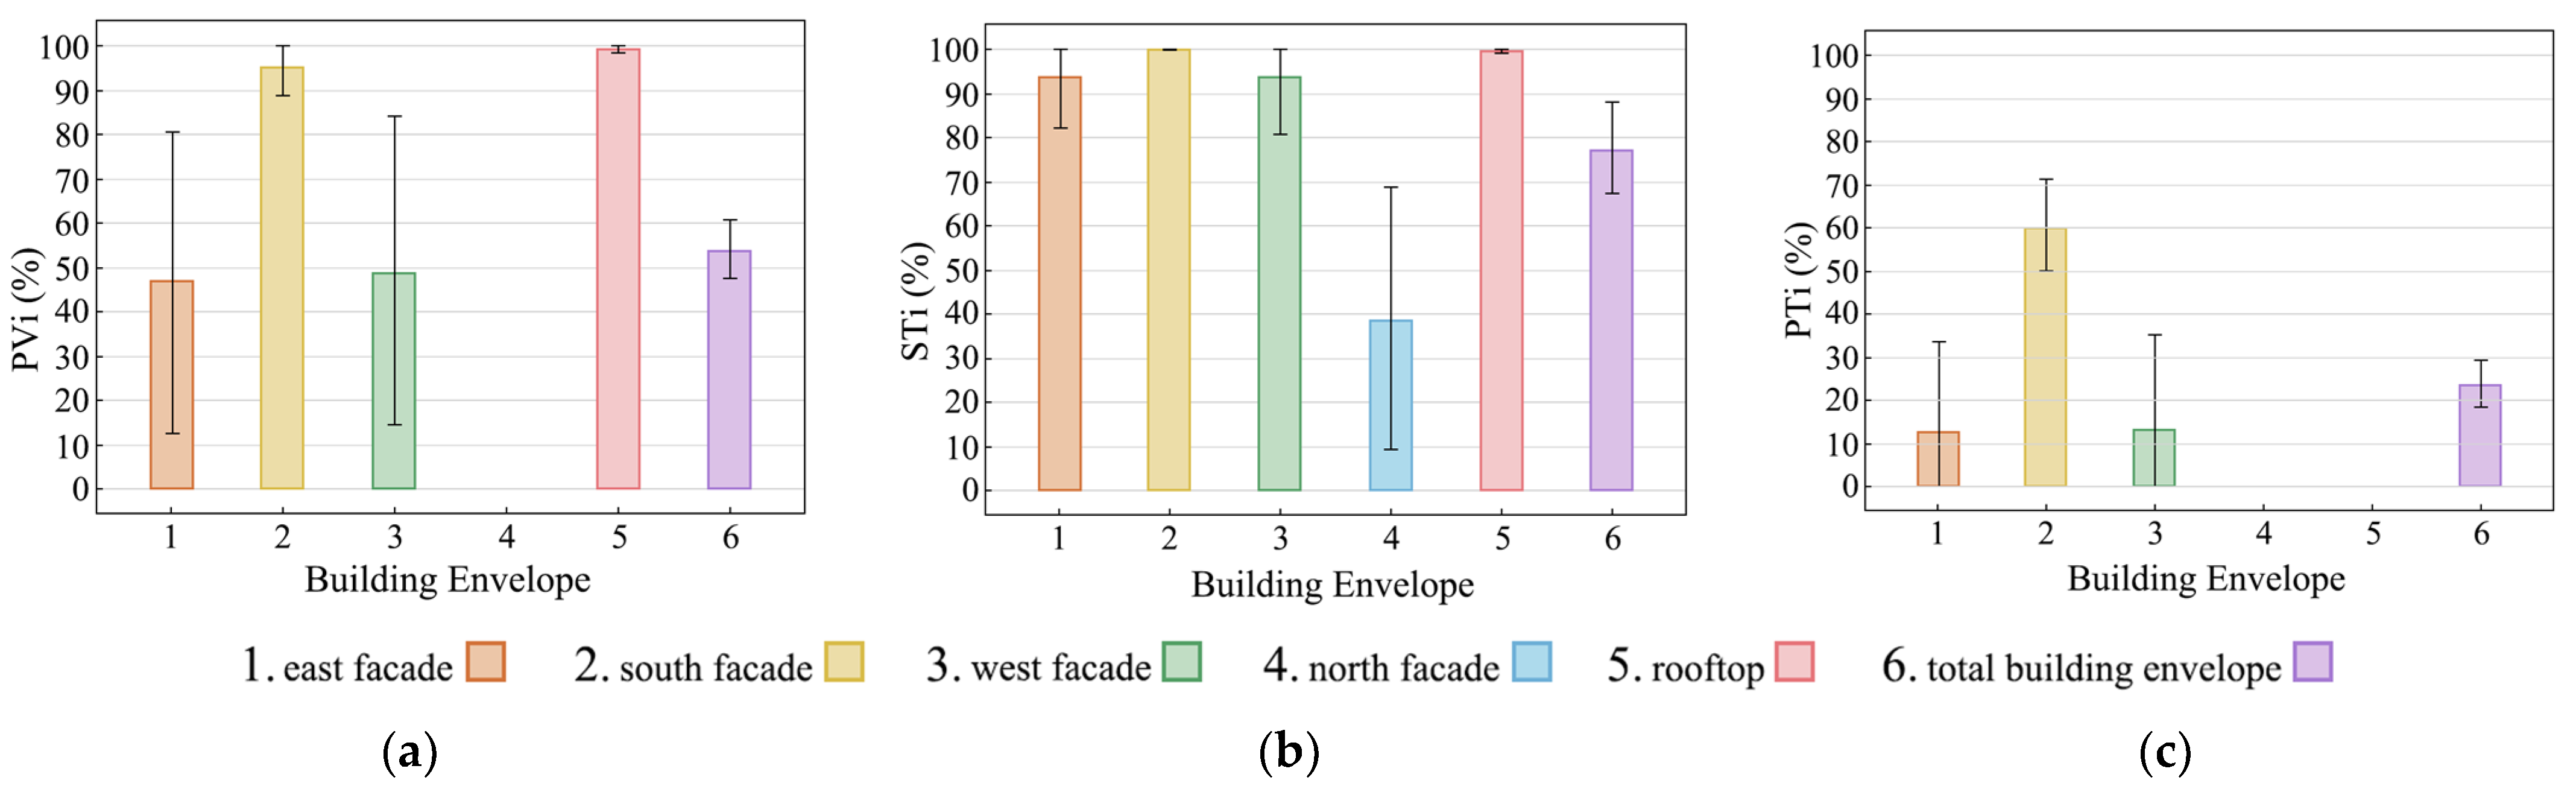
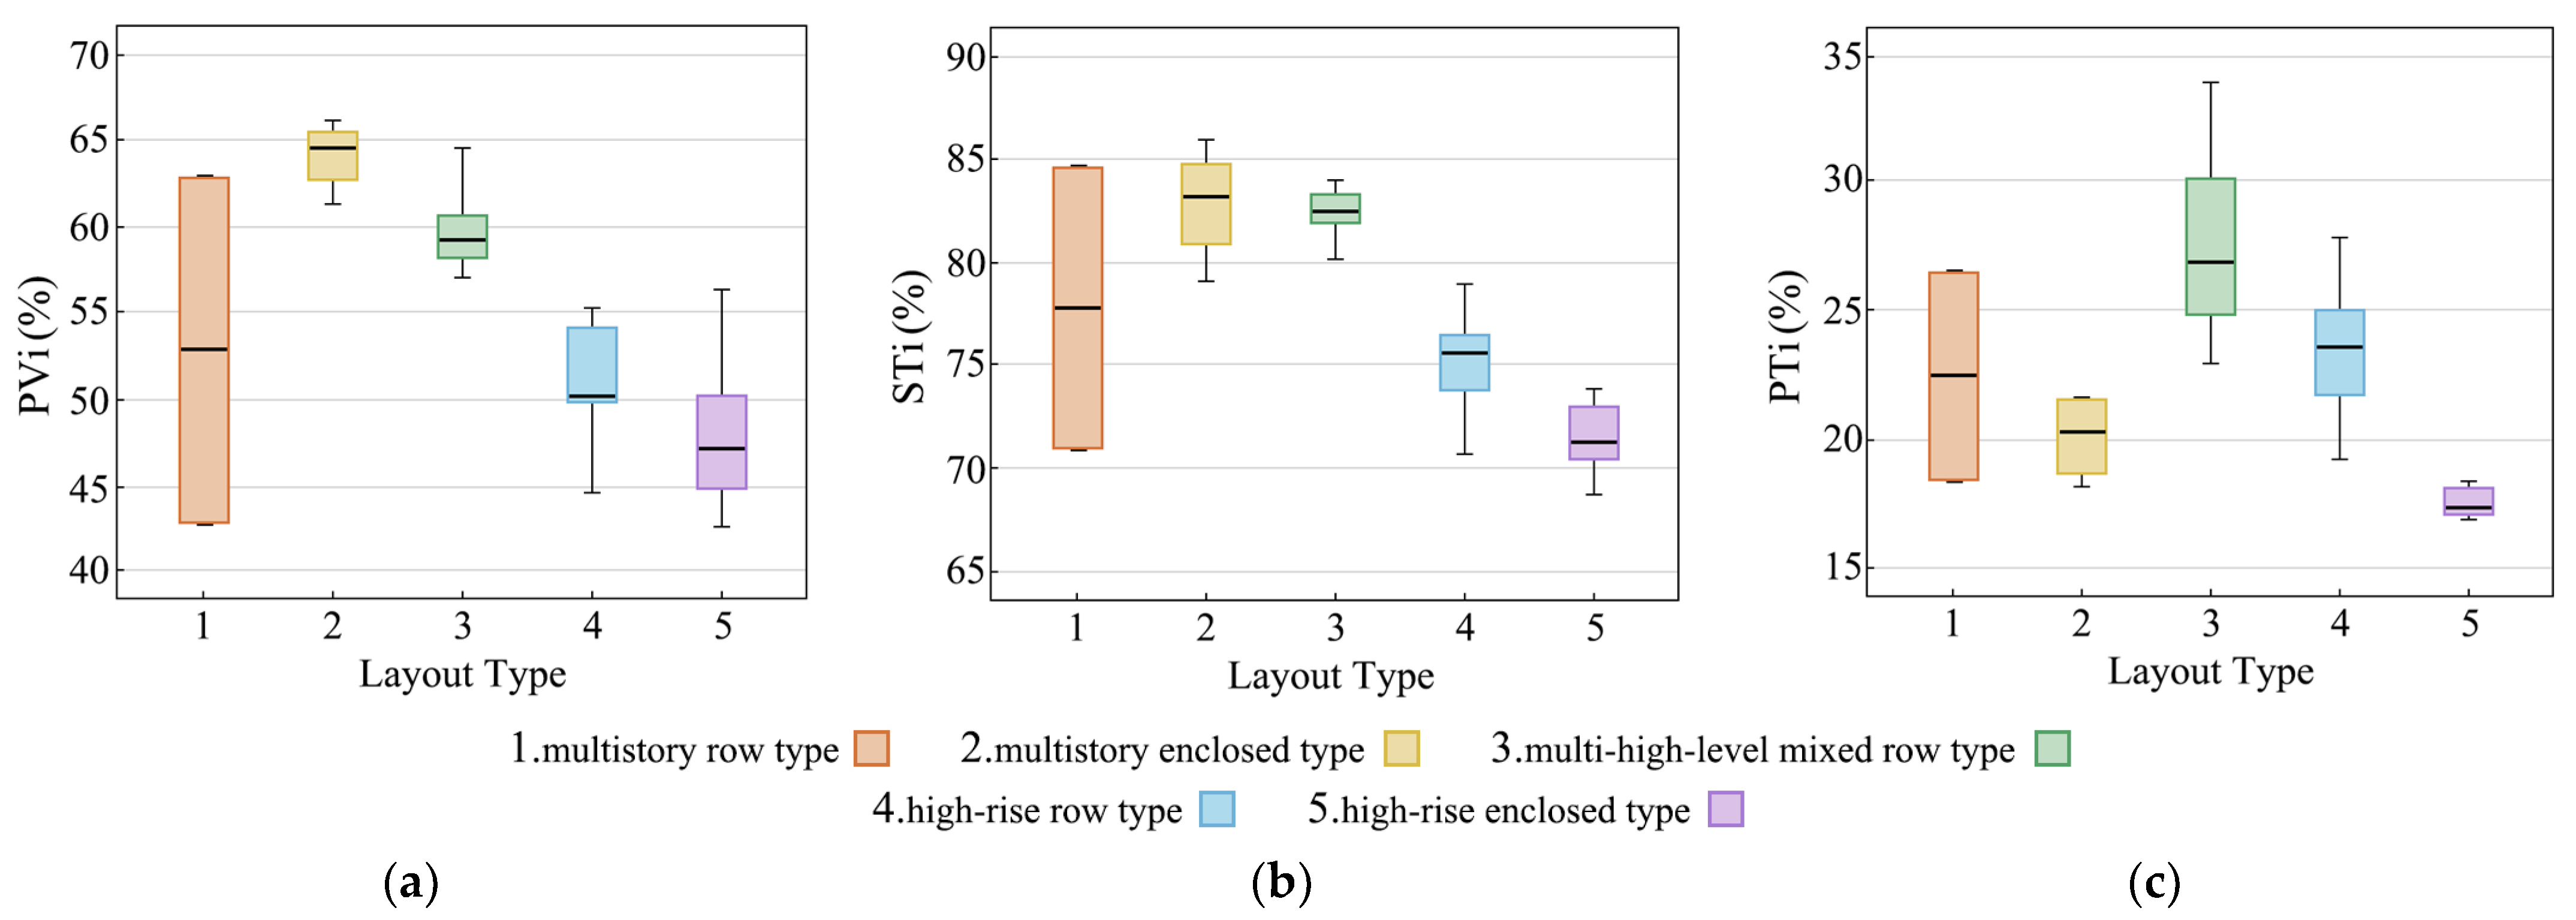
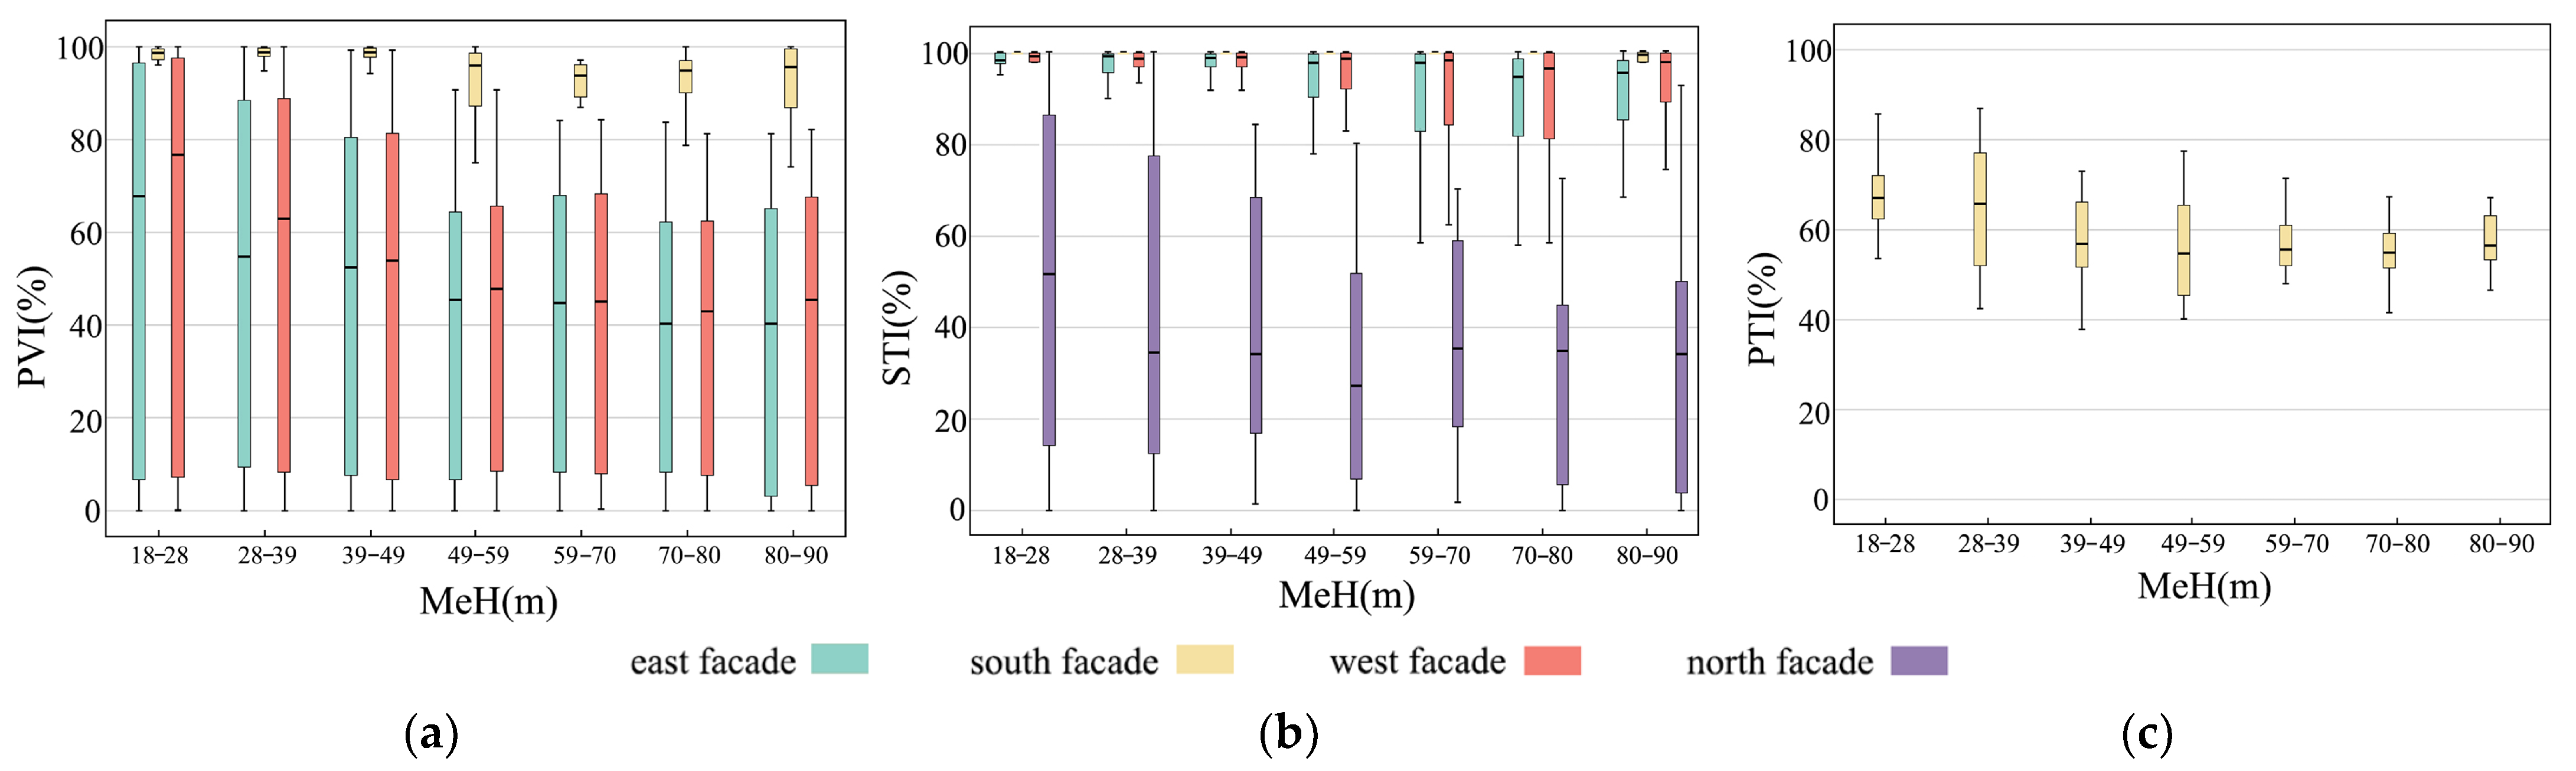
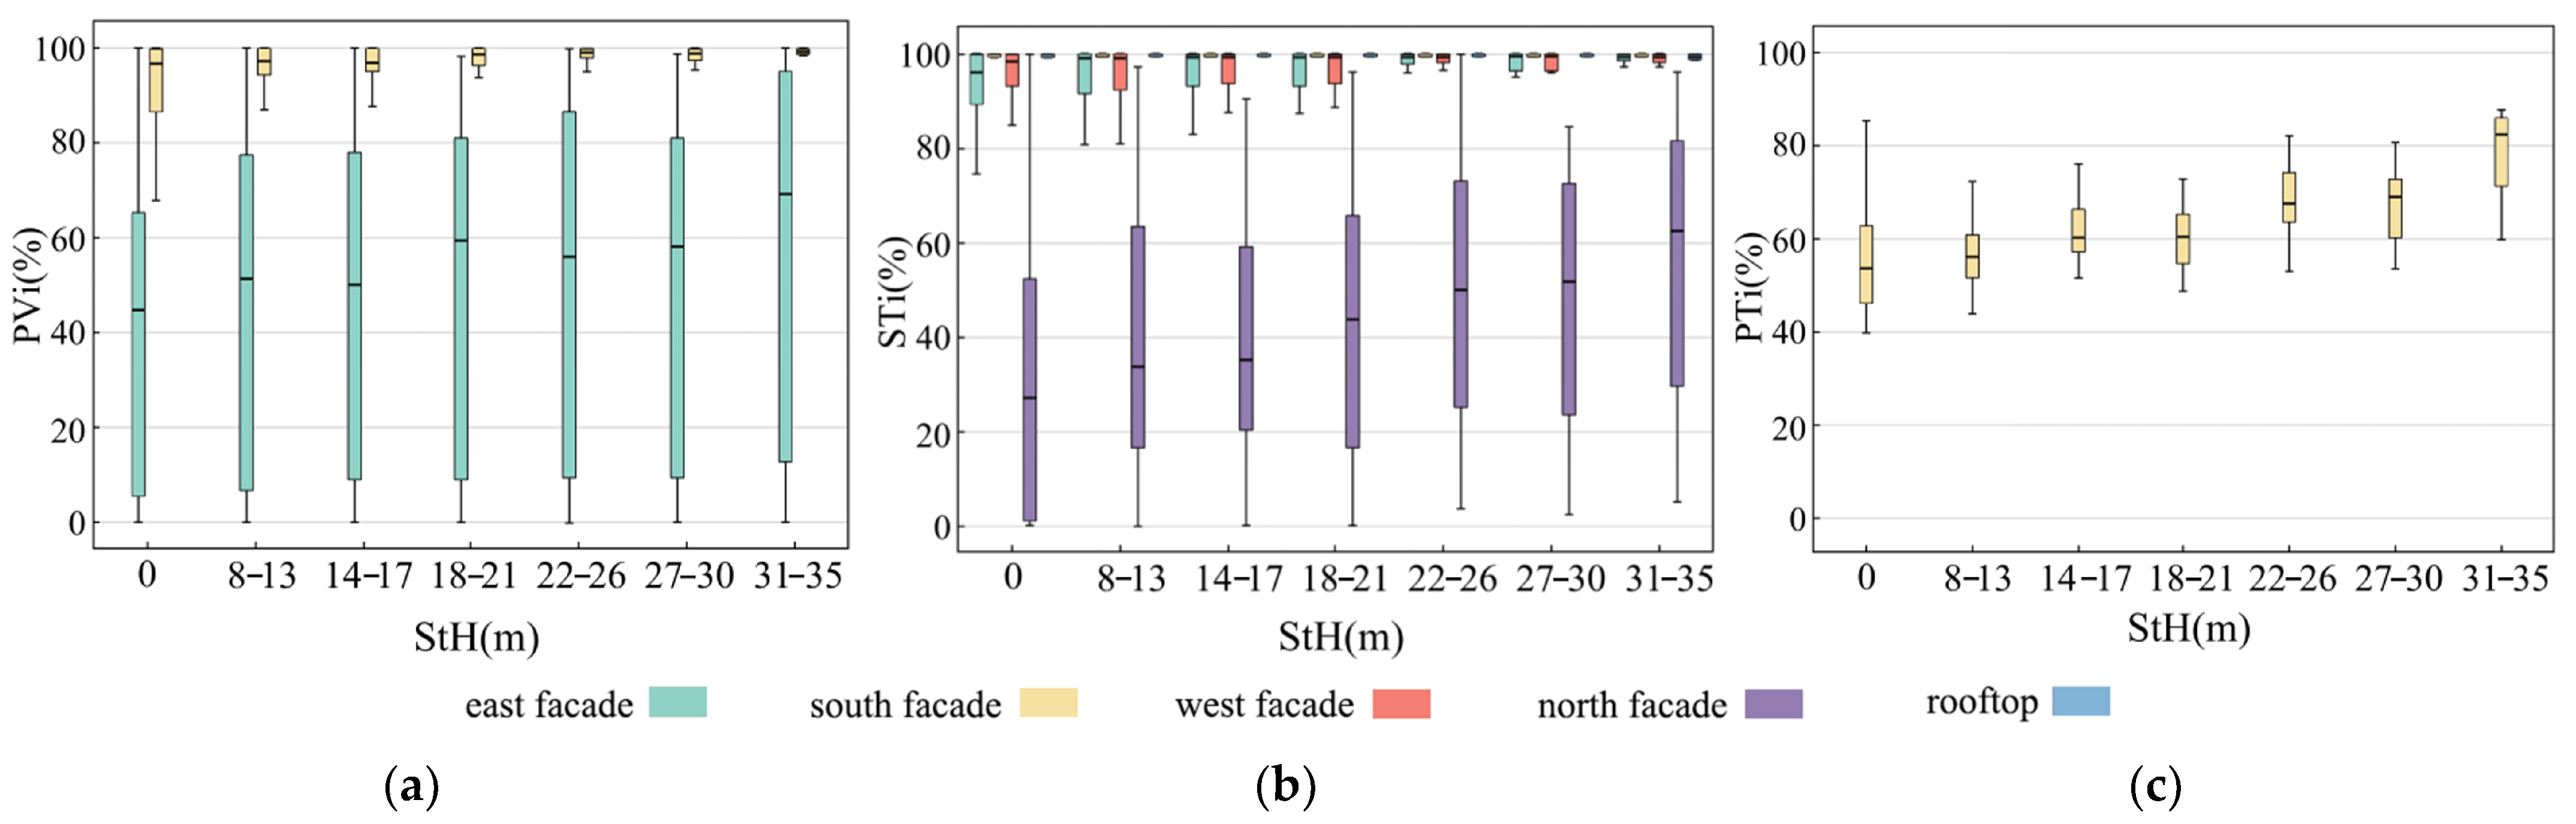
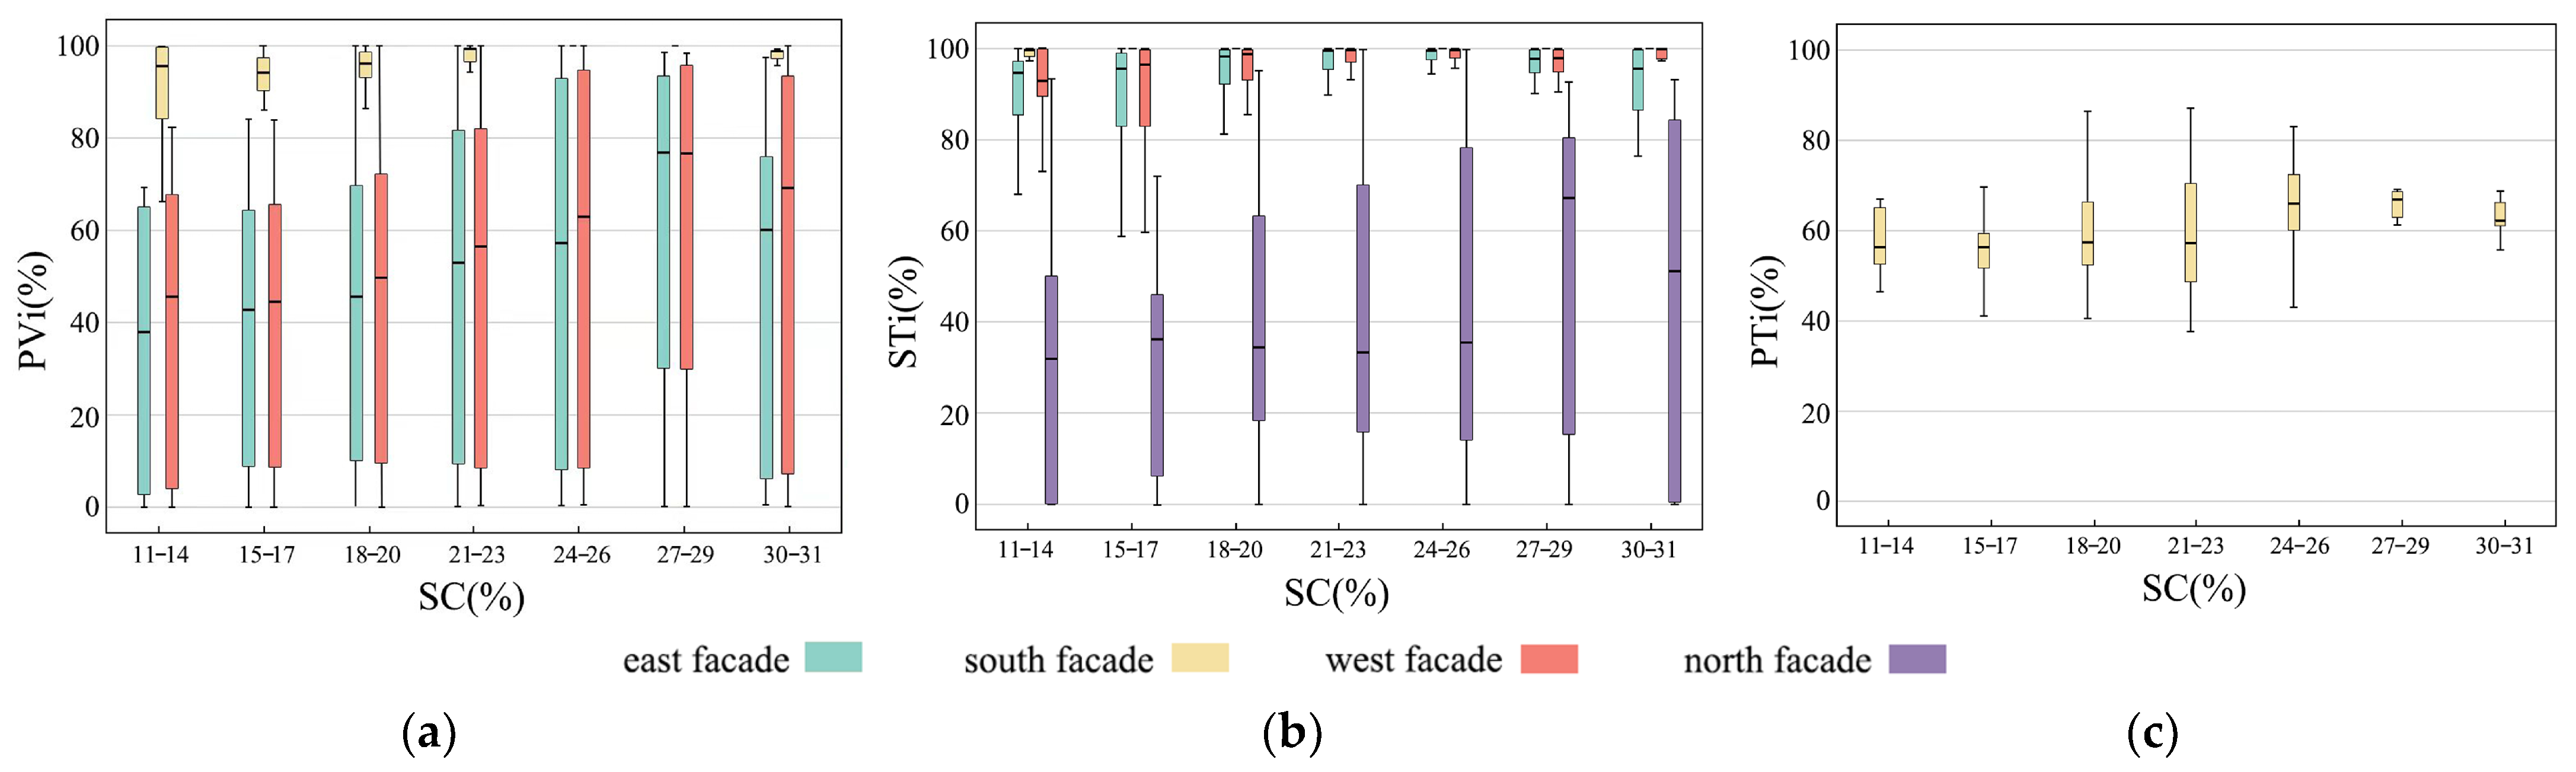
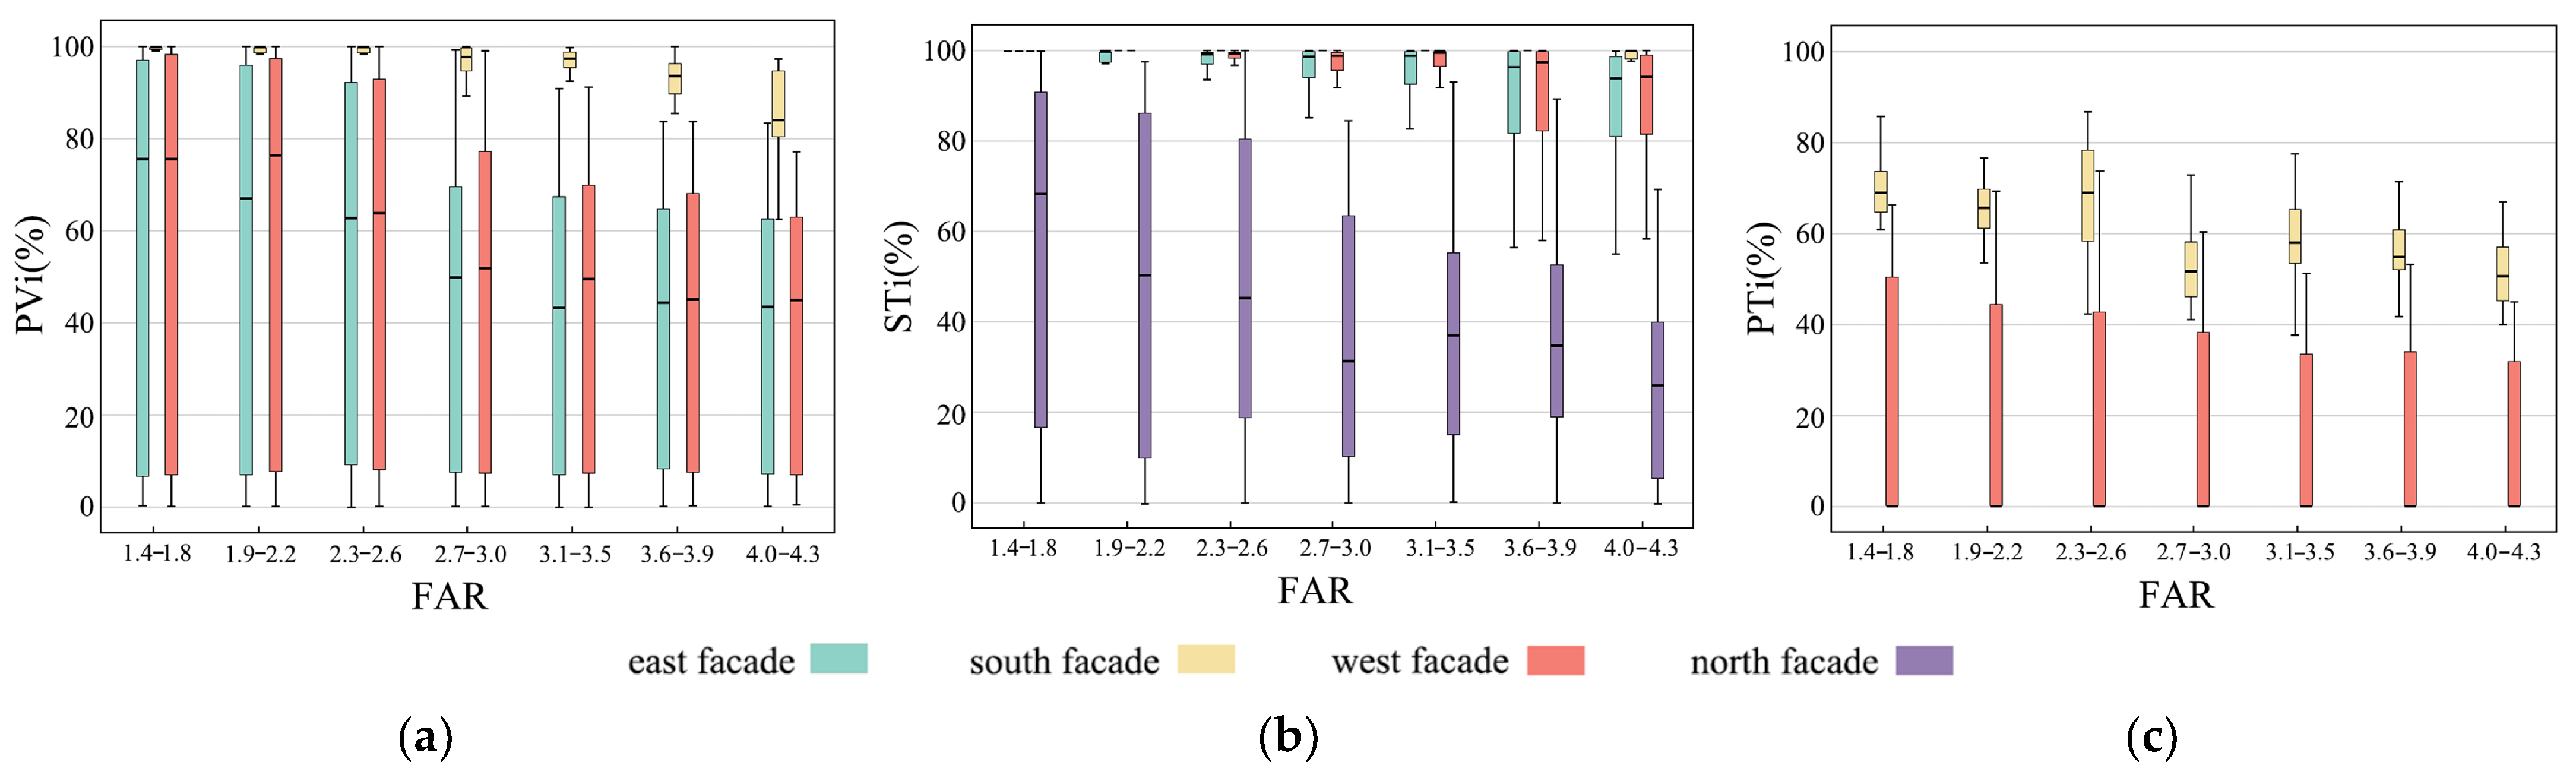
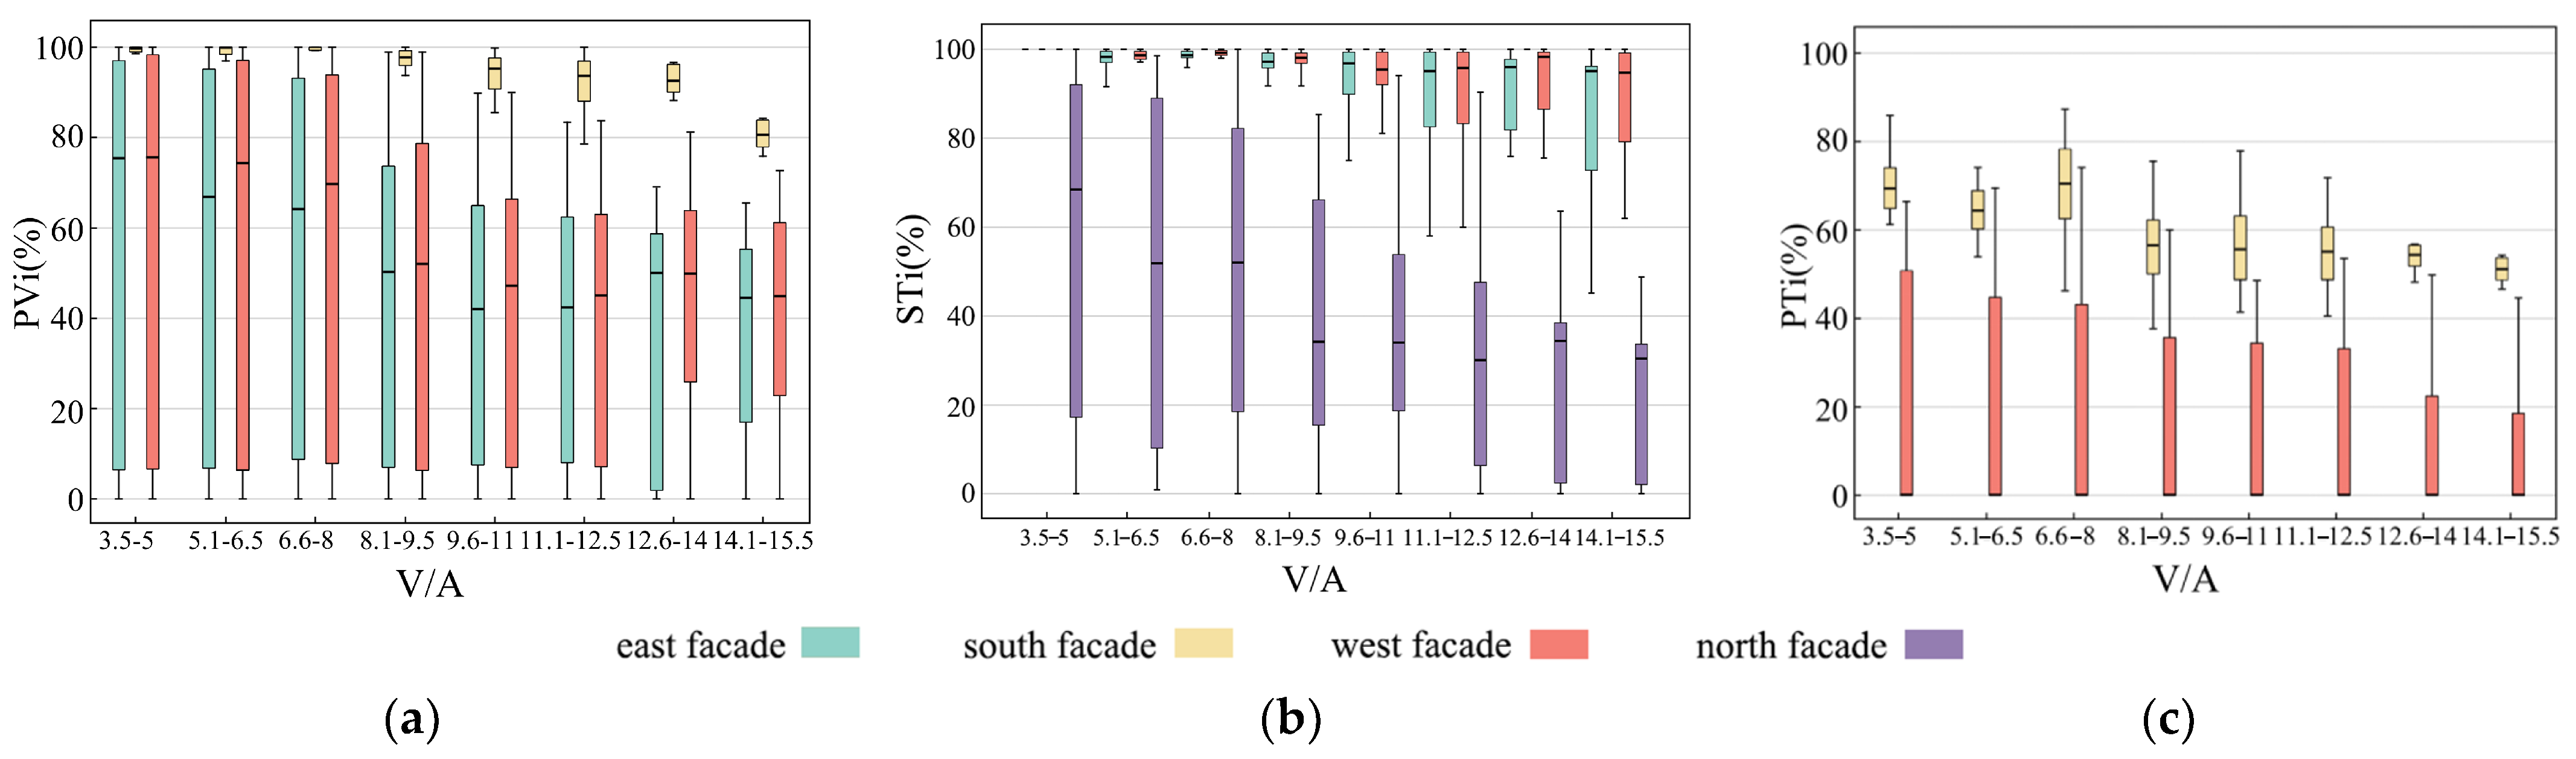
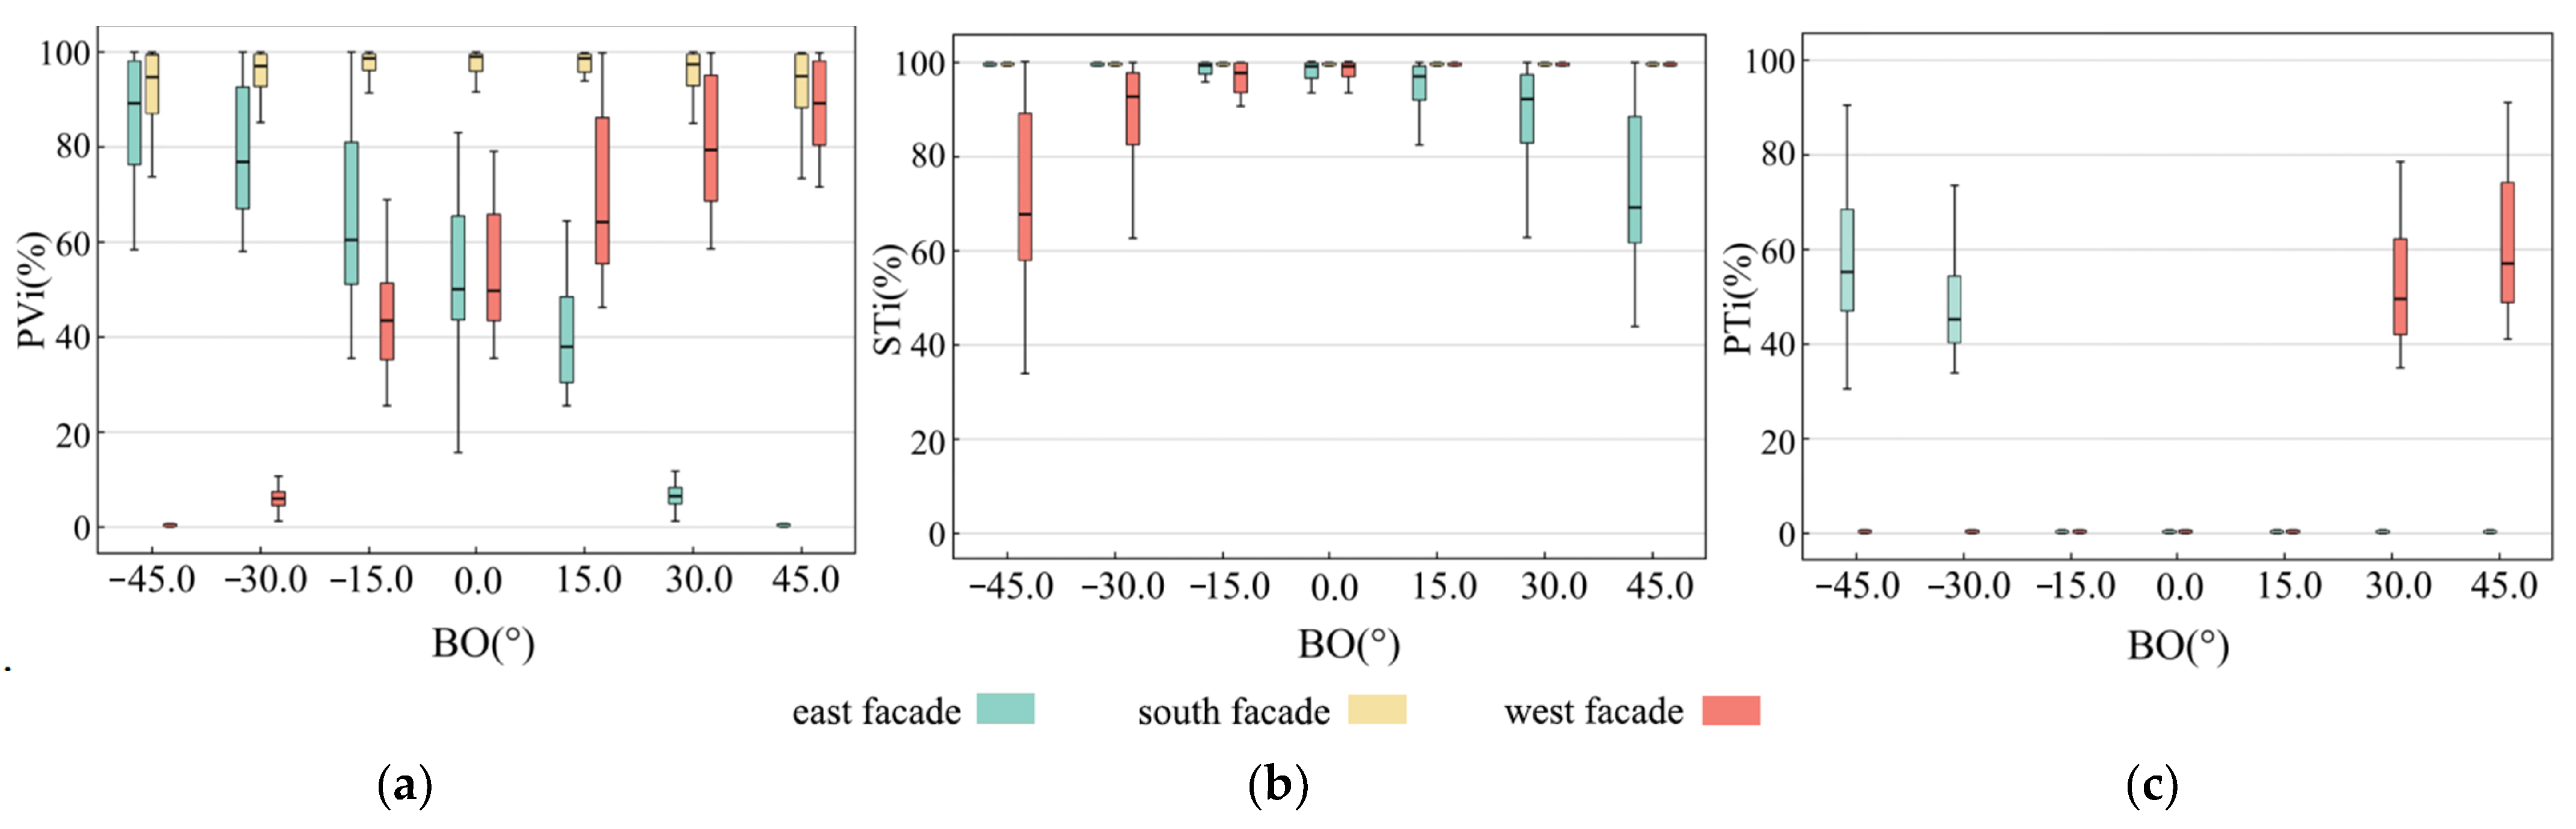
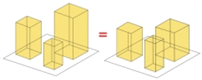
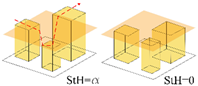
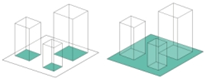
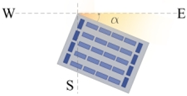
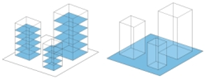
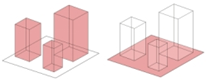

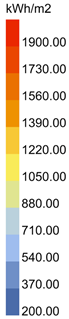
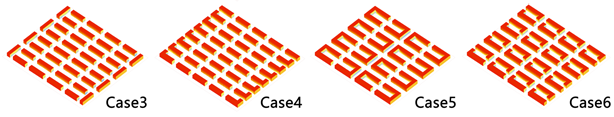
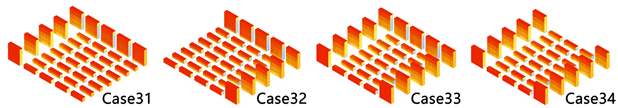
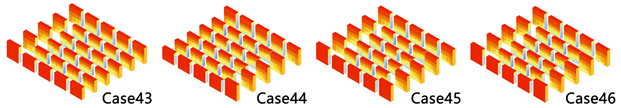
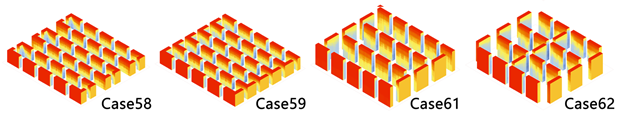
Disclaimer/Publisher’s Note: The statements, opinions and data contained in all publications are solely those of the individual author(s) and contributor(s) and not of MDPI and/or the editor(s). MDPI and/or the editor(s) disclaim responsibility for any injury to people or property resulting from any ideas, methods, instructions or products referred to in the content. |
© 2025 by the authors. Licensee MDPI, Basel, Switzerland. This article is an open access article distributed under the terms and conditions of the Creative Commons Attribution (CC BY) license (https://creativecommons.org/licenses/by/4.0/).