Article

Green Infrastructure Network Planning in Urban Fringe Areas Based on the Characteristics of Agricultural and Forestry Landscape Ecological Network in a Metropolitan City

1
College of Architecture, North China University of Water Resources and Electric Power, Zhengzhou 450046, China
2
Henan Urban Planning and Design Institute Co., Ltd., Zhengzhou 450044, China
3
Department of Landscape Architecture, College of Landscape Architecture and Art, Henan Agricultural University, Zhengzhou 450002, China
*
Authors to whom correspondence should be addressed.
Land 2025, 14(3), 572; https://doi.org/10.3390/land14030572
Submission received: 10 February 2025 / Revised: 1 March 2025 / Accepted: 5 March 2025 / Published: 8 March 2025

Abstract

:
Small-scale, dispersed agroforestry spaces in the urban fringe constitute ecological land that serves dual public benefit functions: natural ecological conservation and rural-urban services. The purpose of this study is to construct a green infrastructure network by integrating the existing and potential green spaces in an urban fringe. The urban fringe in Zhengzhou was chosen as the study site. First, the urban fringe of Zhengzhou was identified based on multi-source data and artificial intelligence, followed by the extraction of green infrastructure elements through morphological spatial pattern analysis. Then, a public benefit output evaluation system was constructed to assess the land value of green infrastructure in the study area. Finally, based on the evaluation results, a classified network planning was conducted, and a triple-network integrated planning strategy was proposed. The results showed that (1) the administrative area of Zhengzhou is divided into three spatial types: urban core areas, the urban fringe areas, and urban periphery area; this study focuses on the urban fringe surrounding the main urban area of Zhengzhou, area of 678.93 km2; (2) the patch sizes of green infrastructure land in the study area range from approximately 0.01 km2 to 2.83 km2; (3) green infrastructure land was classified into levels 1~5 based on ecological conservation and rural-urban services, and comprehensive high-grade land was identified for the construction of the green infrastructure network; and (4) the green infrastructure network in the study area was divided into the forest natural habitat network, the blue-green infrastructure network, and the agroforestry landscape recreation network, and a triple-network integrated green infrastructure network strategy was developed. This study aims to strengthen the effective protection and utilization of micro-habitats in the urban fringe, contributing to the formulation of strategies to reduce the ecological vulnerability of the urban fringe and promote sustainable urban development.

1. Introduction

The dual challenges of urbanization and climate change have placed immense pressure on urban ecosystem services (ESs) [1,2]. The continuously expanding built-up areas are eroding natural spaces both within and outside cities, with the boundaries between urban and rural areas becoming increasingly blurred [3]. Densely populated mid-to-large-sized cities are facing increasingly frequent extreme weather events and the consequences of natural disasters are becoming more severe [4]. As the fastest-changing and most sensitive region within urban areas, the urban fringe bears the dual pressures of urban development and ecological security [5,6]. The concept of the urban fringe reflects the specialized and refined research on urban sustainability [3]. However, previous studies on the urban fringe have primarily focused on land use analysis and evaluation [7,8], while research on practical planning for habitat spaces in the urban fringe remains relatively underdeveloped [9]. The urban fringe requires adaptive responses to reduce vulnerability to urban expansion and natural disasters [10]. A well-functioning urban fringe with ideal ESs can continuously adapt and support urban development. Green infrastructure networks (GINs) planning is a sustainable strategy that can enhance ES functions in the fringe areas, strengthen urban resilience, and mitigate the widening urban-rural gap [11,12]. In this respect, the definition of green infrastructure (GI) is defined as interconnected green networks that include ESs, which conserve the value and function of ecological systems and provide benefits to humans [13]. Therefore, for the vulnerable and dynamic habitat spaces in the fringe areas, it is crucial to plan green infrastructure networks with resilience and urban-rural multifunctional capabilities.
Public benefit output is the primary expression of GI functions in urban fringe areas, encompassing both the inherent ecological conservation and the potential rural-urban services [14]. The ecological conservation public benefit output is demonstrated by supporting functions such as species habitat and corridor protection, as well as maintaining natural processes, and regulating functions like soil improvement, stormwater regulation, and climate regulation. The rural-urban service public benefit output is demonstrated by cultural functions such as leisure, historical education, and aesthetic appreciation, as well as supply functions such as food provision and irrigation for production [15]. To ensure that land use in urban fringe areas supports the healthy evolution of both natural and urban systems, it is crucial to leverage diverse habitat types to build the GIN [12]. By enhancing the GIN’s multifunctionality, the ecosystem service functions of various habitat types are extended to the city scale [16]. Furthermore, the GIN plays an important role not only in connecting ecological functions but also in land-use management by linking accessible green spaces for people. In particular, effective zoning and management can be achieved through the classification of land use types in the GIN [17]. However, most urban fringe areas still lack systematic land management and rational utilization. The ecological land in these areas has not formed an interconnected system or network. Under the conditions of conflicting functional demands and overlapping control from multiple government departments, ecological pressures originating from suburban agricultural production, urban pollution transfer, and improper construction threaten the high-quality output of ESs.
Defining the scope of urban fringe areas is a prerequisite for the scientific and effective evaluation of land use output functions. Scholars both domestically and internationally have undertaken a series of studies and attempts to delineate urban fringe areas from various perspectives, primarily concentrating on three aspects: based on key socio-economic indicators, through the construction of spatial measurement models utilizing specific indicators, and employing big data and artificial intelligence algorithms. The delineation of urban fringe areas using key socio-economic indicators is instrumental in analyzing and quantifying urban-rural social development [18,19,20]. These methods facilitate quick and convenient assessments of social, economic, and demographic aspects; however, they tend to be highly subjective and influenced by governmental guidance. Consequently, the delineated fringe areas, shaped by various socio-economic data or administrative boundaries, often overlook many spatial details. Spatial measurement models constructed with specific indicators integrate relevant urban-rural data for computational analysis, allowing for the calculation of theoretical spatial extents for different urban types [21,22], which demonstrates a certain level of scientific rigor and broad applicability. Nonetheless, the spatial delineation of urban fringe areas necessitates a comprehensive consideration of multiple factors pertaining to urban-rural land use and socio-economic conditions, making it challenging to clarify through single-disciplinary or single-indicator methods. Big data and artificial intelligence algorithms integrate specific data and utilize AI to infer and identify urban spatial boundaries [23,24,25], enabling the simulation and quantification of urban-rural spatial types through machine learning, which offers stronger objectivity and broad application prospects. However, these methodologies require comprehensive data support to ensure greater accuracy, as isolated, fragmented, or insufficient data can significantly compromise the reliability of the results. In this regard, this study employs multi-source data and integrates deep neural network (DNN) models for the identification and extraction of urban fringe areas. The validity and quantity of the underlying data directly influence the accuracy of the results [26]. DNN models can synthesize and objectively reflect the spatial characteristics of cities based on various data analysis results, enabling the classification of different urban spatial structures [27].
In the process of planning the GIN, the functions and benefits of public benefit output should be considered. However, due to the small and fragmented nature of GI lands in fringe areas [28], it is key to identify and link high-output agricultural and forestry lands in planning and land use management. High-output areas not only refer to those that provide multiple ESs, but also serve as “ecological stepping stones” that link urban areas with large peripheral ecological zones [29]. Therefore, the identification process includes both multifunctional land identification and the recognition of corridors that play a supporting role. However, existing studies mostly use model algorithms to generate connected spaces in the process of constructing networks [30,31]. While these methods can quickly and effectively identify and establish ecological networks, they often struggle to account for the land use value of small patches when selecting and calculating evaluation indicators. Furthermore, the assessment of ES output values for small patches in urban fringe areas remains relatively unexplored in related research. In this study, we systematically analyze the public benefit output functions of habitat spaces in the urban fringe areas of Zhengzhou from both natural and urban-rural service perspectives, and establish a land value assessment system to prioritize GIN land use, thereby maximizing the Ess’ functions and benefits in urban fringe.
In this view, the aim of this study is to explore how to incorporate the multi-functional GI planning framework and key components in the planning of GINs for the urban fringe: (1) determination of urban fringe areas; (2) land functions evaluation and identification of ecological processes of GI; (3) functional GIN planning. The development model of urban fringe areas and the classification-based network planning of GI can be used to formulate strategies for enhancing the public service outputs of urban fringe areas.

2. Materials and Methods
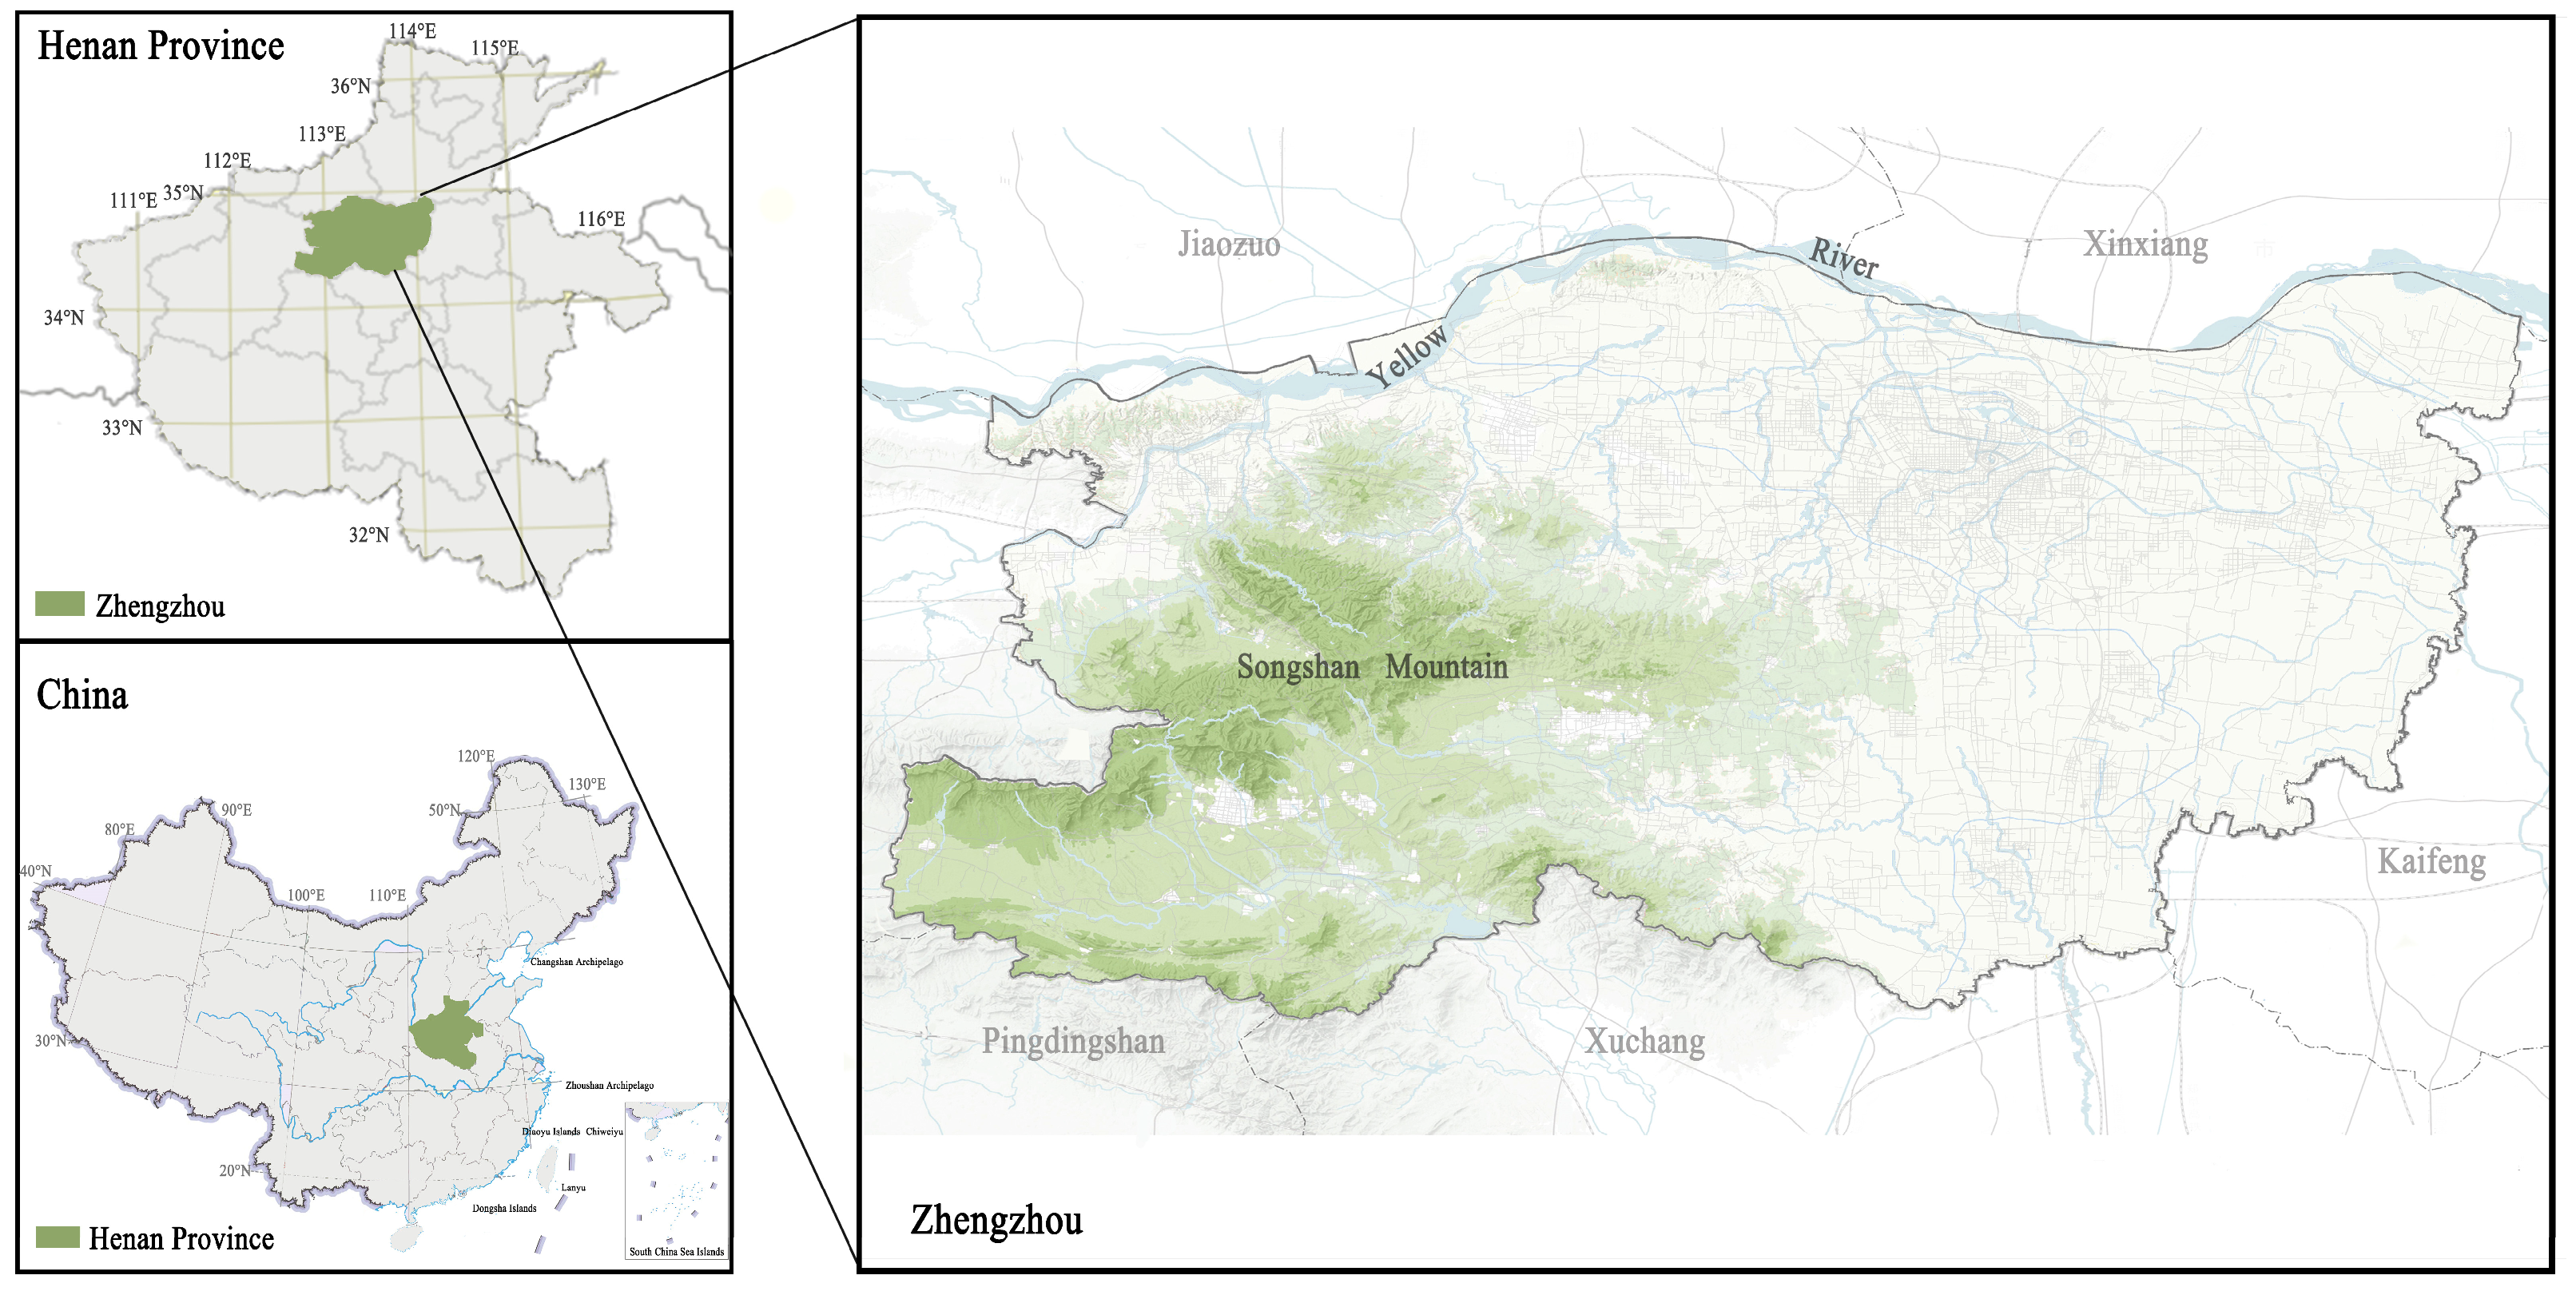
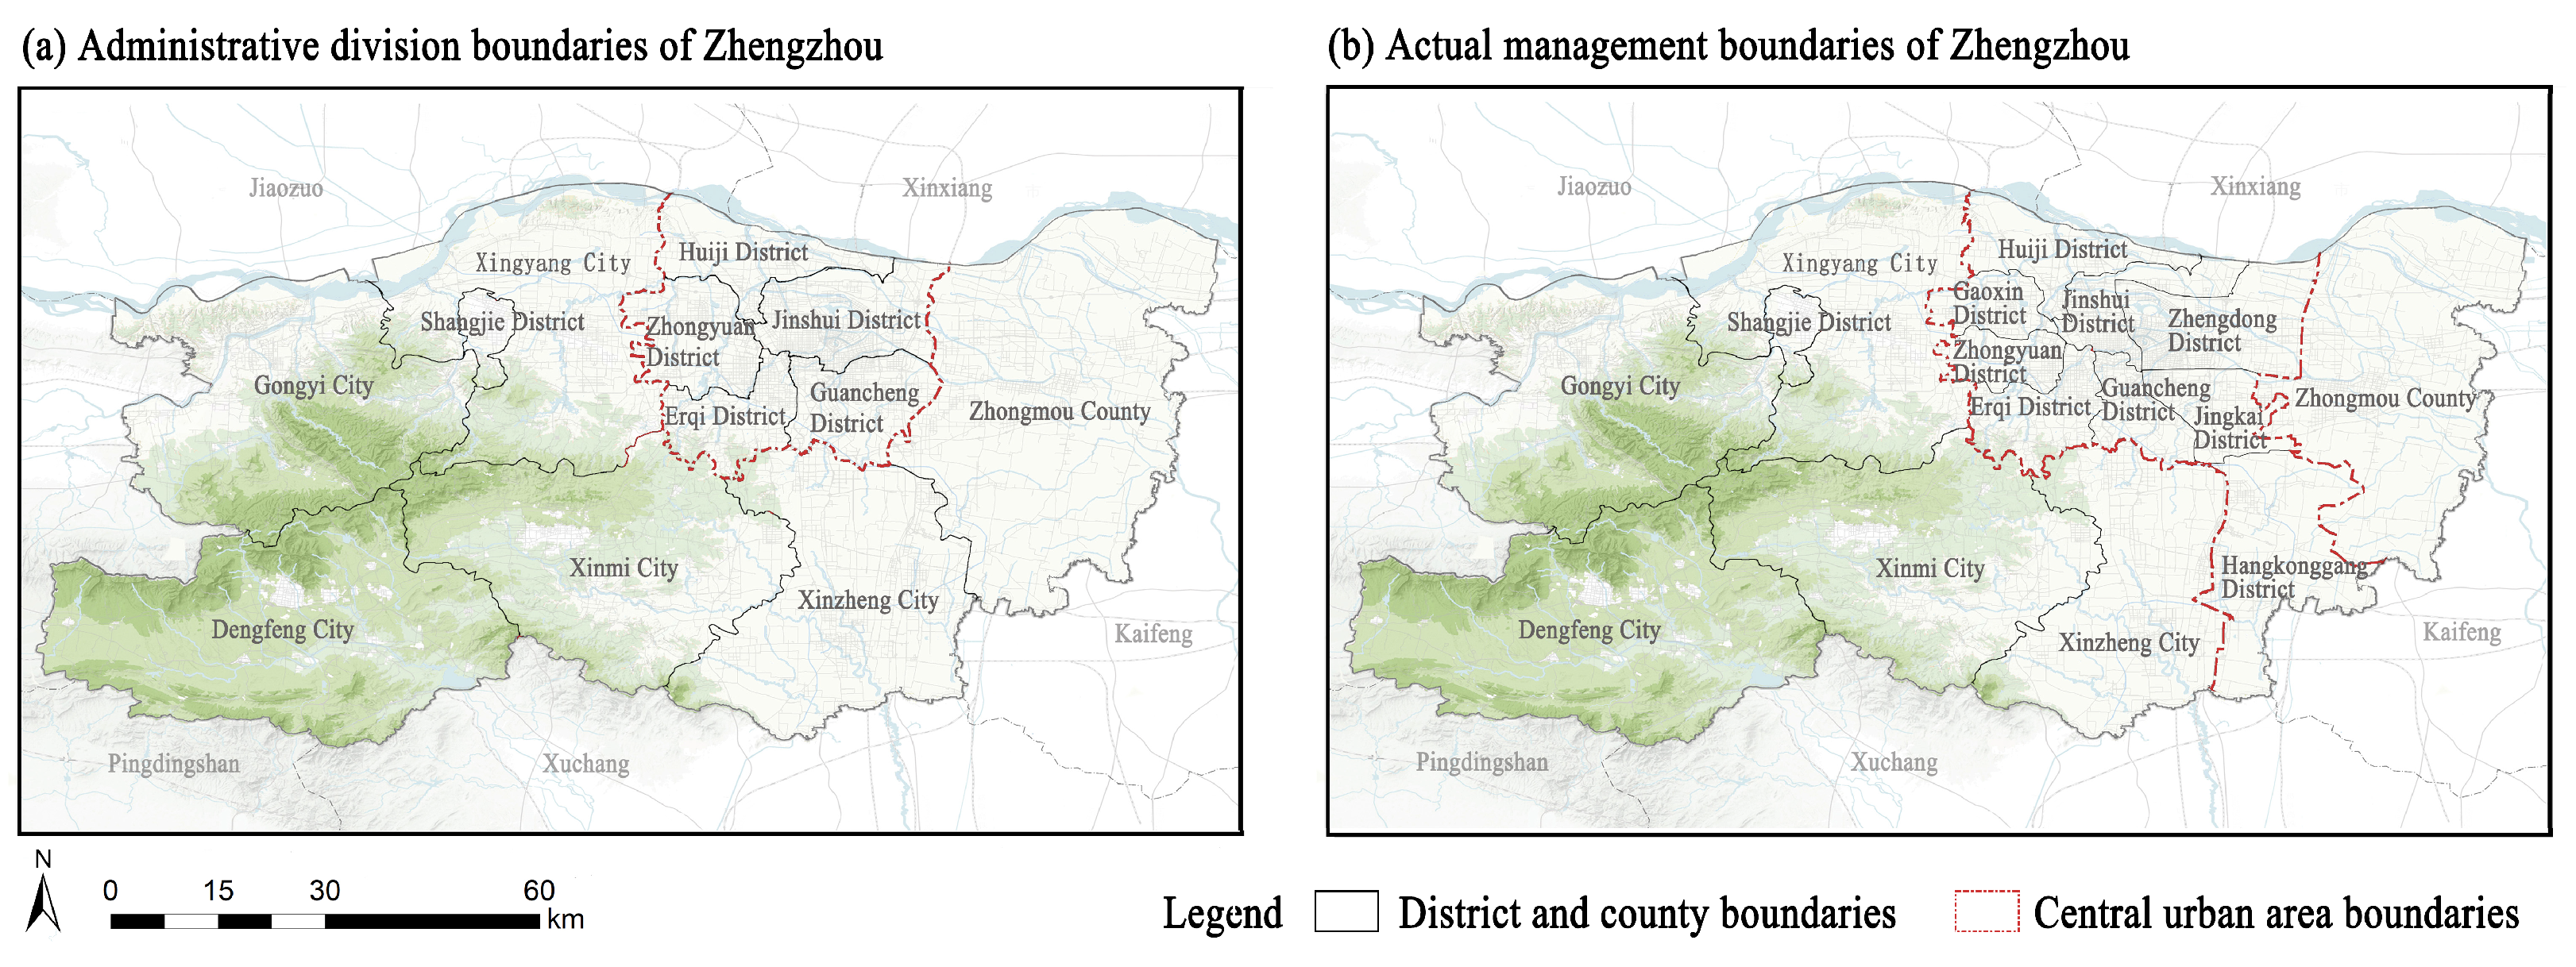
2.1. Study Area

Zhengzhou (112°42′ E~114°14′ E, 34°16′ N~34°58′ N) is the capital of Henan Province and a national central city in China, with a total area of 7567 km2 (Figure 1). As of 2020, the city’s population reached 10.35 million, with an urbanization rate of 78.40% [32]. Since the establishment of its subordinates in 1991, Zhengzhou has faced a discrepancy between its administrative divisions and actual management. Administratively, the city is divided into sux districts (also referred to as the central urban area), five county-level cities, and one county. However, in terms of actual management, the area is divided into six districts, five county-level cities, one county, and four sub-administrative institutions. These four sub-administrative institutions, along with the six districts, are considered the de facto central urban area [33] (Figure 2), which has created challenges for research in areas such as urban-rural planning and development.
The Central China Rising Strategy in 2004 and the proposal of the Zhengzhou Metropolitan Area in 2017 accelerated the city’s urbanization process. Over the past two decades, Zhengzhou has experienced rapid expansion of its urban built-up areas, with construction land quickly encroaching on ecological spaces. This was followed by a shift towards the national ecological civilization transformation, during which urban development began to focus on more orderly progress. To address the many environmental issues and disaster threats arising from urban development, the local government of Zhengzhou has formulated and implemented numerous relevant plans and policies (Table 1). However, on one hand, these plans are mostly focused on the macro-scale green space systems or special treatments for water bodies, air, etc., with no clear GI plan proposed or implemented at the government level. On the other hand, these plans and policies overlook the recognition and attention to the city’s peripheral areas, making it difficult to reflect and utilize the value of ESs in the urban fringe areas.

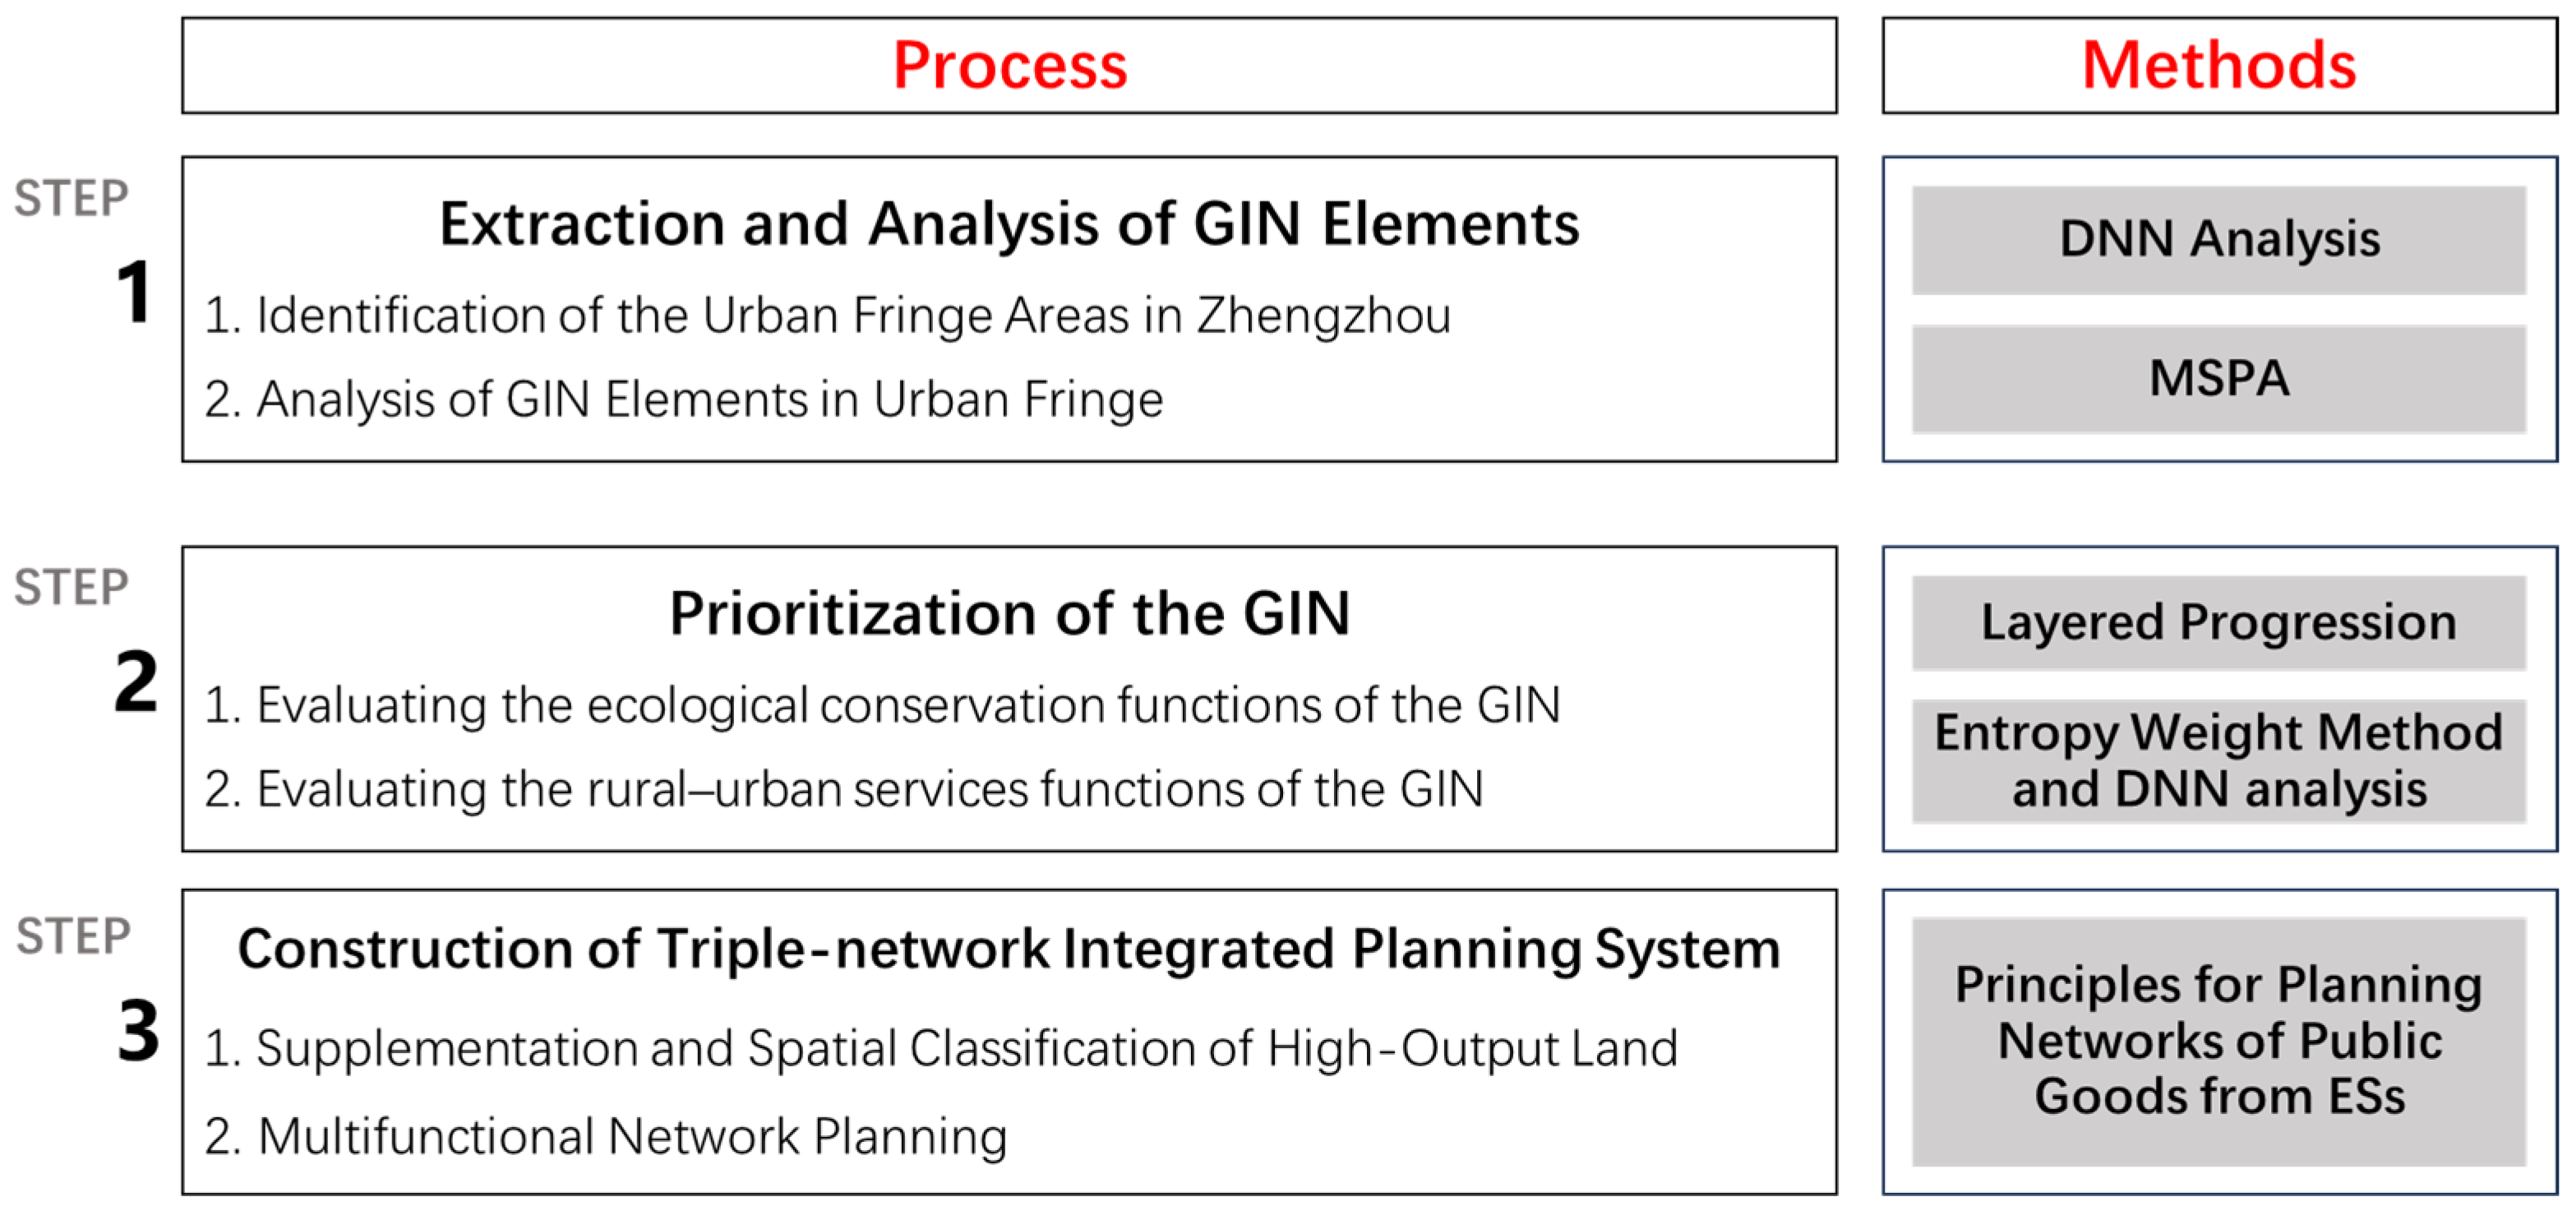
2.2. Research Design

Before the GIN planning, multi-source data were integrated with artificial intelligence algorithms to delineate urban fringe boundaries, ensuring the rigor of the GI research in those areas. In the analysis and planning of GI, this study draws from theoretical research on the public benefit output of ESs by both domestic and international scholars [14,34,35,36]. The supply of ecosystem services is classified into two categories: natural maintenance and rural-urban services, which provides theoretical support for land evaluation and classification network planning. Figure 3 shows the specific research approach.
First, the scope of urban fringe areas in Zhengzhou was delineated using a DNN model based on multi-source data encompassing natural and socio-economic indicators. GI elements within the fringe areas were identified through MSP, and their distribution, classification, and ES output characteristics were analyzed, focusing on natural maintenance and rural-urban services. Next, we employed a public benefit output evaluation system to assess the current levels of natural conservation and urban-rural services provided by GI. This process identified land patches with potential for ecosystem service outputs, discerned the spatial patterns of associated ecological processes, and analyzed planning pathways that respond to the demands of both natural ecosystems and urban functions, ultimately determining priority areas for GIN development. Finally, by integrating the evaluation results of natural conservation and urban-rural services with the current land use classification, we classified and designed the three types of green infrastructure networks. Based on the overlay of the three networks, a GIN construction framework and implementation recommendations were proposed.

2.3. Data Sources and Processing

In this study, all spatial data were obtained in 2020. The process of dividing the urban fringe area, GIN element analysis, ES functional evaluation, and multi-functional network planning requires various input datasets. Different stages of the study have different resolution requirements for the data. For data sources with inconsistent original resolutions, such as those with a resolution of 1000 m × 1000 m, interpolation refinements are required after converting from raster to points format. Table 2 provides the sources and processing methods for all the data.

2.4. Identification of Urban Fringe Areas and GIN Element Analysis

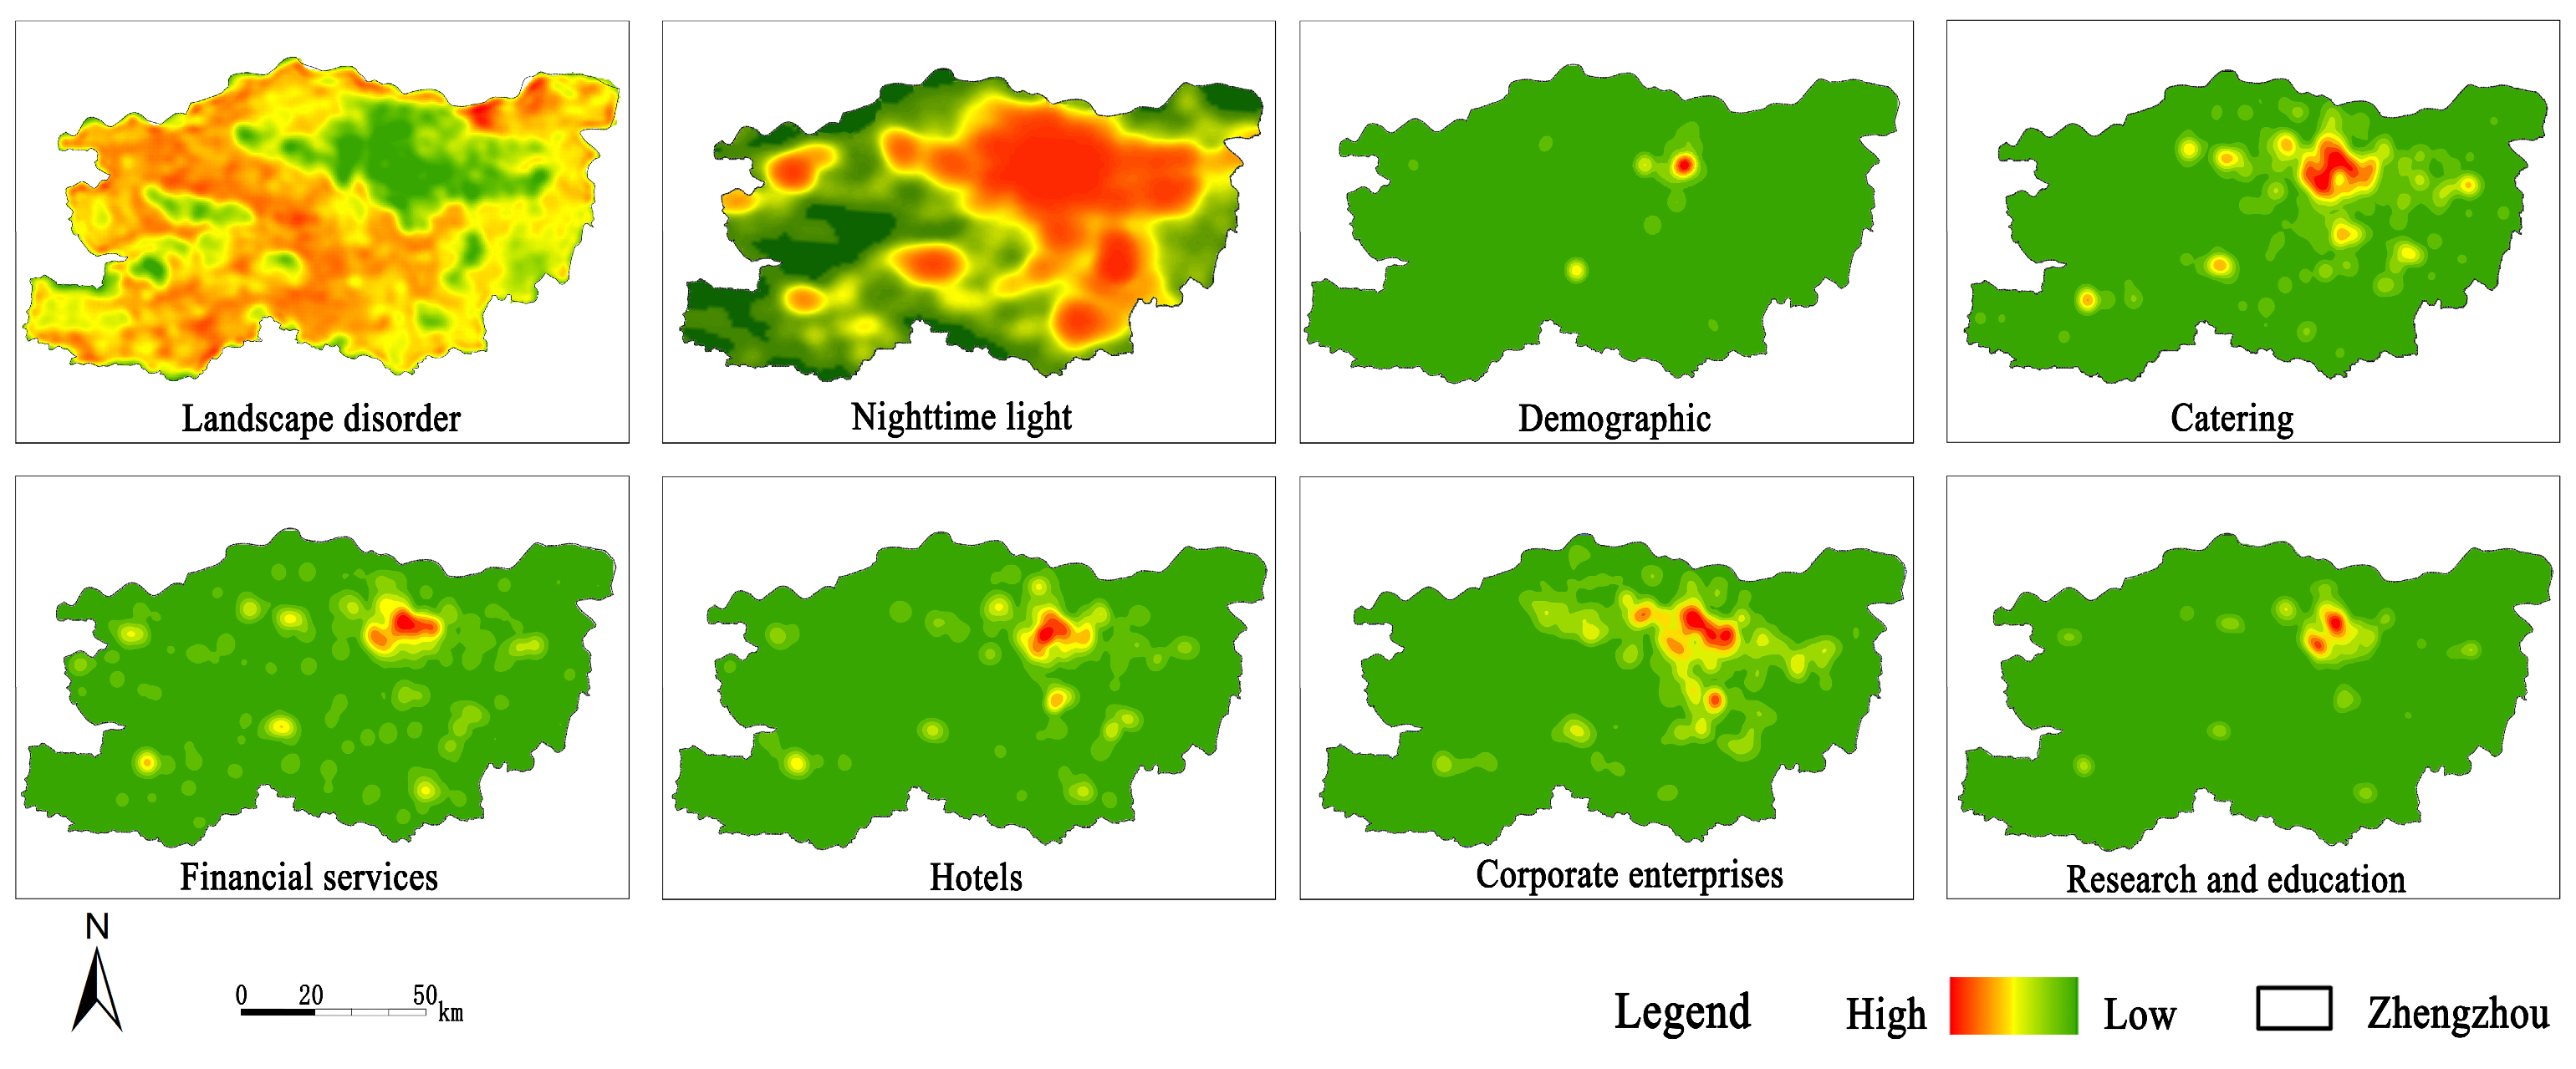
2.4.1. Identification of Urban Fringe Areas Based on a Deep Neural Network Model

In the data selection for defining the urban fringe areas, we combined existing research and the structural characteristics of Zhengzhou, considering land use and socio-economic features as the main reference factors [12,25], and eight representative indicators are selected as the basic data. We characterize land use conditions using landscape disorder and nighttime light data, while socio-economic characteristics are represented by population data and five categories of Points of Interest (POIs). Landscape disorder effectively captures the homogeneity and heterogeneity of landscapes within a given area, quantifying the degree of landscape fragmentation. Compared to urban core and outer urban zones, the patch types in urban fringe areas are more complex and exhibit higher levels of landscape disorder. As a result, the land use characteristics represented by landscape disorder play a significant role in identifying urban fringe areas [12]. Nighttime light data objectively capture factors such as human activity and intensity [25], with urban fringe areas typically showing a notable decrease in light intensity and fragmented spatial distribution patterns. For the POI determination indicators, we selected five categories that have a significant impact on the identification of the fringe area: catering, financial services, hotels, corporate enterprises, and research and education. Figure 4 shows the pre-processing results of the above eight indicators.
By integrating the above eight data points, we developed a DNN model for the spatial division of Zhengzhou using the TensorFlow 2.0 system, combined with the Python 3.6+Pycharm compiler. The spatial area of Zhengzhou is divided into the urban core area, urban fringe area, and urban outer edge area (Figure 5). In selecting the activation function for the DNN computation, based on existing research and extensive experiments [12,40], the ReLU function (Equation (1)) was chosen as the activation function for the hidden layers, and the Sigmoid function (Equation (2)), with output values constrained between (0, 1), was selected to constrain the model’s output.
First, three types of spatial sample points (totaling 7892 sample points across Zhengzhou) were labeled based on normalized grid data of eight factors. Using remote sensing images and street-view photos, we selected 30% of urban points with distinct spatial characteristics as sample points, assigning values of 0.9, 0.5, and 0.1 as labels for urban core area, urban fringe area, and urban outer edge area, respectively. Second, 70% of the sample data were randomly selected as training data for the model, while the remaining 30% were used as testing data. Training was stopped when the error was controlled within 0.001 and the model meeting the accuracy requirements was saved. This model was then applied to fit all grid point data within the study area, with an 8-20-20-10-1 architecture ultimately adopted for this experiment (Figure 6). Third, the eight factors were used as eight input layer neurons in the DNN. The ReLU activation function was applied between the first three connected layers and the Sigmoid function was used as the activation function for the output layer. The model meeting the accuracy requirements was saved and used to fit all grid point data within the study area. Fourth, the category of each sample was determined by calculating the Euclidean distance between the output values of the test samples and the values 0.9, 0.5, and 0.1. The final test data accuracy of the DNN model was 93.1% and all point data were classified within the model to obtain the determination results. Finally, the result data were refined through interpolation to derive the spatial structure boundaries of urban fringe areas in Zhengzhou.
ReLU x = max 0 , x
Sigmoid x = 1 1 + e x

2.4.2. Analysis of GIN Elements in an Urban Fringe

We classified and performed feature analysis on the habitat patches within the study area based on Morphological Spatial Pattern Analysis (MSPA), as a foundation for selecting GI areas. First, the land use data of the study area were reclassified using the Spatial Analyst module in the ArcGIS version 10.8 software platform. Second, ecological land and non-ecological land in the land use classification were separately designated as foreground and background, respectively, resulting in a binary raster image of GIN areas. Third, the raster data was set with a pixel size of 30 m × 30 m and after performing an eight-neighborhood analysis using the Guidos analysis software version 2.3, seven non-overlapping ecological landscape types were obtained, which served as potential elements of GIN in the urban fringe. Finally, the GI areas was analyzed in terms of both MSPA types and land use types.

2.5. Prioritization of the Green Infrastructure Network

We evaluate the functions of GI land in the study area from the perspectives of ecological conservation and rural-urban services. The selection of evaluation indicators was based on the characteristics of the urban fringe area of Zhengzhou and the availability of data [12,35] (Table 3 and Table 4). Due to the different criteria for evaluation in these two aspects, the classification of land for ecological conservation was carried out in a stepwise progression, while the classification for rural-urban services was evaluated through a weighted calculation method. The land value assessment for each function was divided into 1 to 5 levels, from low to high. Finally, based on the prioritization concept, we selected land with ecological conservation and urban-rural service output functions, classified as level 4 and level 5, as high-priority comprehensive valuable land, forming the preliminary prioritization of the GIN.

2.5.1. Evaluating the Ecological Conservation Functions of the GIN

Firstly, we selected core areas identified in the MSPA with an area greater than 0.1 km2 as level 1 to level 2 land value screening. Second, the patch importance (Formulae (3)–(5)) was selected as the indicator to evaluate patch connectivity and patches with dPC ≥ 0.1 were used for level 3 land value screening. Third, combining real-time monitoring data from Gaode Environmental Map and the “2020 Zhengzhou Urban River Water Quality Ranking Report”, patches located in water bodies with water quality levels III and II or above were classified as level 3 and level 4 land, respectively. Fourth, based on the evaluation criteria in the “Ecological Protection Red Line Demarcation Guidelines” and the established boundaries of ecological protection areas, patches within the selected level 3 and level 4 land that belong to ecological protection source areas were classified as level 5 land.
I I C = I I C m u m A L 2 = i = 1 n j = 1 n a i a j 1 + n l i j
P C = P C n u m A L 2 = i = 1 n j = 1 n a i × a j × a i j A l 2
d P C = P C P C r e m o v e P C × 100 %
where n is the number of habitat patches existing in the landscape; ai and aj are the areas of the habitat patches i and j; AL is the total landscape area; nlij is the number of links in the shortest path between patches i and j; PCremove is the metric value after the removal of the plaque.

2.5.2. Evaluating the Rural-Urban Service Functions of the GIN

First, based on national standards or industry norms, we set evaluation thresholds for the seven evaluation factors of the three functional units (leisure and recreation, historical preservation, and land protection) at different levels (Table 4) and performed normalization (Formula (6)). Second, the weight values of the seven evaluation factors are calculated. Based on the evaluation thresholds, the GI elements are computed and the calculation results of 30% of different land use types are selected. The entropy method is used to calculate the weight values with MATLAB 2020b (Formulas (7)–(10)), then the results are combined with the DNN model to determine the weight values of the remaining patches. Finally, based on the weights of the seven evaluation factors, all patches were classified into different levels.
x i j = D i j D j min D j max D j min
X i j = x i j i = 1 x x i j
e j = 1 ln m i = 1 m X i j ln X i j , e j 0 ,   1
d j = 1 e j
W j = d j i = 1 n d j
where Dij is the value of the jth service in the ith patch; Djmax and Djmin represent the maximum and minimum values of the matrix column of the jth service, respectively; m is the number of patches and n is the total number of services being evaluated; Xij is the proportion of the jth service in the ith patch; ej is the information entropy of the jth service; dj is the redundancy of the information entropy for the jth service; Wj is the weight occupied by the jth service.

2.6. Construction of a Triple-Network Integrated Planning System

To undertake the planning of the GIN, we adopted a framework for public benefit outputs of green infrastructure that is modified from existing studies [12,34,35]. The framework is oriented towards ecological conservation and rural-urban services, and it consists of three types of network spaces: forest natural habitat network, blue-green infrastructure network, and agroforestry recreation network (Table 5).
The GIN formed by high-grade land use significantly enhances the functionality of ESs and serves as a critical area for ES output in the urban fringe areas of Zhengzhou. Furthermore, to improve the ES’s output capacity of the GIN within the study area and benefit from its resilience, it is essential to ensure the connectivity of green spaces on one hand and to optimize the network through classification and adopt a multi-type composite GIN on the other hand.

3. Results

3.1. Construction of Integrated Green Infrastructure Networks

3.1.1. Identification of Urban Fringe Areas

Figure 7a shows the division results of the spatial structure of Zhengzhou. The urban fringe areas covers approximately 901.48 km2, accounting for 11.99% of the total municipal area. The overall spatial structure of Zhengzhou exhibits a gradient distribution pattern, consisting of the urban core—urban fringe—urban periphery. The distribution characteristics of the urban fringe reflect the directionality and potential of urban expansion. To the west, it connects with the Shangjie District and Xingyang City, to the east, it links with Zhongmu County, and to the south, it extends towards Xinzheng City. Notably, urban expansion to the north has approached the Yellow River, where the fragmentation and loss of green spaces could significantly weaken the functionality of the ecological barrier along the Yellow River and threaten the city’s ecological security. As shown in the figure, Zhengzhou’s urban development follows a “one main, multiple secondary” pattern, with the main urban area as the primary core and surrounding towns as secondary centers. Based on this development model, this study focuses on the urban fringe surrounding the main urban area of Zhengzhou, considering the integrity and priority of spatial planning. The study area, as mentioned in the following text, refers to this specific region (Figure 7b). This area covers approximately 678.93 km2, accounting for 75.31% of the total urban fringe area of Zhengzhou.

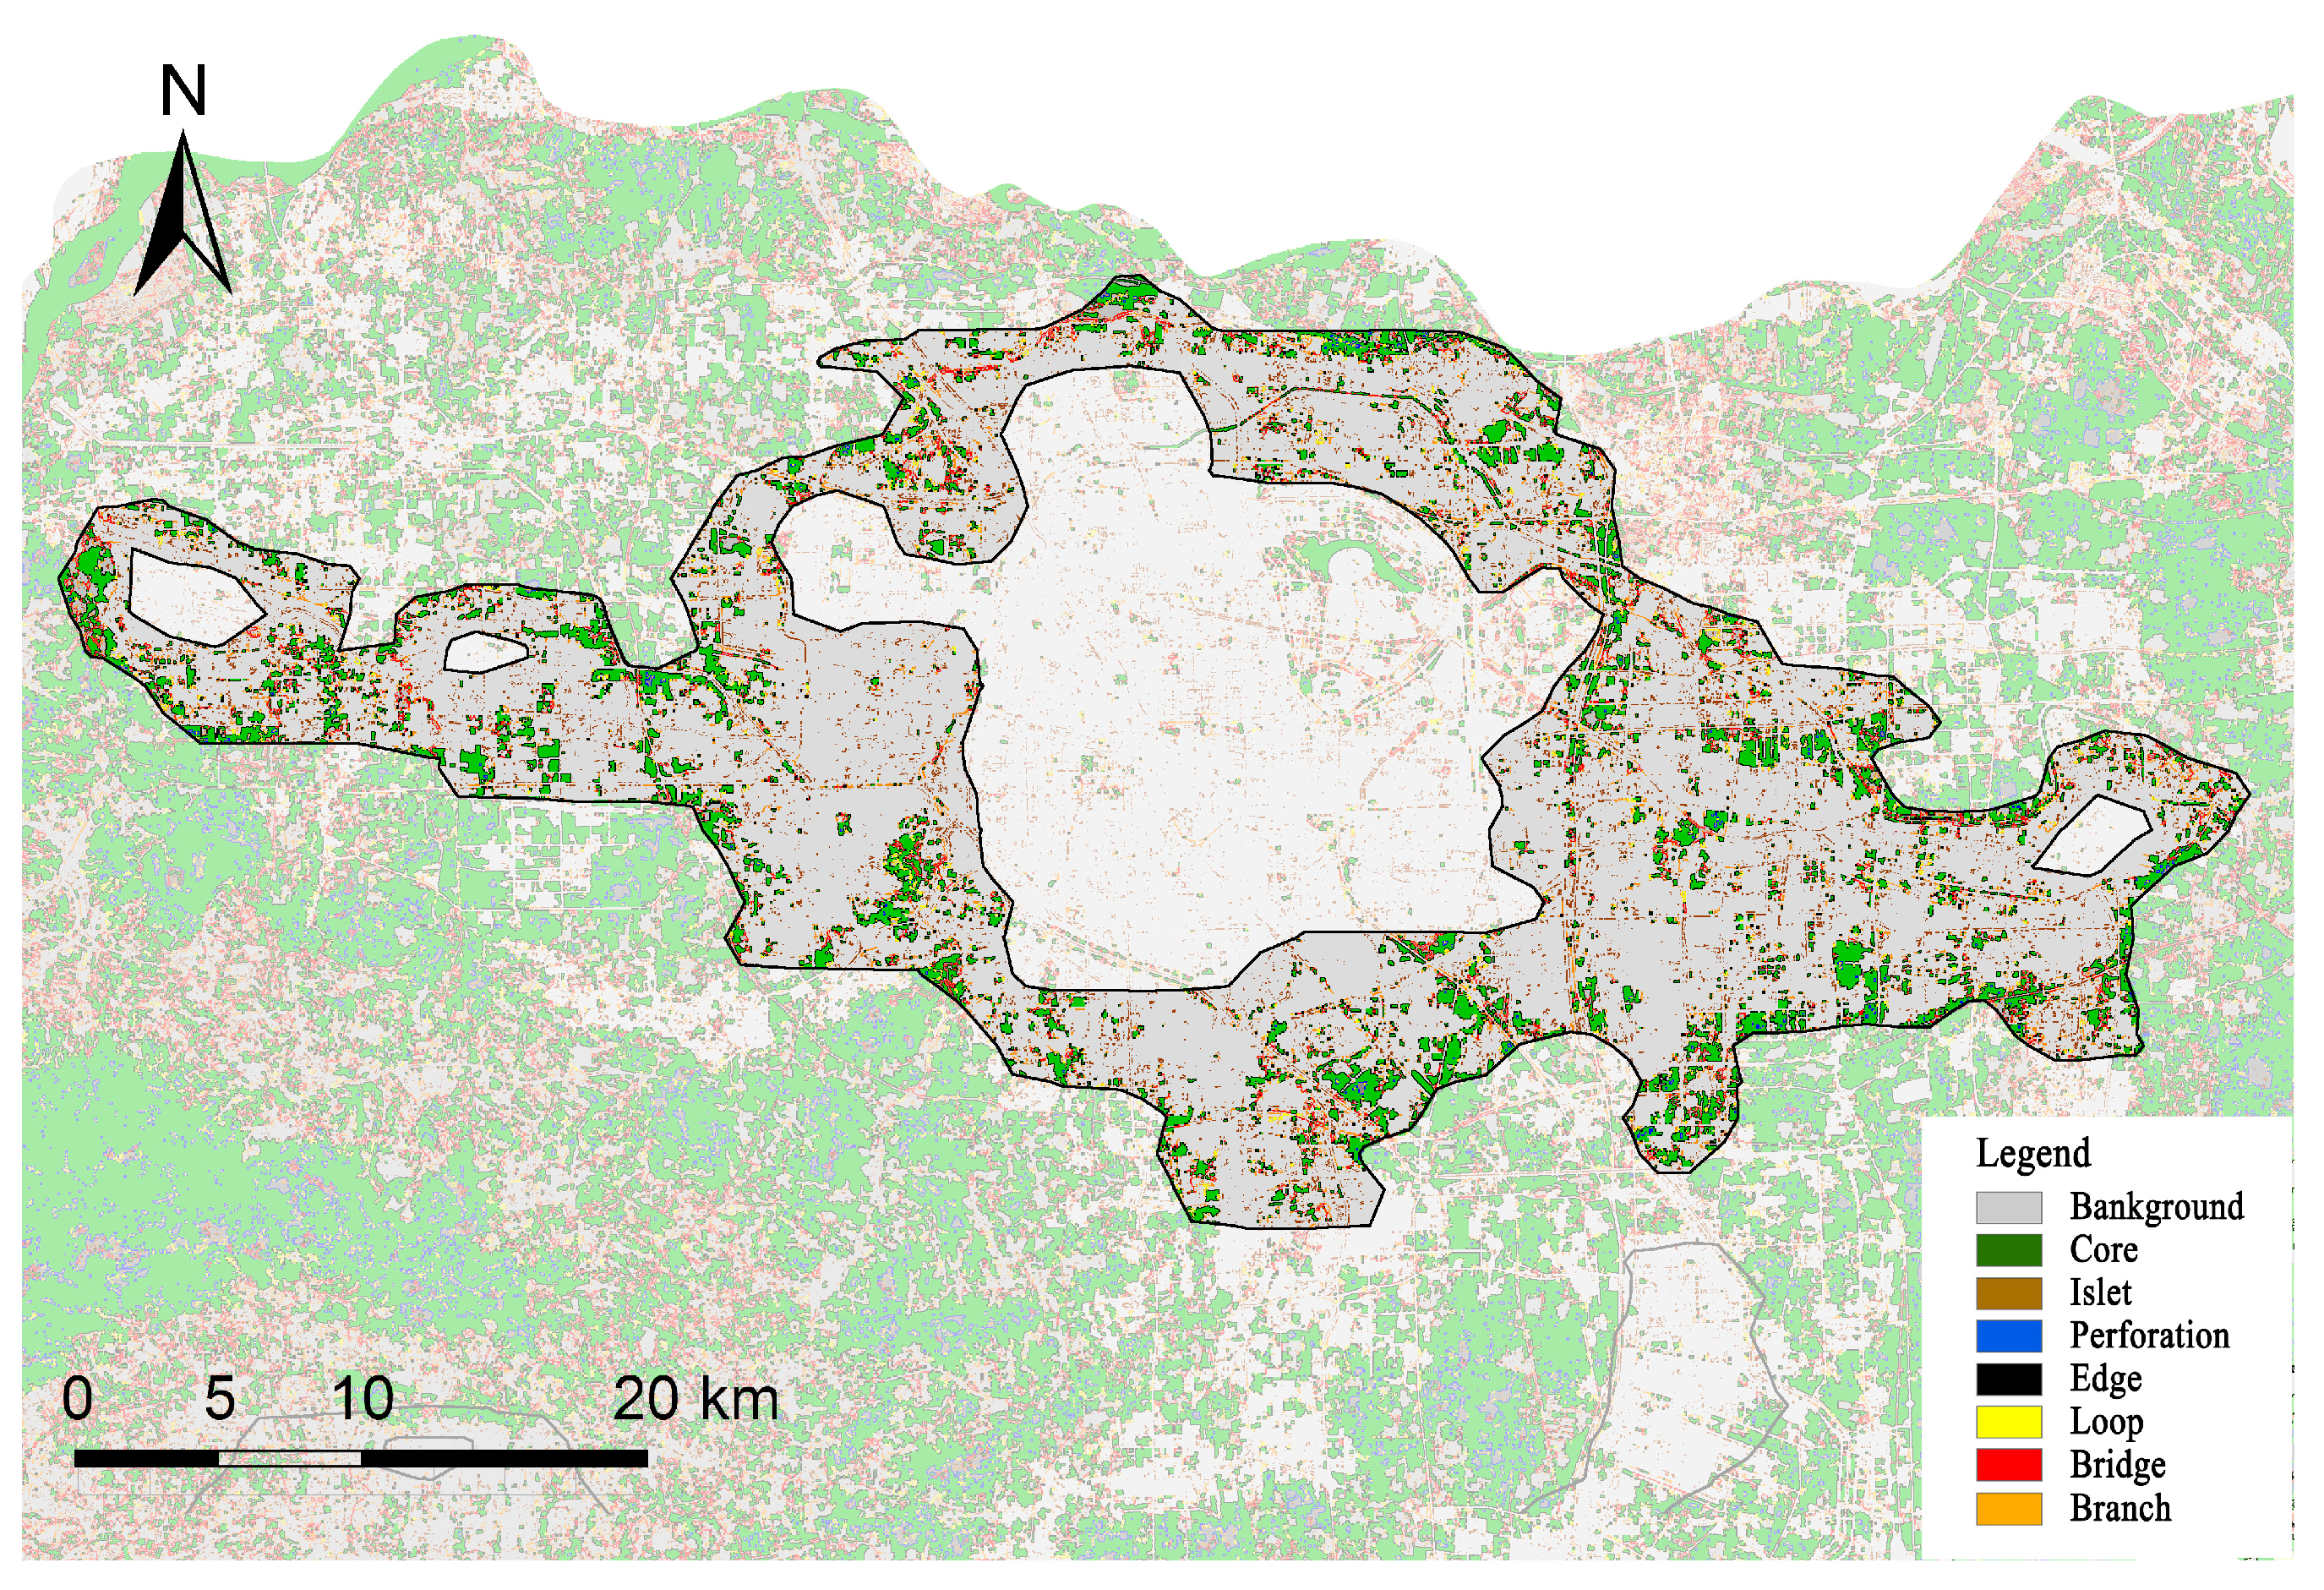
3.1.2. Analysis of GIN Elements in the Urban Fringe

The spatial distribution of the seven landscape types in the urban fringe of Zhengzhou, derived from MSPA, is illustrated in Figure 8, with detailed statistical results of the spatial analysis provided in Table 6. The GI land within this area accounts for only 6.83% of the total GI land in Zhengzhou City. The patch sizes in this area range approximately from 0.01 km2 to 2.83 km2.
In terms of MSPA types, core areas are a crucial habitat type in the GIN, primarily distributed along rivers, lakes, and major transportation corridors, with fragmented and unevenly distributed patches. Bridge areas, serving as connecting pathways between patches, occupy a small spatial proportion and exhibit significant fragmentation. Edge and perforation areas are located on the outer and inner boundaries of core areas, respectively. Edge areas cover a relatively large proportion and are fragmented in distribution, while perforation areas are more numerous and larger in the southern and eastern regions, indicating severe degradation of core areas. Branches are interrupted connecting corridors, widely distributed across the region. Islet patches are small and fragmented, mainly concentrated in construction lands and along roads. Loop areas are distributed within large core patches.
In terms of land use types, the study area is primarily composed of small-scale agroforestry patches, with forest land and cultivated land as the main ecological land uses. The most widely distributed patches are the core and edge patches, in that order. Forest land is mainly composed of agroforestry land and protective forest areas, while cultivated land is small, fragmented, and characterized by numerous gaps. Grasslands are predominantly found in areas with low vegetation cover and high susceptibility to erosion, such as the edge, branch lines, and island areas. Water bodies mainly consist of rivers, artificial lakes, and reservoirs, with surrounding ecological patches predominantly located in the core area, bridge area, and ring corridors.

3.2. Prioritization of the Green Infrastructure Network

Figure 9 presents the evaluation results of the GI land value in the urban fringe of Zhengzhou, guided by public benefit outputs. Within the study area, high-output land (level 4 and above) oriented towards ecological conservation is predominantly distributed in forest land and water bodies (Figure 9a). High-output land (level 4 and above) oriented towards rural-urban services is mainly located along rivers and major transportation corridors. Along rivers, small riparian parks and forest land dominate, while along transportation corridors, green protective belts are the primary feature (Figure 9b). Comprehensive high-value public benefit outputs include the Xianghu Ecological Wetland Park, Diehu Park, Xiliu Lake Park, Changzhuang Reservoir, Jiangang Reservoir, and linear green spaces along certain rivers and transportation corridors (Figure 9c). The results indicate that the GI landscape types are relatively homogeneous and limited in number. Additionally, they are fragmented by construction land, failing to form a complete ecological network.

3.3. Construction of a Triple-Network Integrated Planning System

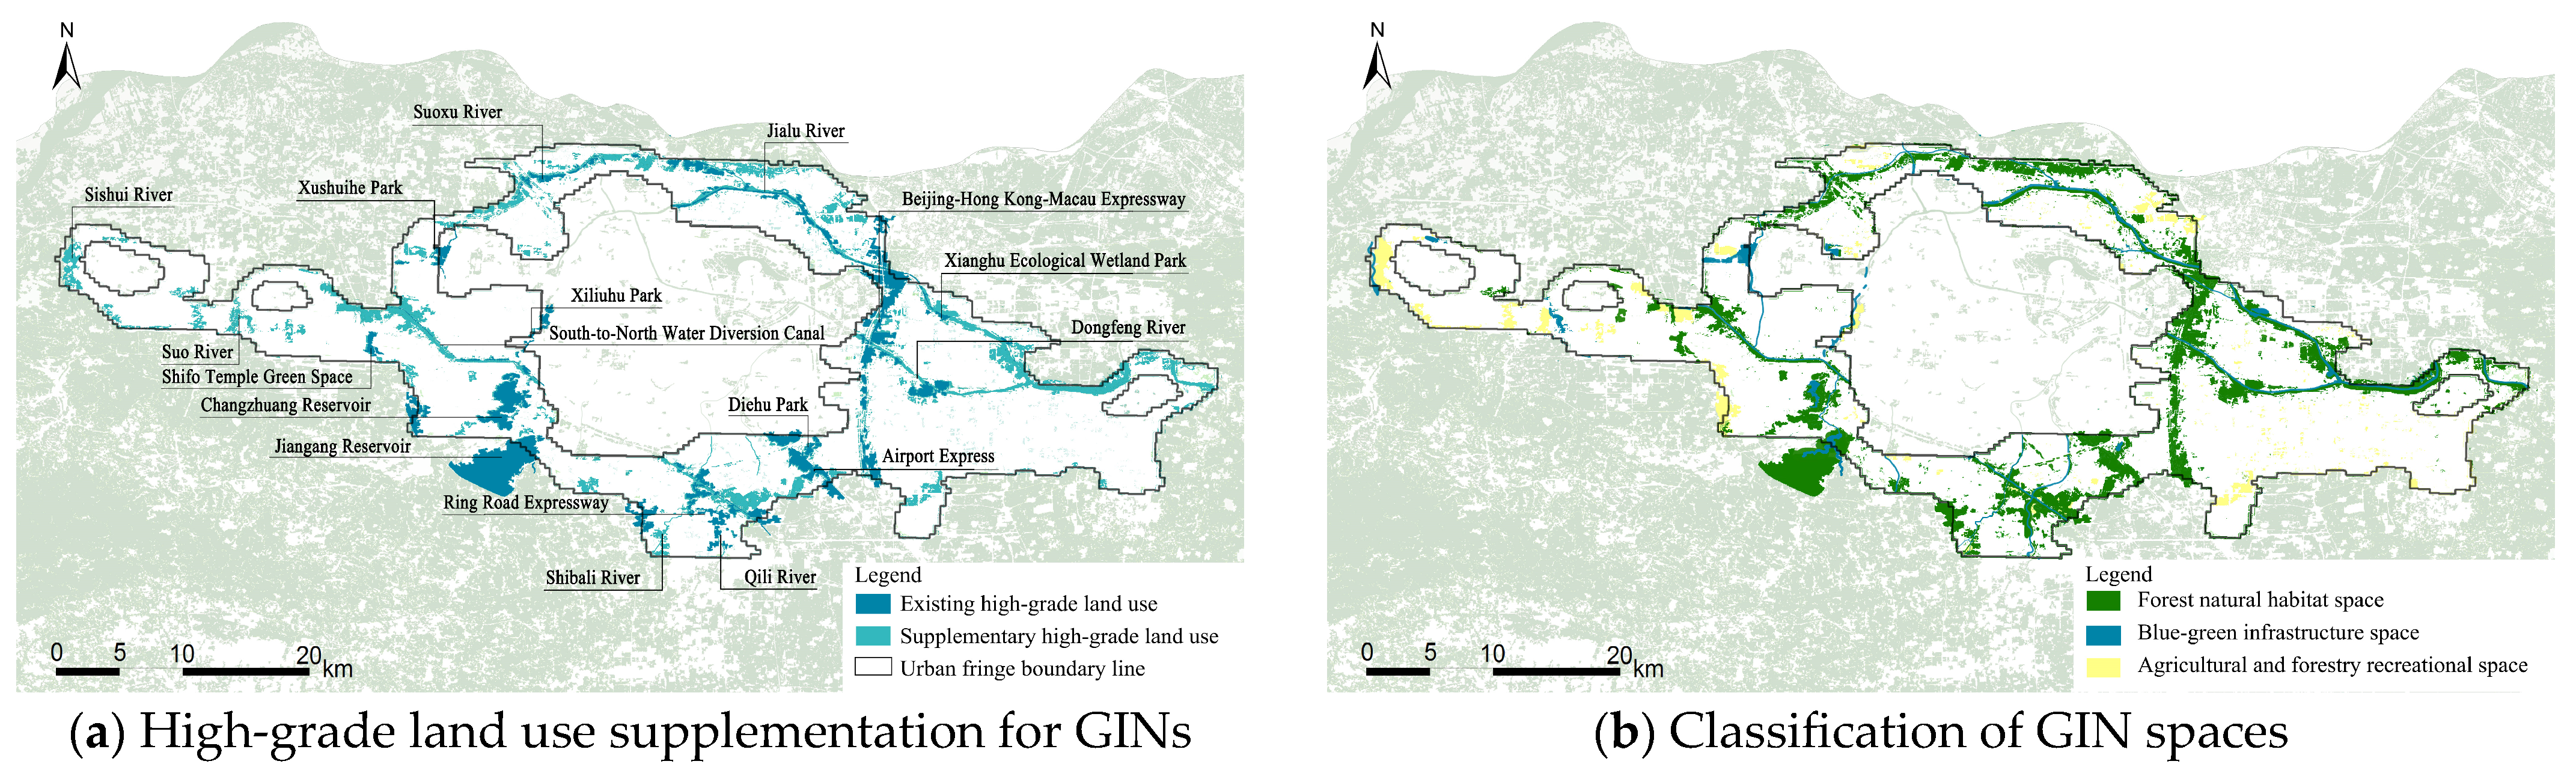
3.3.1. Supplementation and Spatial Classification of High-Output Land for GIN

To ensure the structural integrity of the GIN and enhance the functionality of high-output GINs, we supplemented high-grade GI land (Figure 10a). On one hand, fragmented patches (such as islets, branches, and bridges) and non-construction land adjacent to existing high-grade land were integrated and designated as priority areas. On the other hand, in regions with a lack of high-grade land, such as the areas surrounding Xingyang, Shangjie, and Zhongmu, patches rated as level 2 and level 3 in the ecological conservation and rural-urban service evaluations were selected as supplements. Based on this, we spatially classified the GIN within the study area into the forest natural network, the blue-green infrastructure network, and the agroforestry recreation network (Figure 10b).

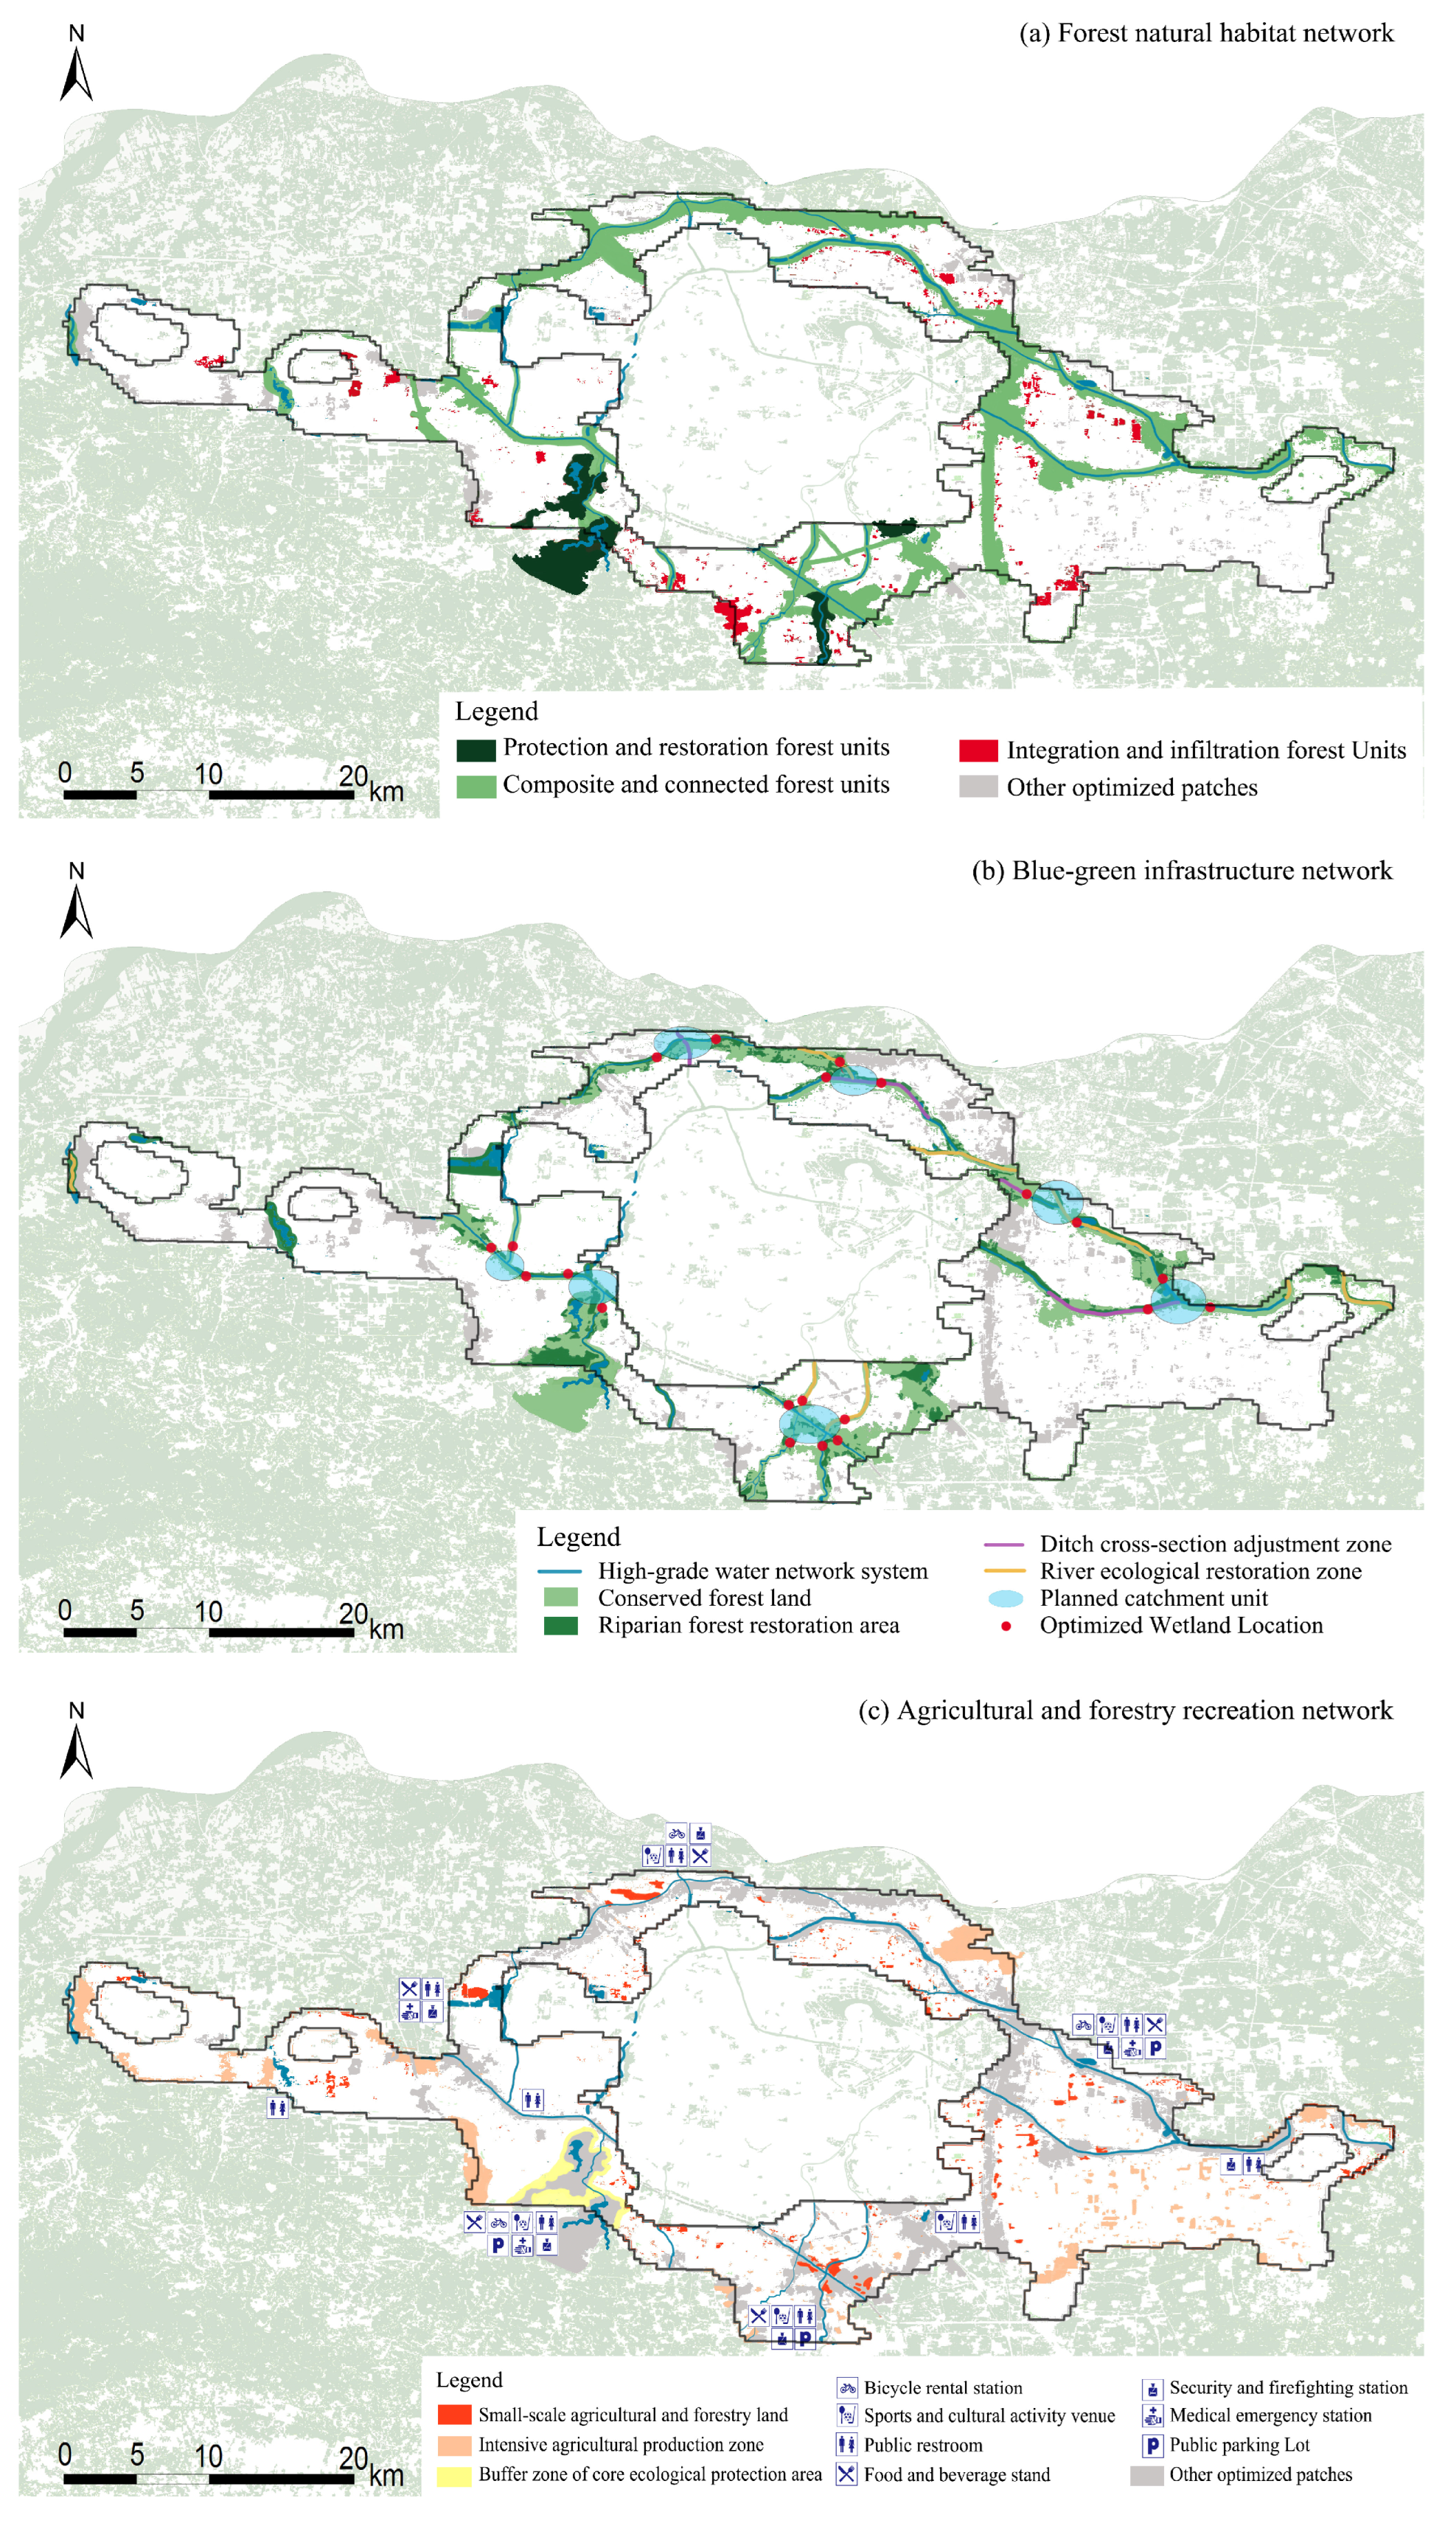
3.3.2. Multifunctional Network Planning

Figure 11 illustrates the GIN spatial planning scheme, which is derived by considering spatial priorities and integrating public welfare output. Based on this, the study combines the functional and spatial interconnections and synergies of the three types of networks, forming a multifunctional and coordinated GIN space. This space is created using the approach of “ecological foundation with functional integration” [35], which aims to preserve the region’s ecological spatial structure while counteracting the expansion of urban development areas (Table 7). In this context, this study discusses how the habitat spaces of the three types of networks can be designed based on public benefit output design principles.

4. Discussion

The multi-layered nature of GINs helps establish a relationship between human activity regulation and natural conservation. To ensure the sustained and effective provision of public benefit outputs from GINs in urban fringe areas, its construction and optimization should align with the current landscape resources and urban functional demands (Table 5). While maintaining the integrity of green patches and corridor systems and ensuring natural conservation functions, GINs should integrate with agricultural matrices and construction lands to enhance the output efficiency of urban-rural public benefit services. The three types of networks differ in public benefit outputs, objectives, and planning responses. The core of GIN spatial planning in urban fringe areas lies in matching planning measures to the characteristics of each network, overlaying classified spatial systems to promote multifunctional integration while mitigating conflicts between different functions [35].

4.1. Forest Natural Space Design for GIN Planning

The goal of network planning for this type of land use space is primarily to enhance the output of natural conservation functions. For different habitat patches, the corresponding planning and optimization measures include three categories: “Protection and restoration”, “Composite and connected”, and “Integration and infiltration” (Figure 11a).
The “Protection and restoration” units refer to areas with relatively large-scale forest patches and ecological conservation levels of 4 or above, such as the forest patches near the Changzhuang Reservoir, Jiangang Reservoir, and the southern section of Qili river. These areas are designated as core habitat protection zones, with buffer zones delineated based on the ecological sensitivity of the patches and the surrounding land use conditions. The conservation and restoration efforts include repairing habitat patches damaged by urban development or agricultural production, integrating abandoned lands, and enhancing functions such as water and soil conservation and natural disaster prevention.
The “Composite and connected” unit integrates relatively fragmented forest patches along rivers and roads into a connected greenway. On one hand, it strengthens the connection between artificial green spaces within the city and natural ecological areas, providing migration and refuge corridors for wildlife. On the other hand, it mitigates the negative impact of agriculture-related traffic and production on the ecological environment through the construction of ecological green corridors and agroforestry networks.
The “Integration and infiltration” unit focuses on scattered small semi-natural habitat patches around construction areas and agricultural production zones. After planning and integration, these patches form a concentrated, cohesive, and mutually interconnected habitat unit. This unit can connect with neighboring large patches to create a stable habitat space and also provide ecological stepping stones and temporary refuge for species.

4.2. Blue-Green Space Design for GIN Planning

The planning and optimization objectives for the blue-green infrastructure network in this study are to utilize high-output water bodies and buffer green belts within the study area to connect adjacent ecological lands, forming a comprehensive blue-green network. The corresponding measures include establishing a water network system as the foundation, strengthening connectivity through “buffer green belts”, and integrating natural and artificial systems (Figure 11b).
First, the connections among rivers, lakes, ponds, and ditches along the blue-green infrastructure network within the study area are identified and reconstructed to form a complete and interconnected water network system with a “river-lake-pond” foundation. Second, to address severely degraded ecosystems and unnecessary channelized river sections, the plan replaces these channelized riverways with “buffer green belts,” allowing green spaces and water bodies to jointly create a seamlessly integrated blue-green space. Specifically: ① ditch cross-section adjustment zone focus on river sections where ecological flow is obstructed due to channelization; ② river section ecological restoration areas target sections suffering from water pollution and poor water quality; ③ riparian forest restoration areas aim to restore and connect vegetation and soil in damaged green belts that are polluted, eroded, or abandoned along the waterfront. Third, a planning approach integrating both “natural and artificial” systems is adopted, reserving a certain amount of space to mitigate anticipated negative impacts. Specifically: ① optimize catchment units by reserving main surface runoff paths and water collection depressions as catchment areas; ② optimize wetland layout by supplementing wetlands at water system junctions to prevent secondary pollution of adjacent water bodies, such as rivers; ③ optimize plant species selection and maintenance techniques, combining vegetation maintenance with irrigation models that align with hydrological and ecological processes.

4.3. Agroforestry Recreation Space Design for GIN Planning

The planning and optimization design of the agroforestry landscape recreation network is reflected in the spatial organization, which is dominated by (semi-)natural forest networks within the study area, with recreational, leisure, and environmental education services integrated as subordinate functions. This network connects to the ecological spaces of the urban core through various greenway forms, such as farmland, forestland, and waterfront areas. It not only extends and supplements the internal open spaces outward but also enhances the convenience of urban-rural interaction, thereby promoting the synergistic effects of ESs (Figure 11c).
Among the three types of planned areas: small-scale agroforestry lands near the urban core area can provide productive land for local food supply, easily accessible suburban recreational areas, and ecological stepping stones and refuges for urban species, while also protecting the topsoil of high-yield lands [41]. The planning of agricultural production areas strengthens the protection of semi-natural forests, shrubs, grasslands, small water bodies, etc., as well as their integration with agricultural landscapes, through the layout of rivers, roads, and protective greenways, thereby enhancing the dual function of ecological corridors for both connection and isolation [42]. The planning of agroforestry patches around core ecological protection areas, such as the Changzhuang Reservoir and Jianggang Reservoir, retains a moderate amount of small-scale agroforestry land along their edges and nearby areas. These patches can serve as ecological buffer zones, enrich landscape types, provide recreational spaces, and alleviate the ecological pressure caused by excessive human traffic.

4.4. Triple-Network Overlay and Service Performance-Oriented Scheme Adjustment

The three types of GIN mentioned above are functionally and spatially interconnected, with their spatial elements exhibiting two key relationships: “intersection” and “parallelism”. It is essential to resolve the conflicts and contradictions that arise between these networks, which stem from the interactions of multiple stakeholders, leading to multiple potential solutions [43]. The optimal choice should be based on the evaluation of public benefit output efficiency. For instance, the Changzhuang and Jiangang Reservoirs are rated higher in terms of ecological conservation than in urban-rural services, particularly in their role in protecting critical or sensitive land uses. As such, when conflicts arise between the planning of forest natural habitat areas and agroforestry recreation spaces, priority should be given to land use for the “protection and restoration” units within the forest natural habitats to maximize their ecological conservation outcomes.
To effectively promote the implementation of GINs, a comprehensive regulatory framework is required, encompassing policy support, interdepartmental collaboration, public participation, and monitoring and evaluation. Policy support includes: ① establishing an ecological compensation mechanism to incentivize developers or communities to participate in ecological protection and restoration; ② integrating existing land use regulations to restrict development activities in high-output and highly sensitive areas while encouraging multifunctional land use (e.g., eco-tourism); and ③ promoting the construction and maintenance of blue-green infrastructure through policy incentives such as tax reductions or funding support. The establishment of an interdepartmental collaboration mechanism ensures coordinated implementation of different network plans, avoiding functional conflicts. Additionally, by leveraging the educational, recreational, and leisure functions of GI lands, public ecological awareness can be enhanced, encouraging community participation in the ecological protection and maintenance of urban fringe areas. Finally, dynamic monitoring and evaluation provide a scientific basis for the sustainable implementation of GINs, ensuring the long-term realization of its ecological and social benefits.

4.5. Limitations and Future Directions

This study significantly advances the understanding of the public benefit output of ESs in urban fringe areas. In evaluating the urban fringe and high-output land, this research employed a DNN model, which was calibrated using real-world maps and field surveys, highlighting the critical need for model improvement and validation. The DNN model is capable of effectively capturing the complex spatial characteristics and nonlinear changes of urban fringe areas, demonstrating significant application potential and expansion prospects in the field of urban data analysis. However, the model also exhibits limitations such as strong data dependency and high computational resource requirements. In this study, these limitations are primarily reflected in the collection and processing of multi-type data: the model training requires a large amount of high-quality, diverse annotated data, yet obtaining comprehensive and high-quality annotated data remains challenging. Future research will focus on optimizing model parameters by incorporating additional biological and landscape indicator data to improve computational accuracy [44], while also validating and calibrating the results through comprehensive field observations.
This study established a priority-based composite evaluation system for ES assessment, while acknowledging its limitations in fully considering non-quantifiable indicators and species diversity. In further refining the evaluation system, the inclusion of these two types of indicators will provide a more comprehensive focus, helping to reflect the realities at the humanistic and meso-micro levels.
We incorporated a mixed-use integration approach in the planning of GINs. However, a limitation of this study in GIN planning is the lack of a comprehensive performance management and implementation control system for the urban fringe areas. Specifically, agricultural and forestry land spaces near the urban core, due to their scattered layout and small patches, were not included within the protection boundaries of basic farmland and ecological red lines. Additionally, the absence of necessary planning and control measures has led to poor compatibility between the various functions of the land, resulting in issues such as land encroachment, environmental pollution, and competition between agricultural and green spaces. Further studies need to be conducted to build a GIN that establishes a planning and control system considering how small habitat systems in the fringe areas can sustain and adapt to socio-ecological changes.

5. Conclusions

Based on multi-source data and the use of a DNN model to determine the urban fringe areas of Zhengzhou, this study adopts a public welfare output planning framework to construct a multifunctional GIN to address the protection and utilization of small agricultural and forestry land in urban fringe areas. This approach helps maximize the delivery and transfer functions of ESs in the fringe areas by providing the necessary public welfare outputs for recovery from urban expansion and environmental disasters. Previous studies have mainly focused on ESs in urban areas or entire regions, rather than on the integration functions between the inner and outer fringe areas. In this context, the GIN model for Zhengzhou’s urban fringe area treats the small habitat spaces of the region as key resources for the transportation and delivery of ESs between the urban core and the periphery. The GIN planning concept and method proposed in this study can be applied to other developing cities facing land imbalance and high environmental disaster risks in their urban fringe areas.
Integrating the above research findings, we propose a feasible planning framework for the development, protection, and utilization of Zhengzhou’s urban fringe, aimed at guiding decision-makers and practitioners. By incorporating human activities and urban ecosystems through three types of network spaces, the framework seeks to meet the dynamic development needs of urban areas. Our planning focuses on three key aspects: ① composite planning objectives based on public benefit outputs: assessing the current output functions of GI land. ② Guided by the protection of microhabitat systems and urban service demands, identifying land patches with potential for public benefit output and analyzing associated ecological processes to develop planning pathways that address both ecological and urban demands. ③ Land use layout emphasizing multifunctionality, implementing protection and utilization strategies to construct a spatial framework that integrates the forest natural habitat network, blue-green infrastructure network, and agroforestry recreation network.

Author Contributions

Conceptualization, D.W., C.Z. (Can Zhao) and Q.F.; methodology, D.W. and B.X.; software, D.W. and C.Z. (Can Zhao); validation, D.W., C.Z. (Chenming Zhang), Q.F., B.X. and D.K.; formal analysis, D.W. and C.Z. (Can Zhao); investigation, Q.F., B.X. and D.K.; resources, D.W. and D.K.; data curation, D.W. and D.K.; writing—original draft preparation, D.W. and C.Z. (Can Zhao); writing—review and editing, D.W., Q.F., B.X. and D.K.; visualization, D.W. and. C.Z. (Chenming Zhang); supervision, Q.F. and B.X.; project administration, Q.F. and C.Z. (Chenming Zhang); funding acquisition, Q.F. and B.X. All authors have read and agreed to the published version of the manuscript.

Funding

This research was funded by: (1) General Program of Humanities and Social Sciences Research in Universities of Henan Province in 2025 [grant number: 2025-ZDJH-585]; (2) Henan Province’s Science and Technology Research and Development in 2025 [project title: Assessment and Optimization Application of Carbon Sequestration Service Flow in Zhengzhou City]; (3) Henan Provincial Philosophy and Social Sciences Planning Project [2024CJJ152]; (4) Henan Urban and Rural Planning and Design Research Institute Co., Ltd. [project title: Ecological Resilience Assessment and Optimization in Henan Province].

Data Availability Statement

The data presented in this study are available on request from the first author.

Acknowledgments

We would like to thank the support staff of the International Joint Laboratory of Landscape Architecture, Henan Agricultural University for their infinite help. We also thank the Data Center for Resources and Environmental Sciences, Zhengzhou Ecological Environment Bureau, and Henan Provincial Department of Natural Resources.

Conflicts of Interest

Author Baolin Xia was employed by the company Henan Urban Planning Design Institute Co., Ltd. The remaining authors declare that the research was conducted in the absence of any commercial or financial relationships that could be construed as a potential conflict of interest.

References

  1. John, B.; Luederitz, C.; Lang, D.J.; von Wehrden, H. Toward Sustainable Urban Metabolisms. From System Understanding to System Transformation. Ecol. Econ. 2019, 157, 402–414. [Google Scholar] [CrossRef]
  2. Lynn, J.; Peeva, N. Communications in the IPCC’s Sixth Assessment Report cycle. Clim. Chang. 2021, 169, 18. [Google Scholar] [CrossRef] [PubMed]
  3. Kalnay, E.; Cai, M. Impact of Urbanization and Land-Use Change on Climate. Nature 2003, 423, 528–531. [Google Scholar] [CrossRef] [PubMed]
  4. Wang, Y.C.; Shen, J.K.; Xiang, W.N. Ecosystem Service of Green Infrastructure for Adaptation to Urban Growth: Function and Configuration. Ecosyst. Health Sustain. 2018, 4, 132–143. [Google Scholar] [CrossRef]
  5. Griffiths, M.B. Lamb Buddha’s Migrant Workers: Self-Assertion on China’s Urban Fringe. J. Curr. Chin. Aff. 2010, 39, 3–37. [Google Scholar] [CrossRef]
  6. Wang, Z.F.; Li, D.; Cheng, H.J.; Luo, T. Multifaceted Influences of Urbanization on Sense of Place in the Rural–Urban Fringes of China: Growing, Dissolving, and Transitioning. J. Urban Plann. 2020, 146, 04019026. [Google Scholar] [CrossRef]
  7. Saurav, C.; Indranil, M.; Pravin, P.P.; Hashem, D.; Suvamoy, P.; Alexander, F.; Josef, N.; Utpal, R. Spatio-temporal Patterns of Urbanization in the Kolkata Urban Agglomeration: A Dynamic Spatial Territory-Based Approach. Sustain. Cities Soc. 2021, 67, 102715. [Google Scholar] [CrossRef]
  8. Yang, J.Y.; Xing, Z.; Cheng, C.H. How Urban Fringe Expansion Affects Green Habitat Diversity? Analysis from Urban and Local Scale in Hilly City. J. Environ. Public Health 2022, 2022, 8566686. [Google Scholar] [CrossRef]
  9. Marques, A.L.; Alvim, A.T.B. Metropolitan Fringes as Strategic Areas for Urban Resilience and Sustainable Transitions: Insights from Barcelona Metropolitan Area. Cities 2024, 150, 105018. [Google Scholar] [CrossRef]
  10. Xiao, D.Q.; Yuan, Q.; Xu, X.C.; Zhang, S.B. Investigating Injury Severity Interaction Between Urban and Urban-Rural Fringe Areas: A Grouped Random Parameters Seemingly Unrelated Bivariate Probit Approach. Int. J. Inj. Control Saf. Promot. 2024, 31, 30–37. [Google Scholar] [CrossRef]
  11. Korkou, M.; Tarigan, A.K.M.; Hanslin, H.M. The Multifunctionality Concept in Urban Green Infrastructure Planning: A Systematic Literature Review. Urban For. Urban Green. 2023, 85, 127975. [Google Scholar] [CrossRef]
  12. Wang, D.M.; Guo, Y.; Liu, C.; Tang, P.X.; Jiao, J.; Kong, W.H.; Liu, Y.P.; Kong, D.Z. Identification of High-Value Land for Green Infrastructure in Urban Fringe Areas: A Case Study of Zhengzhou, Henan Province, China. J. Urban Plann. Dev. 2023, 149, 05023005. [Google Scholar] [CrossRef]
  13. Jeong, D.; Kim, M.; Song, K.; Lee, J. Planning a Green Infrastructure Network to Integrate Potential Evacuation Routes and the Urban Green Space in a Coastal City: The Case Study of Haeundae District, Busan, South Korea. Sci. Total Environ. 2020, 761, 143179. [Google Scholar] [CrossRef] [PubMed]
  14. Wang, D.S.; Zheng, H.; Ouyang, Z.Y. Ecosystem services supply and consumption and their relationships with human well-being. Chin. J. Appl. Ecol. 2013, 6, 1747–1753. [Google Scholar]
  15. Artmann, M.; Bastian, O.; Grunewald, K. Using the Concepts of Green Infrastructure and Ecosystem Services to Specify Leitbilder for Compact and Green Cities: The Example of the Landscape Plan of Dresden (Germany). Sustainability 2017, 9, 198. [Google Scholar] [CrossRef]
  16. Allan, P.; Bryant, M. Resilience as a Framework for Urbanism and Recovery. J. Landsc. Archit. 2011, 6, 34–45. [Google Scholar] [CrossRef]
  17. Monteiro, R.; Ferreira, J.C.; Antunes, P. Green Infrastructure Planning Principles: An Integrated Literature Review. Land 2020, 9, 525. [Google Scholar] [CrossRef]
  18. Gober, P.; Burns, E.K. The Size and Shape of Phoenix’s Urban Fringe. J. Plann. Educ. Res. 2002, 21, 379–390. [Google Scholar] [CrossRef]
  19. Duan, H.R.; Du, F.G.; Zhang, Y.J.; Jiang, X.J.; Chen, B. An Urban-Rural Fringe Extraction Method Based on Combined Urban-Rural Fringe Index (CUFI). Geocarto Int. 2024, 39, 2311211. [Google Scholar] [CrossRef]
  20. Pénzes, J.; Hegedus, L.D.; Makhanov, K.; Túri, Z. Changes in the Patterns of Population Distribution and Built-Up Areas of the Rural-Urban Fringe in Post-Socialist Context: A Central European Case Study. Land 2023, 12, 1682. [Google Scholar] [CrossRef]
  21. Alpesh, M.P. Adaboosted Extra Trees Classifier for Object-Based Multispectral Image Classification of Urban Fringe Area. Int. J. Image Graph. 2022, 22, 2140006. [Google Scholar] [CrossRef]
  22. Wang, Y.; Han, Y.L.; Pu, L.J.; Jiang, B.; Yuan, S.F.; Xu, Y. A Novel Model for Detecting Urban Fringe and Its Expanding Patterns: An Application in Harbin City, China. Land 2021, 10, 876. [Google Scholar] [CrossRef]
  23. Wang, C.R.; Sun, X.; Liu, Z.F.; Xia, L.; Liu, H.X.; Fang, G.J.; Liu, Q.H.; Yang, P. A Novel Full-Resolution Convolutional Neural Network for Urban-Fringe-Rural Identification: A Case Study of Urban Agglomeration Region. Landsc. Urban Plann. 2024, 249, 105122. [Google Scholar] [CrossRef]
  24. Li, J.F.; Peng, B.; Liu, S.Q.; Ye, H.P.; Zhang, Z.Y.; Nie, X.W. An Accurate Fringe Extraction Model of Small- and Medium-Sized Urban Areas Using Multi-Source Data. Front. Environ. Sci. 2023, 11, 1118953. [Google Scholar] [CrossRef]
  25. Zhu, J.; Lang, Z.Q.; Wang, S.; Zhu, M.Y.; Na, J.M.; Zheng, J.Z. Using Dual Spatial Clustering Models for Urban Fringe Areas Extraction Based on Night-Time Light Data: Comparison of NPP/VIIRS, Luojia 1-01, and NASA’s Black Marble. ISPRS Int. J. Geo-Inf. 2023, 12, 408. [Google Scholar] [CrossRef]
  26. Hinton, G.E.; Salakhutdinov, R.R. Reducing the dimensionality of data with neural networks. Science 2006, 313, 504–507. [Google Scholar] [CrossRef]
  27. Zhou, D.X. Universality of deep convolutional neural networks. Appl. Comput. Harmon. Anal. 2020, 48, 787–794. [Google Scholar] [CrossRef]
  28. Li, G.Y.; Cao, Y.; He, Z.C.; He, J.; Wang, J.Y.; Fang, X.Q. Understanding the diversity of urban-rural fringe development in a fast urbanizing region of China. Remote Sens. 2021, 13, 2373. [Google Scholar] [CrossRef]
  29. Shen, J.K.; Guo, X.L.; Wang, Y.C. Identifying and setting the natural spaces priority based on the multi-ecosystem services capacity index. Ecol. Indic. 2021, 125, 107473. [Google Scholar] [CrossRef]
  30. Badiu, D.L.; Nita, A.; Ioja, C.I.; Nita, M.R. Disentangling the connections: A network analysis of approaches to urban green infrastructure. Urban For. Urban Green. 2019, 41, 211–220. [Google Scholar] [CrossRef]
  31. Serra, V.; Defraia, S.; Ledda, A.; Calia, G.; Corona, F.; De Montis, A.; Mulas, M. Ecological network, ecosystem services, and green infrastructure planning: A method for the metropolitan city of Cagliari, Italy. Netw. Spat. Econ. 2024, 4, 1–26. [Google Scholar] [CrossRef]
  32. The People’s Government of Henan Province. Spatial Planning of Zhengzhou Metropolitan Area (2018–2035). 2017. Available online: https://www.henan.gov.cn/ (accessed on 12 March 2021).
  33. The People’s Government of Zhengzhou. Zhengzheng Tong〔2022〕No. 13. Available online: https://public.zhengzhou.gov.cn/?a=theme&n=5 (accessed on 18 February 2023).
  34. Choi, J.Y.; Yu, E.S.H. A public-good approach to environmental economy. Int. J. Econ. Theory 2019, 15, 269–280. [Google Scholar] [CrossRef]
  35. Xing, Z.; Tang, X.Z.; Zhou, Q.; Gu, Y.Y.; Chen, Z.L. Green infrastructure network planning in urban fringe: From the perspective of ensuring public goods output. City Plann. Rev. 2020, 44, 57–69. [Google Scholar] [CrossRef]
  36. Matin, S.; Sullivan, C.A.; Finn, J.A.; hUallacháin, D.O.; Green, S.; Meredith, D.; Moran, J. Assessing the distribution and extent of High Nature Value farmland in the Republic of Ireland. Ecol. Indic. 2019, 108, 105700. [Google Scholar] [CrossRef]
  37. Wu, Y.Z.; Shi, K.F.; Chen, Z.Q.; Liu, S.R.; Chang, Z.J. Developing improved time-series DMSP-OLS-like data (1992–2019) in China by integrating DMSP-OLS and SNPP-VIIRS. IEEE Trans. Geosci. Remote Sens. 2022, 60, 4407714. [Google Scholar] [CrossRef]
  38. GB 3838-2002; Environmental Quality Standards for Surface Water. State Environmental Protection Administration, General Administration of Quality Supervision, Inspection and Quarantine of the People’s Republic of China: Beijing, China, 2002. Available online: https://www.mee.gov.cn/ (accessed on 25 March 2020).
  39. GB 18918-2002; Discharge Standard of Pollutants for Municipal Wastewater Treatment Plant. State Environmental Protection Administration, General Administration of Quality Supervision, Inspection and Quarantine of the People’s Republic of China: Beijing, China, 2002. Available online: https://www.mee.gov.cn/ (accessed on 25 March 2020).
  40. Tao, F.; Liu, X.; Du, H.D.; Yu, W.B. Learning composite constitutive laws via coupling Abaqus and deep neural network. Compos. Struct. 2021, 272, 114137. [Google Scholar] [CrossRef]
  41. Raciti, S.M.; Hutyra, L.R.; Finzi, A.C. Depleted soil carbon and nitrogen pools beneath impervious surfaces. Environ. Pollut. 2012, 164, 248–251. [Google Scholar] [CrossRef]
  42. Fischer, J.; Hartel, T.; Kuemmerle, T. Conservation policy in traditional farming landscapes. Conserv. Lett. 2012, 5, 167–175. [Google Scholar] [CrossRef]
  43. Plieninger, T.; Torralba, M.; Hartel, T.; Fagerholm, N. Perceived ecosystem services synergies, trade-offs, and bundles in European high nature value farming landscapes. Landsc. Ecol. 2019, 34, 1565–1581. [Google Scholar] [CrossRef]
  44. Kontokosta, C.E. Urban informatics in the science and practice of planning. J. Plann. Educ. Res. 2018, 41, 382–395. [Google Scholar] [CrossRef]
Figure 1. Location map of Zhengzhou.
Land 14 00572 g001
Figure 2. Comparison of administrative divisions and actual administrative districts and counties of Zhengzhou.
Land 14 00572 g002
Figure 3. GIN planning process and methods.
Land 14 00572 g003
Figure 4. Determining factors for the spatial structure scope of Zhengzhou.
Land 14 00572 g004
Figure 5. Technical approach for the spatial structure scope of Zhengzhou.
Land 14 00572 g005
Figure 6. Frame diagram of a DNN model.
Land 14 00572 g006
Figure 7. The delineation result of the urban fringe area in Zhengzhou.
Land 14 00572 g007
Figure 8. MSPA analysis result.
Land 14 00572 g008
Figure 9. Evaluation results of GI land value in the urban fringe of Zhengzhou.
Land 14 00572 g009
Figure 10. High-output GIN land in the urban fringe of Zhengzhou.
Land 14 00572 g010
Figure 11. Multifunctional network planning in the urban fringe area of Zhengzhou.
Land 14 00572 g011
Table 1. Policies, regulations, and related plans for addressing environmental issues in Zhengzhou.
Name of Plans and RegulationsIssuing AuthoritiesImplementation Time
Zhengzhou Urban Green Space System PlanZhengzhou Municipal Administration Bureau, Zhengzhou Urban Planning BureauSeptember 2002
Zhengzhou Environmental Protection 12th Five-Year PlanZhengzhou Environmental Protection BureauApril 2012
Zhengzhou Action Plan for Advancing New Urbanization Construction (2016–2018)Zhengzhou Municipal Government OfficeAugust 2016
Zhengzhou Comprehensive Land Use Plan (2006–2020)Zhengzhou Municipal People’s GovernmentAugust 2017
Zhengzhou Ecological Environmental Protection 13th Five-Year PlanZhengzhou Environmental Protection BureauNovember 2017
Guidelines for Sponge City Planning and Design in Zhengzhou Construction Projects Zhengzhou Bureau of Natural Resources and PlanningJanuary 2018
Zhengzhou Three-Year Action Plan for Winning the Battle for Clean Water (2018–2020)Zhengzhou Bureau of Natural Resources and PlanningOctober 2018
Zhengzhou Metropolitan Area Spatial Plan (2018–2035)Henan Provincial Party Committee Office, Henan Provincial Government OfficeDecember 2018
Zhengzhou Implementation Plan for the Battle Against Air Pollution in 2019Zhengzhou Municipal People’s GovernmentApril 2019
(Zhengzhou National Central City Forest Ecosystem Plan (2019–2025)Zhengzhou Municipal People’s GovernmentAugust 2019
Implementation Opinions on Further Strengthening Cultivated Land ProtectionZhengzhou Municipal People’s GovernmentNovember 2019
Forest Zhengzhou Ecological Construction Plan (2020–2035)Zhengzhou Municipal People’s GovernmentSeptember 2020
Table 2. Sources and processing methods.
DateData SourceData Scal/Type/ResolutionData Processing
Landsat remote sensing image mapGDC (http://www.gscloud.cn)
accessed on 22 May 2020
Zhengzhou area/GRID/30 mSynthesize, fuse, and create true-color mosaics of remote sensing images to form land satellite remote sensing imagery.
Land use/coverGDC (http://www.gscloud.cn)
accessed on 22 May 2020
Zhengzhou area/GRID/30 mProduced based on supervised classification of Landsat remote sensing images.
Landscape disorderGenerated based on the processing of land use/coverZhengzhou area/Vector shapefile (polygon)/100 m W = n = 1 N X n ln ( X n ) ,   where W is value of landscape disorder; Xn is ratio of a certain type of land use within a unit area to the area of a unit grid; n is number of land-use type patches within a unit grid.
Nighttime light datePayne Institute for Public Policy (https://payneinstitute.mines.edu/eog/nighttime-lights/)
accessed on 9 September 2020
Zhengzhou area/Vector shapefile (polygon)/100 mThe corrected DMSP-OLS-like data for Zhengzhou in 2020, obtained by integrating DMSP-OLS and SNPP-VIIRS data [37]. Interpolation refinement.
Demographic dateResource and Environmental Science Data Platform (https://www.resdc.cn/Default.aspx)
accessed on 15 March 2021
Zhengzhou area/Vector shapefile (polygon)/100 mInterpolation refinement.
POI point dataBaidu Maps (https://map.baidu.com/)
accessed on 20 May 2020
Zhengzhou area/Vector shapefile (polygon)/100 mObtained from Baidu Maps using web scraping technology based on Python 3.7.
Water environment dataReport on the Ranking of River Water Quality in Zhengzhou City for 2020 (http://sthjj.zhengzhou.gov.cn/) and Gaode Environmental Map (https://ditu.amap.com/)
accessed on 28 March 2021
Urban fringe area of Zhengzhou/River section/1 mThe index calculation adopts the Class 3 standards from the Environmental Quality Standards for Surface Water (GB3838-2002) [38] and the Grade A1 standards from the Discharge Standard of Pollutants for Municipal Wastewater Treatment Plant (GB18918-2002) [39].
Ecological protection landOfficial Website of the Department of Natural Resources of Henan Province (https://dnr.henan.gov.cn/)
accessed on 25 March 2021
Zhengzhou area/Vector shapefile (polygon)/30 m Based on the Guidelines for Defining Ecological Protection Redlines, the land area of the ecological protection zones was selected and converted into vector format.
Historical and cultural landOfficial Website of the Department of Housing and Urban-Rural Development of Henan Province (https://hnjs.henan.gov.cn/), Official Website of the Henan Provincial Administration of Cultural Heritage (https://wwj.henan.gov.cn/)
accessed on 25 March 2021
Zhengzhou area/Vector shapefile (polygon)/30 m Convert the land area into vector format.
Other land use dataBaidu Maps (https://ditu.amap.com/)Zhengzhou area/Vector shapefile (polygon)/30 m Convert the land area into vector format.
Table 3. Evaluation indicators for the ecological conservation functions of GI land.
Functional UnitEvaluation FactorsEvaluation ThresholdUnitBasisPatch Level
Disaster
protection
Patch area0.1km2Results of the MSPALevel 1
ConnectivitydPC ≥ 1Importance of habitat patchesLevel 2
Protection of critical or sensitive landWater qualityIII, IIEnvironmental Quality Standards for Surface Water GB 3838-2002Level 3 or Level 4
Ecological conservation source areasYesGuidelines for Delineating Ecological Protection Red LinesLevel 5
Table 4. Evaluation indicators for the rural-urban services functions of GI land.
Functional UnitEvaluation FactorsEvaluation ThresholdUnitBasisWeight Value
Leisure and
recreation
Proximity to urban functional areas800, 1000, 1500, 2000, 3000mClassification of Urban Land Use and Planning Construction Land Standards GB 50137-20110.1891
Proximity to existing scenic areas2000, 2500, 3000, 3500, 5000mGeneral Planning Standards for Scenic Areas GB/T 50298-20180.0703
Greenway/waterfront connectivity300, 500, 800, 1000, 1500mClassification of Urban Land Use and Planning Construction Land Standards GB 50137-20110.1225
Transport accessibility5, 10, 15, 20, 25minPlanning and Design Standards for Urban Residential Areas GB 50180-20180.1949
Historical preservationHistorical Heritage Protection LevelsCounty-level Cultural Heritage Protection Units (I); Municipal-level Cultural Heritage Protection Units (II); Provincial-level Cultural Heritage Protection Units, and Historical and Cultural Districts, Villages, and Towns (III); Historical and Cultural Cities, and Towns, Villages of China (IV); National Key Cultural Heritage Protection Units (V)Law of the People’s Republic of China on the Protection of Cultural Relics (2017 Revised Edition)0.1093
Land protectionProximity to high-density development area800, 1000, 1500, 2000, 3000mClassification of Urban Land Use and Planning Construction Land Standards GB 50137-20110.1816
Proximity to municipal facilities300, 500, 800, 1000, 1500mClassification of Urban Land Use and Planning Construction Land Standards GB 50137-20110.1323
Table 5. Classification optimization goals and strategies for GINs in the study area.
Types of GINIncluded Landscape TypesESs ProductionEcosystem Function Support Requirements
Forest natural habitat spaceNatural/semi-natural habitat functional unit, land conservation functional unit, natural forest corridor, artificial ecological corridorEstablishing continuous habitat networks to maintain regional biodiversity① Protecting core natural habitats and connectivity zones
② Strengthening the connection between small patches and core areas
③ Reducing external negative impacts
Blue-green infrastructure spaceRivers, lakes, and riparian green spacesRestoring river systems and their corridor functions to enhance ecosystem, recreational, and other service outputs① Mapping river systems and wetland ponds
② Enhancing public service outputs capacity through wetland and river corridor development
③ Integrating urban GINs
Agroforestry recreational spaceSmall-scale farmlands, orchards, grasslands, and semi-natural forestsRestoring agricultural landscapes to ensure the supply of resources and recreational services① Protecting small-scale, high-yield land patches
② Strengthening the construction of forest networks in agricultural production areas
③ Enhancing the connection and interaction with hydrological processes
Table 6. The MSPA landscape type classification statistics in 2020 (Unit: km2).
Landscape TypesCorePerforationLoopIsletEdgeBridgeBranchTotal
Farmland31.661.172.794.8321.046.958.5476.98
Woodland61.71.094.9323.6347.2912.7620.61172.01
Grassland18.670.411.174.8813.514.045.7548.43
Water body7.000.050.370.532.211.130.6811.97
Total120.532.829.3634.2785.0525.1836.08313.29
Proportion of GI in the urban fringe area (%)38.470.882.9910.9527.178.0411.50100.00
Proportion of the urban fringe area (%)11.750.270.913.348.302.463.5130.54
Table 7. Comparison of land protection and network strengthening effects before and after multifunctional network planning in the urban fringe area of Zhengzhou.
ProjectBlue-Green Infrastructure SpaceForest Habitat ConservationProtection of Productive Green SpacesWater Resource Conservation
Forest Cover RateNetwork ConnectivityReserved Forest LandRestored Forest LandReconstructed Forest LandReserved PondsRiver and Ditch Rehabilitation
Existing6.70%1.0271.33 km22.16%//
Planning11.03%1.4560.52%43.21%19.51%2.64%89116.31 km
Change(+) 4.33%42.16%(+) 62.72%(+) 0.48%//
Disclaimer/Publisher’s Note: The statements, opinions and data contained in all publications are solely those of the individual author(s) and contributor(s) and not of MDPI and/or the editor(s). MDPI and/or the editor(s) disclaim responsibility for any injury to people or property resulting from any ideas, methods, instructions or products referred to in the content.

