Article

Soil Organic Carbon Turnover Following Afforestation of a Savanna Revealed by Particle-Size Fractionation and Natural 13C Measurements in Ivory Coast

by
Thierry Desjardins
1,*,
Thierry Henry Des Tureaux
2,
Magloire Mandeng-Yogo
3 and
Fethiye Cetin
3
1
Institut d’Écologie et des Sciences de l’Environnement de Paris, Sorbonne Université, CNRS–INRA–UPEC–IRD—Université Paris Cité, Centre IRD France Nord, 75005 Paris, France
2
Institut d’Écologie et des Sciences de l’Environnement de Paris, Sorbonne Université, CNRS–INRA–UPEC–IRD—Université Paris Cité, Laboratoire d’Ecologie et du Développement Durable, Université Nangui Abrogoua, 02 B.P. 801 Abidjan, Côte d’Ivoire
3
Laboratoire d’Océanographie et du Climat, Expérimentation et Approche Numérique, IPSL, Sorbonne Université, CNRS-IRD-MNHN, Centre IRD France Nord, 4 Place Jussieu, 75005 Paris, France
*
Author to whom correspondence should be addressed.
Land 2025, 14(3), 535; https://doi.org/10.3390/land14030535
Submission received: 15 January 2025 / Revised: 24 February 2025 / Accepted: 25 February 2025 / Published: 4 March 2025
(This article belongs to the Section Land, Soil and Water)

Abstract

:
Soil organic matter plays a crucial role in the global carbon cycle, yet the magnitude and direction of changes in soil carbon content following vegetation shifts in the tropics remain highly debated. Most studies have focused on short-term changes, typically spanning only a few months or years. In this study, we investigated the medium-term dynamics of organic matter at a site where savanna, protected from fire for 58 years, has gradually transitioned to woodland vegetation. Natural 13C abundance analysis combined with particle-size fractionation was used to characterize the changes in SOM over time. While carbon content remains relatively stable, δ13C exhibits a distinct shift, particularly in the surface layers, reflecting the gradual replacement of savanna-derived carbon with tree-derived carbon. All fractions were influenced by the inputs and outputs of carbon from both savanna and tree sources. In the coarse fractions, most of the carbon originates from trees; however, a significant proportion of savanna-derived carbon (ranging from 10% to 40%, depending on the fraction, depth, and patch) persists, likely in the form of black carbon. In the fine fractions, nearly half of the carbon (40% to 50%) remains derived from the savanna, highlighting the greater stability of organic matter that is physically bound to clays and protected within microaggregates.

1. Introduction

Soils represent a significant terrestrial carbon sink, playing a crucial role in mitigating climate change by storing four times more carbon than the atmosphere, primarily in the form of organic matter [1,2]. Soil organic matter (SOM) plays a central role in nutrient availability, soil stability and in the flux of trace greenhouse gases between land surface and the atmosphere [3] (Smith et al., 2019). Generalizations about organic matter in tropical soils are unlikely to have wide applicability, because of the diversity of soils and the factors affecting organic matter dynamics. The idea that organic matter in tropical soils is different and of poorer quality from that of soils of the temperate zone is widely held. The higher rate of turnover of organic matter has led to this opinion, both about the quantity and quality of organic matter in soils of the tropics. However, the analytical data about tropical soils show clearly that the quantities of organic matter in tropical soils cover a wide range [4] (Greenland et al., 1992).
Changes in climate are likely to influence the rates of accumulation and decomposition of SOM through changes in temperature, moisture, and the rates of return of plant residues to the soil. Other changes, especially in land use and management, may have greater effects. Land-use change in the tropics is recognized to be of critical importance in the global carbon cycle [5,6] (Schimel, 1995) since (a) SOM turnover is faster in tropical than in temperate ecosystems [7,8] (Trumbore, 1993; Paustian et al., 1997b), (b) tropical ecosystem contain a large amount of carbon [9] (Foley, 1994), and (c) land-use changes is occurring rapidly in tropical regions [10] (Dixon et al., 1994).
Since the mid-1980s, the study of organic matter dynamics has frequently combined particle-size fractionation with the natural abundance of 13C isotope analysis [11,12,13]. The physical fractionation of soil organic matter (SOM) into particulate and mineral-associated organic matter has been recognized as an effective method for evaluating the effects of management practices on SOM [14,15]. This approach is grounded in the principle that interactions between SOM and soil minerals are key determinants of its stability and turnover [16].
Plant debris and fungal material associated with coarse particles form a labile pool, whereas carbon bound to clays and fine silts is regarded as a stable pool [14,17,18]. The distinct δ13C isotopic signatures naturally exhibited by C3 plants (e.g., trees, ranging from −25‰ to −28‰) and C4 plants (e.g., tropical grasses, ranging from −10‰ to −16‰) enable the quantification and identification of the primary sources of SOM within each fraction [19,20]. This approach facilitates tracking the dynamics of old carbon derived from the original vegetation, as well as new carbon inputs from recent vegetation changes [21,22].
In the tropics, numerous studies have investigated the dynamics of organic matter following deforestation and subsequent conversion to croplands or pastures [23,24,25]. In contrast, fewer studies have examined the effects of afforestation or reforestation of grasslands, which are often implemented through plantations, typically of eucalyptus or pine (e.g., [12,26,27]). Research on the natural recolonization of grasslands by tree vegetation, however, remains much rarer. In 1990, Martin et al. [28] published a study on the dynamics of organic matter in a savanna in Ivory Coast that had been protected from fire for 25 years, allowing the development of tree vegetation, and compared it with a control savanna subjected to annual burning. The objective of our study, revisiting the same site 33 years later, was to assess the long-term changes in carbon dynamics by measuring soil organic carbon (SOC) and natural carbon isotopic abundance (δ13C) in both bulk soil and different particle-size fractions. Was the SOC derived from savannah grasses (C4 plants) lost and replaced by SOC derived from trees (C3 plants) with time (>50 years) in all the soil fractions?

2. Material and Methods

2.1. Study Site and Sampling Process

This study was conducted at the Lamto Research Station in Ivory Coast (West Africa: 6°13′ N, 5°02′ W) at the edge of the rain forest domain [29], in the Guinean bioclimatic zone. The climate is sub-humid tropical, with a mean annual precipitation of 1300 mm, a pronounced inter-annual variability, and a mean annual temperature of 27 °C [30]. The vegetation is a mosaic of riparian forest, woodland, and shrub and grass savannas maintained by annual fires [31]. Most soils are formed on granite or derived sand and are classified as tropical ferruginous soils or ferralsols [32]. The savanna soils were sandy and slightly acidic (pH KCl values of around 6), whereas forest soils have a more loamy texture and are more acidic (pH below 5).
Soils were sampled in August 2021 from five sites (see the map and the geographical coordinates in the Supplementary Materials, Figure S1 and Table S1). A gallery forest, referred to as GF; two grass savannas, referred to as GS1 and GS2; and two fire-protected savanna sites invaded by trees referred to as FPS1 and FPS2. These plots were protected from fire since 1963. The invasion of tree species occurred at a slow rate during the first nine years and then with increasing rapidity [28,33]. The fire-protected plots are now covered by a secondary forest with trees over 15–20 m tall.
A pit was dug in each site, and around 500 g of soil was taken from the successive layers on one side of the pit, every 10 cm. For the 0–10 and 10–20 cm layers, four other samples were collected by auger, 10 m from the pit, in four cardinal directions. The samples were air-dried, passed through a 2 mm sieve, and homogenized manually (forest litter was collected as well as the dead leaves of grasses in savannas).

2.2. Particle-Size Fractionation

The fractionation method, adapted from [34,35], was used on three soil samples from the upper layers (0–10 cm and 10–20 cm) that were collected at each site. Thirty grams of air-dried 2 mm sieved soil were first dispersed by manual shaking and low energetic sonication in water. Organic and mineral particles were separated by wet sieving using 250, 100, 50, and 20 μm sieves. Finally, all the fractions were oven-dried at 50 °C. The recovery of size separates ranged from 97% to 99% of the initial soil mass. By this method, the soil was well, but probably not totally, dispersed. Some aggregates may not have been broken up. The carbon balance after fractionation was generally very close to 1 (0.97 ± 0.1).

2.3. Organic Carbon and Stable Isotopes

Aliquots of the samples ground at 70 meshes were submitted to an acid attack by HCl 3% to remove carbonates for isotope measurements. The organic carbon content and its isotopic composition from the soil profiles, expressed as mg g−1 and δ13C ‰ values, respectively, were obtained at ALYSES Analytical Platform IRD using an elemental analyzer Flash HT (ThermoFisher Scientific, Okehampton, Devon, UK) coupled with a continuous-flow Isotopic Ratio Mass Spectrometer (ThermoFisher Delta V Advantage; ThermoFisher Scientific, Okehampton, Devon, UK). Standardization was calibrated to Cystine 134d for elemental concentrations and to IAEA-CH-6 for isotopic measurements (I.V.A. Analysentechnik, Meerbusch, Germany). Precision was better than 0.10‰ for δ13C, based on repeated internal standards.
The isotopic ratio (R = 13C/12C) is reported in standard delta notation (δ13C), defined as parts per thousand (‰) deviation from an international standard (Vienna Pee Dee Belemnite; [36]): δ13C = ((Rsample/Rstandard) − 1) × 1000.
The carbon content derived from grassland (CdC4) and from forest (CdC3), in each soil layer or fraction of fire-protected savanna, was calculated as follows:
CdC4 = [(δ1 − δ2)/(δ0 − δ2) × Ct
CdC3 = Ct − CdC4
where δ1 is the δ13C of soil sample under fire-protected savanna; δ2 the δ13C of soil sample under forest; and δ0 the δ13C of the grassland savanna.

2.4. Statistical Analysis

All statistical analyses were carried out using R software version 3.3.1 (R Development Core Team, 2016). After normality and homoscedasticity verifications (Shapiro and Bartlett test), C, C to N ratio, and 13C were analyzed using a two-way analysis of variance (ANOVA). When significant (p < 0.05) effects were found, comparisons among means were performed using the least significant difference (LSD) test (“agricolae” package).

3. Results

3.1. SOM Content

In the surface layer (0–10 cm), carbon content ranges from 12.0 mg·g−1 in the grass savanna GS1 to 22.1 mg·g−1 in the fire-protected savanna FPS2 (Table 1). Carbon content decreases consistently with depth, and in the 40–50 cm layer, it varies between 6.3 mg·g−1 in the fire-protected savanna FPS1 and 10.9 mg·g−1 in the fire-protected savanna FPS2. This variation in carbon content across profiles is not associated with the type of vegetation. In contrast, differences in the C/N ratio are distinctly related to vegetation type (Table 1). The C/N ratio ranges from 10 to 11 in forest soils to 15 to 19 in savanna soils, with intermediate values observed in soils under fire-protected savanna.

3.2. δ13 C Values of Litter and SOM

In the forest (GF), the litter exhibits a δ13C value of −29.5‰. In the upper soil layer, the δ13C value is −27.0‰, gradually increasing with depth to −23.9‰ at the 40–50 cm layer, reflecting a typical profile of soil organic matter (SOM) derived from C3 vegetation (Figure 1 and Table S2). Conversely, in grass savannas, the δ13C values of dead grass leaves range between −12.6‰ and −14.0‰. Correspondingly, the δ13C values in savanna soils vary from −13.8‰ to −14.0‰ in the topsoil, gradually shifting to −14.4‰ to −14.7‰ at the 40–50 cm layer. In savannas protected from fire for 58 years, secondary forest vegetation has developed, and the litter now covering the soil displays δ13C values ranging from −28.1‰ to −30.3‰. This transition to C3 vegetation has modified the δ13C profiles of the soil. In the FPS1 plot, the δ13C value of the surface layer is −21.5‰, increasing with depth to −17.3‰. In the FPS2 plot, the surface δ13C value is −22.7‰, rising to −18.8‰ in the 20–30 cm layer, before slightly decreasing to −21.3‰ in the 40–50 cm layer.

3.3. Distribution of Total C in SOM Fractions

As shown in Table 2, the weight distribution of soil fractions (without the destruction of organic matter) reveals some differences between the plots. Although all soils are sandy, the forest soil is characterized by a predominance of the 100–250 μm fraction, whereas in the other plots, the coarser fraction (250–2000 μm) is clearly dominant. In the grass savannas, the finest fraction (0–20 μm) constitutes approximately 20% of the soil, while in the forest and fire-protected plots it ranges between 26% and 31%.
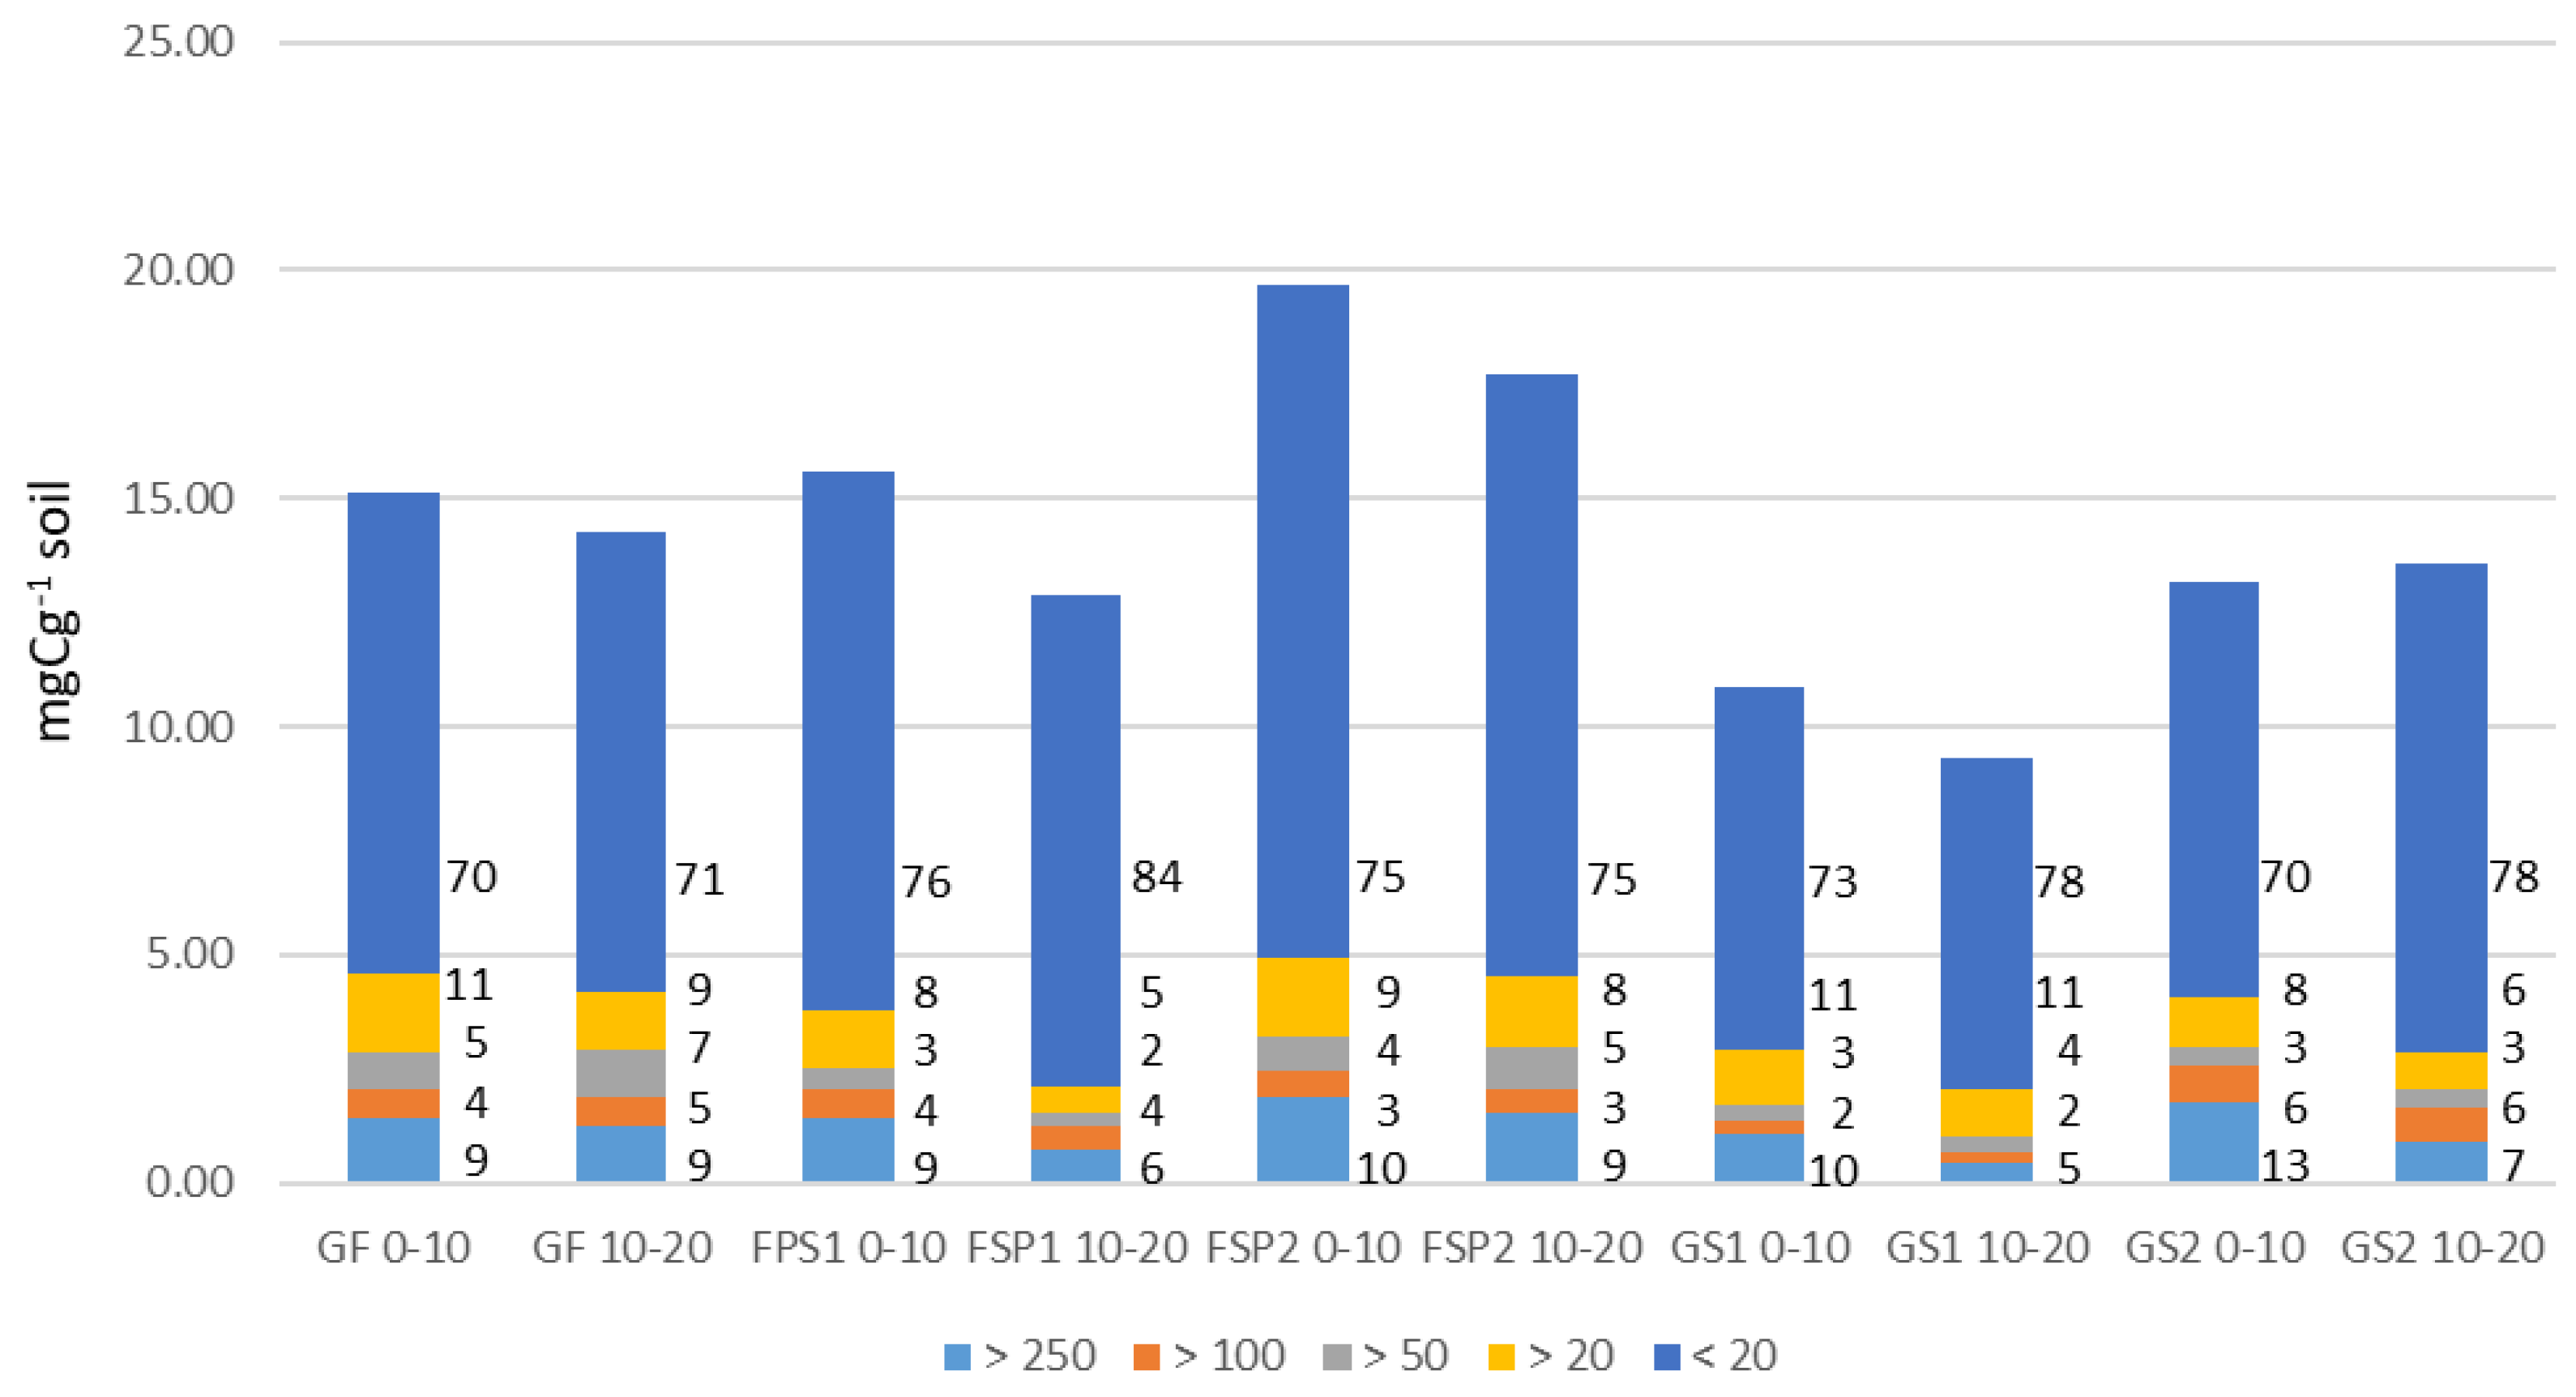
The results presented in Figure 2 indicate that despite differences in the weight distribution of particle-size fractions, the proportion of carbon associated with each fraction is quite similar across soils from the different plots. Carbon is predominantly concentrated in the fine fraction, accounting for 70% to 80% of the total carbon.
The C/N ratio exhibited a consistent pattern across all patches, decreasing notably from the coarser fractions (16–25) to the finer fraction (9–15). Similar to observations for bulk soil, vegetation type influenced the soil C/N ratio. For each fraction, the C/N values were lower in forest soils compared to savanna soils, with soils from fire-protected savannas displaying intermediate values.

3.4. δ13C Values of Particle-Size Fractions

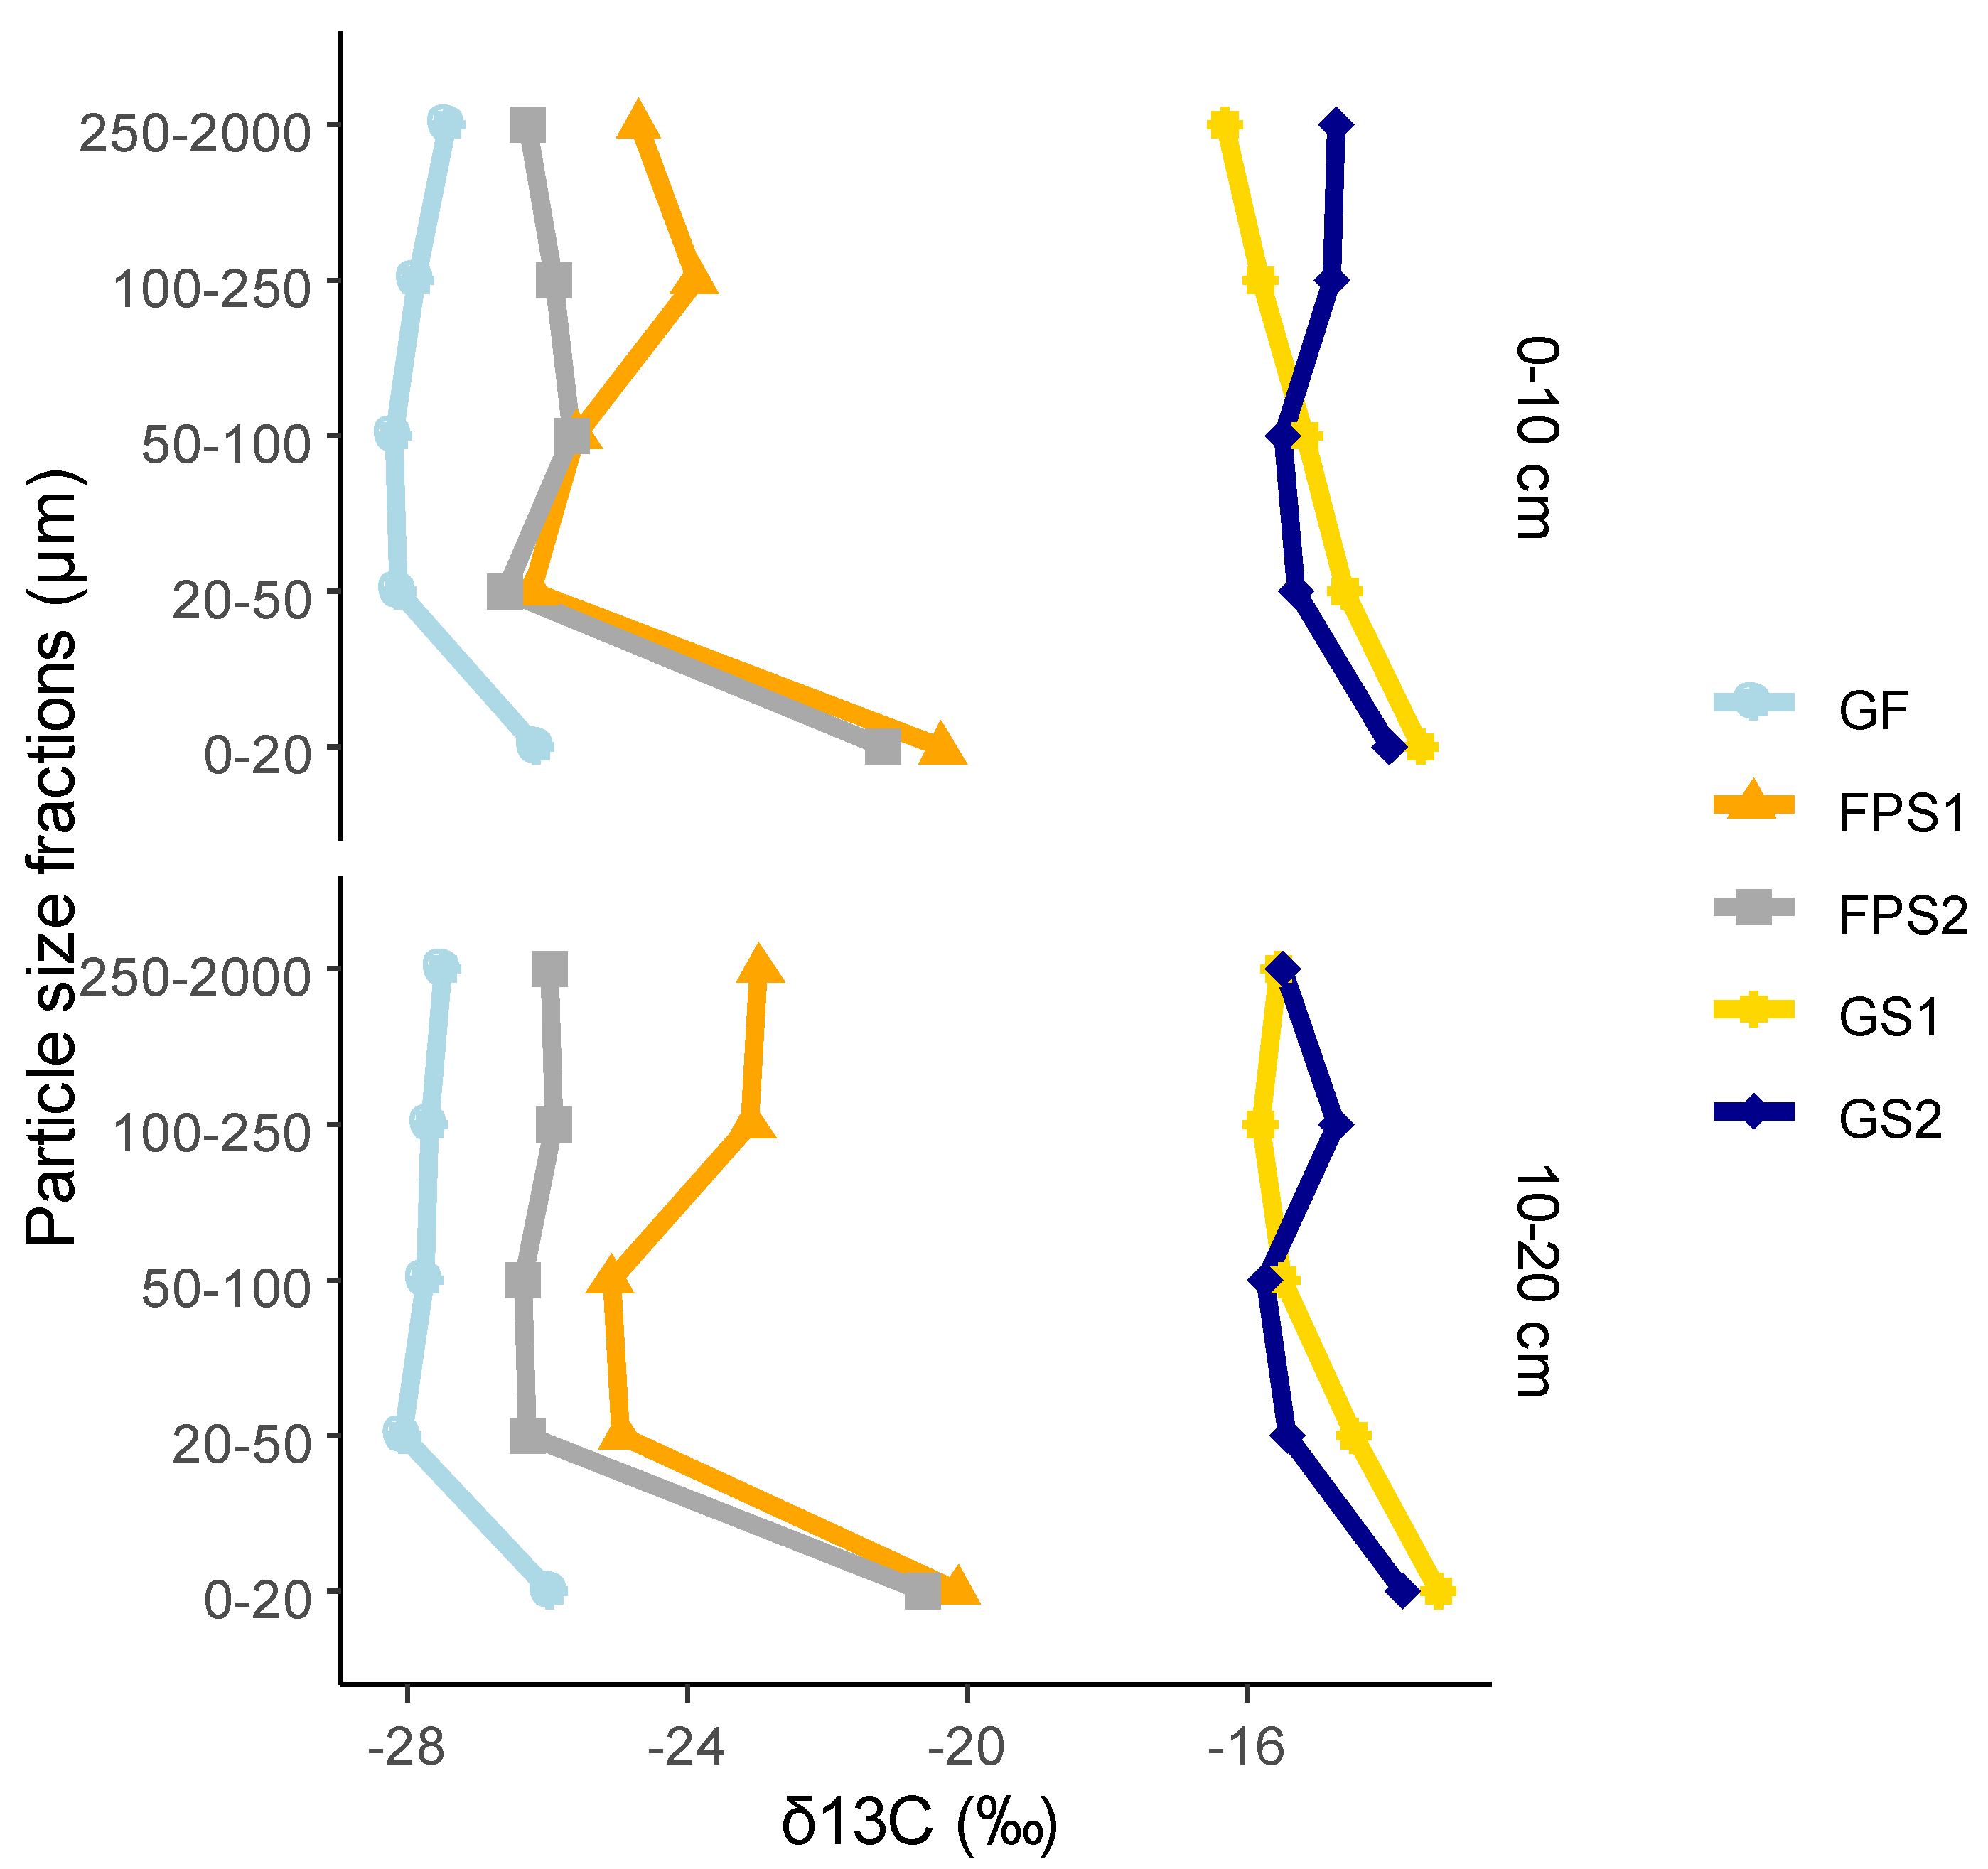
The development of a secondary forest brings significant changes to the natural abundance of δ13C in the particle-size fractions of fire-protected savanna topsoils (Figure 3 and Table S3). In all fractions except the finest, the δ13C values closely resemble those of forest soil in both the 0–10 cm and 10–20 cm layers. The finest fraction (0–20 μm), however, exhibits intermediate δ13C values (−20.1 to −21.2‰), falling between the δ13C values of forest soils and those of grass savanna soils.

3.5. Percentages of C Derived from Savanna (C4) and Forest (C3) Material

δ13C values were used to estimate the relative contributions of carbon derived from savanna vegetation (C4-derived carbon, Cds) and carbon derived from forest vegetation (C3-derived carbon, Cdf) in the different particle-size fractions of the studied soils. After 58 years of fire protection, the upper soil layer (0–10 cm) still contains 33–42% C4-derived carbon. This proportion increases with depth, reaching 37–51% in the 10–20 cm layer and 53–67% in the 20–30 cm layer.
As shown in Table 3, the proportion of Cdf incorporated into the fractions is relatively similar in the two upper layers (0–10 cm and 10–20 cm). In fractions larger than 20 μm, the majority of the carbon originates from C3 secondary vegetation, with contributions ranging from 74% to 87%. In contrast, in the 0–20 μm fraction, the contribution of C3-derived carbon is significantly lower, around 55–57%.

4. Discussion

4.1. SOM Content

One of the key soil parameters influencing organic matter content is texture [37]. The studied soils have a sandy texture and a relatively low carbon content, ranging from 10 to 22 mg·g−1 in the 0–10 cm and 10–20 cm layers. These values align with those reported by [38] for other sandy soils in Ivory Coast. However, they are significantly lower than the carbon content found in clay soils of Ivory Coast (50–90 mg·g−1) [39] and Kenya (25–40 mg·g−1) [40].
The differences in carbon content across the profiles do not appear to be directly related to vegetation type. For instance, the carbon content in the forest soil profile (GF) is comparable to that of one profile under fire-protected savanna (FPS1) and another under unprotected savanna (GS1). Even within the same vegetation type (fire-protected savanna and savanna), carbon content profiles vary widely despite similar soil texture (Table 1). At Lamto, ref. [41] highlighted significant soil variations over short distances. These differences in carbon content could be attributed to variations in the physical and chemical properties of the soils, as well as historical changes in plant cover.

4.2. δ13C Values of Litter and SOM

Several studies have highlighted seasonal variations in the δ13C of CO2 and CH4, as well as in the microbial biomass in soils (e.g., [42,43]). In soils strongly influenced by hydrological conditions, such as dunes or wetlands, fluctuations in SOM δ13C have also been observed [44]. However, in well-drained soils, these seasonal variations tend to be of lower amplitude, as are plant inputs from leaves and roots [45]. In such soils, organic matter consists of different pools with highly variable ages, ranging from days to millennia [46]. With the exception of microbial biomass, the δ13C values of these pools are little influenced by seasonal variations. However, when studying the effect of vegetation change on soil organic matter dynamics, it is essential to compare identical sites in terms of pedoclimatic conditions (same soil, same gathering date) to eliminate the influence of such variations.
The δ13C profiles observed in forest and savanna soils are characteristic of C3 and C4 vegetation, respectively, as the isotopic composition of soil organic matter (SOM) reflects that of the vegetation growing on the soil. In forest soils, the slight enrichment in 13C with depth can be attributed to several factors: (1) an alteration with time of the isotope composition of the vegetation as a consequence of recent content variations in atmospheric CO2; (2) a differential preservation of 13C-enriched SOM components could potentially account for the pattern of 13C enrichment with depth: isotope differences up to 5‰ are reported between various biochemical components of plants; and (3) an isotope fractionation during SOM mineralization (for more details, see [19,47,48]. In savanna soils, by contrast, δ13C values show a slight decrease with depth. This pattern has been reported by several authors, including [28] in the same region, as well as [49,50] in Brazilian savannas. A likely explanation offered by these studies is the presence of older organic matter at depth, originating from a previously more extensive forest cover.
In savannas protected from fire for 58 years, tree vegetation has become established, transforming the area into a secondary forest with no visible remnants of savanna grasses. The litter covering the ground is characteristic of C3 vegetation, with δ13C values ranging from −28‰ to −31‰. Consequently, the δ13C profiles are intermediate between those observed under forest and savanna conditions. In 1988, [28] conducted similar measurements in the same patches after 25 years of fire protection. Interestingly, in the 0–10 cm layer, δ13C values have not significantly changed between 1988 and 2021 (−20.9‰ to −23.1‰ versus −21.5‰ to −22.7‰). However, between 10 and 30 cm, there has been a noticeable trend toward more negative values (−15.8‰ to −16.5‰ versus −17.3‰ to −21.6‰), indicating the incorporation of organic matter derived from C3 vegetation over this period.
As described in Section 2, the δ13C values of soils under forest and savanna conditions can be used to estimate the relative proportions of carbon of C3 and C4 origin in different soil layers. After 58 years of fire protection, the 0–10 cm layer still contains approximately 33% C4-derived carbon in the FPS2 patch and 42% in the FPS1 patch, values similar to those reported by [28] after 25 years of fire protection. By 1988, all labile organic matter from the original savanna had already been mineralized in this layer, leaving behind a fraction of stable C4-derived organic matter that remains preserved over at least several decades.
Between 10 and 30 cm, 37–53% of the carbon in the FPS2 patch and 51–67% in the FPS1 patch is of C4 origin after 58 years of fire protection, compared to 75–80% after 28 years of fire protection. This indicates that the proportion of savanna-derived organic matter in this layer continued to decline between 1988 and 2021, reflecting ongoing mineralization of the remaining labile organic matter. The difference in the rate of organic matter mineralization between the surface and sub-surface layers can be attributed to variations in both biotic and abiotic factors. Decomposers—primarily archaea, bacteria, and fungi—show a significant decline in abundance with increasing depth [51]. Additionally, oxygen (O2) availability, a key factor in mineralization processes, tends to decrease with depth, potentially limiting decomposition activity [52]. Moreover, the accessibility of organic matter to microbial decomposers may be reduced in the sub-surface layers compared to the surface. This could be due to the formation of organo-mineral complexes, which bind organic matter to minerals, and the physical protection of organic matter within microaggregates, both of which restrict microbial access [53,54].

4.3. Distribution of Total SOM in Particle-Size Fractions

As noted in numerous studies [3,55,56,57], the majority of soil carbon is concentrated in the fine fractions, regardless of vegetation type. The C/N ratios of granulometric fractions decrease with particle size, indicating that microbial alteration of soil organic matter (SOM) is significantly more pronounced in the finer fractions than in the coarser ones. These fine fractions serve as the primary reservoir for humified SOM, consistent with findings by [58,59,60].
In 1988, 25 years after fire suppression and the establishment of a C3 woody vegetation cover, ref. [28] reported that in the 0–10 cm soil horizon, only 5–15% of the carbon in the coarse fractions was of C4 origin, with more than 85% derived from the new C3 vegetation. In the intermediate fraction (coarse silts), the proportion of C4-derived carbon reached 30%, while in mineral-associated organic carbon (MAOC), C4 carbon remained dominant at around 60%.
Our results, obtained 33 years later (58 years after afforestation), provide further insights into the medium-term dynamics of soil organic matter. Similar to bulk carbon trends, the two studied plots exhibit comparable patterns but with different ranges of variation. In the particulate organic carbon (POC) fraction, the proportion of C4-derived carbon is approximately 9–20% in FPS2 and 20–30% in FPS1. After more than 50 years of afforestation, one might expect that all C4-derived carbon associated with the coarse, labile fractions would have disappeared. However, it is likely that the coarse plant debris from C4 vegetation degraded rapidly, and the remaining POC is largely composed of black carbon, primarily charcoal resulting from the annual fires previously practiced in savannas prior to fire suppression.
In the intermediate coarse silt fraction and fine fractions (MAOC), the proportion of C4-derived carbon is now approximately 12–15% and 40–47%, respectively—significantly lower than the values observed after 25 years of fire suppression. Although organic matter in these fractions benefits from partial physical protection within aggregates and chemical stabilization through bonds with clays [61,62], it continues to undergo gradual mineralization over time.
In the 10–20 cm sub-surface layer, differences in the proportions of C3- and C4-derived carbon after 25 and 58 years of afforestation are more pronounced than in the 0–10 cm layer. After 25 years, only the coarsest fraction (250–2000 microns) showed a significant loss of C4-derived material, accounting for just 15% of the carbon. In the intermediate fractions, the proportion of C4-C was much higher, ranging from 49% to 52%, while in the MAOC fraction, C4 carbon was dominant, representing 88% of the total [21]. After 33 additional years of afforestation, there has been a substantial reduction in C4-C, with proportions now closely resembling those observed in the 0–10 cm layer (Table 3). In plot FPS2, the proportions of C4-derived carbon are 12–14% in all coarse and intermediate fractions and 43% in the fine fraction (MAOC). In plot FPS1, the corresponding proportions are 22–38% for the coarse and intermediate fractions and 47% for the fine fraction. The dynamics of organic matter (OM) mineralization processes for C4-derived carbon differ between the 0–10 cm and 10–20 cm layers. However, 58 years after afforestation, these processes have resulted in similar proportions of C4- and C3-derived carbon in both layers. We attribute the slower rate of OM transformation in the sub-surface layer to less favorable physico-chemical conditions for biological activity, rather than to differences in the chemical composition of the OM [63].

5. Conclusions

We present a quantitative assessment of soil organic matter (SOM) dynamics in savannas that transitioned to secondary forests after 58 years of fire protection. While this vegetation shift did not significantly affect the total soil carbon stock across layers down to 50 cm, particle-size fractionation and natural 13C abundance measurements revealed significant qualitative changes. Despite coarser fractions typically being considered a labile carbon pool with relatively short turnover rates, our findings show that even after several decades, a substantial proportion of carbon from the original vegetation remains, likely in the form of black carbon. In contrast, the fine fraction, where organic matter is associated with minerals and physically protected, has slower turnover rates, with nearly half of its carbon originating from the former vegetation. Over time, organic matter turnover exhibit a clear progression with increasing soil depth. Our study provides additional information on the dynamics of soil carbon after the afforestation of fire-protected savannahs in the tropics. However, in tropical zones and particularly in Africa, data on the dynamics of soil organic matter over the medium and long term are scarce, and further research is needed to confirm the results of this study on other savanna soils (differing by their physical and chemical properties).

Supplementary Materials

The following supporting information can be downloaded at: https://www.mdpi.com/article/10.3390/land14030535/s1, Figure S1: Location map of the soil profiles analyzed in this study; Table S1: Geographical coordinates of soil profiles; Table S2: δ13C (‰) of soil profiles under the different types of vegetation: gallery forest (GF), savannas (GS) and fire-protected savannas (FPS). Mean values ±1 standard error followed by a common letter, in the layers 0–10 and 10–20 cm, did not differ significantly by the Tukey test at p < 0.05; Table S3: δ13C (‰) of the particle-size fractions under the different types of vegetation: gallery forest (GF), savannas (GS) and fire-protected savannas (FPS). Mean values ±1 standard error followed by a common letter, in each fraction and for each layer 0–10 and 10–20 cm did not differ significantly by the Tukey test at p < 0.05.

Author Contributions

T.D. designed this study; T.D. and T.H.D.T. collected the soil samples; M.M.-Y. and F.C. analyzed the organic matter data; T.D. prepared the manuscript with contribution from all co-authors. All authors have read and agreed to the published version of the manuscript.

Funding

This research received no external funding.

Data Availability Statement

The datasets presented in this article are not readily available due to time constraints. Requests for access to the datasets should be addressed to the authors.

Acknowledgments

We thank Yéo Kolofor allowing us to work at the station of ecology of Lamto. This research work was supported by the Institute of Ecology and Environmental Science of Paris.

Conflicts of Interest

The authors declare that they have no conflicts of interest.

References

  1. Jackson, R.B.; Lajtha, K.; Crow, S.E.; Hugelius, G.; Kramer, M.G.; Piñeiro, G. The ecology of soil carbon: Pools, vulnerabilities, and biotic and abiotic controls. Annu. Rev. Ecol. Evol. Syst. 2017, 48, 419–445. [Google Scholar] [CrossRef]
  2. Lehmann, J.; Kleber, M. The contentious nature of soil organic matter. Nature 2015, 528, 60–68. [Google Scholar] [CrossRef] [PubMed]
  3. Smith, P.; Falloon, P.; Coleman, K.; Smith, J.; Piccolo, M.C.; Cerri, C.; Bernoux, M.; Jenkinson, D.; Ingram, J.; Szabo, J.; et al. Modeling soil carbon dynamics in tropical ecosystems. In Global Climate Change and Tropical Ecosystems; CRC Press: Boca Raton, FL, USA, 2019; pp. 341–364. [Google Scholar] [CrossRef]
  4. Greenland, D.J.; Wild, A.; Adams, D. Organic matter dynamics in soils of the tropics—From myth to complex reality. Myth. Sci. Soils Trop. 1992, 29, 17–33. [Google Scholar] [CrossRef]
  5. Santos, R.S.; Oliveira, F.C.; Ferreira, G.W.; Ferreira, M.A.; Araújo, E.F.; Silva, I.R. Carbon and nitrogen dynamics in soil organic matter fractions following eucalypt afforestation in southern Brazilian grasslands (Pampas). Agric. Ecosyst. Environ. 2020, 301, 106979. [Google Scholar] [CrossRef]
  6. Schimel, D.S. Terrestrial Ecosystems and the carbon cycle. Glob. Change Biol. 1995, 1, 77–91. [Google Scholar] [CrossRef]
  7. Trumbore, S.E. Comparison of carbon dynamics in tropical and temperate soils using radiocarbon measurements. Global Biogeochem. Cycles 1993, 7, 275–290. [Google Scholar] [CrossRef]
  8. Paustian, K.; Andrén, O.; Janzen, H.H.; Lal, R.; Smith, P.; Tian, G.; Tiessen, H.; Van Noordwijk, M.; Woomer, P.L. Agricultural Soils as a sink to mitigate CO2 emissions. Soil Use Manage. 1997, 13, 230–244. [Google Scholar] [CrossRef]
  9. Foley, J.A. Net primary productivity in the terrestrial biosphere. The application of a global model. J. Geophys. Res. 1994, 99, 20773–20783. [Google Scholar] [CrossRef]
  10. Dixon, R.K.; Winjum, J.K.; Andrasko, K.J.; Lee, J.J.; Schroeder, P.E. Integrated land-use systems assessment: Promising agroforest and alternative land-use practices to enhance carbon conservation and sequestration. Clim. Change 1994, 27, 71–92. [Google Scholar] [CrossRef]
  11. Cerri, C.; Feller, C.; Balesdent, J.; Victoria, R.; Plegnecassagne, A. Application du traçage isotopique naturel en 13C à l’étude de la dynamique de la matière organique dans les sols. C. R. Acad. Sci 1985, 300, 423–429. [Google Scholar]
  12. Fonkeng, E.E.; Chevallier, T.; Sauvadet, M.; Enock, S.; Rakotondrazafy, N.; Chapuis-Lardy, L.; Takoutsing, B.; Fritz, O.T.; Harmand, J.-M. Dynamics of soil organic carbon pools following conversion of savannah to cocoa agroforestry systems in the Centre region of Cameroon. Geoderma Reg. 2024, 36, e00758. [Google Scholar] [CrossRef]
  13. Sevink, J.; Obale-Ebanga, F.; Meijer, H.A.J. Land-use related organic matter dynamics in North Cameroon soils assessed by 13C analysis of soil organic matter fractions. Eur. J. Soil Sci. 2005, 56, 103–111. [Google Scholar] [CrossRef]
  14. Cotrufo, M.F.; Ranalli, M.G.; Haddix, M.L.; Six, J.; Lugato, E. Soil carbon storage informed by particulate and mineral-associated organic matter. Nat. Geosci. 2019, 12, 989–994. [Google Scholar] [CrossRef]
  15. Lavallee, J.M.; Soong, J.L.; Cotrufo, M.F. Conceptualizing soil organic matter into particulate and mineral-associated forms to address global change in the 21st century. Glob. Change Biol. 2020, 26, 261–273. [Google Scholar] [CrossRef] [PubMed]
  16. Dungait, J.A.J.; Hopkins, D.W.; Gregory, A.S.; Whitmore, A.P. Soil organic matter turnover is governed by accessibility not recalcitrance. Glob. Change Biol. 2012, 18, 1781–1796. [Google Scholar] [CrossRef]
  17. Balesdent, J.; Besnard, E.; Arrouays, D.; Chenu, C. The dynamics of carbon in particle-size fractions of soil in a forest-cultivation sequence. Plant Soil 1998, 201, 49–57. [Google Scholar] [CrossRef]
  18. Six, J.; Guggenberger, G.; Paustian, K.; Haumaier, L.; Elliott, E.T.; Zech, W. Sources and composition of soil organic matter fractions between and within soil aggregates. Eur. J. Soil Sci. 2001, 52, 607–618. [Google Scholar] [CrossRef]
  19. Balesdent, J.; Mariotti, A.; Guillet, B. Natural 13C abundance as a tracer for soil organic matter dynamics studies. Soil Biol. Biochem. 1987, 19, 25–30. [Google Scholar] [CrossRef]
  20. Poeplau, C.; Don, A.; Six, J.; Kaiser, M.; Benbi, D.; Chenu, C.; Cotrufo, M.F.; Derrien, D.; Gioacchini, P.; Grand, S.; et al. Isolating organic carbon fractions with varying turnover rates in temperate agricultural soils—A comprehensive method comparison. Soil Biol. Biochem. 2018, 125, 10–26. [Google Scholar] [CrossRef]
  21. Epron, D.; Marsden, C.; Thongo M’Bou, A.; Saint-André, L.; d’Annunzio, R.; Nouvellon, Y. Soil carbon dynamics following afforestation of a tropical savannah with Eucalyptus in Congo. Plant Soil 2009, 323, 309–322. [Google Scholar] [CrossRef]
  22. Balesdent, J.; Wagner, G.H.; Mariotti, A. Soil organic matter turnover in long-term field experiments as revealed by carbon-13 natural abundance. Soil Sci. Soc. Am. J. 1988, 52, 118–124. [Google Scholar] [CrossRef]
  23. Don, A.; Schumacher, J.; Freibauer, A. Impact of tropical land-use change on soil organic carbon stocks—A meta-analysis. Glob. Change Biol. 2011, 17, 1658–1670. [Google Scholar] [CrossRef]
  24. Fujisaki, K.; Perrin, A.-S.; Desjardins, T.; Bernoux, M.; Balbino, L.C.; Brossard, M. From forest to cropland and pasture systems: A critical review of soil organic carbon stocks changes in Amazonia. Glob. Change Biol. 2015, 21, 2773–2786. [Google Scholar] [CrossRef] [PubMed]
  25. Guo, L.B.; Gifford, R.M. Soil carbon stocks and land use change: A meta analysis. Glob. Change Biol. 2002, 8, 345–360. [Google Scholar] [CrossRef]
  26. Li, D.; Niu, S.; Luo, Y. Global patterns of the dynamics of soil carbon and nitrogen stocks following afforestation: A meta-analysis. New Phytol. 2012, 195, 172–181. [Google Scholar] [CrossRef] [PubMed]
  27. Sandoval López, D.M.; Arturi, M.F.; Goya, J.F.; Pérez, C.A.; Frangi, J.L. Eucalyptus grandis plantations: Effects of management on soil carbon, nutrient contents and yields. J. For. Res. 2020, 31, 601–611. [Google Scholar] [CrossRef]
  28. Martin, A.; Mariotti, A.; Balesdent, J.; Lavelle, P.; Vuattoux, R. Estimate of organic matter turnover rate in a savanna soil by 13C natural measurements. Soil Biol. Biochem. 1990, 22, 517–523. [Google Scholar] [CrossRef]
  29. Menaut, J.-C.; César, J. Structure and primary productivity of Lamto savannas, Ivory Coast. Ecology 1979, 60, 1197–1210. [Google Scholar] [CrossRef]
  30. Diawara, A.; Yoroba, F.; Kouadio, K.Y.; Kouassi, K.B.; Assamoi, E.M.; Diedhiou, A.P.; Assamoi, P. Climate Variability in the Sudano-Guinean Transition Area and Its Impact on Vegetation: The Case of the Lamto Region in Côte D’Ivoire. Adv. Meteorol. 2014, 2014, 831414. [Google Scholar] [CrossRef]
  31. César, J.; Menaut, J.C. Le peuplement végétal de la savane de Lamto. Analyse d’un écosystème tropical humide: La savane de Lamto. Bull. Liaison Cherch. Lamto 1974, 2, 1–161. [Google Scholar]
  32. IUSS Working Group WRB. World Reference Base for Soil Resources 2014. International Soil Classification System for Naming Soils and Creating Legends for Soil Maps; World Soil Resources Reports; FAO: Rome, Italy, 2014; No. 106. [Google Scholar]
  33. Devineau, J.L.; Lecordier, C.; Vuattoux, R. Evolution de la diversité spécifique du peuplement ligneux dans une succession préforestière de colonisation d’une savane protégée des feux (Lamto, Côte d’Ivoire). Candollea 1984, 39, 103–134. [Google Scholar]
  34. Elliott, E.T.; Cambardella, C.A. Physical separation of soil organic matter. Agric. Ecosyst. Environ. 1991, 34, 407–419. [Google Scholar] [CrossRef]
  35. Anderson, D.W.; Saggar, S.; Bettany, R.; Stewart, J.W.B. Particle-size fractions and their use in studies of soil organic matter. 1. The nature and distribution of forms of carbon, nitrogen, and sulfur. Soil Sci. Soc. Am. J. 1981, 45, 767–772. [Google Scholar] [CrossRef]
  36. Peterson, B.J.; Fry, B. Stable isotopes in ecosystem studies. Annu. Rev. Ecol. Evol. Syst. 1987, 18, 293–320. Available online: https://www.jstor.org/stable/2097134 (accessed on 24 February 2025). [CrossRef]
  37. Feller, C.; Beare, M.H. Physical control of soil organic matter dynamics in the tropics. Geoderma 1997, 79, 69–116. [Google Scholar] [CrossRef]
  38. Koné, A.W.; Kassi, S.P.A.Y.; Bernard, Y.; Koffi, B.Y.; Masse, D.; Maïga, A.A.; Tondoh, J.E.; Kisaka, O.M.; Touré, G.-P.T. Chromolaena odorata (L.) K&R (Asteraceae) invasion effects on soil microbial biomass and activities in a forest-savanna mosaic. Catena 2021, 207, 105619. [Google Scholar] [CrossRef]
  39. Silue, B.K.; Koné, A.W.; Masse, D.; Moulin-Esmard, P.; Kotaix, A.J.A.; Chapuis-Lardy, L. Contrasted effects of shade tree legumes on soil organic carbon stock and carbon balance in 20-year cacao agroforestry, Ivory Coast. Geoderma Reg. 2024, 37, e00807. [Google Scholar] [CrossRef]
  40. Otieno, D.O.; K’Otuto, G.O.; Jakli, B.; Schröttle, P.; Maina, J.N.; Jung, E.; Onyango, J.C. Spatial heterogeneity in ecosystem structure and productivity in a moist Kenyan savanna. Plant Ecol. 2011, 212, 769–783. [Google Scholar] [CrossRef]
  41. Riou, G. Les sols de la savane de Lamto. In Analyse d’un Ecosystème Tropical Humide: La Savane de Lamto (Côte d’lvoire); Bulletin Liaison Chercheurs Lamto; Publications Laboratoire Zoologie ENS: Paris, France, 1974; Volume 1, pp. 3–38. [Google Scholar]
  42. Gillon, M.; Barbecot, F.; Gibert, E.C.; Plain, C.; Corcho-Alvarado, J.-A.; Massault, M. Controls on 13C and 14C variability in soil CO2. Geoderma 2012, 189–190, 431–441. [Google Scholar] [CrossRef]
  43. Zhang, Q.; Wu, J.; Lei, Y.; Yang, F.; Zhang, D.; Zhang, K.; Zhang, Q.; Cheng, X. Agricultural land use change impacts soil CO2 emission and its 13C-isotopic signature in central China. Soil Till. Res. 2018, 177, 105–112. [Google Scholar] [CrossRef]
  44. Kang, X.; Liu, T.; Wang, G.; Hao, L.; Duan, L.; Tong, X.; Singh, V.P.; Wu, R. Control of hydrologic conditions and vegetation composition on carbon dynamics characterized by 13C enrichment in a dune-meadow cascade ecosystem in a semi-arid region. Catena 2023, 231, 107286. [Google Scholar] [CrossRef]
  45. Diels, J.; Vanlauwe, B.; Sanginga, N.; Coolen, E.; Merckx, E.R. Temporal variations in plant d13C values and implications for using the 13C technique in long-term soil organic matter studies. Soil Biol. Biochem. 2001, 33, 1245–1251. [Google Scholar] [CrossRef]
  46. Balesdent, J.; Basile-Doelsch, I.; Chadoeuf, J.; Cornu, S.; Derrien, D.; Fekiacova, Z.; Hatté, C. Atmosphere–soil carbon transfer as a function of soil depth. Nature 2018, 559, 599–602. [Google Scholar] [CrossRef]
  47. Brüggemann, N.; Gessler, A.; Kayler, Z.; Keel, S.G.; Badeck, F.; Barthel, M.; Boeckx, P.; Buchmann, N.; Brugnoli, E.; Esperschütz, J.; et al. Carbon allocation and carbon isotope fluxes in the plant-soil-atmosphere continuum: A review. Biogeosciences 2011, 8, 3457–3489. [Google Scholar] [CrossRef]
  48. Paul, A.; Balesdent, J.; Hatté, C. 13C-14C relations reveal that soil 13C-depth gradient is linked to historical changes in vegetation 13C. Plant Soil 2020, 447, 305–317. [Google Scholar] [CrossRef]
  49. Dortzbach, D.; Pereira, M.G.; Blainski, E.; González, A.P. Estoque de C e abundância natural de 13C em razão da conversão de areas de floresta e pastagem em bioma Mata Atlântica. R. Bras. Ci. Solo 2015, 39, 1643–1660. [Google Scholar] [CrossRef]
  50. Andriollo, D.D.; Redin, C.G.; José Miguel Reichert, J.M.; Silva, L.S. Soil carbon isotope ratios in forest-grassland toposequences to identify vegetation changes in southern Brazilian grasslands. Catena 2017, 159, 126–135. [Google Scholar] [CrossRef]
  51. Xu, T.; Chen, X.; Hou, Y.; Zhu, B. Changes in microbial biomass, community composition and diversity, and functioning with soil depth in two alpine ecosystems on the Tibetan plateau. Plant Soil 2021, 459, 137–153. [Google Scholar] [CrossRef]
  52. Wang, C.; Dippold, M.A.; Blagodatskaya, E.; Dorodnikov, M. Oxygen matters: Short- and medium-term effects of aeration on hydrolytic enzymes in a paddy soil. Geoderma 2022, 407, 115548. [Google Scholar] [CrossRef]
  53. Mbé, B.; Monga, O.; Pot, V.; Otten, W.; Hecht, F.; Raynaud, X.; Nunan, N.; Chenu, C.; Baveye, P.C.; Garnier, P. Scenario modelling of carbon mineralization in 3D soil architecture at the microscale: Toward an accessibility coefficient of organic matter for bacteria. Eur. J. Soil Sci. 2021, 73, e13144. [Google Scholar] [CrossRef]
  54. Nuñez, J.; Moinet, G.Y.K.; Graham, S.L.; Turnbull, M.H.; Grelet, G.-A.; Whitehead, D. Addition of sorptive mineral phases to soils decreases short-term organic matter decomposition by reducing microbial access to substrates. Eur. J. Soil Sci. 2021, 73, e13176. [Google Scholar] [CrossRef]
  55. Desjardins, T.; Barros, E.; Sarrazin, M.; Girardin, C.; Mariotti, A. Effects of forests conversion to pasture soil carbon content and dynamics in Brazilian Amazonia. Agric. Ecosyst. Environ. 2004, 103, 365–373. [Google Scholar] [CrossRef]
  56. Koutika, L.S.; Choné, T.; Andreux, F.; Cerri, C.C. Carbon decomposition of the topsoils and soil fractions under forest and pasture in the western Brazilian Amazon basin, Rondônia. Biol. Fertil. Soils 2000, 30, 284–287. [Google Scholar] [CrossRef]
  57. Solomon, D.; Fritzsche, F.; Lehmann, J.; Tekalign, M.; Zech, W. Soil organic matter dynamics in the subhumid agroecosystems of the Ethiopian highlands: Evidence from natural C-13 abundance and particle-size fractionation. Soil Sci. Soc. Am. J. 2002, 66, 969–978. [Google Scholar] [CrossRef]
  58. Amelung, W.; Zech, W.; Zhang, X.; Follet, R.F.; Tiessen, H.; Knox, E.; Flach, K.W. Carbon, nitrogen, and sulfur pools in particle-size fractions as influenced by climate. Soil Sci. Soc. Am. J. 1998, 62, 172–181. [Google Scholar] [CrossRef]
  59. Solomon, D.; Lehmann, J.; Zech, W. Land use effects on soil organic matter properties of chromic Luvisols in the semiarid tropics: Carbon, nitrogen, lignin and carbohydrates. Agric. Ecosyst. Environ. 2000, 78, 203–213. [Google Scholar] [CrossRef]
  60. Desjardins, T.; Folgarait, P.J.; Pando-Bahuon, A.; Girardin, C.; Lavelle, P. Soil organic matter dynamics along a rice chronosequence in north-eastern Argentina: Evidence from natural 13C abundance and particle size fractionation. Soil Biol. Biochem. 2006, 38, 2753–2761. [Google Scholar] [CrossRef]
  61. Christensen, B.T. Physical fractionation of soil and structural and functional complexity in organic matter turnover. Eur. J. Soil Sci. 2001, 52, 345–353. [Google Scholar] [CrossRef]
  62. Six, J.; Paustian, K. Aggregate-associated soil organic matter as an ecosystem property and a measurement tool. Soil Biol. Biochem. 2014, 68, A4–A9. [Google Scholar] [CrossRef]
  63. Marschner, B.; Brodowski, S.; Dreves, A.; Gleixner, G.; Gude, A.; Pieter, M.; Grootes, P.M.; Hamer, U.; Heim, A.; Jandl, G.; et al. How relevant is recalcitrance for the stabilization of organic matter in soils? J. Plant Nutr. Soil Sci. 2008, 171, 91–110. [Google Scholar] [CrossRef]
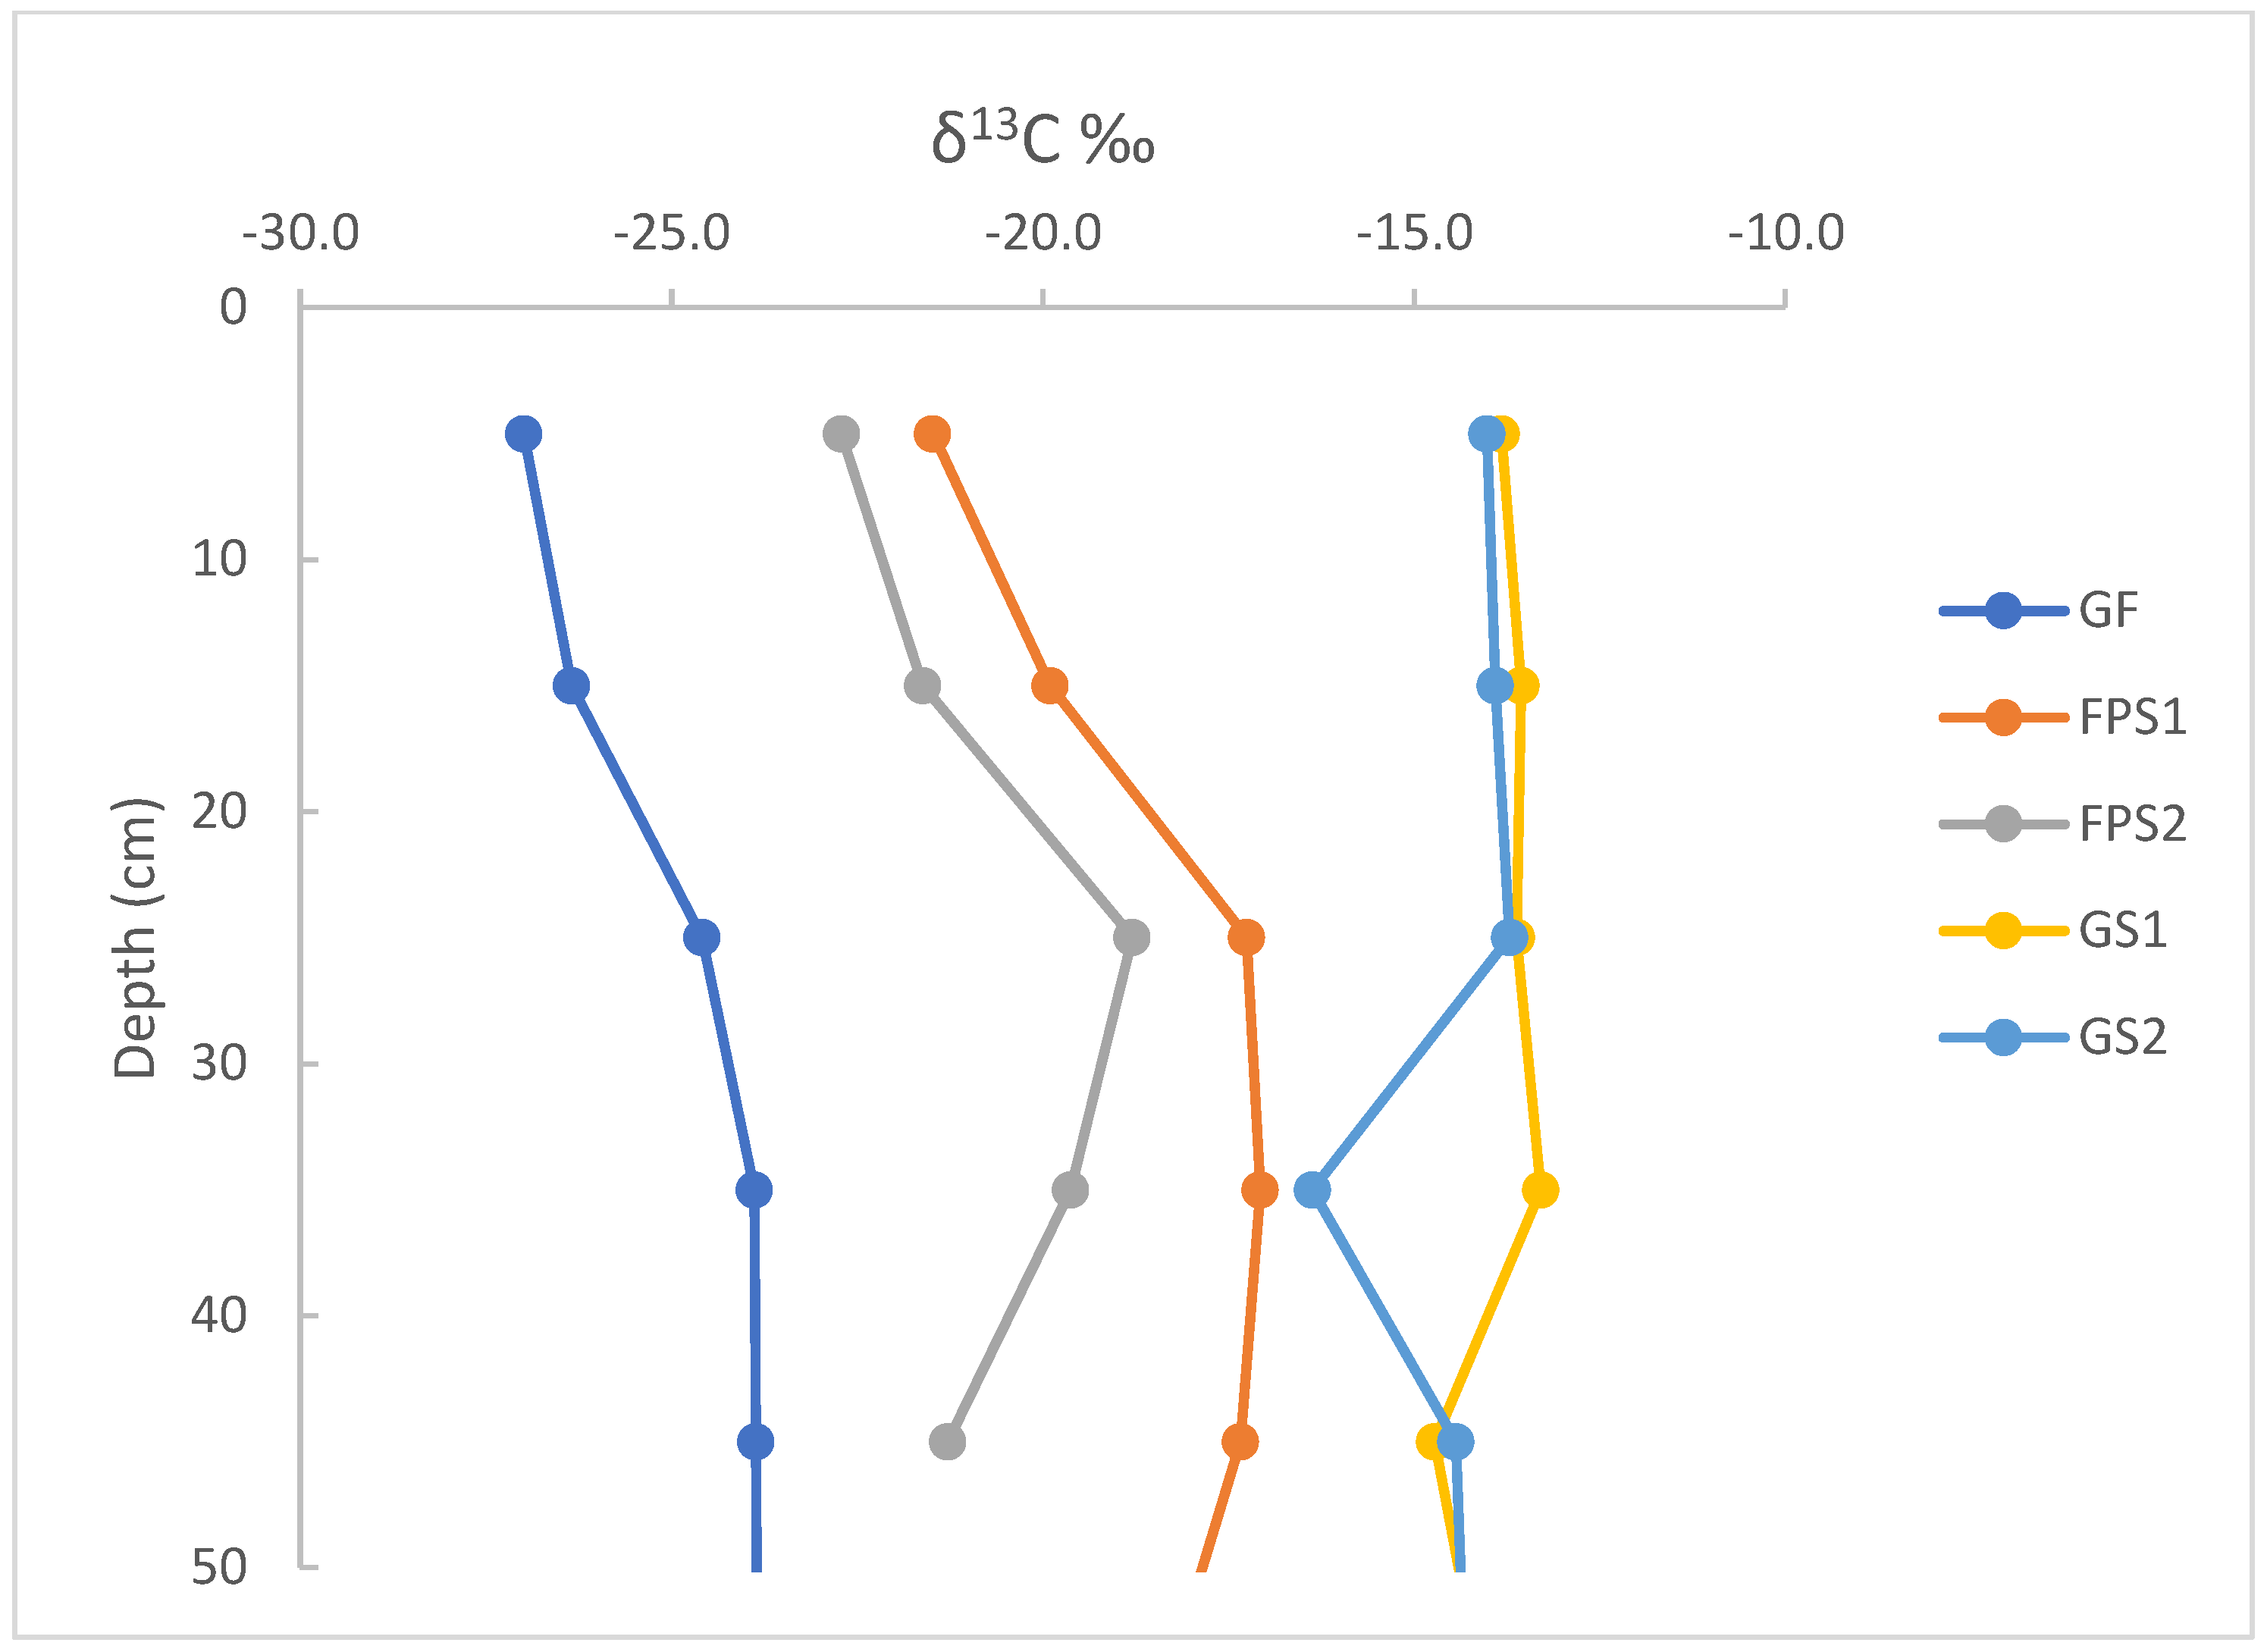
Figure 1. δ13C profiles of SOM under the different types of vegetation: gallery forest (GF), savannas (GSs), and fire-protected savannas (FPSs).
Land 14 00535 g001
Figure 2. C content (in mgC·g−1 soil of the soil layer) of the particle-size organic fractions in the two upper layers of the soil under the different types of vegetation: gallery forest (GF), savannas (GSs), and fire-protected savannas (FPSs). The numbers beside the bars indicate the C content expressed as % of total carbon for each particle-size fraction.
Land 14 00535 g002
Figure 3. δ13C of particle-size organic fractions of the two upper layers (0–10 and 10–20 cm) of the soil under the different types of vegetation: gallery forest (GF), savannas (GSs), and fire-protected savannas (FPSs).
Land 14 00535 g003
Table 1. Carbon content (mg·g−1) and C/N ratios of soil profiles under the different types of vegetation: gallery forest (GF), savannas (GSs), and fire-protected savannas (FPSs). Mean values ±1 standard error followed by a common letter, in the layers 0–10 and 10–20 cm, did not differ significantly by the Tukey test at p < 0.05.
DepthGS1GS2FPS1FPS2GF
(cm)C mg·g−1C/NC mg·g−1C/NC mg·g−1C/NC mg·g−1C/NC mg·g−1C/N
0–1012.0 ± 1.9 d18.6 ± 0.4 a16.6 ± 1.3 c18.6 ± 0.6 a15.6 ± 1.6 c14.2 ± 0.5 b22.1 ± 1.8 a14.1 ± 0.2 b18.0 ± 2.4 b11.3 ± 0.2 c
10–2010.2 ± 0.8 d18.3 ± 0.4 a15.8 ± 1.8 b18.0 ± 0.4 a13.0 ± 1.4 c14.6 ± 0.4 b19.0 ± 1.6 a14.3 ± 0.4 b13.0 ± 1.3 c11.1 ± 0.2 c
20–308.216.915.816.010.515.415.513.911.511.5
30–407.215.714.117.98.314.813.312.48.710.8
40–507.115.39.614.36.311.910.911.66.610.0
Table 2. Particle-size distribution without organic matter destruction (% dry weight) of the upper 10 cm of the soil in the different types of vegetation: gallery forest (GF), savannas (GSs), and fire-protected savannas (FPSs).
Particle Size (μm)GS1GS2FPS1FPS2GF
250–200063.953.741.137.25.8
100–2508.913.016.113.942.4
50–1003.48.58.19.812.5
20–504.45.88.38.712.0
0–2019.519.026.630.427.4
Table 3. Percentage of C derived from savanna (C4) in the particle-size fractions of the 0–10 and 10–20 cm layers of the soils under fire-protected savannas (FSP1 and FSP2).
Particle Size FractionsFPS1FSP2
(μm)0–10 cm10–20 cm0–10 cm10–20 cm
X (C4) %X (C4) %X (C4) %X (C4) %
250–200020.137.89.712.7
100–25031.637.015.614.0
50–10020.221.819.311.9
20–5014.923.811.613.7
0–2046.646.840.142.7
Disclaimer/Publisher’s Note: The statements, opinions and data contained in all publications are solely those of the individual author(s) and contributor(s) and not of MDPI and/or the editor(s). MDPI and/or the editor(s) disclaim responsibility for any injury to people or property resulting from any ideas, methods, instructions or products referred to in the content.