Article

Does a Migrant Relocation Program Aggravate Cropland Abandonment? A Case Study on Pingli County, China

1
School of Marxism, Xi’an Jiaotong University, Xi’an 710049, China
2
College of Economics and Management, Northwest A&F University, Yangling 712100, China
*
Author to whom correspondence should be addressed.
Land 2025, 14(3), 518; https://doi.org/10.3390/land14030518
Submission received: 27 January 2025 / Revised: 25 February 2025 / Accepted: 26 February 2025 / Published: 1 March 2025

Abstract

:
Migrant relocation (MR) is an important way to solve social and ecological problems. Current studies have mainly used the sample survey method to analyze the social and economic benefits of migrant relocation from a micro perspective but less from a global perspective to analyze the impact of migrant relocation on cropland abandonment (CA). Therefore, in order to balance regional cropland utilization and poverty alleviation, this paper aimed to analyze the impact of a MR program on cropland abandonment (CA) on a macro scale. The results showed that during 2011–2020, the relocation scale and resettlement scale of the MR program in Pingli County were 10.691 km2 and 4.535 km2, respectively. MR programs can be divided into three types, namely, out-migration, in-migration, and vacant, accounting for 67.98%, 30.90%, and 1.12%, respectively. The amount of CA is 35.910 km2. There was a threshold effect of the impact of MR on CA. Specifically, when MR ≤ 0 or MR > 0.258%, it has an inhibitory role on CA; when 0 < MR ≤ 0.258%, it promotes the occurrence of CA. Therefore, policy makers need to accurately assess the current situation of villages and adopt a phased and regional strategy to avoid the CA caused by large-scale relocation. These findings not only contribute to the sustainable use of cropland in the study area but also have significant implications for effective governance and poverty eradication in other poor and ecologically fragile regions around the world, such as Africa and Brazil.

1. Introduction

As an important natural resource, cropland provides human beings with essential agricultural products and ecosystem services [1]. With the continuous growth of the global population, the demand for agricultural products is also increasing, promoting the continuous expansion of cropland. However, rapid urbanization has disrupted this tendency and brought many challenges to rural development, such as hollow villages, rural depopulation, and cropland abandonment [2,3,4,5]. Like the developed countries in Northern Europe, cropland abandonment (CA) in China is very significant, which seriously threatens food security in the country [6,7,8]. Relevant studies have pointed out that CA reached about 147 million mu (1 mu ≈ 666.67 m2) in Chinese mountainous counties from 2000 to 2010 [9]. This serious problem has drawn attention from the central government and academia [10]. As a result, rigorously managing CA has become an important task of land management in China. In this case, whether major policies would ease or exacerbate CA deserves further attention.
At the beginning of this century, various migrant relocation (MR) programs were initiated in China [3,11,12]. Formally, MR refers to the process of population migration from ecologically fragile areas, areas with crucial ecological functions, and uninhabitable areas to other areas under the unified planning of the government [13]. Rural people living in these areas are more likely to be trapped in poverty [14]. Simultaneously, poor people are more likely to damage the ecological environment, thereby sliding into a vicious cycle of poverty, environmental degradation, and further poverty [15,16,17]. As a result, despite the high costs, MR programs are an efficient strategy for solving social and ecological problems associated with geographical conditions [18,19,20,21]. Due to their different goals, MR programs are divided into poverty alleviation resettlement (PAR) [19], ecological resettlement (ER) [3], disaster resettlement (DR) [22], and so on.
To evaluate the actual effects of MR programs, many studies have focused on migrants’ willingness and satisfaction [23,24], migrants’ livelihood [3,25,26], poverty alleviation [21], and migrants’ community integration [27]. Notably, although most studies have affirmed the effects of MR programs, some scholars have expressed reservations. For instance, Zhang et al. found that children involved in PAR had lower incomes as adults than a control group by using information on children’s long-term outcomes from a field survey and government archives [28]. Additionally, some studies have pointed out that MR programs not only affect the livelihoods of migrants but also entail significant economic and social impacts [22]. Fan et al. argued that MR programs considerably increase the utilization of water resources and aggravate regional water resource shortages [29]. Lemenih et al. found that due to a lack of regulatory frameworks (formal or informal), MR programs may have a catastrophic impact on the ecological environment of the resettlement area [30].
Currently, whether MR promotes or inhibits CA has also been controversial. One view is that MR accelerates CA [13]. Wang et al. confirmed that MR increases the distance between the homestead and the contracted cropland of migrants, resulting in CA [31]. This is because the continued use of cropland is no longer profitable due to increased transportation costs. On the contrary, many scholars have argued that MR promotes the reallocation of cropland resources, which helps to avoid CA [32,33]. This is because population emigration caused by MR can promote cropland transfer [34,35,36]. In theory, to realize economies of scale, the main body of cropland use has the motivation to expand the scale of production, and China’s smallholders are no exception [9,37].
Taken together, the reasons behind the controversies may be as follows. First, existing studies on the impact of MR on CA are mainly based on micro household survey data. However, the behavioral choices of migrants cannot completely reflect the overall characteristics of regional land use, nor can they accurately describe the effects of policies. Second, most studies focus more on the impact of MR on the land use behavior of migrants in relocation areas [31]. In fact, relocation and resettlement are inseparable parts of MR programs [32]. However, few studies have systematically and comprehensively investigated the impact of both on CA. Finally, there are several papers that have ignored the complexity of rural socioeconomic systems. Under the influence of MR, the rural economic base will be reconfigured, including factors such as labor, capital, and land [32,33]. However, these studies rarely considered the potential nonlinear relationship between MR and CA. This may result in biased conclusions that MR affects CA.
The following steps were used to fill these gaps. First, the development of remote sensing technology has made it possible to observe land use changes on a large scale [9]. The scale of CA in each village was assessed using remote sensing data from two periods. Second, according to the principle of the first-order difference model, this study incorporated the change value of each indicator during the study period into the model. This is equivalent to the fixed effect model [38]. Third, both the multiple regression model and the threshold regression model were employed for quantitative analysis to examine the complex relationship between MR and CA. These steps enabled this study to obtain more robust results and draw constructive conclusions.
The rest of this paper is organized as follows: Section 2 introduces the policy background; Section 3 describes the materials and methods; the empirical results and discussion are presented in Section 4 and Section 5, respectively; and, finally, Section 6 summarizes the conclusions and implications.

2. The MR Program of Southern Shaanxi

Southern Shaanxi is in the upper reaches of the Yangtze River basin, lying in the Qinling Mountains and Ba Mountain hinterland [31]. With complicated topography, a fragile geological environment, and a dense water system, the area is a hotspot and hazard zone of geological disasters in Shaanxi Province. In 2001–2010, more than 2000 geological disasters occurred, resulting in more than 590 deaths or disappearances and direct economic losses of over RMB 46 billion.
In 2011, the People’s Government of Shaanxi Province proposed the “Master Plan for Migrant Relocation in Southern Shaanxi (2011–2020)” (hereinafter referred to as the “Master Plan”) [39]. The aim of this plan is to reduce poverty and geological disasters, restore the environment, and promote sustainable economic and social development. The objective was to invest RMB 120 billion to achieve the relocation of approximately 2.4 million people in 28 counties of three cities (Hanzhong, Ankang, and Shangluo). Overall, 6253 villages were involved in the program. Specific implementation was divided into two phases: 2011–2016, focusing on the implementation of disaster resettlement, poverty alleviation resettlement, and the ecological resettlement of 380,000 households and 1.4 million people, and 2017–2020, where 220,000 households were relocated and 1 million people were resettled. Table 1 shows the pattern and scale of the relocation and resettlement of migrants in Southern Shaanxi.
The MR program includes a series of institutional arrangements, as follows: firstly, the government has defined different types of migrant relocation patterns, such as relocating to a county town or township center, relocating to new villages, relocating from small villages to large villages, self-determined scattered relocation, and relocating across administrative regions. The resettlement modes were as follows: centralized resettlement or scattered resettlement, land resettlement or landless resettlement, and government resettlement or self-determined resettlement. Secondly, the Master Plan stated the need to satisfy resettlement land requirements in terms of land use security. It highlighted the importance of adhering to the principles of economic and intensive land use, as well as keeping a balance between land occupation and compensation. In addition, the plan stipulated steady progress in the promotion of land consolidation programs in the relocated regions and also emphasized the significance of implementing homestead reclamation programs. Finally, in terms of the protection of migrant rights and interests, the Master Plan stipulated that the rights and interests of migrants in the relocation area, such as the cropland and forestland contract relationship, would remain unchanged. At the same time, the government provided a series of non-agricultural technical training to promote the mastery of at least one to two skills and ensure the stable employment of at least one person in each relocated household to realize the employment transfer of migrants and increase family income.

3. Materials and Methods
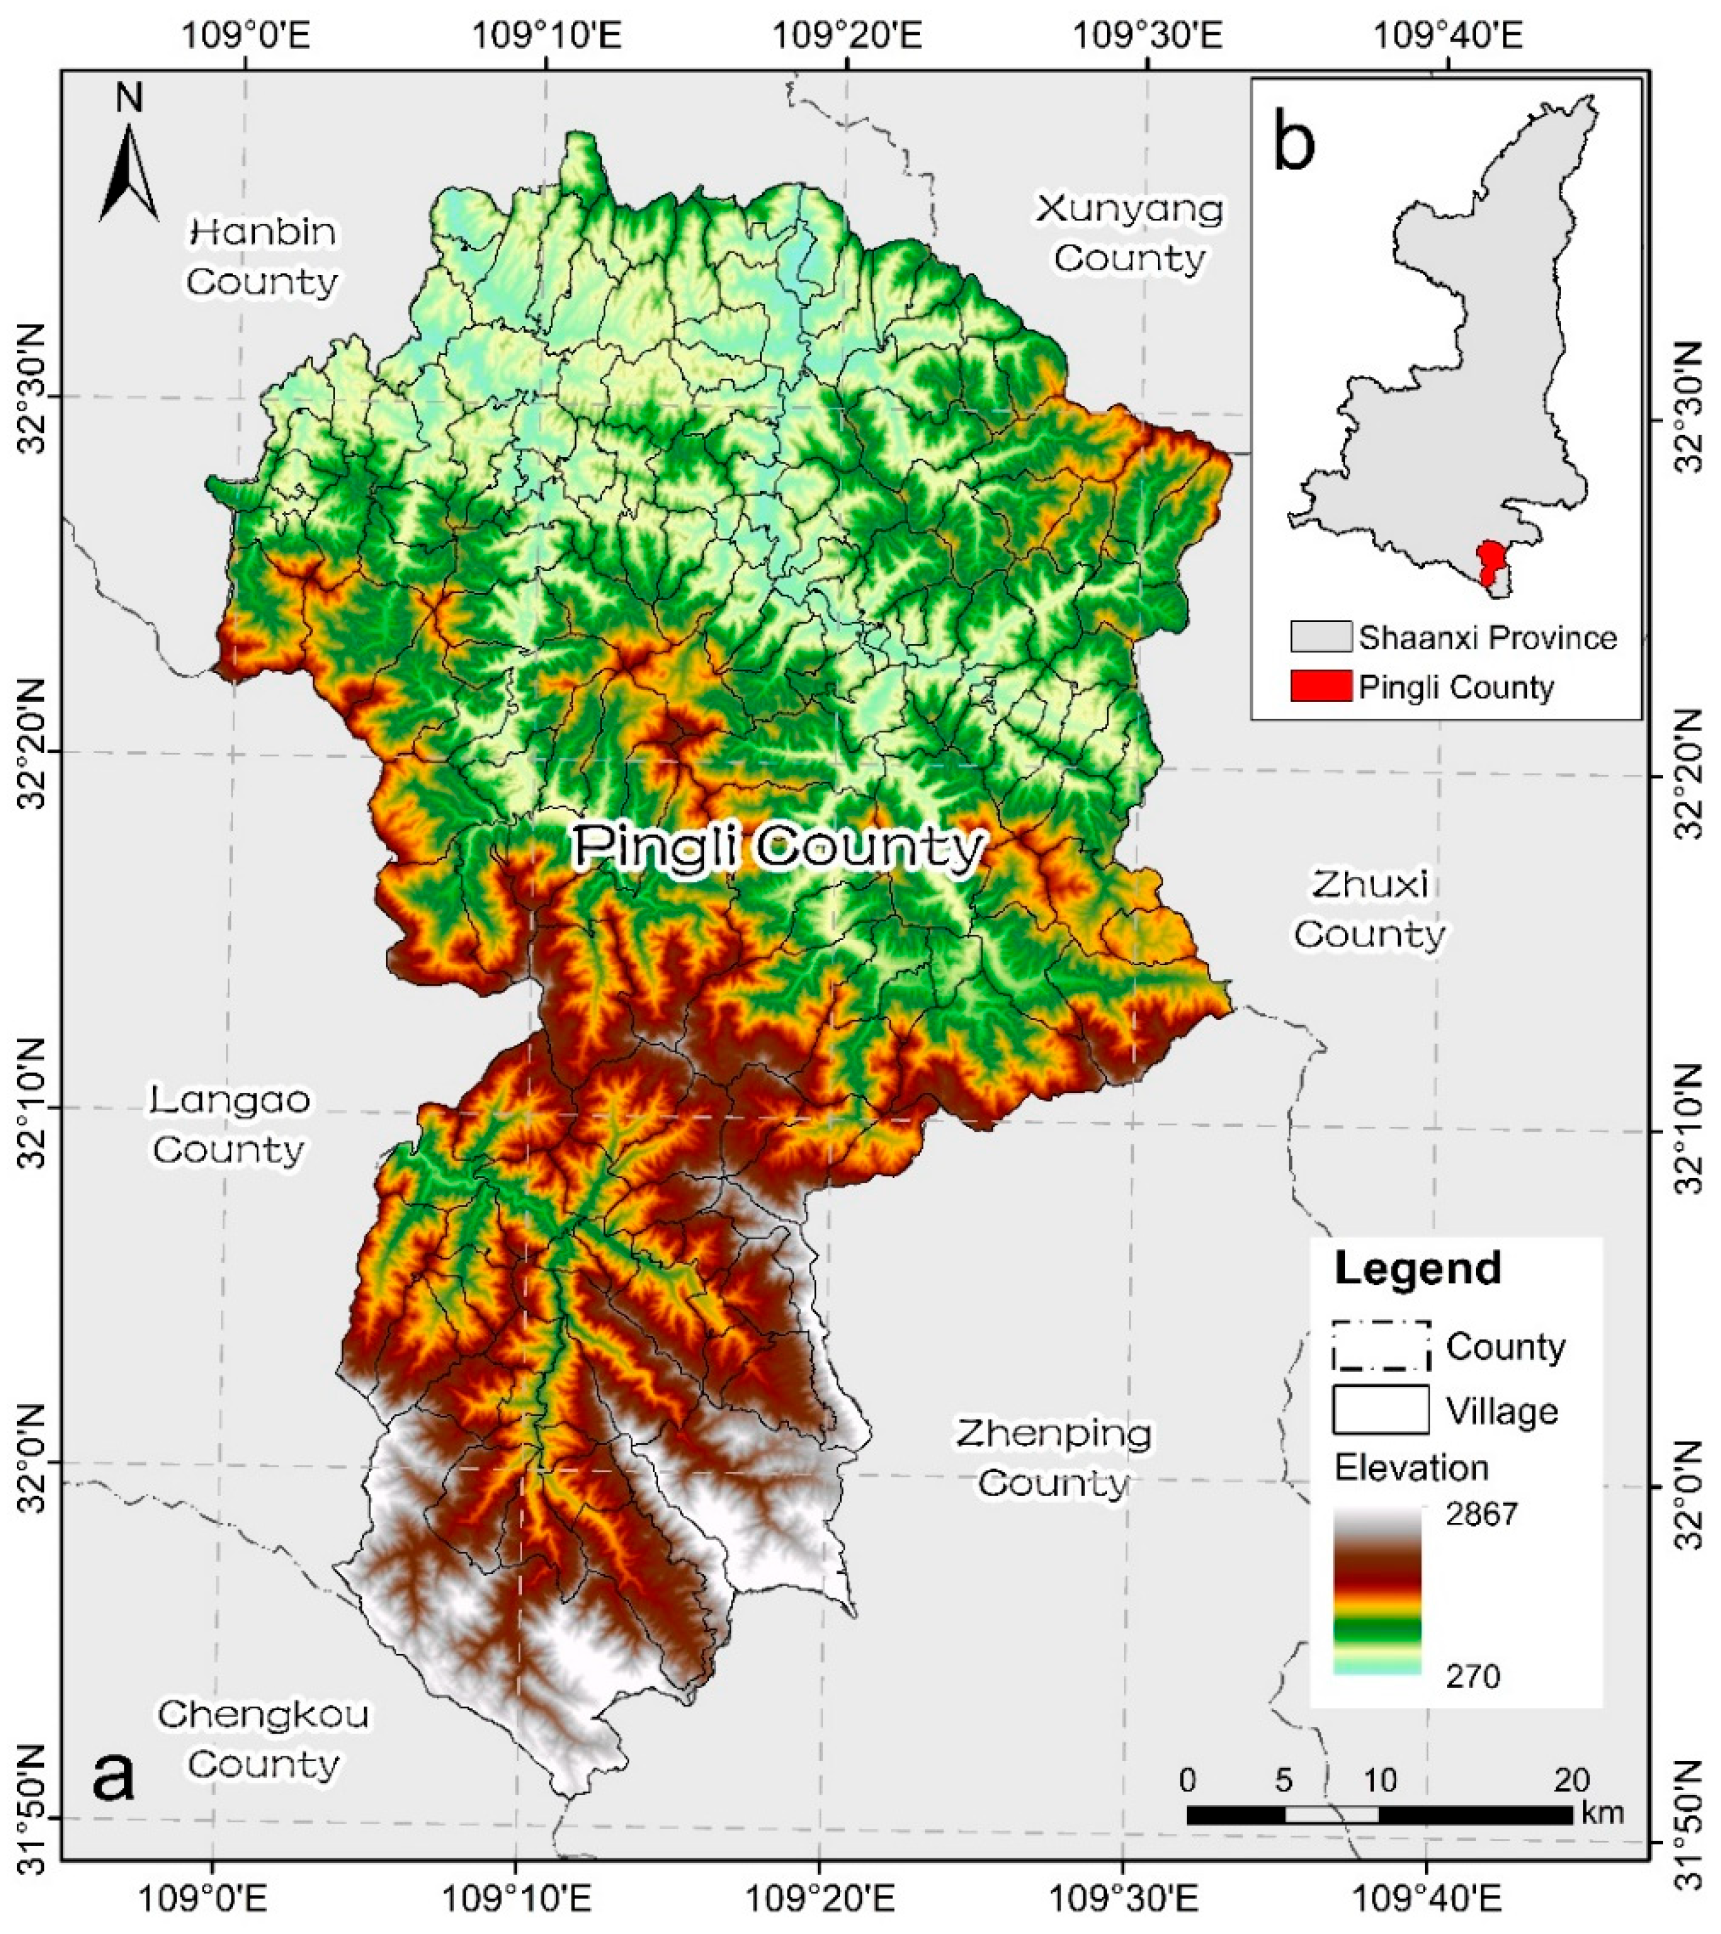
3.1. Study Area

As a key region for a MR program in Southern Shaanxi, Pingli County (Figure 1) is located at the northern foot of the Ba Mountain and is affiliated with Ankang, Shaanxi, China, with a total area of 2647 km2 (https://www.pingli.gov.cn/, 4 January 2024). The elevation of the area varies from 270 m to 2867 m, with mountainous terrain in the south and hilly terrain in the north, making it a typical hilly mountain county. The area is in the subtropical climate zone, with a mean annual temperature of 13.9 °C and total annual precipitation of 942.2 mm. Pingli County was the first county for gynostemma production in China and is the most famous tea county in Northwest China. As of 2020, the county has 200,000 mu (1 mu = 666.67 m2) of ecological tea gardens and 50,000 mu of gynostemma. From 2011 to 2020, Pingli County implemented three batches of MR programs, achieving the relocation of 29,297 households and 97,217 people, involving 178 administrative villages under its jurisdiction. Pingli County is an ecologically fragile and economically disadvantaged region. Using it as a study area offers valuable lessons for the development of migration policies in regions like Brazil or Africa. Additionally, the findings provide important insights into the sustainable development of cropland in other ecologically fragile areas worldwide.

3.2. Data Source and Preprocessing

Land cover data with a resolution of 30 m × 30 m were obtained from the China Land Cover Dataset (CLCD) by Yang and Huang [40]. The CLCD dataset classifies land use types into nine categories: cropland, forest, shrub, grassland, water, snow, barren, impervious, and wetland. The visual interpretation validation results showed that the average overall accuracy of the CLCD was 79.30%. MR data were obtained from the Natural Resources Bureau of Pingli County. The Digital Evaluation Model was derived from the Advanced Land Observing Satellite-1 project of the Japan Aerospace Exploration Agency (https://search.asf.alaska.edu, 1 January 2024) with a resolution of 12.5 m × 12.5 m. Meteorological data were obtained from the meteorological data center of the China Meteorological Administration (http://data.cma.cn, 1 March 2024). Road vector data, construction land vector data, and other vector data such as administrative boundaries came from the Second National Land Survey database and the Third National Land Survey database of Pingli County [41].
The statistical data used in this study included topographic, climatic, land cover, MR, and socioeconomic conditions. These datasets differed in terms of their primary form, type, resolution, statistical cell, spatial reference, etc. Therefore, it was essential to preprocess the data and set up a uniform spatial database in the ArcGIS 10.8 software. All the data were converted into spatial data (GIS layer) in order to facilitate their subsequent modeling. The World Geodetic System 1984 ellipsoid was used to establish the reference coordinate datum. Then, a projected coordinate system was established, whose projection mode and central meridian were set to Universal Transverse Mercator and 108° E, respectively.

3.3. Variables Selection

3.3.1. Explained Variable

CA is characterized as the termination of agricultural activities on croplands with subsequent natural vegetation restoration [42]. In this study, the conversion scale from cropland in 2010 to non-cropland (forest, grassland, or shrub) in 2020 was taken to represent the area of CA of each village:
C A i = S i C A S i C 10 × 100 %
where i represents the i th village ( i = 1, 2, …, 176), C A i is the C A rate of the i th village, S i C A is the abandoned cropland area of the i th village during 2010–2020, and S i C 10 is the total cropland area of the i th village in 2010.
Additionally, Pingli County has also implemented the “Grain for Green” program. Hence, the cropland was converted into forest and grassland with a slope of 25° or higher was considered to have implemented “Grain for Green”. Changes in land use types caused by “Grain for Green” were not included in the scale of CA.

3.3.2. Core Explanatory Variable

A MR program relocates parts of the population from one area to another to achieve the goal of avoiding ecological risks or alleviating poverty. Thus, the area discrepancy between the relocation zone and the resettlement zone was utilized to quantify the MR program. Considering that resettlement areas usually have a higher degree of intensive land use, the difference in area between relocation and resettlement areas cannot simply be calculated directly. Notably, MR programs are usually carried out within a county, and the total population for relocation is often equal to the total population for resettlement. As a result, this paper chose to use the ratio of population density as the conversion coefficient to achieve a comparable scale of relocation and resettlement. The specific formula is as follows:
φ = P o p u l a t i o n T o t a l / S T o t a l R L P o p u l a t i o n T o t a l / S T o t a l R S = 2.357
where φ represents the conversion coefficient, P o p u l a t i o n T o t a l is the total population of the MR program, S T o t a l R L is the total area of homesteads in the relocation area, and S T o t a l R S is the total area of homesteads in the resettlement area.
In addition, in order to eliminate differences in size between villages, the difference between relocation and resettlement areas was divided by the total area of each village. The specific formula is as follows:
M R i = S i R L S i R S × 2.357 S i × 100 %
where M R i is the scale of M R of the i th village, S i R L is the area of homestead in the relocation area of the i th village, and S i R S is the area of homestead in the resettlement area of the i th village.

3.3.3. Other Variables

(1)
Topographic factors
CA is correlated with topography [43]. In this study, slope and elevation were selected as indicators to describe topography. Slope was calculated using the Surface Toolset provided in the ArcToolbox of ArcGIS 10.8. The mean slope and elevation of CA were counted using the Zonal Toolset provided in the ArcToolbox of ArcGIS 10.8.
(2)
Climatic factors
Climate conditions are the most important elements determining agricultural production. In general, the physical yield is higher in areas with abundant precipitation and higher temperatures [44]. Thus, the mean annual precipitation and temperature of the village were selected to reflect the climatic conditions. Precipitation and temperature were counted using the Zonal Toolset provided in the ArcToolbox of ArcGIS 10.8.
(3)
Socioeconomic factors
① Per capita cropland resources
CA is linked to per capita cropland resources [45]. Referring to Zhang et al. [46], the changes in per capita cropland resources were calculated as follows:
P C R i = S i C 20 S T o t a l H 20 S i C 10 S T o t a l H 10
where P C R i represents the change in per capita cropland resources of the i th village, S i C 20 is the total cropland area of the i th village in 2020, S T o t a l H 10 is the total homestead area of the i th village in 2010, and S T o t a l H 20 is the total homestead area of the i th village in 2020.
② Rural road density
Rural road density can reflect the economic development level of a village. The change in rural road density was calculated as follows:
R D i = L i R 20 S i L i R 10 S i
where R D i represents the change in the rural road density of the i th village, L i R 10 is the road length of the i th village in 2010, and L i R 20 is the road length of the i th village in 2020.
(4)
Engineering measures
In order to protect the ecological environment and restore ecological vegetation, MR programs usually use engineering measures to reclaim the migrants’ homesteads and abandoned industrial and mining land, turning them into forestland and grassland. However, for the surrounding cropland, vegetation restoration will increase the risk of wildlife invasion, which will destroy field crops and reduce yields [47]. Vegetation restoration will also form a competitive relationship with the surrounding cropland, especially in terms of water resources and spaces, which will further reduce the profit from cropland utilization [48]. Additionally, these forestlands and grasslands may also cause the fragmentation of cropland and increase agricultural production costs [49]. All of these may exacerbate CA. Thus, this paper chose the proportion of the reclaimed forestland and grassland area to the homestead area in the relocation area to represent the engineering measures. The specific formula is as follows:
E M i = S i F + S i G S i R L × 100 %
where E M i represents the engineering measures of the i th village, S i F is the area of restored forestland of the i th village, and S i G is the area of restored grassland of the i th village.
Table 2 shows the Statistical description of all variables, include dependent variable and independent variables.

3.4. Econometric Model

3.4.1. Multiple Linear Regression Model

As one of the traditional classical regression models, the multiple linear regression model is an important estimation method for exploring causal relationships [38]. Simultaneously, the coefficient of multiple regression is actually a partial regression coefficient, and thus, multiple regression can more accurately reflect the independent contribution of each explanatory variable to the explained variable. Combined with the selected variables in Section 3.3, a multiple linear regression model was constructed as follows:
C A i = β 1 M R i + β 2 S l o p e i + β 3 E l e v a t i o n i + β 4 P r e c i p i t a t i o n i + β 5 T e m p e r a t u r e i + β 6 P C R i + β 7 R D i + β 8 E M i + ε i
In Equation (7), the meaning of each variable is as described in Section 3.3. β 1 to β 8 are the estimated coefficients. ε i is the random disturbance term. This paper used the least-square method to estimate Equation (7).

3.4.2. Threshold Regression Model

The threshold regression model, which not only analyzes the dynamic linear relationship between different indicators but also provides an interpretable threshold mechanism, perfectly balances the simplicity of the model and the applicability of reality. It has an irreplaceable role in the model construction of sociology and management [50]. In this paper, we analyze the nonlinear relationship between MR and CA by introducing the threshold regression model. When a threshold variable passes through the threshold value, the functional model presents piecewise linear characteristics. The threshold value derived from a systematic regression is endogenous, thus avoiding biased estimates due to subjective choices [51]. Given this advantage, the threshold model is widely used in the field of economic studies [52,53]. A single threshold model is as follows [54]:
Y i = α 1 X i + δ i , q i γ
Y i = α 2 X i + δ i , q i > γ
In Equations (8) and (9), Y i is the explained variable, X i represents the explanatory variables, q i is the threshold variable, γ is the threshold value to be estimated, α 1 and α 2 are the coefficients of the explanatory variable when q i γ and q i > γ , respectively, and δ i is the random disturbance term. Sets I γ = { q i γ } and I · denote the indicator function. When q i γ , I = 1 ; otherwise I = 0 . Then, the model can also be converted to
Y i = α 1 X i · I q i γ + α 2 X i · I q i > γ + δ i
Combining the goals of this paper, a single threshold model was constructed with M R as the core explanatory and threshold variable:
C A i = α 1 M R i · I q γ + α 2 M R i · I q > γ + α 3 S l o p e i + α 4 E l e v a t i o n i + α 5 P r e c i p i t a t i o n i + α 6 T e m p e r a t u r e i + α 7 P C R i + α 8 R D i + α 9 E M i + δ i  
The meaning of each variable is as described in Section 3.3. α 1 to α 9 are the estimated coefficients.
In practice, threshold model estimation usually consists of three steps. First, the sum of squared residuals from Equation (11) was calculated by any given threshold value. Through multiple rounds of estimation, the parameter estimation result with the minimum sum of squares of residuals was selected. Second, bootstrap and likelihood ratio statistics were employed to assess the reliability of the thresholds and to calculate confidence intervals for the threshold estimates. Third, if the threshold estimation value passes all tests, the first and second steps will be repeated to estimate the next threshold estimation value and then test its effects [55].
Additionally, this study used Stata 15 to estimate the multiple linear regression model and the threshold regression model to test the linear or nonlinear effects of MR on CA.

4. Results and Analysis

4.1. MR in Pingli County

During the 2010–2020 period, the relocation scale and resettlement scale of the MR program in Pingli County were 10.691 km2 and 4.535 km2, respectively. Since the relocation scale and the resettlement scale could not be directly comparable, the difference between the two was calculated on the basis of the conversion factor provided in Formula (2), dividing the MR program into three types (Figure 2a). When the relocation scale was larger than the resettlement scale, the MR program was mainly for population emigration. This type of MR program could be classified as the out-migration type. There were 121 villages that implemented out-migration-type programs, accounting for 67.98%. On the contrary, some MR programs were of the in-migration type. There were 55 villages that implemented in-migration-type programs, accounting for 30.90%. In addition, two villages were categorized as vacant types, as they did not involve relocation or resettlement. It can be seen that the MR programs in Pingli County are mainly of the out-migration type. In terms of spatial distribution, the in-migration type was generally concentrated in the surrounding areas of the county, town, and township centers, whereas the out-migration type was scattered throughout the county (Figure 2a) and the MR value was calculated according to Equation (3). Based on the natural breaks method, MR values were classified into five categories. Figure 2b shows that the MR value of Shishuigou Village was the largest at 1.097%, and the MR value of Gaofeng Village was the smallest at −17.939%. It can be seen that the villages (MR > 0.397%) where a large number of people had moved out were mainly concentrated in the northern part of Pingli County because of the frequent occurrence of geological disasters in this area.

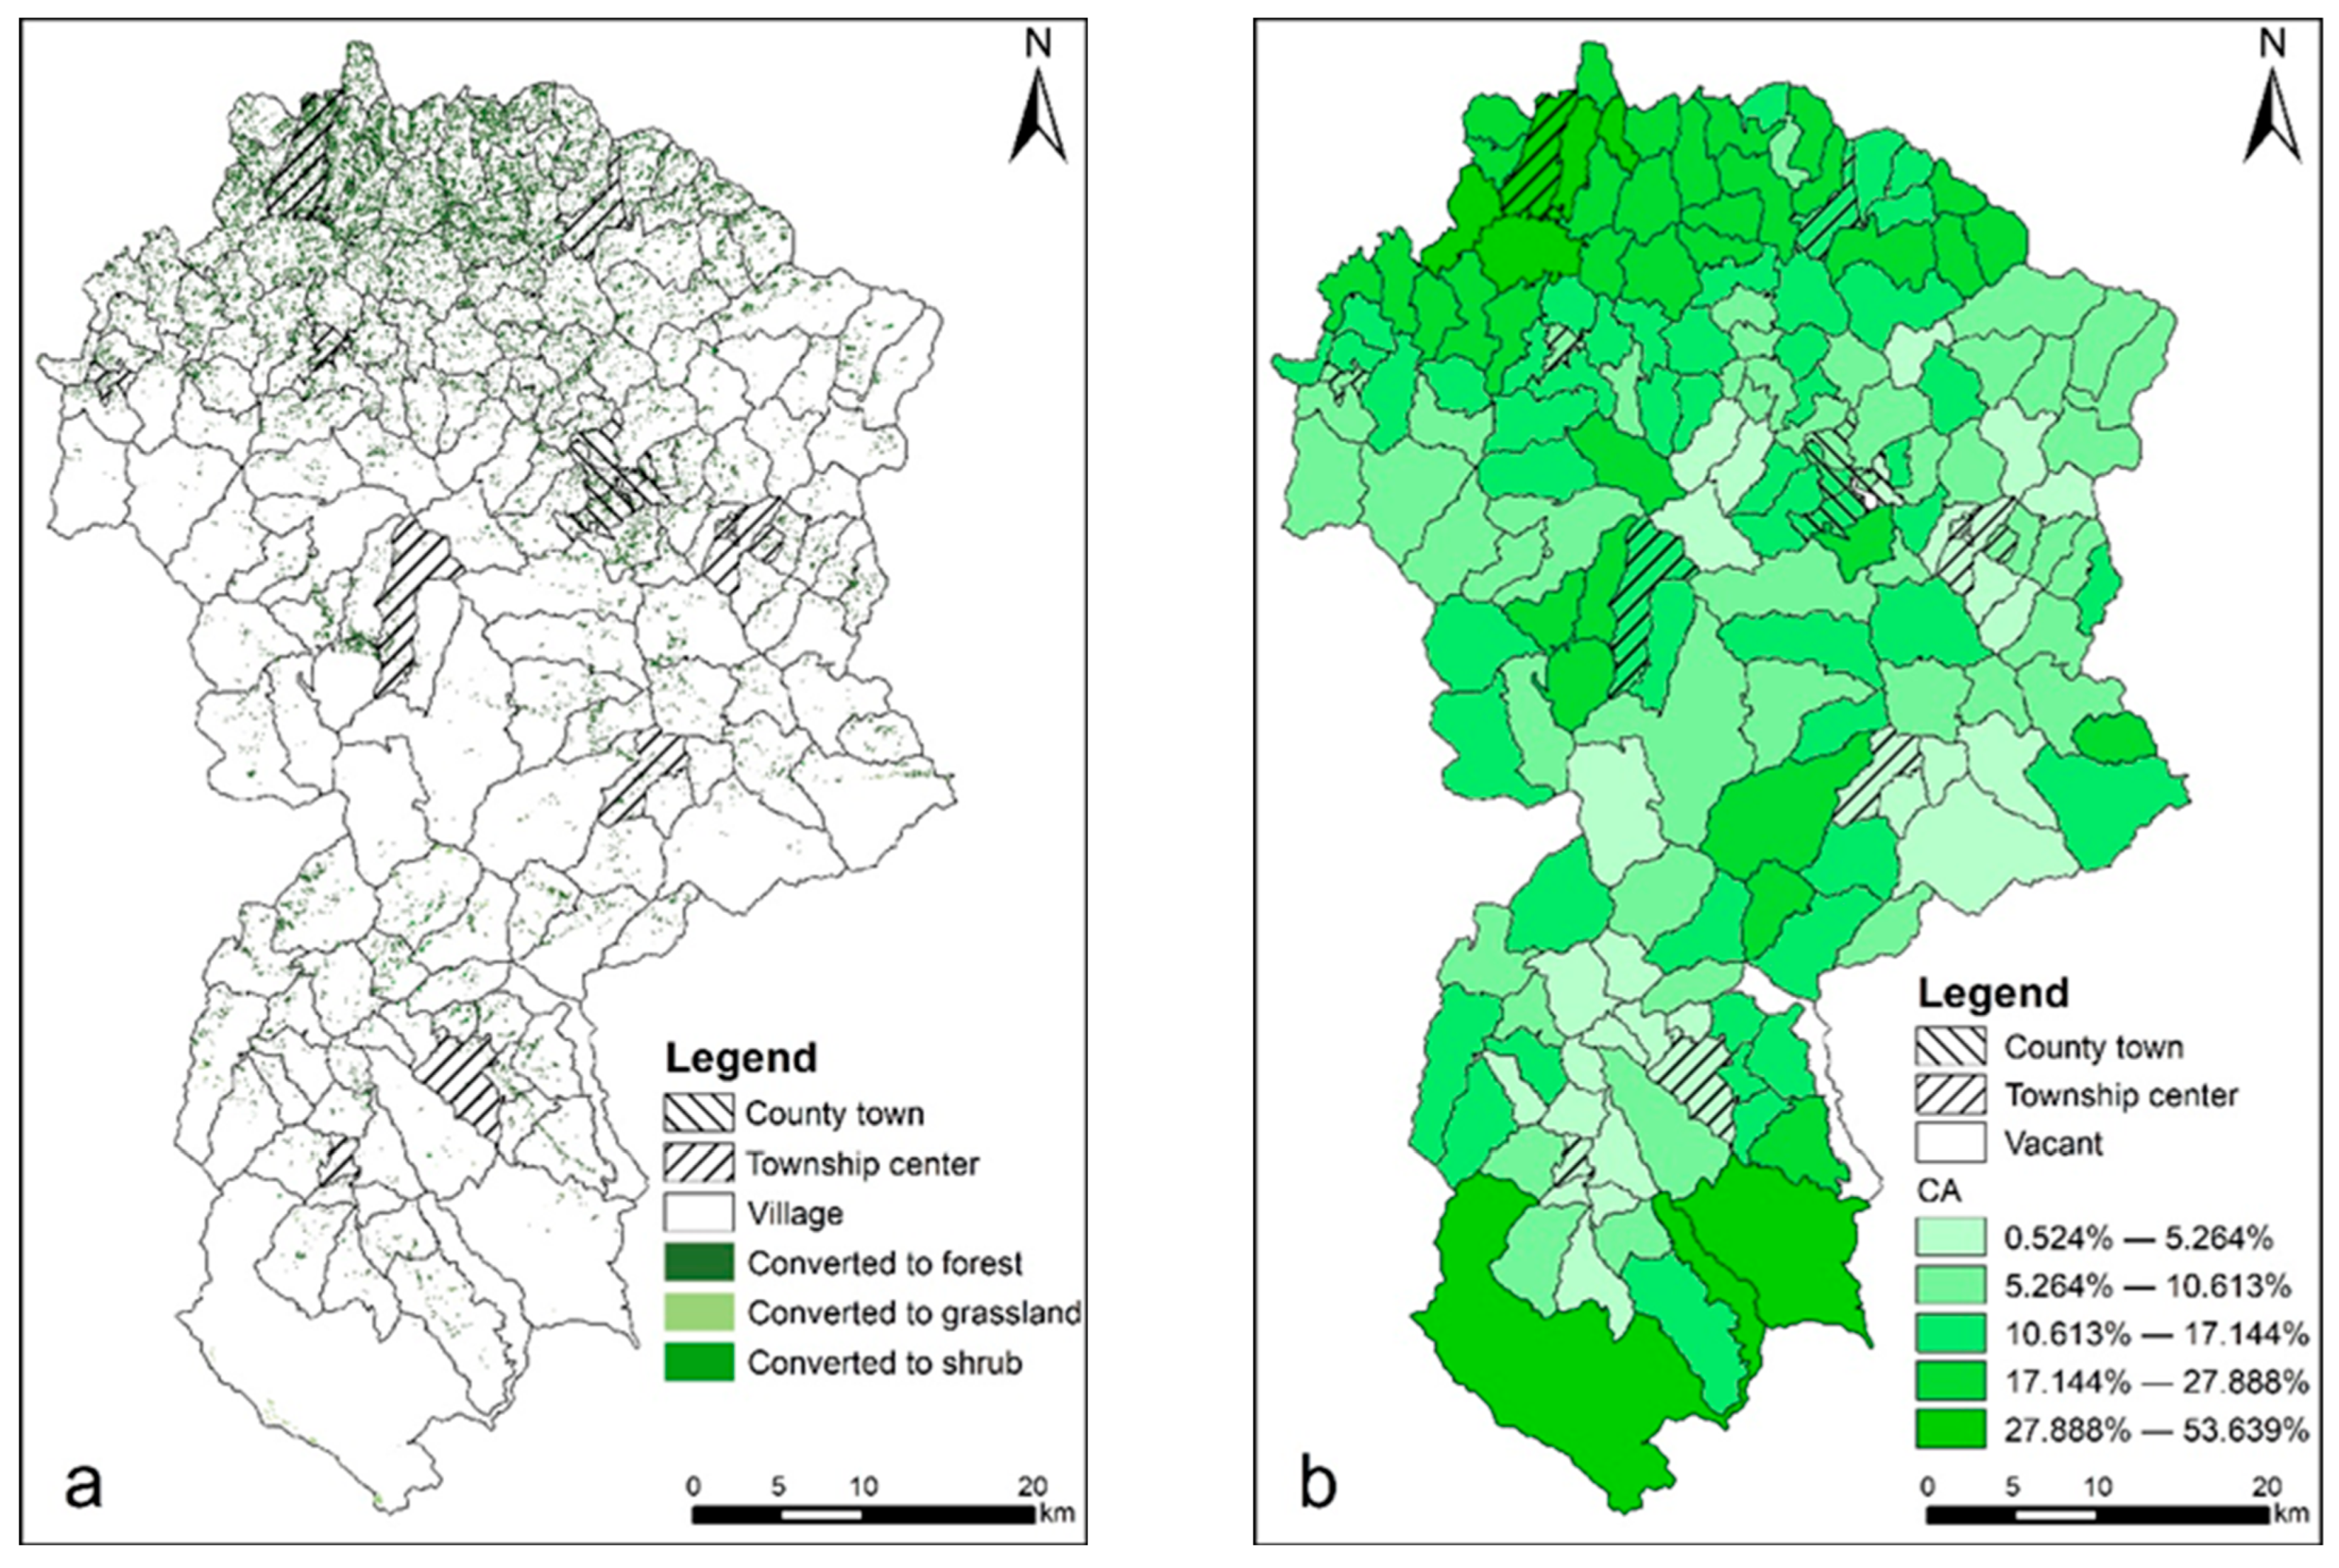
4.2. CA in Pingli County

During the implementation of the MR program, the area of CA in Pingli County added up to 35.910 km2. Among it, the area of cropland converted to forest was 35.553 km2, the area converted to grassland was 0.352 km2, and the area converted to shrub was 0.005 km2, accounting for 99.01%, 0.98%, and 0.01%, respectively. It can be seen that CA mainly took the form of conversion from cropland to forest. As shown in Figure 3a, abandoned cropland is centered in the northern area with relatively low elevations and gentle slopes, which is the largest and most densely distributed area. In the western area, it is relatively concentrated in a few villages, and it is dispersed quite equally in the eastern and southern areas. Moreover, the converted-to-forest type is generally located in the northern area, while the converted-to-grassland type is mostly spread across the southern area. The converted-to-shrub type is mainly distributed in the eastern and southern areas. CA values were classified into five categories using the natural breaks method. Figure 3b shows that the CA value reached a maximum of 53.639% in Zhengyang Village and dropped to a minimum of 0.524% in Qujiagou Village. The high CA values (CA > 17.144%) were mainly distributed in the northern areas. The lower CA values (CA < 10.613%) were more concentrated and contiguous.

4.3. Results and Analysis of Econometric Model

To avoid multi-collinearity among the explanatory variables, the test of variance inflation factor (VIF) was conducted. With the exception of temperature (VIF = 10.82), the maximum VIF value of a single variable was 3.20, and the mean VIF was 1.88, which was much less than the critical value of 10. Therefore, the temperature from the control variables in the subsequent regressions was removed. Further, to eliminate the influence of heteroskedasticity, robust standard error treatment was employed for the multiple regression. Table 3 reports the results of the multiple regression. The estimated coefficient of MR was 1.144, which was statistically significant at the 1% level. It was thus verified that MR did affect CA.
Further, in order to verify whether there was a threshold effect between MR and CA, the threshold regression model was applied. First, the threshold test was performed, with an LM-Value and p-value of 21.452 and 0.028, respectively, indicating that the null hypothesis (H0) was rejected at the 5% significance level. In other words, there was a threshold effect between MR and CA. To avoid the influence of heteroskedasticity, robust standard error treatment was also employed for the threshold regression. Table 4 reports the threshold regression results. Comparing the goodness-of-fit, it can be seen that the explanatory power of the threshold regression result (with R2 as 56.1% before the threshold and 51.3% after the threshold) was stronger than that of the multiple regression result (R2 = 45.3%). This implies that the results of the multiple regression may have masked the real econometric relationship between MR and CA. To this end, the subsequent analysis in this paper is mainly based on the estimation results of the threshold model.
When MR < 0, CA gradually decreases with the decrease in MR (Figure 4). That is, MR inhibits CA. This means that when an MR program is of the in-migration type, MR will play a positive role in restraining CA. Actually, because the resettlement scale is larger than the relocation scale, the MR will inevitably promote an increase in the village population. This entails more cropland to provide agricultural products, thereby reducing the probability of CA. In addition, although villages belonging to the in-migration type are mainly close to county, town, or township centers, off-farm employment opportunities are unstable and living costs increase significantly. Hence, migrants need to continue to maintain traditional livelihoods. In this case, migrants that belong to the land resettlement model will value government-allocated cropland more, whereas those that belong to the landless resettlement model also rent the contracted land of Indigenous villagers for farming.
When 0 < MR ≤ 0.258% (Figure 4b), the MR program is of the out-migration type and MR has a significant positive impact on CA. Specifically, MR programs change the distance between the homestead and the cropland of migrants. As the increase in the farming radius raises the agricultural production cost and reduces the economic viability of agricultural production, low-profit cropland will be abandoned first. Simultaneously, as migrants move out, the government reduces investment in the infrastructure of the relocation areas, especially agricultural infrastructure. The degradation of or damage to agricultural infrastructure can cause some migrants to scale back or discontinue their investment in cropland in the relocation areas. In summary, the increase in production cost is the main reason for CA caused by MR.
When MR > 0.258% (Figure 4b), the MR program is still of the out-migration type. However, MR shows a significantly inhibitive impact on CA. In fact, in order to prevent CA, the Master Plan encourages migrants to transfer their contracted cropland. The field survey also found that after the implementation of the MR program, the phenomenon of cropland transfers indeed increased significantly. Compared with abandoning cropland, the transfer of cropland can also maximize the interests of migrant families. Additionally, the Master Plan also encourages migrants to hand over their cropland to collective economic organizations for trust or management. This has also played a positive role in further alleviating CA.
In fact, agricultural mechanization in sloping terrain is essentially a limited substitution of labor by agricultural machinery. Due to terrain constraints, mechanization cannot completely replace manpower, which in turn increases production costs. However, the development of small machines in recent years has reduced the constraints of slope [56]. Simultaneously, cropland with flat terrain in a valley often suffers from geological disasters and thus lacks comparative advantages. Cropland with relatively high slopes may be more income-guaranteed. In addition, a further comparison of the average slopes of abandoned and expanded cropland revealed that the average slope of expanded cropland (21.41°) was higher than the mean slope of abandoned cropland (18.36°).
It can be seen that the slope is no longer a determinant factor in the abandonment of cropland in Pingli County. The water and soil condition of higher elevation areas was worse than that of lower elevation areas, and transportation was also more inconvenient, especially in mountainous areas. This will affect the benefit of cropland use. Therefore, cropland at high elevations is prone to be abandoned. Precipitation has a negative impact on CA. Interestingly, the estimated coefficients for EM and PCR were not significant either before or after the threshold value. Additionally, before the threshold value, RD significantly contributed to the occurrence of CA. Actually, higher rural road density often means better economic development, especially for non-grain industries such as cash crops. This will reduce the dependence of village development on land resources, which may be more likely to lead to CA [57]. After the threshold value, the coefficient of RD was negative but not statistically significant.

5. Further Discussion

Based on the research area of Pingli County, this study explored the effects of MR programs on CA. To avoid the subjectivity of model selection, this study selected a classical multiple regression model and threshold regression model for the analysis. This makes sense because some studies pointed out that MR not only changes the migrants’ place of residence but also promotes the reconstruction of the regional production systems [32,33]. The results suggested that the threshold regression model had better explanatory power (with R2 at 56.1% before the threshold and 51.3% after the threshold) than the classical multiple regression model (R2 = 45.3%). In fact, the threshold regression model is equivalent to a further expansion of classical multiple linear regression and can solve the problem of complex system structural change [54]. Hence, it is true that the results of the threshold regression model are more credible.
The essence of CA is that it is not economically viable, which has been generally recognized by the academic world [9]. It is confirmed that the cropland-to-housing distance affects farming costs and benefits, and zero-profit distance is a key factor determining CA [58]. This is also the reason Chinese farmers live in dispersed places. However, MR programs in Southern Shaanxi usually relocate people from their original residences to new communities, resulting in a spatial mismatch between the residence and the cropland. Undoubtedly, for migrants, MR programs will increase the costs of engaging in agricultural production and reduce the economic feasibility of their original contracted cropland. This explains why most micro-scale studies, using household survey data of migrants as a sample, concluded that MR promotes CA. The results also confirmed the above point to some extent. That is, MR will promote CA when it is within the range of 0 to 0.258%.
However, micro-scale studies tend to ignore the mobility of cropland [8]. In fact, some croplands that migrants consider unworthy of cultivation actually provide non-migrants with opportunities to expand their production scale [59]. Meanwhile, micro-scale studies do not consider the effects of MR on CA in the resettlement area; that is, the integrity of the policy is insufficiently considered. In contrast, macro-scale studies based on multi-source data can provide a more comprehensive understanding. This is because any land use decision made by migrants and non-migrants, as well as any land-use changes caused by MR programs in relocation and resettlement areas, will be reflected in macro-scale land-use changes.
The modeling results confirmed that the impact of MR on CA is nonlinear. That is, MR will first restrain, then promote, and then again restrain CA. It can be seen that when relocation or resettlement are, respectively, the dominant types, MR shows complex characteristics in affecting CA. Actually, whether the relocation causes CA depends on the distance between the cropland and the migrant’s new place of residence, as well as the distance between those croplands and the non-migrant’s place of residence [31]. As scattered living is still the main feature of Chinese farmers, this spatial matching is often not ideal, which will promote CA in the preliminary stage of relocation [60]. However, as the scale and number of relocations increase, this spatial matching will usually continue to improve. In particular, the possibility that migrants’ cropland is within the zero-profit distance of non-migrants will increase, thereby reducing the possibility of migrants’ cropland being abandoned. Moreover, with the increase in the resettlement population, more cropland within the zero-profit distance around the resettlement areas is needed to meet the livelihoods of migrants [32]. This is conducive to reducing the potential risk of CA by non-migrants in the resettlement area. In summary, due to the different mechanisms between relocation and resettlement affecting CA, as well as scale changes in relocation and resettlement, MR and CA show a non-linear relationship at the regional scale.
Notably, although MR will inhibit CA when MR < 0 or MR > 0.258%, the estimated coefficients of MR are quite different. This means that when relocation and resettlement are the dominant types of MR programs, the effects of MR in inhibiting CA are different. This is because although both relocation and resettlement are constrained by the zero-profit distance, the spatial dispersion of relocation is greater than that of resettlement. The data showed that the number of relocation areas in Pingli County is 17.2 times that of resettlement areas. In other words, relocation has a larger sphere of influence. This also explains why the out-migration type MR (MR > 0.258%) makes a stronger marginal contribution to restraining CA. Interestingly, the estimated coefficient was only significant at the 10% level. This is because it is more up to non-migrants whether the cropland of migrants is abandoned. Wang et al. pointed out that with low expected returns, non-migrants around the relocation area may be less motivated to cultivate migrants’ cropland for agriculture production [31]. In contrast, although the MR program provided each household with one off-farm employment opportunity, it was still difficult to meet the migrants’ livelihood needs. Therefore, the migrants in the resettlement area would cherish cropland. Moreover, the in-migration type (MR < 0) increases the village population, which makes various potential competition relationships more intense [33], especially the human–land relationship in the centralized resettlement area, resulting in resettlement having a more significant inhibitory impact on CA. In summary, differences in the spatial details of program implementation and the external environment of micro-subjects between relocation and resettlement cause MR to make different marginal contributions to inhibiting CA.

6. Conclusions and Implications

6.1. Main Finding

  • Based on the relocation scale and resettlement scale, the MR programs in Pingli County were divided into three types: out-migration, in-migration, and vacant. Among them, out-migration was the main type, accounting for 67.98%. MR had a maximum value of 1.097% and a minimum value of −17.939%.
  • From 2010 to 2020, the amount of CA in Pingli County added up to 35.910 km2. Of this, 35.553 km2 was converted into forest, accounting for 99.01%. The rest was converted into grassland and shrubland. The high CA values (CA > 17.144%) were concentrated in the northern hilly areas, while the lower CA values (CA < 10.613%) were concentrated around townships in the central and southern areas.
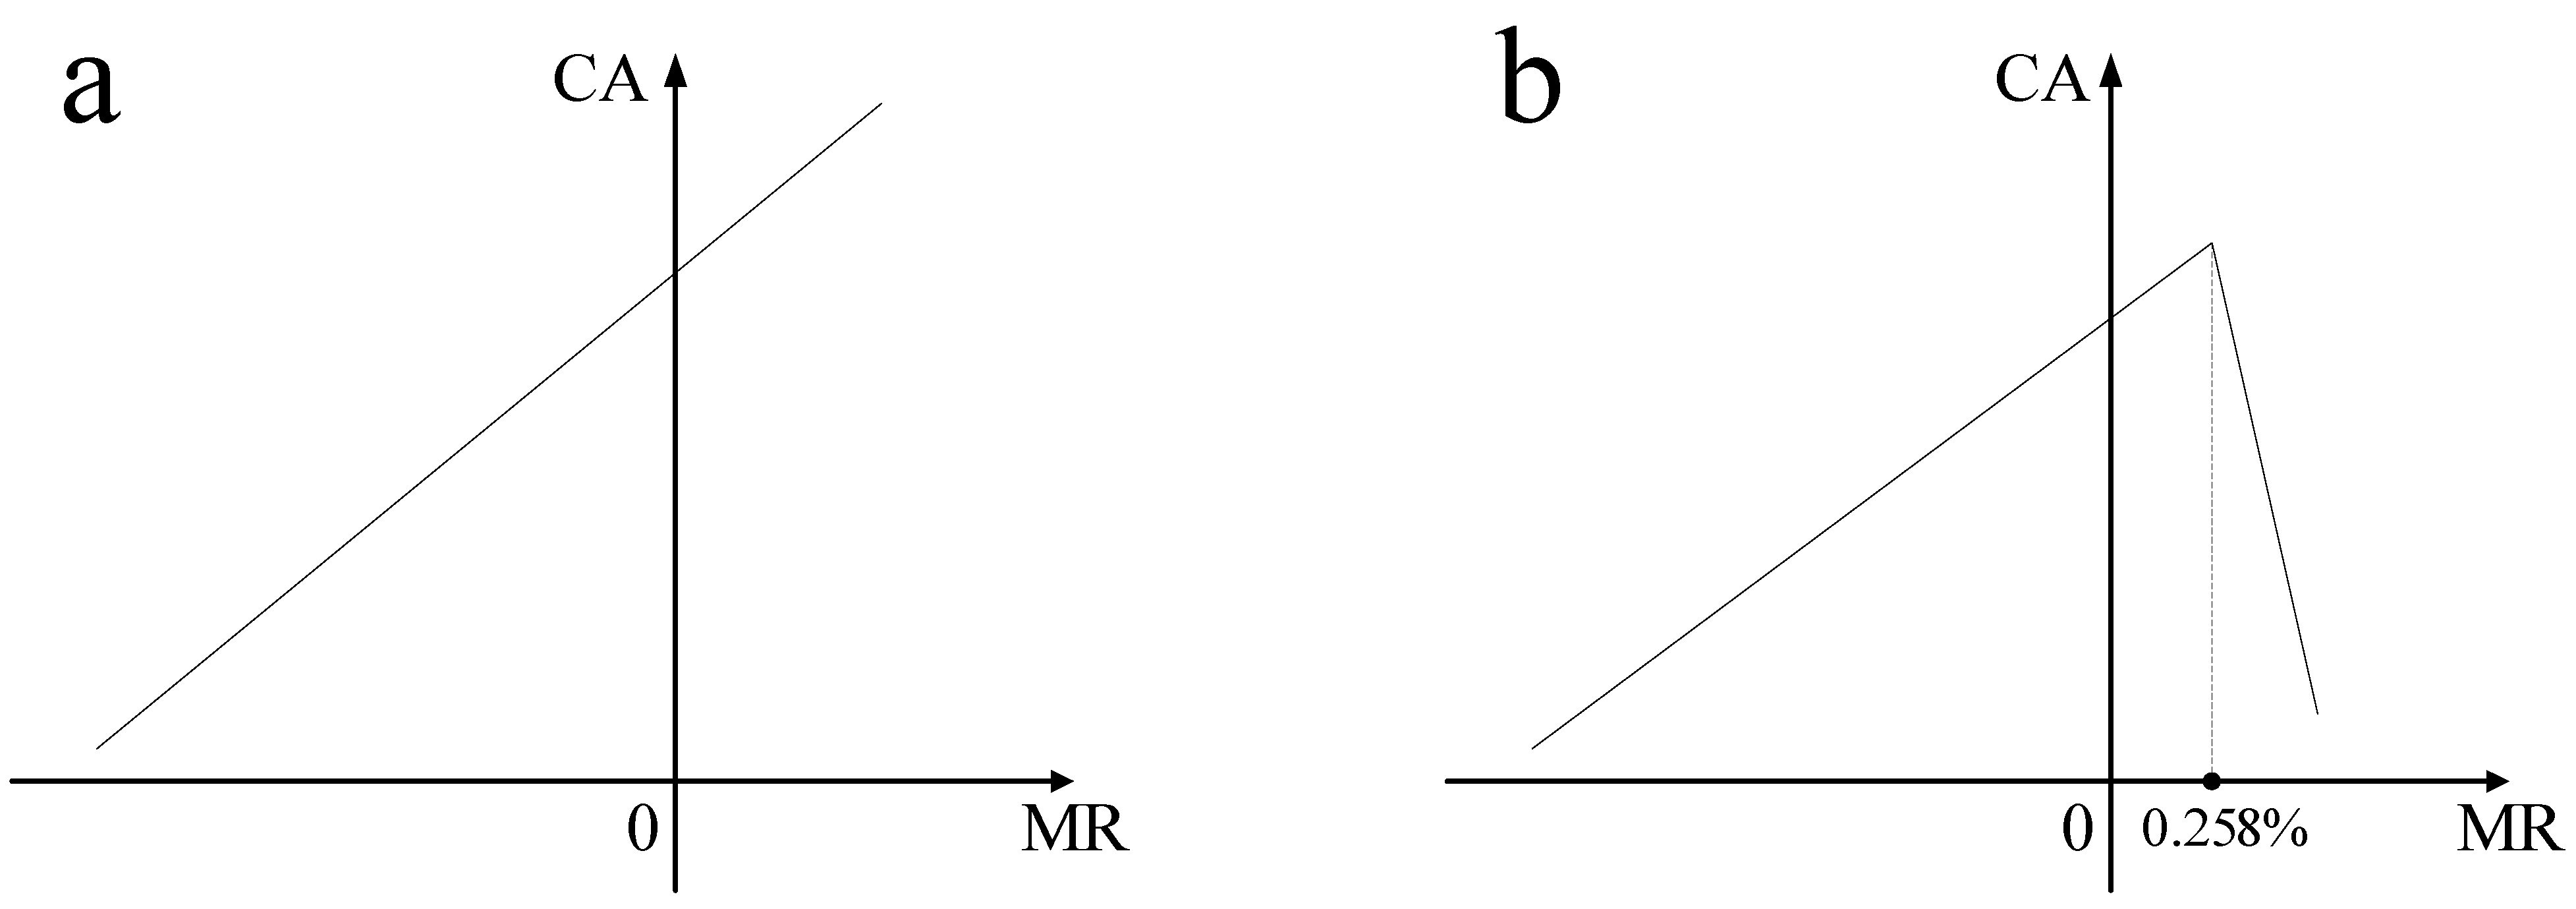
  • The impact of MR on CA showed a nonlinear relationship. The threshold value was 0.258%. Specifically, when MR ≤ 0 or MR > 0.258%, MR had an inhibitory impact on CA; when 0 < MR ≤ 0.258%, MR promoted the occurrence of CA. Thus, it is not appropriate to assume that there is a linear relationship between MR and CA, and this will greatly affect the accuracy of policy evaluations. Compared with the multiple linear regression model, the threshold regression model was able to mine more useful information and is thus a powerful tool for policy evaluations.
  • Although micro-scale studies such as household surveys can directly observe the actual behavioral changes of policy participants, especially land use behaviors, they ignore the mobility of cropland and policy integrity. In contrast, the result of macro-scale studies can provide a comprehensive understanding of policy effects. This also provides a new perspective for this research field.

6.2. Policy Implications

There are three policy implications. First, policy implementers should comprehensively consider the scale of relocation and resettlement in villages to avoid CA caused by MR; that is, to avoid MR within the range of 0 to 0.258%. Second, although centralized resettlement can promote the intensive utilization of land resources and reduce public service expenditures, it is not conducive to solving the relationship between residence and agricultural production. Hence, it is necessary to scientifically determine the location of the resettlement site, especially the distance from the cropland to the residence, and appropriately increase the proportion of decentralized resettlement. Finally, the transfer of cropland is the key to solving CA due to MR. To this end, it is necessary to speed up the confirmation of land rights and cultivate a standardized and institutionalized cropland transfer market. Simultaneously, some non-grain industries, such as cash crops, should be allowed to develop in mountainous cropland. This will help improve the economic feasibility of cropland in mountainous areas and stimulate farmers’ enthusiasm for agricultural production.
This study has two main limitations: (1) According to the arrangement of the Master Plan, there are different patterns of relocation and resettlement (Table 1). However, as it was limited by the availability of the data, this study did not strictly distinguish between these patterns. Therefore, further studies can assess in depth the effects of MR programs on CA on the premise of obtaining more detailed data. (2) The resolution of the land cover data used is 30 m × 30 m, which may have biased the estimation of CA. At the same time, the cross-sectional data could not capture the dynamic changes in CA. Therefore, future studies can select land cover data with a finer resolution and analyze the time-series characteristics of CA.

Author Contributions

Conceptualization, J.L. and X.Z.; methodology, X.Z.; software, X.Z.; validation, J.L., X.Z. and X.H.; formal analysis, X.Z.; investigation, X.H.; resources, X.H.; writing—original draft preparation, J.L.; writing—review and editing, J.L.; visualization, X.Z.; supervision, X.H.; project administration, X.H.; funding acquisition, X.H. and J.L. All authors have read and agreed to the published version of the manuscript.

Funding

This work was funded by the National Natural Science Foundation of China (Grant No. 72104202), the National Social Science Fund of China (Grant No. 24XGL003), and China Postdoctoral Science Foundation (Grant No. 2023M732769).

Data Availability Statement

Data are available via the China Meteorological Administration (http://data.cma.cn, 1 March 2024) and People’s Government Website of Pingli County (https://www.pingli.gov.cn/, 4 January 2024).

Conflicts of Interest

The authors declare no conflict of interest.

References

  1. Costanza, R.; d’Arge, R.; de Groot, R.; Farber, S.; Grasso, M.; Hannon, B.; Limburg, K.; Naeem, S.; O’Neill, R.V.; Paruelo, J.; et al. The value of the world’s ecosystem services and natural capital. Nature 1997, 387, 253–260. [Google Scholar] [CrossRef]
  2. Aide, T.M.; Grau, H.R. Ecology. Globalization, migration, and Latin American ecosystems. Science 2004, 305, 1915–1916. [Google Scholar] [CrossRef]
  3. Liu, W.; Li, J.; Xu, J. Impact of the ecological resettlement program in southern Shaanxi Province, China on households’ livelihood strategies. For. Policy Econ. 2020, 120, 102310. [Google Scholar] [CrossRef]
  4. Long, H.; Li, Y.; Liu, Y.; Woods, M.; Zou, J. Accelerated restructuring in rural China fueled by ‘increasing vs. decreasing balance’ land-use policy for dealing with hollowed villages. Land Use Policy 2012, 29, 11–22. [Google Scholar] [CrossRef]
  5. Dolton-Thornton, N. Rewilding and repeopling in Scotland: Large-scale land managers’ perspectives and practices. J. Rural. Stud. 2021, 86, 36–45. [Google Scholar] [CrossRef]
  6. Sluiter, R.; de Jong, S.M. Spatial patterns of Mediterranean land abandonment and related land cover transitions. Landsc. Ecol. 2007, 22, 559–576. [Google Scholar] [CrossRef]
  7. Lieskovský, J.; Bezák, P.; Špulerová, J.; Lieskovský, T.; Koleda, P.; Dobrovodská, M.; Bürgi, M.; Gimmi, U. The abandonment of traditional agricultural landscape in Slovakia—Analysis of extent and driving forces. J. Rural. Stud. 2015, 37, 75–84. [Google Scholar] [CrossRef]
  8. Han, Z.; Song, W. Abandoned cropland: Patterns and determinants within the Guangxi Karst Mountainous Area, China. Appl. Geogr. 2020, 122, 102245. [Google Scholar] [CrossRef]
  9. Li, S.; Li, X.; Sun, L.; Cao, G.; Fischer, G.; Tramberend, S. An estimation of the extent of cropland abandonment in mountainous regions of China. Land Degrad. Dev. 2018, 29, 1327–1342. [Google Scholar] [CrossRef]
  10. Milenov, P.; Vassilev, V.; Vassileva, A.; Radkov, R.; Samoungi, V.; Dimitrov, Z.; Vichev, N. Monitoring of the risk of farmland abandonment as an efficient tool to assess the environmental and socio-economic impact of the Common Agriculture Policy. Int. J. Appl. Earth Obs. Geoinf. 2014, 32, 218–227. [Google Scholar] [CrossRef]
  11. Yin, R.; Yin, G. China’s primary programs of terrestrial ecosystem restoration: Initiation, implementation, and challenges. Environ. Manag. 2010, 45, 429–441. [Google Scholar] [CrossRef]
  12. Shi, P.; Vanclay, F.; Yu, J. Post-Resettlement Support Policies, Psychological Factors, and Farmers’ Homestead Exit Intention and Behavior. Land 2022, 11, 237. [Google Scholar] [CrossRef]
  13. Zhang, W.; Zhou, L.; Zhang, Y.; Chen, Z.; Hu, F. Impacts of Ecological Migration on Land Use and Vegetation Restoration in Arid Zones. Land 2022, 11, 891. [Google Scholar] [CrossRef]
  14. Carter, M.R. Poverty traps and natural disasters in Ethiopia and Honduras. World Dev. 2007, 35, 835–856. [Google Scholar] [CrossRef]
  15. Barbier, E.B.; Hochard, J.P. Land degradation and poverty. Nat. Sustain. 2018, 1, 623–631. [Google Scholar] [CrossRef]
  16. Zhou, L.; Xiong, L.-Y. Natural topographic controls on the spatial distribution of poverty-stricken counties in China. Appl. Geogr. 2018, 90, 282–292. [Google Scholar] [CrossRef]
  17. Zhou, Y.; Li, Y.; Liu, Y. The nexus between regional eco-environmental degradation and rural impoverishment in China. Habitat Int. 2020, 96, 102086. [Google Scholar] [CrossRef]
  18. Taylor, J.E.; Lopez-Feldman, A. Does migration make rural households more productive? Evidence from Mexico. J. Dev. Stud. 2010, 46, 68–90. [Google Scholar] [CrossRef]
  19. Lo, K.; Xue, L.; Wang, M. Spatial restructuring through poverty alleviation resettlement in rural China. J. Rural. Stud. 2016, 47, 496–505. [Google Scholar] [CrossRef]
  20. Liu, Y.; Liu, J.; Zhou, Y. Spatio-temporal patterns of rural poverty in China and targeted poverty alleviation strategies. J. Rural. Stud. 2017, 52, 66–75. [Google Scholar] [CrossRef]
  21. Wang, W.; Ren, Q.; Yu, J. Impact of the ecological resettlement program on participating decision and poverty reduction in southern Shaanxi, China. For. Policy Econ. 2018, 95, 1–9. [Google Scholar] [CrossRef]
  22. Guo, X.; Kapucu, N. Examining the impacts of disaster resettlement from a livelihood perspective: A case study of Qinling Mountains, China. Disasters 2018, 42, 251–274. [Google Scholar] [CrossRef] [PubMed]
  23. Peng, W.; López-Carr, D.; Wu, C.; Wang, X.; Longcore, T. What factors influence the willingness of protected area communities to relocate? China’s ecological relocation policy for Dashanbao Protected Area. Sci. Total. Environ. 2020, 727, 138364. [Google Scholar] [CrossRef]
  24. Zhu, D.; Jia, Z.; Zhou, Z. Place attachment in the Ex-situ poverty alleviation relocation: Evidence from different poverty alleviation migrant communities in Guizhou Province, China. Sustain. Cities Soc. 2021, 75, 103355. [Google Scholar] [CrossRef]
  25. Liu, W.; Xu, J.; Li, J. The influence of poverty alleviation resettlement on rural household livelihood vulnerability in the western mountainous areas, China. Sustainability 2018, 10, 2793. [Google Scholar] [CrossRef]
  26. Gou, H.; Li, J. Impact of urban resettlement on the livelihood activities of rural resettled households in Southern Shaanxi Province with method of Coarsened Exact Matching (CEM). China Popul. Resour. Environ. 2019, 29, 149–156. (In Chinese) [Google Scholar]
  27. Tang, J.; Xu, Y.; Qiu, H. Integration of migrants in poverty alleviation resettlement to urban China. Cities 2022, 120, 103501. [Google Scholar] [CrossRef]
  28. Zhang, J.; Zhan, L.; Lu, C. The long-run effects of poverty alleviation resettlement on child development: Evidence from a quasi-experiment in China. Demogr. Res. 2020, 43, 245–284. [Google Scholar] [CrossRef]
  29. Fan, M.; Li, Y.; Li, W. Solving one problem by creating a bigger one: The consequences of ecological resettlement for grassland restoration and poverty alleviation in Northwestern China. Land Use Policy 2015, 42, 124–130. [Google Scholar] [CrossRef]
  30. Lemenih, M.; Kassa, H.; Kassie, G.T.; Abebaw, D.; Teka, W. Resettlement and woodland management problems and options: A case study from north-western Ethiopia. Land Degrad. Dev. 2014, 25, 305–318. [Google Scholar] [CrossRef]
  31. Wang, Q.; Qiu, J.J.; Yu, J. Does rural resettlement accelerate farmland abandonment in mountainous areas: A case study of 1578 households in Southern Shaanxi. J. Nat. Resour. 2019, 34, 1376–1390. (In Chinese) [Google Scholar]
  32. Artur, L.; Hilhorst, D. Floods, resettlement and land access and use in the lower Zambezi, Mozambique. Land Use Policy 2014, 36, 361–368. [Google Scholar] [CrossRef]
  33. Rye, J.F. Labour migrants and rural change: The “mobility transformation” of Hitra/Frøya, Norway, 2005–2015. J. Rural. Stud. 2018, 64, 189–199. [Google Scholar] [CrossRef]
  34. Gao, J.; Song, G.; Sun, X. Does labor migration affect rural land transfer? Evidence from China. Land Use Policy 2020, 99, 105096. [Google Scholar] [CrossRef]
  35. Wang, Y.; Li, X.; Xin, L.; Tan, M. Farmland marginalization and its drivers in mountainous areas of China. Sci. Total. Environ. 2020, 719, 135132. [Google Scholar] [CrossRef] [PubMed]
  36. Wang, J.; Cao, Y.; Fang, X.; Li, G. Does land tenure fragmentation aggravate farmland abandonment? Evidence from big survey data in rural China. J. Rural. Stud. 2022, 91, 126–135. [Google Scholar] [CrossRef]
  37. Guo, B.; Fang, Y.; Zhou, Y. Influencing factors and spatial differentiation of cultivated land abandonment at the household scale. Resour. Sci. 2020, 42, 696–709. (In Chinese) [Google Scholar] [CrossRef]
  38. Zhang, D.; Jia, Q.; Xu, X.; Yao, S.; Chen, H.; Hou, X. Contribution of ecological policies to vegetation restoration: A case study from Wuqi County in Shaanxi Province, China. Land Use Policy 2018, 73, 400–411. [Google Scholar] [CrossRef]
  39. Shaanxi Provincial People’s Government. Master Plan for Migrant Relocation and Resettlement in Southern Shaanxi (2011–2020); Internal Information; Shaanxi Provincial People’s Government: Xi’an, China, 2011. [Google Scholar]
  40. Yang, J.; Huang, X. The 30 m annual land cover dataset and its dynamics in China from 1990 to 2019. Earth Syst. Sci. Data 2021, 13, 3907–3925. [Google Scholar] [CrossRef]
  41. People’s Government of Pingli County. National Land Survey Report of Pingli County (2010-2020); Internal Information; People’s Government of Pingli County: Pingli, China, 2011.
  42. Levers, C.; Schneider, M.; Prishchepov, A.V.; Estel, S.; Kuemmerle, T. Spatial variation in determinants of agricultural land abandonment in Europe. Sci. Total. Environ. 2018, 644, 95–111. [Google Scholar] [CrossRef]
  43. Kuemmerle, T.; Hostert, P.; Radeloff, V.C.; van der Linden, S.; Perzanowski, K.; Kruhlov, I. Cross-border comparison of post-socialist farmland abandonment in the Carpathians. Ecosystems 2008, 11, 614–628. [Google Scholar] [CrossRef]
  44. Gellrich, M.; Zimmermann, N.E. Investigating the regional-scale pattern of agricultural land abandonment in the Swiss mountains: A spatial statistical modelling approach. Landsc. Urban Plan. 2007, 79, 65–76. [Google Scholar] [CrossRef]
  45. Xu, D.; Deng, X.; Guo, S.; Liu, S. Labor migration and farmland abandonment in rural China: Empirical results and policy implications. J. Environ. Manag. 2019, 232, 738–750. [Google Scholar] [CrossRef] [PubMed]
  46. Zhang, D.; Jia, Q.; Xu, X.; Yao, S.; Chen, H.; Hou, X.; Zhang, J.; Jin, G. Assessing the coordination of ecological and agricultural goals during ecological restoration efforts: A case study of Wuqi County, Northwest China. Land Use Policy 2019, 82, 550–562. [Google Scholar] [CrossRef]
  47. Shi, T.; Li, X.; Xin, L.; Xu, X. The spatial distribution of farmland abandonment and its influential factors at the township level: A case study in the mountainous area of China. Land Use Policy 2018, 70, 510–520. [Google Scholar] [CrossRef]
  48. Gellrich, M.; Baur, P.; Koch, B.; Zimmermann, N.E. Agricultural land abandonment and natural forest re-growth in the Swiss mountains: A spatially explicit economic analysis. Agric. Ecosyst. Environ. 2007, 118, 93–108. [Google Scholar] [CrossRef]
  49. Kolecka, N.; Kozak, J.; Kaim, D.; Dobosz, M.; Ostafin, K.; Ostapowicz, K.; Wężyk, P.; Price, B. Understanding farmland abandonment in the Polish Carpathians. Appl. Geogr. 2017, 88, 62–72. [Google Scholar] [CrossRef]
  50. Liu, H.; Cui, W.; Zhang, M. Exploring the causal relationship between urbanization and air pollution: Evidence from China. Sustain. Cities Soc. 2022, 80, 103783. [Google Scholar] [CrossRef]
  51. Tong, H.; Lim, K.S. Threshold autoregression, limit cycles and cyclical data. J. R. Stat. Soc. Ser. B (Stat. Methodol.) 1980, 42, 245–268. [Google Scholar] [CrossRef]
  52. Hou, X.; Liu, J.; Zhang, D.; Zhao, M.; Xia, C. Impact of urbanization on the eco-efficiency of cultivated land utilization: A case study on the Yangtze River Economic Belt, China. J. Clean. Prod. 2019, 238, 117916. [Google Scholar] [CrossRef]
  53. Xu, F.; Wang, Z.; Chi, G.; Zhang, Z. The impacts of population and agglomeration development on land use intensity: New evidence behind urbanization in China. Land Use Policy 2020, 95, 104639. [Google Scholar] [CrossRef]
  54. Hansen, B.E. Sample Splitting and Threshold Estimation. Econometrica 2000, 68, 575–603. [Google Scholar] [CrossRef]
  55. Caner, M.; Hansen, B.E. Threshold autoregression with a unit root. Econometrica 2001, 69, 1555–1596. [Google Scholar] [CrossRef]
  56. Franco, W.; Barbera, F.; Bartolucci, L.; Felizia, T.; Focanti, F. Developing intermediate machines for high-land agriculture. Dev. Eng. 2020, 5, 100050. [Google Scholar] [CrossRef]
  57. Rigg, J. Land, farming, livelihoods, and poverty: Rethinking the links in the Rural South. World Dev. 2006, 34, 180–202. [Google Scholar] [CrossRef]
  58. Zhang, Y.; Li, X.; Song, W.; Zhai, L. Land abandonment under rural restructuring in China explained from a cost-benefit perspective. J. Rural. Stud. 2016, 47, 524–532. [Google Scholar] [CrossRef]
  59. Zhao, X.; Xiao, J.Q.; Duan, Y.F. Relocation, farmland transfer and livelihood transformation of reservoir resettlement. Resour. Sci. 2018, 40, 1954–1965. (In Chinese) [Google Scholar]
  60. Yang, C.; Qian, Z. ‘Resettlement with Chinese characteristics’: The distinctive political-economic context, (in) voluntary urbanites, and three types of mismatch. Int. J. Urban Sustain. Dev. 2021, 13, 496–515. [Google Scholar] [CrossRef]
Figure 1. Study area. (a) Elevation of Pingli County. (b) Location of Pingli County.
Land 14 00518 g001
Figure 2. Distribution of migrant relocation (MR) in Pingli County. (a) Type of MR programs in Pingli County. (b) MR value in administrative village of Pingli County.
Land 14 00518 g002
Figure 3. Cropland abandonment (CA) in Pingli County. (a) Distribution of CA in Pingli County. (b) CA value in administrative village of Pingli County.
Land 14 00518 g003
Figure 4. Schematic diagram of the relationship between MR and CA (a) multiple regression model; (b) threshold regression model.
Land 14 00518 g004
Table 1. Pattern and scale of relocation and resettlement of migrants in Southern Shaanxi.
Relocation (RL)PopulationResettlement (RS)Population
Poverty alleviation RL1,166,071New village RS1,543,794
Geological disaster avoidance RL491,594County town or township RS440,989
Flood disaster avoidance RL320,185Small village merging into large village RS257,009
Ecological RL468,838Self-determined RS206,516
Engineering RL1620
Note: data source is from “Master Plan for Migrant Relocation in Southern Shaanxi (2011–2020)” [39].
Table 2. Statistical description of the variables.
ClassificationCriterion LayerVariablesMinMaxMeanStd.
Dependent Variable CA (%)0.52453.63912.7160.086
Independent VariablesCore VariableMR (%)−17.9391.097−0.1940.017
Topographic factorsSlope (degree)6.57330.12318.3924.330
Elevation (m)324.3542337.738751.160315.674
Climatic factorsPrecipitation (mm)870.6671059.599962.65842.338
Temperature (℃)4.45714.62411.8052.258
Socioeconomic factorsPCR (-)2.59967.59511.0427.803
RD (km−1)0.1404.2771.1430.679
Engineering measuresEM (%)0.00087.56518.2520.119
Note: data from statistical results in Section 2.
Table 3. Results of the multiple regression model and the threshold regression model.
VariablesMultiple Regression ModelThreshold Regression Model
MR ≤ 0.258%MR > 0.258%
CoefficientR.S.E.VIFCoefficientR.S.E.CoefficientR.S.E.
MR1.144 ***0.3311.411.293 ***0.304−6.190 *3.343
Slope−0.004 **0.0021.44−0.004 **0.002−0.0020.003
Elevation0.001 ***0.0003.200.001 ***0.0000.001 **0.000
Precipitation−0.002 ***0.0003.04−0.002 ***0.000−0.002 ***0.000
PCR0.002 *0.0011.290.0010.0010.0020.002
RD0.018 **0.0091.580.047 ***0.009−0.0190.014
EM0.0300.0481.200.0740.064−0.0590.062
(Constant)1.519 ***0.224-1.290 ***0.2481.865 ***0.332
Observations17610670
F-Value15.53012.27010.140
R20.4530.5610.513
Note: ***, **, and * denote statistical significance at the 1%, 5%, and 10% levels, respectively.
Table 4. Threshold test results.
H0Threshold VariableLM-Valuep-ValueThreshold-Value
No thresholdMR21.4520.0280.258%
Note: number of bootstrap replications is 500, trimming percentage is 15%.
Disclaimer/Publisher’s Note: The statements, opinions and data contained in all publications are solely those of the individual author(s) and contributor(s) and not of MDPI and/or the editor(s). MDPI and/or the editor(s) disclaim responsibility for any injury to people or property resulting from any ideas, methods, instructions or products referred to in the content.

