Abstract
Given the increasing scarcity of natural resources and the global imperative for sustainable development, the relationship between land resource allocation and green economic efficiency remains crucial but underexplored. This study, utilizing land transfer data from China Land Market Network, examines 285 cities at or above the prefectural level in China from 2007 to 2019. By applying a modified Slake-Based Measure (SBM) directional distance function model (MSBM), the study quantifies green economic efficiency and develops various panel models to investigate the impact of land resource misallocation on urban green economic efficiency. The findings indicate that land resource misallocation significantly impedes the enhancement of urban green economic efficiency. This is primarily achieved through the reduction in human capital investment and the weakening of technological conversion capabilities, both of which adversely affect the development of green economies in cities. Furthermore, government performance levels are shown to play a pivotal role in moderating the relationship between land resource misallocation and green economic efficiency, with regional heterogeneity evident between cities in old industrial bases and those in non-old industrial bases. These results underscore the critical importance of rational land resource allocation in improving green economic efficiency and facilitating the achievement of high-quality urban development.
1. Introduction
The development of a green economy is a central focus in global sustainable development efforts and a key priority in China’s pursuit of high-quality development. The unique land system in China positions the government as both the supplier and monopolist on the primary land market. Moreover, the conversion of land use is exclusively within the government’s purview. For instance, the transformation of agricultural land to non-agricultural use requires government approval and is subject to annual quotas. Any entity or individual seeking non-agricultural land for construction purposes must apply to the government for the use of state-owned land, thereby reinforcing the government’s control over land resources. As a result, land resources serve as a pivotal instrument for urban economic growth, with their allocation playing a critical role in fostering sustainable urban development. Chinese cities face the dual challenges of advancing land market reforms and achieving green economic development. Addressing these challenges hinges on the effective performance of local government functions, particularly in managing the economic environment, social governance, and administrative intervention [1,2]. These dimensions are increasingly recognized as benchmarks for evaluating the sustainability, equity, and effectiveness of government-led economic initiatives [3,4]. Land marketization has been widely acknowledged as an effective mechanism for addressing land resource misallocation (LRM) [5,6]. However, due to the distinctive characteristics of land in China, the rational allocation of land resources remains tightly linked to the objectives, governance frameworks, and social responsibilities of governmental entities [7]. The performance of these entities, particularly in economic, social, and administrative (ESA) functions, directly influences land resource allocation and its alignment with green economic development goals. Consequently, the role of government performance in optimizing land resource allocation and driving green economic progress has garnered increasing scholarly attention, reflecting a shift toward land marketization as a key policy focus.
Local governments in China are uniquely positioned to address LRM and promote green economic innovation through improved functional performance. Scholars, depending on their research perspectives, have different interpretations of land resource misallocation. From the perspective of land supply allocation, it is defined as the distribution of construction land quotas between different cities [8] or as the allocation of land quotas between agricultural and construction land within a city [9]. From the perspective of land structural allocation, it is primarily defined as the distribution of land resources among different types of construction land, such as residential, commercial, and industrial land [10]. Integrating these definitions, this study defines land resource misallocation as the imbalance in the distribution of land between different uses, resulting from local government use of their control and monopoly over the primary land market, which leads to large-scale sales of industrial land and the under-supply of commercial and service land. This approach is widely applied in studies examining internal structural land resource misallocation at the urban level. From a broader perspective, LRM can be defined as the mismatch between land and its intended use in countries that implement land public ownership, such as Vietnam, Cuba, North Korea, Laos, and others. In these countries, land is owned by the state and managed and distributed by the government. Under this institutional framework, land resource misallocation arises due to improper government intervention or policy failures, leading to inefficiencies in the allocation of land to its optimal uses. Additionally, the academic community has directly explored, from various angles, the impact of LRM on urban green economic efficiency (GEE). [11,12]. From an economic perspective, LRM disrupts the optimal allocation of resources across industries, resulting in inefficiencies that hinder green economic development [13,14]. Furthermore, LRM exacerbates rent-seeking behavior and discourages investment in long-term, high-cost initiatives, such as talent acquisition and research and development (R&D) [15,16,17]. These inefficiencies constrain technological advancement, impeding efforts to enhance GEE. While rational land resource allocation fosters the agglomeration of similar enterprises and supports technological spillovers [18], LRM often sustains low-end enterprises, thereby, obstructing urban green economic progress. Local governments, through stable governance, policy support, and technological initiatives, play a crucial role in mitigating these effects. By fostering a conducive environment for innovation, governments enable enterprises to align their production processes and outputs with green economic development goals, thereby alleviating the adverse impact of LRM on GEE.
The existing literature underscores the importance of government functions in shaping the interplay between land resource allocation and green economic outcomes. Specifically, the ESA dimensions of economic environment, social governance, and administrative intervention are integral to achieving both market-driven growth and environmentally sustainable urban development [1,19]. However, current research predominantly focuses on the linear relationships between LRM and GEE, often overlooking the potential nonlinear mechanisms and the moderating role of government performance.
This study aims to address these research gaps by leveraging micro-level transaction data from China’s land market, covering 285 cities at or above the prefectural level from 2007 to 2019. The primary objectives are to evaluate the impact of LRM on urban GEE, investigate the internal transmission mechanisms involved, and determine how different levels of government performance influence this relationship.
This research makes several important contributions to the literature. First, it provides a nuanced understanding of how LRM impedes green economic development by identifying reduced human capital investment and weakened technological conversion capacity as dual mechanisms that hinder GEE. These findings extend existing studies by revealing the broader implications of resource misallocation on sustainable economic growth. Second, the study innovatively highlights government performance as a critical threshold factor in moderating the impact of LRM on GEE. This perspective emphasizes the synergistic effects of land market reforms and government function transformation, offering new theoretical insights and practical guidance for policymakers. By proposing targeted strategies for land resource allocation and green economic development, the study establishes a robust foundation for advancing high-quality development in China and beyond.
The rest of this paper is structured as follows. A theoretical framework is outlined in Section 2 and research hypotheses are proposed based on that. Section 3 presents empirical methodology and data. Section 4 and Section 5 present empirical results and discussion, respectively. Concluding remarks follow in Section 5.
2. Theoretical Analysis and Research Hypotheses
2.1. The Impact of LRM on GEE
The rapid advancement of transportation infrastructure and information technology has accelerated resource flows across regions, significantly enhancing land resource allocation and fostering urban innovation [20,21,22]. However, LRM has been identified as a critical impediment to green economic development, operating through multiple mechanisms [23,24].
China’s unique land system, characterized by local governments’ monopolistic control over land markets, enables subjective decision-making, including large-scale industrial land allocations for economic and technological development zones and new cities [19]. This system often incentivizes rent-seeking behaviors, particularly among inefficient, high-pollution, low-end enterprises, which exploit low-cost industrial land to sustain their operations. This phenomenon leads to “many zones, few constructions, and unbuilt zones”, resulting in inefficiencies that hinder urban GEE.
Moreover, land resources, being a scarce natural asset, are often allocated for industrial purposes at the expense of commercial, residential, and other uses. This misallocation disrupts the balance of urban land use and undermines urban production efficiency. As land, labor, and capital are complementary production factors, inefficient land allocation exacerbates the underutilization of other production inputs, further constraining resource efficiency [25].
This paper contends that LRM not only fosters corruption among local officials but also perpetuates resource misallocation, posing significant obstacles to urban green economic development. Accordingly, the following hypothesis is proposed:
H1.
Land resource misallocation hinders urban green economic efficiency.
2.2. Hypotheses of Mediating Effects
Technological innovation is a pivotal mechanism through which LRM impacts GEE. Innovation optimizes the input-output ratio of production factors, enhances their marginal productivity, and improves environmental quality [26,27,28]. This process facilitates the transition from extensive to intensive economic growth, breaking resource constraints and boosting urban GEE. However, LRM undermines this potential by limiting human capital investment and weakening technological transformation capacity.
First, the “land-based development” paradigm enables local governments to manipulate land use decisions, creating fertile ground for rent-seeking and corruption. High levels of government intervention in factor markets incentivize low-end enterprises to secure low-cost industrial land through rent-seeking, reducing their production costs but also diminishing incentives to invest in high-end talent and R&D activities [15]. This lack of investment in human capital and innovation stifles technological advancement, further impeding urban GEE [17].
Second, large-scale industrial land allocations often crowd out residential and commercial land, inflating housing prices and raising the local cost of living. This dynamic leads to human capital outflows and shifts production resources from the real economy to the real estate sector, further undermining technological innovation in manufacturing [29]. Additionally, local officials, driven by career advancement incentives, prioritize infrastructure projects with immediate economic returns over high-risk, long-term innovation investments, further constraining urban green economic development [16].
Based on this reasoning, the following hypothesis is proposed:
H2.
LRM hinders urban GEE by reducing human capital investment and weakening technological transformation capacity.
2.3. Hypotheses of Threshold Effects
The interplay between government function performance and market mechanisms is a central theme in resource allocation and sustainable development research. Efficient utilization of state-owned resources requires not only market-driven mechanisms but also government intervention to address market failures, ensure social equity, and promote green economic development [30,31]. The relationship between land resource allocation, government function performance, and urban GEE can be analyzed through three dimensions: economic environment, social governance, and administrative intervention (ESA).
First, the Williams hypothesis suggests an inverted U-shaped relationship between spatial agglomeration and economic development. In the early stages of economic growth, spatial agglomeration fosters economic expansion but lacks sufficient technological support. As economic development matures, the diminishing returns of agglomeration and congestion effects take precedence. However, during this phase, a strong economic environment can bolster urban technological innovation and support GEE [32].
Second, effective social governance enables the clustering of industrial enterprises, yielding economies of scale and reducing energy consumption and pollution [33,34]. Conversely, weak governance or excessive urban expansion exacerbates environmental degradation [35,36,37], traffic congestion [38,39,40], and inefficiencies [41], hindering urban GEE. A robust governance framework can attract high-end talent and facilitate resource optimization, enhancing technological innovation and GEE.
Finally, moderate government intervention in the land market promotes rational resource allocation, guiding production factors into efficient combinations and enhancing resource utilization efficiency [42]. However, excessive intervention, driven by local officials’ performance metrics, often skews land allocations toward industrial uses, leading to resource misallocation and environmental degradation, thereby obstructing urban green economic progress.
Based on these arguments, the following hypothesis is proposed:
H3.
The impact of LRM on urban GEE exhibits a threshold effect, contingent on government function performance.
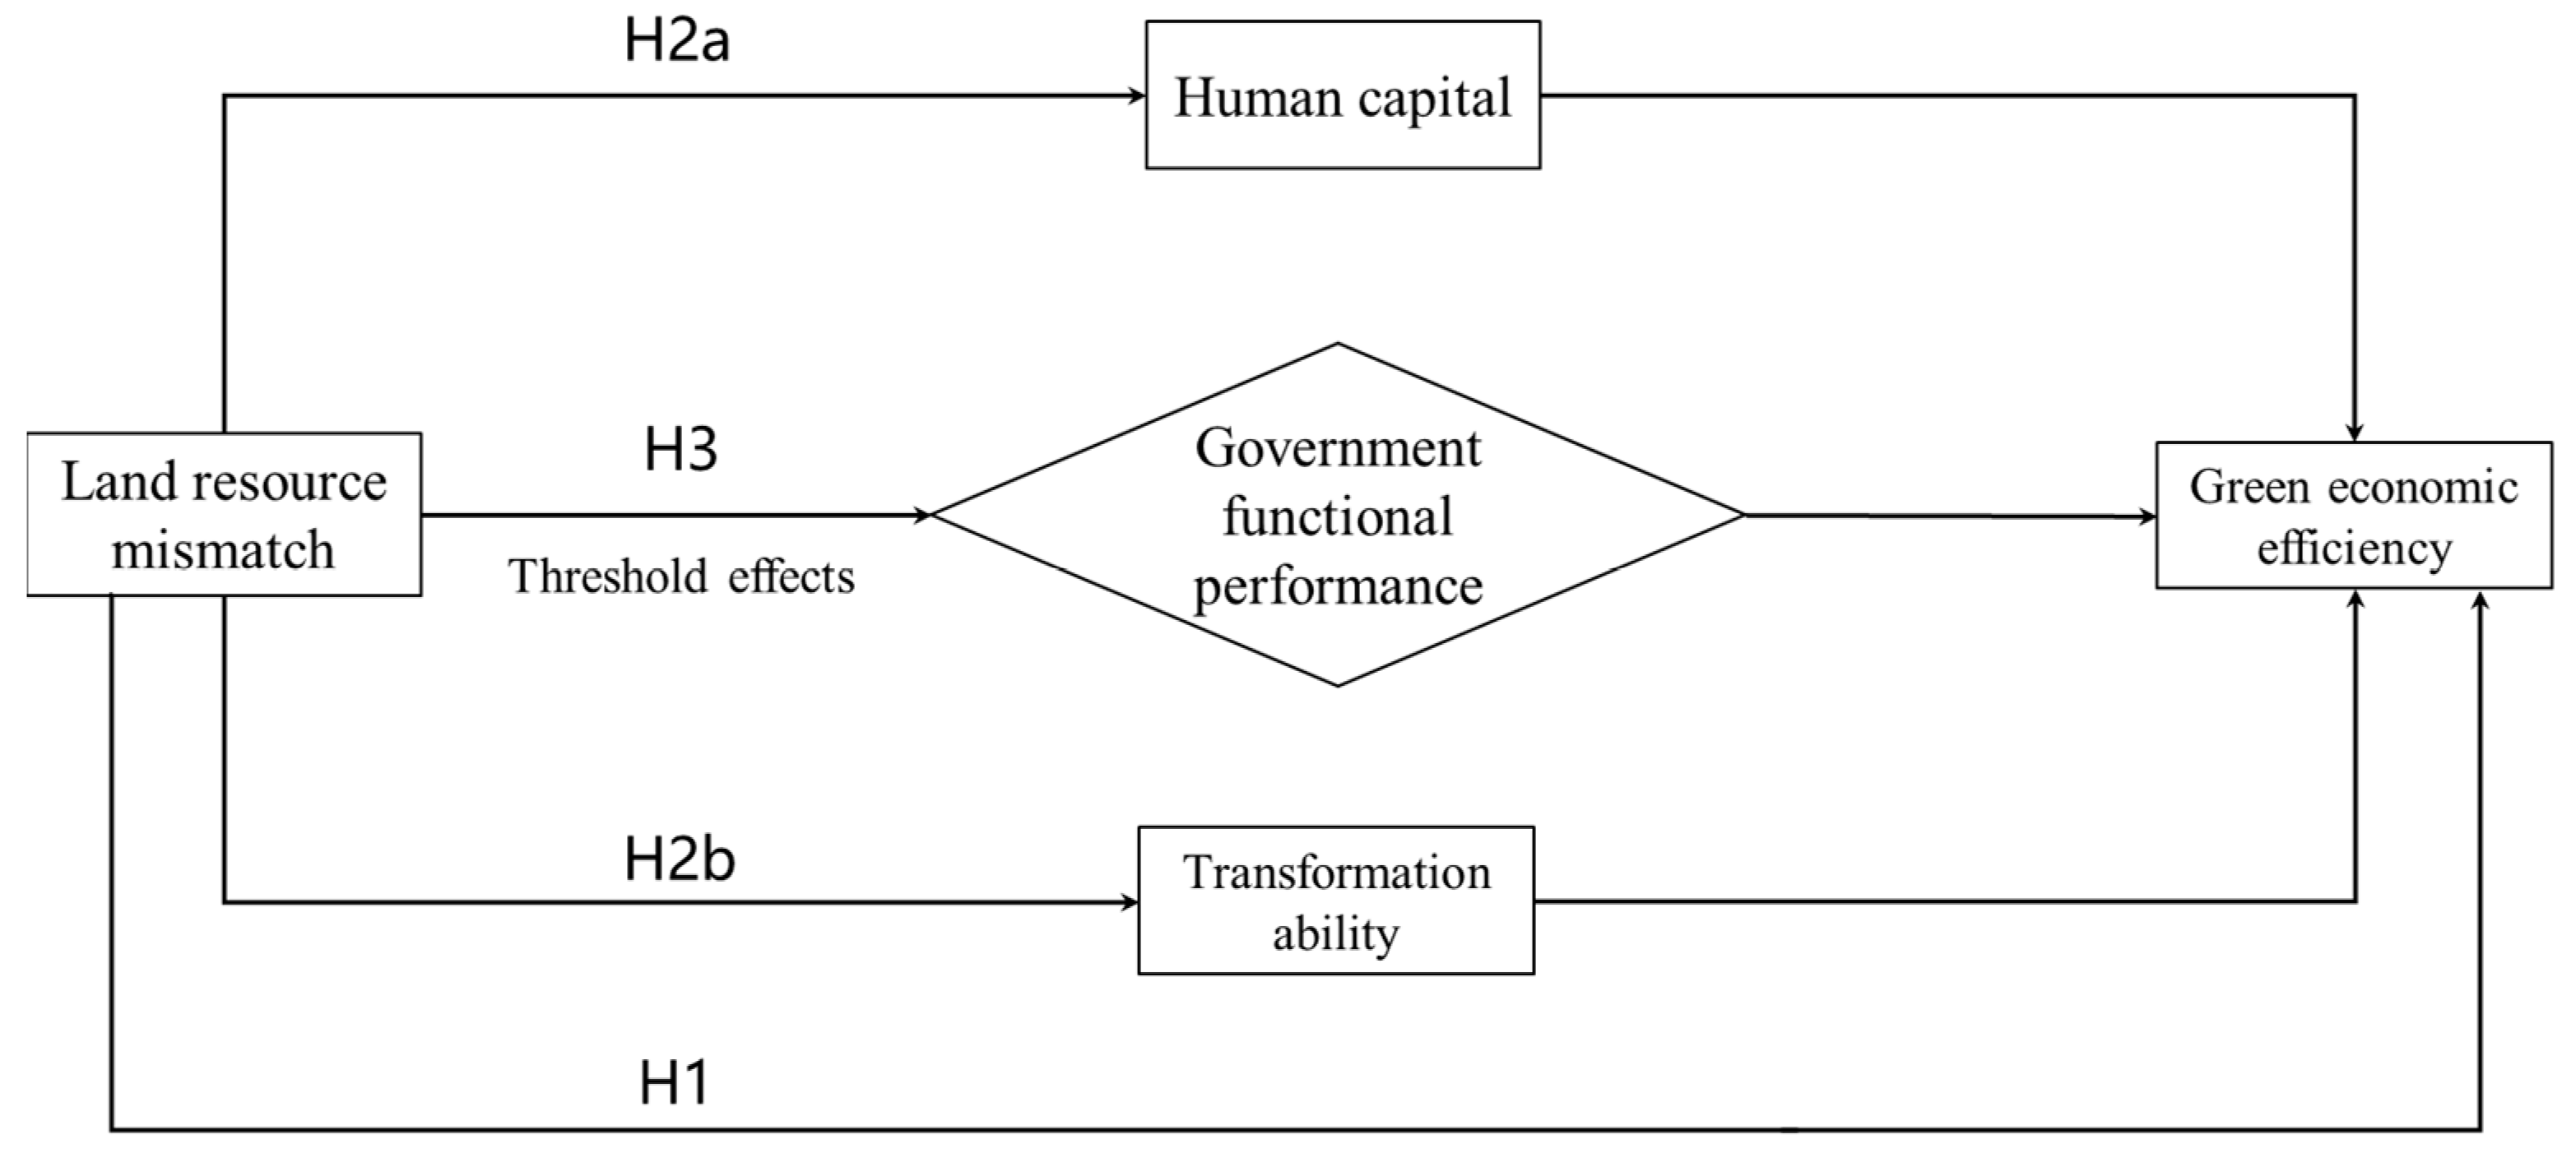
Based on these hypotheses, the study constructs the following research framework, as illustrated in Figure 1.
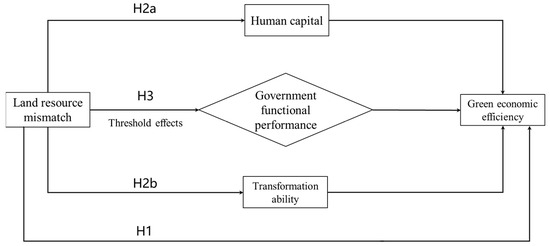
Figure 1.
Theoretical framework model.
3. Research Design
3.1. Variable Selection
3.1.1. Dependent Variable
In light of the lack of a universally recognized standard for assessing GEE within the academic community, this study introduces an innovative approach by utilizing the Modified Slacks-Based Measure (MSBM) model. This enhanced directional distance function model, derived from the Slacks-Based Measure (SBM), is implemented through the Max DEA Pro software platform version 12.2. Building on prior research [43], the MSBM model is employed to compute the Malmquist–Luenberger (ML) index and its decomposition components, providing a comprehensive reflection of urban GEE. Unlike the traditional SBM model, the MSBM model features a notable advantage: it accommodates negative values in both input and output indicators, thereby improving its applicability and robustness. [44] The specific formulation of the model is expressed as follows:
In this context, represents the number of decision-making units (DMUs), each of which has m types of inputs, types of expected outputs, and types of undesired outputs. , , and refer to the elements in the respective input, expected output, and undesired output matrices. represents the prefecture-level city where the calculated GEE is located; ρ denotes the efficiency value of the evaluation unit, which corresponds to the city’s GEE, with a value range of [0, 1]. A unit is considered technically efficient if and only if there is no input redundancy and the expected output is zero. When ρ < 1, improvements can be made by adjusting the allocation of input and output resources.
This study employs three key input indicators to evaluate green economic efficiency. Labor input is measured by the number of employed persons in each city at the end of the year. Capital stock input is estimated using the perpetual inventory method, a widely recognized approach for calculating capital stock data for Chinese cities, following existing research [45]. Energy input is represented by the total electricity consumption within each city.
For the output indicators, the expected output is captured by real GDP at constant 2006 prices. From the perspective of energy conservation and emissions reduction, undesired outputs include three primary pollutants: industrial wastewater, measured by a city’s industrial wastewater discharge data; industrial air pollutants, represented by industrial sulfur dioxide emissions; and industrial particulate matter, quantified using emissions data for smoke and dust. Notably, before 2011, the statistical criterion for this variable was industrial smoke emissions, while post-2011, it referred to industrial particulate matter emissions. To ensure comparability across time, this study adopts the methodological adjustments proposed by related scholars [46] to derive consistent particulate matter emission data.
Furthermore, to account for environmental pollution comprehensively, the three undesired output indicators are standardized and combined into a unified pollution index using the entropy-based method. This approach enhances the accuracy and efficiency of measurement while aligning with established practices in the field.
3.1.2. Independent Variable
The measurement of LRM typically focuses on two dimensions: the allocation scale among industrial, commercial, and other land uses within prefecture-level cities, and the transfer process of industrial land, particularly when land is allocated via negotiated sales at prices below competitive market levels. Due to the significant scarcity of comprehensive land transfer price data across China’s prefecture-level cities, relying on such prices as a measure of LRM could introduce substantial bias.
To address this issue, this study builds on existing research and adopts a widely accepted approach of using land transfer area data as the primary measure of LRM. Specifically, the allocation of industrial land resources in cities is quantified by calculating the ratio of industrial and mining warehouse land transferred to the total land area transferred within the city. The land data are sourced from the official website of China’s land market and processed to fit the research context. To ensure robustness, this study also examines the ratio of industrial land transferred through negotiated sales to the total land area transferred as an alternative measure, focusing on land transfer methods.
3.1.3. Mediation Variables
The mediating variable in this study is the local scientific and technological level, evaluated from two key dimensions: human capital input and scientific and technological output. Human capital input is proxied by local government expenditure on education, reflecting investment in the region’s scientific and technological development. Scientific and technological output is represented by the number of invention patents granted annually within the prefecture-level city, a widely recognized indicator of innovation capacity in empirical research.
3.1.4. Threshold Variables
Government functional performance serves as the threshold variable in this study, assessed across three dimensions: economic environment, social governance, and administrative intervention.
The economic environment is measured by the Gross Domestic Product (GDP) of each prefecture-level city.
Social governance is represented by the total population of each city at the end of the year.
Administrative intervention is captured by the number of foreign-invested projects utilizing contractual foreign direct investment in each city.
This multi-dimensional approach provides a comprehensive framework for analyzing the interaction between government performance and LRM.
3.1.5. Control Variables
To mitigate potential omitted variable bias, this study incorporates a set of control variables informed by prior research [12,47], encompassing urban infrastructure, agglomeration, and fiscal and financial factors:
- Transportation convenience, measured by per capita road area.
- Population agglomeration, reflected by population density.
- Degree of openness, quantified by the value of foreign direct investment (converted into RMB).
- Government fiscal level, measured by the difference between fiscal expenditure and revenue.
- Local financial development, represented by the ratio of the sum of deposit and loan balances in urban districts to the GDP of these districts.
These control variables ensure the robustness of the model and account for key factors influencing urban green economic efficiency.
Based on the above analysis, the specific variable names and definitions are shown in Table 1.

Table 1.
Variable definition table.
3.2. Model Setting
In this section, the research methodology is primarily outlined, with the benchmark regression model presented as follows:
In Model (1), represents the GEE of city in year ; represents LRM of city in year ; represents a set of control variables that affect GEE; and are city-specific and time-specific fixed effects, respectively; is the random error term; is the constant term, and and are the estimated coefficients for the core explanatory variables and control variables. The key coefficient of interest in this model is , which reflects the impact of LRM on GEE.
To explore the transmission mechanism of LRM’s effect on GEE, the study follows the research approach outlined in the classic literature [48] and employs a two-step mediation effect model. A regression model that includes the mediator variable is constructed, with the model set up as follows:
In Model (2), represents the level of human capital investment and technological innovation output of city in year . reflects the impact of md on GEE.
To further investigate whether the hindering effect of LRM on GEE is influenced by government function performance, this study constructs a nonlinear threshold model (with one and two thresholds) with government performance in the economic environment, social governance, and administrative intervention as threshold variables. The model specifications are as follows:
where is the threshold indicator function, and represents government performance in city in year .
3.3. Sample and Data
This study encompasses all administrative provincial units of China, excluding Taiwan, Hong Kong, and Macau, with a focus on 285 prefecture-level cities as the primary research subjects. Given the availability of data, the impact of the COVID-19 pandemic, and China’s achievement in poverty alleviation, the study spans the period from 2007 to 2019. Government performance is assessed across three dimensions: economic environment, social governance, and administrative intervention. Data for these threshold variables and control variables are sourced from the statistical yearbooks and official statistical bulletins of various prefecture-level cities. Land resource misallocation (LRM) data are obtained from the land transaction records available on the official China Land Market website. A rigorous data cleaning and processing methodology is employed to refine the initial sample, resulting in a robust dataset comprising 3705 annual observations from prefecture-level cities.
4. Results
4.1. Descriptive Statistical Analysis
According to the descriptive statistics presented in Table 2, the mean value of GEE is 0.602, with a standard deviation of 0.128, indicating that the overall green economic performance of prefecture-level cities in China is at a relatively advanced stage of high-quality development. In contrast, the LRM variable has a mean of 0.291 and a standard deviation of 0.168. Notably, the standard deviation of LRM is substantially higher than that of GEE, suggesting significant variability in land resource allocation across prefecture-level cities in China. This disparity highlights the unequal distribution and utilization of land resources, which may have important implications for the efficiency of urban green economic development.
Table 2.
Descriptive statistical analysis of variables.
4.2. Baseline Regression Results
After testing the Hausman model, it was determined to choose fixed effects, we proceeded with regression analysis using Model (1), and the results are presented in Table 3. The dependent variables in Columns (1), (2), and (3) include the Malmquist–Luenberger (ML) index and its decomposed components: pure technical efficiency and scale efficiency. The regression results, based on the fixed-effects model, are shown for all specifications. Across all models, a statistically significant negative relationship is observed between GEE and LRM. Specifically, when GEE is measured by pure technical efficiency and scale efficiency, the regression coefficients for LRM are 0.053 and 0.057, respectively, both of which are significantly negative at the 1% level. These findings indicate that LRM has a substantial detrimental impact on the green economic efficiency of prefecture-level cities. Consequently, hypothesis H1 is preliminarily confirmed.
Table 3.
Baseline regression results.
4.3. Endogeneity Test
The potential for reverse causality and endogeneity arises in the relationship between LRM and urban GEE, as it is possible that GEE may also influence LRM. To address these concerns, this study employs two methods to test for endogeneity: the System Generalized Method of Moments (SYS-GMM) and the instrumental variables approach, with results presented in Table 4.
Table 4.
Endogeneity test.
The SYS-GMM approach introduces lagged GEE as an explanatory variable, treating the core explanatory variables and control variables as endogenous, and using their lagged values as instruments. Column (1) of Table 4 shows that the regression coefficient for lagged GEE is significantly positive, confirming that current GEE is influenced by its prior levels. The coefficient for LRM remains significantly negative, consistent with the baseline regression results, thus confirming that LRM continues to exert a significant negative effect on GEE. Additionally, the SYS-GMM estimation results pass the endogeneity test, as the AR (2) and Sargan tests do not reject the null hypothesis, indicating that there is no second-order autocorrelation in the residuals and validating the instrumental variables used in the model.
In addition to the SYS-GMM, this study employs the two-stage least squares (2SLS) regression method to further address endogeneity. Following China’s land slope classification standards and drawing from existing research [49], an instrumental variable for LRM is selected: the interaction term between the proportion of urban area with a slope less than 15 degrees and the difference between the provincial and national economic growth targets. The results of the first-stage regression, presented in Column (2) of Table 4, confirm that the instrumental variable is correlated with land resources as expected. The “instrumental variable under-identification” test shows an LM statistic of 24.557, leading to the rejection of the null hypothesis at the 1% significance level, thus meeting the correlation requirement for the instrumental variables. The “weak identification” test also supports the choice of instruments, as the Wald statistic of 24.595 exceeds the 10% critical value of 16.380, indicating no weak instrument issues.
Finally, the second-stage estimation results, presented in Column (3) of Table 4, reveal that the coefficient for LRM remains significantly negative at the 10% level, further confirming that after addressing endogeneity concerns, LRM continues to have a detrimental impact on GEE. These findings are consistent with the baseline regression results, reinforcing the robustness and validity of the core conclusions of this study.
4.4. Robustness Tests
To further assess the reliability of the baseline regression results, we conducted a series of robustness checks employing four distinct approaches: (1) replacing the dependent variable, (2) utilizing alternative measurement methods for the core explanatory variables, (3) altering the sample space, and (4) excluding the first and last years of the study period. The results of these robustness tests are presented in Table 5.
Table 5.
Robustness test.
First, as part of the robustness checks, the dependent variable is replaced with a recalculated measure of GEE using the stochastic frontier analysis (SFA) method, followed by a re-estimation of the model. The SFA method offers the distinct advantage of accounting for the influence of stochastic errors on the efficiency term, thereby preventing the misattribution of random error components to inefficiency. Furthermore, it facilitates the quantification of the specific effects of various factors on efficiency differences among decision-making units [50]. The estimation results derived from this approach are presented in Column 1 of Table 5.
Second, we re-evaluated LRM using an alternative perspective on land transaction methods. Specifically, the proportion of industrial land transaction area conducted through negotiated sales, relative to the total industrial land transactions, was used as a new measure of LRM. This revision provided another robustness check, and the results are presented in Column (2).
Third, we conducted a robustness test by excluding the four municipalities directly under the central government—Beijing, Tianjin, Shanghai, and Chongqing—from the sample. This adjustment narrowed the focus to the remaining 281 prefecture-level cities. The results of this estimation are shown in Column (3).
Finally, following established research practices, we excluded data for the first and last years of the study period. This modification was intended to minimize potential biases associated with the endpoints of the sample. The adjusted model was then re-estimated, and the results are displayed as the fourth robustness check.
After performing these robustness tests, the estimated coefficients for LRM on urban GEE, while varying in magnitude, retained the same sign and statistical significance as those in the baseline regression. These findings confirm the robustness of the core empirical results, further validating the reliability of our conclusions.
4.5. Mediating Effects Tests
To further explore the theoretical mechanism proposed earlier, we hypothesize that LRM impedes urban GEE by diminishing human capital investment and weakening technological transformation capacity. In order to test the existence of this transmission mechanism, we conduct regression analyses based on econometric models (2) and (3) outlined in the previous section. Specifically, human capital investment (Edu) and technological output (Patent) are sequentially incorporated as dependent and explanatory variables in the empirical model. The results are presented in Table 6.
Table 6.
Intermediary effect of scientific and technological level.
Columns (2) and (4) of Table 6 show that the regression coefficients of LRM on human capital investment and technological output are −0.868 and −1.618, respectively, both significant at the 1% level. These findings suggest that LRM induces businesses and governments to prioritize short-term, high-return projects, thereby diverting investments from long-term research and development activities. This leads to a reduction in both human capital investment and technological output, which in turn hampers the green economic development of cities.
Furthermore, the results in Columns (3) and (5) indicate that LRM, human capital investment, and technological output all have a significant impact on GEE, with coefficients also significant at the 1% level. This confirms the presence of a mediating effect through which LRM affects GEE, validating the hypothesized pathway and providing empirical support for Hypothesis H2.
These findings underline the crucial role of human capital and technological innovation in moderating the negative impact of LRM on urban green economic development, supporting the argument that efficient land resource allocation is critical for fostering sustainable growth in cities.
4.6. Threshold Effect Test
Building on the theoretical analysis presented earlier, this study examines whether the suppressive effect of LRM on urban GEE is influenced by variations in government performance. To investigate this, we utilize three key government performance indicators—economic environment, social governance, and administrative intervention—as threshold variables. The threshold effect is empirically tested using the Bootstrap method, with the results summarized in Table 7. The F-values, threshold estimates, and their corresponding 95% confidence intervals for the different threshold variables (economic environment, social governance, and administrative intervention) indicate that the government’s Economic and Social Administration (ESA) performance successfully passes both the single and double threshold effect tests at a statistically significant level.
Table 7.
Estimates of threshold effects.
Consequently, we proceed with a double threshold model for further regression analysis, the results of which are presented in Table 8. In the first column of Table 8, we focus on the economic environment, specifically the regional GDP of local governments. When regional GDP is less than or equal to 18.765 billion RMB, the coefficient for the effect of LRM on urban GEE is 0.2024, which is significantly positive at the 5% level. When regional GDP exceeds 18.765 billion RMB but is less than or equal to 59.157 billion RMB, the coefficient becomes 0.0904, which is significantly negative at the 1% level. This suggests that in the early stages of economic development, the large-scale allocation of industrial land contributes to the stimulation of agglomeration effects, improved resource utilization efficiency, and overall enhancement of urban GEE. However, once the economy reaches a certain level of maturity, congestion effects begin to dominate, leading to a negative impact on the improvement of urban GEE.
Table 8.
Threshold effect regression results.
In the second column of Table 8, we examine social governance. When the total population of a city is less than or equal to 776,000, the estimated coefficient for the impact of LRM on GEE is 0.0073, which is negative but not statistically significant. When the population exceeds 776,000, the estimated coefficient increases to 0.1026, and it is significantly negative at the 1% level. This indicates that as the challenges associated with social governance intensify—due to rising energy consumption, escalating social pollution, and increased traffic congestion—the adverse impact of LRM on GEE becomes more pronounced.
In the third column of Table 8, we investigate administrative intervention by local governments. When the number of foreign direct investment contracts is less than or equal to 21, the estimated coefficient is 0.015, positive but not significant. However, when the number exceeds 21 but is less than or equal to 53, the coefficient becomes 0.038 and is significantly negative at the 5% level. When the number of contracts exceeds 53, the coefficient rises to 0.085 and remains significantly negative at the 1% level. This suggests that excessive local government intervention in the land market—often driven by the pursuit of short-term achievements—can lead to the preferential allocation of industrial land, which in turn misallocates productive factors, increases environmental pollution, and hinders urban green economic development. Consequently, the suppressive effect of LRM on urban GEE is amplified under conditions of heightened administrative intervention.
In summary, the results of the threshold effect tests confirm that government ESA performance plays a critical role in moderating the relationship between LRM and urban GEE, thereby validating Hypothesis H3.
4.7. Heterogeneity Analysis
To further investigate the regional heterogeneity in the threshold effect of LRM on GEE, this study moves beyond the conventional regional classifications of eastern, central, western, and northeastern China. Instead, it categorizes cities at or above the prefecture level into two groups: old industrial bases and non-old industrial bases, based on China’s unique national context. Drawing from the “State Council’s Approval of the National Plan for the Adjustment and Transformation of Old Industrial Bases (2013–2022)”, the study considers the 95 cities listed in this document as the sample space for old industrial bases, while other cities are classified as non-old industrial bases. The results of the threshold effect test and estimation are presented in Table 9 and Table 10. Overall, the threshold effect of LRM on GEE demonstrates significant heterogeneity across different regional types, as influenced by government performance.
Table 9.
The threshold effect estimation of heterogeneity analysis.
Table 10.
Threshold effect regression results of heterogeneity analysis.
4.7.1. Economic Environment
The results in Columns (1) and (4) of Table 10 reveal that, after controlling for relevant variables, cities in old industrial bases show a significant shift in the impact of LRM on GEE once their GDP exceeds 271.4 billion RMB. Specifically, when GDP is less than or equal to this threshold, the estimated coefficient is 0.0258, negative but not statistically significant. However, once GDP surpasses 271.4 billion RMB, the coefficient increases to 0.1952, and becomes significantly positive at the 5% level. Conversely, in non-old industrial bases, the impact of LRM on GEE changes at a higher threshold of 922.45 billion RMB. When GDP is below this threshold, the coefficient is significantly negative at the 1% level, with a value of 0.0729. After surpassing this threshold, the coefficient becomes 0.2802, but it is no longer statistically significant. These findings suggest that, after crossing their respective threshold values, the effect of LRM on GEE transitions from inhibitory to positive in both types of regions.
4.7.2. Social Governance
The results in Columns (2) and (5) of Table 10 indicate a shift in the impact of LRM on GEE based on population size. In cities within old industrial bases, when the total population is less than or equal to 231,000, the estimated coefficient is 0.2870, significantly positive at the 5% level. However, when the population exceeds this threshold, the coefficient drops to 0.0453, significantly negative at the 10% level. In non-old industrial bases, when the population is less than or equal to 1.019 million, the coefficient is 0.0248, negative but not statistically significant. When the population exceeds 1.019 million, the coefficient increases to 0.1474, significantly negative at the 1% level. This pattern suggests that, in old industrial bases, as population growth surpasses the threshold, the impact of LRM on GEE shifts from positive to negative, while in non-old industrial bases, the adverse effect of LRM on GEE intensifies as population size increases.
4.7.3. Administrative Intervention
As shown in Columns (3) and (6) of Table 10, the number of foreign direct investment (FDI) projects also plays a crucial role in mediating the relationship between LRM and GEE. In cities within old industrial bases, when the number of FDI projects is less than or equal to 7, the coefficient is 0.0246, positive but not statistically significant. Once this threshold is exceeded, the coefficient becomes significantly negative at the 10% level, with a value of 0.0522. In contrast, in non-old industrial bases, when the number of FDI projects is below 20, the coefficient is 0.0202, negative but not statistically significant. However, when the number of FDI projects exceeds 20, the coefficient becomes significantly negative at the 1% level, with a value of 0.1167. This indicates that in both old and non-old industrial bases, after crossing their respective thresholds, the influence of LRM on GEE transitions from positive to negative. Furthermore, in non-old industrial bases, this effect becomes more pronounced with higher FDI involvement.
This analysis confirms the existence of significant heterogeneity in the threshold effect of LRM on urban green economic development across different regional contexts. The impact of LRM on GEE varies depending on the economic environment, social governance capacity, and administrative intervention, further highlighting the complex dynamics at play in different regional settings.
5. Conclusions and Policy Implications
5.1. Conclusions
This study, utilizing a panel dataset of 285 prefecture-level cities in China from 2007 to 2019, investigates the impact of LRM on urban GEE and explores the underlying mechanisms, particularly from the perspective of government performance. Based on both theoretical analysis and empirical tests, the key findings of this study are as follows:
First, LRM is found to have a significant negative impact on urban GEE. This result remains robust even after addressing potential endogeneity issues and conducting a series of robustness checks, further reinforcing the validity of the conclusion. Second, the mechanism tests reveal that LRM impedes urban green economic development primarily by reducing human capital investment and weakening the capacity for technological innovation and transformation. Third, government performance plays a crucial threshold role in moderating the impact of LRM on urban GEE. Specifically, as local governments become more focused on economic development, face increasing challenges in social governance, and exert greater intervention in the land market, the negative effect of LRM on urban green economic development intensifies. Finally, the heterogeneity analysis demonstrates that, in cities located within old industrial bases, the impact of LRM on GEE is more sensitive to changes in government performance thresholds compared to cities outside these regions.
The analysis underscores the importance of considering the threshold effect of government performance when evaluating the impact of LRM on GEE in Chinese cities. This perspective leads to varying conclusions based on the research focus. First, emphasizing the role of government performance highlights its critical importance in shaping urban green economic development, particularly in relation to land resource allocation, human capital investment, and technological innovation. Second, our findings align with those of Chang-Tai Hsieh et al. [51], who similarly argue that misallocation of labor or capital can impede urban green economic development. Other studies also affirm that the allocation of human capital by both government and enterprises significantly influences urban green economic efficiency [52,53], further validating the robustness of our research methodology. Lastly, from an interregional perspective, the study confirms that LRM hinders GEE in both old industrial base cities and non-old industrial base cities, although the intensity of this effect varies based on regional characteristics.
In conclusion, this study provides compelling evidence of the detrimental effects of LRM on urban green economic development and emphasizes the role of government performance in moderating these effects. These findings have important implications for policymakers, particularly in terms of designing strategies to optimize land resource allocation and enhance the green economic development of cities across China.
5.2. Policy Implications
Based on the preceding analysis, this study offers three policy recommendations aimed at mitigating the detrimental effects of LRM on urban GEE, supporting local governments in China in achieving high-quality, sustainable development and providing a reference for other countries to formulate land policies.
First, establish a mechanism for optimizing land stock oriented to efficiency improvement. Policymakers should abandon the traditional path of relying on incremental land expansion and shift to a stock optimization strategy that focuses on efficiency improvement. Build a human capital accumulation and technological innovation coupling mechanism, focusing on the implementation of a gradient cultivation program for highly skilled personnel and a technology diffusion subsidy policy. In particular, it is necessary to establish a dynamic monitoring system for governmental governance performance, and when the regional governance performance is below the critical threshold, it should activate the early warning system for land mismatch risk and adopt a mandatory land use efficiency audit system, so as to effectively block the vicious cycle path of “land mismatch—human capital extrusion—technological degradation”.
Second, the government should adjust its land policy according to the city’s level of economic development, social governance capacity and degree of administrative intervention. For economies in the middle and late stages of industrialization, pilot land factor market reforms should be implemented to guide factor restructuring through price signals; on the other hand, for newly industrialized regions, moderate policy flexibility should be maintained to establish a linkage response mechanism between land supply and the adoption rate of green technologies. The framework emphasizes the embedded integration of the government’s performance management system with the land risk management module to ensure that policy behavior is adjusted when the marginal benefits of administrative intervention diminish.
Third, implement the Multi-dimensional Heterogeneity Regional Strategy. It is recommended that countries establish a Land Mismatch Dynamic Database (LM-DD) and a Green Efficiency Monitoring Cloud Platform (GEMP), and use machine learning algorithms to assess the effects of policy interventions in real time. At the same time, a transnational knowledge-sharing network on land governance should be established through the World Bank and other international organizations, and a global land resource allocation efficiency benchmarking system (GLABES) should be constructed to provide countries at different stages of development with a toolkit for policy adaptation.
While this study provides a thorough analysis of the impact of LRM on urban green economic development, it is important to acknowledge several limitations that also suggest avenues for future research. First, the theoretical model could be further developed. While this study focuses on the threshold effect of government performance in shaping the relationship between LRM and GEE in China, the theoretical framework could be expanded to incorporate a more comprehensive economic logic. Second, extending the study period could provide additional insights. Due to data availability constraints, the analysis covers the period from 2007 to 2019. However, the land market system underwent continuous reforms before 2007, which may have influenced urban GEE. Future studies should extend the time frame to examine the long-term effects of LRM and the threshold effect of government performance on GEE. Finally, the empirical analysis could be further refined. This study uses city-level data, which limits the ability to disaggregate indicators by industry, such as manufacturing and services. Future research could explore micro-level enterprise data to provide more granular insights, thus enhancing the practical applicability of the findings at the enterprise level.
Author Contributions
Y.W.: conceptualization, methodology, review, editing; F.L.: data collection, data curation, and original draft writing; Z.W.: review, editing; F.L. and Z.W.: Software; Y.W.: Supervision, Project Administration, Funding Acquisition. All authors have read and agreed to the published version of the manuscript.
Funding
This research was supported by National Natural Science Foundation of China (72373151, 71773133) and General Project of National Social Science Fund of China, grant number (23BDJ108) and Research Project “Special Study on Enhancing the Functional Value of State-owned Assets and Central Enterprises and Serving the Implementation of National Regional Development Strategies” by the State-owned Assets Supervision and Administration Commission of the State Council in 2024 (No. 17).
Data Availability Statement
The data presented in this study are available on request from the corresponding author.
Acknowledgments
We would like to express our sincere gratitude to Mao from the Technical Institute of Physics and Chemistry CAS, Chinese Academy of Sciences, for his invaluable contributions to this study.
Conflicts of Interest
The authors declare no conflicts of interest.
References
- Chang, R.-D.; Soebarto, V.; Zhao, Z.-Y.; Zillante, G. Facilitating the transition to sustainable construction: China’s policies. J. Clean. Prod 2016, 30, 534–544. [Google Scholar] [CrossRef]
- Kaiwen, Z.; Tan, R. Land policy making in a complex system: The innovation and diffusion logic of China’s retained land policy reform. Land Use Pol. 2024, 144, 107263. [Google Scholar] [CrossRef]
- He, D.H.; Wang, X.M.; Liu, Y.T. Reflection on Land Use Institutional System towards Spatial Justice: Discussion on Role of Local Government in Land Redevelopment. Urban Stud. 2023, 30, 1–7+17. [Google Scholar]
- North, D.C.; Calvert, R.; Eggertsson, T. Institutions Institutional Change and Economic Performance; Cambridge University Press: Cambridge, UK, 1990; p. 164. [Google Scholar]
- Jiang, Y.; Tang, Y.T.; Long, H.; Deng, W. Land consolidation: A comparative research between Europe and China. Land Use Pol. 2022, 112, 105790. [Google Scholar] [CrossRef]
- Jiang, R.; Lin, G.C.S. Placing China’s land marketization: The state, market, and the changing geography of land use in Chinese cities. Land Use Pol. 2021, 103, 105293. [Google Scholar] [CrossRef]
- Fan, X.; Qiu, S.; Sun, Y. Land finance dependence and urban land marketization in China: The perspective of strategic choice of local governments on land transfer. Land Use Pol. 2020, 99, 105023. [Google Scholar] [CrossRef]
- Wang, J.; Wu, Q.; Yan, S.; Guo, G.; Peng, S. China’s local governments breaking the land use planning quota: A strategic interaction perspective. Land Use Pol. 2019, 92, 104434. [Google Scholar] [CrossRef]
- Zhou, Y.; Chang, J.; Feng, S. Effects of urban growth boundaries on urban spatial structural and ecological functional optimization in the Jining Metropolitan Area, China. Land Use Pol. 2022, 117, 106113. [Google Scholar] [CrossRef]
- Zhou, D.; Huang, Q.; Chong, Z. Analysis on the effect and mechanism of land misallocation on carbon emissions efficiency: Evidence from China. Land Use Pol. 2022, 121, 106336. [Google Scholar] [CrossRef]
- Zhang, W.; Xu, H. Effects land finance on carbon emissions: A panel data analysis for Chinese provinces. Land Use Pol. 2017, 63, 493–500. [Google Scholar] [CrossRef]
- Xie, R.; Yao, S.; Han, F.; Zhang, Q. Does misallocation of land resources reduce urban green total factor productivity? An analysis of city-level panel data in China. Land Use Pol. 2022, 122, 106353. [Google Scholar] [CrossRef]
- Restuccia, D.; Rogerson, R. Policy Distortions and Aggregate Productivity with Heterogeneous Establishments. Rev. Econ. Dyn. 2008, 11, 707–720. [Google Scholar] [CrossRef]
- Hsieh, C.-T.; Moretti, E. Housing constraints and spatial misallocation. Am. Econ. J.-Macroecon. 2019, 11, 1–39. Available online: https://www.aeaweb.org/articles?id=10.1257/mac.20170388 (accessed on 16 May 2020). [CrossRef]
- Murphy, K.M.; Shleifer, A.; Vishny, R.W. Why is rent-seeking so costly to growth? Am. Econ. Rev. 1993, 83, 409–414. [Google Scholar]
- Grisorio, M.J.; Prota, F. The impact of fiscal decentralization on the composition of public expenditure: Panel data evidence from Italy. Reg. Stud. 2015, 49, 1949–1956. [Google Scholar] [CrossRef]
- Athanasouli, D.; Goujard, A. Corruption and management practices: Firm level evidence. J. Comp. Econ. 2015, 43, 1014–1034. [Google Scholar] [CrossRef]
- Li, Y.; Zhang, X. Rent-seeking in bank credit and firm R&D innovation: The role of industrial agglomeration. J. Bus. Res. 2023, 159, 113454. [Google Scholar] [CrossRef]
- Du, J.; Peiser, R.B. Land supply, pricing and local governments’ land hoarding in China. Reg. Sci. Urban Econ. 2014, 48, 180–189. [Google Scholar] [CrossRef]
- Chang, Z.; Diao, M.; Jing, K.; Li, W. High-speed rail and industrial movement: Evidence from China’s Greater Bay Area. Transp. Policy 2021, 112, 22–31. [Google Scholar] [CrossRef]
- Gebresilasse, M. Rural roads, Agricultural extension and Productivity. J. Dev. Econ. 2023, 162, 103048. [Google Scholar] [CrossRef]
- Chen, P.; Hao, Y. Digital transformation and corporate environmental performance: The moderating role of board characteristics. Corp. Soc. Responsib. Environ. Manag. 2022, 29, 1757–1767. [Google Scholar] [CrossRef]
- Huang, Z.; Du, X. How does high-speed rail affect land value? Evidence from China. Land Use Pol. 2021, 10, 105068. [Google Scholar] [CrossRef]
- Chang, Z.; Zheng, L.; Yang, T.; Long, F. High-speed rail, new town development, and the spatial mismatch of land leases in China. Land Use Pol. 2022, 115, 106014. [Google Scholar] [CrossRef]
- Li, L.X.; Huang, P.Y.; Ma, G.R. Land resource mismatch and productivity differences in industrial enterprises in China. Manag. World 2016, 8, 86–96. [Google Scholar] [CrossRef]
- Camisón, C.; Villar-López, A. Organizational innovation as an enabler of technological innovation capabilities and firm performance. J. Bus. Res. 2014, 67, 2891–2902. [Google Scholar] [CrossRef]
- Liu, X.; Zhang, X. Industrial agglomeration, technological innovation and carbon productivity: Evidence from China. Resour. Conserv. Recycl. 2021, 166, 105330. [Google Scholar] [CrossRef]
- Zou, T. Technological innovation promotes industrial upgrading: An analytical framework. Struct. Chang. Econ. Dyn. 2024, 70, 150–167. [Google Scholar] [CrossRef]
- Jordà, Ò.; Knoll, K.; Kuvshinov, D.; Schularick, M.; Taylor, A.M. The rate of return on everything, 1870–2015. Q. J. Econ. 2019, 134, 1225–1298. [Google Scholar] [CrossRef]
- Fike, R.; Gwartney, J. Public choice, market failure, and government failure in principles textbooks. J. Econ. Educ. 2015, 46, 207–218. [Google Scholar] [CrossRef]
- Lin, B.; Zhu, J. Fiscal spending and green economic growth evidence from China. Energy Econ. 2019, 83, 264–271. [Google Scholar] [CrossRef]
- Sedgley, N.; Elmslie, B. Agglomeration and congestion in the economics of ideas and technological change. Am. J. Econ. Sociol. 2008, 60, 101–121. [Google Scholar] [CrossRef]
- Chen, L.; Wang, X.; Hao, Y.; Yin, J.; Chen, D. Population agglomeration, borrowed size and urban economic growth in China. Cities 2024, 155, 105491. [Google Scholar] [CrossRef]
- Fan, Q.; Yang, S.; Liu, S. Asymmetrically spatial effects of urban scale and agglomeration on haze pollution in China. Int. J. Environ. Res. Public Health 2019, 16, 4936. [Google Scholar] [CrossRef]
- Zhang, N.; Choi, Y. Total-factor carbon emission performance of fossil fuel power plants in China: A metafrontier non-radial Malmquist index analysis. Energy Econ. 2013, 40, 549–559. [Google Scholar] [CrossRef]
- Shi, K.; Xu, T.; Li, Y.; Chen, Z.; Gong, W.; Wu, J.; Yu, B. Effects of urban forms on CO2 emissions in China from a multi-perspective analysis. J. Environ. Manag. 2020, 262, 110300. [Google Scholar] [CrossRef]
- Han, S.; Sun, B.; Zhang, T. Mono- and polycentric urban spatial structure and PM2.5 concentrations: Regarding the dependence on population density. Habitat Int. 2020, 104, 102257. [Google Scholar] [CrossRef]
- Safirova, E. Telecommuting, traffic congestion, and agglomeration: A general equilibrium model. J. Urban Econ. 2002, 52, 26–52. [Google Scholar] [CrossRef]
- Sun, B.; He, Z.; Zhang, T.; Wang, R. Urban spatial structure and commute duration: An empirical study of China. Int. J. Sustain. Transp. 2016, 10, 638–644. [Google Scholar] [CrossRef]
- Rao, Y.; Yang, J.; Dai, D.; Wu, K.; He, Q. Urban growth pattern and commuting efficiency: Empirical evidence from 100 Chinese cities. J. Clean. Prod. 2021, 302, 126994. [Google Scholar] [CrossRef]
- Harari, M. Cities in bad shape: Urban geometry in India. Am. Econ. Rev. 2020, 110, 2377–2421. Available online: https://www.aeaweb.org/articles?id=10.1257/aer.20171673 (accessed on 6 April 2021). [CrossRef]
- Du, L.; Wei, M.; Zhang, S.; Pan, J. Unveiling the policy intervention effects of natural resource regulation on firm-level pollution emissions: Evidence from China’s restrained land supply. Resour. Policy. 2023, 86, 104081. [Google Scholar] [CrossRef]
- Pan, W.; Pan, W.; Hu, C.; Tu, H.; Zhao, C.; Yu, D.; Xiong, J.; Zheng, G. Assessing the green economy in China: An improved framework. J. Clean. Prod 2019, 209, 680–691. [Google Scholar] [CrossRef]
- Sharp, J.A.; Meng, W.; Liu, W. A modified slacks-based measure model for data envelopment analysis with ’natural’ negative outputs and inputs. J. Oper. Res. Soc. 2007, 58, 1672–1677. [Google Scholar] [CrossRef]
- Young, A. Gold into base metals: Productivity growth in the People’s Republic of China during the reform period. J. Polit. Econ. 2003, 110, 1220–1261. Available online: https://www.journals.uchicago.edu/doi/full/10.1086/378532 (accessed on 22 November 2019). [CrossRef]
- Li, J.L.; Xu, B. Curse or Blessing: How Does Natural Resource Abundance Affect Green Economic Growth in China? Econ. Res. J. 2018, 53, 151–167. [Google Scholar]
- Hou, S.; Song, L.; Wang, J.; Ali, S. How land finance affects green economic growth in Chinese cities. Land 2021, 10, 819. [Google Scholar] [CrossRef]
- Baron, R.M.; Kenny, D.A. The moderator—mediator variable distinction in social psychological research: Conceptual, strategic, and statistical considerations. J. Pers. Soc. Psychol. 1986, 51, 1173–1182. [Google Scholar] [CrossRef]
- Mao, W.F.; Lu, J. How mismatch of land factors affects the quality of urban innovation and entrepreneurship in China-Empirical evidence from prefecture-level cities. Ind. Econ. Res. 2020, 3, 17–29+126. [Google Scholar] [CrossRef]
- Jin, G.; Shen, K.; Li, J. Interjurisdiction political competition and green total factor productivity in China: An inverted-U relationship. China Econ. Rev. 2020, 61, 101224. [Google Scholar] [CrossRef]
- Hsieh, C.-T.; Klenow, P.J. Misallocation and manufacturing TFP in China and India. Q. J. Econ. 2009, 124, 1403–1448. [Google Scholar] [CrossRef]
- Deng, Q.; Zhou, S.; Peng, F. Measuring green innovation efficiency for China’s high-tech manufacturing industry: A network DEA approach. Math. Probl. Eng. 2020, 2020, 8902416. [Google Scholar] [CrossRef]
- Yang, Y.; Wu, D.; Xu, M.; Yang, M.; Zou, W. Capital misallocation, technological innovation and green development efficiency: Empirical analysis based on China provincial panel data. Environ. Sci. Pollut. Res. 2022, 29, 65535–65548. [Google Scholar] [CrossRef] [PubMed]
Disclaimer/Publisher’s Note: The statements, opinions and data contained in all publications are solely those of the individual author(s) and contributor(s) and not of MDPI and/or the editor(s). MDPI and/or the editor(s) disclaim responsibility for any injury to people or property resulting from any ideas, methods, instructions or products referred to in the content. |
© 2025 by the authors. Licensee MDPI, Basel, Switzerland. This article is an open access article distributed under the terms and conditions of the Creative Commons Attribution (CC BY) license (https://creativecommons.org/licenses/by/4.0/).