Abstract
Urban functional zones (UFZs) are related to people’s daily activities. Accurate recognition of UFZs is of great significance for an in-depth understanding of the complex urban system and optimizing the urban spatial structure. Emerging geospatial big data provide new ideas for humans to recognize urban functional zones. Point-of-interest (POI) data have achieved good results in the recognition of UFZs. However, since humans are the actual users of urban functions, and POI data only reflect static socioeconomic characteristics without considering the semantic and temporal features of dynamic human activities, it leads to an incomplete and insufficient representation of complex UFZs. To solve these problems, we proposed a data-synthesis-driven approach to quantify and analyze the distribution and mixing of urban functional zones. Firstly, representation learning is used to mine the spatial semantic features, activity temporal features, and activity semantic features that are embedded in POI data and social media check-in data from spatial, temporal, and semantic aspects. Secondly, a weighted Stacking ensemble model is used to fully integrate the advantages between different features and classifiers to infer the proportions of urban functions and dominant functions of each urban functional zone. A case study within the 5th Ring Road of Beijing, China, is used to evaluate the proposed method. The results show that the approach combining dynamic and static features of POI data and social media data effectively represents the semantic information of UFZs, thereby further improving the accuracy of UFZ recognition. This work can provide a reference for uncovering the hidden linkages between human activity characteristics and urban functions.
1. Introduction
Urban functional zones (UFZs) are closely related to human life and production. Pacione [1] associates urban form and function with human economy and culture. He believes that urban development in different countries is influenced by cultural backgrounds and stages of development. Johansson [2] suggests that UFZs can reflect the concentration of people and activities. As a fundamental spatial unit for urban planning and management, the types of UFZs are determined by residents’ use of urban space and the human activities that occur inside [3,4,5]. In this paper, an urban function zone is defined as a spatial unit of human activities within a metropolitan area that is dominated by a specific function. With the rapid development of the economy and urbanization, urban compactness has increased [6], and various functions have been integrated within the same zones. The urban spatial structure presents the characteristics of heterogeneity, complexity, and diversity [7,8], which brings challenges to the identification of UFZs; therefore, a timely and in-depth understanding of urban functions is conducive to solving urban development problems, such as urban sprawl, chaotic functional layouts, and declining urban livability [9,10,11], and promoting sustainable urban development. Some research has used remote sensing images to identify land use or urban functions [12,13,14,15], and these methods are effective in identifying simple land covers by extracting surface physical properties of the objects, such as spectral and textural features [16,17,18]. Some studies classify UFZs based on the morphological features of the building [19,20]. However, these methods only consider the natural attributes of the urban space, neglecting the economic and human activity characteristics that are closely related to urban functions [21,22].
The advent of the big data era has brought new challenges to in-depth perception and understanding of UFZs. Geospatial big data contains abundant semantic information about socio-economic and human activities, which can adequately reflect the patterns and preferences of human activities and is conducive to describing and distinguishing complex UFZs [23,24]. Many studies have recognized and analyzed UFZs using geospatial big data, such as points of interest (POIs) [22,25,26,27], mobile phone location data [5,28], trajectories of floating cars [29,30,31], and social media data [32,33]. Soto et al. [34] used Madrid’s cell phone records to classify land use types. Becker et al. [35] used cellular network data to analyze people flow and identify park and residential zones. Frias-Martinez et al. [36] used geolocated tweets generated by mobile social media applications to perceive urban land use. Barlacchi et al. [37] extracted the hierarchical structure features of POIs to model city zones. Among these, POI data have been used widely due to their comprehensiveness and accessibility; for example, Niu and Silva [38] used POI data to infer UFZs in London. Yao et al. [27] introduced the Word2Vec model to explore the relationship between the spatial distribution patterns of POIs and UFZs.
To obtain more information, some researchers have also integrated multi-source data. Crooks et al. [4] presented a bottom-up approach to capture a city’s form and function using open-source and volunteered datasets. Han et al. [39] identified UFZs based on bus smart card data and POIs. Feng et al. [40] proposed an SOE (scene–object–economy)-based framework to identify UFZs, which integrates scene features, object features, and economy features. Ye et al. [41] revealed urban functions by integrating social media data and street-level images. Jendryke et al. [42] combined remote sensing and social media data to classify possible land cover types. Du et al. [29] applied the latent Dirichlet allocation (LDA) model to POI data, taxi trajectory data, and bicycle stock data to identify functional regions. Thakur et al. [43] used social media and geolocation sensor data to study population dynamics and land classification. Yang et al. [24] combined morphological features extracted from buildings and socioeconomic features of POIs to classify UFZs. The above studies show that different geospatial data have their own advantages and disadvantages [44]. Integrating multi-source data can provide more detailed information for inferring UFZs [45].
Despite the above studies having achieved remarkable performance, there is still room for improvement. First, previous studies have mainly focused on static urban features and have failed to capture the dynamic features of urban functions driven by human activities. Only a limited number of previous studies consider the temporal, spatial, and semantic features of human activities simultaneously. Second, the extracted features are simply spliced or stacked [24,46] and then directly fed to the classifier, which cannot adequately capture the complementary strengths between features. Therefore, a rational ensemble learning framework needs to be designed for feature integration.
To alleviate the above issues, we proposed a data-synthesis-driven approach to recognize UFZs. Our methods integrate POI data and social media check-in data to extract dynamic human activities and socio-economic features in geospatial big data from three perspectives: temporal, spatial, and semantic. Specifically, we extract spatial semantic features from POI data using the Place2Vec model, which employs the nearest neighbor approach and considers the distance augmenting factor to construct the training dataset. Then, we use the Skip-Gram training framework to extract high-dimensional feature vectors of the POIs. We adopt the LDA-Doc2Vec model to obtain the activity semantic feature of social media check-in tweets and adopt statistical analysis to extract activity temporal features of check-in time series. Finally, a weighted stacking ensemble (WSE) classification model is built to recognize the UFZs. The contributions of this study are as follows: (1) A new data-synthesis-driven approach is developed for comprehensive perception and understanding of the UFZs by integrating dynamic and static human activity data; (2) We build a WSE classification model that combines the strengths of different classifiers and features to obtain the final UFZ classification result, improving the accuracy of the recognition results. (3) Our methods recognize the dominant functions and the proportion of urban functions within each analysis unit and analyze its spatial patterns and degree of mixing. The results provide insights for urban planning and decision making.
2. Materials and Methods
2.1. Study Area and Datasets
In this research, we chose the area within the Fifth Ring Road of Beijing as the study area (shown in Figure 1). Beijing is the capital of China and the political, economic, and international cultural exchange center. Beijing’s Ring Road system consists of a series of concentric roads encircling the city center, designed to manage traffic and urban expansion. As the city center, the Fifth Ring Road is the main place for residents’ activities and contains a variety of urban functional zones. We selected the traffic analysis zone (TAZ) as the analysis unit to identify fine-grained urban functions. TAZ is a commonly used spatial analysis unit in urban studies, usually divided by major roads. Roads serve as the boundaries of these zones, facilitating the movement of residents between different blocks, which makes TAZs a more reliable and meaningful unit compared to grid-based boundaries. Additionally, POIs and human activities occur within the road-defined zones, ensuring geographical and functional consistency. The study area is segregated into 1167 TAZs, using the main road networks extracted from OpenStreetMap and the morphological partition algorithm of Yuan et al. [47]. Figure 1 shows the distribution of TAZs.
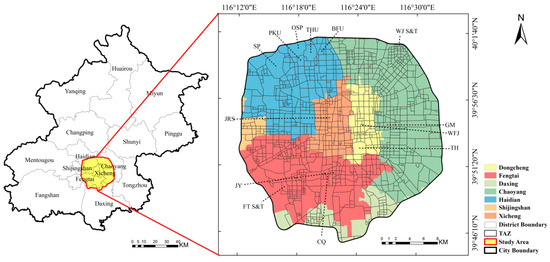
Figure 1.
The study area and TAZs in Beijing. Abbreviations of places: WJ S&T—Wangjing Science and Technology Park, OSP—the Old Summer Palace, THU—Tsinghua University, PKU—Peking University, SP—the Summer Palace, JRS—Jinrong Street, GM—Guomao, WFJ—Wangfujing, TH—Temple of Heaven, JY—Jiayuan, CQ—Caoqiao, BFU—Beijing Forestry University, FT S&T—Fengtai Science and Technology park.
POI data contain abundant spatio-temporal and thematic distribution features [7,8]. In this study, a dataset containing 408,026 POIs was collected via the AMap platform (https://lbs.amap.com/api, accessed on 21 November 2020) in 2022; each record contains a POI name, coordinates, and three different level categories: top-level category, second-level category, and final-level category. Referring to the latest Code for Classification of Urban Land Use and Planning Standards of Development Land (GB50137-2011) [48] issued in 2011, and taking into account the actual situation of the study area, the POI data are reclassified into five basic functional types: commercial (C), residential (R), administration and public service (A), green space and square (G), and industrial (I), which are summarized in Table 1.

Table 1.
Reclassification of POI data.
The social media check-in data were collected from Sina Weibo, one of the most popular social platforms in China. We collected geo-tagged check-in data for one and a half years, from 1 January 2022 to 30 June 2023. Each record contains coordinates, timestamps, and textual contents. After removing the error location records, a total of 1,824,249 records were retained within the study area.
2.2. Methods
The flowchart of the proposed data-synthesis-driven approach is illustrated in Figure 2. This approach is based on POI data and social media check-in data. First, the latent features in big data are mined in terms of spatial, temporal, and semantic aspects by using the representation learning method, specifically including spatial semantic features, activity temporal features, and activity semantic features. Then, a weighted stacking ensemble learning model is used to integrate different features to infer the dominant functions and functional proportions in each TAZ. This study constructs a comprehensive model for identifying UFZs from the perspective of human activities. The results are analyzed and validated at the end.
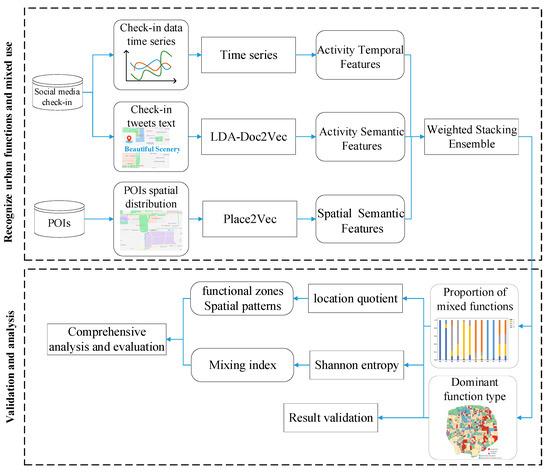
Figure 2.
Flowchart of our methodology.
2.2.1. Extracting Spatial Semantic Features Using POI Data
POI data integrate location and attribute information, and the spatial distribution and interactions of different categories of POIs reflect the utilization of urban spaces [7]. POI type distribution is similar to word frequency distribution and is more related to points geographically close to it [22,49,50]. Therefore, an extended model Place2Vec [50] based on Word2Vec is investigated to obtain Spatial Semantic Features from POI data. In this model, the study area is regarded as a corpus, each TAZ within the study area is regarded as a document, and the types of POIs contained in the TAZs are regarded as words. To obtain sufficient feature information, this paper adopts the second-level category of POIs to construct the training dataset.
We used the nearest neighbor approach rather than a fixed-size sliding window to capture POI-based spatial contextual information (Figure 3). We created a buffer around the center POI to search the k nearest neighboring POIs and record their categories as the training pairs . In addition, considering the effect of distance on the characteristics of POI distribution, we introduced the augmenting factor to increase the frequency of the training pairs in our training dataset. is defined as follows:
where is the augmenting factor for the training tuple when the center POI is and the context POI is , rounded to an integer. represents the total number of POIs, represents the number of check-ins associated with this POI, set to 1 in our case. The numerator is usually regarded as a smoothing constant. denotes the distance between the center POI and context POI . is an inverse distance factor. In this paper, we set
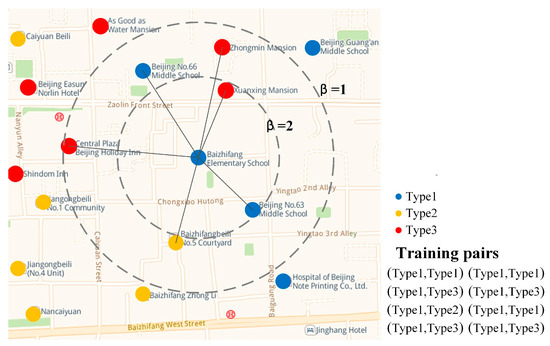
Figure 3.
Constructing training pairs.
The generated training dataset is fed into the Skip-Gram model to train the neural network. Cross-entropy is used to measure the difference between the learned probability and the true probability [22,50]. Since the POI data are discrete, the cross-entropy formula was simplified as follows:
where is the learned probability distribution and is the true probability distribution. and are the predicted probability and the true probability of a context POI type given the type of the central POI is , respectively. It is further defined as follows:
where is the center POI type and are the context POI types. Finally, the softmax function is used as an activation function in the output layer of the neural network to convert the scores into probabilities and output vector representation of POI types. The objective function is shown in Equation (4):
where is the number of POI types, and are the vectors of the context POI types at index and index , respectively, and is the vector of the center POI type.
After obtaining the vector of each POI type using the Place2Vec model, the feature vector of the -th TAZ is computed by weighted averaging, which is defined as follows:
where is the feature vector of the type to which the -th POI belongs in the -th TAZ. is the total number of POIs contained in the -th TAZ. The computed feature vector for each TAZ is used as the representation of the spatial semantic features.
2.2.2. Extracting Activity Temporal Feature Using Check-In Time Series
The temporal patterns of human activities corresponding to different UFZs tend to be different [33]. Most of the current studies on extracting temporal features were based on taxi GPS trajectory data [47,51,52,53]. However, due to the short distances between neighboring TAZs, people often choose to walk or ride bicycles, which leads to the loss of partial features. Therefore, in this paper, we choose social media check-in data to capture the activity temporal feature in TAZs by using the time and location information generated when people check in.
In this study, a day is divided into 24 periods (each period representing one hour), and a 24-length feature vector is used to count the number of check-ins per TAZ per time period in a day. In addition, due to the differences in human activity patterns between weekdays and weekends [33], separate statistics are required. We consider weekdays (Monday to Friday) and weekends (Saturday and Sunday). Their vectors are represented as and , respectively. Where denotes the number of check-ins during the -th time period on weekends within a TAZ and denotes the number of check-ins during the -th time period on weekdays within a TAZ, defined as follows:
where denotes the number of check-ins in the -th time period of the -th weekend, indicates the total number of weekends, and is computed similarly to Equation (6) by replacing weekends with weekdays. The sum normalization method is used to obtain the normalized vectors and , the normalization formula is shown in Equation (7) ( is normalized in a similar way to by replacing with ):
Finally, the activity temporal feature of the -th TAZ is defined as follows:
2.2.3. Extracting Activity Semantic Features Using Check-In Texts
The textual content of social media check-in data contains a wealth of semantic information, which can reflect the types, purposes, and sentiments of human activity within a specific area [46]. In this paper, we integrated the embedding learning model Doc2vec and the topic model LDA (Latent Dirichlet Allocation) to propose the LDA-Doc2Vec model (Figure 4). Our model combines potential topic features and contextual features to extract the active semantic features of the texts.
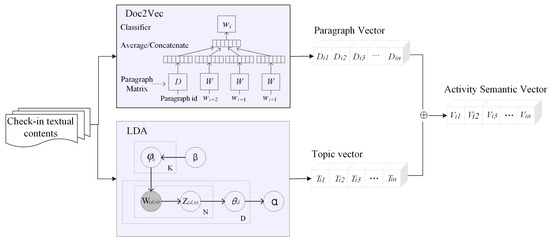
Figure 4.
Framework of the proposed LDA-Doc2Vec model.
First, we pre-processed the textual contents using the following steps: (1) Removed hashtags, emojis, @usernames, hyperlinks, and special characters in the texts. (2) Deleted records with empty content and records that do not contain Chinese characters. (3) Segmented the text and removed the stop words.
The LDA model is a three-layer Bayesian probability model, which is widely used to discover potential topic features. The core idea of LDA is that documents can be represented as joint probability distributions over latent topics, and each topic is characterized by a distribution over words. Suppose that document corpus has topics and words associated with them, and are document-topic and topic-word prior parameters, respectively, and follow a Dirichlet distribution. The joint probability distribution is denoted as follows:
where denotes the polynomial distribution of topics in the -th document, denotes the polynomial distribution of words under the theme k, denotes the topic of the -th word in the -th document, and denotes the -th word in the -th document. We use Gibbs sampling to train the model.
In this paper, each TAZ is considered as a document, and the words in the tweets are used as words in the document. The latent topic semantics contained in each TAZ can be obtained through LDA. However, the LDA model adopts the bag-of-words approach, which does not take into account the ordering of the words and loses local semantic information. Therefore, we further introduced the Doc2Vec model, which extends Word2Vec by incorporating paragraph vectors into the learning task of the neural network.
The Doc2Vec model pays more attention to the logical relationship between contexts. We use the Distributed Memory Model of Paragraph Vectors (PV-DM) model to train Doc2Vec to get the feature representation of each TAZ from the textual content. In this model, each TAZ is treated as a paragraph and assigned a unique paragraph id and a corresponding paragraph vector (equal to the length of the word vector). The paragraph id and paragraph vector can be regarded as a special word used to capture the topic or the missing information of the paragraph. The context words obtained using the sliding window and the current paragraph vectors are simultaneously fed into the model to predict by maximizing the logarithm likelihood, as in Equation (10).
where is the number of words in the tweets contained in the -th TAZ, is the size of the training window, and is the total number of TAZs.
After obtaining the topic vectors from LDA and the paragraph vectors from Doc2Vec, we sum them to obtain the activity semantic feature of each TAZ.
2.2.4. Weighted Stacking Ensemble Model
After extracting the spatial semantic features, activity temporal features, and activity semantic features of TAZs, the WSE model is built to identify the type of UFZs. Ensemble learning improves performance by combining the contributions of various classifiers, achieving better performance than a single model. The baseline Stacking Ensemble (SE) model consists of two layers, the first layer is the base classifier, which can consist of two or more identical or different classifiers. The second layer is the meta-classifier. First, the original dataset is used to train the base classifier. Then, the outputs of the base classifier are fed into the meta-classifier to make the final prediction. The SE model has a stronger generalization ability and can reduce the variance in the prediction. However, the model does not take into account the performance differences between each model. In order to extract more information and fully utilize the advantages of each classifier, we proposed the WSE model. This model assigns weight factors to the meta-classifier based on the classification accuracy of the base classifiers. The basic framework of the WSE model is illustrated in Figure 5.
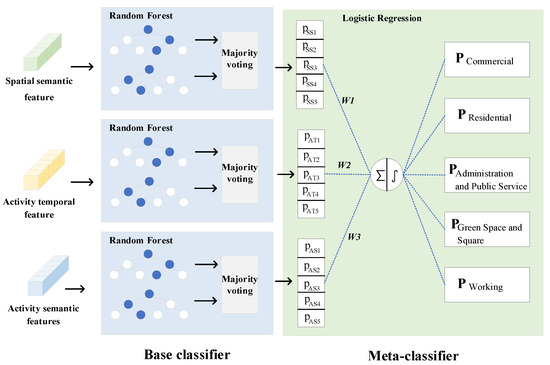
Figure 5.
Illustration of the proposed weighted stacking ensemble model.
The base classifier consists of three random forest (RF) models with three different input features, and the models use a k-fold cross-validation method to avoid overfitting the data. Taking the first base classifier as an example, each cross-validation will randomly divide the training dataset into sub-datasets, denoted as , where is used as the test data, and the remaining sub-datasets are used as the training data to train the RF model. The accuracy of the test data is denoted as . The weighting factors are calculated according to Equation (11):
A higher weighting factor indicates a better-performing model, and it also means the model has a more significant impact on the final result. The three base classifiers in this paper input spatial semantic features, activity temporal features, and activity semantic features, respectively, and output the forecasting results , , and , where , , and denote the probability of the -th function type, respectively. The weighting factors are combined with the prediction results, normalized, and then fed into the meta-classifier. The meta-learner, using logistic regression, is trained to produce the final probabilities of each TAZ belonging to different functional types.
3. Results
We extracted 20% of the TAZs in our study area to train the WSE model and evaluate the results. Sample selection and labeling have a great impact on the UFZs identification results. The annotation method follows Zhang et al. [28] and is further validated using the EULUC-China map [54], remote sensing imagery, and electronic maps.
3.1. Results of the Proposed Method
3.1.1. Visualization of Human Activity Features
The method proposed in this paper extracted three features: spatial semantic features, activity time features, and activity semantic features. In the Place2Vec model, the k of the nearest neighbor method is set to 150, the length of the feature vector is set to 70, the number of negative samples is set to 5, and the minimum word frequency is set to 1. For the LDA-Doc2Vec model, the number of topics is set to 50, the vector size is set to 50, the context window size is set to 2, the minimum word frequency is set to 2, and the number of training parallels is set to 4. We used t-SNE [55] to downscale the three feature vectors and project them into the 2D plane. The results are shown in Figure 6, where some typical locations within the Fifth Ring Road of Beijing are labeled (see Figure 1 for the abbreviations of the places).
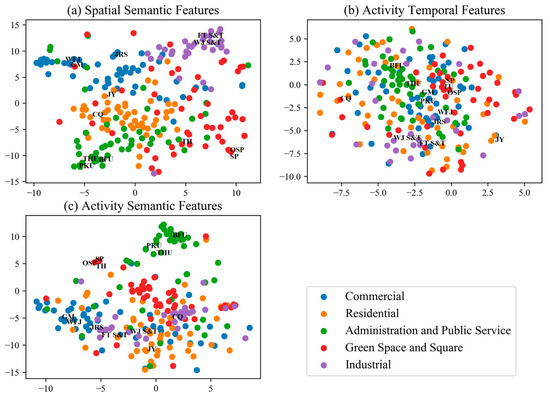
Figure 6.
Dimensionality reduction of feature vectors using t-SNE: (a) spatial semantic features, (b) activity temporal features, (c) activity semantic features.
It can be seen from Figure 6 that TAZs with the same functional type are clustered in the vector space, and different features have different distribution characteristics in the 2D plane. The spatial semantic features of commercial areas, residential areas, industrial areas, and administration and public service areas show an aggregated distribution (Figure 6a), indicating that the spatial units with the same functional type have similar spatial distribution characteristics. The activity temporal features extracted in this paper (Figure 6b) are relatively dispersed in the vector space. However, the distances between typical locations of the same functional type are quite close, indicating a mixing of functions within the TAZ. This finding helps to identify the proportion of functional types in UFZs. The activity semantic features of commercial areas, green space and square, working areas, and administration and public service areas were aggregated into different clusters (Figure 6c). This suggests that activity semantic features are better able to recognize green space and square area compared to spatial semantic features. We speculate that people prefer to post on social media platforms when sightseeing and traveling, which makes this feature more prominent. The results show that the three features extracted in this paper reveal different aspects of the relationship between human activities and urban functions. All the above features are conducive to the identification of UFZs.
3.1.2. Spatial Distribution of Urban Functional Zones
In this section, Figure 7 demonstrates the proportion of five urban functional types and the dominant functional type in each TAZ:
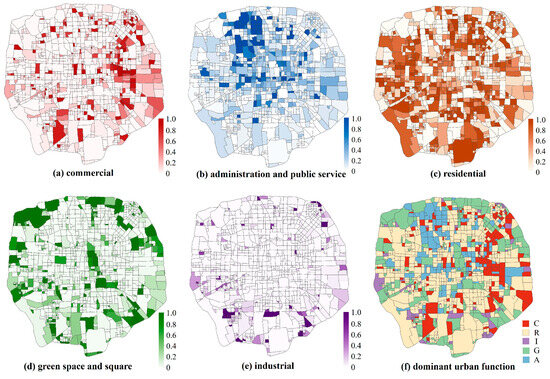
Figure 7.
The proportion of each urban function and the dominant urban function in Beijing’s Fifth Ring Road area, (a) commercial, (b) administration and public service, (c) residential, (d) green space and square, (e) industrial, (f) dominant urban function.
As shown in Figure 7, different types of functions within the Fifth Ring Road of Beijing have different spatial distribution characteristics. Commercial areas include business circles, shopping centers, convenience stores, and comprehensive markets that cater to the daily needs of residents. These areas are mainly located in the eastern part of the study area, as well as in the vicinity of the Third to the Fourth ring roads and the major urban thoroughfares (Figure 7a).
Administration and public service areas reflect the spatial distribution and configuration of public service facilities such as education, healthcare, and government offices. The results indicate that these functions are mainly concentrated in the central and northwestern parts of the study area (Figure 7b). Compared with electronic maps, the northwestern part of the study area is home to several universities and research institutions, including the prestigious Peking University, Tsinghua University, and the Chinese Academy of Sciences. Meanwhile, the central area of the study region mainly houses national administrative institutions. According to the “Beijing Urban Master Plan (2016–2035)”, the center of the study areas is the core zone for the capital, serving as the heart of the nation’s political, cultural, and international exchanges. This aligns with the findings of our research.
Residential areas comprise the largest proportion of the study area (see Figure 7c). It displays a distribution pattern that radiates outward from the center. Within the Second Ring Road, residential areas are relatively sparse, and these areas are often surrounded by facilities such as supermarkets and hospitals.
Green space and square areas, including recreational zones such as scenic spots and parks, are mainly situated on the outskirts of the study area.
Industrial areas, which include buildings like companies, industrial parks, and factories, are primarily located on the boundaries of the study area, beyond the Fourth Ring Road and far from the city center. This distribution pattern is closely related to Beijing’s urban planning. This spatial arrangement helps reduce the impact of industrial pollution on the environment and noise on human life, while also lowering the cost of production.
In summary, within the study area, only a few TAZs serve a single function. Most zones exhibit a mixed-use pattern. Among these, functional zones dominated by residential functions are the most numerous, while those dominated by industrial functions have the lowest number. The Dongcheng District, Xicheng District, and Haidian District mainly focus on administration and public service functions. Chaoyang District mainly focuses on commercial functions and industrial functions are mainly distributed in Fengtai District.
3.2. Validation and Comparison
3.2.1. Different Data Combinations
We first compared the classification accuracy of different data combinations. Based on different data sources, we divided them into three combinations: (I) POI data (spatial semantic feature, SSF); (II) check-in data (activity temporal feature and activity semantic feature, ATF+ASF); (III) POI + check-in data (SSF+ATF+ASF). We used 70% of the sample for training, with the remaining 30% used for testing. The decision trees of the RF model were set to 100.
Table 2 presents the confusion matrices for different data combinations. POI data performed best at classifying residential and commercial areas, while check-in data were most effective for recognizing green spaces and square areas. This indicates that POI data and social media check-in data can reveal dynamic human activity characteristics from different perspectives. When combined with POI data and social media check-in data, the model’s recognition capability was improved.
Table 2.
Confusion matrices when using different data combinations.
Table 3 presents the overall accuracy and kappa coefficients. In this section, each model was run 100 times, and we took the average value as the final result. As shown in this table, the overall accuracy (OA) using our method was 81.24%, which was 4.35% higher than with POI data alone and 21.13% higher than with check-in data alone. The results indicate that combining spatial semantic features obtained from POI data with activity temporal features and activity semantic features obtained from social media check-in data can improve classification accuracy.
Table 3.
Classification results when using different data combinations.
3.2.2. Different Classification Models
For comparison, we selected three commonly used classifiers (RF, SVM, and XGBoost) and compared them with the SE and WSE models to evaluate their performance in the UFZ recognition task. We use 70% of the sample for training, with the remaining 30% used for testing. The decision trees of the RF model were set to 100, while for the WSE model, the decision trees of the base classifier were set to 100. SVM used the linear kernel. A 5-fold cross-validation method was used to avoid data overfitting. To ensure the reliability of the results, each model was repeated 100 times. The other parameters were set to their default values.
The overall accuracy (OA) and kappa coefficients are shown in Table 4. The comparison of the results shows that the WSE classifier with multi-source data achieved the best performance for UFZ classification. Among the traditional single classifiers, RF yielded the best classification results. The performance of the ensemble classifiers outperformed that of the single classifiers. The classification accuracy of SE in the table is slightly lower than that of WSE, but it outperforms other single classifiers. Additionally, the Kappa value of the method presented in this paper was the highest, indicating that the model has good consistency.
Table 4.
Classification results when using different data combinations and different classification models.
Figure 8 displays the confusion matrices of three different models. The confusion matrices provide a more detailed view of the classification results. The deeper the color of the diagonal cells and the lighter the color of the off-diagonal cells, the more accurate the predictions and the higher the model’s accuracy. As shown in Figure 8, the number of misclassified TAZs decreases when using the WSE.
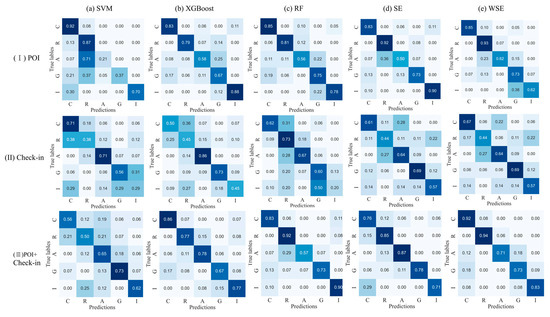
Figure 8.
Confusion matrices of classification results of three different models (a) SVM; (b) XGBoost; (c) RF; (d) SE; and (e) WSE.
Overall, our approach introduces a new framework for identifying UFZs. The complementary strengths of the data and classifier can provide valuable insights into revealing the relationship between dynamic human activities and urban functions.
To evaluate the accuracy of the proportion results, we manually tagged some TAZ functional proportions as references, similar to Zhang et al. [28], and compared them with the results from our method. As shown in Figure 9, *p represents the model prediction results for the zone, and *t represents the manually interpreted results.
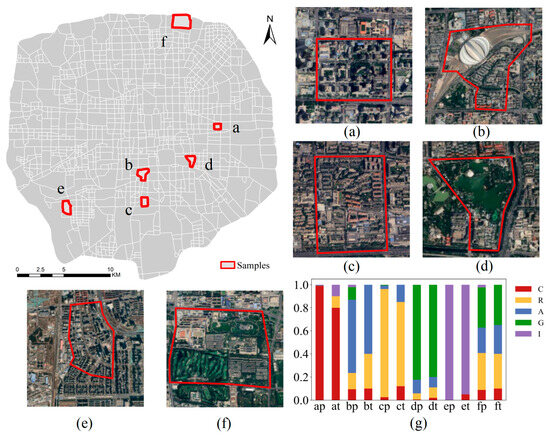
Figure 9.
Satellite images and the proportion of urban functions in six sample TAZs. (a–f) Satellite images (from Google Earth) of zones (a–f). (g)The proportions of five urban functional types in these six regions.
The results indicate that the method presented in this paper not only identifies the dominant urban function but also reflects the proportions of urban functional types. Moreover, it performs well in handling various combinations of functional types.
3.3. Spatial Patterns of the Urban Functional Zones
The location quotient (LQ) is used to evaluate specialization in each geographic area. In this study, the LQ is calculated to reflect the development status of each function type and the spatial structure of UFZs can be analyzed. The LQ is calculated by Equation (12).
where denotes the LQ of function in region , is the area of function in region , is the total area of region , is the total area of function in the entire study area, and is the total area of the study area. By calculating LQ, it becomes clear which functions dominate within a specific area and can reflect the degree of function composite. A higher LQ value indicates greater concentration of the function and stronger development advantages. In general, when , the dominance of function is below the average level in region . When , function is above the average level in region . When , function has a strong advantage and is dominant in region .
We calculated the LQ of each ring road in Beijing according to Equation (12), as shown in Table 5. The five different function types show different superiorities in the study area. Inside the Second Ring Road, administration and public service areas, as well as green spaces and squares, are the dominant functions, which is consistent with the results found in Figure 7. We believe that this is due to the presence of numerous historical and cultural attractions and central administrative institutions inside the Second Ring Road. It is worth noting that there are no industrial functions within the Second Ring Road. Compared to the Second Ring Road, the superiority of commercial and residential functions gradually increases in the Third Ring Road area. While administration and public service remain the primary function, the superiority of green space and squares weakens. Within the Fourth Ring Road, commercial functions are the most dominant, while the superiority of other functions diminishes. Within the Fifth Ring Road, all functions, except for industrial, show relatively weak LQ. According to the results, between the Second and Third ring roads, three functions show high superiority. This indicates a high degree of functional completeness in this area.
Table 5.
Location quotient based on the ring roads.
Figure 10 shows the spatial distributions of LQs for each ring road. Commercial function exhibits significant superiority within the Second to Fourth ring roads, with a particularly strong presence between the Third and Fourth ring roads. Administration and public service areas are prominent within the Third Ring Road. The LQ of residential areas is relatively uniform, with the weakest superiority inside the Second Ring Road. Green spaces and squares show high superiority inside the Second and Fourth–Fifth ring roads. Industrial areas show a low level of LQ within the Fourth ring, with their superiority gradually increasing from the inner to the outer rings.
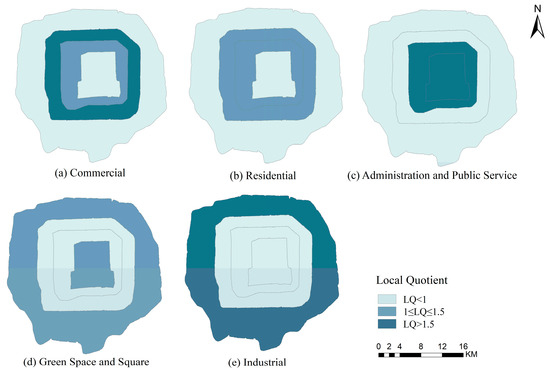
Figure 10.
The spatial distribution of LQ for each ring road, (a) commercial, (b) residential, (c) administration and public service, (d) green space and square, (e) industrial.
3.4. Degree of Urban Functional Mix
We use Shannon entropy as the mixing index to quantitatively assess the degree of mixing in TAZs, thus validating the accuracy of the proportion of urban functional types. A higher index value indicates a higher degree of mixing and a wider variety of functions within a TAZ, while a lower value suggests a more homogeneous urban functional zone. The Shannon entropy index effectively reflects the complexity and diversity of a TAZ. It is calculated using Equation (13):
where denotes the number of function types in this study and indicates the probability that the TAZ is labeled as the -th function type. The Shannon index in each TAZ is shown in Figure 11:
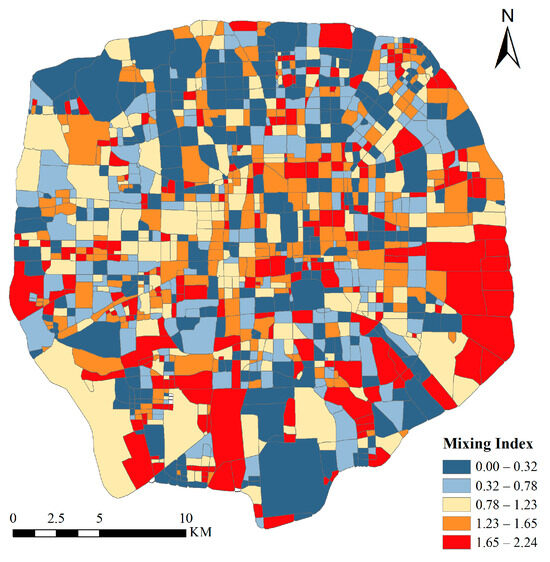
Figure 11.
The spatial distribution of mixing index.
After calculation, the average mixing index within the fifth ring road of Beijing is 0.96, with approximately 52.19% of UFZs having a mixing index higher than this value. The results indicate that more than half of the functional zones within the study area have a high degree of functional diversity. Areas with a low mixing index are mainly concentrated in the administration and public service areas, as well as some green spaces and squares. TAZs with a relatively high mixing index are mainly commercial areas and residential areas. Some administrative and public service areas located near residential areas also have a high mixing index.
To reveal the spatial distribution patterns of the degree of urban functional mixing, we calculated the functional mixing index based on each ring road. The results are shown in Table 6.
Table 6.
Mixing index statistics based on the ring road.
From the statistical results, there is no significant difference in the degree of mixing in the regions divided by ring roads. We believe that the city’s infrastructure is well-developed, with a well-organized distribution of economic, cultural, educational, and other facilities.
The average mixing index is highest inside the Second Ring Road. Apart from the highly intensive land use in the city center, this can be attributed to the unique historical and cultural background of Beijing’s old city areas. Within the Second Ring Road, there are many hutongs, which are a distinctive feature of Beijing’s cultural heritage. A hutong is not only a major place for residents to live, but also a popular tourist attraction. Therefore, multiple functions coexist in the same TAZ, resulting in a higher mixing index. Additionally, we can find that as the distance between the ring road and the city center grows, the variance of the mixing index gradually widens. This suggests that the farther from the city center, the greater the differences in functional structures within the ring roads. Some studies have pointed out that combining different types of infrastructures in appropriate proportions within a TAZ can provide residents with more diverse urban services; this not only accommodates large populations but also demonstrates significant urban vitality.
4. Discussion
The analyses above suggest that the data-synthesis-driven approach proposed in this paper is effective for gaining a comprehensive understanding of UFZs. Compared to the research of Zhang et al. [28], Srivastava et al. [14], and Barlacchi et al. [37], we incorporate dynamic human activity features, offering a more enriched perspective for the identification of UFZs. POI data alone may overlook the dynamic features of human activities, leading to inaccurate classification results, whereas check-in data can effectively compensate for this limitation. The WSE classification model used in the classification addresses the limitations of previous studies [7,29,46], leading to more accurate recognition results. This improvement is mainly driven by two key factors. First, unlike previous studies that concatenated the obtained feature vectors and directly input them into classifiers, the WSE model integrates the contributions of different features through an ensemble learning approach. Second, the model’s weight factors allow more weight to be assigned to base classifiers with higher accuracy, ensuring that well-performing classifiers contribute more to the final result. Our analysis, based on the identification results, deepens our understanding of the urban functional pattern. Research by Monteiro et al. suggests that urban development may deviate from the original plan. Therefore, our approach provides a foundation for perceiving the actual functional structure. Furthermore, our analysis has confirmed the existence of imbalances in urban development.
In the recognition results, some TAZs were still misclassified. We summarized and analyzed the reasons for misclassification, and Figure 12 shows four common types of errors that occurred in most cases.
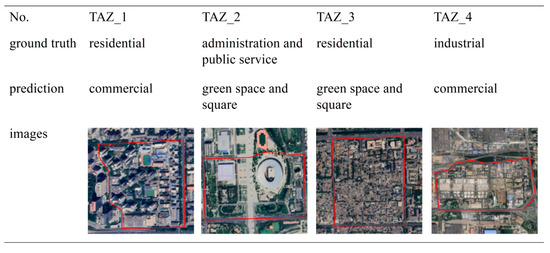
Figure 12.
Typical misclassification TAZs produced by our method.
The misclassification of TAZ_1 is attributed to the imbalance in the proportion and spatial distribution of different types of POIs. The center of TAZ_1 is a residential area, surrounded by schools and some commercial facilities. It is evident that residential uses occupy the largest area and serve as the dominant function of this TAZ. However, the presence of a significant proportion of commercial-related POIs (e.g., stores and restaurants) skews the identification results towards commercial areas.
The misclassification of TAZ_2 is due to the discrepancy between its actual function and planned function. This area hosts the “Bird’s Nest” and the “Water Cube”, which are venues for the Beijing Olympics Games and fall under the public service functional type. Nowadays, this site is frequently visited by tourists as a popular attraction. From a human activity perspective, it serves a recreational function and is recognized as a green space and square in this study. This indicates that the method proposed in this paper offers insights into recognizing urban functions and effectively reflects how humans actually utilize urban areas.
The reason for the misclassification of TAZ_3 is similar to TAZ_1 and is attributed to an imbalance in check-in frequencies. TAZ_3 encompasses both residential areas and historical and cultural attractions. As found in Section 3.1.1, people tend to share content on social media platforms while traveling. Therefore, this area was incorrectly classified as a green space and a square area.
We believe that the classification error of TAZ_4 is due to the ambiguity between functional types, as this area contains multiple facilities, such as industrial parks and wastewater treatment plants. However, our method identified the dominant function as commercial areas. Analysis of the data revealed that in the northeastern part of this area, several companies are primarily engaged in commercial and office activities. We speculate that our method may still have some limitations in distinguishing between industrial functions and commercial functions, which has led to TAZ_4 being recognized as a commercial area.
These examples reflect problems that occurred in the majority of cases, and understanding these potential causes is crucial for improving the model’s performance. It should be noted that the reasons for misclassification are not limited to this. The accuracy of classification may also be influenced by factors such as data quality, feature selection, or the inherent similarities between certain UFZ types.
In addition, another limitation is the selection and annotation of the samples. We invited three experts to annotate the functions of the regions, and the highest-scoring types were used as the final annotations. However, the results of manual annotation may be influenced by the subjective bias of the annotators. Finally, this study categorized UFZs into five types. However, residents have more specific uses of urban space. Therefore, we could consider dividing urban zones into finer granularity and utilizing additional reliable data sources to achieve a more detailed identification of UFZs.
5. Conclusions
In this study, we proposed a data-synthesis-driven approach that integrated human activity data to infer UFZs. We divided spatial analysis units based on road networks to achieve a fine-grained identification of UFZs. Spatial semantic features, activity temporal features, and activity dynamic features were comprehensively and deeply mined by our method. Then, a weighted stacked ensemble model was built to identify the dominant function and the proportions of urban functional types of each TAZ. We chose the area within the Fifth Ring Road of Beijing for our case study. The research results indicate that our proposed method extracted both dynamic and static human activity information from large-scale geographic spatial data, contributing to a better understanding of urban spatial structures. The calculation of the Shannon entropy index and location quotient revealed how people utilize different administrative districts and ring roads in Beijing. Our results can provide valuable insights for urban planning and management, helping to formulate better urban development strategies.
In future work, improvements can be made in the following aspects: Firstly, in areas with limited human activity, POI data and social media check-in data may not capture enough characteristic information. Therefore, further research can be conducted by considering additional sources, such as mobile phone trajectory data, to extract more accurate and comprehensive human activity patterns. Secondly, the scope of the study can be expanded by selecting study areas of different city sizes and different socio-economic levels for comparison to reveal differences in the function of spatial structures in different cities.
Author Contributions
Conceptualization, X.L.; methodology, X.L.; software, X.L.; validation, X.L., Y.S. and L.Y.; formal analysis, X.L.; investigation, X.L.; resources, X.L.; data curation, X.L.; writing—original draft preparation, X.L.; writing—review and editing, X.L., Y.S. and L.Y.; visualization, X.L.; supervision, Y.S.; funding acquisition, Y.S. All authors have read and agreed to the published version of the manuscript.
Funding
This research was funded by the National Natural Science Foundation of China, grant number 42471463.
Data Availability Statement
The OpenStreetMap data can be obtained from https://www.openstreetmap.org, accessed on 23 November 2022. The EULUC-China map data can be obtained from https://data-starcloud.pcl.ac.cn/zh, accessed on 23 November 2022. The check-in data and POI data are available from the corresponding author upon reasonable request.
Conflicts of Interest
The authors declare no conflicts of interest.
Abbreviations
The following abbreviations are used in this manuscript:
| UFZs | Urban functional zones |
| TAZ | Traffic analysis zone |
| LDA | Latent Dirichlet Allocation |
| SE | Stacking ensemble |
| WSE | Weighted stacking ensemble |
| POI | Point-of-interest |
References
- Pacione, M. Urban Geography: A Global Perspective; Routledge: London, UK, 2009. [Google Scholar]
- Johansson, B. Location attributes and dynamics of job location. Doboku Gakkai Ronbunshu 1996, 1996, 1–15. [Google Scholar] [CrossRef]
- Deng, J.S.; Wang, K.; Hong, Y.; Qi, J.G. Spatio-temporal dynamics and evolution of land use change and landscape pattern in response to rapid urbanization. Landsc. Urban Plan. 2009, 92, 187–198. [Google Scholar] [CrossRef]
- Crooks, A.; Pfoser, D.; Jenkins, A.; Croitoru, A.; Stefanidis, A.; Smith, D.; Karagiorgou, S.; Efentakis, A.; Lamprianidis, G. Crowdsourcing urban form and function. Int. J. Geogr. Inf. Sci. 2015, 29, 720–741. [Google Scholar] [CrossRef]
- Tu, W.; Cao, J.; Yue, Y.; Shaw, S.-L.; Zhou, M.; Wang, Z.; Chang, X.; Xu, Y.; Li, Q. Coupling mobile phone and social media data: A new approach to understanding urban functions and diurnal patterns. Int. J. Geogr. Inf. Sci. 2017, 31, 2331–2358. [Google Scholar] [CrossRef]
- Burton, E.; Jenks, M.; Williams, K. The Compact City: A Sustainable Urban Form? Routledge: London, UK, 2003. [Google Scholar]
- Gao, S.; Janowicz, K.; Couclelis, H. Extracting urban functional regions from points of interest and human activities on location-based social networks. Trans. GIS 2017, 21, 446–467. [Google Scholar] [CrossRef]
- Janowicz, K. Observation-driven geo-ontology engineering. Trans. GIS 2012, 16, 351–374. [Google Scholar] [CrossRef]
- Huang, Z.; Qi, H.; Kang, C.; Su, Y.; Liu, Y. An ensemble learning approach for urban land use mapping based on remote sensing imagery and social sensing data. Remote Sens. 2020, 12, 3254. [Google Scholar] [CrossRef]
- Li, X.; Li, W.; Middel, A.; Harlan, S.L.; Brazel, A.J.; Turner, B. Remote sensing of the surface urban heat island and land architecture in Phoenix, Arizona: Combined effects of land composition and configuration and cadastral–demographic–economic factors. Remote Sens. Environ. 2016, 174, 233–243. [Google Scholar] [CrossRef]
- Yammine, S.Z.; Liu, C.; Jarreau, P.B.; Coe, I.R. Social media for social change in science. Science 2018, 360, 162–163. [Google Scholar] [CrossRef]
- Cheng, G.; Han, J.; Lu, X. Remote sensing image scene classification: Benchmark and state of the art. Proc. IEEE 2017, 105, 1865–1883. [Google Scholar] [CrossRef]
- Li, M.; Stein, A.; Bijker, W.; Zhan, Q. Urban land use extraction from Very High Resolution remote sensing imagery using a Bayesian network. ISPRS J. Photogramm. Remote Sens. 2016, 122, 192–205. [Google Scholar] [CrossRef]
- Srivastava, S.; Vargas Munoz, J.E.; Lobry, S.; Tuia, D. Fine-grained landuse characterization using ground-based pictures: A deep learning solution based on globally available data. Int. J. Geogr. Inf. Sci. 2020, 34, 1117–1136. [Google Scholar] [CrossRef]
- Guzder-Williams, B.; Mackres, E.; Angel, S.; Blei, A.M.; Lamson-Hall, P. Intra-urban land use maps for a global sample of cities from Sentinel-2 satellite imagery and computer vision. Comput. Environ. Urban Syst. 2023, 100, 101917. [Google Scholar] [CrossRef]
- Yang, Y.; Newsam, S. Bag-of-Visual-Words and Spatial Extensions for Land-Use Classification. In Proceedings of the 18th SIGSPATIAL International Conference on Advances in Geographic Information Systems, San Jose, CA, USA, 2–5 November 2010; pp. 270–279. [Google Scholar]
- Zhang, X.; Du, S.; Wang, Q. Integrating bottom-up classification and top-down feedback for improving urban land-cover and functional-zone mapping. Remote Sens. Environ. 2018, 212, 231–248. [Google Scholar] [CrossRef]
- Zhao, L.; Tang, P.; Huo, L. A 2-D wavelet decomposition-based bag-of-visual-words model for land-use scene classification. Int. J. Remote Sens. 2014, 35, 2296–2310. [Google Scholar] [CrossRef]
- Steiniger, S.; Lange, T.; Burghardt, D.; Weibel, R. An approach for the classification of urban building structures based on discriminant analysis techniques. Trans. GIS 2008, 12, 31–59. [Google Scholar] [CrossRef]
- Jochem, W.C.; Leasure, D.R.; Pannell, O.; Chamberlain, H.R.; Jones, P.; Tatem, A.J. Classifying settlement types from multi-scale spatial patterns of building footprints. Environ. Plan. B Urban Anal. City Sci. 2021, 48, 1161–1179. [Google Scholar] [CrossRef]
- Pei, T.; Sobolevsky, S.; Ratti, C.; Shaw, S.-L.; Li, T.; Zhou, C. A new insight into land use classification based on aggregated mobile phone data. Int. J. Geogr. Inf. Sci. 2014, 28, 1988–2007. [Google Scholar] [CrossRef]
- Zhai, W.; Bai, X.; Shi, Y.; Han, Y.; Peng, Z.-R.; Gu, C. Beyond Word2vec: An approach for urban functional region extraction and identification by combining Place2vec and POIs. Comput. Environ. Urban Syst. 2019, 74, 1–12. [Google Scholar] [CrossRef]
- Cui, H.; Wu, L.; Hu, S.; Lu, R.; Wang, S. Recognition of urban functions and mixed use based on residents’ movement and topic generation model: The case of Wuhan, China. Remote Sens. 2020, 12, 2889. [Google Scholar] [CrossRef]
- Yang, M.; Kong, B.; Dang, R.; Yan, X. Classifying urban functional regions by integrating buildings and points-of-interest using a stacking ensemble method. Int. J. Appl. Earth Obs. Geoinf. 2022, 108, 102753. [Google Scholar] [CrossRef]
- Huang, W.; Cui, L.; Chen, M.; Zhang, D.; Yao, Y. Estimating urban functional distributions with semantics preserved POI embedding. Int. J. Geogr. Inf. Sci. 2022, 36, 1905–1930. [Google Scholar] [CrossRef]
- Zhong, C.; Huang, X.; Arisona, S.M.; Schmitt, G.; Batty, M. Inferring building functions from a probabilistic model using public transportation data. Comput. Environ. Urban Syst. 2014, 48, 124–137. [Google Scholar] [CrossRef]
- Yao, Y.; Li, X.; Liu, X.; Liu, P.; Liang, Z.; Zhang, J.; Mai, K. Sensing spatial distribution of urban land use by integrating points-of-interest and Google Word2Vec model. Int. J. Geogr. Inf. Sci. 2017, 31, 825–848. [Google Scholar] [CrossRef]
- Zhang, J.; Li, X.; Yao, Y.; Hong, Y.; He, J.; Jiang, Z.; Sun, J. The Traj2Vec model to quantify residents’ spatial trajectories and estimate the proportions of urban land-use types. Int. J. Geogr. Inf. Sci. 2021, 35, 193–211. [Google Scholar] [CrossRef]
- Du, Z.; Zhang, X.; Li, W.; Zhang, F.; Liu, R. A multi-modal transportation data-driven approach to identify urban functional zones: An exploration based on Hangzhou City, China. Trans. GIS 2020, 24, 123–141. [Google Scholar] [CrossRef]
- Hu, S.; Gao, S.; Wu, L.; Xu, Y.; Zhang, Z.; Cui, H.; Gong, X. Urban function classification at road segment level using taxi trajectory data: A graph convolutional neural network approach. Comput. Environ. Urban Syst. 2021, 87, 101619. [Google Scholar] [CrossRef]
- Liu, H.; Xu, Y.; Tang, J.; Deng, M.; Huang, J.; Yang, W.; Wu, F. Recognizing urban functional zones by a hierarchical fusion method considering landscape features and human activities. Trans. GIS 2020, 24, 1359–1381. [Google Scholar] [CrossRef]
- Cranshaw, J.; Schwartz, R.; Hong, J.; Sadeh, N. The Livehoods Project: Utilizing Social Media to Understand the Dynamics of a City. In Proceedings of the International AAAI Conference on Web and Social Media, Dublin, Ireland, 4–7 June 2012; pp. 58–65. [Google Scholar]
- Wu, L.; Cheng, X.; Kang, C.; Zhu, D.; Huang, Z.; Liu, Y. A framework for mixed-use decomposition based on temporal activity signatures extracted from big geo-data. Int. J. Digit. Earth 2020, 13, 708–726. [Google Scholar] [CrossRef]
- Soto, V.; Frías-Martínez, E. Automated Land Use Identification Using Cell-Phone Records. In Proceedings of the 3rd ACM International Workshop on MobiArch, Washington, DC, USA, 28 June 2011; pp. 17–22. [Google Scholar]
- Becker, R.A.; Caceres, R.; Hanson, K.; Loh, J.M.; Urbanek, S.; Varshavsky, A.; Volinsky, C. A tale of one city: Using cellular network data for urban planning. IEEE Pervasive Comput. 2011, 10, 18–26. [Google Scholar] [CrossRef]
- Frias-Martinez, V.; Frias-Martinez, E. Spectral clustering for sensing urban land use using Twitter activity. Eng. Appl. Artif. Intell. 2014, 35, 237–245. [Google Scholar] [CrossRef]
- Barlacchi, G.; Lepri, B.; Moschitti, A. Land use classification with point of interests and structural patterns. IEEE Trans. Knowl. Data Eng. 2020, 33, 3258–3269. [Google Scholar] [CrossRef]
- Niu, H.; Silva, E.A. Delineating urban functional use from points of interest data with neural network embedding: A case study in Greater London. Comput. Environ. Urban Syst. 2021, 88, 101651. [Google Scholar] [CrossRef]
- Han, H.; Yu, X.; Long, Y. Discovering functional zones using bus smart card data and points of interest in beijing. arXiv 2015, arXiv:1503.03131. [Google Scholar]
- Feng, Y.; Huang, Z.; Wang, Y.; Wan, L.; Liu, Y.; Zhang, Y.; Shan, X. An SOE-based learning framework using multisource big data for identifying urban functional zones. IEEE J. Sel. Top. Appl. Earth Obs. Remote Sens. 2021, 14, 7336–7348. [Google Scholar] [CrossRef]
- Ye, C.; Zhang, F.; Mu, L.; Gao, Y.; Liu, Y. Urban function recognition by integrating social media and street-level imagery. Environ. Plan. B Urban Anal. City Sci. 2021, 48, 1430–1444. [Google Scholar] [CrossRef]
- Jendryke, M.; Balz, T.; McClure, S.C.; Liao, M. Putting people in the picture: Combining big location-based social media data and remote sensing imagery for enhanced contextual urban information in Shanghai. Comput. Environ. Urban Syst. 2017, 62, 99–112. [Google Scholar] [CrossRef]
- Thakur, G.; Sims, K.; Mao, H.; Piburn, J.; Sparks, K.; Urban, M.; Stewart, R.; Weber, E.; Bhaduri, B. Utilizing Geo-Located Sensors and Social Media for Studying Population Dynamics and Land Classification. Human Dynamics Research in Smart and Connected Communities; Springer: Berlin/Heidelberg, Germany, 2018; pp. 13–40. [Google Scholar]
- Calabrese, F.; Ferrari, L.; Blondel, V.D. Urban sensing using mobile phone network data: A survey of research. ACM Comput. Surv. 2014, 47, 1–20. [Google Scholar] [CrossRef]
- Steiger, E.; De Albuquerque, J.P.; Zipf, A. An advanced systematic literature review on spatiotemporal analyses of t witter data. Trans. GIS 2015, 19, 809–834. [Google Scholar] [CrossRef]
- Hu, J.; Gao, Y.; Wang, X.; Liu, Y. Recognizing mixed urban functions from human activities using representation learning methods. Int. J. Digit. Earth 2023, 16, 289–307. [Google Scholar] [CrossRef]
- Yuan, J.; Zheng, Y.; Xie, X. Discovering Regions of Different Functions in a City Using Human Mobility and POIs. In Proceedings of the 18th ACM SIGKDD International Conference on Knowledge Discovery and Data Mining, Beijing, China, 12–16 August 2012; pp. 186–194. [Google Scholar]
- GB 50137-2011; Code for Classification of Urban Land Use and Planning Standards of Development Land. China Planning Press: Beijing, China, 2012.
- Li, W. Random texts exhibit Zipf’s-law-like word frequency distribution. IEEE Trans. Inf. Theory 1992, 38, 1842–1845. [Google Scholar] [CrossRef]
- Yan, B.; Janowicz, K.; Mai, G.; Gao, S. From Itdl to Place2vec: Reasoning about Place Type Similarity and Relatedness by Learning Embeddings from Augmented Spatial Contexts. In Proceedings of the 25th ACM SIGSPATIAL International Conference on Advances in Geographic Information Systems, Los Angeles, CA, USA, 10 November 2017; pp. 1–10. [Google Scholar]
- Liu, Y.; Liu, X.; Gao, S.; Gong, L.; Kang, C.; Zhi, Y.; Chi, G.; Shi, L. Social sensing: A new approach to understanding our socioeconomic environments. Ann. Assoc. Am. Geogr. 2015, 105, 512–530. [Google Scholar] [CrossRef]
- Niu, N.; Liu, X.; Jin, H.; Ye, X.; Liu, Y.; Li, X.; Chen, Y.; Li, S. Integrating multi-source big data to infer building functions. Int. J. Geogr. Inf. Sci. 2017, 31, 1871–1890. [Google Scholar] [CrossRef]
- Qi, G.; Li, X.; Li, S.; Pan, G.; Wang, Z.; Zhang, D. Measuring Social Functions of City Regions from Large-Scale Taxi Behaviors. In Proceedings of the 2011 IEEE International Conference on Pervasive Computing and Communications Workshops (PERCOM Workshops), Seattle, WA, USA, 21–25 March 2011; pp. 384–388. [Google Scholar]
- Gong, P.; Chen, B.; Li, X.; Liu, H.; Wang, J.; Bai, Y.; Chen, J.; Chen, X.; Fang, L.; Feng, S. Mapping essential urban land use categories in China (EULUC-China): Preliminary results for 2018. Sci. Bull. 2020, 65, 182–187. [Google Scholar] [CrossRef]
- van der Maaten, L.; Hinton, G. Visualizing data using t-SNE. J. Mach. Learn. Res. 2008, 9, 2579–2605. [Google Scholar]
Disclaimer/Publisher’s Note: The statements, opinions and data contained in all publications are solely those of the individual author(s) and contributor(s) and not of MDPI and/or the editor(s). MDPI and/or the editor(s) disclaim responsibility for any injury to people or property resulting from any ideas, methods, instructions or products referred to in the content. |
© 2025 by the authors. Licensee MDPI, Basel, Switzerland. This article is an open access article distributed under the terms and conditions of the Creative Commons Attribution (CC BY) license (https://creativecommons.org/licenses/by/4.0/).