Article

Research on the Inversion Method of Dust Retention in Grassland Plant Canopies Based on UAV-Borne Hyperspectral Data

Engineering Research Center of Ministry of Education for Mine Ecological Restoration, China University of Mining and Technology, Xuzhou 221116, China
*
Author to whom correspondence should be addressed.
Land 2025, 14(3), 458; https://doi.org/10.3390/land14030458
Submission received: 6 February 2025 / Revised: 18 February 2025 / Accepted: 21 February 2025 / Published: 23 February 2025

Abstract

:
Monitoring the dust retention content in grassland plants around open-pit coal mines is of significant importance for environmental pollution monitoring and the development of dust control strategies. This paper focuses on the HulunBuir grassland in the Inner Mongolia Autonomous Region, China. UAV-borne hyperspectral data and measured dust retention content in plant canopies are used as data sources. The spectral response characteristics of canopy dust retention are analyzed, and four types of optimized spectral indices are constructed, including the difference index (DI), ratio index (RI), normalized difference index (NDI), and inverse difference index (IDI). The spectral index with the highest absolute value of the correlation coefficient with the canopy dust retention is selected as the feature variable for each spectral index. In addition, machine learning methods such as the partial least squares regression (PLSR), support vector machine (SVM), and random forest (RF) methods are used to develop models for the inversion of canopy dust retention. The results show that as the dust retention content increases, the canopy reflectance in the visible wavelength initially increases and then decreases, while the reflectance in the near-infrared wavelength gradually decreases. The spectral reflectance values at different dust retention levels exhibit significant differences in the 400–420 nm, 579–698 nm, and 714–1000 nm ranges. The four types of spectral indices constructed exhibit high correlations with the canopy dust retention content, and the spectral index with the highest absolute value of the correlation coefficient is composed of near-infrared bands. The dust retention inversion model established using the RF method is more accurate than those established using the PLSR and SVM methods and yields a higher prediction accuracy. The high canopy dust retention areas are mainly distributed within 900 m of the mining area, and the dust retention gradually decreases with distance. In addition, with increasing dust retention, the fractional vegetation cover (FVC) decreases. The results of this study provide a theoretical basis and technical support for monitoring dust retention in grassland plant canopies and for dust control measures.

1. Introduction

Grasslands are the largest terrestrial ecosystems in China [1,2], provide habitats for a wide range of wildlife, and play a crucial role in water conservation, soil protection, and carbon storage. However, with the accelerating pace of industrialization in China, particularly the extraction and utilization of coal resources, grasslands have gradually become one of the country’s key coal energy bases [3,4]. While coal mining serves as an important pillar for economic development by ensuring energy supply and industrial growth, it also causes negative environmental impacts. Mining activities, especially blasting, loading, and transporting, generate substantial amounts of unorganized dust. As the wind disperses this dust, it pollutes the air, soil, and water sources. Additionally, coal combustion and the weathering of soils and rocks release fine particles, further exacerbating dust pollution. These fine particles not only degrade the air quality but also inhibit plant photosynthesis, alter the physicochemical properties of the soil, and even pose serious health risks to the respiratory systems of local residents [5,6,7]. Therefore, effectively monitoring and controlling dust pollution around open-pit coal mines has become a pressing environmental issue. In this context, the dust retention of grassland plants becomes particularly important. Through the structural and physical characteristics of their leaf surfaces, plants can effectively absorb and retain dust from the air, serving as a natural air purification system. The amount of dust retention achieved by plants not only reflects the level of airborne dust pollution in grassland areas but also serves as an important indicator for measuring environmental quality. By monitoring the dust retention content of grassland plants, we can obtain direct information about atmospheric pollution, thereby providing a scientific basis for developing effective dust prevention and control measures.
Currently, research on the use of spectral technology to monitor plant dust retention has focused on two main directions. On one hand, studies have explored the influence of dust retention on spectral reflectance, as well as the relationship between dust retention content and leaf spectral characteristics [8,9,10,11]. On the other hand, scholars have constructed quantitative inversion models for dust retention content [12,13,14,15,16,17]. For instance, Saaroni et al. [18] studied the changes in the spectral characteristics of dust accumulated on tree leaves and paper bags near power plants in Tel Aviv power station before and after the replacement of mineral fuels, confirming that reflectance spectra are an effective tool for monitoring coal smoke pollution. Xiao et al. [19] compared the dust retention contents of different plants in Wuhan against atmospheric particulate pollution and constructed a quantitative remote sensing model for leaf dust retention based on hyperspectral data. Su et al. [20] measured the reflectance of leaves with different dust retention amounts using the ASD FildSpec Handheld spectrometer and studied the influences of dust retention on leaf spectral features, as well as their influence on the model’s prediction accuracy and stability. Kayet et al. [21] used the normalized difference vegetation index (NDVI) to estimate the dust retention content of plant leaves in an open-pit mining area in India, and their results showed that the accuracy achieved using Hyperion data was better than that achieved using Landsat data. Li et al. [22] analyzed the correlations between dust retention on poplar leaves in Beijing and the hyperspectral reflectance, spectral indices, and three boundary parameters and established a model for leaf dust retention estimation based on spectral parameters. Zhu et al. [23] explored the response mechanisms and trade-off strategies of leaf surface spectra and leaf functional traits of Euonymus japonicas under the influence of different dust concentrations and established a dust retention prediction model. Wang et al. [16] analyzed the influence of different dust retention on spectral reflectance and explored the spectral bands that are highly sensitive to dust retention of leaves. The regression model of vegetation index ratio and dust retention in the satellite band was established. Luo et al. [24] analyzed the influence of dust retention on plant spectral characteristics at the leaf scale based on the leaf spectral reflectance curve and partial least squares regression model. Peng et al. [25] studied the effect of foliar dustfall content (FDC) on the hyperspectral characteristics of pear leaves, analyzed the correlation between FDC and reflectance, and established a quantitative inversion model for FDC. Wang et al. [26] analyzed the relationship between the spectral reflectance ratio (Dust/Clean) and the weight of dust-fall, using satellite band reflectance and normalized difference vegetation index (NDVI) to build the dustfall weight regression model.
Although previous methods of dust retention inversion using the ASD spectrometer and satellite hyperspectral image have achieved satisfactory results, the ASD spectrometer can only obtain point-source data, limiting its application in large-scale dust monitoring. Satellite image has a long revisit cycle and lower resolution, which is prone to mixed pixel effects, thereby limiting the accuracy and timeliness of plant dust retention monitoring. In contrast, UAV-borne hyperspectral data, which have a high spatial resolution and short revisit cycle, provide a new solution, allowing for efficient and precise monitoring of plant dust retention in small and medium-sized areas. While the potential of UAV-borne hyperspectral data for plant dust retention monitoring is gradually being recognized, research on using a combination of spectral indices to monitor dust retention on grassland plants remains relatively scarce.
In this study, we focused on the HulunBuir grassland in the Inner Mongolia Autonomous Region, China. Using UAV-borne hyperspectral data and measured canopy dust retention data to analyze the spectral response characteristics of grassland plant dust retention. By constructing four optimized spectral indices, the best spectral index was selected and combined with partial least squares regression (PLSR), support vector machine (SVM), and random forest (RF) algorithms to build a canopy dust retention inversion model. Based on the best model, a spatial distribution map of canopy dust retention was drawn, and the distribution characteristics were analyzed. The results of this study provide an important reference for the development of dust control methods in grassland areas and offer a new technical method for large-scale environmental monitoring and management.

2. Materials and Methods
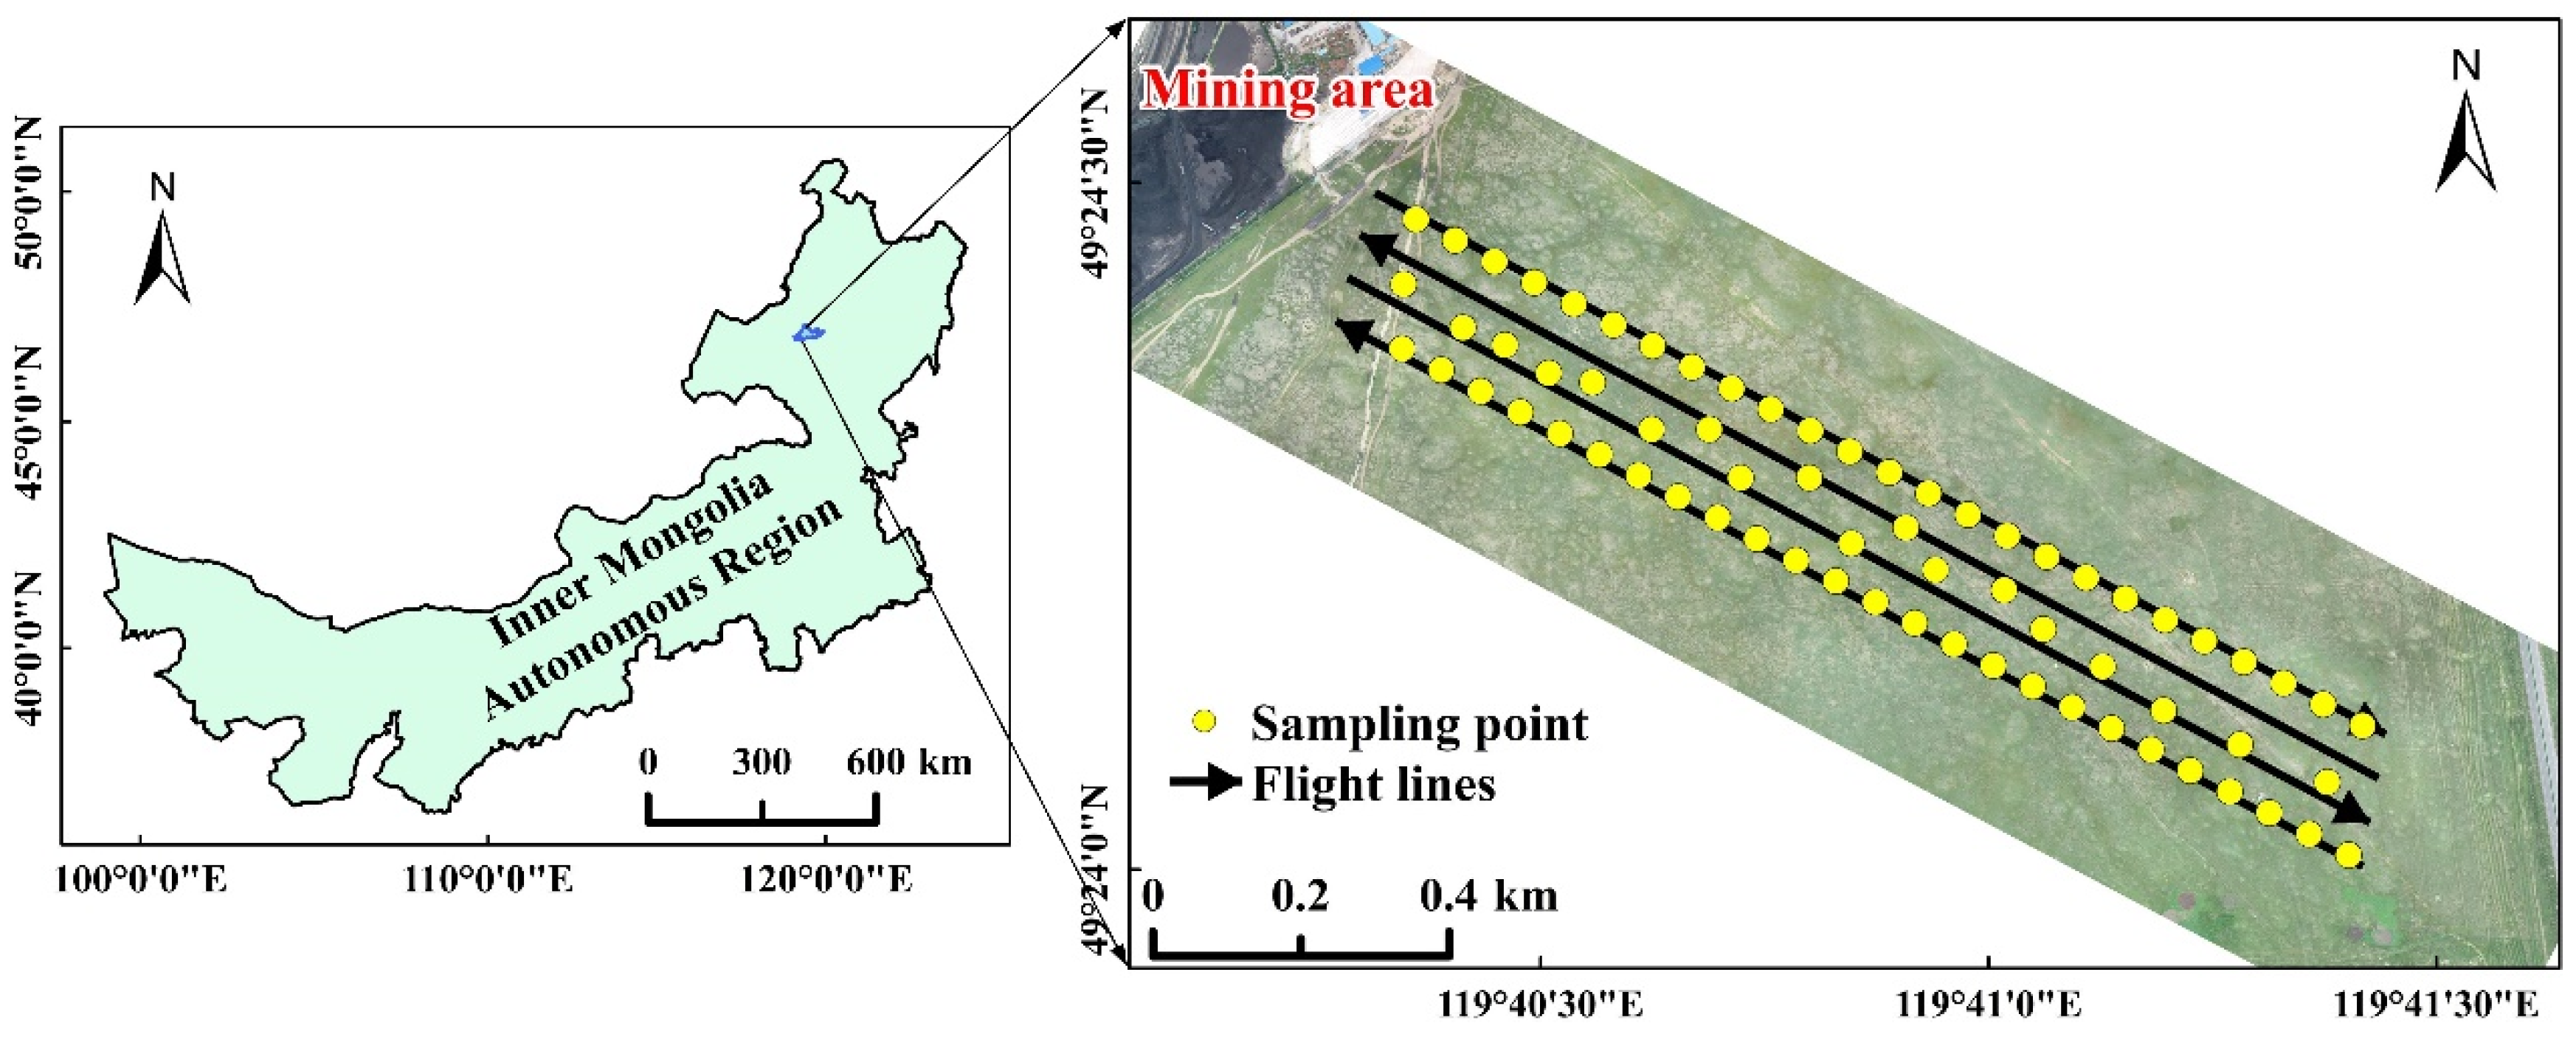
2.1. Study Area

The study area is located in the HulunBuir grassland in the Inner Mongolia Autonomous Region, China (49°24′22″–49°25′37″ N, 119°38′27″–119°40′32″ E), southeast of the Dongming Mine in HulunBuir (Figure 1). The region has a continental subarctic climate with distinct seasons. The climate is dry, with sparse precipitation, abundant sunshine, and large diurnal temperature variations. The area is often affected by Siberian cold air masses, resulting in long, cold winters. The lowest recorded temperature is −42.6 °C, and the highest is 38.8 °C, with an annual average temperature of −0.6 °C. The average annual precipitation is 372 mm, and the average annual evaporation is 1247 mm. The predominant wind direction is northwest, the instantaneous maximum wind speed is 20 m/s, and the annual average wind speed is greater than 3 m/s.

2.2. Dust Retention Content Measurement

In our experiment, a total of 70 vegetation samples were collected. For each sampling point, three healthy, disease-free, and pest-free leaves were selected from the top of the plant. The coordinates of each sampling point were recorded using the real-time kinematic (RTK) technology. The leaves from the same species at each sampling point were sealed in a centrifuge tube. In the laboratory, the following processes were performed on each set of leaves: weighing, dust removal, and leaf area measurement. The mass of the leaves in the centrifuge tube was weighed using an electronic analytic balance (1/10,000 g scale) and recorded as W 1 . After the initial weighing, the dust was carefully removed from the front surface of the leaves using a soft brush, and a second weight was obtained ( W 2 ). The leaf area (cm2) was measured using a leaf area meter (CID Bio-Science, New York, NY, USA) and was recorded as S. The dust retention content (DRC) of the leaves was calculated using Equation (1), and the average dust retention content of all of the leaves at a sampling point was taken as the canopy dust retention content.
D R C g / c m 2 = W 1 W 2 ÷ S × 10,000

2.3. UAV-Borne Hyperspectral Data Acquisition and Preprocessing

In this study, hyperspectral data were collected using a Wind4 (DJI Technology, Shenzhen, China) equipped with a SPECIM FX10 (SPECIM Spectral Imaging Ltd., Oulu, Finland). The SPECIM FX10 has a spectral range of 400–1000 nm, a spectral resolution of 5.5 nm, and a field of view (FOV) of 38°. The drone was flown at an altitude of 117 m above the ground, and the sensor’s binning mode was set to 4 × 2, providing a spatial resolution of 0.16 m and a spectral sampling of 3.4 nm.
The hyperspectral raw data reflects the attributes of each pixel through the digital number (DN value) and does not contain spatial coordinate information. It is necessary to use the calibration file and dark current data for radiometric calibration, that is, to convert the DN value into the radiance. The specific process is shown in Equation (2) [27].
L = G a i n [ D N o M e a n D N d D N s ] T i m e
where L is the radiance, measured in m W / ( c m 2 s t r μ m ) , Gain is the radiometric correction coefficient, D N o is the DN value of the original data, D N d is the DN value of the dark current, D N s is the DN value of the scattered light, and T i m e is the integration time.
The position and attitude data recorded by the inertial navigation system (INS) and the digital surface model (DSM) were used for geolocating hyperspectral data based on the collinearity equation, as shown in Equation (3).
X P = X S + Z P Z S a 1 x + a 2 y a 3 f c 1 x + c 2 y c 3 f Y P = Y S + ( Z P Z S ) b 1 x + b 2 y b 3 f c 1 x + c 2 y c 3 f
where ( x , y , f ) are the image space coordinates, ( X P , Y P , Z P ) are the object space coordinates of the corresponding ground point, ( X S , Y S , Z S ) are the object space coordinates of the sensor center and a i , b i , c i (i = 1, 2, 3) are the rotation matrix elements, that is, the exterior orientation angle elements.
Radiometric calibration and geolocating were performed using the CaliGeoPro 2.2.4 software. Then, the reflectance data were derived using the average spectral data for a whiteboard that was synchronously captured during the hyperspectral data acquisition. The specific process is shown in Equation (4).
R = L L w
where R is the reflectance, L is the radiance of the hyperspectral data, and L w is the mean radiance of the whiteboard.
Subsequently, a georeferenced mosaicking method was employed to stitch the individual flight strips together, generating an orthophoto covering the entire study area. Finally, a median filter was applied to smooth and denoise the image. The processed hyperspectral data are shown in Figure 2. Georeferenced mosaicking and median filter were performed using the ENVI 5.3 software. Extract the spectral curve of the corresponding pixel from the hyperspectral data based on the coordinates measured in the field.

2.4. Optimized Spectral Indices

To improve the inversion accuracy of the canopy dust retention content, in this study, we developed four spectral indices: difference index (DI) [28,29], ratio index (RI) [30,31], normalized difference index (NDI) [32,33], and inverse difference index (IDI) [34,35]. Different objects have unique reflectance characteristics for different wavelengths. DI enhances the contrast between the spectral features of different objects by calculating the reflectance difference between two bands. RI measures the relative relationship of reflectance between two bands. When the reflectance difference is small, but the ratio between them varies significantly, RI can effectively highlight the spectral features of the ground objects. Furthermore, ratio-based calculations help mitigate the influence of lighting changes on different bands. NDI calculates the reflectance difference between two bands and normalizes it to reveal the relative performance of object features, thereby enhancing the contrast of object features between specific bands. Normalization restricts the results of NDI to between −1 and +1, reducing the interference of changes in lighting, atmospheric conditions, and background noise on reflectance. IDI calculates the difference in the inverse reflectance between two bands and applies inverse weighting to the changes in reflectance, altering the distribution of the original reflectance. In this way, bands with lower reflectance have a greater influence on index calculation, while bands with higher reflectance have a relatively smaller influence. These spectral indices were calculated by combining the specific relationships between any two bands within the 400–1000 nm wavelength range, which can effectively select key variables related to canopy dust retention. By constructing these spectral indices, not only can the dimensionality of the data be significantly reduced and the model’s structure simplified, but the multicollinearity issues caused by the involvement of multiple bands in the modeling process can also be alleviated, thereby enhancing the stability and predictive capability of the model. The four spectral indices were tested across all the band combinations with MATLAB R2018b. The formulas for calculating the various spectral indices are as follows:
D I = R λ i R λ j
R I = R λ i R λ j
N D I = R λ i R λ j R λ i + R λ j
I D I = 1 R λ i 1 R λ j
where R λ i and R λ j represent the spectral values at wavelengths λ i and λ j , respectively.

2.5. Model Construction and Evaluation

In this study, we constructed inversion models using three methods: PLSR, SVM, and RF. PLSR is a modeling method that combines the advantages of multivariate linear regression (MLR) and principal component analysis (PCA). Compared to traditional MLR methods, PLSR can handle highly autocorrelated data and cases where the number of variables greatly exceeds the number of samples. This method minimizes the sum of the squared errors to find the optimal function match for a dataset, particularly addressing issues of multicollinearity [28,36]. The SVM applies a nonlinear transformation to map vectors into a high-dimensional feature space where parameter optimization is carried out using cross-validation and grid search methods on the training set. In the feature space, the SVM seeks the optimal hyperplane that minimizes the distance between all of the data points and this plane, ultimately performing regression prediction on the dependent variable [37,38]. The RF algorithm is a machine learning algorithm that combines multiple decision tree models to perform regression prediction on the dependent variable. It uses the bootstrap resampling method to generate multiple samples from the original training set, constructs decision trees for each new training set and combines the predictions from all of the decision trees. The final prediction is determined by the highest frequency value or the average of all of the prediction results [39,40]. The three modeling methods are implemented using MATLAB R2018b.
The coefficient of determination ( R 2 ), the root mean square error (RMSE), and the residual predictive deviation (RPD) were selected as the evaluation indices. These three indices were calculated as follows:
R 2 = 1 i = 1 m ( y i y i ^ ) 2 i = 1 m ( y i y ¯ ) 2
R M S E = i = 1 m ( y i y i ^ ) 2 m
R P D = S D R M S E p
where y i represents the measured value of dust retention content, y i ^ represents the predicted value of dust retention content, y ¯ represents the average value of the measured dust retention content, m is the number of the samples, and S D is the standard deviation of the measured values in the validation set.
A higher R 2 value and a smaller RMSE value indicate better model fitting, with less discrepancy between predicted and measured values. When RPD < 1.4, the inversion model cannot predict the sample; when 1.4 ≤ RPD < 2.0, the model can only provide rough predictions; when RPD ≥ 2.0, the model has excellent prediction ability [37].

3. Results

3.1. Descriptive Analysis of Canopy Dust Retention Content

This study used the Kennard-Stone [41] method to divide all samples into calibration set and validation set in a 2:1 ratio, with the calibration set containing 47 samples and the validation set containing 23 samples. The statistical characteristics of the overall samples and the divided samples are shown in Table 1. The canopy dust retention content for all of the samples ranges from 1.486 to 54.688 g/m2, with a mean value of 16.969 g/m2, and the coefficient of variation (CV) reaches 53.014%, indicating moderate variation. The calibration and validation sets, after the division, are very similar for all of the indicators. This similarity suggests that the data division in this study is reasonable and scientific, providing a reliable foundation for the subsequent model construction.

3.2. Spectral Response Characteristics of Canopy Dust Retention

All of the samples were divided into seven levels based on the dust retention from low to high, and the average reflectance of each level was calculated (Figure 3). As can be seen from Figure 3, the spectral curves for the different dust retention levels have similar shapes, and all exhibit typical vegetation spectral characteristics. In the visible wavelength of 400–700 nm, as the dust retention increases, the spectral reflectance initially increases and then decreases. Specifically, when the dust retention increases from the first level (1–12 g/m2) to the second level (12–17 g/m2), the spectral reflectance increases. However, as the dust retention continues to increase, the reflectance gradually decreases. In the near-infrared wavelength of 700–1000 nm, the spectral reflectance decreases as the dust retention increases.
To further explore the differences in the spectral reflectance at different dust retention levels, a one-way analysis of variance (ANOVA) [42,43] was used to test the spectral data at the different dust retention levels (Figure 4). The analysis results indicate that there are significant differences in the spectral reflectance at different dust retention levels in the 400–420 nm, 579–698 nm, and 714–1000 nm, while there are no significant differences within the other ranges. Notably, the F-statistic value in the near-infrared range (714–1000 nm) is the highest, and the significance level is low, indicating that the near-infrared band has a higher sensitivity and better discriminative ability for monitoring plant canopy dust retention.

3.3. Construction of Optimized Spectral Index

Figure 5 displays the correlation matrix between the four spectral indices and canopy dust retention. The correlation coefficients in the matrix are color-coded, transitioning from cool tones (blue) to warm tones (red). Red represents a significant positive correlation, blue represents a significant negative correlation, and yellow and green indicate that the correlation coefficient is close to 0, meaning there is no significant correlation. The correlation matrices of the four spectral indices are divided by the diagonal, with the correlation coefficients in the upper and lower parts exhibiting opposite relationships. Specifically, the correlation matrices of the DI, RI, and NDI exhibit similar distribution patterns. That is, significant positive correlations occur in the four intervals of (400–703 nm, 709–1000 nm), (400–515 nm, 526–563 nm), (526–563 nm, 568–698 nm), and (901–929 nm, 969–1000 nm); while significant negative correlations occur in the ranges of (526–563 nm, 400–515 nm), (568–698 nm, 526–563 nm), (709–1000 nm, 400–703 nm), and (969–1000 nm, 901–929 nm). In contrast, the distribution pattern of the correlation matrix of the IDI is opposite compared to those of the other three indices. This is because the IDI is derived by calculating the reciprocal of the spectral data, and thus, its correlation trends are inversely related to those of the DI, RI, and NDI. Further analysis reveals that when using the same wavelength bands for the calculation, the absolute correlation coefficient of the IDI is smaller than those of the DI, RI, and NDI. This finding indicates that the DI, RI, and NDI are more effective in extracting spectral information related to plant canopy dust retention, thereby enhancing their correlation and characterization capabilities for canopy dust retention inversion.
The maximum absolute values of the correlation coefficients between each spectral index and the canopy dust retention, along with the corresponding band combinations, are shown in Table 2. The results indicate that except that the maximum absolute correlation coefficient (R) between the IDI and the canopy dust retention is less than 0.6, the maximum absolute correlation coefficients of the other three spectral indices with the canopy dust retention are all greater than 0.6. This suggests that the spectral indices derived from different band combinations can significantly improve the correlation with canopy dust retention. Moreover, the band combinations corresponding to the maximum correlation coefficients are all located in the near-infrared range, which is consistent with the analysis presented in Section 3.2 and further validates the importance of the near-infrared wavelength in monitoring canopy dust retention.

3.4. Construction of the Canopy Dust Retention Inversion Model

Among the DI, RI, NDI, and IDI, the spectral index with the highest absolute correlation coefficients with the canopy dust retention content was selected as the feature variable. The accuracy evaluation results of the dust retention inversion models constructed using the PLSR, SVM, and RF methods are presented in Table 3. Based on the stability and accuracy of the models, it is evident that the dust retention estimation results are significantly influenced by the modeling method. The R2 values of the RF model for the calibration and validation sets are 0.899 and 0.756, respectively, with RMSE values of 2.949 and 4.837, demonstrating a superior fitting performance. The performance of the SVM model is slightly worse, and the PLSR model performs the worst. Furthermore, the RF model achieves an RPD of 2.023, indicating a strong predictive ability. The RPD of the SVM model is 1.405, which does not meet the requirement for precise prediction and indicates that it can only provide a rough estimate of the canopy dust retention content. The RPD of the PLSR model is only 1.323, indicating that it is not capable of predicting the canopy dust retention content. Overall, the RF model demonstrates the smallest deviation between the predicted and measured values, yielding the best predictive ability.

4. Discussion

4.1. Rationality Analysis of Spectral Indices

This study explores the feasibility of using four spectral indices, DI, RI, NDI, and IDI, to invert canopy dust retention. By constructing spectral indices, the influence of background noise on the original reflectance was effectively reduced while highlighting spectral features. Considering the interactions between bands minimizes the influence of irrelevant wavelengths, enhances the correlation between the dependent and independent variables, and compensates for the shortcomings of using the full band to construct inversion models, thereby significantly improving the inversion accuracy [30]. The spectral indices selected to construct the canopy dust retention content inversion model in this experiment consist of six bands: 720 nm, 747 nm, 752 nm, 758 nm, 774 nm, and 924 nm. This can be explained by the influence of dust retention on the physiological characteristics of plant leaves. Dust accumulation on plant leaf surfaces can cause phenomena such as stomatal blockage [44], reduced stomatal conductance [45], and decreased photosynthetic activity of mesophyll cells [46], inhibiting photosynthesis and transpiration rates [47], leading to a reduction in chlorophyll, carotenoids, and the water content [6,48,49]. Studies have shown that bands around 720 nm, 747 nm, 752 nm, and 758 nm are sensitive to chlorophyll [50,51,52,53]. The 720 nm band is also considered to be a characteristic band for carotenoid inversion [50], while bands around 774 nm and 924 nm are associated with the leaf water content [54,55,56]. Therefore, the sensitive bands for canopy dust retention selected in this study are closely related to the responses of the plant’s physicochemical parameters to dust, and these band selections can effectively reflect the influence of dust retention on the plant’s physiological state.

4.2. Spatial Distribution Characteristics of Canopy Dust Retention

The hyperspectral image was classified into two categories, plant and bare soil, using a supervised classification method. The RF model was applied to the plant area, and the spatial distribution map of canopy dust retention produced by the ArcGIS 10.5 software is shown in Figure 6. Each pixel represents the canopy dust retention content, and it is color-coded, with red indicating high dust retention content and green indicating low dust retention content. As can be seen from Figure 6, the dust retention range obtained from the hyperspectral image inversion is 4.365–50.762 g/m2, and the high-value areas are primarily concentrated within 900 m of the mining area. As the distance from the mining area increases, the canopy dust retention gradually decreases. In addition, the inversion results tend to be overestimated in the low dust retention range and slightly underestimated in the high dust retention range. This phenomenon is reflected in the fact that the minimum inversion value is higher than the measured minimum value, and the maximum value is lower than the measured maximum value, indicating that there is some error in the model’s prediction of extreme values.
To further understand the influence of dust retention on the fractional vegetation cover (FVC), Figure 7 shows the average FVC values for the different dust retention levels. As can be seen from Figure 7, as dust retention increases, the average vegetation cover tends to decrease gradually; this is consistent with the conclusion found by Li et al. in their study of the East Junggar basin in Xinjiang, China [45]. This phenomenon can be explained by the influence of dust retention on the plant’s physiological functions. Zia-Khan et al. [57] found that dust retention would increase leaf surface temperature and decrease stomatal conductance, which would affect photosynthesis. The research results of Chaston et al. [58] and Popek et al. [59] indicate that factors such as shading of plant leaves, blockage of stomata, and high leaf temperature caused by dust retention can affect plant photosynthesis. Dust retention not only affects the photosynthesis of plants but also inhibits their respiration and transpiration [60,61]. Hou et al. [62] found that dust retention would reduce the net photosynthetic efficiency, stomatal conductance, and transpiration rate of leaves, ultimately leading to a decrease in biomass. Zhang et al. [63] found that dust retention can reduce the photosynthetic rate, stomatal conductance, and transpiration rate of plant leaves while leading to an increase in intercellular carbon dioxide concentration and leaf temperature. Prolonged stomatal blockage not only reduces the plant’s ability to absorb water and nutrients but also potentially limits plant growth, accelerating the aging of plants [60]. Furthermore, harmful substances (such as heavy metals) in the dust may be absorbed by plants through their leaves, affecting their growth, development, and resistance capabilities [64]. These not only slow down plant growth but also weaken the plant’s ability to adapt to environmental changes, leading to decreases in vegetation cover and ecological recovery. Therefore, there is a negative correlation between dust retention and vegetation cover, indicating that dust retention has a significant inhibitory effect on plant growth.

4.3. Limitation and Future Work

Although this study achieved satisfactory inversion results, the limitation of sample size may affect the stability and generalizability of the model due to the use of only 70 samples for model construction and validation. In addition, the plant species selected in this study are limited, and it is necessary to collect more dust retention samples of plant species in the future to build a more robust inversion model.
This study analyzed the influence of dust retention on FVC, but it is still unclear which types of plants have stronger dust retention abilities. In the future, we will further investigate how to improve FVC by selecting suitable plant species, aiming to reduce dust concentration in the air and improve air quality through the dust retention effect of plant leaves and branches.

5. Conclusions

In this study, we analyzed the spectral response characteristics of the plant canopy dust retention, constructed sensitive spectral indices and quantitative inversion models for the canopy dust retention, and examined the spatial distribution characteristics of the canopy dust retention. The main conclusions of this study are summarized below.
(1)
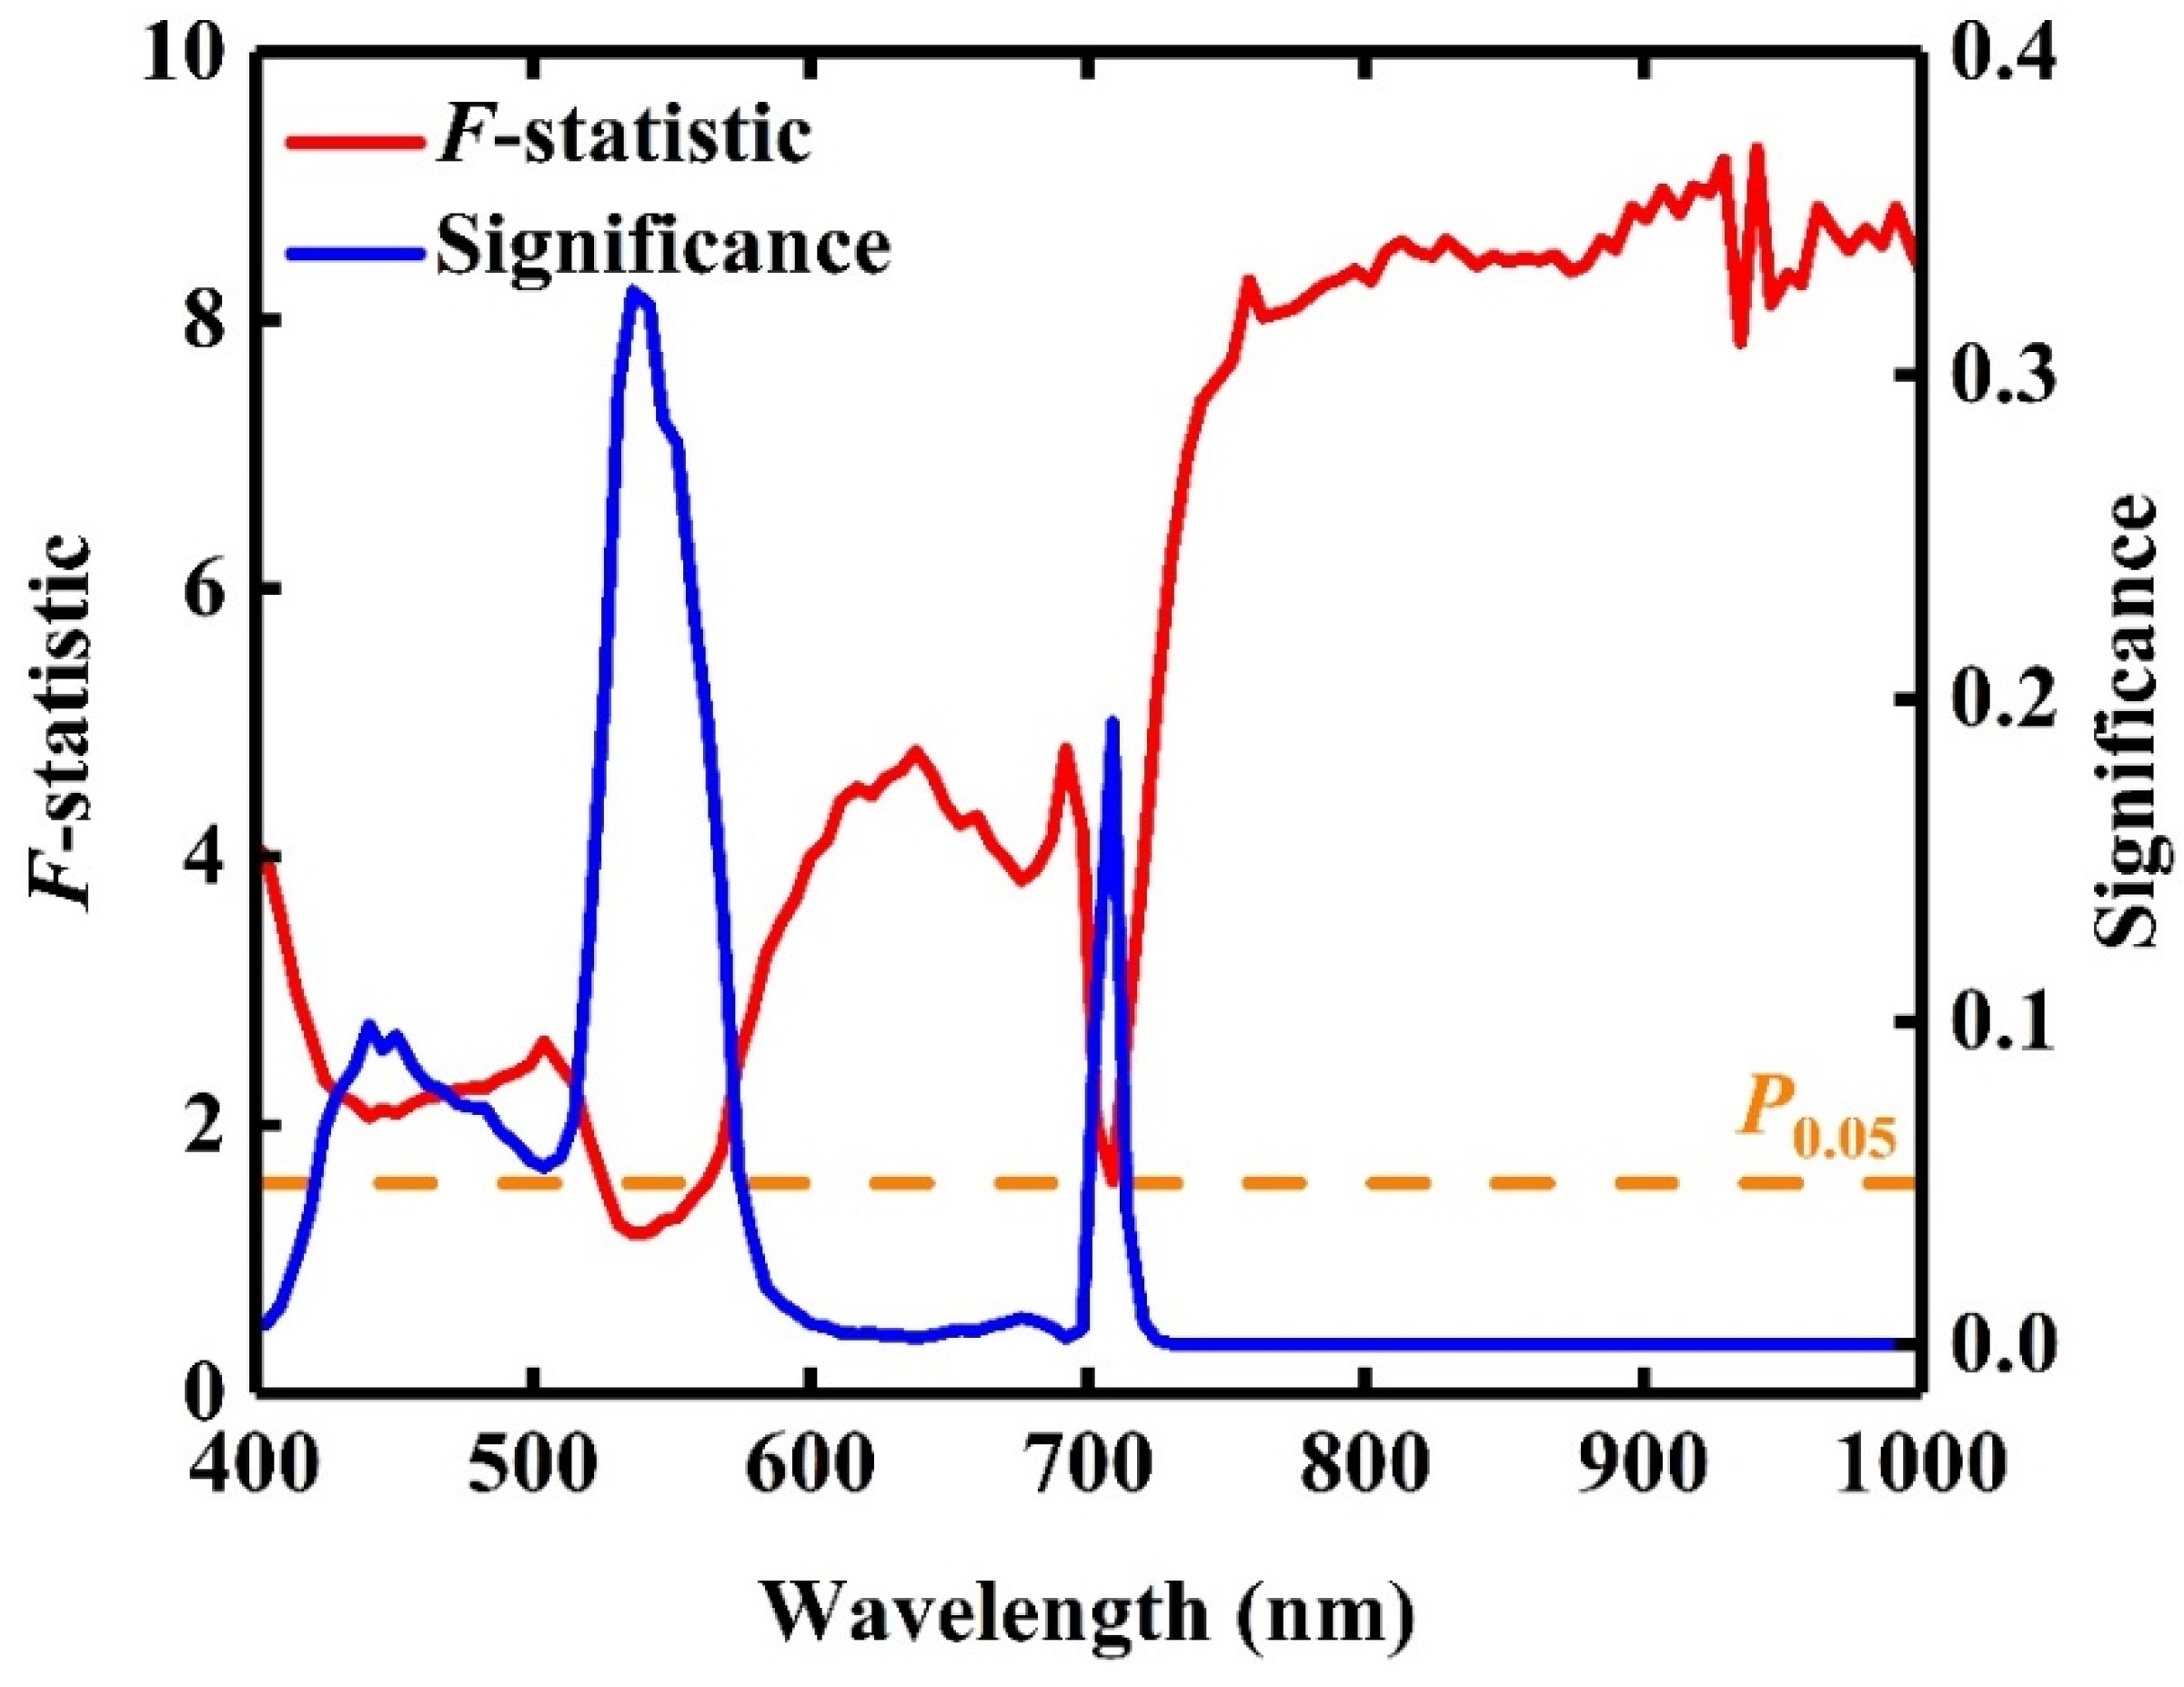
As the canopy dust retention increases, the spectral reflectance in the 400–700 nm wavelength initially increases and then decreases, while the spectral reflectance in the 700–1000 nm wavelength gradually decreases. One-way ANOVA indicates that there are significant differences in the spectral reflectance at different dust retention levels in the 400–420 nm, 579–698 nm, and 714–1000 nm ranges.
(2)
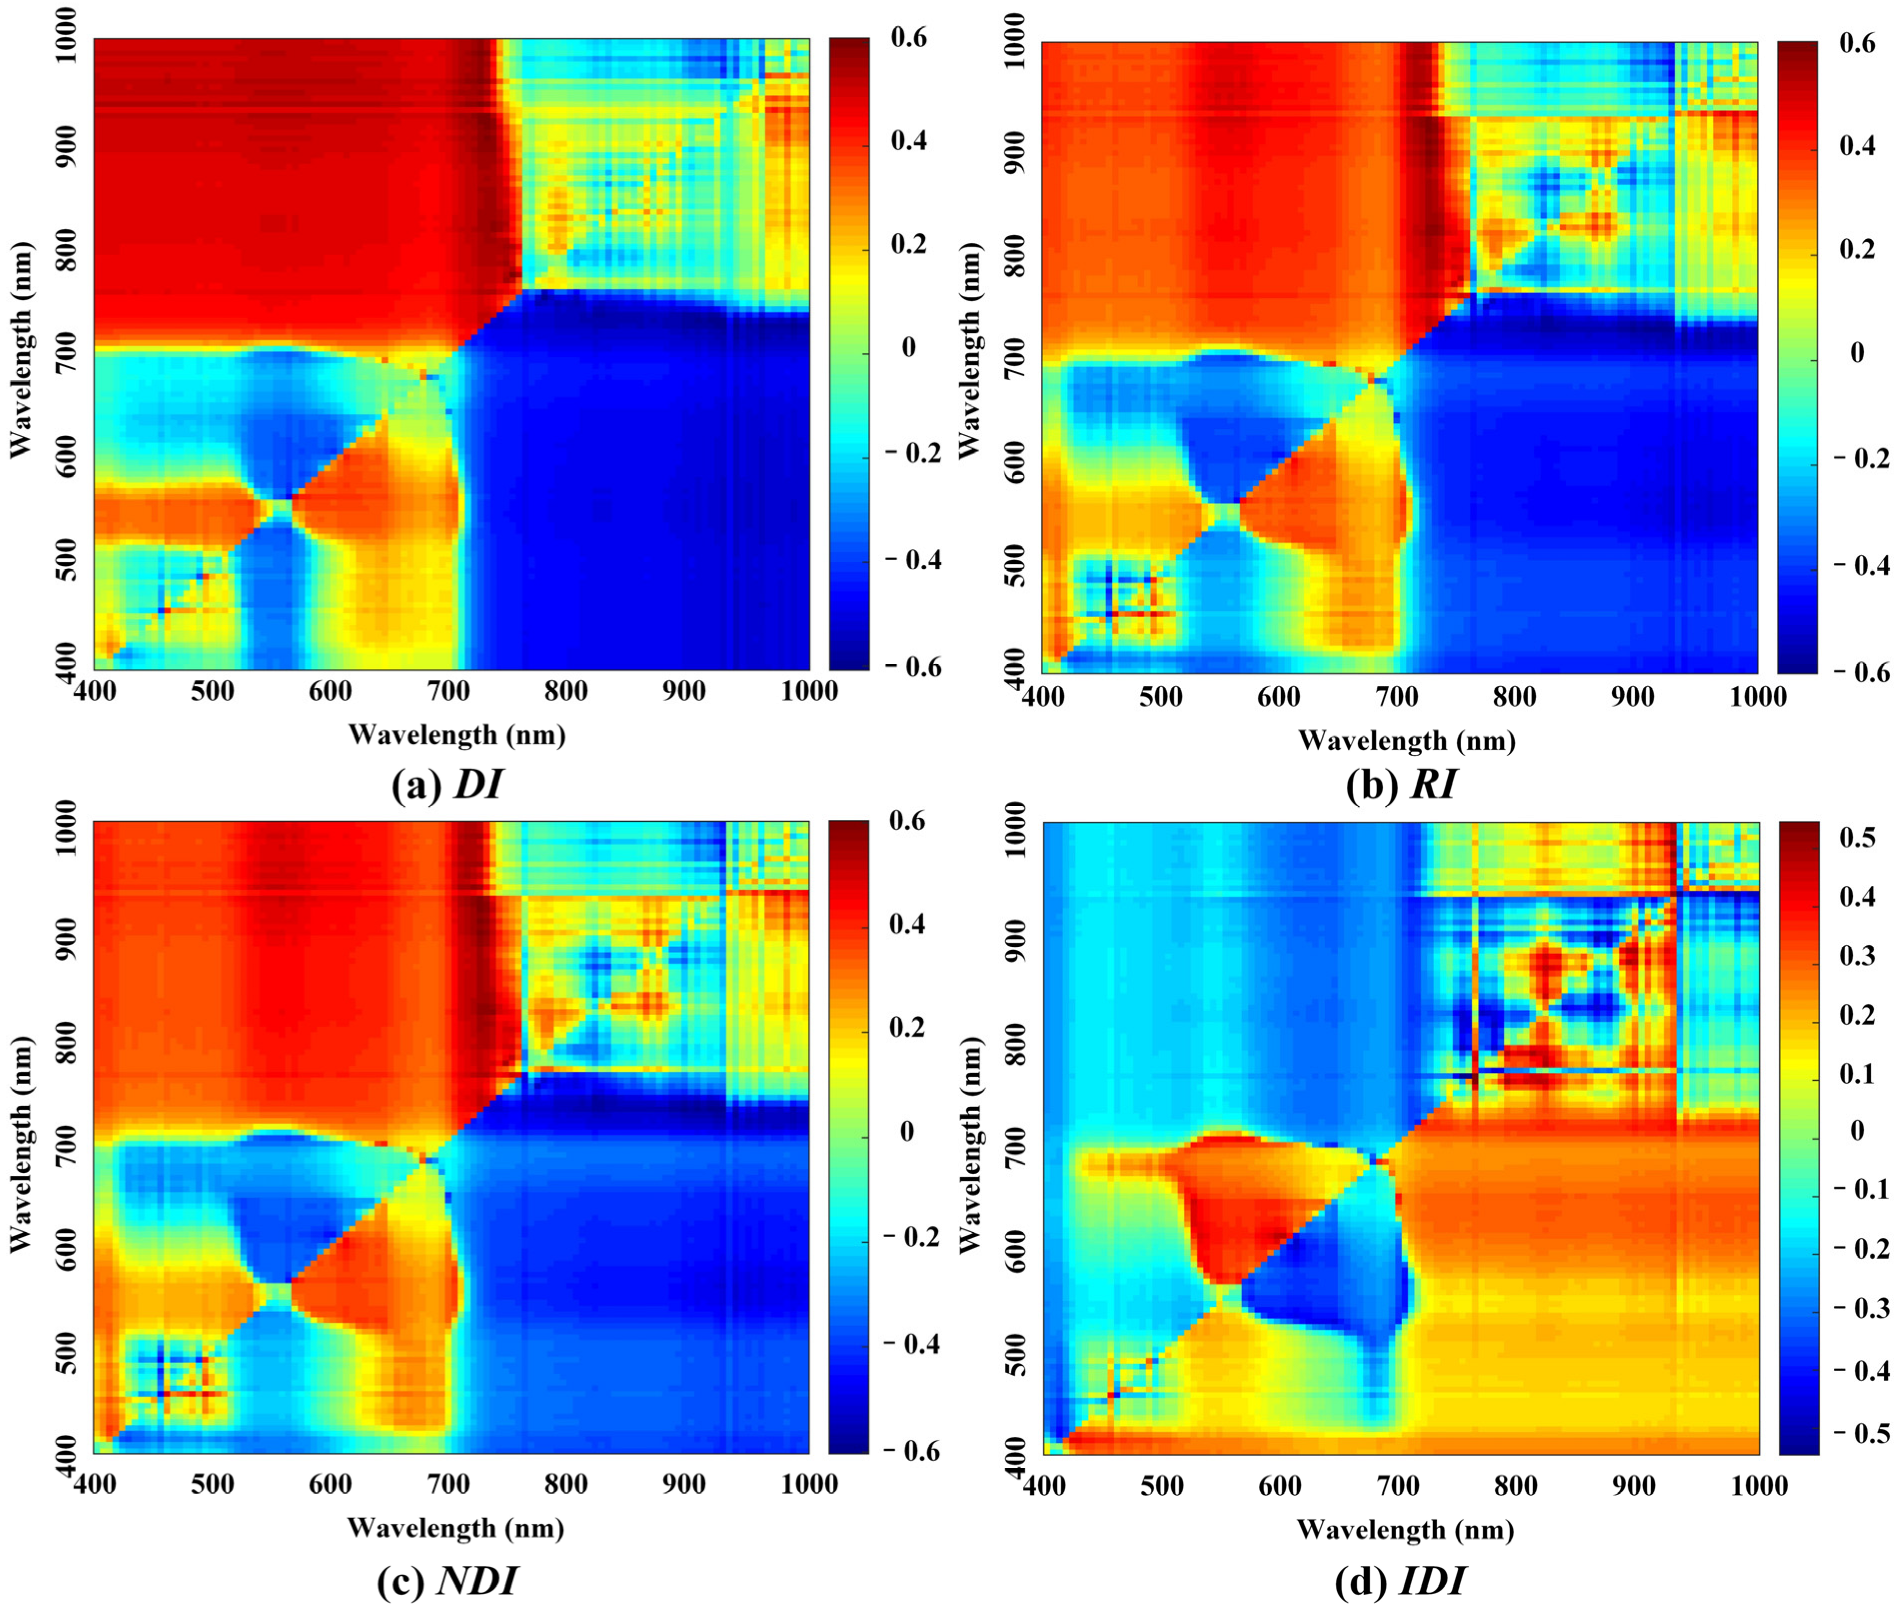
The four spectral indices (DI, RI, NDI, and IDI) constructed in this study exhibit high correlations with the canopy dust retention content, and the spectral index has the largest absolute correlation coefficient formed by near-infrared band combinations.
(3)
Using the spectral index (i.e., DI, RI, NDI, and IDI) with the largest absolute correlation coefficient with the canopy dust retention as a feature variable, the dust retention inversion model constructed using the RF method yielded an R2 value of 0.899 and RMSE of 2.949 for the calibration set, an R2 value of 0.756, and RMSE of 4.837 for the validation set, and an RPD of 2.023, demonstrating that it has a strong predictive ability. Its accuracy is superior to those of the PLSR and SVM models.
(4)
The dust retention content range obtained via inversion using UAV-borne hyperspectral data is 4.365–50.762 g/m2, and the high dust retention areas are primarily distributed within 900 m of the mining area. As the distance from the mining area increases, the canopy dust retention gradually decreases. The increase in the dust retention content is accompanied by a decrease in the vegetation cover, indicating that dust retention has a negative influence on plant growth.

Author Contributions

Conceptualization, Y.Z.; formal analysis, Y.Z.; funding acquisition, S.L.; investigation, Y.Z. and S.L.; methodology, Y.Z.; project administration, S.L.; supervision, S.L.; validation, S.L.; writing—original draft, Y.Z.; writing—review and editing, S.L. All authors have read and agreed to the published version of the manuscript.

Funding

This research was funded by the National Key Research and Development Program of China (No. 2023YFF1306005) and the National Natural Science Foundation of China (No. 52394193).

Data Availability Statement

The data supporting the findings of this study are available from the corresponding author on request.

Conflicts of Interest

The authors declare no conflicts of interest.

References

  1. Huang, L.; Li, J.; Zhang, H.; Li, Y.; Wang, S.; Fan, J. Accounting and assessment of grassland ecological values. Acta Prataculturae Sin. 2024, 33, 47–63. [Google Scholar]
  2. Tang, F.; Yang, Z.; Wang, Z.; Sun, N.; Han, F.; Zhao, J. Research on the Establishment of Grassland Governance Systems from the Perspective of Ecological Civilization. Acta Agrestia Sin. 2021, 29, 2381–2390. [Google Scholar]
  3. Wang, H.; Wang, J.; Cao, Y.; Lu, Y.; Qin, Q.; Wang, Y. Effect of soil and topography on vegetation restoration in an opencast coal mine dump in a loess area. Acta Ecol. Sin. 2016, 36, 5098–5108. [Google Scholar]
  4. Guo, J.; He, J.; Li, J.; Xing, E.; Wen, A.; Liu, Y.; Yang, G. Effects of different measures on water erosion control of dump slope at opencast coal mine in typical steppe. Trans. Chin. Soc. Agric. Eng. 2015, 31, 296–303. [Google Scholar]
  5. Hirano, T.; Kiyota, M.; Aiga, I. Physical effects of dust on leaf physiology of cucumber and kidney bean plants. Environ. Pollut. 1995, 89, 255–261. [Google Scholar] [CrossRef] [PubMed]
  6. Lu, J.; Lei, S. Research Overview of Effect of Dust on Environment and Its Diffusion Laws in Open-pit Coal Mine. Saf. Coal Mines 2017, 48, 231–234. [Google Scholar]
  7. Naidoo, G.; Chirkoot, D. The effects of coal dust on photosynthetic performance of the mangrove, Avicennia marina in Richards Bay, South Africa. Environ. Pollut. 2004, 127, 359–366. [Google Scholar] [CrossRef]
  8. Xu, J.; Yu, J. Air dustfall impact on spectrum of Ficus microcarpa’s leaf. Adv. Mater. Res. 2013, 655, 813–815. [Google Scholar] [CrossRef]
  9. Chudnovsky, A.; Ben-Dor, E. Application of visible, near-infrared, and short-wave infrared (400–2500 nm) reflectance spectroscopy in quantitatively assessing settled dust in the indoor environment. Case study in dwellings and office environments. Sci. Total Environ. 2008, 393, 198–213. [Google Scholar] [CrossRef] [PubMed]
  10. Wang, J.; Xu, R.; Ma, Y.; Miao, L.; Cai, R.; Chen, Y. The research of air pollution based on spectral features in leaf surface of Ficus microcarpa in Guangzhou, China. Environ. Monit. Assess. 2008, 142, 73–83. [Google Scholar] [CrossRef]
  11. Zhang, P.; YAO, F. Using hyperspectral indices to measure the effect of mine dust on the growth of three typical desert plants. Spectrosc. Spectr. Anal. 2014, 34, 2162–2168. [Google Scholar]
  12. Kayet, N.; Pathak, K.; Singh, C.P.; Chaturvedi, R.K.; Brahmandam, A.S.; Mandal, C. Assessment and estimation of coal dust impact on vegetation using VIs difference model and PRISMA hyperspectral data in mining sites. J. Environ. Manag. 2024, 367, 121935. [Google Scholar] [CrossRef] [PubMed]
  13. Jing, W.; Zhou, X.; Zhang, C.; Wang, C.; Jiang, H. Machine learning for estimating leaf dust retention based on hyperspectral measurements. J. Sens. 2018, 2018, 6026259. [Google Scholar] [CrossRef]
  14. Yan, X.; Shi, W.; Zhao, W.; Luo, N. Mapping dustfall distribution in urban areas using remote sensing and ground spectral data. Sci. Total Environ. 2015, 506, 604–612. [Google Scholar] [CrossRef]
  15. Peng, J.; Xiang, H.; Wang, J.; Ji, W.; Liu, W.; Chi, C.; Zuo, T. Quantitative model of foliar dustfall content using hyperspectral remote sensing. J. Infrared Millim. Waves 2013, 32, 313–318. [Google Scholar] [CrossRef]
  16. Wang, G.; Yu, Q.; Yang, D.; Niu, T.; Long, Q. Retrieval of Dust Retention Distribution in Beijing Urban Green Space Based on Spectral Characteristics. Spectrosc. Spectr. Anal. 2022, 42, 2572–2578. [Google Scholar]
  17. Su, K.; Yu, Q.; Hu, Y.; Liu, Z.; Wang, P.; Zhang, Q.; Zhu, J.; Niu, T.; Pei, Y.; Yue, D. Inversion Research on Dust Distribution of Urban Forests in Beijing in Winter Based on Spectral Characteristics. Spectrosc. Spectr. Anal. 2020, 40, 1696–1702. [Google Scholar]
  18. Saaroni, H.; Chudnovsky, A.; Ben-Dor, E. Reflectance spectroscopy is an effective tool for monitoring soot pollution in an urban suburb. Sci. Total Environ. 2010, 408, 1102–1110. [Google Scholar] [CrossRef] [PubMed]
  19. Xiao, H.; Chen, X.; Ling, Q.; Zhou, Z. Analysis of dust detention capability of landscape plants and the hyperspectral remote sensing quantitative models construction of foliagedust detention. Resour. Environ. Yangtze Basin 2015, 24, 229–236. [Google Scholar]
  20. Su, K.; Yu, Q.; Sun, X.; Yue, D. Effects of leaf dust retention on spectral characteristics of Euonymus japonicus. J. Beijing For. Univ. 2021, 43, 40–49. [Google Scholar]
  21. Kayet, N.; Pathak, K.; Chakrabarty, A.; Kumar, S.; Chowdary, V.M.; Singh, C.P.; Sahoo, S.; Basumatary, S. Assessment of foliar dust using Hyperion and Landsat satellite imagery for mine environmental monitoring in an open cast iron ore mining areas. J. Clean. Prod. 2019, 218, 993–1006. [Google Scholar] [CrossRef]
  22. Li, W.; Wu, J.; Chen, T.; Peng, D. Hyperspectral estimation model of dust deposition content on plant leaves. Trans. Chin. Soc. Agric. Eng. 2016, 32, 180–185. [Google Scholar]
  23. Zhu, J.; Yu, Q.; Liu, X.; Yu, Y.; Yao, J.; Su, K.; Niu, T.; Zhu, H.; Zhu, Q. Effect of Leaf Dust Retention on Spectral Characteristics of Euonymus japonicus and Its Dust Retention Prediction. Spectrosc. Spectr. Anal. 2020, 40, 517–522. [Google Scholar]
  24. Luo, N.; Zhao, W.; Yan, X. Impact of Dust-Fall on Spectral Features of Plant Leaves. Spectrosc. Spectr. Anal. 2013, 33, 2715–2720. [Google Scholar]
  25. Peng, J.; Wang, J.; Xiang, H.; Niu, J.; Chi, C.; Liu, W. Effect of Foliar Dustfall Content (FDC) on High Spectral Characteristics of Pear Leaves and Remote Sensing Quantitative Inversion of FDC. Spectrosc. Spectr. Anal. 2015, 35, 1365–1369. [Google Scholar]
  26. Wang, H.; Fang, N.; Yan, X.; Chen, F.; Xiong, Q.; Zhao, W. Retrieving Dustfall Distribution in Beijing City Based on Ground Spectral Data and Remote Sensing. Spectrosc. Spectr. Anal. 2016, 36, 2911–2918. [Google Scholar]
  27. Jia, W.; Pang, Y.; Yue, C.; Li, Z.; Che, T.; Ma, M. The Processing of Airborne AISA Eagle Ⅱ Data in Ejina Banner Study Area. Remote Sens. Technol. Appl. 2016, 31, 504–510. [Google Scholar]
  28. Zhou, Y.; Cheng, Y.; Wang, D.; Zhang, Z.; Zeng, D.; Li, X.; Mao, C. Hyperspectral inversion of soil arsenic content in polymetallic mining areas based on optimized spectral index combined with PLSR. Chin. J. Nonferrous Met. 2024, 34, 653–667. [Google Scholar]
  29. Ning, J.; Zou, B.; Tu, Y.; Zhang, X.; Wang, Y.; Tian, R. Evaluation of Soil as Concentration Estimation Method Based on Spectral Indices. Spectrosc. Spectr. Anal. 2024, 44, 1472–1481. [Google Scholar]
  30. Han, C.; Lu, J.; Chen, S.; Xu, X.; Wang, Z.; Pei, Z.; Zhang, Y.; Li, F. Estimation of heavy metal (loid) contents in agricultural soil of the suzi river basin using optimal spectral indices. Sustainability 2021, 13, 12088. [Google Scholar] [CrossRef]
  31. Lin, N.; Liu, Y.; Liu, Q.; Jiang, R.; Ma, X. Inversion method of organic matter content of different types of soils in black soil area based on hyperspectral indices. Open Geosci. 2024, 16, 20220739. [Google Scholar] [CrossRef]
  32. Sun, H.; Feng, M.; Xiao, L.; Yang, W.; Wang, C.; Jia, X.; Zhao, Y.; Zhao, C.; Muhammad, S.K.; Li, D. Assessment of plant water status in winter wheat (Triticum aestivum L.) based on canopy spectral indices. PLoS ONE 2019, 14, e0216890. [Google Scholar] [CrossRef] [PubMed]
  33. Li, D.; Wu, T.; Wang, S.; Li, Z.; Tian, Y.; Fei, X.; Liu, Y.; Lei, Y.; Li, G. Hyperspectral Indices for Identification of Red Pigments Used in Cultural Relic. Spectrosc. Spectr. Anal. 2022, 42, 1588–1594. [Google Scholar]
  34. Zhao, Y.; Yan, C.; Lu, S.; Wang, P.; Qiu, G.Y.; Li, R. Estimation of chlorophyll content in intertidal mangrove leaves with different thicknesses using hyperspectral data. Ecol. Indic. 2019, 106, 105511. [Google Scholar] [CrossRef]
  35. Li, Z.; Tian, A. Quantitative Prediction and Spatial Distribution of Soil Heavy Metal Zn Based on Spectral Indices. Spectrosc. Spectr. Anal. 2024, 44, 3287–3293. [Google Scholar]
  36. Hou, L.; Li, X.; Li, F. Hyperspectral-based Inversion of Heavy Metal Content in the Soil of Coal Mining Areas. J. Environ. Qual. 2019, 48, 57–63. [Google Scholar] [CrossRef] [PubMed]
  37. Tan, K.; Wang, H.; Zhang, Q.; Jia, X. An improved estimation model for soil heavy metal (loid) concentration retrieval in mining areas using reflectance spectroscopy. J. Soils Sediments 2018, 18, 2008–2022. [Google Scholar] [CrossRef]
  38. Li, J.; Zhang, H.; Ma, W.; Chen, C.; Zhu, Y.; Zhou, Y.; Zhan, Y. Spaceborne GNSS-R soil moisture inversion method based on support vector machine. Prog. Geophys. 2023, 38, 1960–1966. [Google Scholar]
  39. Liang, L.; Di, L.; Zhang, L.; Deng, M.; Qin, Z.; Zhao, S.; Lin, H. Estimation of crop LAI using hyperspectral vegetation indices and a hybrid inversion method. Remote Sens. Environ. 2015, 165, 123–134. [Google Scholar] [CrossRef]
  40. Dai, L.; Ge, J.; Wang, L.; Zhang, Q.; Liang, T.; Bolan, N.; Lischeid, G.; Rinklebe, J. Influence of soil properties, topography, and land cover on soil organic carbon and total nitrogen concentration: A case study in Qinghai-Tibet plateau based on random forest regression and structural equation modeling. Sci. Total Environ. 2022, 821, 153440. [Google Scholar] [CrossRef] [PubMed]
  41. He, Z.; Ma, Z.; Li, M.; Zhou, Y. Selection of a calibration sample subset by a semi-supervised method. J. Near Infrared Spectrosc. 2018, 26, 87–94. [Google Scholar] [CrossRef]
  42. Wang, X.; Gong, Z.; Jing, R.; Zhang, L.; Jin, D. Extraction of aquatic plants based on continuous removal method and analysis of its temporal and spatial changes—A case study of Guanting Reservoir. Chin. J. Plant Ecol. 2018, 42, 640–652. [Google Scholar]
  43. Lin, C.; Gong, Z.; Zhao, W.; Fan, L. Identifying typical plant ecological types based on spectral characteristic variables: A case study in Wild Duck Lake wetland, Beijing. Acta Ecol. Sin. 2013, 33, 1172–1185. [Google Scholar]
  44. Krajíčková, A.; Mejstřik, V. The effect of fly ash particles on the plugging of stomata. Environ. Pollut. Ser. A Ecol. Biol. 1984, 36, 83–93. [Google Scholar] [CrossRef]
  45. Li, Y.; Zhao, N.; Cao, Y.; Yang, J. Effects of coal dust deposition on the physiological properties of plants in an open-pit coal mine. Acta Ecol. Sin. 2018, 38, 8129–8138. [Google Scholar]
  46. Tezara, W.; Habash, D.; Paul, M.J.; Lawlor, D.W. Effects of water stress on the biochemistry and physiology of photosynthesis in sunflower. Photosynth. Res. 1995, 205, 625–628. [Google Scholar]
  47. Yang, H.; Wei, L.; Ye, X.; Liu, G.; Yang, X.; Huang, Z. Effects of coal dust deposition on seedling growth of Hedysarum laeve Maxim: A dominant plant species on Ordos Plateau. Acta Ecol. Sin. 2016, 36, 2858–2865. [Google Scholar]
  48. Prusty, B.; Mishra, P.C.; Azeez, P.A. Dust accumulation and leaf pigment content in vegetation near the national highway at Sambalpur, Orissa, India. Ecotoxicol. Environ. Saf. 2005, 60, 228–235. [Google Scholar] [CrossRef] [PubMed]
  49. Rai, P.K.; Panda, L.L. Dust capturing potential and air pollution tolerance index (APTI) of some road side tree vegetation in Aizawl, Mizoram, India: An Indo-Burma hot spot region. Air Qual. Atmos. Health 2014, 7, 93–101. [Google Scholar] [CrossRef]
  50. Zhou, X.; Huang, W.; Kong, W.; Ye, H.; Dong, Y.; Casa, R. Assessment of leaf carotenoids content with a new carotenoid index: Development and validation on experimental and model data. Int. J. Appl. Earth Obs. Geoinf. 2017, 57, 24–35. [Google Scholar] [CrossRef]
  51. Darvishzadeh, R.; Skidmore, A.; Schlerf, M.; Atzberger, C.; Corsi, F.; Cho, M. LAI and chlorophyll estimation for a heterogeneous grassland using hyperspectral measurements. ISPRS J. Photogramm. Remote Sens. 2008, 63, 409–426. [Google Scholar] [CrossRef]
  52. Chappelle, E.W.; Kim, M.S.; McMurtrey, J.E., III. Ratio analysis of reflectance spectra (RARS): An algorithm for the remote estimation of the concentrations of chlorophyll a, chlorophyll b, and carotenoids in soybean leaves. Remote Sens. Environ. 1992, 39, 239–247. [Google Scholar] [CrossRef]
  53. Sims, D.A.; Gamon, J.A. Relationships between leaf pigment content and spectral reflectance across a wide range of species, leaf structures and developmental stages. Remote Sens. Environ. 2002, 81, 337–354. [Google Scholar] [CrossRef]
  54. Liu, L.; Huang, W.; Pu, R.; Wang, J. Detection of internal leaf structure deterioration using a new spectral ratio index in the near-infrared shoulder region. J. Integr. Agric. 2014, 13, 760–769. [Google Scholar] [CrossRef]
  55. Liu, L.; Zhang, S.; Zhang, B. Evaluation of hyperspectral indices for retrieval of canopy equivalent water thickness and gravimetric water content. Int. J. Remote Sens. 2016, 37, 3384–3399. [Google Scholar] [CrossRef]
  56. Peñuelas, J.; Filella, I.; Biel, C.; Serrano, L.; Save, R. The reflectance at the 950–970 nm region as an indicator of plant water status. Int. J. Remote Sens. 1993, 14, 1887–1905. [Google Scholar] [CrossRef]
  57. Zia-Khan, S.; Spreer, W.; Pengnian, Y.; Zhao, X.; Othmanli, H.; He, X.; Müller, J. Effect of dust deposition on stomatal conductance and leaf temperature of cotton in northwest China. Water 2014, 7, 116–131. [Google Scholar] [CrossRef]
  58. Chaston, K.; Doley, D. Mineral particulates and vegetation: Effects of coal dust, overburden and flyash on light interception and leaf temperature. Clean. Air Environ. Qual. 2006, 40, 40–44. [Google Scholar]
  59. Popek, R.; Gawrońska, H.; Wrochna, M.; Gawroński, S.W.; Sæbø, A. Particulate matter on foliage of 13 woody species: Deposition on surfaces and phytostabilisation in waxes–a 3-year study. Int. J. Phytoremediation 2013, 15, 245–256. [Google Scholar] [CrossRef] [PubMed]
  60. Paoli, L.; Guttová, A.; Grassi, A.; Lackovičová, A.; Senko, D.; Sorbo, S.; Basile, A.; Loppi, S. Ecophysiological and ultrastructural effects of dust pollution in lichens exposed around a cement plant (SW Slovakia). Environ. Sci. Pollut. Res. 2015, 22, 15891–15902. [Google Scholar] [CrossRef] [PubMed]
  61. Mo, Z.; Zhang, J.; Wang, J.; Liu, W.; Wang, J. Effect of Dustfall on Photosynthetic Characteristics and Chlorophyll Content of Pyrus bretschneideri cv.Fragrant Pear Leaf in Tarim Basin. Hubei Agric. Sci. 2013, 52, 3845–3848. [Google Scholar]
  62. Hou, J.; Wang, Z.; Wu, D. Effect of coal dust deposition on the root system and leaf growth of Agropyron cristatum as an important plant in Inner Mongolia grassland. Heilongjiang Anim. Sci. Vet. Med. 2017, 1, 144–147. [Google Scholar]
  63. Zhang, Y.; Sun, X.; Bo, M.; Chang, S.; Han, Y.; Li, X.; Lu, J. Effect of Mining Dust on Photosynthetic and Physiological Characteristics of Picea schrenkiana Needles. J. West. China For. Sci. 2016, 45, 1–7. [Google Scholar]
  64. Pan, R. Migration of heavy metals in dust from smelters in the environment and its countermeasures. Chin. J. Ecol. 1990, 4, 31–36. [Google Scholar]
Figure 1. Locations of the study area.
Land 14 00458 g001
Figure 2. Preprocessed UAV-borne hyperspectral data.
Land 14 00458 g002
Figure 3. Spectral reflectance of canopy with different dust retention.
Land 14 00458 g003
Figure 4. The results of the one-way analysis of variance for spectral reflectance.
Land 14 00458 g004
Figure 5. Correlation matrix diagram between spectral indices and canopy dust retention content. (a) DI, (b) RI, (c) NDI, (d) IDI.
Land 14 00458 g005
Figure 6. Spatial distribution of canopy dust retention.
Land 14 00458 g006
Figure 7. Statistics of fractional vegetation cover and canopy dust retention.
Land 14 00458 g007
Table 1. Descriptive statistical characteristics of collected samples.
Sample TypeMin
(g/m2)
Max
(g/m2)
Mean
(g/m2)
S.D
(g/m2)
CV
(%)
Calibration1.48654.68817.3969.52254.737
Validation2.33651.55216.5428.58651.904
Total1.48654.68816.9698.99653.014
Table 2. The maximum absolute correlation coefficient and optimal band combination between spectral indices and canopy dust retention content.
DIRINDIIDI
R
band combination
R
band combination
R
band combination
R
band combination
0.609
(747 nm, 774 nm)
0.608
(720 nm, 924 nm)
0.604
(720 nm, 924 nm)
0.546
(758 nm, 752 nm)
Table 3. Model evaluation indices of the dust retention inversion models.
ModelsCalibrationValidation
R c 2 RMSEC (g/m2) R p 2 RMSEP (g/m2)RPD
PLSR0.4257.0660.4297.3941.323
SVM0.5136.5030.4936.9641.405
RF0.8992.9490.7564.8372.023
Disclaimer/Publisher’s Note: The statements, opinions and data contained in all publications are solely those of the individual author(s) and contributor(s) and not of MDPI and/or the editor(s). MDPI and/or the editor(s) disclaim responsibility for any injury to people or property resulting from any ideas, methods, instructions or products referred to in the content.

