Article

Land-Use Transformation and Its Eco-Environmental Effects of Production–Living–Ecological Space Based on the County Level in the Yellow River Basin

Henan Key Laboratory of Ecological Environment Protection and Restoration of Yellow River Basin, Yellow River Institute of Hydraulic Research, Zhengzhou 450003, China
*
Authors to whom correspondence should be addressed.
Land 2025, 14(2), 427; https://doi.org/10.3390/land14020427
Submission received: 10 December 2024 / Revised: 27 January 2025 / Accepted: 5 February 2025 / Published: 18 February 2025

Abstract

:
The Yellow River Basin (YRB) serves as a critical ecological functional and economic zone in China. However, due to the rapid economic and social development, the YRB has encountered dual pressure from the anthropogenic disturbances and climate change, leading to intensified conflicts among production, living, and ecological spaces (PLES). In this study, we examined the spatiotemporal evolution pattern and transition mode of the PLES from 1980 to 2020 at the county level, evaluated the eco-environmental effects, and identified the key driving factors. The results indicate that land-use changes in the YRB are marked by a continuous increase in living space, while ecological spaces initially decreased before increasing, and production spaces initially increased before decreasing, with the year 2000 serving as a pivotal point in these transitions. At the county level, land-use transformations in the YRB have significant spatial differentiation. The north region of the Hu Line is predominantly characterized by a reduction in ecological space, whereas the south primarily exhibits declines in production space and increases in living space in the downstream region. Consequently, the environmental quality index (EQI) also exhibits a trend of an initial decline followed by an increase. Frequent mutual conversions between production and ecological spaces influenced by major national ecological conservation policies after 2000, as well as pressure from living spaces on production spaces influenced by population and GDP growth, have been the primary manifestations of spatial transformation in the region. These findings suggest that with the implementation of appropriate governance measures, exploring the transformation of PLES at a finer county level can provide a clearer pattern of spatiotemporal changes, supporting detailed basin management for sustainable development.

1. Introduction

With rapid urbanization and industrialization, about three-quarters of Earth’s land surface has been altered over the last millennium, significantly impacting global sustainability challenges (Winkler et al., 2021) [1]. The frequent land-use transitions have both direct and indirect consequences on regional ecosystems, ultimately resulting in various ecological and environmental impacts (Lambin and Meyfroidt, 2011; Hanaõcek and Rodríguez-Labajos, 2018; Tian et al., 2018; Wang et al., 2022) [2,3,4,5]. Concurrently, conflicts among ecological, agricultural, and residential spaces are intensifying significantly, particularly in developing nations such as China (Ning et al., 2018; Jiang et al., 2022) [6,7]. The rapid expansion of production and residential areas in China has triggered a deterioration of ecological spaces, as evidenced by soil erosion affecting 20% of the country’s landmass and grassland degradation reaching an alarming 66.67 million hectares (Fu et al., 2020) [8]. In the Yellow River Basin, the cumulative area of human-induced land-cover change reaches 65.71 million ha from 1980 to 2015, accounting for 87.33% of the total basin area (Liu et al., 2021) [9]. Therefore, achieving a balance between economic development and the establishment of ecological civilization to promote regional sustainable development has emerged as a significant scientific challenge.
The research on land-use transformation has garnered increasing attention (Asabere et al., 2020; Das and Angadi, 2020; Nguyen et al., 2023) [10,11,12], and mainly focuses on the theoretical foundations and research frameworks of land-use transformation, as well as the interplay between rural land-use transformation and urban–rural development, resource management, and environmental impacts (Zhao et al., 2020; Wynn et al., 2020) [13,14]. Among them, as an important aggregation unit of human activities connected by the water network, the ecological and environmental effects caused by land-use transformation have received more and more attention (Niu et al., 2024; Ofosu et al., 2020) [15,16], while the existing research primarily concentrates on broader, macro-level scales, predominantly within the contexts of an entire river basin (Sun et al., 2023; Wang et al., 2023a) [17,18] or provinces (Li et al., 2022; Li et al., 2024; Xie et al., 2021; Yousafzai et al., 2022) [19,20,21,22] based on multiple land use. There are few research results on the eco-environmental effects of basin land-use change from the perspective of a finer county scale based on the ecological, production, and living spaces.
The production–living–ecological space (PLES) concept was initially presented in the 2012 report of the 18th National Congress of the Communist Party of China, with the goal of promoting sustainable ecological development (Jiang et al., 2022) [6]. It emphasized that the “production space must be both intensive and efficient, the living space should be comfortable and sustainable, and the ecological space ought to remain pristine and aesthetically pleasing” (Wang et al., 2020; Fu and Zhang, 2021) [23,24]. Additionally, the 2022 report from the 20th National Congress of the Communist Party of China reaffirmed the necessity of focusing on ecological priorities and creating a territorial spatial framework that harmonizes high-quality development with synergistic advantages. Analyzing the spatial and temporal changes in landscape patterns through the lens of ecological–production–living space is vital for reducing ecological risks and enhancing the modernization of ecological governance in China.
The Yellow River Basin is a crucial ecological function area and economic zone in China, traversing three tiers of terrain: the Qinghai–Tibet Plateau, the Loess Plateau, and the North China Plain. The interplay of complex conditions such as water and sediment, geography, population, and climate leads to the Yellow River Basin facing intricate challenges, including ecological fragility, water resource shortages, industrial underdevelopment, and insufficient high-quality development. These issues are further exacerbated by intensive anthropogenic activities (e.g., high water consumption, industrialization, and urbanization) and challenging environmental conditions (like water scarcity and drought risk, Wang et al., 2023b; Zhang et al., 2021 [25,26]). In 2019, the ecological protection and high-quality development of the YRB have been proposed as significant national strategy, on par with the coordinated development of the Beijing–Tianjin–Hebei region, the advancement of the Yangtze River Economic Belt, the construction of the Guangdong–Hong Kong–Macao Greater Bay Area, and the integrated development of the Yangtze River Delta. Recently, human activities and climate change have exacerbated a series of ecological and environmental issues within the Yellow River Basin, stemming from both inherent deficiencies and subsequent malnutrition (Chen et al., 2020; Zhu et al., 2024) [27,28]. Moreover, there are notable differences in the ecosystem patterns among the upstream, midstream, and downstream regions of the Yellow River Basin.
From the perspective of production–living–ecological land-use classification, we obtained land-use change data of YRB at the county level from 1980 to 2020. Through the calculations of the land-use transfer matrix, the ecological environment quality index, and the ecological contribution rate linked to land-use changes on the county level, the main objectives of the study were to rigorously analyze the structure from the perspective of PLES on the county level, to investigate the spatial distribution and development pattern of counties, to evaluate the resultant impact on eco-environment quality, and to explore the county transformation model and the underlying driving mechanisms shaping these changes in the YRB.

2. Materials and Methods
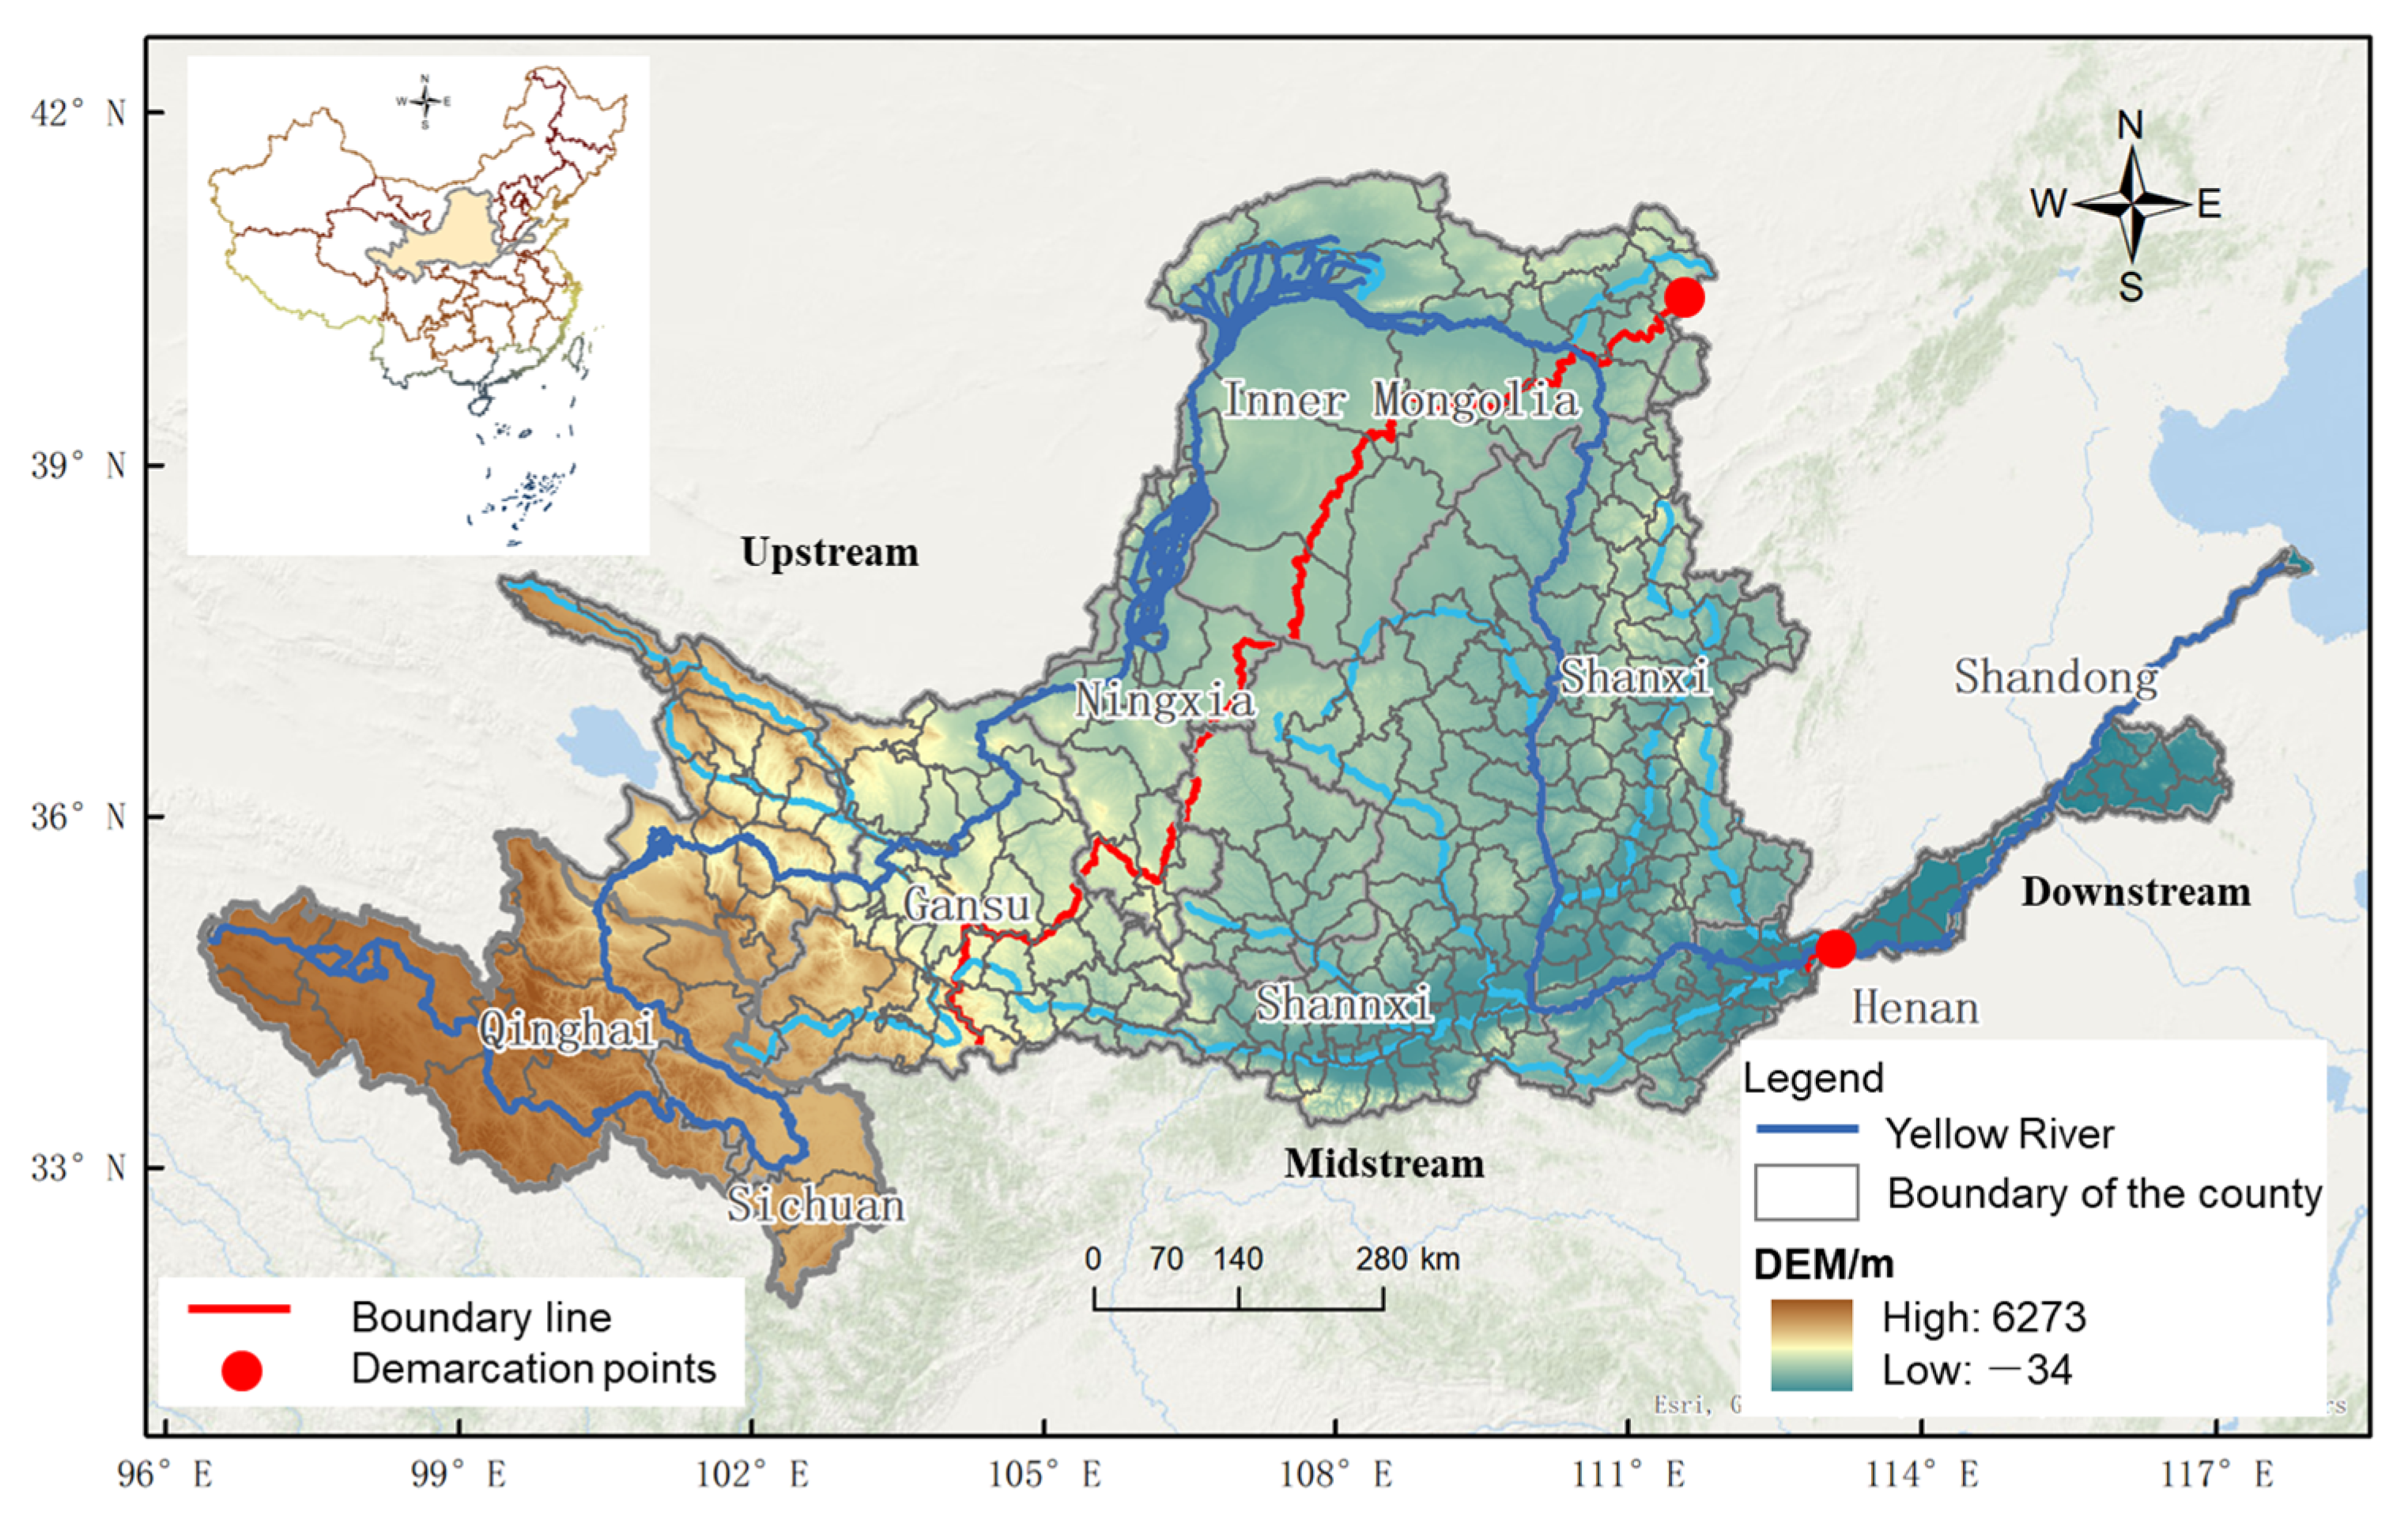
2.1. Study Area

The Yellow River originates from the Bayankara Mountains on the Qinghai–Tibet Plateau and flows through nine provinces (regions), including Qinghai, Sichuan, Gansu, Ningxia, Inner Mongolia, Shaanxi, Shanxi, Henan, and Shandong, before emptying into the Bohai Sea in Kenli County, Shandong Province (Figure 1). The Yellow River Basin (YRB) spans a geographical range of 31°20’ to 40°48’ N and 110°21’ to 116°39’ E, encompassing three major terrain steps from west to east: the Qinghai–Tibet Plateau, the Inner Mongolia Plateau, and the Loess Plateau. This basin covers an area of approximately 795,000 km2, which includes 42,000 km2 of endorheic regions. The terrain of the river basin is characterized by high elevations in the west and lower elevations in the east, resulting in a vertical drop of 4480 m, with the average altitude of the western source area exceeding 4000 m. The average annual temperature in the basin is 7.2 °C, and the annual precipitation is approximately 530 mm.
According to the administrative divisions of China in 2013, the Yellow River Basin encompasses 9 provinces (autonomous regions), 72 prefecture-level cities (including autonomous prefectures and leagues), and 429 counties (districts and county-level cities). These regions serve as a crucial ecological security barrier for our country and play a vital role in achieving the protection of ecological resources alongside economic and social development.

2.2. Data Sources and Preprocessing

The remote-sensing monitoring data spanning from 1980 to 2020 were selected from the Resource and Environmental Science Data Center of the Chinese Academy of Sciences (http://www.resdc.cn/) with a resolution of 30 m. The primary information source employed was the Landsat remote-sensing imagery from the United States, covering intervals of 5 years. The visualization of the data was achieved through human–computer interaction techniques, leading to the creation of a thematic database for land use and land cover across multiple time periods. The study’s dataset was clipped from the overall data for China, utilizing the natural boundaries of the Yellow River Basin.
In the original database, the data of Yellow River Basin encompassed 6 primary types and 18 secondary types. In this study, the data will be reclassified into three types including ecological, production, and living-space land use, based on these secondary classifications (Table 1). During the classification process, the previous literature, the standard “Current Land Use Classification (GB/T 21010-2007)” [29], and characteristics of the Yellow River basin were also taken into consideration (Wei et al., 2024) [30]. This reclassification framework categorizes the territorial spaces within the basin into eight subcategories related to ecological–production–living spaces, including agricultural production, industrial and mining production, urban residential areas, rural residential areas, ecological woodland, ecological grassland, aquatic ecological areas, and potential ecological space. Building on earlier research findings (Hu et al., 2021; Wei et al., 2022) [31,32] and factoring in the specific conditions of the area studied, we allocated weights to different land-use types within these secondary spaces to establish a definitive relationship between land-use practices and ecological environment quality (Table 1). In the land-use analysis, five datasets were used (1980, 1990, 2000, 2010, and 2020), each covering a 10-year period, and in the ecological environment quality analysis, data with a five-year interval were used.
Data regarding driving factors, such as terrain (including DEM, slope, and aspect), soil types, traffic accessibility (which encompasses distances to primary (D1), secondary (D2), and tertiary roads (D3) as well as railways (DR)), socioeconomic indicators (population (POP), GDP, and distance to water bodies (DW)), and climate variables (precipitation and temperature) were selected from both natural and human-related perspectives (refer to Table 2). The vector data pertaining to county-level administrative divisions, along with digital elevation model (DEM) data, are obtained from the Geospatial Data Cloud Platform (http://www.gscloud.cn). Slope and aspect calculations were conducted using ArcGIS 10.8 software. Additionally, soil type, population data (at a resolution of 1 km), and GDP (also at a resolution of 1 km) came from the Resource and Environmental Sciences Data Center at the Chinese Academy of Sciences (https://www.resdc.cn/). The annual average temperature and precipitation data, sourced from the China Meteorological Administration (http://data.cma.cn/), were used to derive meteorological data. For the spatial interpolation of meteorological information within China, the inverse distance weighted (IDW) interpolation method was employed, and meteorological spatial data for the Henan section of the Yellow River Basin were extracted.

2.3. Land-Use Transition Mode

The transfer matrix can quantitatively investigate the amount of transformation among different landscape types and clarify the inter-transformation relationships between each landscape type. With ArcGIS 10.0 software, the landscape vector maps of 2020 and 1980 period were overlaid and cross-calculated to derive the changes in landscape spatial structure between the past 40 years and construct a transfer matrix for landscape types. The formula is as follows:
S i j = S 11   S 12     S 1 n S 21   S 22     S 2 n     S n 1   S n 2     S n n
where S represents the area of land use; n represents the number of land-use types; and i and j represent the initial and final land-use types being considered, respectively.

2.4. Eco-Environment Effects

The eco-environment effects of land transformation in the Yellow River Basin were analyzed and studied through eco-environmental quality. The Ecological Quality Index (EQI) was employed to quantitatively assess the ecological quality of diverse land-use spaces across different years. The EQI, along with the area proportion of diverse land-use functions categorized within the production–living–ecological spaces of the YRB, enables a quantitative assessment of the overall eco-environmental quality across three different time periods in the region. For each secondary classification, different ecological weight according to its characteristics and their influence on the eco-environment is assigned, referring to the study by Wei et al. (2022) [32]. By assigning ecological weights to each land-use type, the EQIs for the years 1980, 1985, 1990, 1995, 2000, 2005, 2010, 2015, and 2020 were calculated by the area-weighted method. The calculation was based on the following formula:
E Q I t = i = 1 n L U x × C a v e r a g e / T A
where EQIt represents the eco-environmental quality index of the specific period t within the region, which is derived through a meticulous calculation process. This involves considering various factors such as the area (LU) occupied by each land-use space i during the period t, as well as the ecological weight (C) assigned to that particular land-use type. Additionally, the total land area (TA) of the study region and the total number of land-use spaces (N) within the region are also taken into account. By incorporating these variables into the calculation, we are able to obtain a quantitative measure of the ecological quality of different land-use spaces over time, thereby gaining a deeper understanding of the region’s ecological health and sustainability.

2.5. Driving Factors Detection Based on Random Forest

The PLUS model, which stands for Patch-generating Land-Use Simulation, represents an enhanced iteration of the FLUS model. In contrast to traditional geo-cellular automata frameworks, it excels at investigating the factors driving land-use changes and enables detailed simulations at the patch level. When integrated with a multi-objective optimization algorithm, the PLUS model enhances the precision of simulation outcomes (Liang et al., 2021) [33]. This model fundamentally comprises two components: the Land Expansion Analysis Strategy (LEAS) module and the Cellular Automaton model utilizing multitype random patch seeds (CARS) module. The LEAS module incorporates the random forest algorithm, allowing for a thorough examination of the factors influencing land-use expansion, the assessment of how various land-use types relate to different driving forces, and the random selection of sample datasets through the random forest algorithm for the purpose of training. This methodology aids in determining each land-use type’s development potential and evaluates the impact of each driving factor using the random permutation approach (Rad et al., 2014) [34]. By merging cellular automata with patch-based simulation methodologies, this model substantially enhances the capabilities for fine-grained simulation and improves the accuracy of predictions regarding actual landscape patterns, while also uncovering the intricate nonlinear relationships between land-use changes and their driving factors. The calculations were based on the following formula:
P i , k d , ( x ) = n = 1 M I = h n x = d M
where the value of d ranges from 0 or 1. If d = 1, it indicates that there is a transition from other land-use types to land-use type k. When d = 0, it means that the land-use type has transformed into other land-use types besides k. x is a vector composed of several driving factors. The function I is an indicator function of the decision tree set. hn(x) represents the predicted type of the nth decision tree for vector x. M is the total number of decision trees.

3. Results

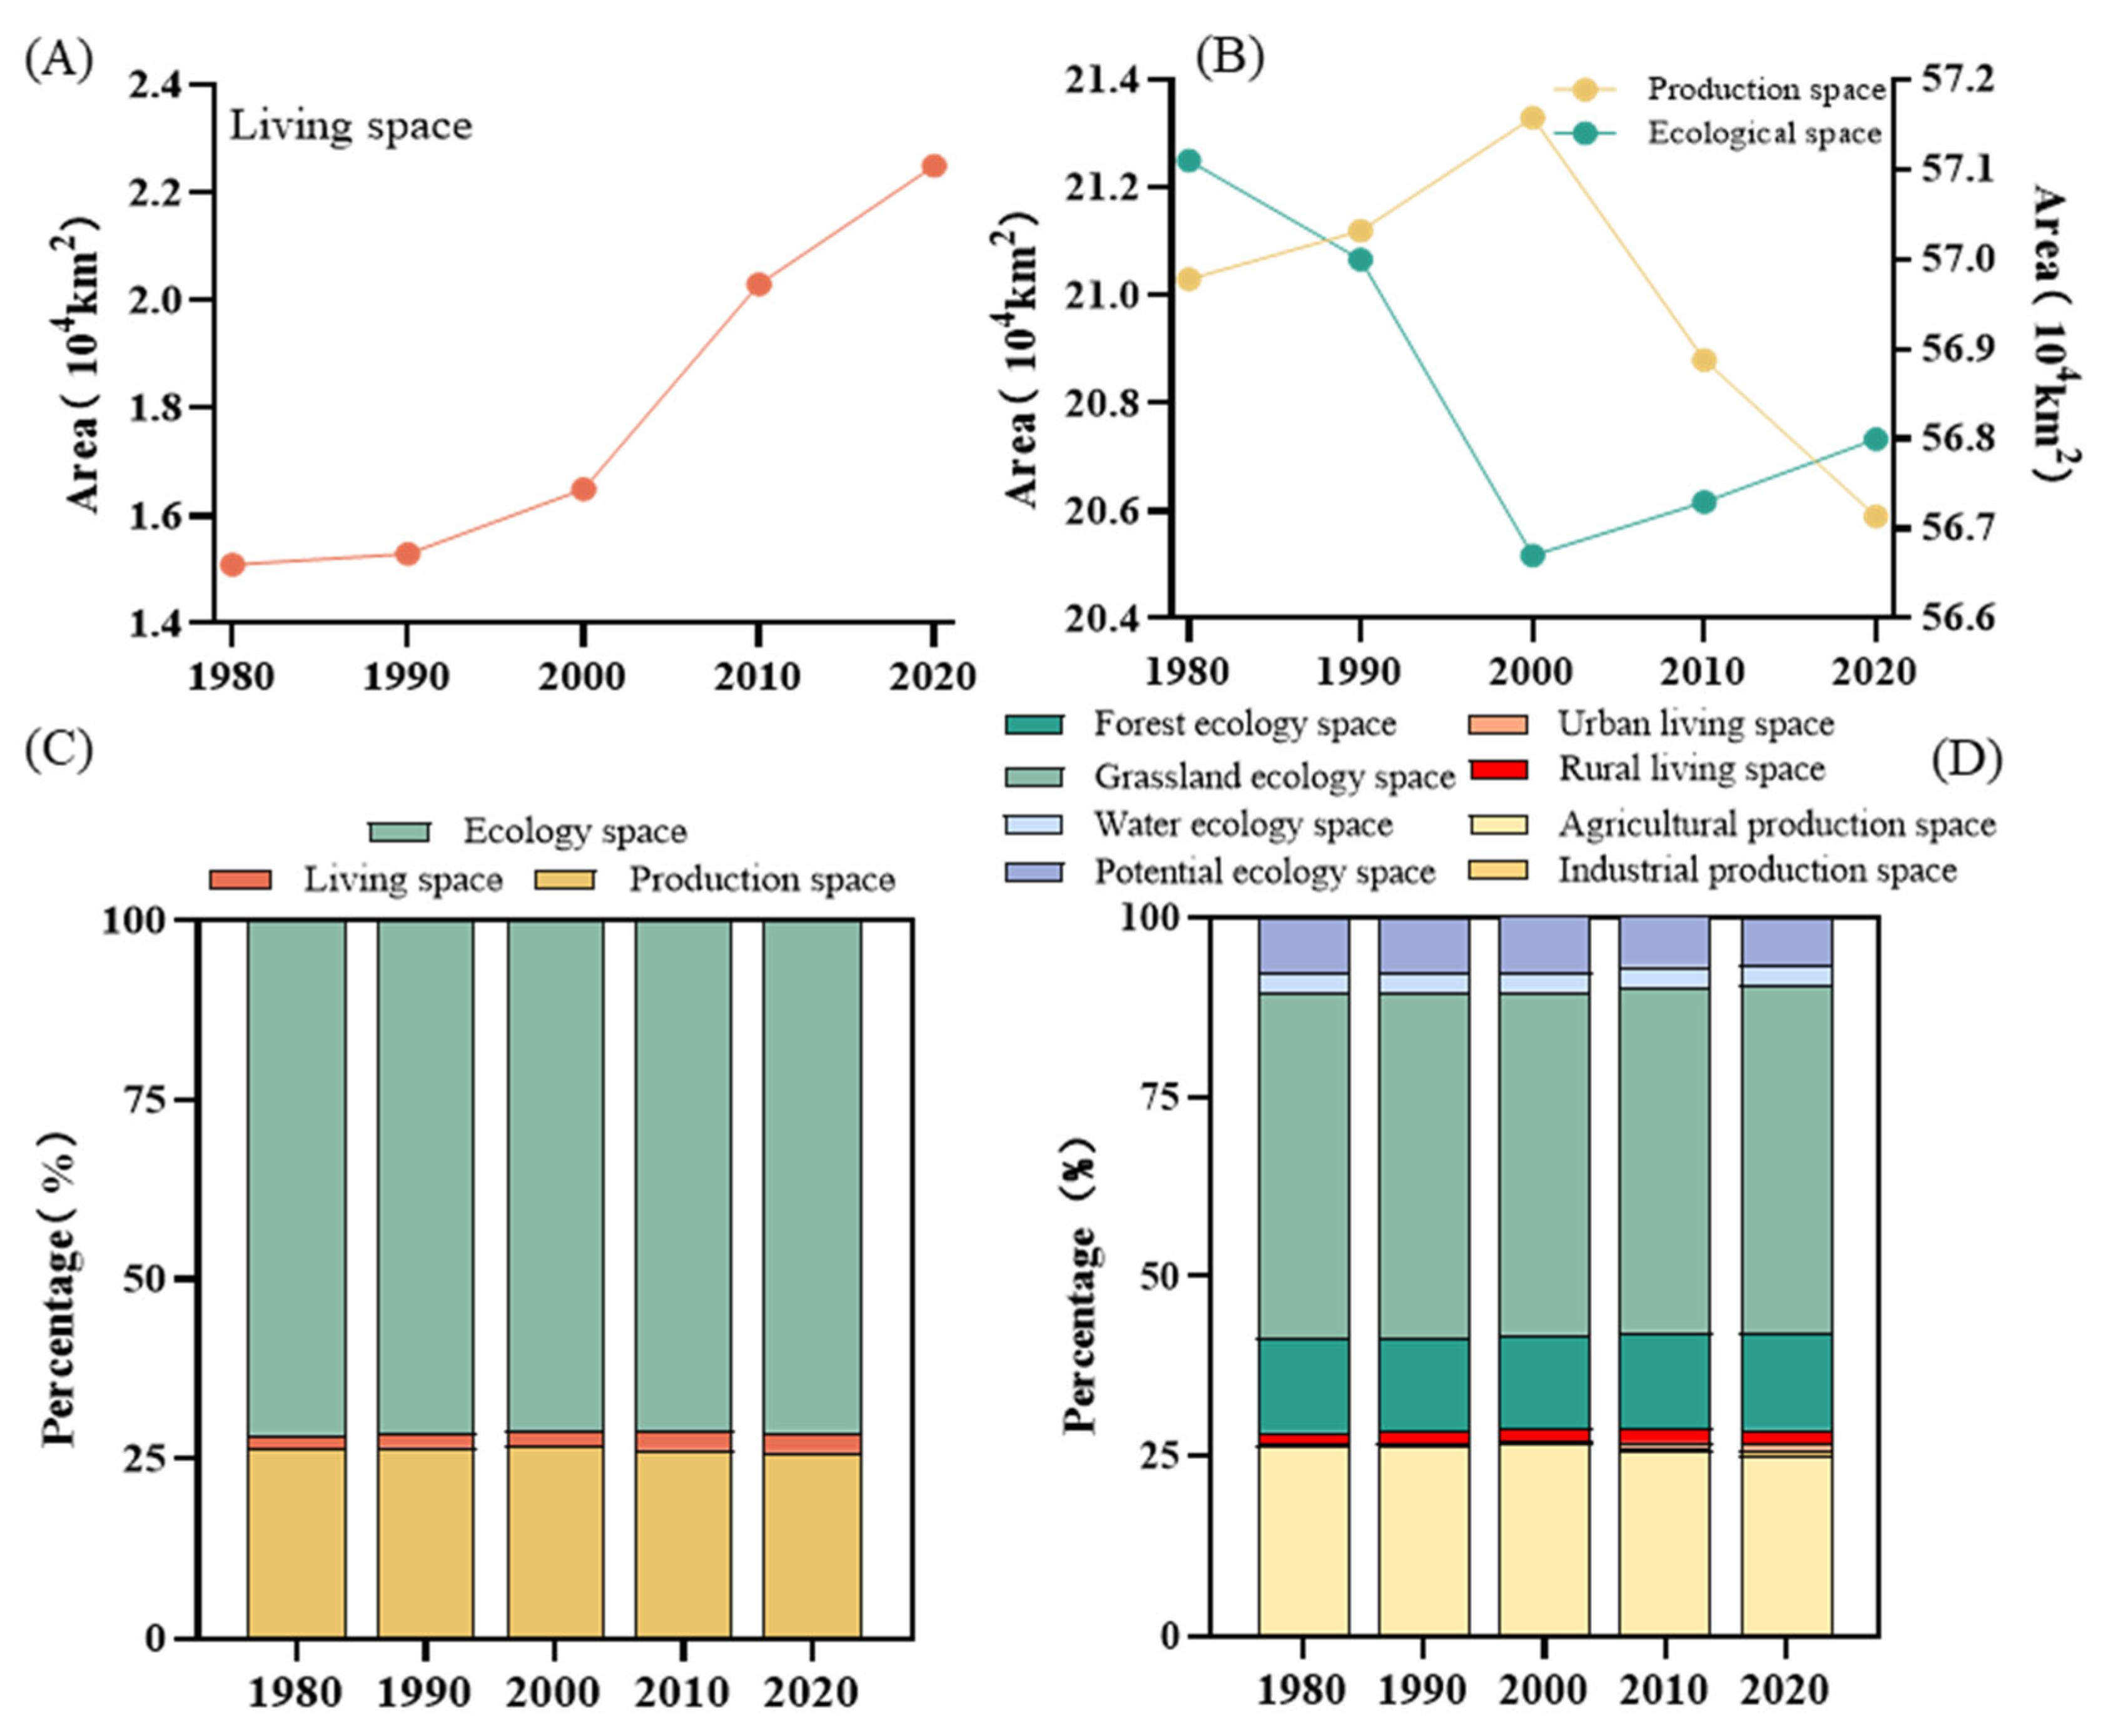
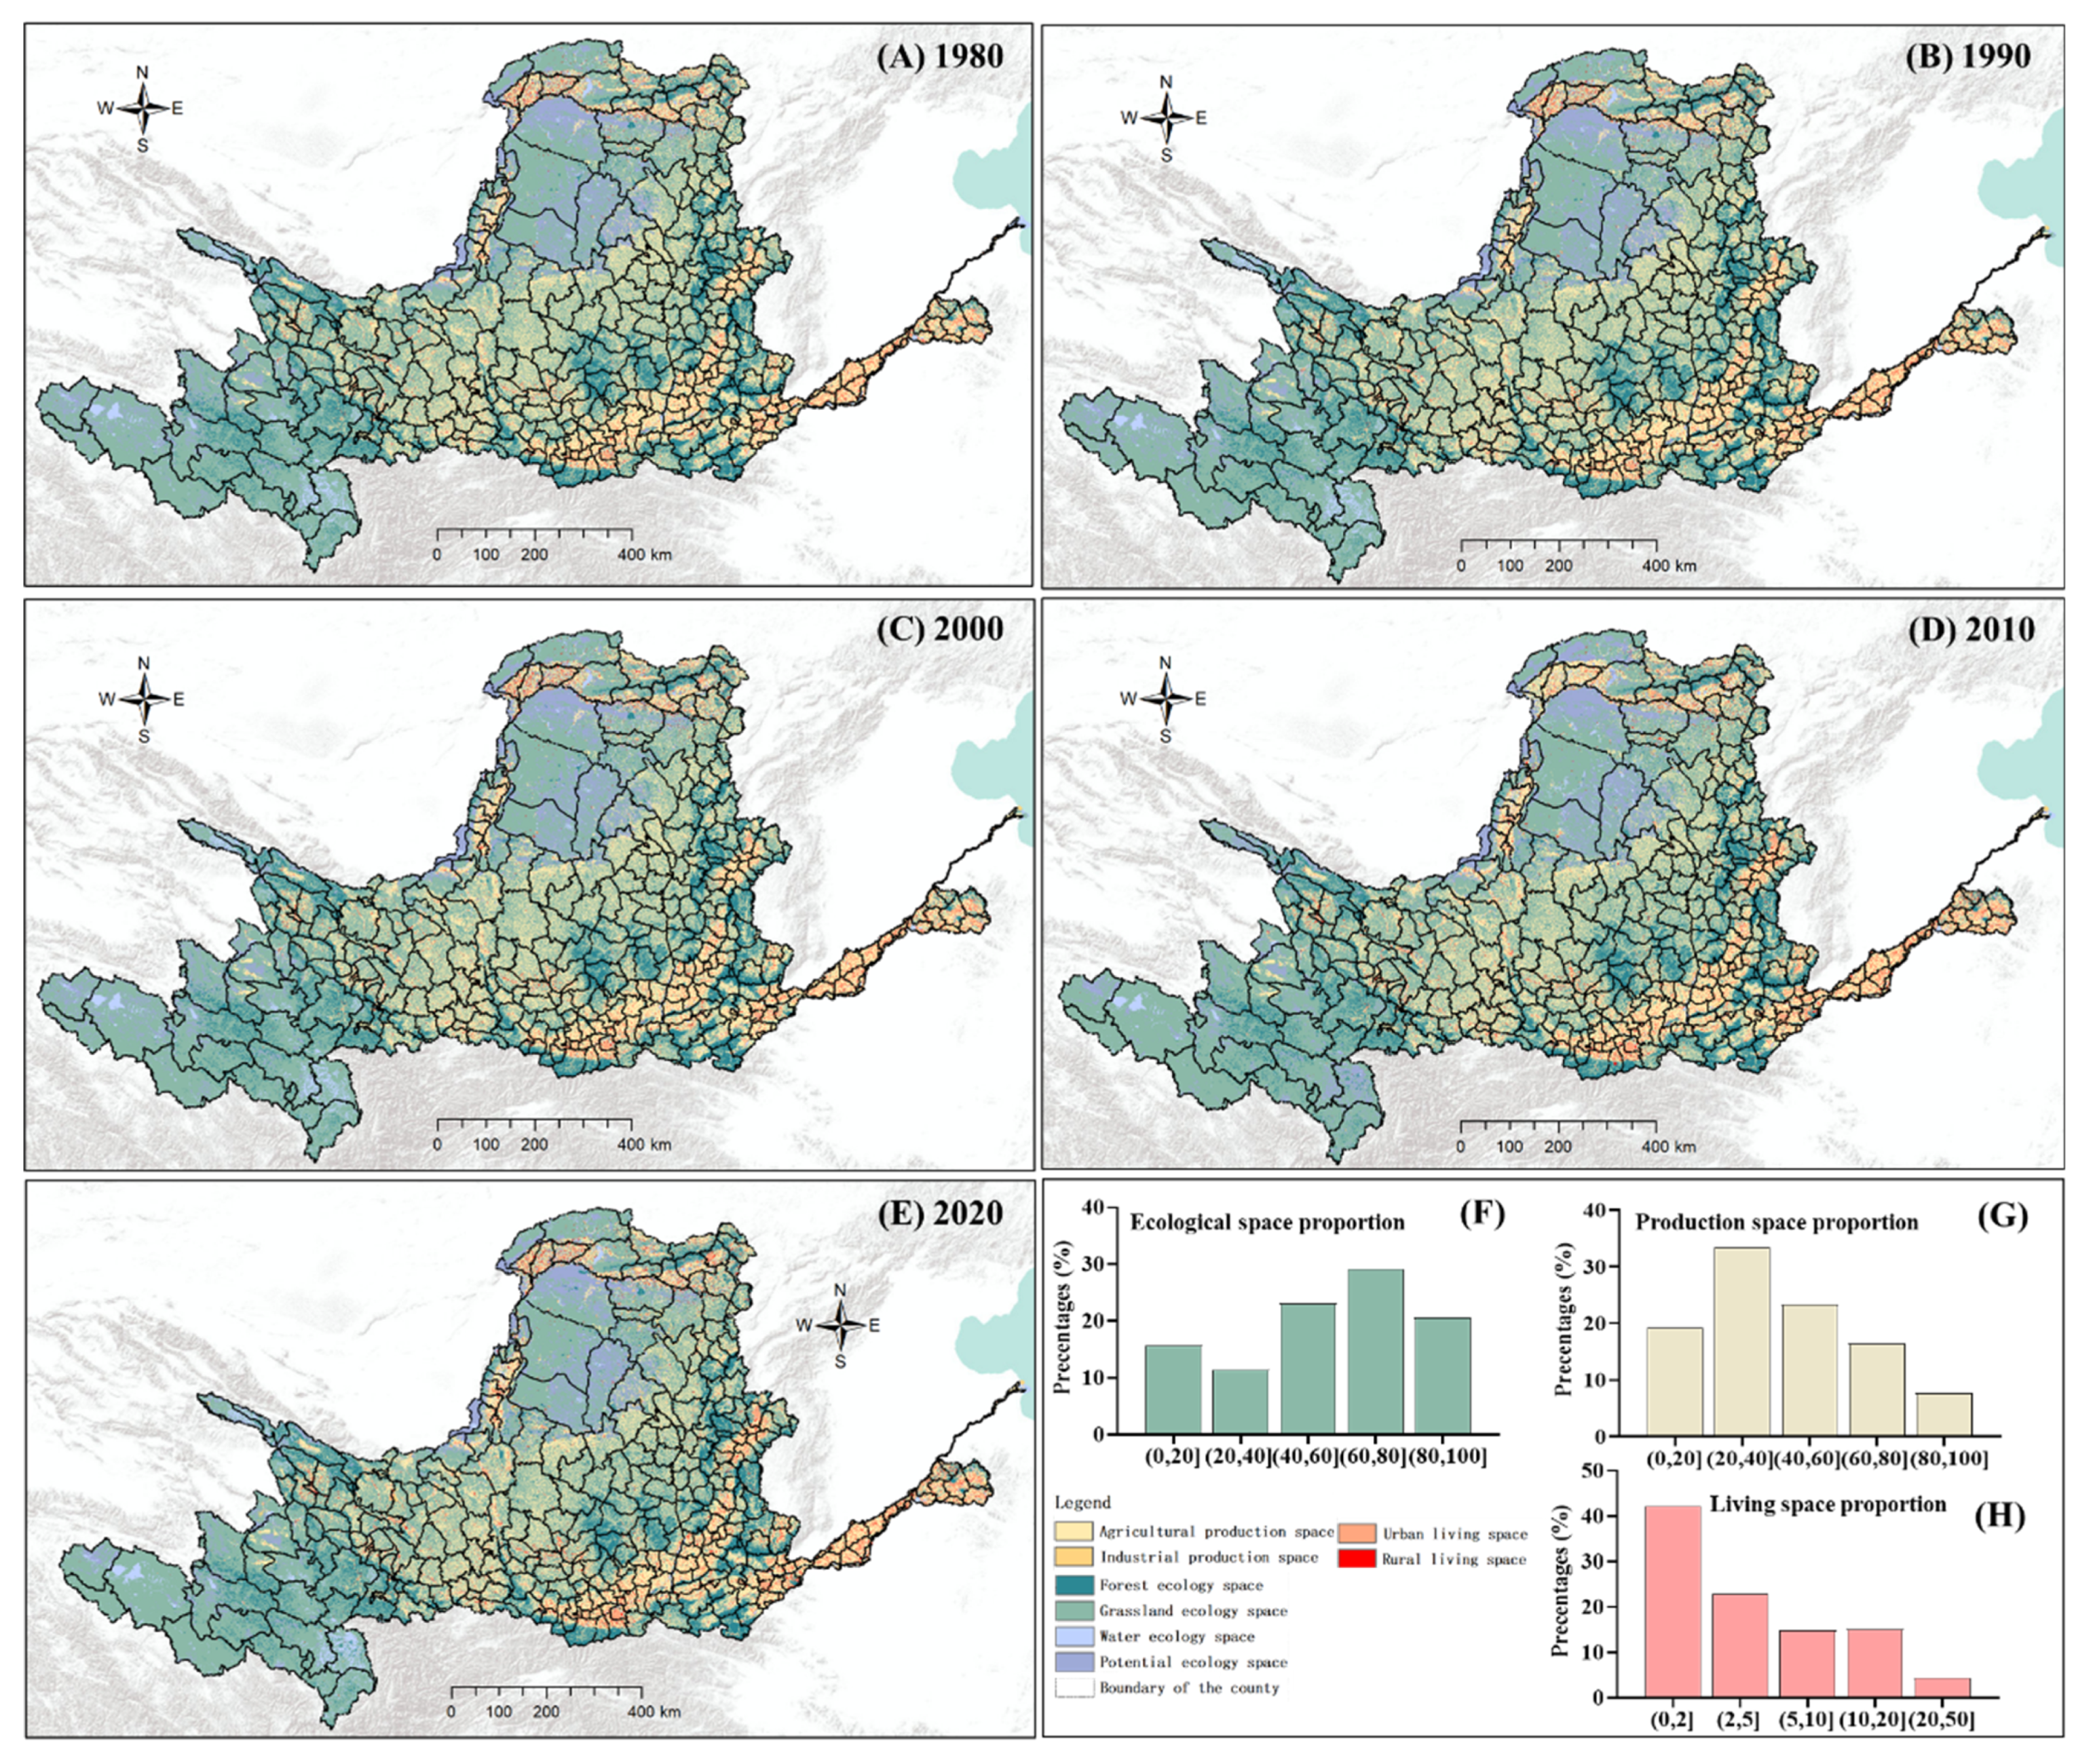
3.1. Land-Use Structure from the Perspective of PLES on the County Level

In the Yellow River Basin (YRB), the spatial structure is predominantly characterized by ecological space and production space, which constituted 71.33% and 25.85% of the total area in 2020, respectively (Figure 2), with living space comprising the remaining 2.82%. Further analysis from the perspective of secondary land-use space shows that grassland ecological space, agricultural production space, and rural living space are the dominant ecological, production, and living spaces, respectively. In 2020, the spatial structure ratio of PLES (production, living, and ecological spaces) was 25.85:2.82:71.33, compared to 26.40:1.89:71.71 in 1980 and 26.78:2.07:71.15 in 2000. From a county-level perspective (Figure 3F–H), the majority of counties (29.10%) exhibit an ecological space ratio ranging from 60~80%. The proportion of ecological space in 27.11% of counties is less than 40%. Additionally, the highest number of counties (33.33%) have a production space ratio between 20~40%, while the living space ratio (42.29%) for the majority of counties falls within the range of 0~2%.
Compared with those in 1980 (Figure 2), the proportion of living space increased significantly by 0.93%, with urban living-space growth increasing by 0.39% and rural living space by 0.35%. The growth rate after 2000 (0.75%) was significantly higher than that before 2000 (0.18%). Notably, living space continued to expand, increasing by 7430 km2, which corresponds to a growth rate of 49.33%. Prior to 2000, production space was on the rise while the ecological space was decreasing. Concurrently, the proportion of production space decreased by 0.93% after 2000, with agricultural production space contracting (−1.57%) and industrial production space expanding (0.64%). Among the fluctuations in ecological space, potential ecological space experienced the most substantial loss, decreasing by 1.17% over the past 40 years, resulting in an overall reduction of 9291.06 km2. Specifically, it contracted by 630.51 km2 from 1980 to 2000 and by 8660.55 km2 from 2000 to 2020. Conversely, forests and grasslands demonstrated the most rapid growth among the variations in ecological space, increasing by 0.42% and 0.30%, respectively, over the past 40 years, with overall increases of 3366.66 km2 and 2389.00 km2.

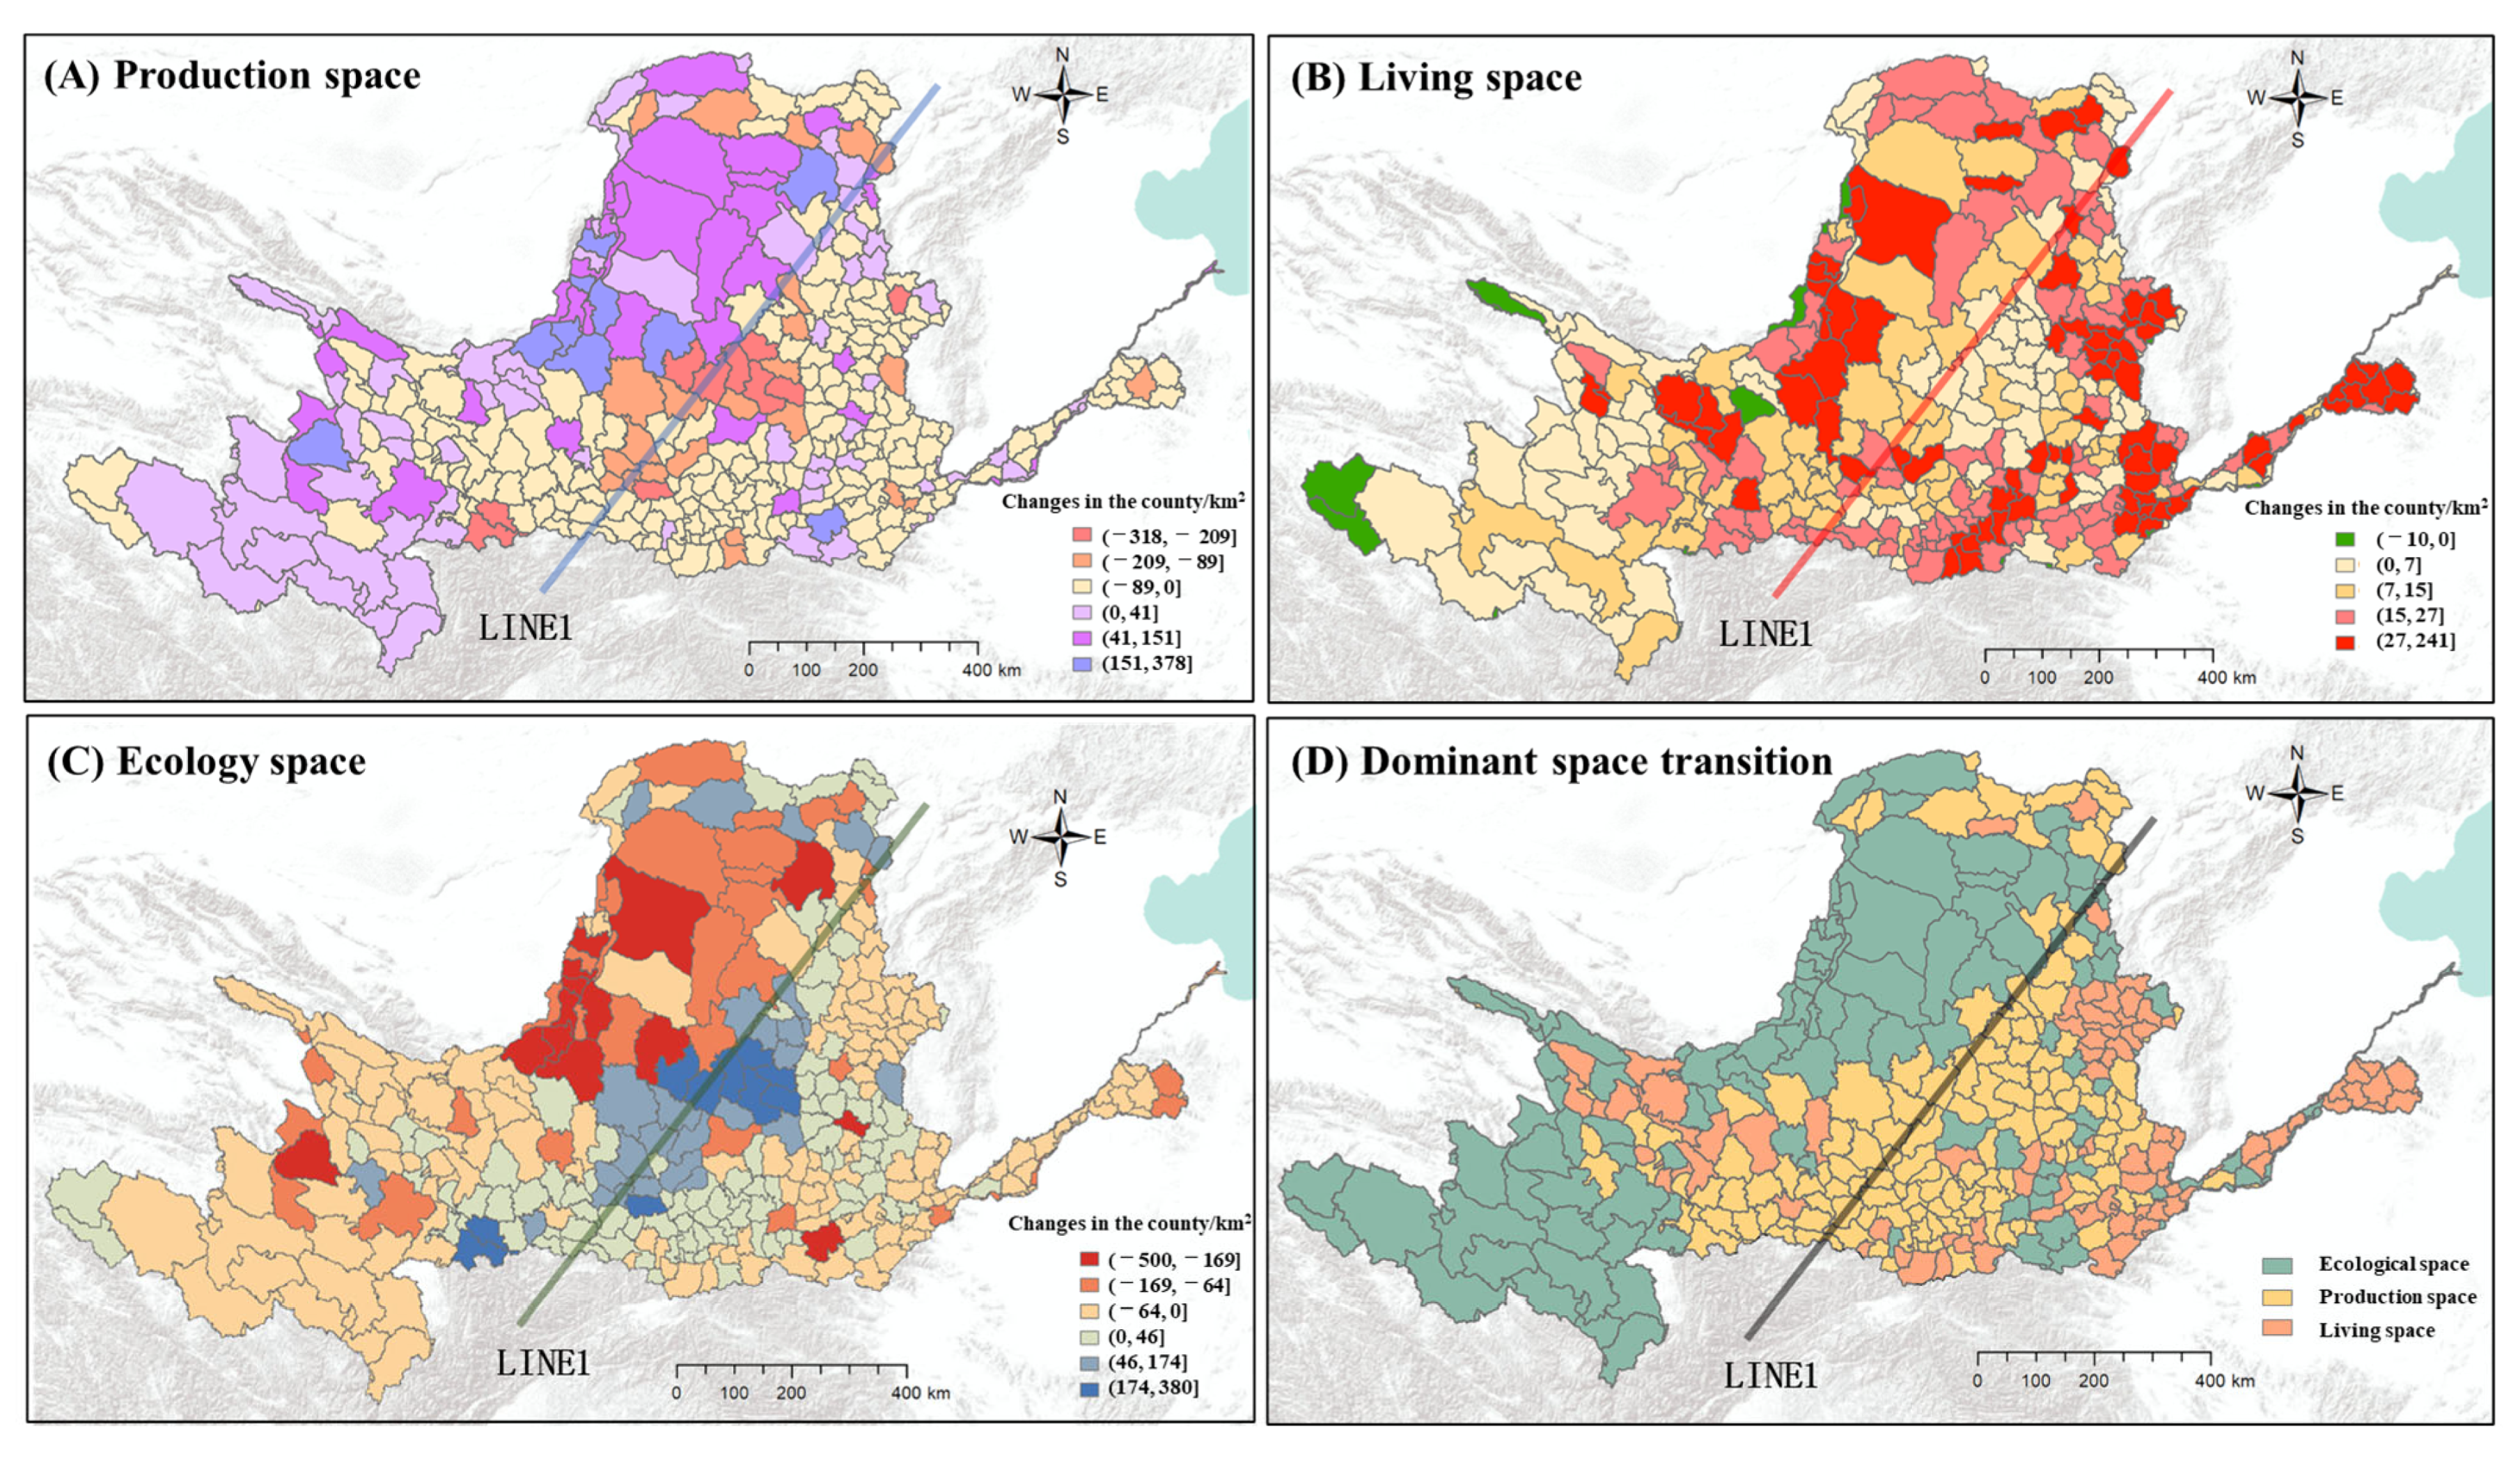
3.2. The Transition Mode Based on the County Level

From 1980 to 2020, the distribution pattern of ecological, production, and living spaces exhibited significant variations at the county level (Figure 3 and Figure 4). The production space is primarily concentrated in flat regions such as the Ningxia–Inner Mongolia irrigation area, the Fenwei Plain, and the downstream beach area along with the river network. Over the past 40 years, 60.10% of counties have experienced a decline in production space, characterized by a decreasing gradient which is low in the northwest (upstream) and high in the southeast (midstream and downstream), roughly delineated by the Hu Huanyong Line. Notably, in the middle and lower reaches, production spaces have exhibited a trend of mild to severe decline.
The ecological space, predominantly located in the Yellow River source area, the Loess Plateau, and the Yellow River estuary, consists of critical natural barriers and resources, their conservation and management being influenced by societal values and policies towards environmental sustainability. Meanwhile, 62.59% of counties have demonstrated a downward trend in ecological space. The contraction of ecological space is primarily concentrated in the five major desert areas upstream of the Yellow River, the source area of the Yellow River, and the downstream beach areas. The amplitude of contraction gradually decreases from the north to the south of the basin. The loss of ecological space is predominantly manifested in the degradation of potential ecological space, which is linked to factors such as ecological protection efforts in the Yellow River source area and the governance of the ’five major deserts’ in Inner Mongolia. In contrast, 36.66% of counties have shown an upward trend in ecological space, with high growth rates primarily observed in the central plateau of the Yellow River and the Fen-Wei Plain area.
The living spaces, integrated within the ecological spaces, are distributed in a clustered and scattered manner around urban agglomeration hubs, highlighting the impact of urbanization and population growth on land-use patterns. These living spaces exhibit a growth pattern that radiates outward from specific urban centers, influencing broader regional development. Except for some counties in the upper reaches of the YRB, living spaces across the entire region (89.03%) have increased at varying scales. Specifically, strong growth rates are noted in the northwest of the Hu Huanyong Line, while mild growth rates are evident in the Fen-Wei Plain area in the southeast.
By identifying the predominant land-use type in a county as the primary direction of change (Figure 4D), we explored their spatial changes at the county level in the YRB. The results indicate that the PLES land-use changes exhibit significant spatial variations: the upstream region is primarily characterized by changes in ecological space, the midstream region is dominated by changes in production space, and the downstream region is characterized by changes in living space. Analyzing the spatial distribution of these changes reveals that, when considering the Hu Huanyong Line as a boundary, the northern part is primarily marked by a reduction in ecological space, which is manifested as production and living space encroaching upon ecological space. In contrast, the middle reaches of the southern area predominantly experience a reduction in production space, which is reflected in the increase in ecological and living space. Lastly, in the downstream areas, the primary trend is an increase in living space, characterized by the encroachment of ecological and production spaces by residential development.

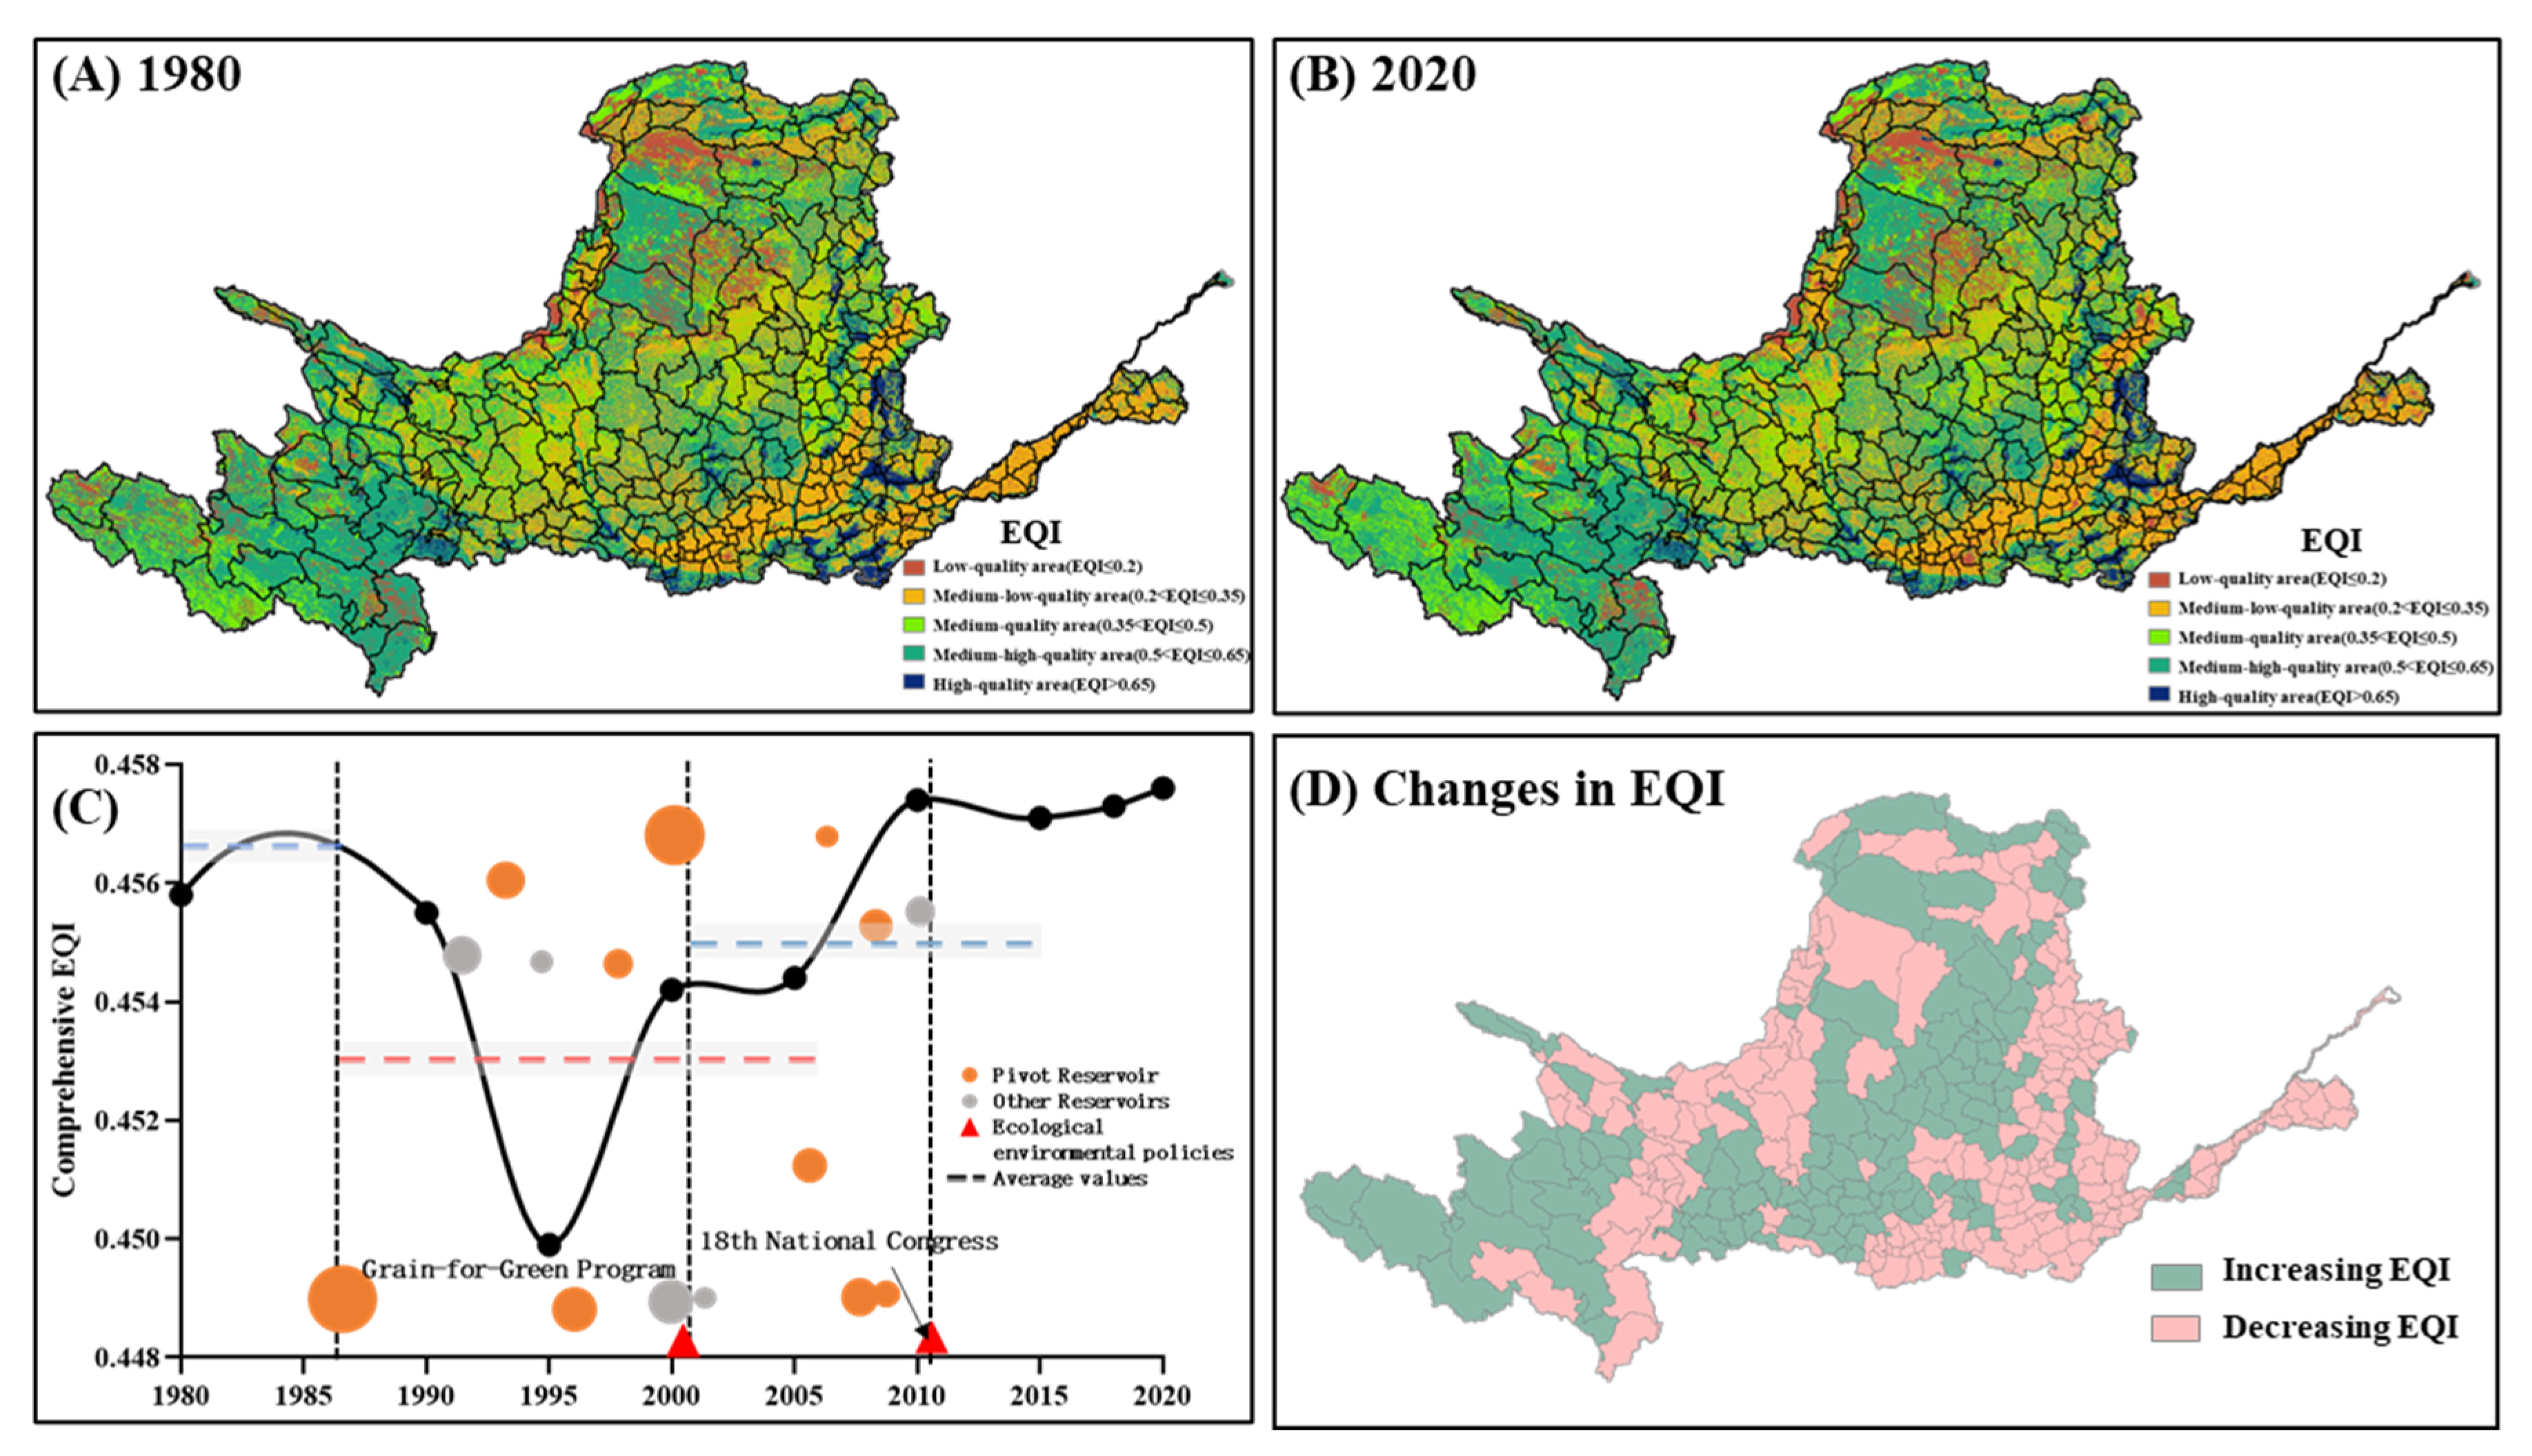
3.3. Eco-Environmental Quality

The eco-environmental quality index (EQI) of grassland ecology space was highest, followed by forest ecology space and agricultural production space. The lowest were industrial production space and urban living space. Based on the five-year period comprehensive EQI data, we mapped out the fluctuation pattern (Figure 5, Table 3). The findings reveal that the study area’s overall EQI dipped slightly from 0.4558 in 1980 to 0.4542 in 2000, but bounced back steeply to 0.4576 by 2020. A detailed examination of land-use shifts between 1980 and 2020 in Section 3.2 and Section 3.3 indicates that the primary transitions were from grassland ecological spaces to agricultural production areas and from agricultural production to urban and rural residential areas. Notably, the EQI for grassland ecological spaces surpassed that of agricultural production spaces and was higher than that of urban and rural living spaces. The development and utilization of grasslands did compensate for some cultivated land loss, while the conversion of cultivated land for construction purposes, driven by economic growth, had a more significant impact on the ecological environment. The sharp improvement in the comprehensive EQI from 2000 onward reflects positive strides in ecological restoration and management efforts. By analyzing the spatial changes in the EQI over the past 40 years (Figure 5D), regions exhibiting improved ecological quality are primarily located near the Hu Huanyong Line and the source area of the Yellow River. These improvements are strongly correlated with regions where significant national ecological projects have been implemented.

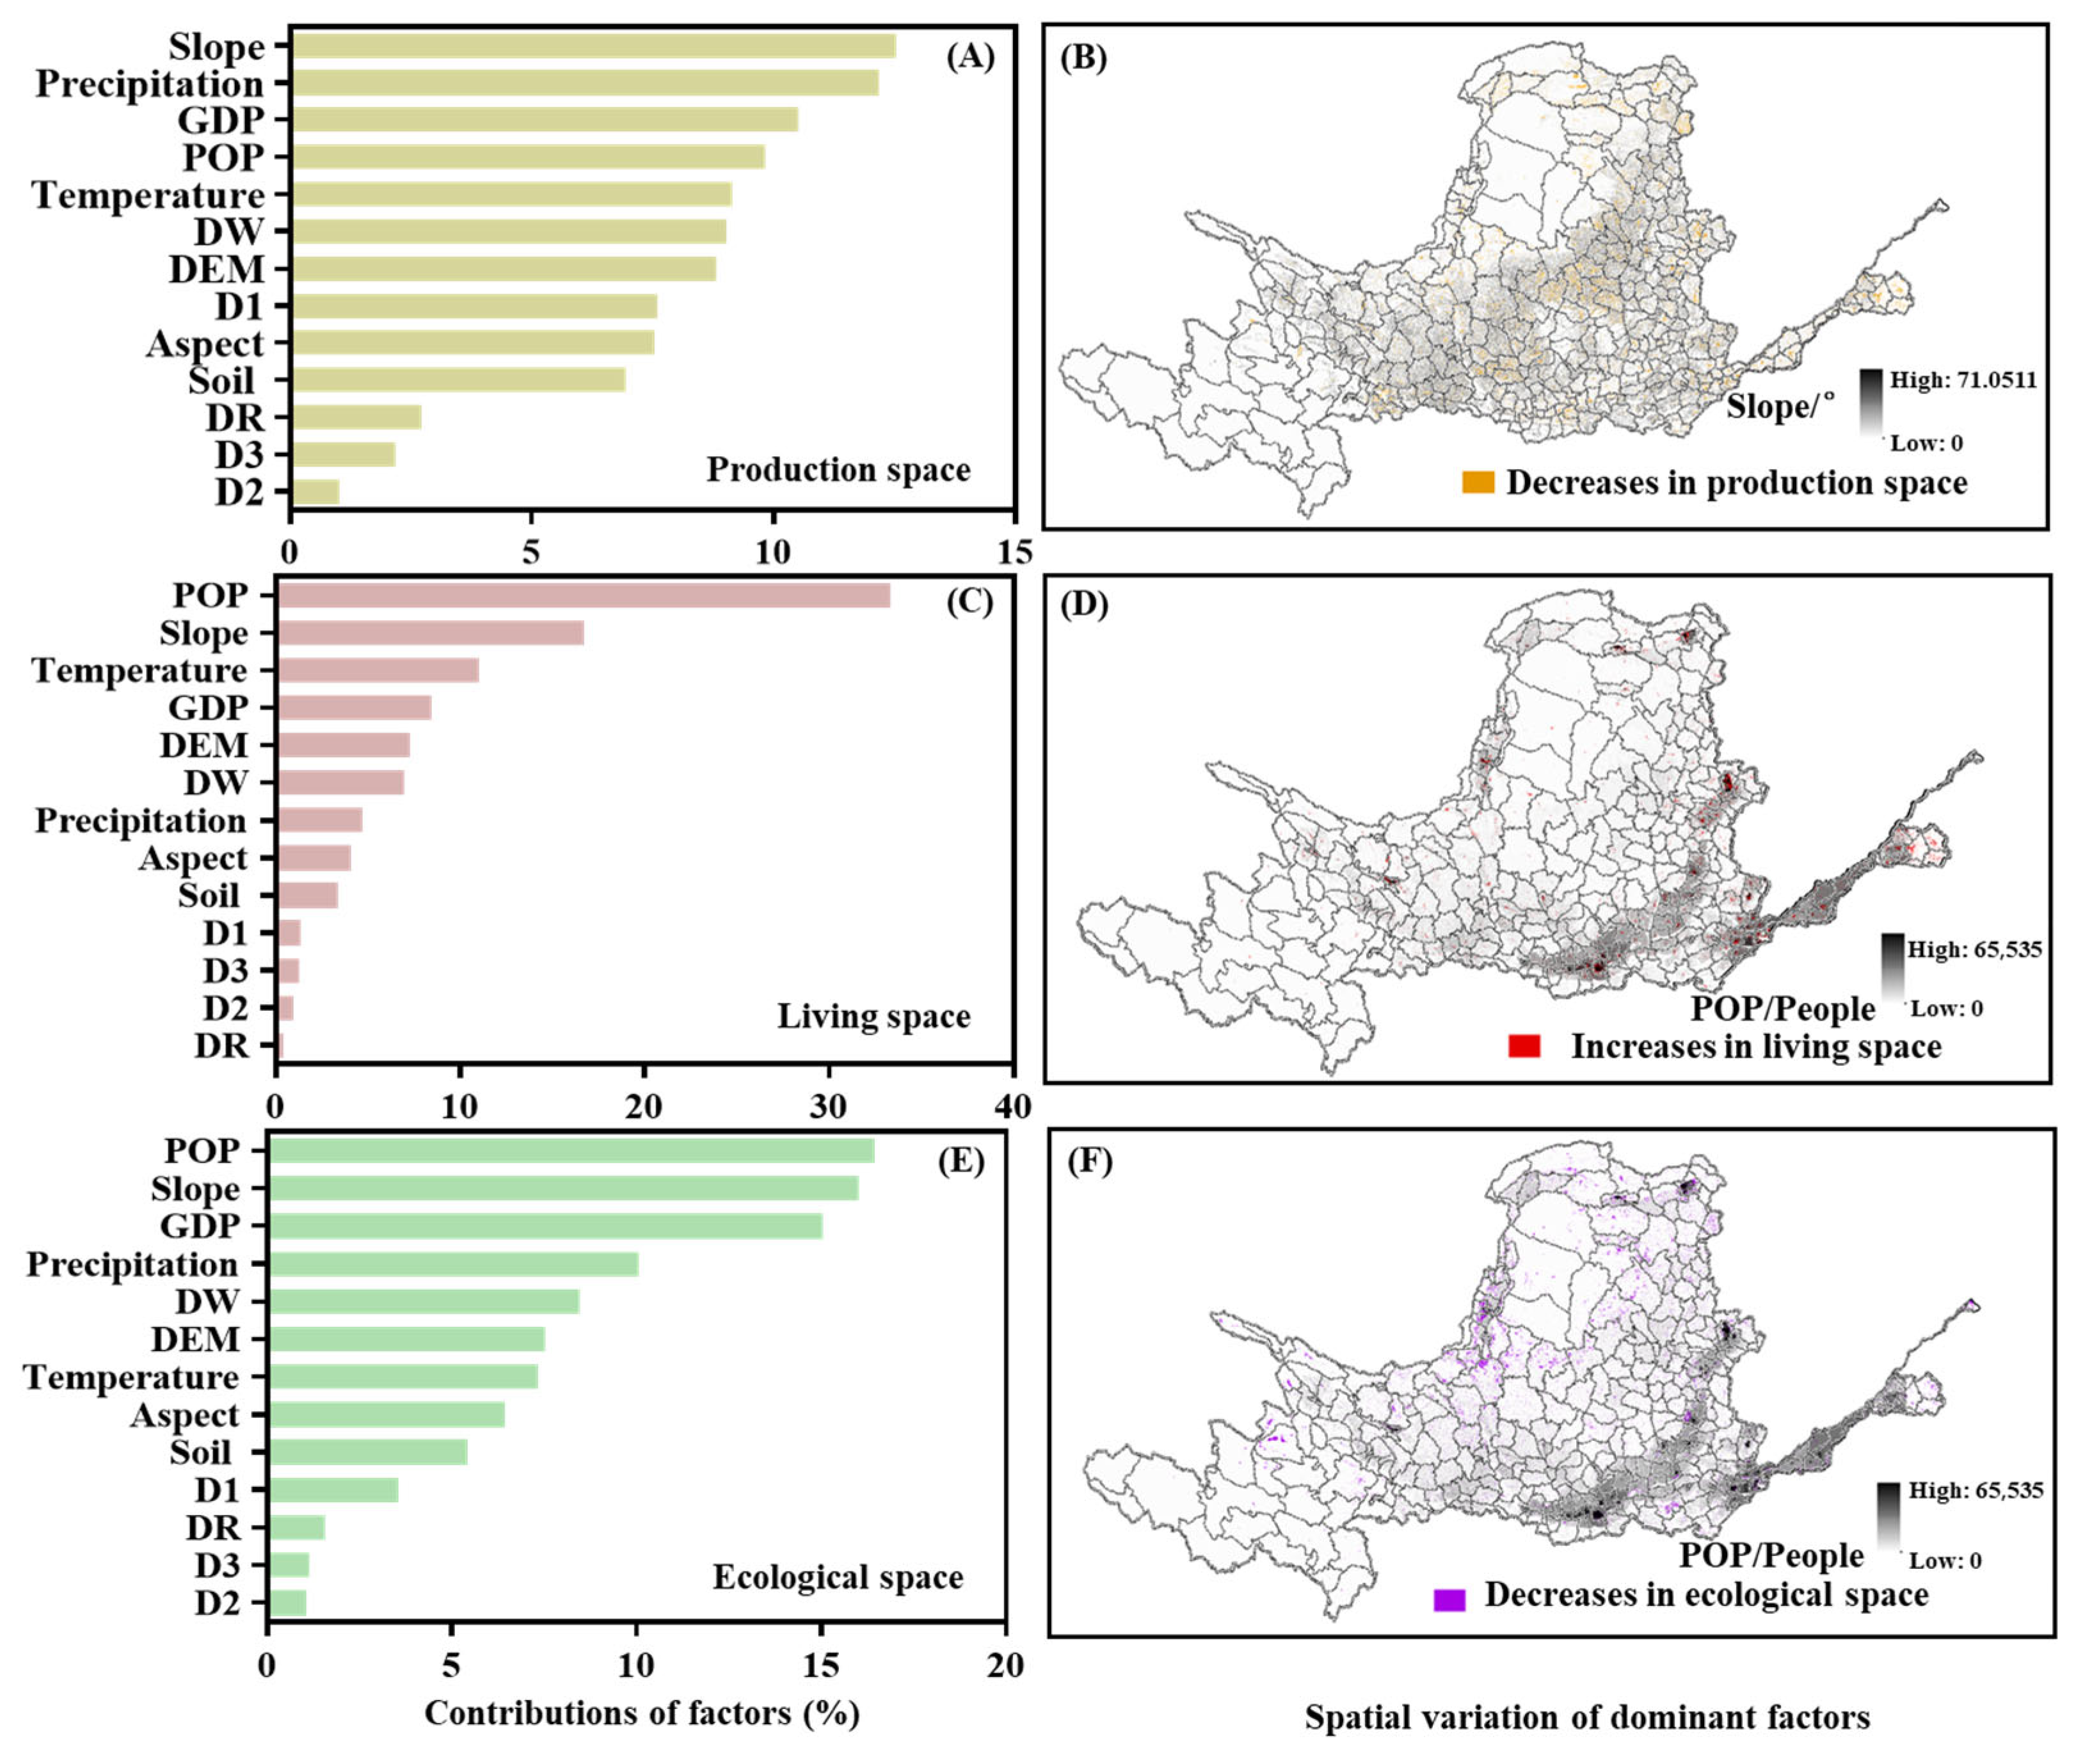
3.4. Driving Factors for PLES Evolution

Using the random forest algorithm to calculate the contribution rates of various influencing factors on land-use changes (Figure 6), it was found that the factors with the highest contributions to the production space in the Yellow River Basin were slope and precipitation, with contribution rates of 12.53% and 12.18%, respectively, followed by GDP (10.50%) and population (9.81%). For living spaces, the factors with the highest contributions were population (33.33%), slope (16.72%), and temperature (10.99%). For ecological spaces, the factors with the highest contributions were population (16.43%), slope (16.01%), and GDP (15.02%).

4. Discussions

4.1. The Influencing Factors for PLES and EQI Evolution Patterns

The Yellow River Basin is still predominantly characterized by ecological space, with the ratio of production, living, and ecological spaces being 25.85:2.82:71.33 in 2020. When contrasted with the Yangtze River Basin (30.64:3.2:66.15, Zhang et al., 2023 [35]) and PoYang lake (34.75:2.81:62.44, Wei et al., 2024 [30]), the ecological space of the YRB still accounts for a high proportion.
From 1980 to 2020, with the year 2000 serving as a pivotal turning point, the ecological space and production space within the Yellow River Basin exhibited contrasting trends. Following 2000, the ecological space gradually expanded, while the production space steadily contracted. This observation is consistent with Niu et al. (2024) and Liu et al. (2021) [9,15], which collectively suggest that the implementation of the “Grain for Green” program has significantly benefited the ecology of the Yellow River Basin. Before 2000, agricultural practices had played a crucial role in the YRB as a human endeavor aimed at accommodating population growth (Fu et al., 2017; Wu et al., 2020) [36,37]. Additionally, our investigation into the driving factors revealed that human activity indicators, such as GDP and population, play crucial roles in influencing changes in production and living spaces. For the YRB, restoring and reconstructing vegetation has served as a significant approach for ecological conservation and soil erosion management (Lu et al., 2012) [38]. By integrating the spatial change trends with county-level spatial transformation patterns, a clearer understanding of spatial transformation emerged. Notably, when considering the Hu Huanyong Line as a boundary, a discernible trend in the changes in ecological space, production space, and living space can be observed from west to east. Furthermore, the implementation of ecological engineering measures in the middle reaches and source regions has proven to be particularly effective in enhancing the quality of the ecological environment.

4.2. Uncertainties in EQI Assessment

The Eco-environmental Quality Index (EQI) is capable of quantitatively illustrating the traits of eco-environmental quality and its changes over time and space. Since its introduction, it has gained significant application (Dong et al., 2021; Wei et al., 2022) [32,39]. Research methods for quantitatively describing the relationship between land-use transitions and eco-environmental quality using EQI are several (Wei et al., 2022) [32]. In this study, a method that assigns ecological weights to various second-level classifications was currently employed. However, this approach presently focuses solely on second-level classifications and does not adequately address the spatial distribution characteristics of the same classification with differing ecological functional attributes. Consequently, there remains significant potential for enhancing the assessment of ecological environmental quality in this study. In future work, we will comprehensively consider ecological quality assessment indices that incorporate both ecological and service functions, thereby providing a more precise evaluation of the ecological environmental impacts of land-use management in watersheds.

5. Conclusions

This study investigates the shifts in land-use structure and its eco-environmental effects in the Yellow River Basin from 1980 to 2020 by employing a land-use transfer matrix within the framework of the collaborative view of production–living–ecological space on the county level. The findings unveiled substantial shifts in the “production-living-ecological” spatial configuration on the county level. This spatial differentiation law takes the Hu Huanyong Line as an important demarcation line, which is characterized by significant changes in the ecological, production, and living spaces of the upstream, midstream, and downstream, respectively. The overall EQI declined, but it subsequently rebounded after 2000 due to the ecological restoration efforts. The ecological environment quality increased mainly in the area near the Hu Huanyong Line and the source area of the Yellow River, indicating the ecological restoration measures have achieved some results, but it still needs to be strengthened in the upstream and the Fen-Wei Plain. These insights offer a foundational framework for policymakers to devise sustainable land-use strategies, thereby fostering a deeper exploration of the intricate human–land relationship within the YRB.

Author Contributions

Conceptualization, J.J., E.J. and S.T.; Methodology, L.H. and C.L.; Data curation, B.Q., J.L. and Y.J. All authors have read and agreed to the published version of the manuscript.

Funding

This research was funded by the National Youth Natural Science Foundation (42207527), the National Key Research and Development Program (2021YFC3200402), the Yellow River Water Science Research Joint Fund (U2243214), the Yellow River Conservancy Research Institute Basic Research Fund Special Project (HKY-JBYW-2022-04), the Science and Technology Development Fund of the Yellow River Institute of Hydraulic Research (202112).

Data Availability Statement

Data available on request due to restrictions by our organization: The data presented in this study are available on request from the corresponding author.

Conflicts of Interest

The authors declare no conflicts of interest.

References

  1. Winkler, K.; Fuchs, R.; Rounsevell, M.; Herold, M. Global land use changes are four times greater than previously estimated. Nat. Commun. 2021, 12, 2501. [Google Scholar] [CrossRef] [PubMed]
  2. Hanaõcek, K.; Rodríguez-Labajos, B. Impacts of land-use and management changes on cultural agroecosystem services and environmental conflicts-a global review. Glob. Environ. Change 2018, 50, 41–59. [Google Scholar] [CrossRef]
  3. Lambin, E.F.; Meyfroidt, P. Global land use change, economic globalization, and the looming land scarcity. Proc. Natl. Acad. Sci. USA 2011, 108, 3465–3472. [Google Scholar] [CrossRef]
  4. Tian, F.; Li, M.; Han, X.; Liu, H.; Mo, B. A production–living–ecological space model for land-use optimisation: A case study of the core tumen river region in China. Ecol. Model. 2020, 437, 109310. [Google Scholar] [CrossRef]
  5. Wang, A.; Liao, X.; Tong, Z.; Du, W.; Zhang, J.; Liu, X.; Liu, M. Spatial-temporal dynamic evaluation of the ecosystem service value from the perspective of “production-living-ecological” spaces: A case study in dongliao River basin, China. J. Clean. Prod. 2022, 333, 130218. [Google Scholar] [CrossRef]
  6. Jiang, X.T.; Zhai, S.Y.; Liu, H.; Chen, J.; Zhu, Y.Y.; Wang, Z. Multi-scenario simulation of production-living-ecological space and ecological effects based on shared socioeconomic pathways in Zhengzhou, China. Ecol. Indic. 2022, 137, 108750. [Google Scholar] [CrossRef]
  7. Ning, J.; Liu, J.; Kuang, W.; Xu, X.; Zhang, S.; Yan, C.; Ning, J. Spatiotemporal patterns and characteristics of land-use change in China during 2010–2015. J. Geogr. Sci. 2018, 28, 547–562. [Google Scholar] [CrossRef]
  8. Fu, B.J.; Tian, H.Q.; Tao, F.L.; Zhao, W.W.; Wang, S. Progress on the impact of global change on ecosystem services. China Basic Sci. 2020, 6, 25–30. (In Chinese) [Google Scholar] [CrossRef]
  9. Liu, B.; Pan, L.B.; Qi, Y.; Guan, X.; Li, J.S. Land use and land cover change in the Yellow River Basin from 1980 to 2015 and its impact on the ecosystem services. Land 2021, 10, 1080. [Google Scholar] [CrossRef]
  10. Asabere, S.B.; Acheampong, R.A.; Ashiagbor, G.; Beckers, S.C.; Keck, M.; Erasmi, S.; Schanze, J.; Sauer, D. Urbanization, land use transformation and spatio-environmental impacts: Analyses of trends and implications in major metropolitan regions of Ghana. Land Use Policy 2020, 96, 104707. [Google Scholar] [CrossRef]
  11. Das, S.; Angadi, D.P. Land use-land cover (LULC) transformation and its relation with land surface temperature changes: A case study of Barrackpore Subdivision, West Bengal, India. Remote Sens. Appl. Soc. Environ. 2020, 19, 100322. [Google Scholar] [CrossRef]
  12. Nguyen, T.T.; Grote, U.; Neubacher, F.; Rahut, D.B.; Hung, M.; Paudel, G.P. Security risks from climate change and environmental degradation: Implications for sustainable land use transformation in the Global South. Curr. Opin. Environ. Sustain. 2023, 63, 101322. [Google Scholar] [CrossRef]
  13. Wynn, J.G.; Duvert, C.; Bird, M.I.; Munksgaard, N.C.; Setterfield, S.A.; Hutley, L.B. Land transformation in tropical savannas preferentially decomposes newly added biomass, whether c3 or c4 derived. Ecol. Appl. 2020, 30, e02192. [Google Scholar] [CrossRef] [PubMed]
  14. Zhao, X.; Calvin, K.V.; Wise, M.A. The critical role of conversion cost and comparative advantage in modeling agricultural land use change. Clim. Change Econ. (CCE) 2020, 11, 1–44. [Google Scholar] [CrossRef]
  15. Niu, H.P.; Xiu, Z.Y.; Xiao, D.Y. Impact of land-use change on ecological vulnerability in the Yellow River Basin based on a complex network model. Ecol. Indic. 2024, 166, 112212. [Google Scholar] [CrossRef]
  16. Ofosu, S.A.; Adjei, K.A.; Odai, S. Ecological vulnerability of the Densu river Basin due to land use change and climate variability. Cogent Eng. 2020, 7, 1735714. [Google Scholar] [CrossRef]
  17. Sun, Z.X.; Liu, Y.; Sang, H.B. Spatial-temporal variation and driving factors of ecological vulnerability in nansi lake basin, China. Int. J. Environ. Res. Public Health 2023, 20, 2653. [Google Scholar] [CrossRef]
  18. Wang, X.; Ma, J.; Feng, X. Spatio-temporal changes and driving factors of windbreak and sand-fixing services in the ecological security barrier of the Yellow River Basin. Acta Ecol. Sin. 2023, 43, 660–671. [Google Scholar] [CrossRef]
  19. Li, C.X.; Wu, J.Y. Land use transformation and eco-environmental effects based on production-living-ecological spatial synergy: Evidence from Shaanxi Province, China. Environ. Sci. Pollut. Res. 2022, 29, 41492–41504. [Google Scholar] [CrossRef]
  20. Li, M.Y.; Li, X.B.; Liu, S.Y.; Lyu, X.; Dang, D.L.; Dou, H.S.; Wang, K.; Cao, W.Y.; Zhang, C.H. Analysis of the spatiotemporal dynamics and driving factors of ecosystem quality in Inner Mongolia from 2005 to 2020. Environ. Technol. Innov. 2024, 35, 103686. [Google Scholar] [CrossRef]
  21. Xie, X.T.; Li, X.S.; Fan, H.P.; He, W.K. Spatial analysis of production-living-ecological functions and zoning method under symbiosis theory of Henan, China. Environ. Sci. Pollut. Res. 2021, 28, 69093–69110. [Google Scholar] [CrossRef] [PubMed]
  22. Yousafzai, S.; Saeed, R.; Rahman, G.; Farish, S. Spatio-temporal assessment of land use dynamics and urbanization: Linking with environmental aspects and DPSIR framework approach. Environ. Sci. Pollut. Res. 2022, 29, 81337–81350. [Google Scholar] [CrossRef] [PubMed]
  23. Fu, J.; Zhang, S. Functional assessment and coordination characteristics of production, living, ecological function—A case study of Henan province, China. Int. J. Environ. Res. Public Health 2021, 18, 8051. [Google Scholar] [CrossRef]
  24. Wang, D.; Jiang, D.; Fu, J.; Lin, G.; Zhang, J. Comprehensive assessment of production–living–ecological space based on the coupling coordination degree model. Sustainability 2020, 12, 2009. [Google Scholar] [CrossRef]
  25. Wang, X.; Duan, L.; Zhang, T.; Cheng, W.; Jia, Q.; Li, J.; Li, M.Y. Ecological vulnerability of China’s Yellow River Basin: Evaluation and socioeconomic driving factors. Environ. Sci. Pollut. Res. 2023, 30, 115915–115928. [Google Scholar] [CrossRef]
  26. Zhang, B.Q.; Tian, L.; Zhao, X.N.; Wu, P.T. Feedbacks between vegetation restoration and local precipitation over the Loess Plateau in China. Sci. China Earth Sci. 2021, 64, 920–931. [Google Scholar] [CrossRef]
  27. Chen, Y.P.; Fu, B.J.; Zhao, Y.; Wang, K.B.; Zhao, M.M.; Ma, J.F.; Wu, J.H.; Xu, C.; Liu, W.G.; Wang, H. Sustainable development in the Yellow River Basin: Issues and strategies. J. Clean. Prod. 2020, 263, 121223. [Google Scholar] [CrossRef]
  28. Zhu, M.; Zhang, X.W.; Elahi, E.; Fan, B.B.; Khalid, Z. Assessing ecological product values in the Yellow River Basin: Factors, trends, and strategies for sustainable development. Ecol. Indic. 2024, 160, 111708. [Google Scholar] [CrossRef]
  29. GB/T 21010-2007; Current Land Use Classification. National Standardization Administration: Beijing, China, 2007.
  30. Wei, G.E.; Liu, Y.B.; Li, R.Z.; Luo, K.; Liu, C.H. Pattern transformation and spatial heterogeneity mechanism of production-living-ecological spaces in Poyang Lake area in last 40 years. Acta Ecol. Sin. 2024, 44, 2308–2322. (In Chinese) [Google Scholar] [CrossRef]
  31. Hu, P.; Li, F.; Sun, X.; Liu, Y.; Chen, X.; Hu, D. Assessment of land-use/cover changes and its ecological effect in rapidly urbanized areas—Taking pearl river delta urban agglomeration as a case. Sustainability 2021, 13, 5075. [Google Scholar] [CrossRef]
  32. Wei, Y.N.; Zhang, Y.; Chen, L.F.; Chen, H.Y.; Zhang, X.Q.; Liu, P. Production–living–ecological space transition and its eco-environmental effects based on an improved area-weighted method: A case study of Gangcheng District, a typical industrial base in China. Front. Environ. Sci. 2022, 10, 972786. [Google Scholar] [CrossRef]
  33. Liang, X.; Guan, Q.F.; Clarke, K.C.; Liu, S.S.; Wang, B.Y.; Yao, Y. Understanding the drivers of sustainable land expansion using a patch-generating land use simulation (PLUS) model: A case study in Wuhan, China. Comput. Environ. Urban Syst. 2021, 85, 101569. [Google Scholar] [CrossRef]
  34. Rad, M.R.P.; Toomanian, N.; Khormali, F.; Brungard, C.W.; Komaki, C.B.; Bogaert, P. Updating soil survey maps using random forest and conditioned Latin hypercube sampling in the loess derived soils of northern Iran. Geoderma 2014, 232–234, 97–106. [Google Scholar] [CrossRef]
  35. Zhang, X.; Zhang, S.C.; Zhang, X.Y.; Liu, J.Y.; Xue, X.F. Spatial and temporal evolution of landscape ecological security and its influencing factors in the Yangtze River Economic Belt from the perspective of production-living-ecological space in the past 40 years. Chin. J. Eco-Agric. 2023, 31, 1539–1552. (In Chinese) [Google Scholar] [CrossRef]
  36. Fu, B.J.; Wang, S.; Liu, Y.; Liu, J.B.; Liang, W.; Miao, C.Y. Hydrogeomorphic Ecosystem Responses to Natural and Anthropogenic Changes in the Loess Plateau of China. Annu. Rev. Earth Planet. Sci. 2017, 45, 223–243. [Google Scholar] [CrossRef]
  37. Wu, X.; Wei, Y.; Fu, B.; Wang, S.; Zhao, Y.; Moran, E.F. Evolution and effects of the social-ecological system over a millennium in China’s Loess Plateau. Sci. Adv. 2020, 6, eabc0276. [Google Scholar] [CrossRef]
  38. Lu, Y.H.; Fu, B.J.; Feng, X.M.; Zeng, Y.; Liu, Y.; Chang, R.Y.; Sun, G.; Wu, B.F. A Policy-Driven Large Scale Ecological Restoration: Quantifying Ecosystem Services Changes in the Loess Plateau of China. PLoS ONE 2012, 7, 31782. [Google Scholar] [CrossRef]
  39. Dong, J.; Zhang, Z.; Da, X.; Zhang, W.; Feng, X. Eco-environmental effects of land use transformation and its driving forces from the perspective of “production-living-ecological” spaces: A case study of Gansu province. Acta Ecol. Sin. 2021, 41, 5919–5928. [Google Scholar] [CrossRef]
Figure 1. Location of the study area.
Land 14 00427 g001
Figure 2. The changing trend (A,B) and structure (C,D) of the ecological–production–living spaces in the Yellow River Basin from 1980 to 2020: (C) is based on the primary classification; (D) is based on the secondary classification.
Land 14 00427 g002
Figure 3. The distribution of production–living–ecological spaces based on the secondary land-use classification (AE) and a histogram of the proportion distribution of ecological (F), production (G), and living (H) space at the county level of the Yellow River Basin from 1980 to 2020.
Land 14 00427 g003
Figure 4. Evolution of the distribution pattern of the production–living–ecological spaces in counties and districts (AC), and the dominant changes in production–living–ecological spaces on the county scale (D) of the Yellow River Basin in the past 40 years (LINE1 represents the Hu Huanyong Line).
Land 14 00427 g004
Figure 5. Spatial distribution of the eco-environment quality levels (A,B)—EQI is the eco-environmental quality index of each ecological unit—and the changing trend of the comprehensive eco-environment quality index under the influence of cascade development of reservoirs and major policies (C) and the changes in EQI (D) from 1980 to 2020 of the Yellow River Basin.
Land 14 00427 g005
Figure 6. The contributions of driving factors for production (A), living (C), and ecological (E) spaces and the spatial variation in dominant factors from 1980 to 2020 of the production (B), living (D) and ecological (F) spaces of the Yellow River Basin.
Land 14 00427 g006
Table 1. Production–living–ecological space classification and ecological weight assignment.
Primary Land-Use SpaceSecondary Land-Use SpaceLand-Use Type
Production spaceAgricultural production spacePaddy land (0.30), dry land (0.30)
Industrial production spaceMining lease (0.15), transportation land (0.15)
Living spaceUrban living spaceUrban land (0.20)
Rural living spaceRual residential land (0.20)
Ecological spaceForest ecology spaceWoodland (0.95), shrubbery (0.65), other woodland (0.50)
Grassland ecology spaceHigh-coverage grassland (0.65), middle-coverage grassland (0.55), low-coverage grassland (0.45)
Water ecology spaceRiver (0.53), reservoir pond (0.53), ditches (0.53), inland tidal flats (0.53)
Potential ecology spaceNaked land (0.05), sandy land (0.05)
Table 2. Information on natural and anthropogenic driving factors.
Data TypeData NameDescription
Natural FactorsDEM
SlopeCalculated from DEM data
AspectCalculated from DEM data
TemperatureInterpolated calculation
PrecipitationInterpolated calculation
Distance to waterEuclidean distance
Social FactorsPopulationResampling
GDPResampling
Distance to class 1 roadsEuclidean distance
Distance to class 2 roadsEuclidean distance
Distance to class 3 roadsEuclidean distance
Distance to railwaysEuclidean distance
Table 3. Eco-environment quality index (EQI).
Production–Living–Ecological Land ClassificationEQI
Primary Land-Use SpaceSecondary Land-Use Space19801990200020102020Average
Production spaceAgricultural production space0.07890.0792 0.0800 0.0775 0.0753 0.0782
Industrial production space0.0001 0.0002 0.0002 0.0006 0.0011 0.0004
Living spaceUrban living space0.0004 0.0005 0.0006 0.0012 0.0014 0.0008
Rural living space0.0033 0.0033 0.0035 0.0039 0.0042 0.0037
Ecological spaceForest ecology space0.0955 0.0956 0.0953 0.0977 0.0973 0.0963
Grassland ecology space0.2585 0.2583 0.2568 0.2583 0.2596 0.2583
Water ecology space0.0151 0.0145 0.0140 0.0148 0.0154 0.0148
Potential ecology space0.0039 0.0039 0.0039 0.0034 0.0033 0.0037
Disclaimer/Publisher’s Note: The statements, opinions and data contained in all publications are solely those of the individual author(s) and contributor(s) and not of MDPI and/or the editor(s). MDPI and/or the editor(s) disclaim responsibility for any injury to people or property resulting from any ideas, methods, instructions or products referred to in the content.

