Article

Spatiotemporal Evolution Mechanism and Spatial Correlation Network Effect of Resilience in Different Shrinking Cities in China

1
Advanced Institute of Natural Sciences, Beijing Normal University, Zhuhai 519087, China
2
Huitong College, Beijing Normal University, Zhuhai 519087, China
3
School of Environment, Beijing Normal University, Beijing 100875, China
4
Key Laboratory of Coastal Water Environmental Management and Water Ecological Restoration of Guangdong Higher Education Institutes, Beijing Normal University, Zhuhai 519087, China
5
Zhixing College, Beijing Normal University, Zhuhai 519087, China
*
Author to whom correspondence should be addressed.
Land 2025, 14(2), 348; https://doi.org/10.3390/land14020348
Submission received: 2 January 2025 / Revised: 31 January 2025 / Accepted: 6 February 2025 / Published: 8 February 2025

Abstract

:
Bolstering the resilience of shrinking cities (SCs) is essential for maintaining urban dynamic security and fostering sustainable development. Accurately assessing and revealing the resilience level and impact mechanism of SCs to cope with disturbances and shocks has become a hot topic of research in urban sustainable development. In this research, we presented a systematic conceptualization of the fundamental components of urban shrinkage (US) and urban resilience (UR) and, based on US and UR theories, constructed a methodological framework aimed at investigating the spatiotemporal evolution mechanism and spatial correlation network effect of resilience in different SCs in China. This paper initially evaluates the UR levels of various types of SCs in China by establishing an evaluation model for US and a multidimensional evaluation index system for UR based on the theoretical frameworks, aligned with the national context in China. We also define the spatiotemporal evolution patterns of UR for different types of SCs. Subsequently, this paper employs a coupled coordination model and a geographical detector model to elucidate the influencing mechanisms on UR of different types of SCs, focusing on UR subsystems and indicators. Finally, this paper empirically examines the spatial correlation network effects of UR under various US scenarios using a social network analysis model. The results show that many SCs have progressively adjusted to the challenges posed by US, and the UR of SCs has shown an upward trend from 2010 to 2021. Cities with higher US levels generally show lower coordination in UR subsystems. The comprehensive utilization rate of industrial solid waste and road freight per capita are crucial for improving the UR of cities with higher US levels. Moreover, US probably strengthens UR connections between cities, facilitating resilience transmission and dissemination. These findings advance UR research within the US framework and offer theoretical foundations and planning guidance for environmentally friendly and high-quality development in shrinking cities.

1. Introduction

The worldwide occurrence of urban shrinkage (US) is becoming more widespread as a result of globalization and the changing dynamics within urban societies [1,2]. Factors such as industrial transformations, aging demographics, institutional changes, and both global and local economic crises have led to significant population decline and economic downturns in over a quarter of cities globally, with approximately 40% of cities in Europe and around 10% of cities in North America experiencing these processes [3,4,5,6,7,8]. China, as the largest developing country globally, is currently facing an unprecedented level of urbanization, which also presents an inevitable challenge of US [9,10]. In the last decade, changes in the global development landscape and economic trajectory as China transitions into a new phase have resulted in structural transformations in the internal and external factors influencing urban development in China. The previous growth-oriented urbanization model has become unsustainable. Various factors have contributed to this transition, including the aftermath of the global financial crisis era, the repercussions of the COVID-19 pandemic, the decline in export-driven manufacturing, the reduction in demographic dividends, the waning of industrial cost advantages, stricter regulations on land finance, and the aging population [11,12,13,14]. These factors have led to US in different regions. Instances of US in China include general shrinkage in the northeast, localized shrinkage in industrially and commercially focused cities in the east, and dependent shrinkage observed in small to medium-sized towns on the peripheries of major metropolitan areas [15,16,17].
Shrinking cities (SCs) have emerged as a significant focal point in the urbanization of China, garnering notable attention in scholarly discussions [18,19]. A growing number of scholars are shifting their focus to studying US at different spatial scales, such as at the levels of prefecture-level cities, counties, and even towns [17,20,21,22,23]. This perspective allows for a more granular understanding of US, highlighting the fact that the phenomenon is not uniform across different administrative levels or regions. Analyzing US from such multiple spatial perspectives helps reveal the localized nature of US, with distinct patterns emerging in areas of varying economic structures, population densities, and policy environments. Additionally, the phenomenon of US is distinguished by its intricate nature, multidimensional characteristics, and intricate interplay with the surrounding environment. Consequently, exploring the diverse causes of US and accurately pinpointing SCs are pivotal areas of inquiry in the field of US research. While initial studies primarily focused on demographic changes and industrial transitions, recent scholarship has broadened to encompass urban development conditions, including transportation infrastructure, social determinants, and policy frameworks [24,25,26,27]. Regarding identification methodologies, researchers have increasingly turned to remote sensing technology and big data to integrate observable social phenomena and geospatial perspectives, moving beyond a sole reliance on demographic data for evaluating SCs [28,29,30,31]. Furthermore, researchers have drawn comparisons between the ways in which various governments address the challenges posed by US, focusing on policy innovations and governance models. In developed countries, many cities have implemented strategies such as economic diversification, land reuse, and community engagement to address US [32,33,34,35]. In contrast, China’s response to US, particularly in its industrial cities in the northeast, has focused on revitalizing industrial zones, improving transportation infrastructure, and attracting new industries to reverse economic stagnation [9]. Therefore, governments worldwide are actively seeking appropriate solutions for the future development of SCs, exploring strategies that can effectively address the challenges posed by population decline and economic stagnation.
Given the multifaceted challenges faced by SCs, there is an increasing recognition that traditional approaches may not suffice to address the complexity of these urban transformations. To effectively cope with external environmental pressures and internal dynamics, SCs must develop the capacity to adapt, recover, and renew. As a result, the concept of building resilient cities has emerged as a critical approach to address US, mitigate disaster impacts, and achieve sustainable development goals. The term “resilience” is derived from the Latin word “resilio”, denoting a return to an original state [36]. With the growing awareness of crises such as economic recessions and extreme weather events, the notion of resilience has been widely applied to explore adaptive urban strategies for navigating unpredictable future challenges. Several cities, including Beijing, Shanghai, Guangzhou, Chengdu, and Xi’an, have incorporated the development of resilient cities into their urban master plans or official reports, moving from the planning phase to implementation. Recently, numerous scholars have conducted detailed studies to evaluate the levels of urban resilience (UR) [37,38,39,40,41,42]. The establishment of a comprehensive and scientifically grounded indicator system for evaluating UR represents a fundamental objective within contemporary UR research. Given that UR encompasses intricate interactions among various systems, reliance on a singular evaluation framework has proved inadequate for fully encapsulating the complexities inherent in urban dynamics. Consequently, the academic community has progressively embraced multidimensional frameworks for the development of UR indicator systems [43,44,45]. These frameworks typically encompass physical, natural, economic, institutional, and social dimensions, thereby reflecting the multifaceted elements that contribute to a city’s capacity to adapt, recover, and transform in response to disturbances [46]. Furthermore, scholars have increasingly acknowledged that UR cannot be comprehensively understood in isolation from broader urban issues [47]. As a result, there is a growing emphasis within UR research on elucidating the interactions between UR and other critical urban challenges, such as urban inequality, economic recovery, and environmental sustainability [48,49,50]. This heightened awareness of the interconnections between UR and various urban challenges has fostered a focus on integrated UR. Thus, the integration of resilience with other urban development objectives has emerged as a central theme in recent UR scholarship, which is vital for the creation of resilient cities capable of adapting to both current challenges and future uncertainties. Therefore, with a deeper understanding of UR, enhancing the UR of SCs is expected to promote a positive synergy between high-quality development and increased security levels.
However, the differing research goals and focuses between studies on US, which look into the effects of urban depopulation and economic downturns, and those on UR, which examine cities’ responses to and recovery from shocks and disasters, have resulted in a lack of integration between these two areas. Although there have been notable advancements in research related to both US and UR [51,52,53,54,55], one key limitation is that research on UR has not fully embraced the perspective of SCs, leading to several gaps in understanding resilient development in this context. First, the interaction and transmission mechanisms between US and UR have not been thoroughly explored [56,57]. Second, there is insufficient consideration of how economic and social factors affect UR in different SCs, resulting in a narrow analysis that fails to capture the complexities of these cities [58,59]. Third, existing studies have predominantly focused on the UR of individual SCs [60], which restricts data coverage and limits the examination of interconnections across different spatial scales. Consequently, systematic research on UR in SCs is necessary to broaden and deepen understanding in this field. Building on the literature gaps mentioned above, future studies could explore the interaction and transmission mechanisms between US and UR, which have not been fully integrated in prior research. By considering multiple dimensions of UR, such research would provide a broader understanding of the factors that shape resilience in SCs. Additionally, it would go beyond the typical focus on individual cities by expanding the analysis to multiple cities, offering a more comprehensive view that includes spatial interconnections across different scales. These contributions would fill a critical void in the existing literature and provide a more nuanced understanding of UR in SCs.
Based on these potential research directions, this study initially employs the US model to categorize various categories of SCs and develops a multidimensional evaluation index system for UR, aligned with the national context in China. We also define the spatiotemporal evolution patterns of UR for different types of SCs. Subsequently, this paper employs a coupled coordination model and a geographical detector model to elucidate the influencing mechanisms on UR of different types of SCs, focusing on UR subsystems and indicators. Finally, this paper empirically examines the spatial correlation network effects of UR under various US scenarios using a social network analysis model. In conclusion, this study contributes to the understanding of UR development in the context of US, offering insights into the spatial change characteristics, the influencing mechanisms, and the spatial correlation network effect of UR in different types of SCs. The findings provide a theoretical foundation for informed decision-making regarding US processes in the future and the sustainable development of cities in the new normal.

2. Materials and Methods

2.1. Study Area

China comprised 691 cities by 2021, including 4 municipalities, 15 sub-provincial cities, 278 prefecture-level cities, and 394 county-level cities. To ensure data completeness and study representativeness, our study area encompasses 285 prefecture-level and higher cities (Figure 1). Since the initiation of the reform and opening-up policy, China’s economy has grown quickly, resulting in a substantial increase in the movement of people, resources, and information into cities. Despite the swift urbanization and city expansion in China, there exist notable disparities in city development. This rapid urban growth and uneven development have caused many cities to experience US. City construction will shift focus from extensive expansion to enhancing the urban environment, emphasizing the establishment of new city models like green cities and smart cities. This evolution places greater demands on cities for high-quality sustainable development.

2.2. Methodology

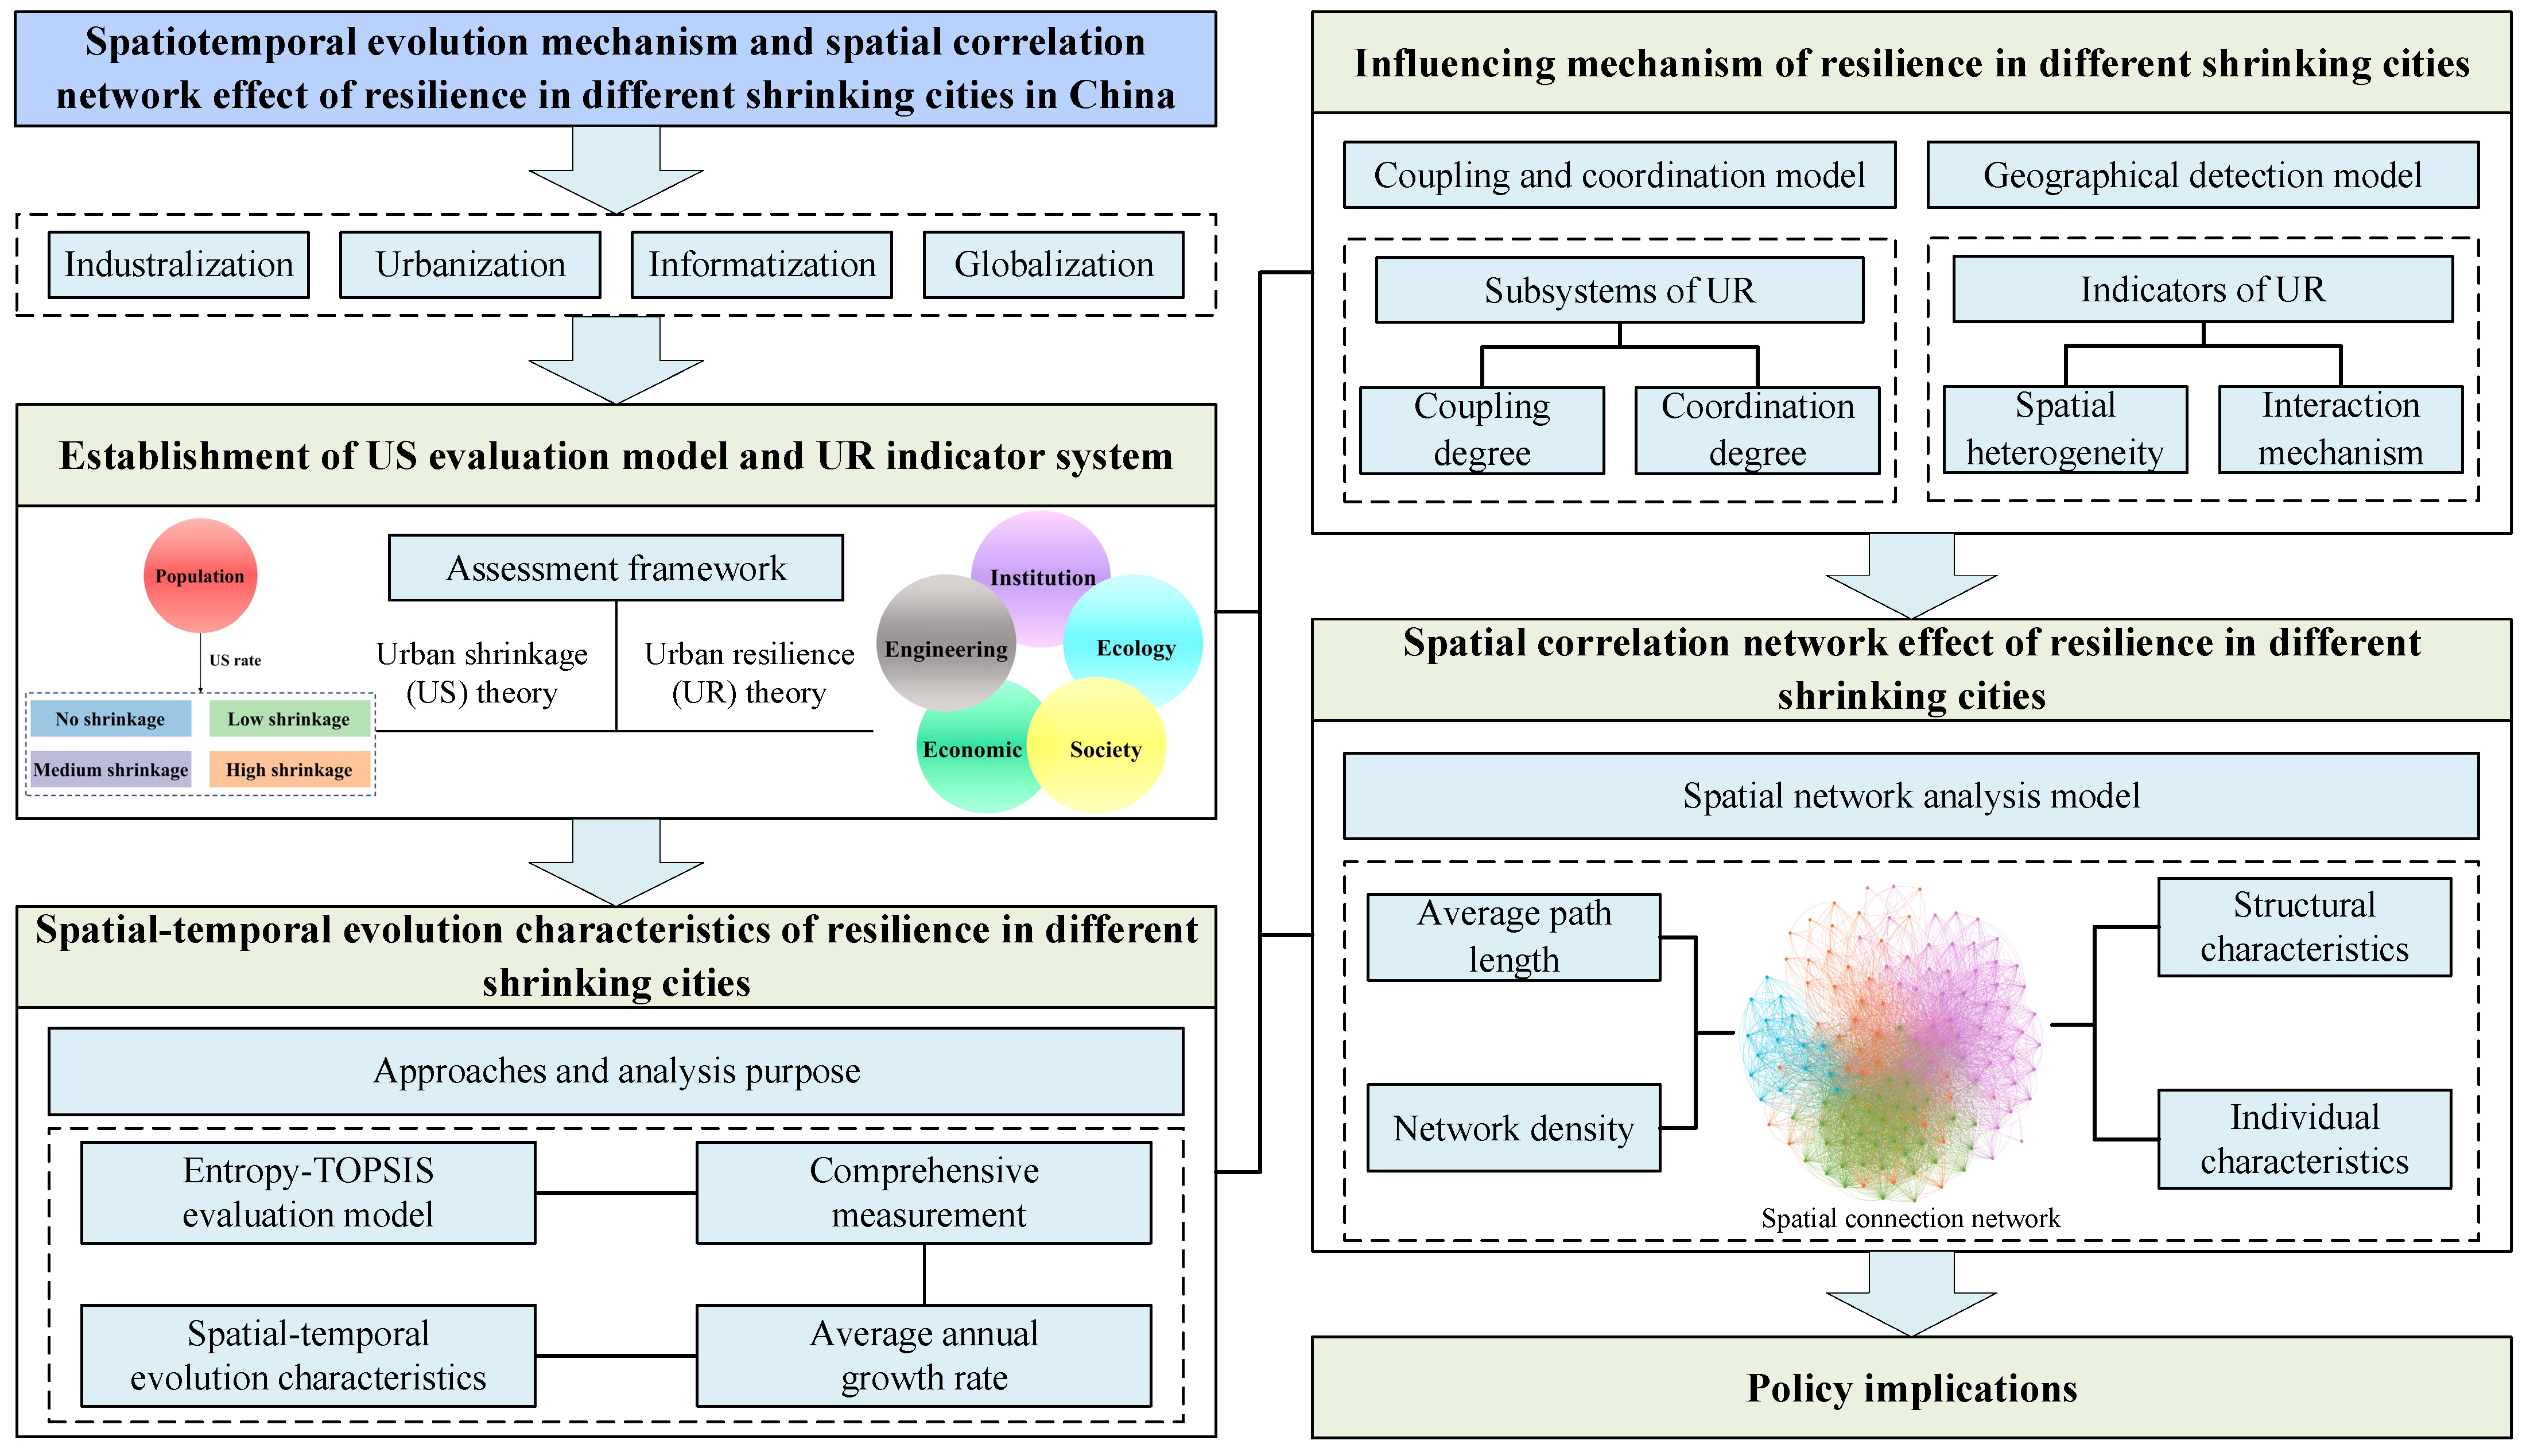
2.2.1. Methodological Framework

Aiming to thoroughly investigate the evolution of UR within the framework of US, as well as to analyze the interaction mechanisms and propagation pathways between these two phenomena, this study presents a systematic conceptualization of the fundamental components of US and UR (Figure 2). The study outlines UR across five core aspects: social, economic, institutional, ecological, and engineering resilience. By developing UR subsystems that correspond to these five dimensions, the study seeks to elucidate the roles and mechanisms that each dimension contributes to the process of US.
The contemporary global landscape is currently experiencing a profound transformation. The primary contradiction within Chinese society has shifted significantly, leading to increased uncertainties. US has become a phenomenon in numerous cities, intensifying the susceptibility, interactivity, proliferation, and hazardous nature of various risks and latent threats. Therefore, there is an urgent necessity to establish resilient cities to safeguard the new development paradigm of Chinese urban centers. Based on US and UR theories, we propose a methodological framework to explore the spatiotemporal evolution mechanism and spatial correlation network effect of resilience in different SCs in China (Figure 3). We developed a comprehensive UR assessment framework tailored to various types of SCs in China. In this framework, we established an evaluation model for US and a multidimensional indicator system for UR. We further explored the dynamic evolution of spatiotemporal UR patterns in diverse SCs and analyzed the influencing mechanism through a coupled coordination model and a geographical model. Finally, we employed a social network analysis model to illustrate the spatial relationships on UR under the impact of US, revealing the internal structure of UR networks and the spatial correlation network effect among them. By amalgamating insights from US and UR research, this study aims to provide a theoretical basis and practical guidance for establishing a more secure urban environment in China.

2.2.2. Establishment of US Evaluation Model and UR Indicator System

A systematic framework is essential for the comprehensive assessment of shrinking and resilient cities, as it directly impacts the scientific rigor and accuracy of the results.
The alteration in population size serves as the most straightforward metric for evaluating whether a city is experiencing US [61]. Consequently, this study employs the US model to determine the US rate. As indicated in the pertinent literature [62,63], the formula for calculating the US rate is as follows:
U S R c i t y y y + n = p o p c i t y y + n p o p c i t y y p o p c i t y y 100 %
where U S R c i t y y y + n represents the US rate of a city over the interval from year y to year y + n. A positive value for U S R c i t y y y + n signifies that the city is classified as a no-shrinkage city. p o p c i t y y + n and p o p c i t y y refer to the population sizes of the city’s municipal area at the respective times y + n and y. To further investigate the degree of US, this paper categorizes city shrinkage in accordance with existing literature [20,22,64] and establishes specific classifications based on relevant criteria, as illustrated in Table 1.
Initially focused on a city’s adaptability and endurance, the assessment criteria for UR have evolved to encompass four main objectives: robustness, rapidity, redundancy, and resource redeployability. This scope has further extended to include considerations related to the economy, infrastructure, governmental and non-governmental organizations, emergency services, and local population. As a result, there is a general agreement on the importance of developing a comprehensive UR evaluation system that consists of multiple subsystems. Therefore, the social, economic, institutional, ecological, and engineering aspects form the basis of the five subsystems from which this study developed the UR evaluation framework (Table 2).

2.2.3. Entropy–TOPSIS Evaluation Model

This study utilized entropy–TOPSIS to assess UR based on the constructed indicator system. This evaluation model, which incorporates the entropy approach with the conventional TOPSIS model, has been widely employed in comprehensive evaluations [92,93,94,95].
Initially, the model employs the entropy method to normalize the original data matrix, identifying optimal and worst options among limited choices. Subsequently, it calculates the proximity between a specific option and these extremes to evaluate the advantages and disadvantages of each option, making it suitable for assessing the UR levels of cities in China.
The first step involves standardizing the indicators to eliminate scale discrepancies between the UR evaluation systems. The entropy weight approach is employed for standardizing the dataset, leading to the creation of the normalization matrix A.
For positive indicators, the normalization formula is:
x m n = x m n m i n x m i n m a x x m i n m i n x m i n
while for negative indicators, it is:
x m n = m a x x m n x m n m a x x m n m i n x m n
The normalized matrix A is represented as:
A = x 11 x 1 n x m 1 x m n
where m denotes evaluation indicators (m = 1, 2, …, a), n denotes various cities (n = 1, 2, …, b), x m n signifies the initial measurement of the evaluation index system of UR, and x m n represents the normalized metric. Subsequently, the weight W for the indicator m in the year n is calculated, yielding the matrix W m n :
W m n = x m n n = 1 b x m n
The information entropy of the indicator m is then computed:
e m = 1 l n a b n = 1 b W m n l n W m n
If W m n = 0, l i m f m n 0 f m n l n f m n = 0 .
Then, the weight of the indicator m can be calculated:
p m = 1 e m m = 1 b 1 e m
Following this, X m n is generated using the calculated indicator weights, which are determined as follows:
X m n = x m n p m
The Euclidean distance is then calculated:
D n + = m = 1 a d m + d m n 2
D n = m = 1 a d m d m n 2
where d m +   a n d   d m denote the the upper and lower measurements of indicator m respectively.
Finally, the composite score U n is computed:
U n = D n D n + + D n
For a city, a greater value signifies a higher UR.

2.2.4. Average Annual Growth Rate

In order to assess the UR changes (URC) during the US process, this research employed the subsequent formula derived from pertinent literature [65]:
U R C c i t y y y + a = U R c i t y y + a U R c i t y y a 1 100 %
where U R C c i t y y y + a indicates the average annual growth rate of UR throughout the US process, U R c i t y y signifies the UR value at the start of the US period, U R c i t y y + a represents the UR value at the end of the US period, and a denotes the duration of time.

2.2.5. Coupling Coordination Model

To clarify the interaction degree and coordinated development level between the five major UR subsystems of SCs in different years, and to measure the correlation between each UR subsystem, this study used the coupling coordination model to facilitate a spatiotemporal analysis of the coupling coordination among the UR subsystems of different types of SCs in China.
The first step is the coupling degree (CD) calculation. Due to the numerous errors in the CD model in recent years, and the limited research validity due to the relatively concentrated CD, this study adopted the CD correction model [96]. The equation is as follows:
C = 1 i > j , j = 1 n U i U j 2 m = 1 n 1 m i = 1 n U i m a x U i 1 n 1
where C is the CD of each UR subsystem. Since there are five UR subsystems, n = 5 in the above formula, and the values of the social, economic, institutional, ecological, and engineering subsystems are, respectively, U1, U2, U3, U4, and U5, in which the max Ui is U4.
The second step is the coordination calculation. The formula is as follows:
T = α 1 U 1 + α 2 U 2 + α 3 U 3 + α 4 U 4 + α 5 U 5 α 1 + α 2 + α 3 + α 4 + α 5 = 1
where T is the harmonic index between UR subsystems, and the meaning of Ui is the same as in the calculation of CD. Considering that society, economy, system, ecology, and engineering are all key components of UR system, this study considers them equally important and assumes the coefficients are equal: α 1 = α 2 = α 3 = α 4 = α 5 = 0.2 .
The third step is the calculation of the coupling coordination degree (CCD), which is based on coupling degree and coordination degree models. The formula is as follows:
D = C T
where D is the CCD among UR subsystems, C is the CD, and T is the harmonic index.
After the calculation, the CD and CCD of the four types of SCs in different years are divided into five types to describe the inter-system correlation (Table 3 and Table 4).

2.2.6. Geographical Detector Model

The geographical detector model (GeoDetector) is an innovative statistical approach designed to identify spatial heterogeneity and uncover the underlying driving factors [97]. The central concept relies on the premise that the spatial patterns of both independent and dependent variables that significantly influence the dependent variable are similar. The advantages of GeoDetector include the ability to detect both numerical and qualitative data, as well as the capability to determine if the combined influence of two interacting factors on the dependent variable follows a linear or nonlinear pattern, and whether it strengthens or weakens the variable’s explanatory power.
GeoDetector includes four detectors: the factor detector, the interaction detector, the risk detector, and the ecological detector. In this paper, for different SCs, the resilience evaluation index data collected in the early stage are discretized with the natural breaks of the analysis tool in ArcGIS 10.8 software, so as to divide the research object into groups of similar nature. Then the factor detector and the interaction detector are applied to derive the explanatory power of each evaluation index of UR on resilience values of different SCs, as well as the impact of the interaction between the two factors on the UR values, so as to reveal the influential mechanism of UR in different SCs.
q = 1 Σ h = 1 L N h σ h 2 N σ 2
where h = 1, …, L signifies the layering of factors; N denotes the total number of samples, and N h is the number of samples in stratum h; σ 2 is the overall variability of the response variable across the entire region; and σ h 2 indicates the variation in the dependent variable value in stratum h. The domain of the value of q is [0, 1], and higher values signify a stronger explanatory capacity of the factor on the dependent variable, i.e., the factor explains 100 × q% of the dependent variable.

2.2.7. Spatial Network Analysis Model

The social network analysis model serves as a significant sociological instrument for examining the interactions among individuals. It comprises a set of principles and techniques for scrutinizing the configurations and connections within social networks and their attributes [98]. To elucidate the spatial relationship in terms of UR among cities of similar US types, this study employed the social network analysis model to establish the spatial correlation structure of UR across various US types. This involved extracting the network topology using the social network analysis software Gephi-0.10.1, as well as measuring and statistically evaluating the parameters of each network’s structure to visually assess the structural features of each network and elucidate the positioning of cities with different US types within their respective networks.
Initially, this study created the spatial correlation network of UR among cities of different US types using the gravity model. The formula for the gravity model is expressed as follows:
  f m n = U R C m U R C n D m n 2
where U R C m   a n d   U R C n denote the URC of different SCs, D m n signifies the geographical distance between two cities, and f m n indicates the gravitational force between city m and city n. A higher f m n value signifies a stronger gravitational force between the two cities, indicating a closer resilience connection between them.
The f m n value in the aforementioned equation characterizes the spatial connectivity strength between cities, and the connectivity strength matrix F is constructed from f m n :
F = f 11 f 1 n f m 1 f m n
In order to prevent relatively weak correlations from influencing the overall network distribution, this paper assesses the correlation strengths to convert the complete network into a non-uniform network. The binarization criterion is defined as follows:
F ~ m , n = 1 , f m n f m n 0 , f m n < f m n
where f m n is the mean value of f m n for the same US-type city. By simplifying the network structure, the neighborhood matrix F ~ m , n is obtained to construct the correlation network of UR among cities of different US types.
This study employed the average path length (APL) and network density (ND) metrics in the analysis of network structures to evaluate the overall UR correlation network of various shrinkage-type cities. The APL represents the average distance between any two nodes in the network, with a higher value indicating a longer distance required for event propagation between cities, resulting in lower transmission efficiency. Conversely, a lower APL signifies improved accessibility, operational efficiency, and robust propagation and diffusion effects within the network. The APL is calculated using the following formula:
A P L = 1 1 2 a     a + 1 m n D m n
where a denotes the number of nodes, and D m n represents the geospatial distance between city m and city n.
Network density (ND) characterizes the closeness of associations among cities within the network. Higher network density values indicate stronger correlations between cities, leading to a greater impact on the UR of different cities. Its formula is as follows:
N D = l a a 1
where l represents the number of edges in the network, and a denotes the number of cities.
The degree ( C m ) is defined as the sum of the edges connecting a node to other nodes in the network. A higher degree value signifies a city’s stronger position within the network and a greater impact on the UR of neighboring cities. The degree is calculated using the following formula:
C m = m = 1 a n = 1 a x m n a 1
where x m n indicates the value of 0 (no connection between x m   a n d   x n ) or 1 (the connection between x m   a n d   x n ), and a is the number of cities in the network.
The local clustering coefficient ( C L m ) reflects the degree of close connection between a city and its neighbouring regions, and the higher the local clustering coefficient, the faster the city can maintain stability and resilience through the support of its neighboring cities during emergencies. The C L m is calculated as follows:
C L m = 2 l m C m C m 1
where l m is the number of edges generated between node m and its neighbors, and C m represents the degree of node m.

2.3. Data Sources

This study delves into 285 prefecture-level cities in China from 2010 to 2021, scrutinizing the spatiotemporal trends of US and UR during this period and suggesting strategies to fortify UR in the face of US. The indicators selected in this article primarily rely on authoritative data from government statistical sources, including the China Urban Statistical Yearbook, the China Urban Construction Statistical Yearbook, and the Statistical Yearbook of Various Cities, ensuring the reliability and consistency of data across fundamental research units. Population data are derived from the China Population and Employment Statistics Yearbook. Economic data are predominantly sourced from the Financial Yearbook of China and the Almanac of China’s Finance and Banking. Environmental data are mainly sourced from the official website of the Ministry of Ecology and Environment of the People’s Republic of China (https://www.mee.gov.cn/, accessed on 20 September 2023). Social data are primarily obtained from the statistical bulletins of each city.

3. Results

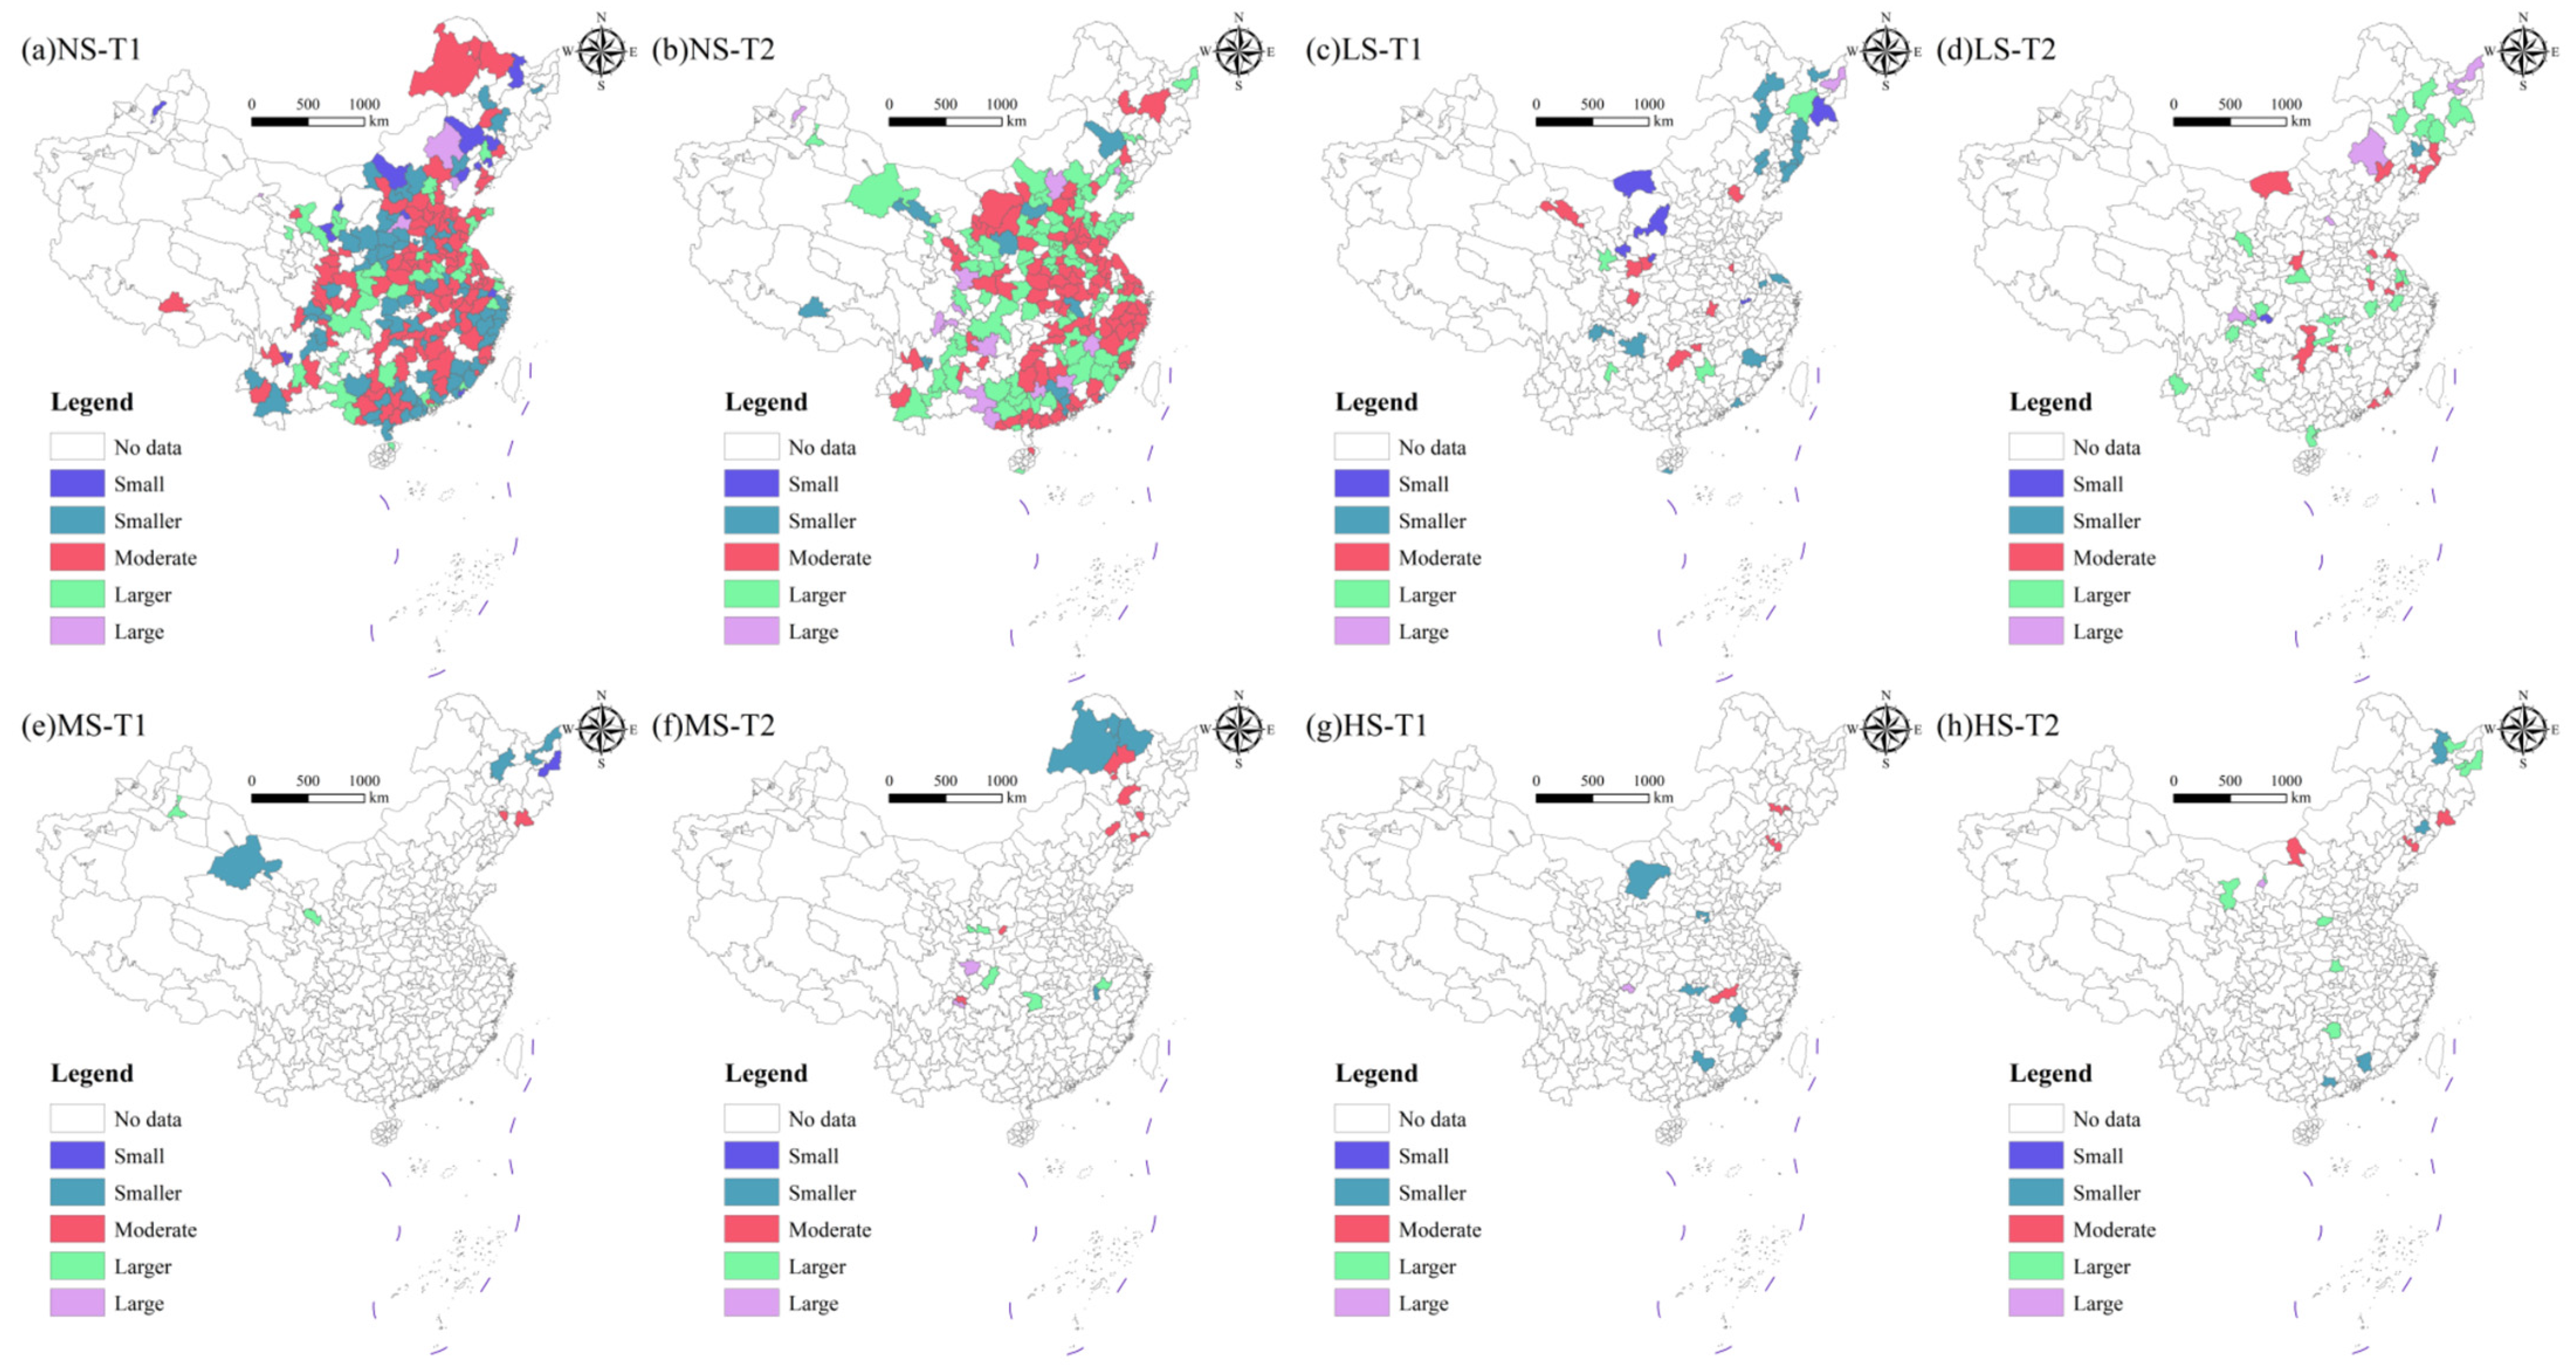
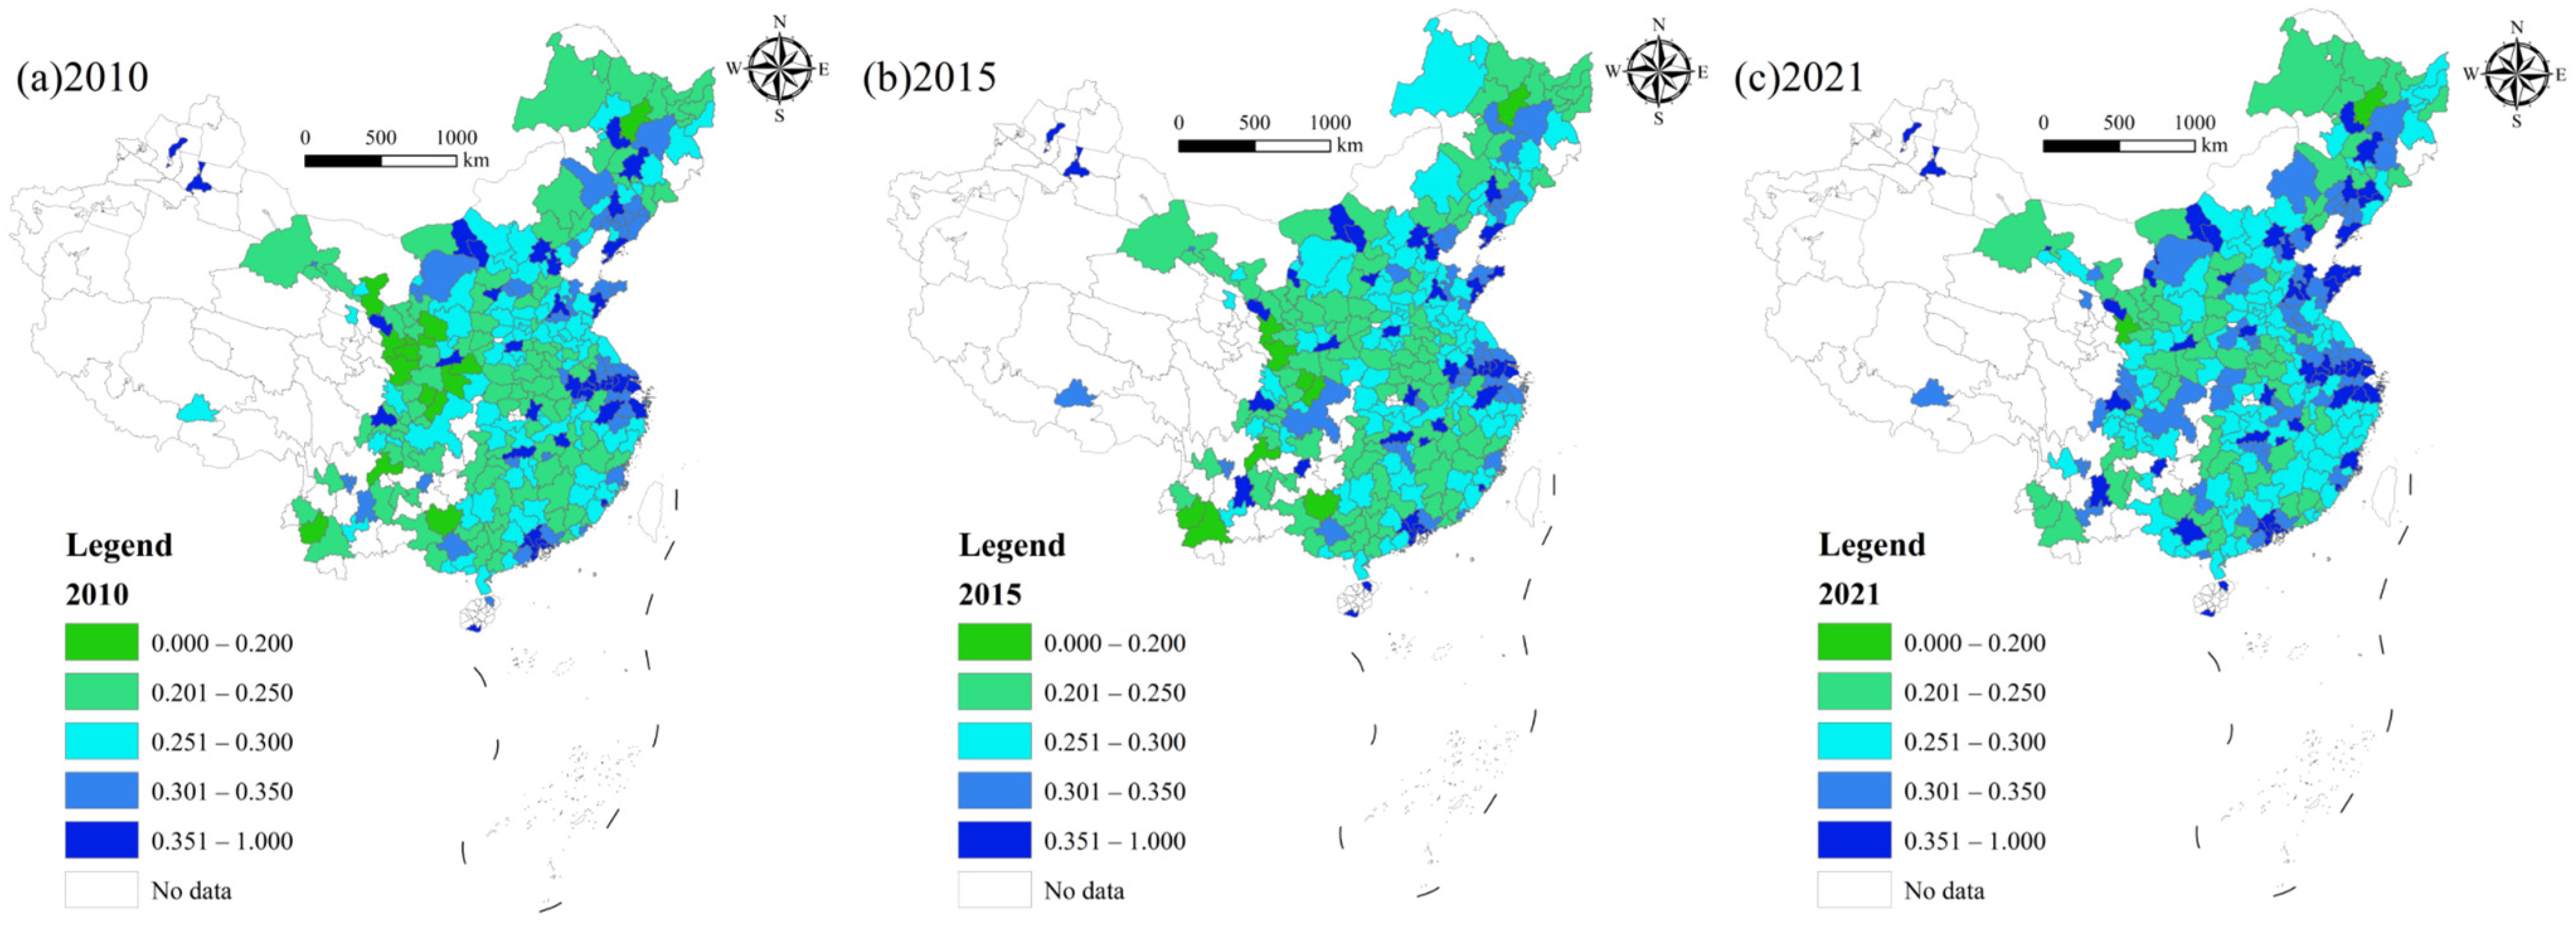
3.1. Spatiotemporal Evolution Characteristics of Resilience in Different Shrinking Cities

The study initially analyzed the geographical distribution characteristics of SCs (Figure 4). Between 2010 and 2015, a total of 54 cities exhibited notable US phenomena. The spatial distribution of these SCs reveals a predominant concentration in the northeast and northwest regions, with an overall mild degree of US. Conversely, resource-based cities such as Ordos and Anshan have experienced substantial population declines due to the gradual depletion of their resources. From 2015 to 2021, the number of SCs increased markedly to 76. This trend indicates that as urbanization in China advances and the economy develops rapidly, the phenomenon of US has intensified, particularly in the northeast, where both the number of SCs and the degree of US have exhibited the most pronounced growth.
In order to investigate the variations in UR among different SCs throughout the US process, this paper quantifies UR and URC across various cities based on the entropy–TOPSIS evaluation model (Figure 5 and Figure 6). In 2010, the UR levels of most cities were predominantly low, with only provincial capitals exhibiting higher UR due to the concentration of resources and public services, well-developed infrastructure, and diversified economic activities. By 2015, there was a notable increase in the number of cities classified as having low UR, while the number of cities in other UR categories generally declined. From the perspective of different types of SCs, it is evident that NS cities have managed to enhance their UR, as they have not been adversely affected by US and have sustained economic growth alongside stable or increasing populations. Conversely, the situation for SCs is markedly different: 62.2% of LS cities, 50.0% of MS cities, and 55.5% of HS cities reported negative UR from 2010 to 2015. This trend indicates that US adversely affects UR, contributing to an overall decline in the average UR levels of cities nationwide. Furthermore, it suggests that the challenges associated with US extend beyond population loss and economic downturns, potentially exacerbating social issues, resource scarcity, and insufficient policy support, thereby diminishing the cities’ capacity to manage future risks. By 2021, there was a significant increase in the number of cities achieving medium to high UR, reflecting a notable upward trend in UR levels across the country. In terms of US severity, cities continued to exhibit robust growth in UR. However, compared to the preceding period, most SCs experienced a high rate of UR growth between 2015 and 2021. This indicates that an increasing number of SCs have begun to adapt to the challenges posed by US, shifting from a reliance on resource and labor growth to implementing effective transformation and governance strategies that enhance their UR to manage risks. Nevertheless, as the degree of US intensifies, the growth rate of UR tends to decline, suggesting that greater US correlates with a more pronounced negative impact on UR. This underscores the necessity for enhanced external support and more comprehensive reform measures to bolster UR.

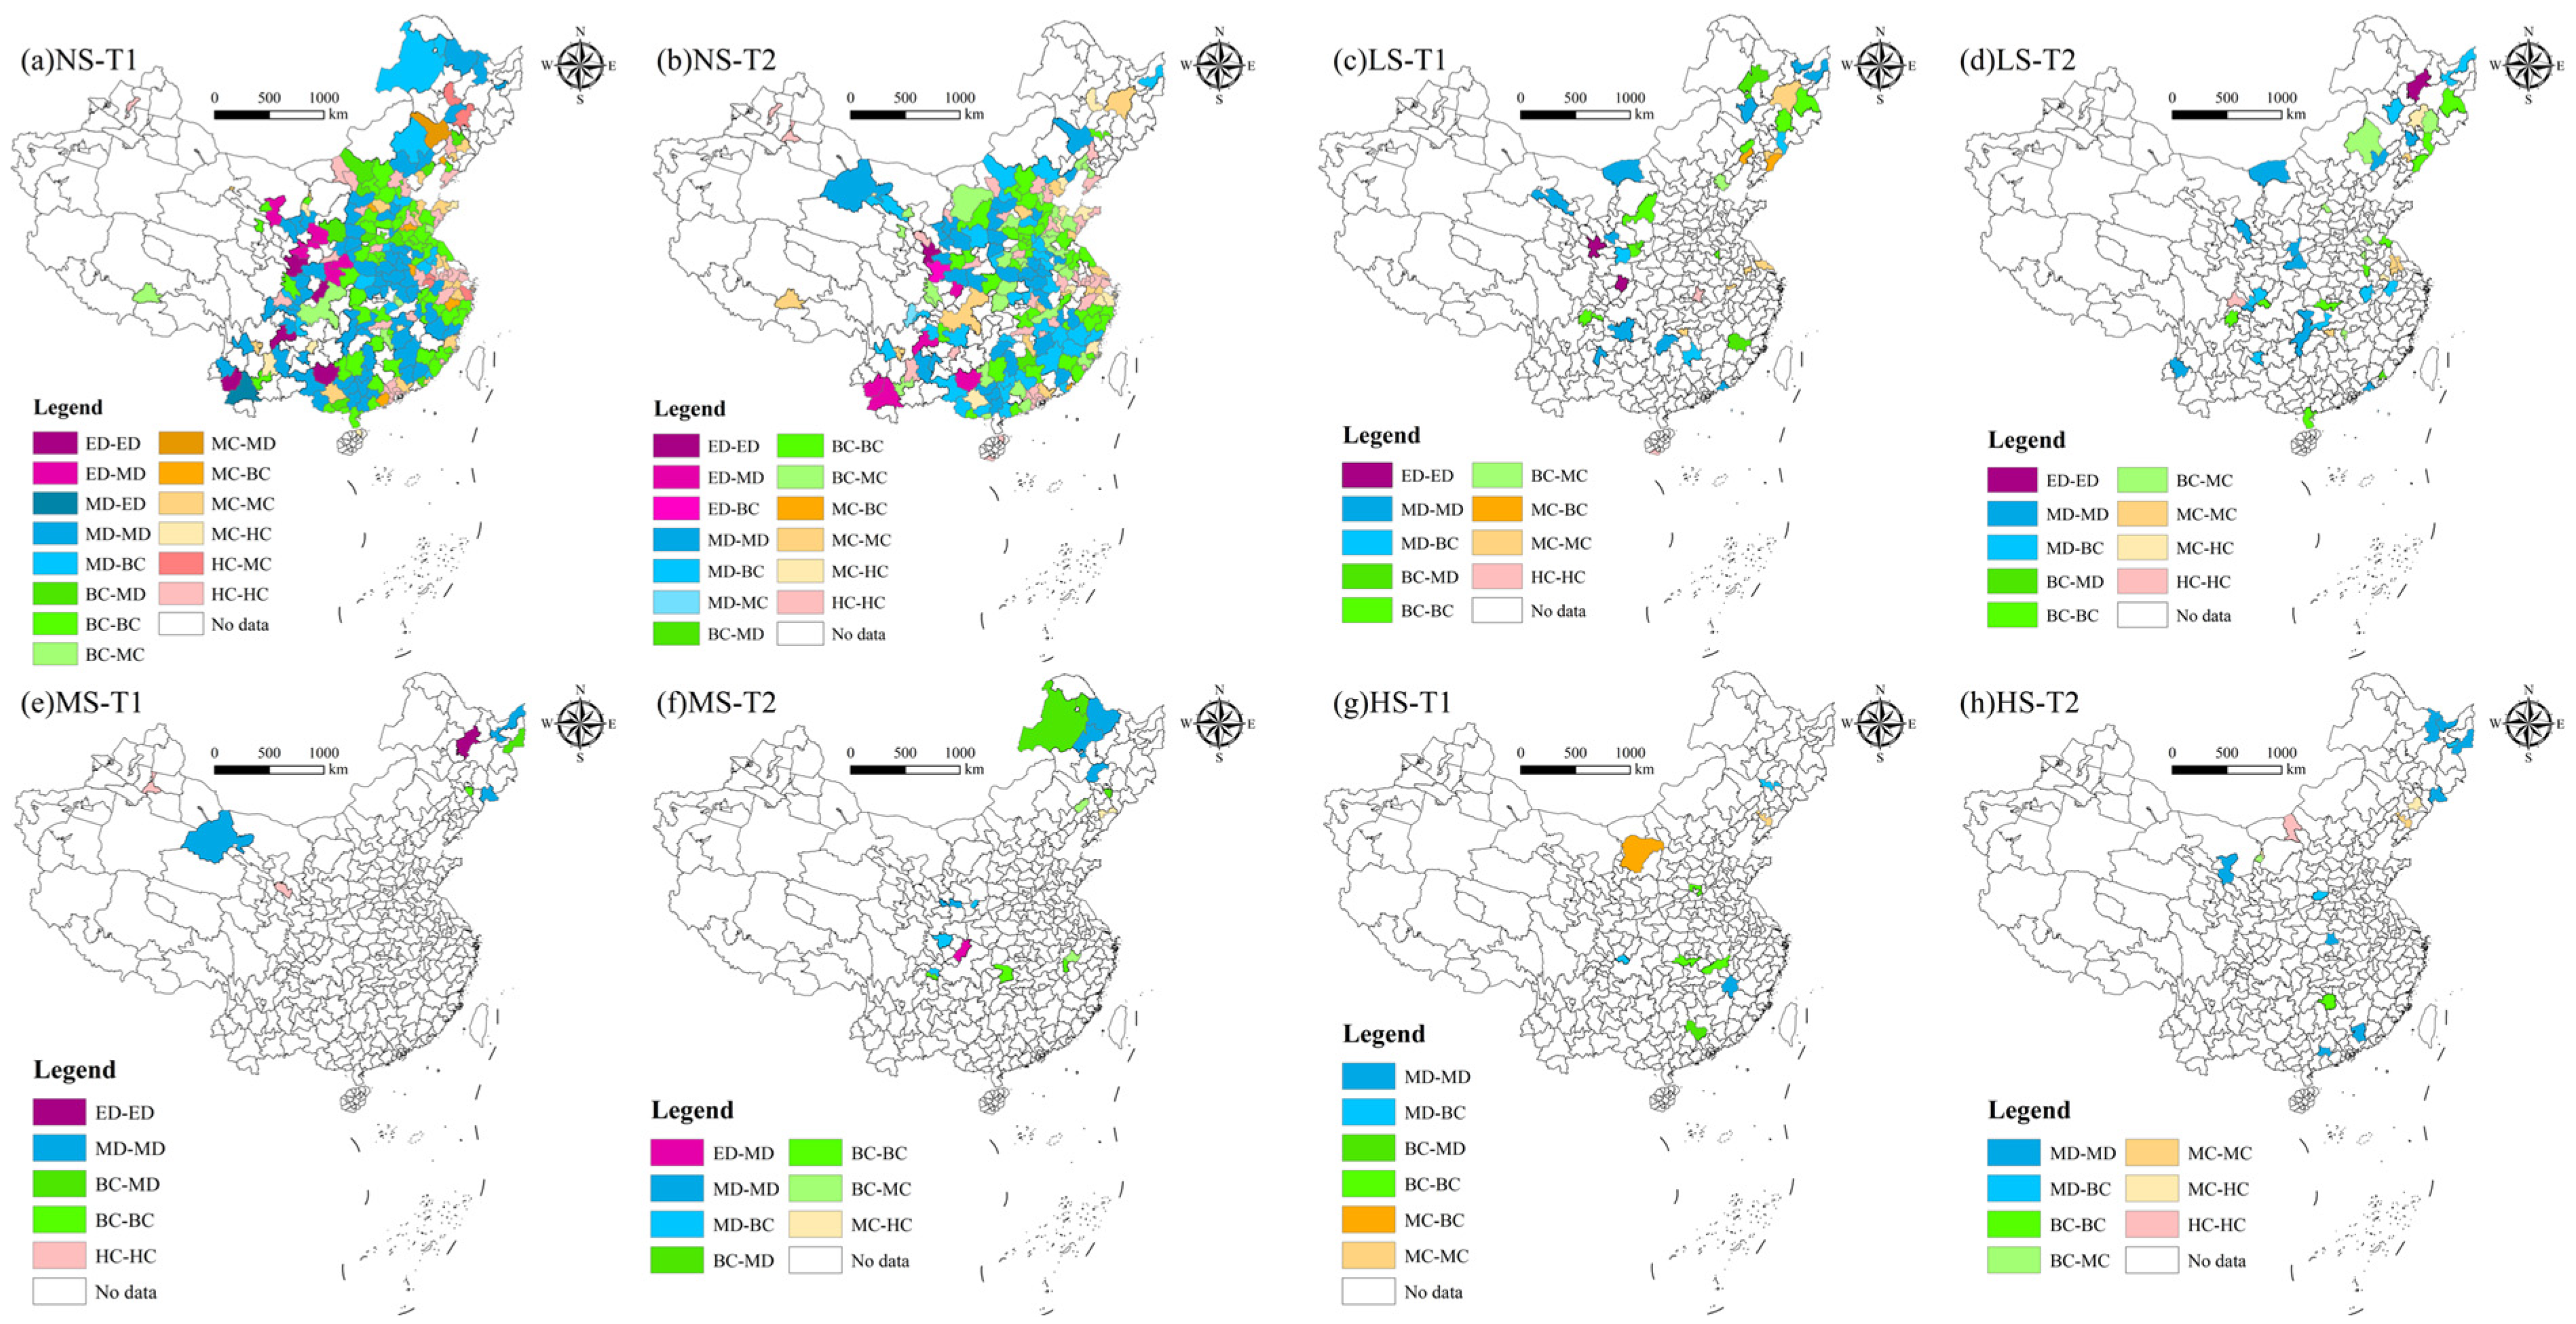
3.2. CCD of Resilience of Shrinking Cities

According to the coupling coordination model between the UR subsystems in Equations (13)–(15), the CD and CCD of 285 cities in China during 2010–2021 were obtained. We used the ArcGIS10.8 software to plot the spatial evolution of CD and CCD between UR subsystems in Chinese cities during 2010–2021 (Figure 7 and Figure 8). We also mapped the change of CCD type in different shrinking cities in the T1 and T2 time periods (Figure 9).
The CD level of UR subsystems increased slightly from 2010 to 2015, and significantly from 2015 to 2021, which indicates that in the process of rapid urbanization in China, UR systems gradually run in the long-term process and gradually improve the degree of interaction. Compared with 2010, there were significantly fewer cities in the low coupling stage in 2015, which were mainly located in the western region. In 2021, the CD of most cities in northern China was improved, especially in many cities between the Beijing–Shanghai Line and the Beijing–Hangzhou Grand Canal, and in many cities to the west of the Beijing–Guangzhou Line (Figure 7).
The overall change trend of CCD in Chinese cities during 2010–2021 is similar to that of CD, but the specific spatial distribution is different. Although the above-mentioned phenomenon of the improvement of the coupling coordination level in 2021 compared with 2015 in the northern region still holds, the more obvious phenomenon is that the coupling coordination level of all coastal provinces in the country significantly improved. In addition, the CCD of provincial administrative centers and some other economically developed cities was at its maximum in the same period, and by 2021, these cities were basically in the HC type. With these cities or urban agglomerations as the center, the CCD of the surrounding cities also increased. In general, the closer the city was to the radiation center, the greater the CCD improvement, and the faster the upgrading speed (Figure 8).
In general, cities with higher levels of US were more likely to experience a decline in coupling coordination between 2010 and 2015. In the NS, LS, MS, and HS cities, the proportions of the coupling coordination decreased by 9.51%, 13.51%, 12.50%, and 25%, respectively. We believe that those cities with social, economic, institutional, ecological, and engineering resilience exist in a state of mutual promotion and progress at the coupling stage, their economy is relatively prosperous and the society is relatively stable, which promotes population growth, as seen in cities in the Yangtze River Delta and the Pearl River Delta. On the contrary, a decline in the degree of coupling between resilient systems represents a low level of economic and social development of these cities, further leading to population loss, as in Ordos, Jixi, and other cities (Figure 9).
It is worth noting that the CD of UR system and the characteristics expressed are not the only reason for US. US is the result of the mutual influence and interaction of various factors between human and earth systems, and the process changes over time, which is also the reason why the ratio mentioned above is still relatively low on the whole and the data from 2015 to 2021 do not yield obvious patterns.

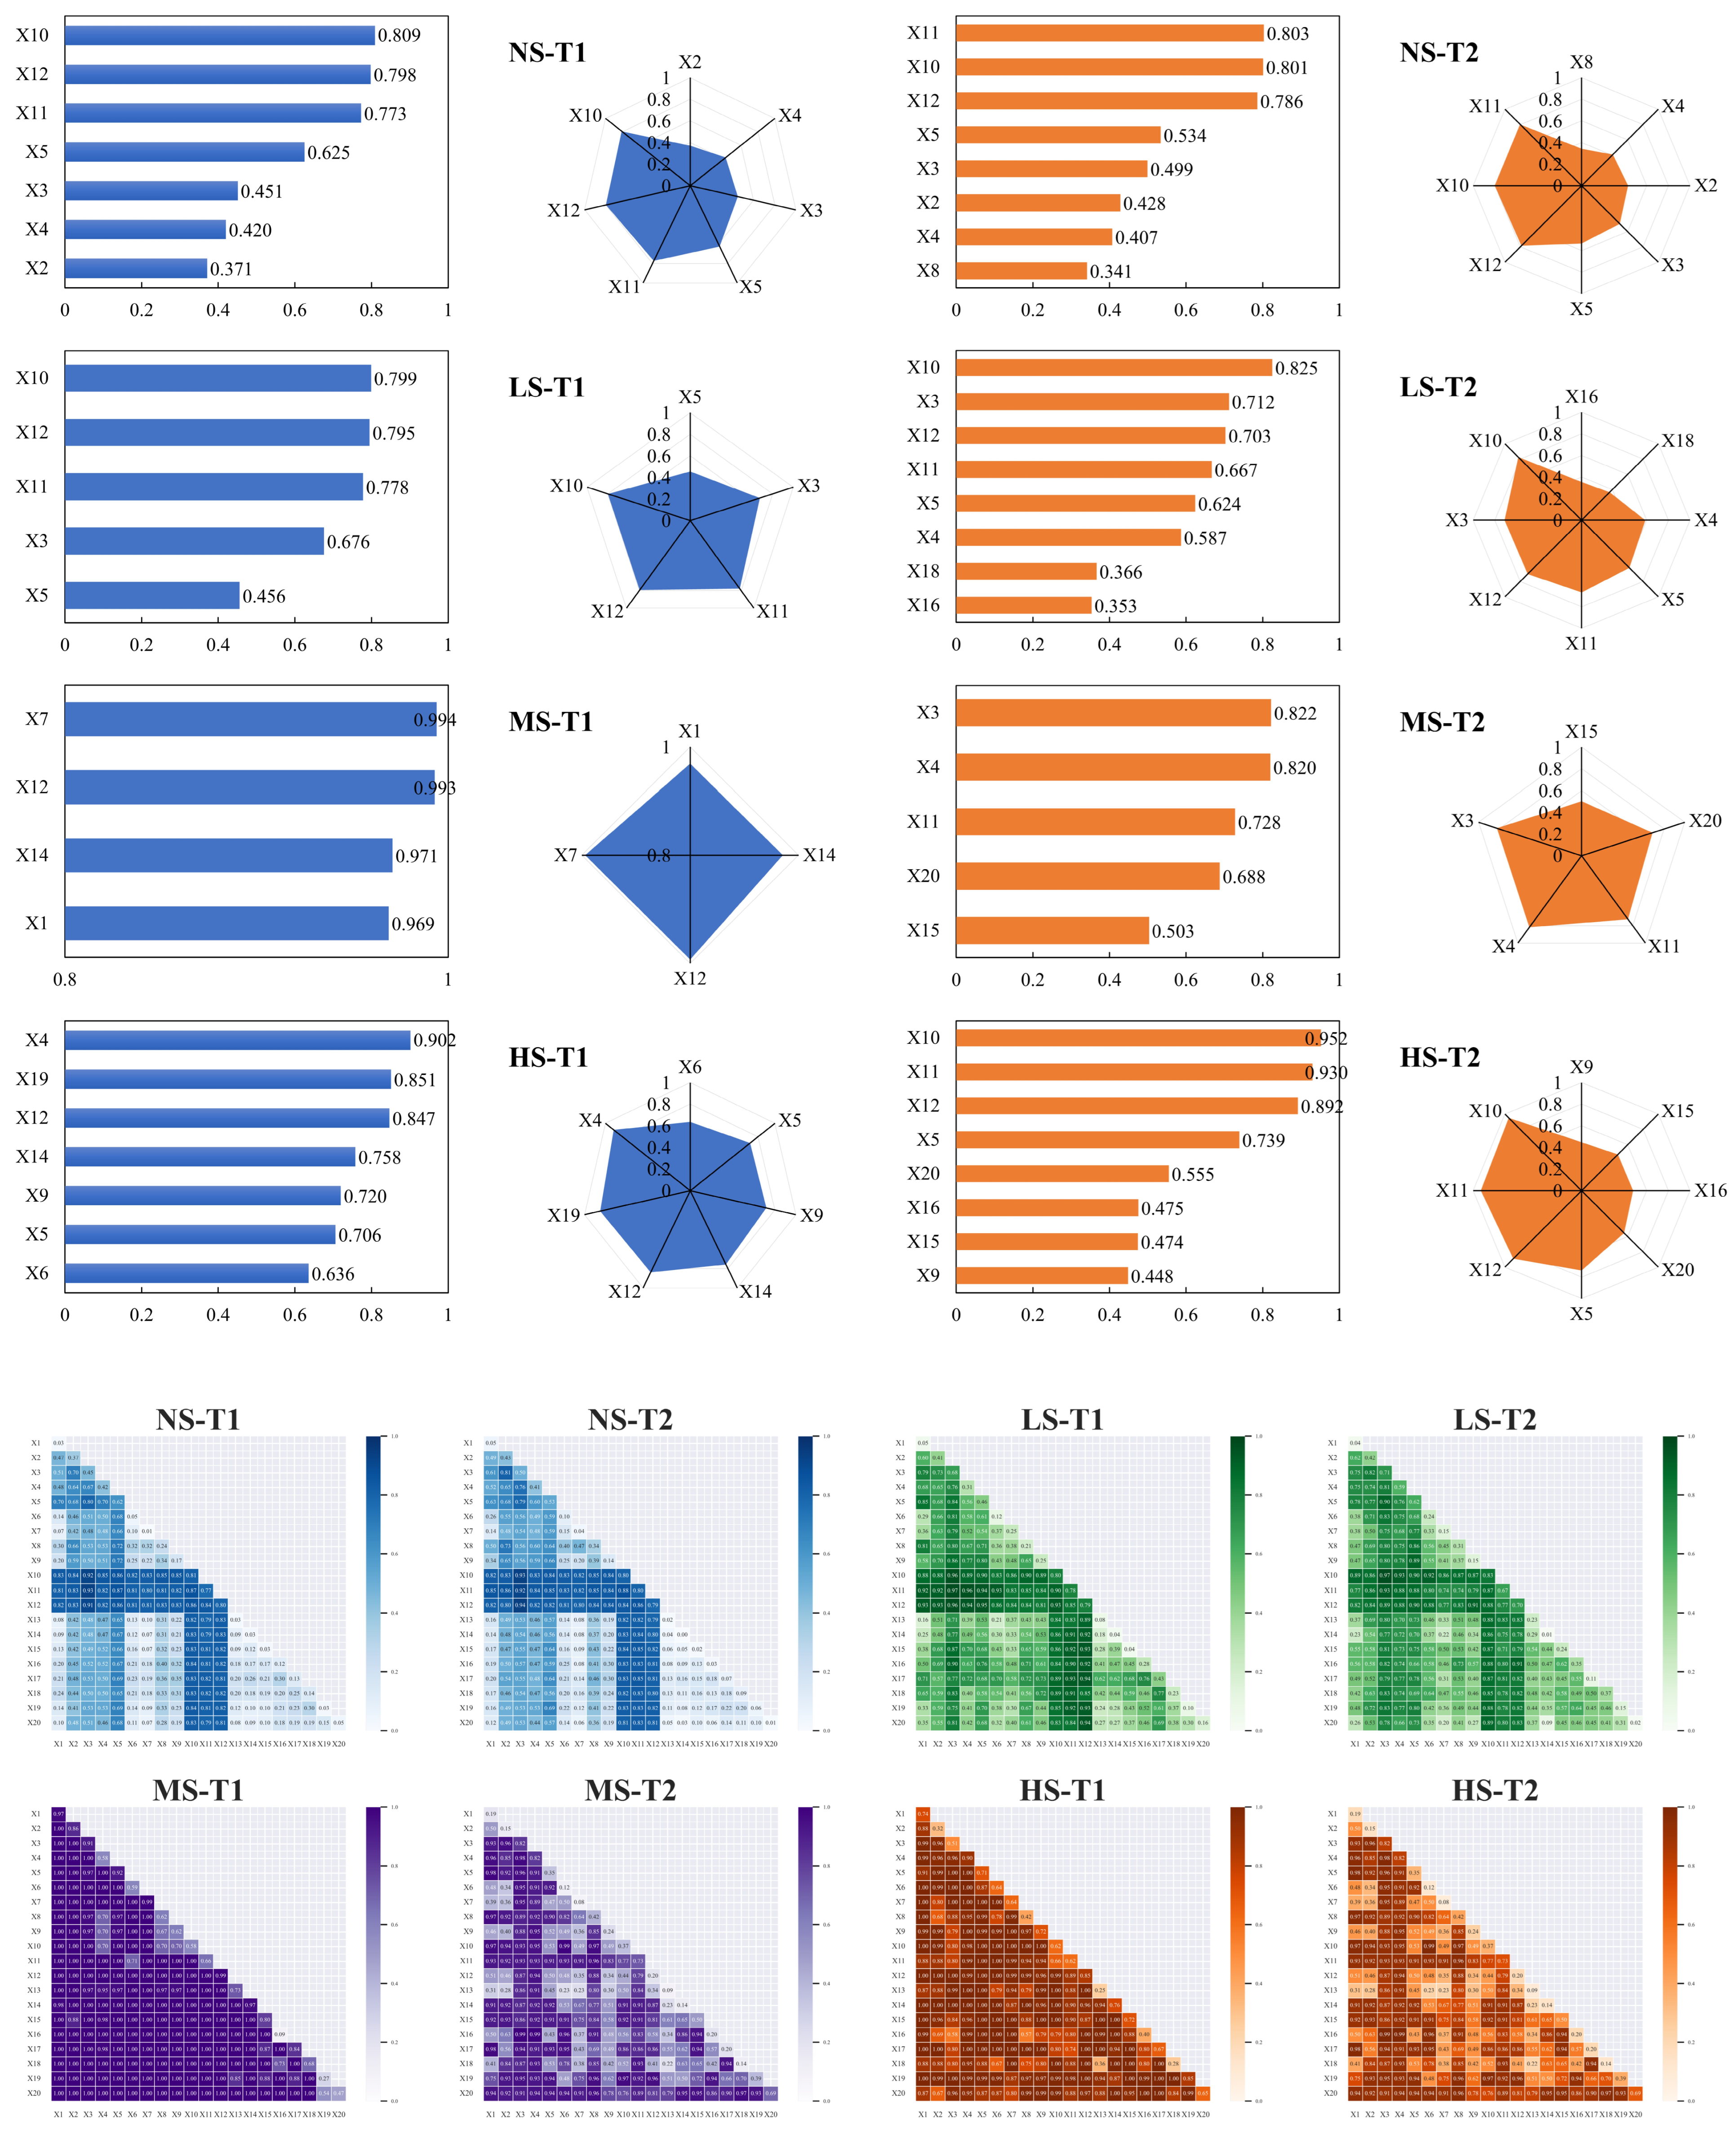
3.3. Detection of Influencing Factors of Resilience in Different Shrinking Cities

To investigate the mechanisms influencing UR across various SCs, this paper uses GeoDetector to explore the influencing factors of UR in different SCs in two time periods. The results show that the basic pension insurance participants at the end of the year (X10), the basic unemployment insurance participants at the end of the year (X12), and the basic medical insurance participants at the end of the year (X11) significantly influence the UR of NS cities, indicating that a sound social security system is one of the important factors that help cities to attract talent (Figure 10). For LS cities, in addition to the above three factors, the number of college students per 10,000 population (X3) also has a particularly significant impact on UR. A higher proportion of college students in the population reflects the enhancement of regional human capital and represents the potential for regional economic growth, which helps LS cities enhance their UR and thus slows down their US trend. Compared to the period from 2010 to 2015, when ER was the primary driver of the UR of MS and HS cities, the period from 2015 to 2021 experienced a significant shift. During this latter period, IR became the most influential factor, with the degree of influence of ECR and ENR also increasing. This reflects the increased need for these cities to pursue sustainable development and integrated governance as the economy gradually stabilizes.
In addition, this paper applies the interaction detector to each evaluation factor of UR to explore the effect of the interaction between the two factors on UR and represents them as a heat map, as shown in Figure 10. The results show that the effects of the interactions of the two factors on UR are both bifactorially enhanced and nonlinearly enhanced, with no diminishing or independent interactions. For NS and LS cities, the enhanced interactions of the basic pension insurance participants at the end of the year (X10), the basic medical insurance participants at the end of the year (X11), and the basic unemployment insurance participants at the end of the year (X12) were significant, suggesting that a sound social security system is a key factor in attracting talent. For MS and HS cities, the two-factor interaction was significantly stronger, but weakened over time. This reflects that the role of certain single factors in urban resilience has become more independent and significant, which may lead to a relative weakening of the synergies between the two-factors. Cities may rely more on the role of single factors to maintain and enhance UR.

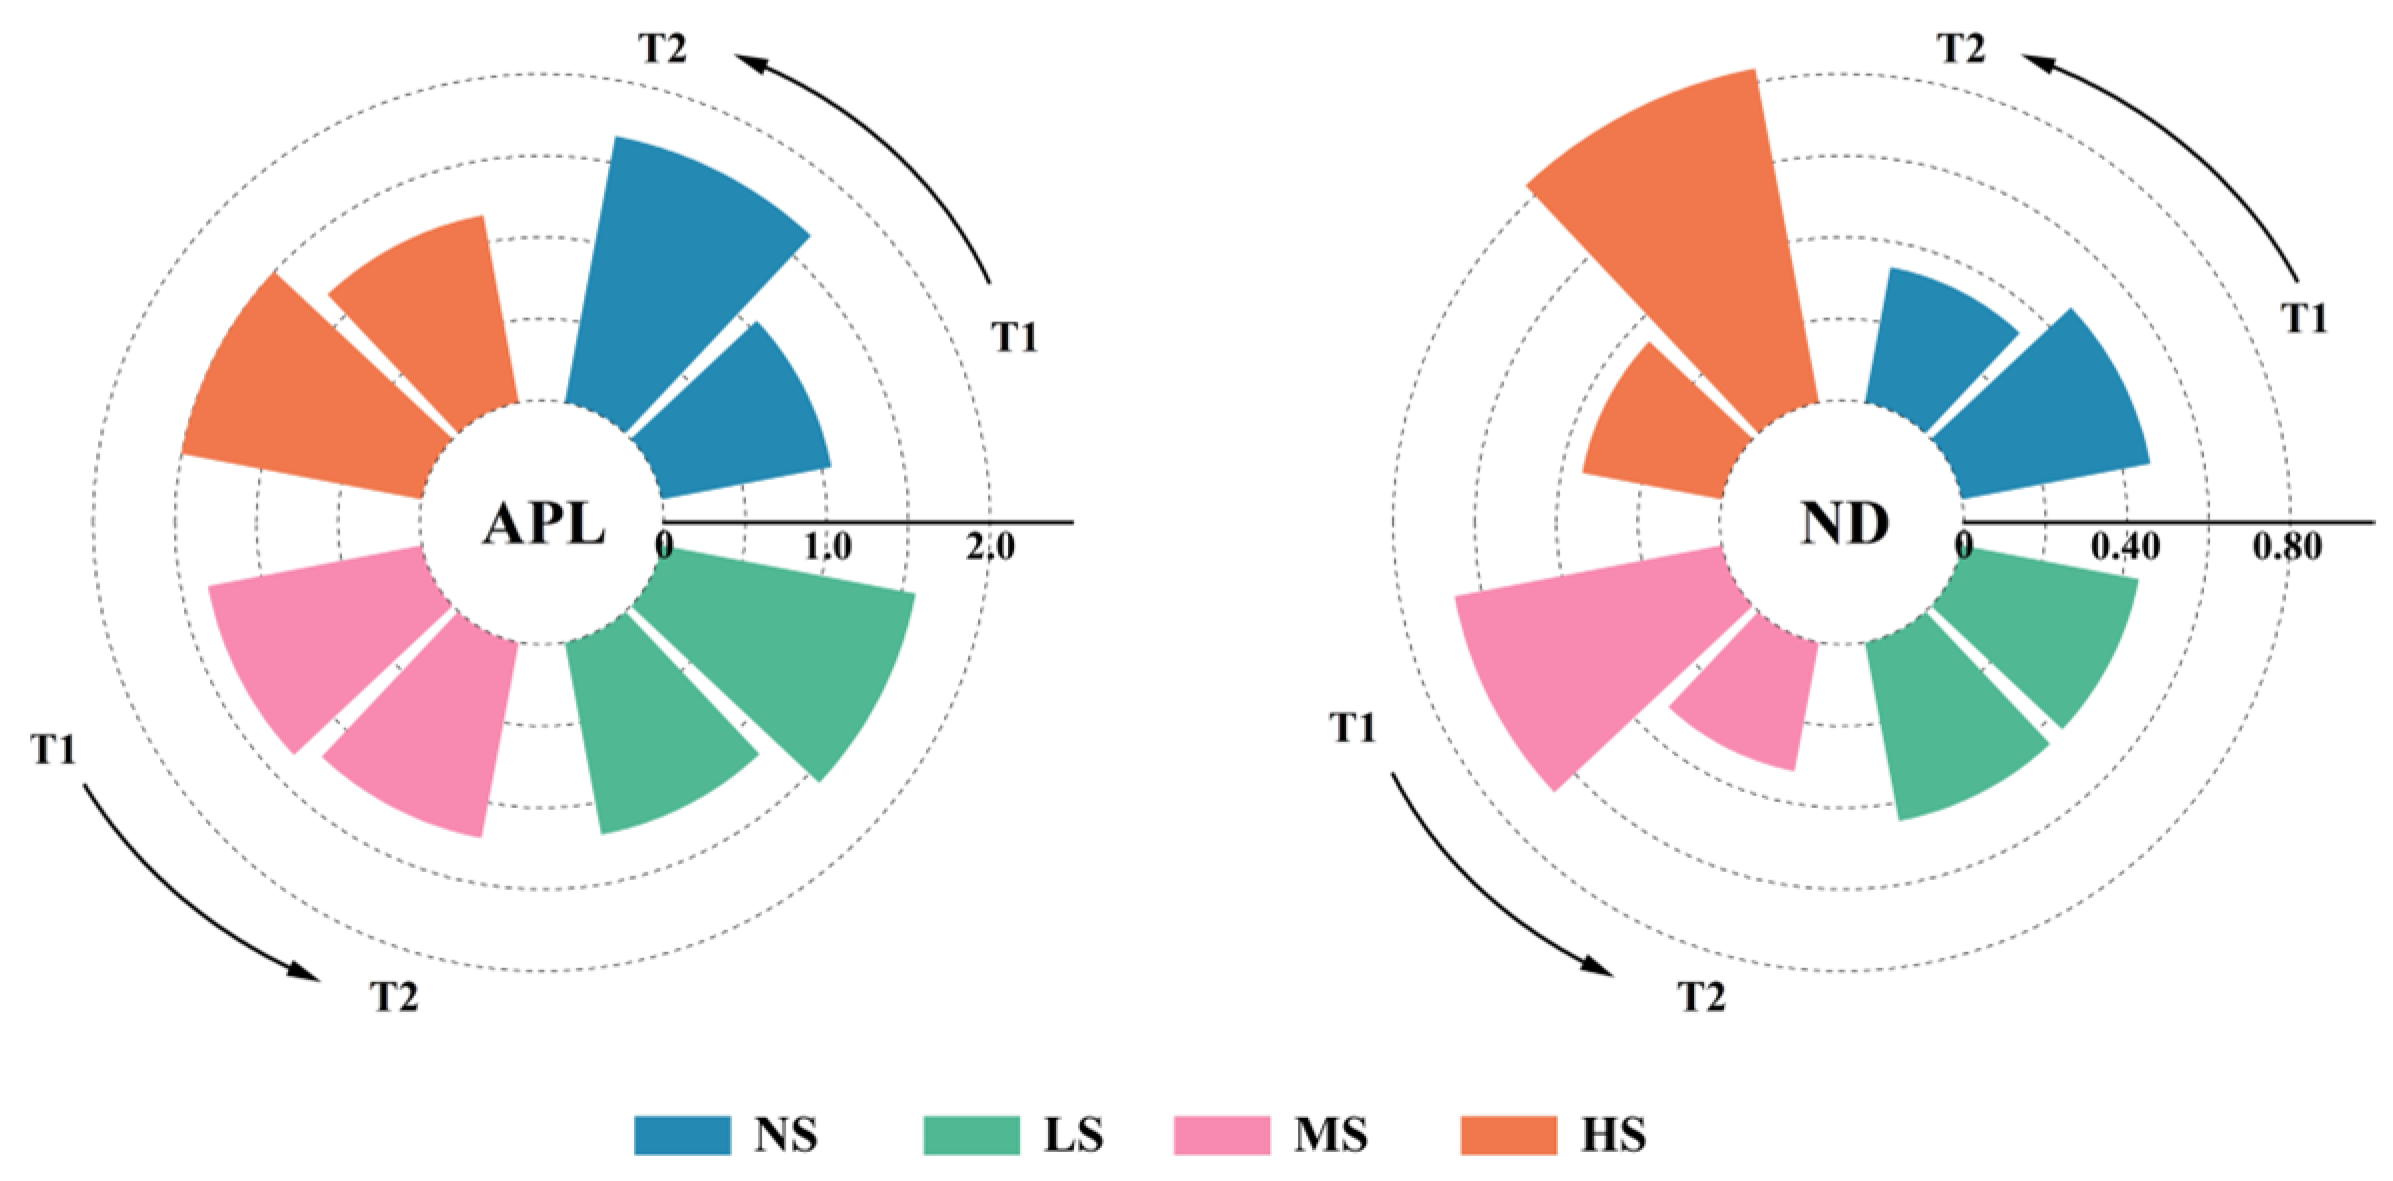
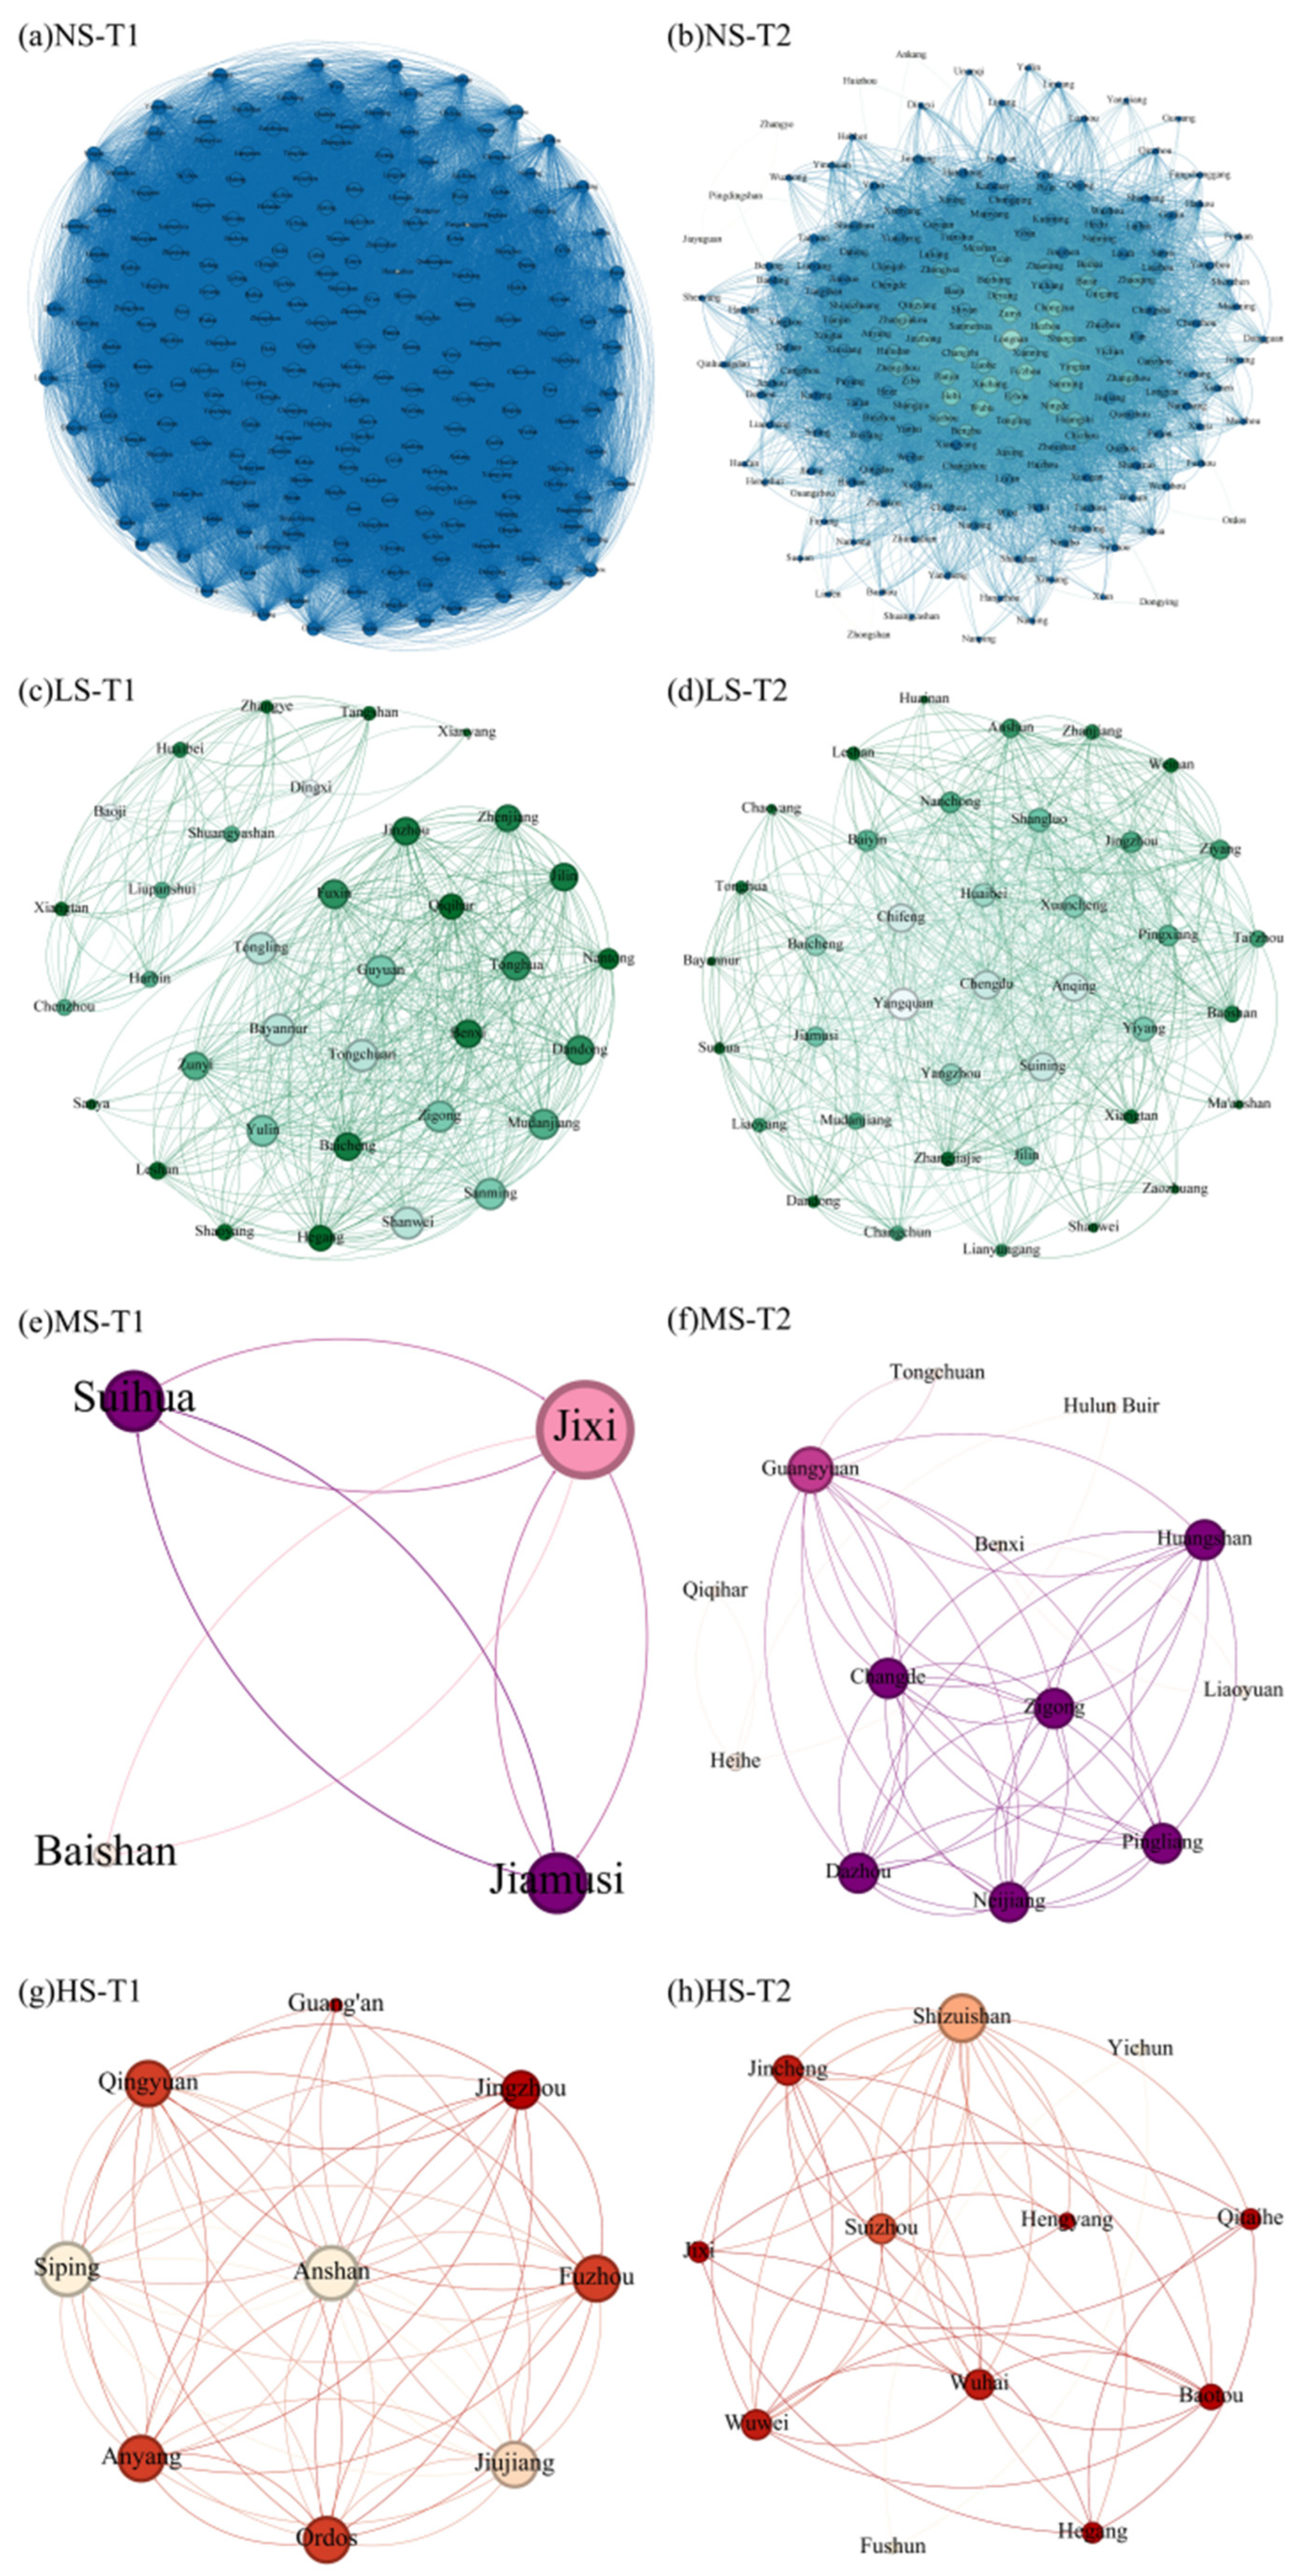
3.4. Spatial Correlation Network Effect of Resilience in Different Shrinking Cities

This paper provides a comprehensive analysis of network structure characteristics, with a specific focus on average path length (APL) and network density (ND) (Figure 11). The results indicate that the APL of UR networks in NS, LS, and HS cities increased markedly from 2010 to 2021. This trend suggests that in NS, LS, and HS cities, inter-city interactions and exchanges are relatively weak, potentially impeding the diffusion of UR through activities such as personnel mobility and technological exchanges. Conversely, in MS cities, the changes in APL were more gradual, indicating that the UR networks among MS cities exhibited greater cohesion. MS cities appear to have depended more heavily on robust inter-city connections and localized resource flows to sustain their UR amid US. Regarding ND, as the degree of US intensified during the period from 2010 to 2015, the ND of UR networks also increased and remained elevated. This finding implies that cities experiencing higher levels of US possess stronger internal connectivity within their UR networks. However, a notable decline in ND was observed across all types of SCs from 2015 to 2021, with a particularly significant reduction in MS and HS cities. This decline suggests a weakening of overall connectivity within the UR networks of SCs during this timeframe, indicating a substantial decrease in the capacity of MS and HS cities to mobilize internal resources and provide mutual support.
From an individual characteristics perspective, this study examines the network structure characteristics of different SCs (Figure 12). The analysis specifically examines the degree centrality and local clustering coefficient to evaluate the UR associations and connectivity patterns within these cities. The results indicate that between 2010 and 2015, NS cities generally demonstrated high degrees of centrality with minimal variation among them, suggesting a high level of interconnectivity and equilibrium within the UR network, thereby forming a stable framework for cooperation and interaction. Conversely, SCs encountered more pronounced socio-economic challenges, which compelled them to prioritize addressing their own issues over fostering collaboration and networking with other cities. This resulted in a comparatively weaker network of connections in terms of UR. Nevertheless, certain SCs in the northeast, such as Bayannur, Jixi, and Anshan, still display high degrees of centrality and low local clustering coefficients within their respective UR networks. Despite experiencing varying levels of US, these cities continue to serve as significant economic, industrial, or transportation hubs, thereby playing a crucial role in enhancing UR in surrounding areas. From 2015 to 2021, as SCs gradually transitioned, there was an increased emphasis on regional synergy and both internal and external cooperation. Consequently, the internal linkages within the UR network began to equalize, leading to a reduction in disparities in regional UR connections. However, it is important to note that, in comparison to the period from 2010 to 2015, the degree of US in certain cities has intensified, such as Benxi, Tongchuan, and Fushun. These cities, which also have experienced significant economic decline, exhibit lower degrees of centrality and local clustering coefficients in the latest iteration of the UR network. This trend suggests that the exacerbation of US may result in the fragmentation of UR ties among economically disadvantaged cities, potentially initiating a self-reinforcing vicious cycle that hampers their ability to maintain cooperation and connections with other cities, ultimately leading to a further deterioration of their status and influence within the UR network.

4. Discussion

US is an increasing global issue in the context of globalization and deindustrialization, highlighting the need to improve the ability of SCs to withstand, adjust to, and quickly bounce back from this challenge. Developed countries experiencing US have implemented a range of management strategies to tackle the difficulties, resulting in notable success in mitigating US [4,99,100]. Notably, cities in Europe have undertaken extensive urban regeneration initiatives aimed at fostering industrial transformation, enhancing infrastructure, and creating green spaces [101]. These efforts have effectively converted the adverse effects of US into developmental opportunities, facilitating the restoration of both environmental and social structures [102]. As a result, urban vitality has been revitalized, leading to increased population influx and investment, thereby stimulating economic rejuvenation [33]. In the United States, cities such as Detroit and Cleveland have prioritized optimizing land use and strengthening urban adaptive capacity [32]. Such policies have not only improved the urban ecological environment but have also drawn new residents and investments by enhancing the urban landscape and quality of life, thereby fostering sustainable urban development [103]. The experiences garnered from the management of SCs, which other nations are currently investigating for adaptable solutions, offer valuable insights for China’s strategies in addressing similar urban challenges.
In alignment with global practices, although the emphasis on SCs is still developing, China has embarked on an accelerated journey toward the establishment of resilient cities. The implementation of the National Standard of China “Guide for safe resilient city evaluation” (GB/T 40947-2021) has played a crucial role in facilitating the development of resilient urban environments in China [104]. Major cities such as Beijing, Shanghai, Chongqing, Chengdu, Guangzhou, and Nanjing have implemented pertinent policies and plans that promote UR across various domains, including smart city initiatives, sponge city concepts, and green low-carbon ecological protection efforts. The experiences of these pioneering cities in implementing resilience-focused policies offer valuable insights and a viable framework for strengthening the UR of SCs. Additionally, when developing UR policies, these advanced cities often employ innovative and adaptive strategies that are specifically tailored to local conditions. This localized approach to policy innovation is particularly crucial for SCs, allowing them to design UR initiatives that are attuned to their unique socio-economic contexts, historical backgrounds, and available resources. From the planning stages through to execution, these localized innovations are key to navigating the complexities that arise in SCs’ development, ensuring that policies are not only relevant but also effective in addressing the distinct needs of diverse urban environments. By embracing such approaches, SCs can achieve self-adaptation and transformation, progressively overcoming challenges and transitioning toward a more sustainable and adaptable development model.
Consequently, drawing upon the policies enacted and the successful transformation and development of SCs in various countries, China possesses a robust policy foundation and promising prospects for bolstering the UR of SCs. Previous research has indicated that improving the interaction and coordination of internal factors and leveraging the spillover effects of UR spatial networks can effectively enhance the UR of SCs [73,105,106,107]. This study delves into the spatial and temporal variations of UR across different types of SCs, both theoretically and empirically. Despite facing varying degrees of US, most cities have witnessed an increase in UR from 2010 to 2021, aligning with prior studies [108,109,110]. When exploring the influencing mechanisms of UR, in alignment with the conclusions of Jin et al. [60], it is observed that various degrees of US lead to alterations in the UR subsystems. Furthermore, US promotes the strengthening of UR linkages among cities, underscoring that US does not uniformly impede the progress of all urban areas, in line with the observations of Cho and Kim and Seymour et al. [111,112]. Given the substantial disparities in US levels, economic foundations, market dynamics, and adaptive requirements across cities [8,113], it is imperative to tailor policies to local contexts.
In the context of worsening climatic conditions and rapid urban expansion, the challenges posed by climate risks, urbanization, and development to SCs are growing in complexity and diversity [114,115,116,117,118]. Consequently, establishing a resilient urban spatial structure that can adapt to growth and contraction is essential for cities to sustainably develop. Drawing on the framework of the five dimensions of UR, this study discusses how US influences the UR of SCs and proposes tailored policy recommendations for the governance and urban planning of cities experiencing US to varying extents.
Cities categorized as NS and LS are experiencing a lesser degree of US. Although these cities maintain a strong economic base and a relatively stable labor market, their attractiveness is increasingly declining as the phenomenon of US continues to advance. This decline is particularly evident in their challenges related to attracting high-tech talent. Concurrently, traditional sectors such as manufacturing and resource-based industries are struggling to adapt to technological advancements and shifts in market demand, primarily due to outdated technological upgrades and decreasing production efficiency. As urban shrinkage intensifies, these industries face a shrinking urban consumer market, coupled with diminishing demand and evolving consumption patterns, which hinder their ability to implement timely adjustments and transformations, ultimately eroding their market presence and competitiveness. Furthermore, the homogenization of industrial structures and a lack of innovation have rendered the traditional economic models and industrial chains of these cities increasingly inadequate in meeting contemporary development needs. This inadequacy is exacerbated by globalization, which poses additional challenges to traditional industries, thereby diminishing the cities’ competitiveness and ER in the global market. From the ENR perspective, driven by slower population and economic growth, US may lead to a decline in the quality of public services, increased traffic congestion, and energy shortages, highlighting the urgent need for infrastructure development and upgrades. Although a declining population may reduce infrastructure demand, aging facilities may fail to accommodate the requirements of new urban developments. Additionally, constrained fiscal revenues have limited infrastructure investment and construction, resulting in reduced adaptability and flexibility of infrastructure, as well as a diminished capacity for emergency response to unforeseen events, further undermining the ENR of these cities.
This analysis suggests that NS and LS cities should prioritize enhancing both ER and ENR in the future. Specifically, to bolster ER, it is essential to promote industrial diversification to mitigate reliance on a single industry, foster the development of high value-added sectors, and cultivate a diversified economic structure to enhance risk resistance. The healthy growth of small and medium-sized enterprises is also vital for economic stability. Cities should enhance their financial market systems, facilitate the listing and financing of local enterprises, broaden direct financing channels, strengthen financial oversight to mitigate risks, and encourage financial institutions to increase lending support for them to stimulate the real economy. In terms of ENR, cities should conduct regular inspections and maintenance of infrastructure such as roads, bridges, and water supply systems to ensure their stability and safety during disaster responses. Enhancing operational efficiency and service quality through technological advancements and intelligent management is crucial. The development of smart cities, utilizing big data analytics for resource allocation, optimizing the use of water and electricity, and establishing intelligent emergency command centers to improve emergency response capabilities, are also recommended.
MS and HS cities are currently grappling with numerous challenges stemming from population decline and economic recession. The ongoing US process results in significant population loss, which not only contracts the labor market and reduces employment opportunities but also heightens financial pressures on residents, diminishes their sense of belonging and identity, and exacerbates income inequality and poverty. These issues not only threaten social equity but also weaken social cohesion and the spirit of mutual assistance, rendering the cities more vulnerable in the face of disasters or economic crises due to a lack of SR. Many cities rely heavily on residential and corporate tax revenues, often opting to reduce social security expenditures and public service investments to address fiscal deficits, particularly in healthcare, pensions, unemployment, and social security for low-income groups. This trend has led to a decline in the protection levels for disadvantaged populations and a gradual contraction of social security coverage, thereby undermining IR. Moreover, as urban areas shrink, numerous residential, commercial, and industrial sites are left abandoned, resulting in significant amounts of idle land. Due to financial constraints, local governments typically prioritize basic city operations and public safety, often neglecting environmental governance and ecological restoration in favor of land development for other purposes. This neglect has led to a reduction in urban green spaces and public areas, diminishing the cities’ capacity to address pollution and environmental degradation, thereby weakening ECR.
In light of these challenges, MS and HS cities should focus on enhancing SR, IR, and ECR. To improve SR, cities should create attractive employment opportunities and foster favorable living environments to retain talent and residents. Addressing employment challenges necessitates the formulation and enhancement of policies aimed at attracting talent, providing financial incentives, and collaborating with esteemed educational institutions to establish sub-campuses or research centers, thereby elevating the city’s educational standards to attract more students and researchers. Additionally, strengthening community engagement and encouraging resident participation in social activities and volunteer services can enhance community cohesion. In terms of IR, cities should optimize their healthcare systems, bolster primary medical institutions, and ensure equitable distribution of medical resources. Strengthening the social security framework and improving unemployment, pension, and medical insurance systems are essential to safeguarding the basic livelihoods of disadvantaged groups. Establishing community service centers to offer employment guidance, legal counseling, and psychological support can enhance the accessibility and convenience of social security services. To enhance workforce competitiveness, cities should implement skills training programs aligned with market demands, create job-matching platforms that integrate online and offline services, and provide timely information on job openings and training opportunities to assist job seekers in improving their success rates and reducing unemployment. Regarding ECR, cities should promote urban renewal initiatives to rehabilitate abandoned industrial sites and ensure environmental safety. Developing vacant land into multifunctional zones can enhance land-use efficiency and optimize population density, while increasing green spaces and water systems, constructing urban parks and artificial lakes, and establishing eco-parks and green communities can improve environmental quality and enhance the ecological functions of urban areas, thereby improving residents’ living environments.

5. Conclusions

This study establishes a methodological framework aimed at assessing the spatiotemporal dynamics and the effects of spatial correlation networks on resilience across various SCs in China. Utilizing this framework, this study has established an evaluation model of US and a multidimensional evaluation system of UR tailored to China’s national context. It has investigated the spatial and temporal evolution patterns and impact mechanisms of UR in response to US, and examined the structural attributes of resilience networks in diverse SCs. The analysis was conducted on 285 cities in China, leading to specific policy recommendations. The key findings are outlined as follows:
(1) Despite the rise in SCs, many have progressively adjusted to the challenges posed by US, and the UR of SCs has shown an upward trend from 2010 to 2021. As US intensifies, the effects of US on UR become increasingly significant, contributing to a gradual decline in the rate of growth of UR.
(2) The CCD of UR subsystems across all cities has consistently increased, with a significant rise observed in cities located in eastern China between 2015 and 2021. Cities experiencing greater US tend to exhibit a corresponding decline in the CCD. From a geographical perspective, the central city within an urban agglomeration typically demonstrates lower US and a higher CCD. Such cities also play a pivotal role in enhancing the CCD of surrounding regions.
(3) A robust social security system serves as the foundation for enhancing UR across all cities. The interplay among the factors influencing UR primarily revolves around the social, economic, and institutional dimensions. As time goes by, the roles of the comprehensive utilization rate of industrial solid waste and road freight per capita gradually become prominent in MS and HS cities, and the interaction of influencing factors of UR tends to weaken.
(4) US contributes to enhancing the strength of UR connections between cities, thereby facilitating the transmission and dissemination of UR. However, there exists variability in the contributions of cities at various stages of development and economic status within this framework.
(5) Overall, this study provides a valuable framework for assessing the spatiotemporal dynamics of UR in SCs across the globe. The analytical approach presented herein should not only be effective for examining UR development trends in other SCs worldwide but also enable the comparison of the impacts of various multidimensional factors on UR. Furthermore, this research enriches the existing body of literature on UR in SCs globally, establishing a solid scientific foundation for advancing the sustainable development of SCs.
This study also presents certain limitations. Firstly, there is currently no standardized evaluation criterion for US and UR in the academic realm. The evaluation model and indicator system developed in this study may be subject to certain biases, as the static data employed do not fully encapsulate the dynamic characteristics of US and UR. This limitation hinders its capacity to reflect the continuous and evolving changes inherent in these processes. Secondly, the study period coincided with the early stages of the COVID-19 pandemic, a pivotal event that likely exerted a significant influence on both the economic recovery and social resilience of SCs. Future studies could investigate the longitudinal impact of such specific events on the UR of SCs, exploring the mechanisms driving these shifts. Thirdly, while the study area encompassed a broad sample of cities in China, focusing on specific urban agglomerations may allow for more tailored urban governance strategies. Lastly, the study did not include dynamic simulations of the levels of US and UR in the future. Given the intricate and multifaceted nature of US and UR, conducting simulations under various scenarios may help pinpoint potential issues and challenges. This approach can aid in formulating proactive measures and prevent responses solely based on historical problems, leading to more comprehensive and precise conclusions.

Author Contributions

Conceptualization, H.W.; Data curation, W.Y., S.Z., E.P., Y.Y., Y.Z., T.J., H.Z. and H.W.; Funding acquisition, H.W.; Methodology, W.Y., S.Z., E.P., Y.Y., Y.Z. and H.W.; Formal analysis, W.Y., S.Z., E.P., Y.Y., Y.Z. and H.W.; Writing—original draft, W.Y. and H.W. All authors have read and agreed to the published version of the manuscript.

Funding

This research was financially supported by the National Natural Science Foundation of China (No. 42201241); the National Key Research and Development Project of China (No. 2021YFC3101701); the Supplemental Funds for Major Scientific Research Projects of Beijing Normal University, Zhuhai (No. ZHPT2023001); and by startup funding granted to Huihui Wang by the Advanced Institute of Natural Sciences, Beijing Normal University, Zhuhai (No. 310432104).

Data Availability Statement

The original contributions presented in the study are included in the article. Further inquiries can be directed to the corresponding author.

Acknowledgments

The authors would like to thank the anonymous reviewers for their helpful and constructive comments.

Conflicts of Interest

The authors declare no conflicts of interest.

References

  1. Meng, X.; Jiang, Z.; Wang, X.; Long, Y. Shrinking cities on the globe: Evidence from LandScan 2000–2019. Environ. Plan. A Econ. Space 2021, 53, 1244–1248. [Google Scholar] [CrossRef]
  2. Zhai, W.; Jiang, Z.; Meng, X.; Zhang, X.; Zhao, M.; Long, Y. Satellite monitoring of shrinking cities on the globe and containment solutions. iScience 2022, 25, 104411. [Google Scholar] [CrossRef] [PubMed]
  3. Häußermann, H.; Siebel, W. Die schrumpfende Stadt und die Stadtsoziologie. Soziologische Stadtforsch. 1988, 29, 78–94. [Google Scholar]
  4. Wiechmann, T.; Pallagst, K.M. Urban shrinkage in Germany and the USA: A comparison of transformation patterns and local strategies. Int. J. Urban Reg. Res. 2012, 36, 261–280. [Google Scholar] [CrossRef] [PubMed]
  5. Penuelas, J.; Nogué, S. Catastrophic climate change and the collapse of human societies. Natl. Sci. Rev. 2023, 10, nwad082. [Google Scholar] [CrossRef]
  6. Liu, Y.; Han, L.; Pei, Z.; Jiang, Y. Evolution of the coupling coordination between the marine economy and urban resilience of major coastal cities in China. Mar. Policy 2023, 148, 105456. [Google Scholar] [CrossRef]
  7. Sethi, S.S.; Vinoj, V. Urbanization and regional climate change-linked warming of Indian cities. Nat. Cities 2024, 1, 402–405. [Google Scholar] [CrossRef]
  8. Sun, Y.; Jiao, L.; Guo, Y.; Xu, Z. Recognizing urban shrinkage and growth patterns from a global perspective. Appl. Geogr. 2024, 166, 103247. [Google Scholar] [CrossRef]
  9. Liu, Z.; Liu, S. Urban shrinkage in a developing context: Rethinking China’s present and future trends. Sustain. Cities Soc. 2022, 80, 103779. [Google Scholar] [CrossRef]
  10. Meng, X.; Long, Y. Shrinking cities in China: Evidence from the latest two population censuses 2010–2020. Environ. Plan. A Econ. Space 2022, 54, 449–453. [Google Scholar] [CrossRef]
  11. Du, Z.; Zhang, H.; Huang, G.; Jin, L.X. Local state responses to crisis-induced shrinkage in the world’s factory Dongguan, China: Regional resilience perspective. J. Urban Plan. Dev. 2021, 147, 05021021. [Google Scholar] [CrossRef]
  12. Johnston, L.A. “Getting Old Before Getting Rich”: Origins and Policy Responses in China. China Int. J. 2021, 19, 91–111. [Google Scholar] [CrossRef]
  13. Tu, W.J.; Zeng, X.; Liu, Q. Aging tsunami coming: The main finding from China’s seventh national population census. Aging Clin. Exp. Res. 2022, 34, 1159–1163. [Google Scholar] [CrossRef] [PubMed]
  14. Wang, Z.; Cao, C.; Chen, J.; Wang, H. Does land finance contraction accelerate urban shrinkage? A study based on 84 key cities in China. J. Urban Plan. Dev. 2020, 146, 04020038. [Google Scholar] [CrossRef]
  15. Gao, Z.; Wang, S.; Gu, J. Identification and mechanisms of regional urban shrinkage: A case study of Wuhan city in the heart of rapidly growing China. J. Urban Plan. Dev. 2021, 147, 05020033. [Google Scholar] [CrossRef]
  16. Tan, Z.; Xiang, S.; Wang, J.; Chen, S. Identification and measurement of shrinking cities based on integrated time-Series nighttime light data: An example of the Yangtze River Economic Belt. Remote Sens. 2023, 15, 3797. [Google Scholar] [CrossRef]
  17. Tong, Y.; Liu, W.; Li, C.; Zhang, J.; Ma, Z. Understanding patterns and multilevel influencing factors of small town shrinkage in Northeast China. Sustain. Cities Soc. 2021, 68, 102811. [Google Scholar] [CrossRef]
  18. Han, Z.; Mykhnenko, V.; Peng, K.; Mi, J. The governance dilemmas of urban shrinkage: Evidence from Northeast China. J. Urban Aff. 2023, 45, 1608–1624. [Google Scholar] [CrossRef]
  19. Zhang, X.; Zhang, Q.; Zhang, X.; Gu, R. Spatial-temporal evolution pattern of multidimensional urban shrinkage in China and its impact on urban form. Appl. Geogr. 2023, 159, 103062. [Google Scholar] [CrossRef]
  20. Zhang, Y.; Fu, Y.; Kong, X.; Zhang, F. Prefecture-level city shrinkage on the regional dimension in China: Spatiotemporal change and internal relations. Sustain. Cities Soc. 2019, 47, 101490. [Google Scholar] [CrossRef]
  21. Iwasaki, Y. Shrinkage of regional cities in Japan: Analysis of changes in densely inhabited districts. Cities 2021, 113, 103168. [Google Scholar] [CrossRef]
  22. Zhang, Y.; Ding, X.; Dong, L.; Yu, S. Research on spatiotemporal patterns and influencing factors of county-level urban shrinkage in urbanizing China. Sustain. Cities Soc. 2024, 109, 105544. [Google Scholar] [CrossRef]
  23. Li, W.; Li, H.; Wang, S.; Feng, Z. Spatiotemporal evolution of county-level land use structure in the context of urban shrinkage: Evidence from Northeast China. Land 2022, 11, 1709. [Google Scholar] [CrossRef]
  24. Deng, T.; Wang, D.; Yang, Y.; Yang, H. Shrinking cities in growing China: Did high speed rail further aggravate urban shrinkage? Cities 2019, 86, 210–219. [Google Scholar] [CrossRef]
  25. He, Q.; Yan, M.; Zheng, L.; Wang, B.; Zhou, J. The Effect of Urban Form on Urban Shrinkage—A Study of 293 Chinese Cities Using Geodetector. Land 2023, 12, 799. [Google Scholar] [CrossRef]
  26. Hu, Y.; Wang, Z.; Deng, T. Expansion in the shrinking cities: Does place-based policy help to curb urban shrinkage in China? Cities 2021, 113, 103188. [Google Scholar] [CrossRef]
  27. Wang, J.; Yang, Z.; Qian, X. Driving factors of urban shrinkage: Examining the role of local industrial diversity. Cities 2020, 99, 102646. [Google Scholar] [CrossRef]
  28. Alves, D.; Barreira, A.P.; Guimarães, M.H.; Panagopoulos, T. Historical trajectories of currently shrinking Portuguese cities: A typology of urban shrinkage. Cities 2016, 52, 20–29. [Google Scholar] [CrossRef]
  29. Beauregard, R.A. Urban population loss in historical perspective: United States, 1820–2000. Environ. Plan. A 2009, 41, 514–528. [Google Scholar] [CrossRef]
  30. Ma, Q.; Gong, Z.; Kang, J.; Tao, R.; Dang, A. Measuring functional urban shrinkage with multi-source geospatial big data: A case study of the Beijing-Tianjin-Hebei Megaregion. Remote Sens. 2020, 12, 2513. [Google Scholar] [CrossRef]
  31. Zhou, Y.; Li, C.; Zheng, W.; Rong, Y.; Liu, W. Identification of urban shrinkage using NPP-VIIRS nighttime light data at the county level in China. Cities 2021, 118, 103373. [Google Scholar] [CrossRef]
  32. Hollander, J.B.; Pallagst, K.; Schwarz, T.; Popper, F.J. Planning shrinking cities. Prog. Plan. 2009, 72, 223–232. [Google Scholar]
  33. Haase, A.; Bontje, M.; Couch, C.; Marcinczak, S.; Rink, D.; Rumpel, P.; Wolff, M. Factors driving the regrowth of European cities and the role of local and contextual impacts: A contrasting analysis of regrowing and shrinking cities. Cities 2021, 108, 102942. [Google Scholar] [CrossRef]
  34. Bartholomae, F.; Woon Nam, C.; Schoenberg, A. Urban shrinkage and resurgence in Germany. Urban Stud. 2017, 54, 2701–2718. [Google Scholar] [CrossRef]
  35. Sakamoto, K.; Iida, A.; Yokohari, M. Spatial patterns of population turnover in a Japanese Regional City for urban regeneration against population decline: Is Compact City policy effective? Cities 2018, 81, 230–241. [Google Scholar] [CrossRef]
  36. Klein, R.J.; Nicholls, R.J.; Thomalla, F. Resilience to natural hazards: How useful is this concept? Glob. Environ. Change Part B Environ. Hazards 2003, 5, 35–45. [Google Scholar] [CrossRef]
  37. Giulia, D. Implementing urban resilience in urban planning: A comprehensive framework for urban resilience evaluation. Sustain. Cities Soc. 2023, 98, 104821. [Google Scholar]
  38. Mu, X.; Fang, C.; Yang, Z. Spatio-temporal evolution and dynamic simulation of the urban resilience of Beijing-Tianjin-Hebei urban agglomeration. J. Geogr. Sci. 2022, 32, 1766–1790. [Google Scholar] [CrossRef]
  39. Ruan, J.; Chen, Y.; Yang, Z. Assessment of temporal and spatial progress of urban resilience in Guangzhou under rainstorm scenarios. Int. J. Disaster Risk Reduct. 2021, 66, 102578. [Google Scholar] [CrossRef]
  40. Zhao, R.; Fang, C.; Liu, J.; Zhang, L. The evaluation and obstacle analysis of urban resilience from the multidimensional perspective in Chinese cities. Sustain. Cities Soc. 2022, 86, 104160. [Google Scholar] [CrossRef]
  41. Zuniga-Teran, A.A.; Gerlak, A.K.; Mayer, B.; Evans, T.P.; Lansey, K.E. Urban resilience and green infrastructure systems: Towards a multidimensional evaluation. Curr. Opin. Environ. Sustain. 2020, 44, 42–47. [Google Scholar] [CrossRef]
  42. Wang, H.; Liu, Z.; Zhou, Y. Assessing urban resilience in China from the perspective of socioeconomic and ecological sustainability. Environ. Impact Assess. Rev. 2023, 102, 107163. [Google Scholar] [CrossRef]
  43. Chen, X.L.; Yu, L.X.; Lin, W.D.; Yang, F.Q.; Li, Y.P.; Tao, J.; Cheng, S. Urban resilience assessment from the multidimensional perspective using dynamic Bayesian network: A Case Study of Fujian Province, China. Reliab. Eng. Syst. Saf. 2023, 238, 109469. [Google Scholar] [CrossRef]
  44. Sun, J.; Zhai, N.; Mu, H.; Miao, J.; Li, W.; Li, M. Assessment of urban resilience and subsystem coupling coordination in the Beijing-Tianjin-Hebei urban agglomeration. Sustain. Cities Soc. 2024, 100, 105058. [Google Scholar] [CrossRef]
  45. Cheng, Y.; Liu, J. Evaluation of urban resilience in the post-COVID-19 period: A case study of the Yangtze delta city group in China. Int. J. Disaster Risk Reduct. 2023, 97, 104028. [Google Scholar] [CrossRef]
  46. Ribeiro, P.J.G.; Gonçalves, L.A.P.J. Urban resilience: A conceptual framework. Sustain. Cities Soc. 2019, 50, 101625. [Google Scholar] [CrossRef]
  47. Büyüközkan, G.; Ilıcak, Ö.; Feyzioğlu, O. A review of urban resilience literature. Sustain. Cities Soc. 2022, 77, 103579. [Google Scholar] [CrossRef]
  48. Adger, W.N.; Safra de Campos, R.; Siddiqui, T.; Szaboova, L. Commentary: Inequality, precarity and sustainable ecosystems as elements of urban resilience. Urban Stud. 2020, 57, 1588–1595. [Google Scholar] [CrossRef]
  49. Zou, Y. Urban resilience, digital technologies, and the economic recovery of a city from the pandemic. Public Adm. Rev. 2024, 84, 637–650. [Google Scholar] [CrossRef]
  50. Leal Filho, W.; Icaza, L.E.; Neht, A.; Klavins, M.; Morgan, E.A. Coping with the impacts of urban heat islands. A literature based study on understanding urban heat vulnerability and the need for resilience in cities in a global climate change context. J. Clean. Prod. 2018, 171, 1140–1149. [Google Scholar] [CrossRef]
  51. Ren, J.; Li, Y.; Zhang, J.; Xu, H.; Hao, C. Does urban shrinkage equate to a decline in development levels?–Urban development measurement and influencing factors analysis. Environ. Impact Assess. Rev. 2024, 105, 107401. [Google Scholar] [CrossRef]
  52. Sun, J.; Zhou, T. Urban shrinkage and eco-efficiency: The mediating effects of industry, innovation and land-use. Environ. Impact Assess. Rev. 2023, 98, 106921. [Google Scholar] [CrossRef]
  53. Wang, H.; Xue, H.; He, W.; Han, Q.; Xu, T.; Gao, X.; Liu, S.; Jiang, R.; Huang, M. Spatial-temporal evolution mechanism and dynamic simulation of the urban resilience system of the Guangdong-Hong Kong-Macao Greater Bay Area in China. Environ. Impact Assess. Rev. 2023, 104, 107333. [Google Scholar] [CrossRef]
  54. Wang, H.; Du, S.; Zhong, Y.; Liu, S.; Xu, T.; Zhao, Y.; He, W.; Xue, H.; He, Y.; Gao, X.; et al. Unveiling the impact mechanism of urban resilience on carbon dioxide emissions of the Pearl River Delta urban agglomeration in China. Environ. Impact Assess. Rev. 2024, 105, 107422. [Google Scholar] [CrossRef]
  55. Yu, Y.; Yang, C.; Hu, Q.; Kong, S. Towering sustainability: Unraveling the complex effects of skyscrapers on urban resilience. Environ. Impact Assess. Rev. 2024, 108, 107614. [Google Scholar] [CrossRef]
  56. Eraydin, A.; Özatağan, G. Pathways to a resilient future: A review of policy agendas and governance practices in shrinking cities. Cities 2021, 115, 103226. [Google Scholar] [CrossRef]
  57. Hartt, M. The elasticity of shrinking cities: An analysis of indicators. Prof. Geogr. 2021, 73, 230–239. [Google Scholar] [CrossRef]
  58. Sun, Y.; Wang, Y.; Zhou, X.; Chen, W. Are shrinking populations stifling urban resilience? Evidence from 111 resource-based cities in China. Cities 2023, 141, 104458. [Google Scholar] [CrossRef]
  59. Xie, M.; Feng, Z.; Li, C. How does population shrinkage affect economic resilience? A case study of resource-based cities in northeast china. Sustainability 2022, 14, 3650. [Google Scholar] [CrossRef]
  60. Jin, Y.; Zhou, G.; Sun, H.; Fu, H.; Wu, H.; Liu, Y. Regrowth or smart decline? A policy response to shrinking cities based on a resilience perspective. Sustain. Cities Soc. 2024, 108, 105431. [Google Scholar] [CrossRef]
  61. Hartt, M.D. How cities shrink: Complex pathways to population decline. Cities 2018, 75, 38–49. [Google Scholar] [CrossRef]
  62. Tong, Y.; Liu, W.; Li, C.; Rong, Y.; Zhang, J.; Yang, Y.; Liu, Y. County town shrinkage in China: Identification, spatiotemporal variations and the heterogeneity of influencing factors. J. Rural Stud. 2022, 95, 350–361. [Google Scholar] [CrossRef]
  63. Kang, H.; Fu, M.; Kang, H.; Li, L.; Dong, X.; Li, S. The Impacts of Urban Population Growth and Shrinkage on the Urban Land Use Efficiency: A Case Study of the Northeastern Region of China. Land 2024, 13, 1532. [Google Scholar] [CrossRef]
  64. Jiang, Y.; Sun, P. Does shrinkage have an impact on urban livability? An empirical analysis from Northeast China. Sustain. Cities Soc. 2024, 113, 105725. [Google Scholar] [CrossRef]
  65. Liu, W.; Zhou, J.; Li, X.; Zheng, H.; Liu, Y. Urban resilience assessment and its spatial correlation from the multidimensional perspective: A case study of four provinces in North-South Seismic Belt, China. Sustain. Cities Soc. 2024, 101, 105109. [Google Scholar] [CrossRef]
  66. Ye, C.; Hu, M.; Lu, L.; Dong, Q.; Gu, M. Spatio-temporal evolution and factor explanatory power analysis of urban resilience in the Yangtze River Economic Belt. Geogr. Sustain. 2022, 3, 299–311. [Google Scholar] [CrossRef]
  67. Jaafari, A.; Mafi-Gholami, D.; Yousefi, S. A spatiotemporal analysis using expert-weighted indicators for assessing social resilience to natural hazards. Sustain. Cities Soc. 2024, 100, 105051. [Google Scholar] [CrossRef]
  68. Liu, L.; Lei, Y.; Fath, B.D.; Hubacek, K.; Yao, H.; Liu, W. The spatio-temporal dynamics of urban resilience in China’s capital cities. J. Clean. Prod. 2022, 379, 134400. [Google Scholar] [CrossRef]
  69. Song, G.; Zhong, S.; Song, L. Spatial pattern evolution characteristics and influencing factors in county economic resilience in China. Sustainability 2022, 14, 8703. [Google Scholar] [CrossRef]
  70. Qin, F.; Chen, G. Vulnerability of Tourist Cities’ Economic Systems Amid the COVID-19 Pandemic: System Characteristics and Formation Mechanisms—A Case Study of 46 Major Tourist Cities in China. Sustainability 2022, 14, 2661. [Google Scholar] [CrossRef]
  71. Chen, Y.; Li, K.; Zhou, Q. Spatial differentiation of urban economic resilience and its influencing factors: Evidence from Baidu migration big data. Technol. Econ. Dev. Econ. 2023, 29, 353–381. [Google Scholar] [CrossRef]
  72. Parra, C.M.; Poudel, R.; Sutherland, M. Towards an Understanding of Low-Income Individuals’ Financial Resiliency: Exploration of Risk Preferences, Personality Traits, and Savings Behavior. J. Econ. Behav. Stud. 2021, 13, 32–54. [Google Scholar] [CrossRef] [PubMed]
  73. Han, S.; Wang, B.; Ao, Y.; Bahmani, H.; Chai, B. The coupling and coordination degree of urban resilience system: A case study of the Chengdu–Chongqing urban agglomeration. Environ. Impact Assess. Rev. 2023, 101, 107145. [Google Scholar] [CrossRef]
  74. Tang, D.; Li, J.; Zhao, Z.; Boamah, V.; Lansana, D.D. The influence of industrial structure transformation on urban resilience based on 110 prefecture-level cities in the Yangtze River. Sustain. Cities Soc. 2023, 96, 104621. [Google Scholar] [CrossRef]
  75. Yeh, C.Y.; Cheng, H.; Shi, S.J. Public–private pension mixes in East Asia: Institutional diversity and policy implications for old-age security. Ageing Soc. 2020, 40, 604–625. [Google Scholar] [CrossRef]
  76. Zhang, Y.; Liu, Q.; Li, X.; Zhang, X.; Qiu, Z. Spatial-temporal evolution characteristics and critical factors identification of urban resilience under public health emergencies. Sustain. Cities Soc. 2024, 102, 105221. [Google Scholar] [CrossRef]
  77. Soon, S.; Chou, C.C.; Shi, S.J. Withstanding the plague: Institutional resilience of the East Asian welfare state. Soc. Policy Adm. 2021, 55, 374–387. [Google Scholar] [CrossRef]
  78. Huang, J.; Zhong, P.; Zhang, J.; Zhang, L. Spatial-temporal differentiation and driving factors of ecological resilience in the Yellow River Basin, China. Ecol. Indic. 2023, 154, 110763. [Google Scholar] [CrossRef]
  79. Xu, X.; Wang, M.; Wang, M.; Yang, Y.; Wang, Y. The coupling coordination degree of economic, social and ecological resilience of urban agglomerations in China. Int. J. Environ. Res. Public Health 2022, 20, 413. [Google Scholar] [CrossRef]
  80. Dui, H.; Zhu, Y.; Tao, J. Multi-phased resilience methodology of urban sewage treatment network based on the phase and node recovery importance in IoT. Reliab. Eng. Syst. Saf. 2024, 247, 110130. [Google Scholar] [CrossRef]
  81. Chang, Q.; Sha, Y.; Chen, Y. The Coupling Coordination and Influencing Factors of Urbanization and Ecological Resilience in the Yangtze River Delta Urban Agglomeration, China. Land 2024, 13, 111. [Google Scholar] [CrossRef]
  82. Liu, Y.; Li, Q.; Li, W.; Jia, L.; Pei, X. Knowledge map and hotspot analysis in climate resilience infrastructure (CRI) from 1997 to 2022 through scientometric analysis. Environ. Res. 2023, 228, 115874. [Google Scholar] [CrossRef] [PubMed]
  83. Hu, X.; Su, Y.; Ren, K.; Song, F.; Xue, R. Measurement and influencing factors of urban traffic ecological resilience in developing countries: A case study of 31 Chinese cities. Reg. Sustain. 2021, 2, 211–223. [Google Scholar] [CrossRef]
  84. Li, G.; Cheng, G.; Wu, Z. Resilience assessment of urban complex giant systems in Hubei section of the three gorges reservoir area based on multi-source data. Sustainability 2022, 14, 8423. [Google Scholar] [CrossRef]
  85. Wu, Y.; Que, W.; Liu, Y.G.; Cao, L.; Liu, S.B.; Zhang, J. Is resilience capacity index of Chinese region performing well? Evidence from 26 provinces. Ecol. Indic. 2020, 112, 106088. [Google Scholar] [CrossRef]
  86. An, R.; Liu, P.; Feng, M.; Cheng, L.; Yao, M.; Wang, Y.; Li, X. Resilience analysis of the nexus across water supply, power generation and environmental systems from a stochastic perspective. J. Environ. Manag. 2021, 289, 112513. [Google Scholar] [CrossRef]
  87. He, G.; Zhang, J.; Jiang, H. A study on the spatial and temporal evolution patterns of water resource–ecology–social economy composite system resilience in the Huaihe River Basin. Water Supply 2024, 24, 1590–1607. [Google Scholar] [CrossRef]
  88. Chen, Y.; Su, X.; Zhou, Q. Study on the spatiotemporal evolution and influencing factors of urban resilience in the Yellow River basin. Int. J. Environ. Res. Public Health 2021, 18, 10231. [Google Scholar] [CrossRef]
  89. Liu, L.; Luo, Y.; Pei, J.; Wang, H.; Li, J.; Li, Y. Temporal and spatial differentiation in urban resilience and its influencing factors in Henan Province. Sustainability 2021, 13, 12460. [Google Scholar] [CrossRef]
  90. Lyu, T.; Tong, D. Impact of accessibility of land transportation networks on regional economic resilience: An empirical study of China. Int. J. Shipp. Transp. Logist. 2021, 13, 515–537. [Google Scholar] [CrossRef]
  91. Patnala, P.K.; Regehr, J.D.; Mehran, B.; Regoui, C. Resilience for freight transportation systems to disruptive events: A review of concepts and metrics. Can. J. Civ. Eng. 2023, 51, 237–263. [Google Scholar] [CrossRef]
  92. Hsu, P.F.; Hsu, M.G. Optimizing the information outsourcing practices of primary care medical organizations using entropy and TOPSIS. Qual. Quant. 2008, 42, 181–201. [Google Scholar] [CrossRef]
  93. Tzeng, G.H.; Huang, J.J. Multiple Attribute Decision Making: Methods and Applications; CRC Press: Boca Raton, FL, USA, 2011. [Google Scholar]
  94. Cao, X.; Wei, C.; Xie, D. Evaluation of scale management suitability based on the entropy-TOPSIS method. Land 2021, 10, 416. [Google Scholar] [CrossRef]
  95. Li, J.; Ren, Y.; Ma, X.; Wang, Q.; Ma, Y.; Yu, Z.; Li, J. Comprehensive evaluation of the working mode of multi-energy complementary heating systems in rural areas based on the entropy-TOPSIS model. Energy Build. 2024, 310, 114077. [Google Scholar] [CrossRef]
  96. Wang, S.J.; Kong, W.; Ren, L.; Zhi, D.D. Research on misuses and modification of coupling coordination degree model in China. J. Nat. Resour. 2021, 36, 793–810. [Google Scholar] [CrossRef]
  97. Wang, J.; Xu, C. Geodetector: Principle and prospective. Acta Geogr. Sin. 2017, 72, 116–134. (In Chinese) [Google Scholar]
  98. Wasserman, S.; Faust, K. Social Network Analysis: Methods and Applications; Cambridge University Press: Cambridge, UK, 1994. [Google Scholar]
  99. Schetke, S.; Haase, D. Multi-criteria assessment of socio-environmental aspects in shrinking cities. Experiences from eastern Germany. Environ. Impact Assess. Rev. 2008, 28, 483–503. [Google Scholar] [CrossRef]
  100. Tateishi, E.; Takahashi, K.; Nakano, T. Governance reaction to the emerging megacity shrinkage in Tokyo: The case of the Tsukuba express transit-suburban region. Cities 2021, 109, 103033. [Google Scholar] [CrossRef]
  101. Haase, A.; Bernt, M.; Großmann, K.; Mykhnenko, V.; Rink, D. Varieties of shrinkage in European cities. Eur. Urban Reg. Stud. 2016, 23, 86–102. [Google Scholar] [CrossRef]
  102. Döringer, S.; Uchiyama, Y.; Penker, M.; Kohsaka, R. A meta-analysis of shrinking cities in Europe and Japan. Towards Integr. Res. Agenda. Eur. Plan. Stud. 2020, 28, 1693–1712. [Google Scholar]
  103. Pallagst, K.; Fleschurz, R.; Trapp, F. Greening the shrinking city—Policies and planning approaches in the USA with the example of Flint, Michigan. Landsc. Res. 2017, 42, 716–727. [Google Scholar] [CrossRef]
  104. GB/T 40947-2021; Guide for Safety Resilient City Evaluation. Standardization Administration of the People’s Republic of China: Beijing, China, 2021.
  105. He, X.; Zhou, Y.; Yuan, X.; Zhu, M. The coordination relationship between urban development and urban life satisfaction in Chinese cities-An empirical analysis based on multi-source data. Cities 2024, 150, 105016. [Google Scholar] [CrossRef]
  106. Shi, T.; Qiao, Y.; Zhou, Q. Spatiotemporal evolution and spatial relevance of urban resilience: Evidence from cities of China. Growth Change 2021, 52, 2364–2390. [Google Scholar] [CrossRef]
  107. Yao, Y.; Guo, Z.; Huang, X.; Ren, S.; Hu, Y.; Dong, A.; Guan, Q. Gauging urban resilience in the United States during the COVID-19 pandemic via social network analysis. Cities 2023, 138, 104361. [Google Scholar] [CrossRef]
  108. Bănică, A.; Istrate, M.; Muntele, I. Challenges for the resilience capacity of Romanian shrinking cities. Sustainability 2017, 9, 2289. [Google Scholar] [CrossRef]
  109. Dong, L.J.; Su, F.; Wen, Y.Q.; Wang, Y.C. Obstacle factors and evolution of urban economic resilience of Fuxin shrinking city and its obstacle factors. Sci. Geogr. Sin. 2020, 40, 1142–1149. (In Chinese) [Google Scholar]
  110. Hartt, M. The diversity of North American shrinking cities. Urban Stud. 2018, 55, 2946–2959. [Google Scholar] [CrossRef]
  111. Cho, H.R.; Kim, S. Attributes of the positive side of urban shrinkage: Evidence from seoul. J. Urban Plan. Dev. 2023, 149, 05023008. [Google Scholar] [CrossRef]
  112. Seymour, E.; Endsley, K.A.; Franklin, R.S. Differential drivers of rent burden in growing and shrinking cities. Appl. Geogr. 2020, 125, 102302. [Google Scholar] [CrossRef]
  113. Nijman, J.; Wei, Y.D. Urban inequalities in the 21st century economy. Appl. Geogr. 2020, 117, 102188. [Google Scholar] [CrossRef]
  114. Turok, I.; Mykhnenko, V. The trajectories of European cities, 1960–2005. Cities 2007, 24, 165–182. [Google Scholar] [CrossRef]
  115. Ren, Z.; Fu, Y.; Dong, Y.; Zhang, P.; He, X. Rapid urbanization and climate change significantly contribute to worsening urban human thermal comfort: A national 183-city, 26-year study in China. Urban Clim. 2022, 43, 101154. [Google Scholar] [CrossRef]
  116. Slach, O.; Bosák, V.; Krtička, L.; Nováček, A.; Rumpel, P. Urban shrinkage and sustainability: Assessing the nexus between population density, urban structures and urban sustainability. Sustainability 2019, 11, 4142. [Google Scholar] [CrossRef]
  117. Long, Y.; Gao, S. Shrinking cities in China: The overall profile and paradox in planning. In Shrinking Cities in China: The Other Facet of Urbanization; Springer: Singapore, 2019; pp. 3–21. [Google Scholar]
  118. Zhou, K.; Koutský, J.; Hollander, J.B. Urban shrinkage in China, the USA and the Czech Republic: A comparative multilevel governance perspective. Int. J. Urban Reg. Res. 2022, 46, 480–496. [Google Scholar] [CrossRef]
Figure 1. Study area. Notes: (a) indicates the location of the study area. (bd) represent the population, fiscal revenue per capita, and the number of employees in the tertiary sector of the study area in 2021, respectively.
Land 14 00348 g001
Figure 2. Conceptual framework of the interactions between US and UR.
Land 14 00348 g002
Figure 3. The methodological framework of this study.
Land 14 00348 g003
Figure 4. Spatial and temporal pattern of SCs in China.
Land 14 00348 g004
Figure 5. Characteristics of the spatiotemporal evolution of UR. Notations: The division standards for different UR levels are Low (UR ≤ 0.102), Lower (0.102 < UR ≤ 0.148), Medium (0.148 < UR ≤ 0.210), Higher (0.210 < UR ≤ 0.298), and High (UR > 0.298).
Land 14 00348 g005
Figure 6. Characteristics of the spatiotemporal evolution of URC in 2010–2015 (T1) and 2015–2021 (T2) from the perspective of US. Notations: The division standards for different URC levels are Small difference (URC ≤ −0.057), Smaller difference (−0.057 < URC ≤ −0.007), Moderate difference (−0.007 < URC ≤ 0.023), Larger difference (0.023 < URC ≤ 0.060), and Large difference (URC > 0.060).
Land 14 00348 g006
Figure 7. The CD of UR systems from 2010 to 2021.
Land 14 00348 g007
Figure 8. The CCD of UR systems from 2010 to 2021.
Land 14 00348 g008
Figure 9. The change of CCD types in different SCs.
Land 14 00348 g009
Figure 10. Influencing factors of UR in different SCs.
Land 14 00348 g010
Figure 11. Structure indicators of UR spatial association network in different SCs.
Land 14 00348 g011
Figure 12. Topological structure diagrams of UR networks in different SCs. Node size is proportional to the number of direct connections each city has with other cities. The darker the color of a node, the higher the local clustering coefficient of the city.
Land 14 00348 g012
Table 1. Criteria for the classification of US degree.
The Degree of USDivision Standard
No shrinkage (NS) U S R c i t y y y + n ≥ 0
Low shrinkage (LS)−5% < U S R c i t y y y + n ≤ 0
Medium shrinkage (MS)−10% < U S R c i t y y y + n ≤ −5%
High shrinkage (HS) U S R c i t y y y + n ≤ −10%
Table 2. Comprehensive evaluation index system of UR.
First Level IndicatorSecondary IndicatorsUnits and PropertiesEvaluation ContentWeightReferences
Social resilience
(SR)
Natural population growth rate (X1)% (+)Stability of the age structure of the population0.0114[65,66]
Population density (X2)10,000 people/km2 (+)Population distribution0.1474[66,67]
College students per 10,000 population (X3)People/10,000 (+)Individual capacity to cope with risk0.1423[68]
Economic resilience
(ER)
GDP per capita (X4)CNY (+)Personal economic strength0.0559[43,69]
Local fiscal self-sufficiency rate (X5)% (+)Local financial strength0.0494[70]
Financial loan-to-deposit ratio (X6)% (+)Urban risk control capacity0.0220[71]
Residents’ personal savings rate (X7)% (+)0.0003[72]
Institutional resilience
(IR)
Doctors and nurses employees per 1000 population (X8)People/1000 (+)Socio-medical motivation0.0412[73]
Number of beds per 1000 people in medical institutions (X9)Beds/1000 people (+)Social security capacity0.0278[74]
Basic pension insurance participants at the end of the year (X10)People/100 (+)Social security needs0.1331[43,75]
Basic medical insurance participants at the end of the year (X11)People/100 (+)0.1393[76]
Basic unemployment insurance participants at the end of the year (X12)People/100 (−)0.0025[77]
Ecological resilience
(ECR)
Harmless disposal rate of domestic waste (X13)% (+)Municipal capacity to treat industrial waste0.0051[78,79]
Centralized treatment rate of sewage treatment plants (X14)% (+)0.0064[80]
Comprehensive utilization rate of industrial solid waste (X15)% (+)0.0171[81,82]
Greening coverage of the district (X16)% (+)Urban self-purification capacity0.0036[71,83]
Engineering resilience
(ENR)
Gas penetration rate (X17)t/people (−)Residential energy consumption capacity0.0043[84,85]
Water consumption per capita (X18)t/people (−)The perfection of urban infrastructure0.0048[86,87]
Road area per capita (X19)m2/people (+)0.0332[88,89]
Road freight per capita (X20)t/people (+)0.1530[90,91]
Notations: The “+” indicates that the impact of this indicator on UR is positive. The “−” indicates that the impact of this indicator on UR is negative.
Table 3. Different stages of CD.
CDTypeStage
C ∈ [0, 0.2]Low CouplingLower Coupling stage
C ∈ (0.2, 0.3]Antagonistic
C ∈ (0.3, 0.4]Moderate CouplingModerate Coupling stage
C ∈ (0.4, 0.5]Running-inAdvanced Coupling stage
C ∈ (0.5, 1)High Coupling
Table 4. Different stages of CCD.
CCDTypeStage
D ∈ [0, 0.2]Extreme Disorder (ED)Disorder stage
D ∈ (0.2, 0.25]Moderate Disorder (MD)
D ∈ (0.25, 0.3]Basic Coordination (BC)Transition stage
D ∈ (0.3, 0.35]Moderate Coordination (MC)Coordination stage
D ∈ (0.35, 1]High Coordination (HC)
Disclaimer/Publisher’s Note: The statements, opinions and data contained in all publications are solely those of the individual author(s) and contributor(s) and not of MDPI and/or the editor(s). MDPI and/or the editor(s) disclaim responsibility for any injury to people or property resulting from any ideas, methods, instructions or products referred to in the content.

