Abstract
Vast rural populations squeezed into cities, leaving small townships hollowed out. Even so, some townships’ lands are still expanding. The dilemma of land expansion with a shrinking population raises various challenges including farmland reduction. Much of the current research on the impervious expansion has focused on urban areas, while townships were often neglected. Based on high-resolution satellite data and statistic data in 1993–2018, this study explored long-term township impervious land expansion dynamics and explored the real-world relationship with their population for the 17 first-batch-of-strong-tourism counties in China. The results showed that over the past 26 years, there had been an increasing trend in the impervious areas in 17 counties. There were diseconomies of scale for impervious land expansion, i.e., the township’s land expansion became less efficient with the shrinking population. The impervious area was predominantly converted from cropland (ranging from 16.40% to 71.96%). The expansion in highlands was also increasing, although most of the growth occurred in the lowlands. The expansion patterns were mainly dominated by infilling and edge-expansion during the early stage, after which leapfrogging occurred, and infilling increased again in recent years. Townships with a “closer” accessibility to tourist attractions had the largest and fastest rate of impervious land expansion and an increasing influence of townships. These counties needed customized development with its unique natural conditions. This study could provide data-based evidence for better planning and governing to promote sustainable development worldwide.
1. Introduction
The advancement of industrialization and urbanization had profoundly transformed the industrial structure and population distribution in rural areas, causing rural shrinkage to become a focal point of attention for numerous scholars. This non-intensive growth pattern, marked by population decline and uncontrolled land expansion, had sparked sustainability issues in numerous regions [1,2]. The migration out of rural areas had resulted in the abandonment of many newly constructed buildings and infrastructure, which not only escalated maintenance costs but also led to the squandering of public investments [3]. Notably, the phenomenon of rural shrinkage in countries and regions such as Europe, the Americas, and Asia had shown unique characteristics, with a range of causes and impacts [4,5,6]. It was a widely held belief that enhancing the quality of life would curb migration and foster rural towns as attractive places for living and business [7]. Governments and international organizations have consistently explored and implemented various strategies, encompassing but not limited to devising and enforcing more scientific and rational land use planning, optimizing land resource allocation, advancing agricultural modernization, and the flexible development of public facilities. However, despite numerous adjustments made by countries in the allocation of resources and production factors, suboptimal land expansion and population shifts remained prevalent on a global scale. Identifying their characteristics and subsequently optimizing the corresponding conditions continues to be a noteworthy challenge.
In recent decades, the vast rural population in China have squeezed into cities, leading to a dramatic increase in the urban population from 17.9% in 1978 to 63.9% in 2020 [8,9,10]. Urban growth has brought about super-linear scaling in economic productivity, driving the booming development of wealth and innovation [11]. Despite the continuous advancement of urbanization, China’s rural areas still have a vast number of villages. Many townships have been experiencing the loss of their population, slower development, fewer job opportunities, and then gradually become hollowed out [12,13]. Even so, some townships’ land is still expanding due to the presence of children, the environment, investment, vanity, geomancy and other factors [14,15,16,17]. The migrants in cities also invested their savings to build bigger houses back in towns and villages, often on uncultivated agricultural land [18]. This dilemma of land expansion with shrinking populations raises various challenges including farmland reduction and ecological destruction. Exploring impervious land expansion patterns and drivers in townships can provide data-based evidence for better planning and governing [19].
Most of the existing studies for township development were based on interviews, structured questionnaires, and statistical data from the government. Xue and Kerstetter (2018) conducted in-depth interviews with local residents in Chongdu Valley, China, detailing their livelihoods as they transitioned from agriculture to tourism [20]. Su et al. (2019) combined a quantitative questionnaire survey and qualitative semi-structured interviews to study the overall livelihood sustainability in the Hetu Township [21]. However, the accuracy of the data from surveys is influenced by sample selection, questionnaire design, and response biases. Moreover, large-scale surveys require significant human resources and time cost. Satellite images have provided long-term and high-resolution monitoring on the surface with rapid response. The remote sensing approach has been widely applied in cities [22,23]. At present, township development studies based on the satellite approach are still very limited. Exploring spatial and temporal land expansion in townships will deepen our understanding of the township development trajectory and help formulate rational strategies for future sustainable development. Therefore, it is necessary to depict long-term township land expansion with high spatial resolution and explore the real-world relationship with its increasing or decreasing population.
According to the theory of growth poles (Perroux, 1950), townships, serving as small growth poles, possess diverse characteristics, such as being industrial, agricultural, trade-oriented, or tourism-based, among others [24]. Influenced by the new consumption revolution and the aspiration for a better life, rural tourism has rapidly developed in many places in Europe, America, and Asia, exerting a significant impact on the spatial layout of rural areas and nearby towns [25]. The strategic idea of choosing tourism-oriented growth poles is a development choice for numerous Chinese townships. Researching this type of township can benefit a broader range of areas. The Chinese government has made great effort in counties and villages to achieve Sustainable Development Goals 1-SDGs (No Poverty) and the Beautiful China Initiative. One of these is the implemented rural vitalization strategy in towns and villages [26]. And tourism vitalization is one of the typical types, addressed with the significance in creating employment opportunities [27]. China carried out the pilot construction of the first batch of strong tourism counties in 2003 and announced 17 counties that reached the standard in 2007. Based on the satellite data from 1993 to 2018 for these 17 first-batch-strong-tourism counties, we aim to (1) explore the township dilemma of “shrinking population vs. increasing land expansion”; (2) identify how and where the impervious land expansion happened; and (3) analyze the role of tourist attractions on impervious land expansion.
2. Materials and Methods
2.1. Study Area
The 17 first-batch-of-strong-tourism counties were located dispersedly across China (Figure 1). After nearly two decades, these counties have developed into being well known and highly representative in terms of research and practice. The 17 counties are distributed in the Eastern region (5 counties), the Central Region (6 counties) and the Western region (6 counties). The counties located in the central and eastern regions have a flatter terrain than those located in the western regions. For all the 17 counties, there are rich tourism resources with 3A-, 4A-, or 5A-rated scenic areas, which attract the arrival of a multitude of tourists. For example, the Luanchuan county, located in the Central Plains Region, received 13.62 million tourists in 2022, realizing a comprehensive tourism income of 9.7 billion yuan (https://www.luanchuan.gov.cn/zwgknews/65814, accessed on 20 September 2023). The location quotients of tourism revenue in the Luanchuan county (compared with the Henan province) from 2016 to 2022 were all greater than 1.0 and even reached 6.23 in 2022. These counties had a great advantage in the tourism development in China.
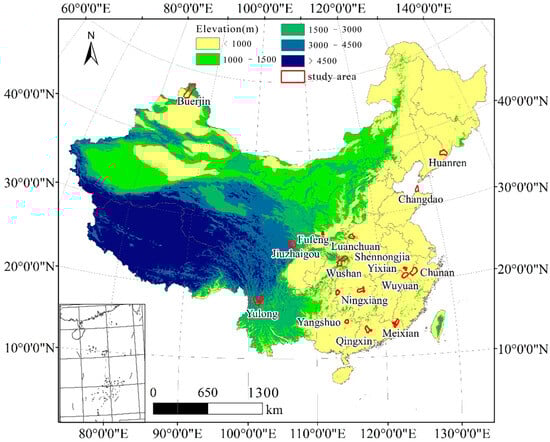
Figure 1.
Location of 17 first-batch-of-strong-tourism counties.
2.2. Temporal Town Expansion Dynamics
In this study, we used land cover data for 26 years during 1993–2018, and selected six representative years (1993, 1998, 2003, 2008, 2013, and 2018) to reflect the morphological evolution of the townships [28]. The land cover data were sourced from the CLCD (China Land Cover Dataset), an annual land cover dataset for China produced based on Landsat imagery [28]. The land cover data with a resolution of 30 m were classified into categories such as cropland, forest, shrub, grassland, water, snow/ice, barren, impervious, and wetland. The overall accuracy reached 79.31%, with the accuracy of impervious land exceeding 72%. The annual impervious area increase (AI) and annual growth rate (AGR) were utilized to quantify land expansion in the 17 counties from 1993 to 2018. The equations were as follows [22]:
where As and Ae represent the township impervious area at the start and end of a period, respectively, and n is the study period.
To assess the impervious area expansion in the highlands, we also acquired elevation (DEM) data with a spatial resolution of 30 m from the Geospatial Data Cloud platform (https://www.gscloud.cn/, accessed on 3 October 2023). According to Yang et al. (2022), highlands include hills (elevation 0~1000 m with slope > 15°, or elevation 1000~1200 m with slope > 8° or elevation 1200~1500 m with slope 0~3°) and mountains (elevation 1200~1500 m with slope > 3° or elevation > 1500 m) [29].
To further evaluate the transformations among various land use types, the land use transition matrix was used to statistically examine the mutual transformation relationships between different land use types across various periods. The land use type that was most frequently converted into impervious surfaces, namely cropland, was then identified from the matrix. Finally, the amount and percentage of cropland transitions were calculated for the different counties.
2.3. Scaling Relationship Between Land and Population
To reveal the scaling relationship between land and population, we examined the temporal (longitudinal) evolution dynamics of 17 counties based on power law scaling [30]. Power law scaling was first proposed to quantify the allometric scaling of metabolic rate with body mass, then it was often applied in the exploration of urban evolution [31,32].
where Y(t) represents the township’s impervious area in a specific t-th year, and N(t) represents the township resident population in a specific t-th year. The parameter Y0 is constant, and β is the scaling exponent. The resident population data of the townships were collected from the related County Bureau of Statistics (https://data.cnki.net/, accessed on 20 September 2023).
2.4. Townships’ Impervious Land Expansion Types
Three types of expansion, namely infilling, edge-expansion, and leapfrogging were analyzed in this study [33]. Infilling refers to when central unincorporated land is converted into impervious land. Edge-expansion is the growing of new impervious land along the boundaries of existing patches. Leapfrogging is delineated by a separate new growth not overlapping with existing impervious land patches. An indicator E was used to distinguish these three types of expansion:
where Lcom denotes the length of the common boundary between the new impervious patch and original impervious patch, and Pnew denotes the perimeter of the newly grown impervious patch. The value range of E is [0, 1], and infilling occurs when 0.5 < E ≤ 1, while edge-expansion occurs when 0 < E ≤ 0.5, and leapfrogging occurs when E = 0.
2.5. Accessibility Assessment of Tourist Attractions Based on Average Travel Time
We used road network data from Sky map 2020 to explore the accessibility of locations to tourist attractions within each county through a network analysis. The speed limits for each type of road were derived from the Industrial Standards of the People’s Republic of China: Technical Standards for Highway Engineering (JTGB-2003), and also by referencing actual regional constraints (Table S1) [34,35]. The new O-D matrix was created using the gates of tourist attractions as destination points. Then, accessibility was measured as the total weighted time to these destination points, and the smaller the value, the higher the accessibility. Finally, we used the inverse distance weighting method to obtain the visualization results and classified them into five levels, which are closer, close, medium, far, and farther. After that, a correlation analysis was used to explore the relationships between the annual impervious land area growth rate and accessibility or traffic density in IBM SPSS Statistics 27.
3. Results
3.1. Townships’ Impervious Land Expansion with Shrinking Population
From 1993 to 2018, the impervious area of 17 counties showed a trend of continuous expansion, and the expansion area and speed of the counties located in the eastern region were mostly higher than those in the central and western regions. Among them, Huanren located in northeastern China ranked first in 1993 with 3751.4 ha and then became the second-largest county with 6334.1 ha in 2018. The Ningxiang County located in central China had the largest increase in impervious land area from 2021.4 ha in 1993 to 8195.5 ha in 2018, with an annual area growth of 246.96 ha. The Yulong Naxi Autonomous County located in the southwest China increased the least (Figure 2). From the annual area growth rate (AGR) perspective, the Buerjin County ranked first, up to 17.70%, and the second was the Fenghuang County, up to 6.49%, while the Ningxiang County ranked fourth with 5.76%. We also found that the AGR was the largest during the period from 2008 to 2013, compared with other periods. Nine counties had the largest annual area growth value and growth rate during this period.
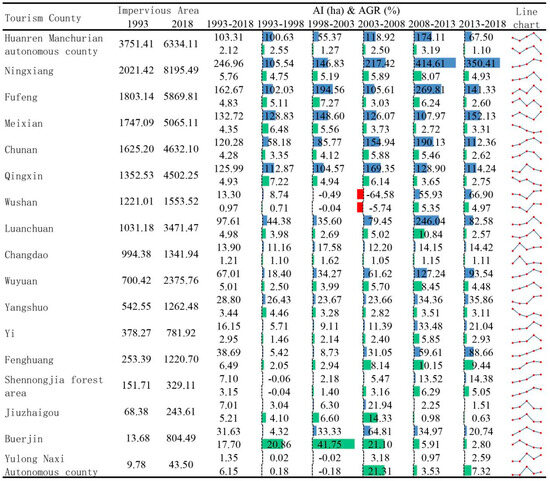
Figure 2.
Annual increase (AI) area and annual growth rate (AGR) for each county among five periods from 1993 to 2018. Blue blocks showed AI growth, green blocks showed AGR growth, and red blocks indicated decreases.
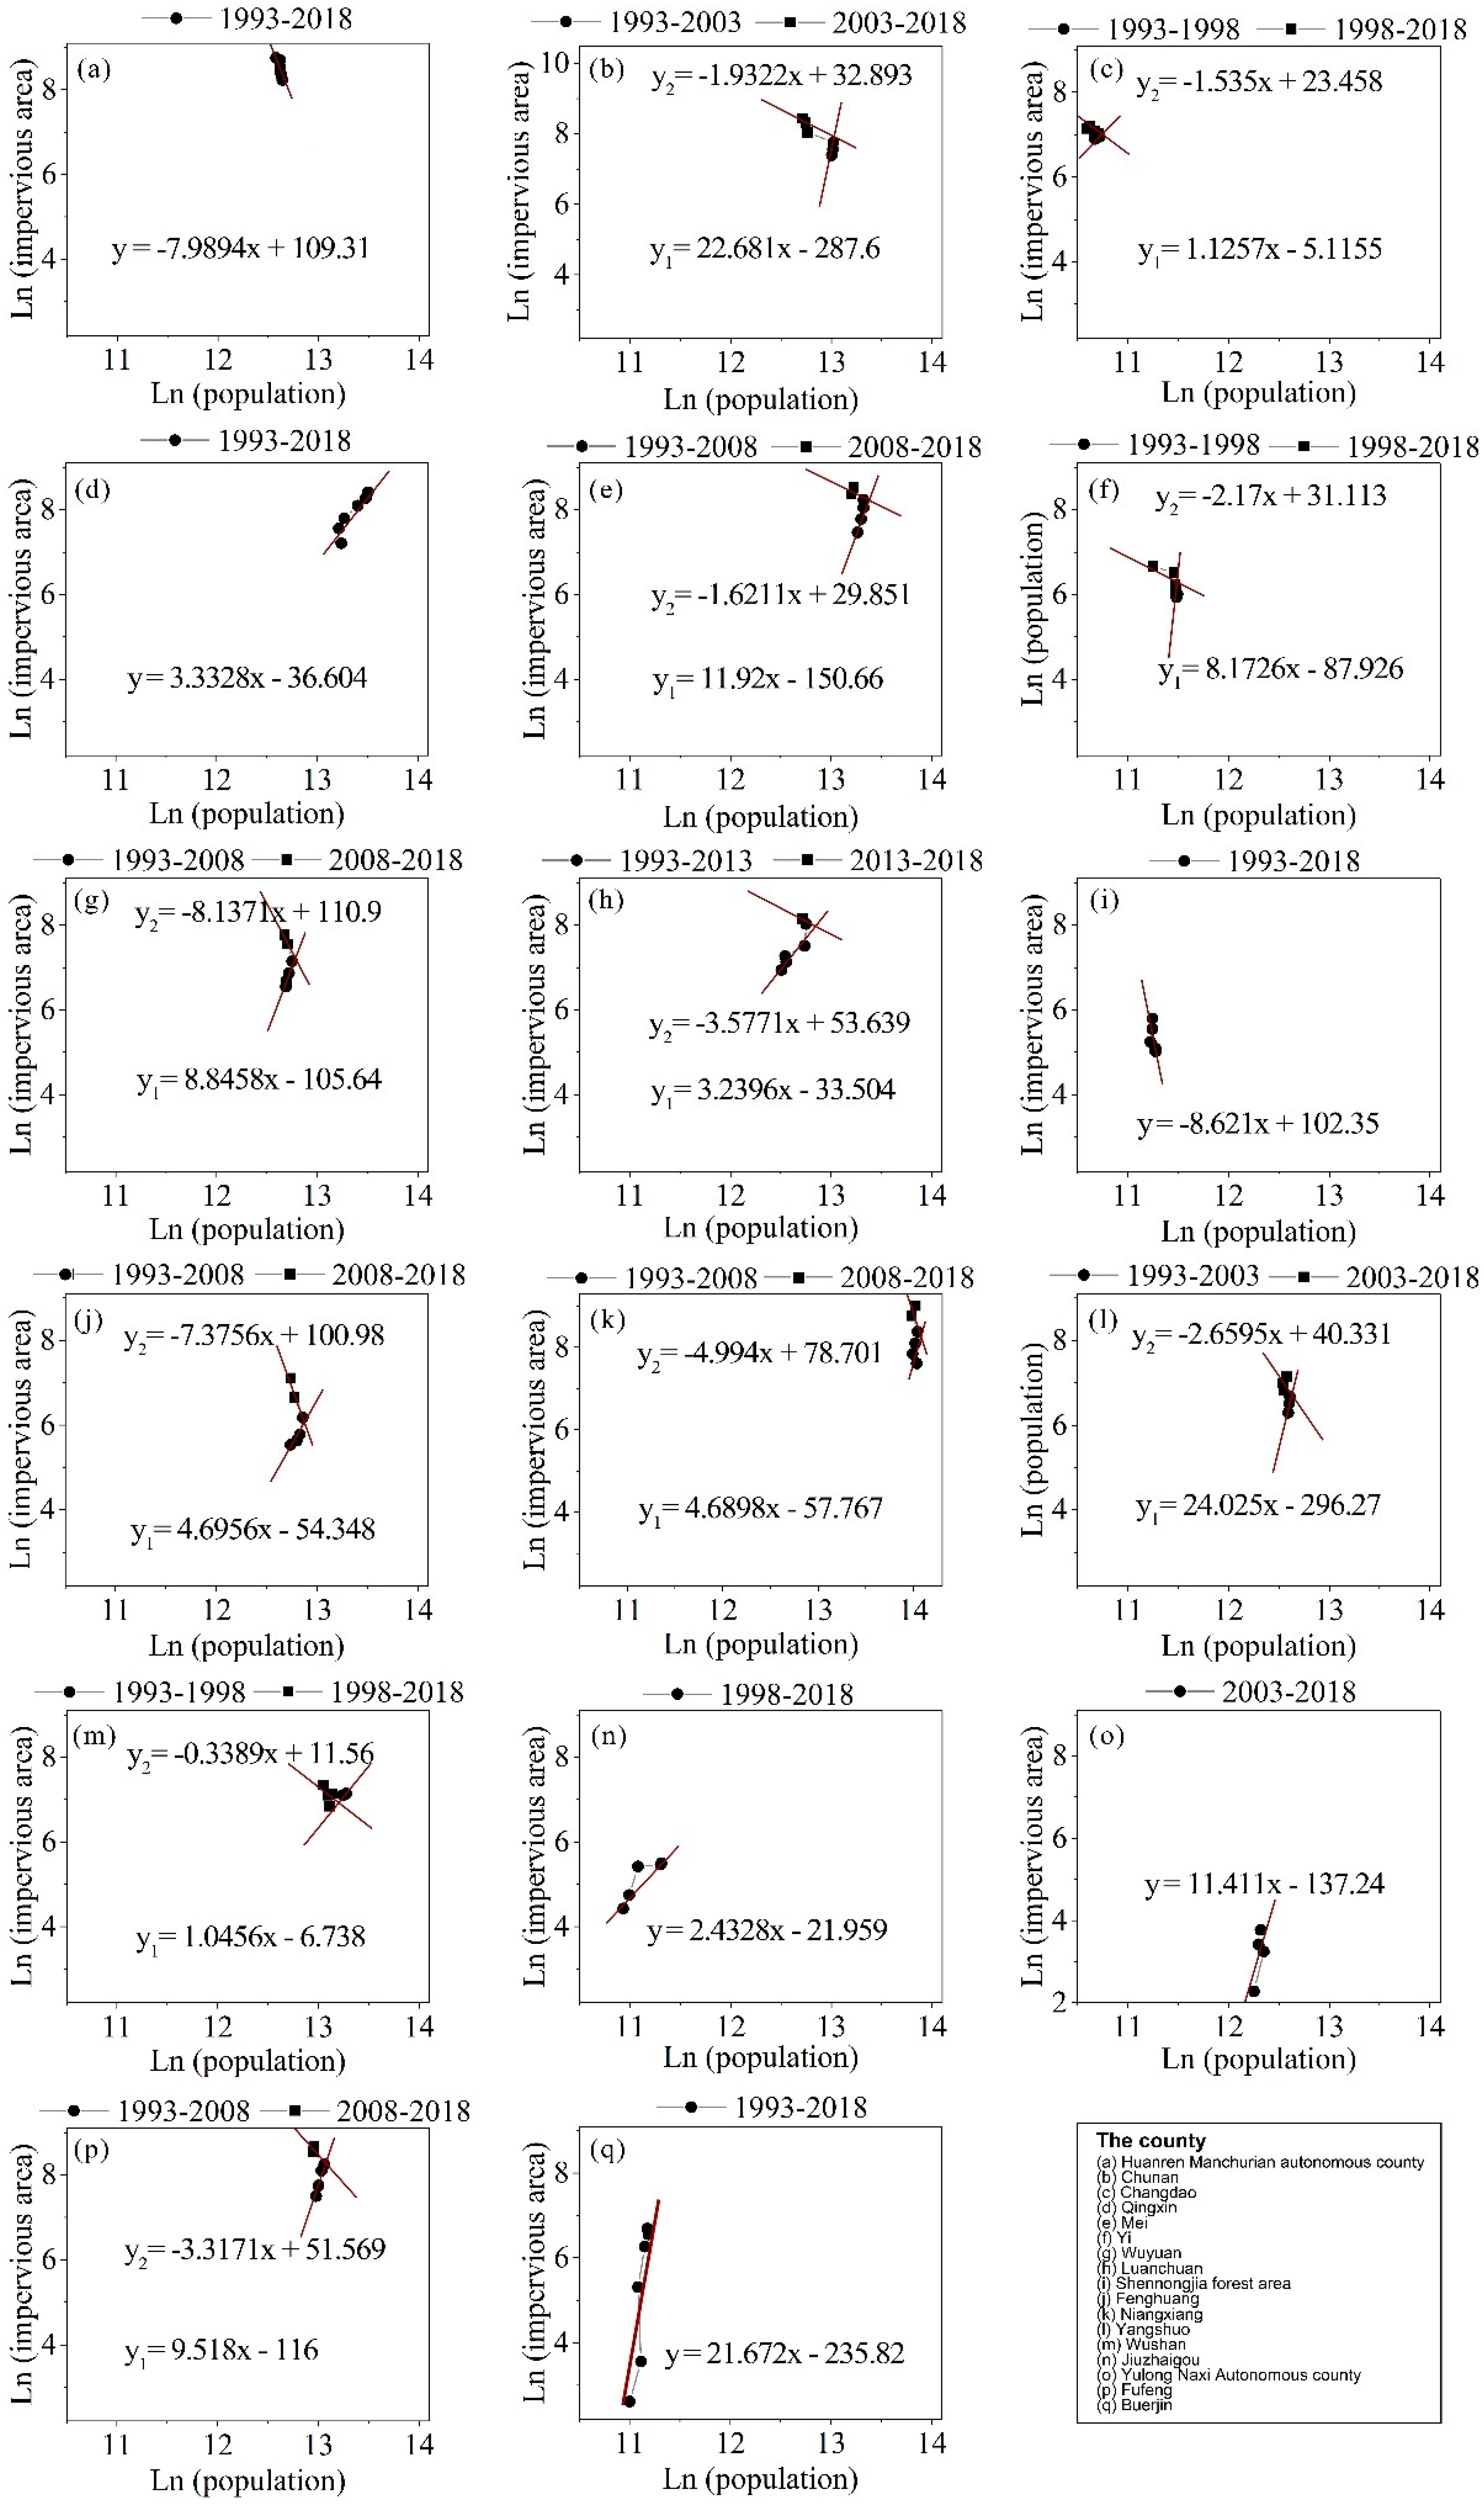
We further investigated the scaling relationship between impervious land expansion and resident population over time (Figure 3). There were three patterns. The first pattern was that the scaling exponent was negative (−7.99 in Huanren, Figure 3a; −8.62 in Shennongjia, Figure 3i), i.e., the resident population decreased, but the impervious land expanded. The second pattern was that the scaling exponent was positive first, and became negative in the late period, i.e., the resident population rose in the early stage and then flattened or decreased in the subsequent period, but the impervious land was continuously expanding. There were 11 counties in line with this trend, and the scaling exponents in the positive stage were all greater than 1.0. The last pattern was that the scaling exponent was positive across 1993 to 2018, i.e., the resident population increased, and the impervious land also expanded. A total of four counties conformed to this trend, with the scaling exponent being far greater than 1.0 (averaged at 9.71). All these three patterns indicated that the impervious land expanded much faster than the population growth. Most of the counties (13/17) were experiencing a shrinking population.
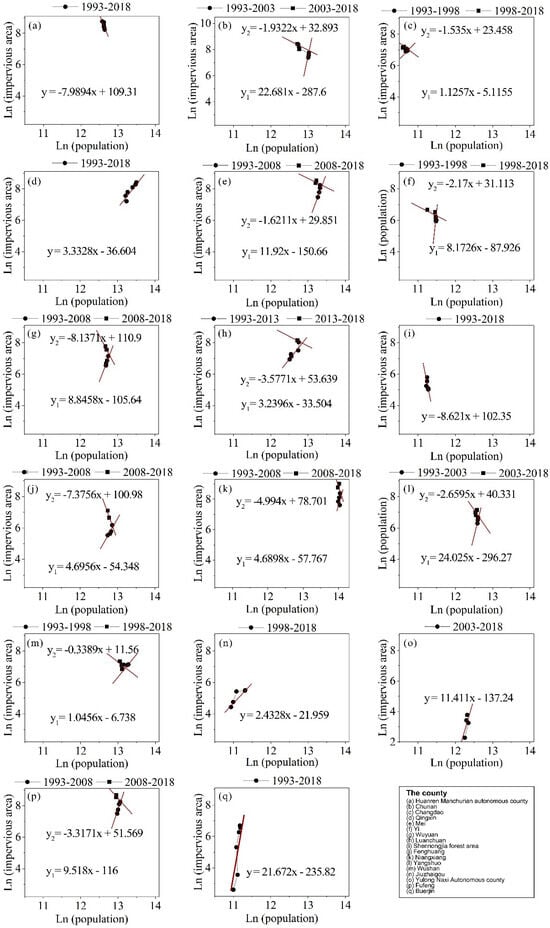
Figure 3.
The allometric relationship between resident population vs. impervious area in 17 counties during 1993–2018.
3.2. How and Where the Townships’ Impervious Land Expanded
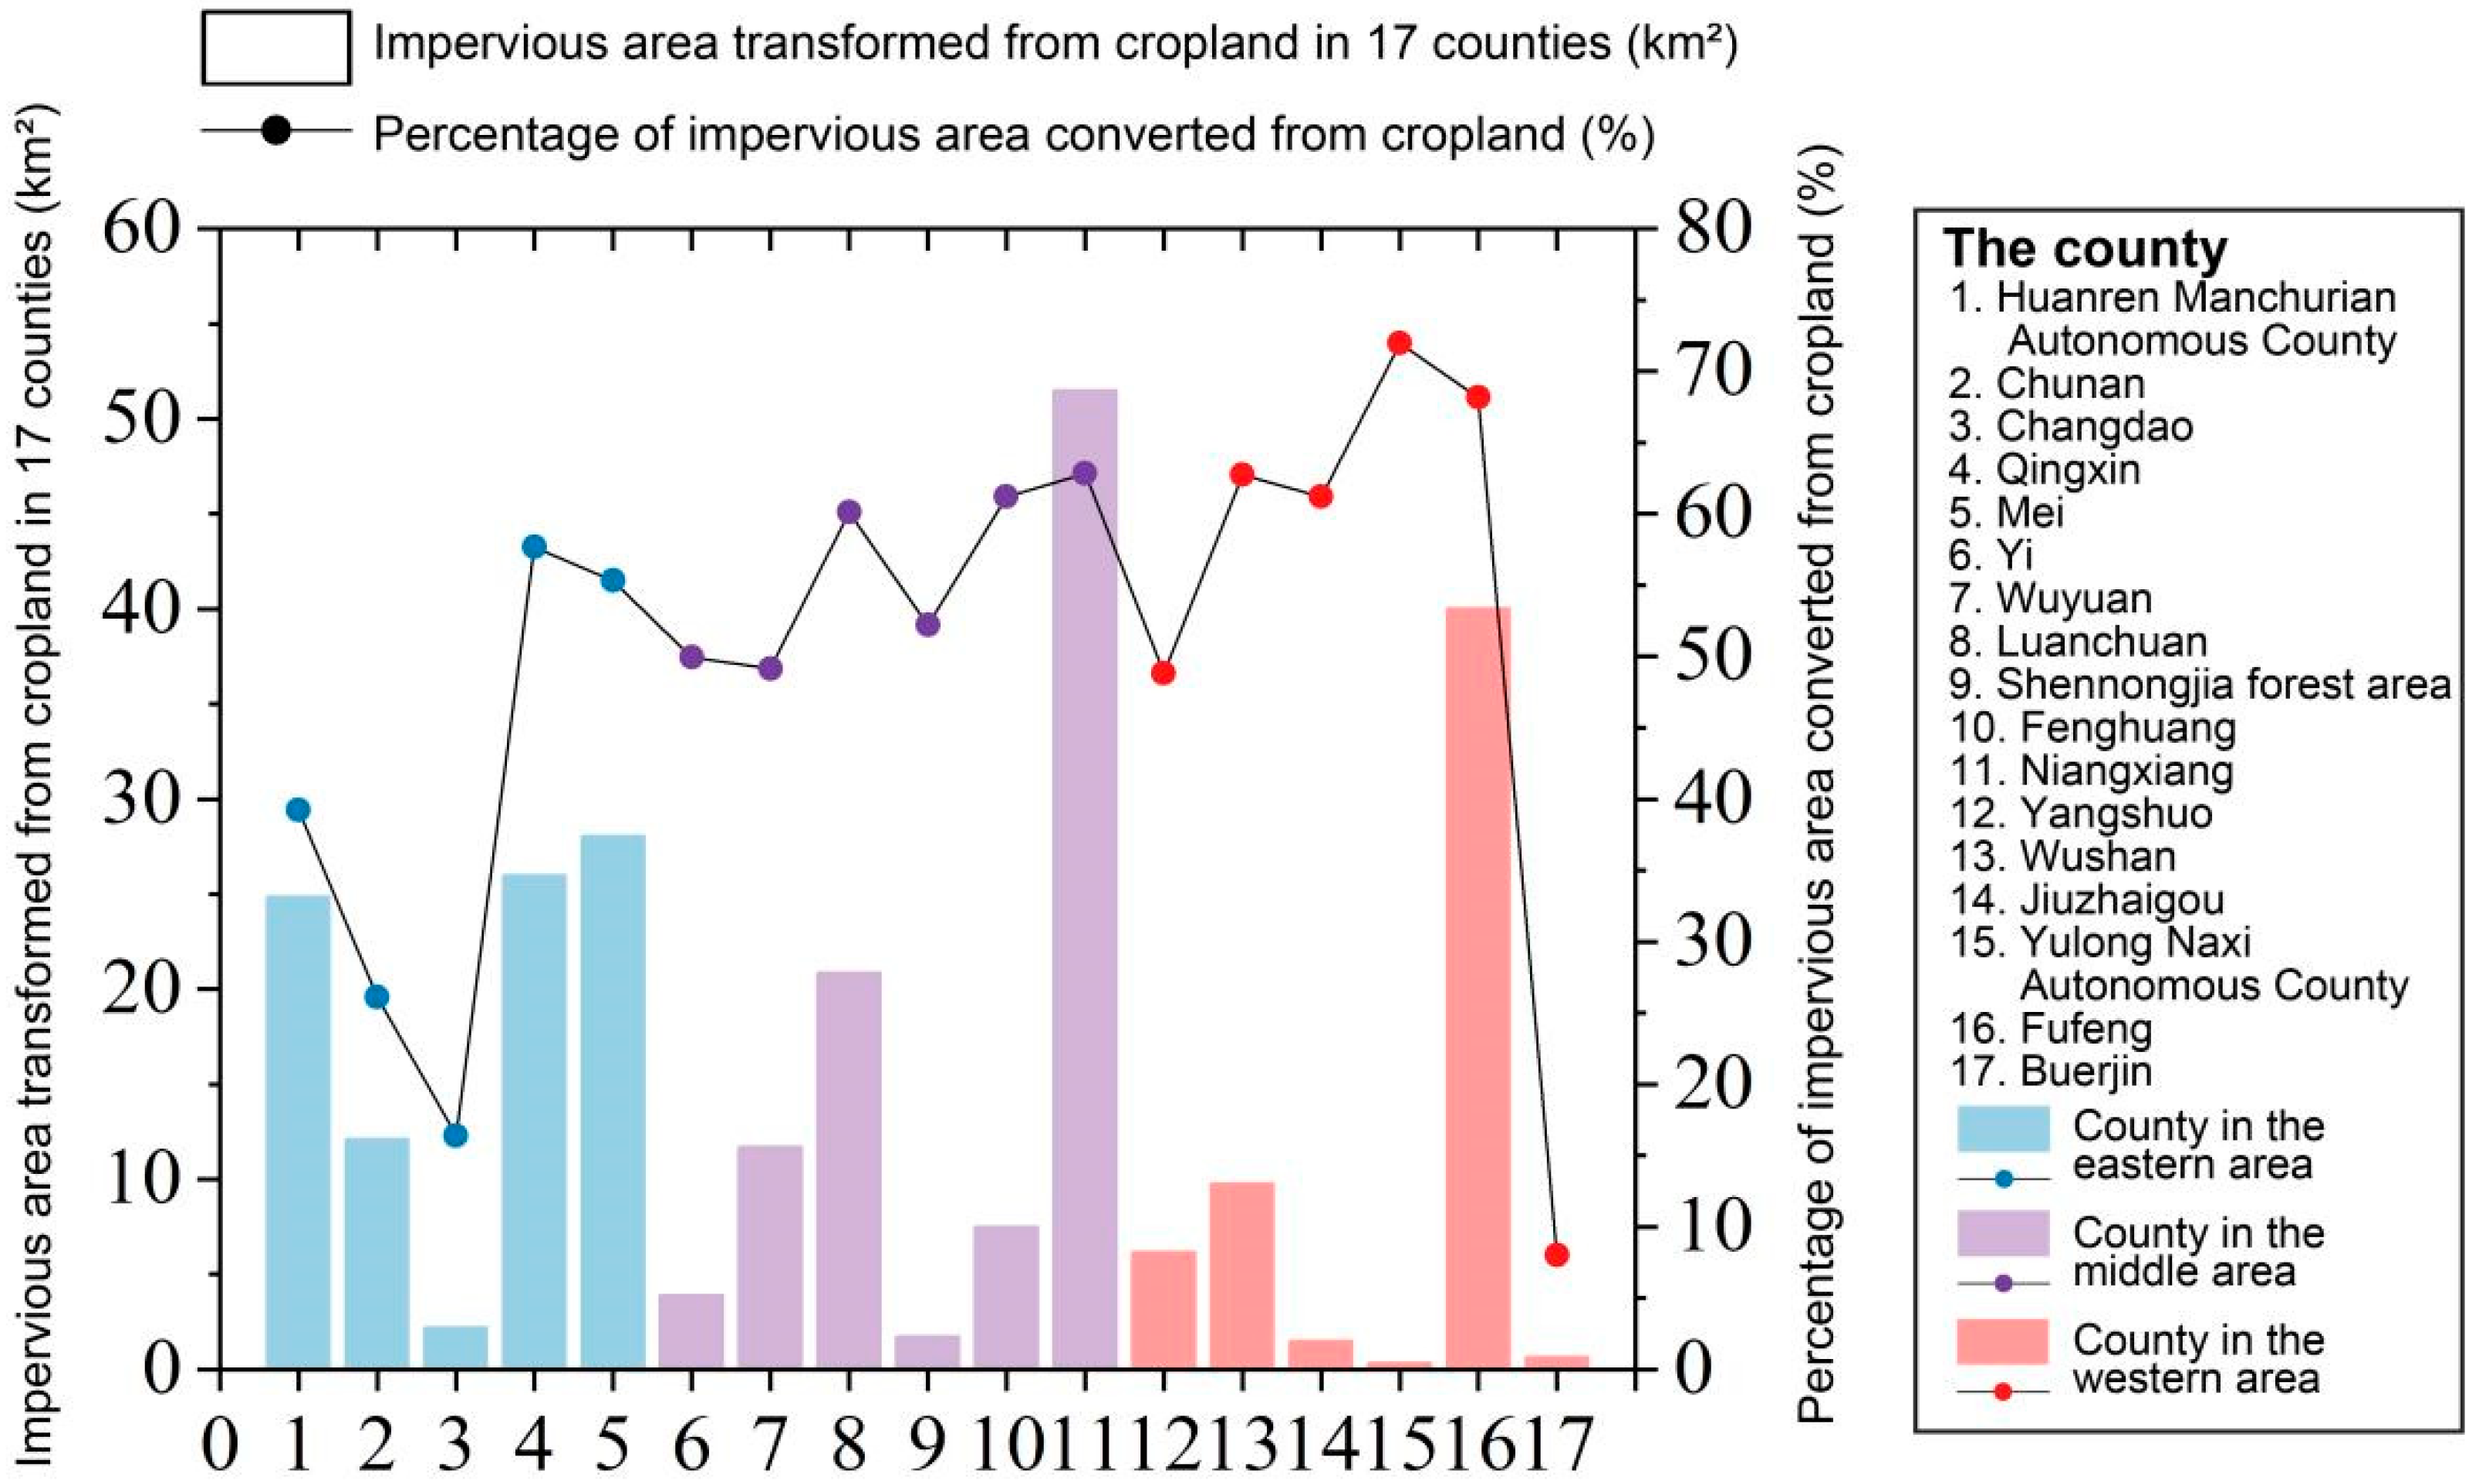
We also found that the impervious surface areas of 15 counties were mainly converted from cropland (Figure 4). The proportion converted from cropland in the 17 counties averaged at 50.1%. And the second-largest proportion was from the forest, with an averaged value of 8.9%. The conversion from a forest was especially largest for the eastern China counties, such as Chunan, Wuyuan and Fenghuang, at 34.1%, 23.0% and 16.7%, respectively. For Buerjin, which is located in northwestern China, the impervious land was converted mainly from grassland, and the proportion was 47.2%.
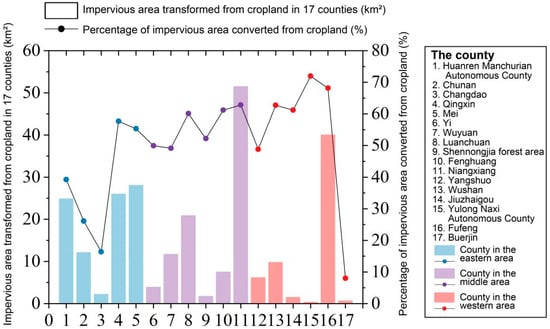
Figure 4.
Impervious area and the proportion converted from cropland in 17 counties.
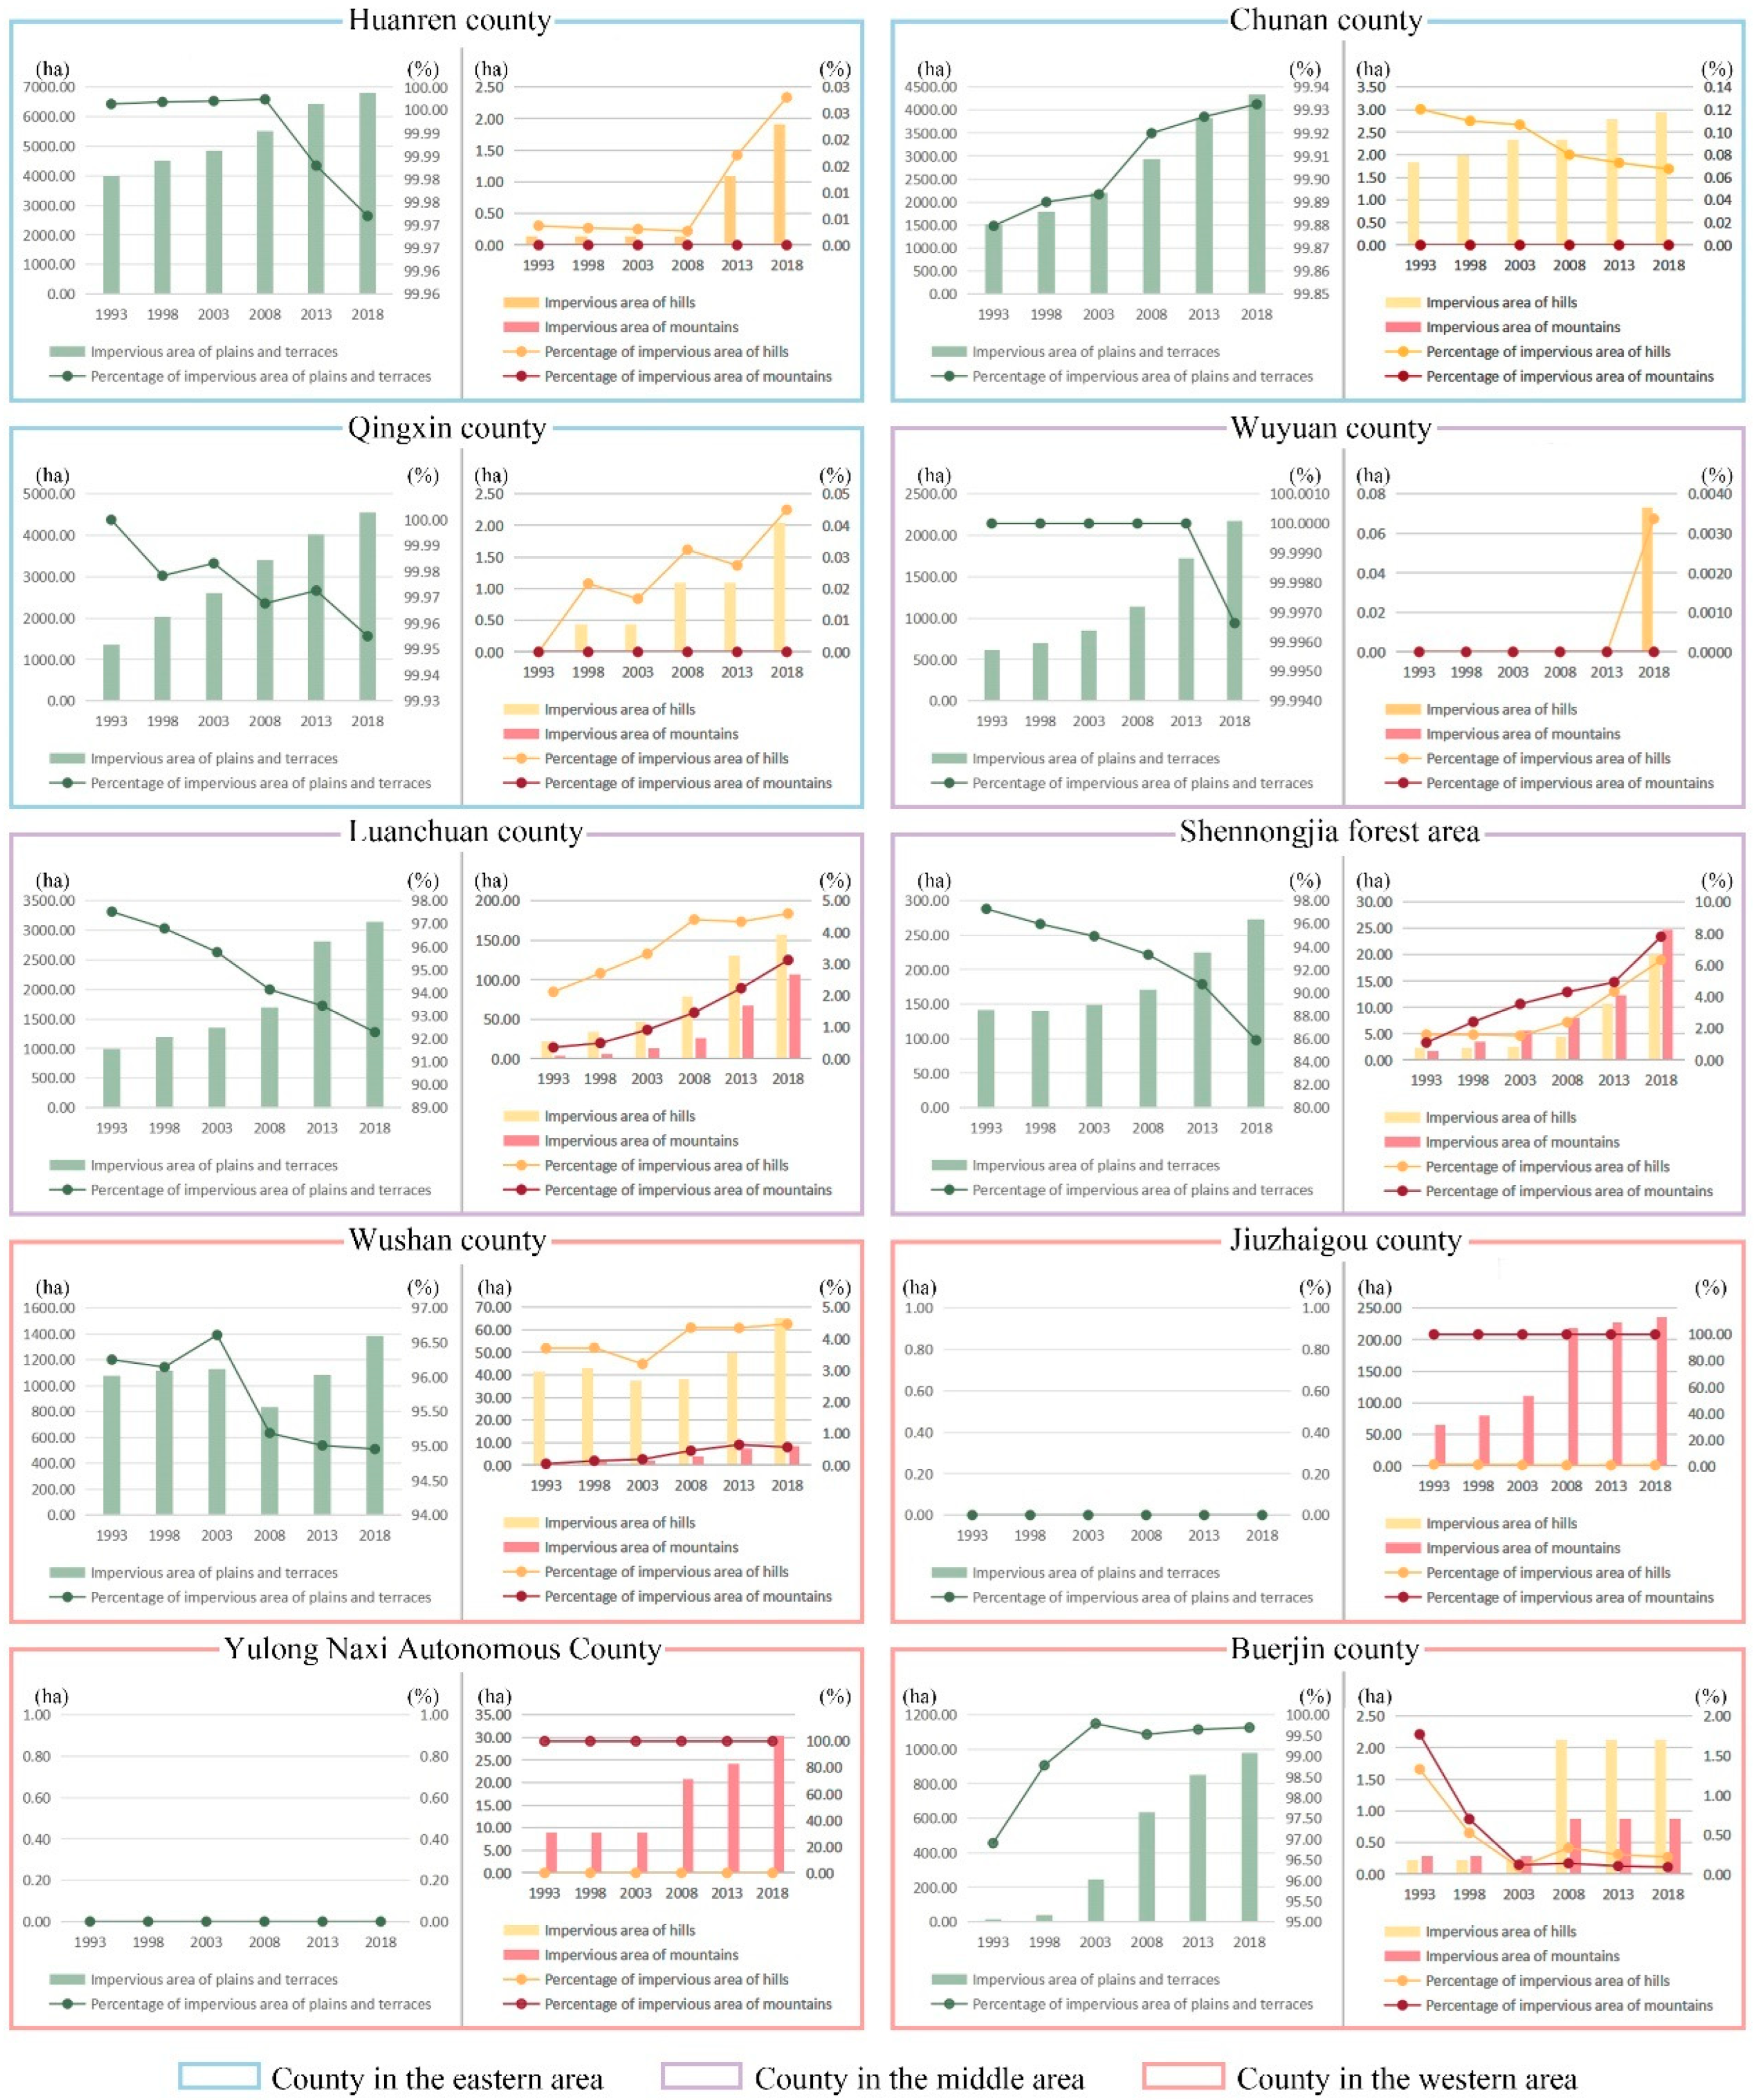
For the eastern China counties, impervious expansion mainly happened in the lowlands. Notably, in west China, the expansion tended to happen in the highlands. Some counties (Jiuzhaigou and Yulong) had 100% of their expansion in the highlands due to their geolocation. For the eight counties distributed in eastern, middle, and western China, impervious expansion in the highlands increased over time, although most expansion still occurred in the lowlands (Figure 5). For example, in the Luanchan county, the expansion in the highlands increased from 101.4 ha in 1993 to 491.0 ha in 2018, contributing to the increase in impervious area expansion from 9.9% to 14.2%, among which, the impervious expansion in hills increased from 81.9 ha (8.0%) to 287.9 ha (8.3%), while that in mountains grew from 19.5 ha (1.9%) to 203.1 ha (5.9%) during 1993–2018. For the Chunan county and Buerjin County, the expansion that happened in the highlands increased but the ratio was still decreasing, since the most expansion, by area and ratio, happened in the lowlands.
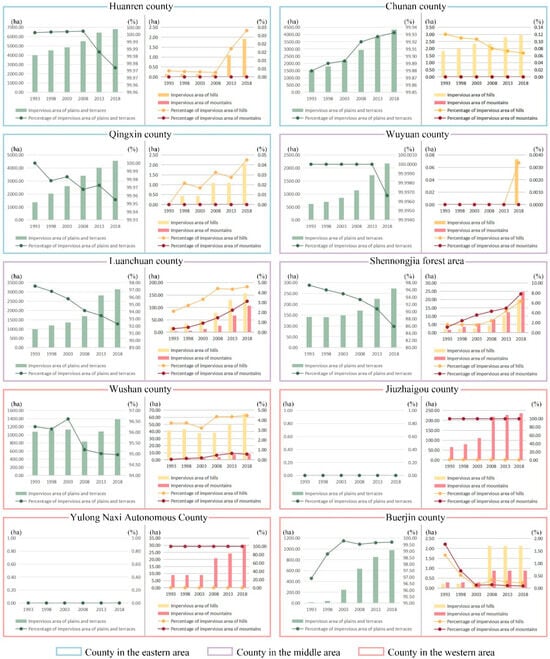
Figure 5.
Dynamics of spatial expansion in highland and lowland areas in 10 counties during 1993–2018.
3.3. Three Types of Impervious Land Expansion in Townships
In terms of urban spatial expansion patterns, the counties located in the central and western regions mostly had a single-core expansion, while the counties located in the eastern regions had both single-core and dual-core expansion patterns.
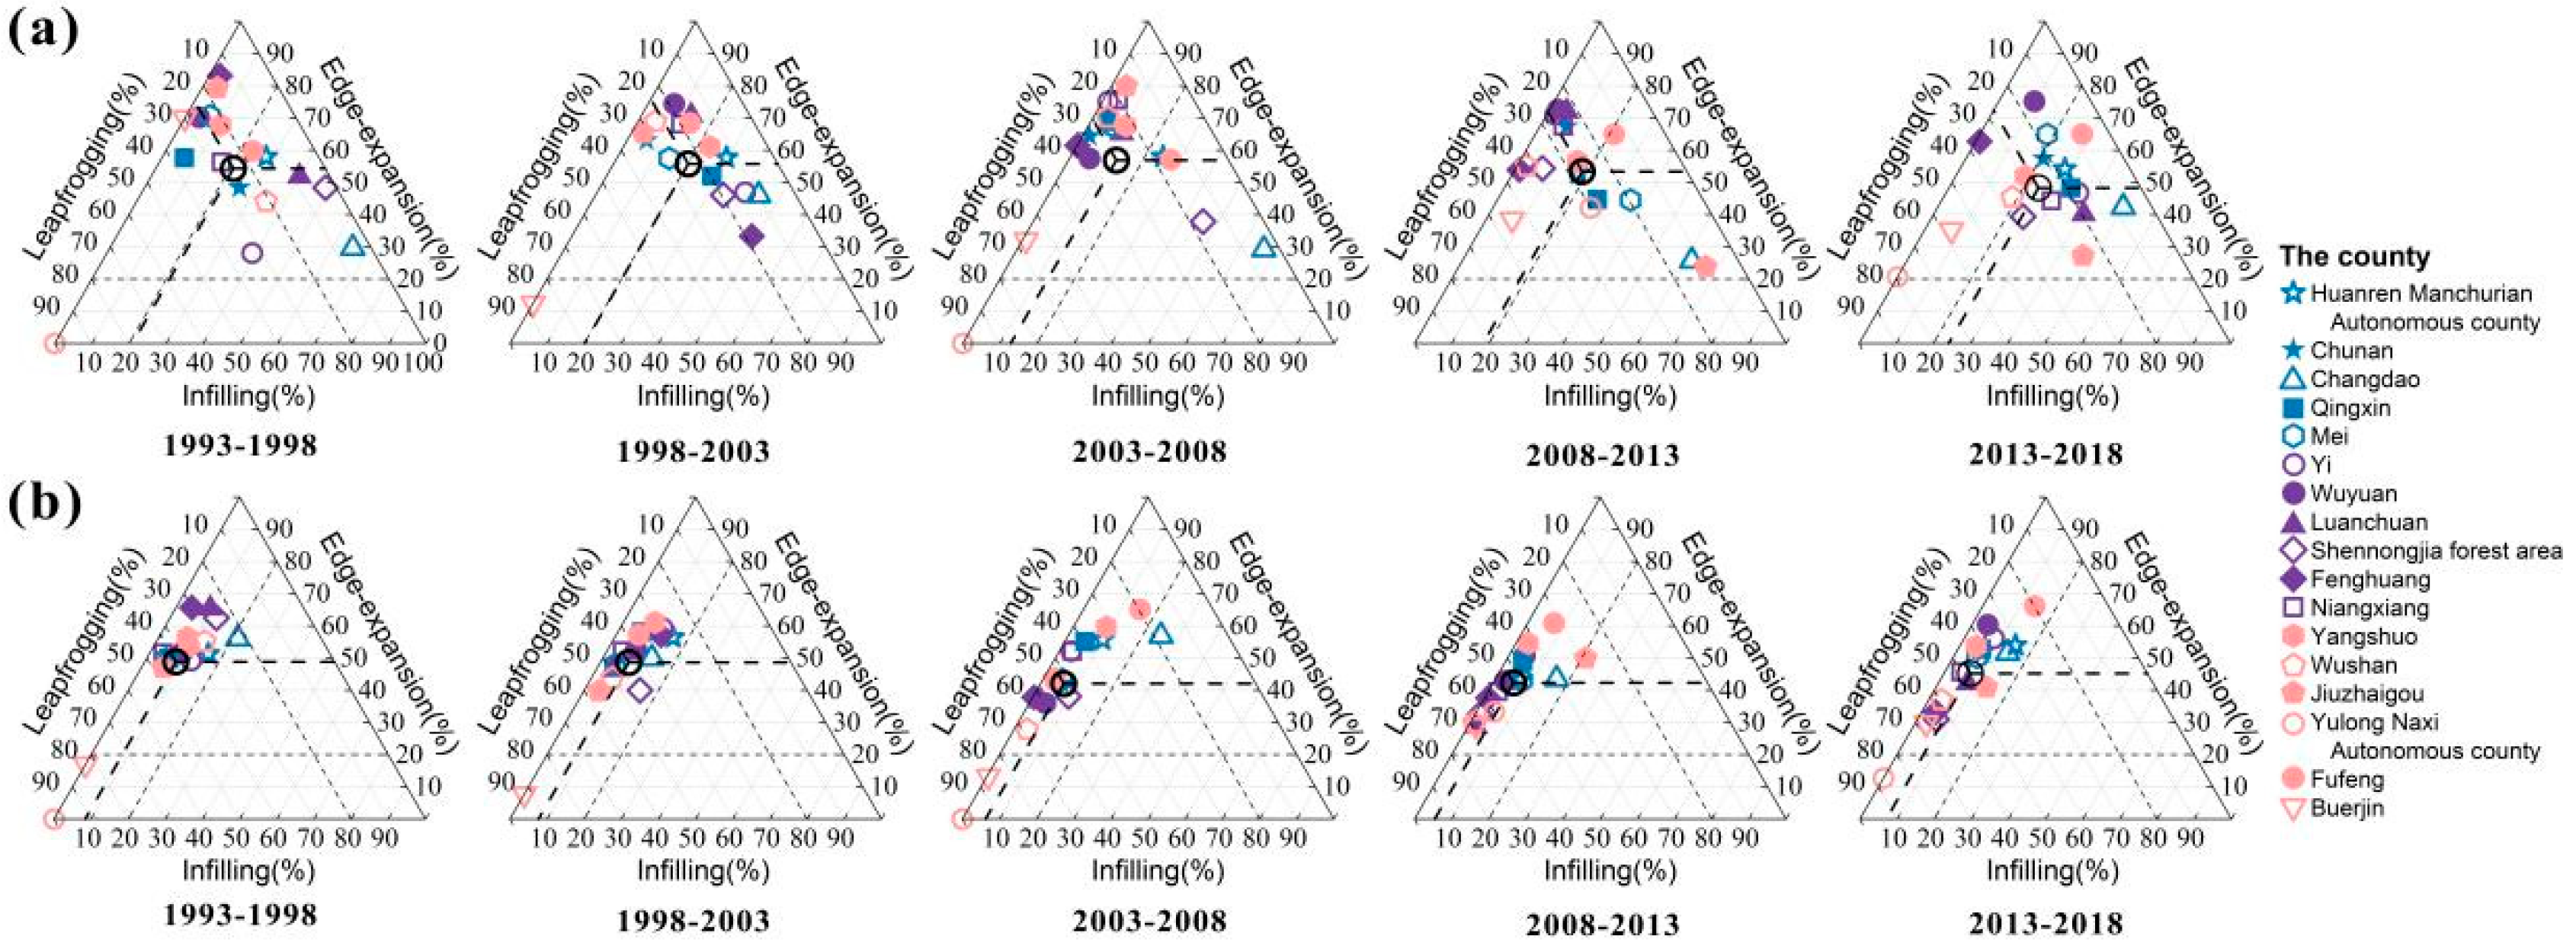
The expansion types in the 17 counties located in different regions were mainly dominated by infilling and edge-expansion during the early stage, after which leapfrogging occurred, and infilling occurred again in recent years (Figure 6). Specifically, the composition of infilling and edge-expansion with different percentages were the dominant growth type in all townships during 1993–1998. After 1998, the number of counties that transformed from infilling to leapfrogging increased significantly. Also, some counties located in the western region undertook significantly more leapfrogging than that in the eastern and central regions.
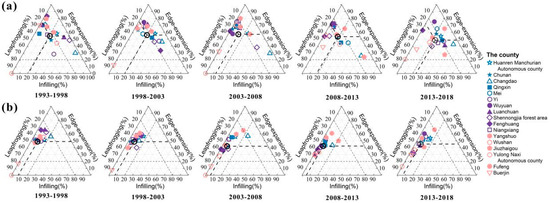
Figure 6.
Land expansion types (i.e., infilling, edge-expansion, and leapfrogging) calculated from (a) the impervious area and (b) the numbers of patches in 17 counties.
Based on the calculation from the number of patches (Figure 6b), from 2008 to 2018, the average percentage of leapfrogging type decreased from 52.23% to 47.65%, while the average percentage of infilling type increased from 5.44% to 7.10%, indicating the intensive land development in these townships.
3.4. Relationship Between Tourist Attraction Accessibility and Township Impervious Land Expansion
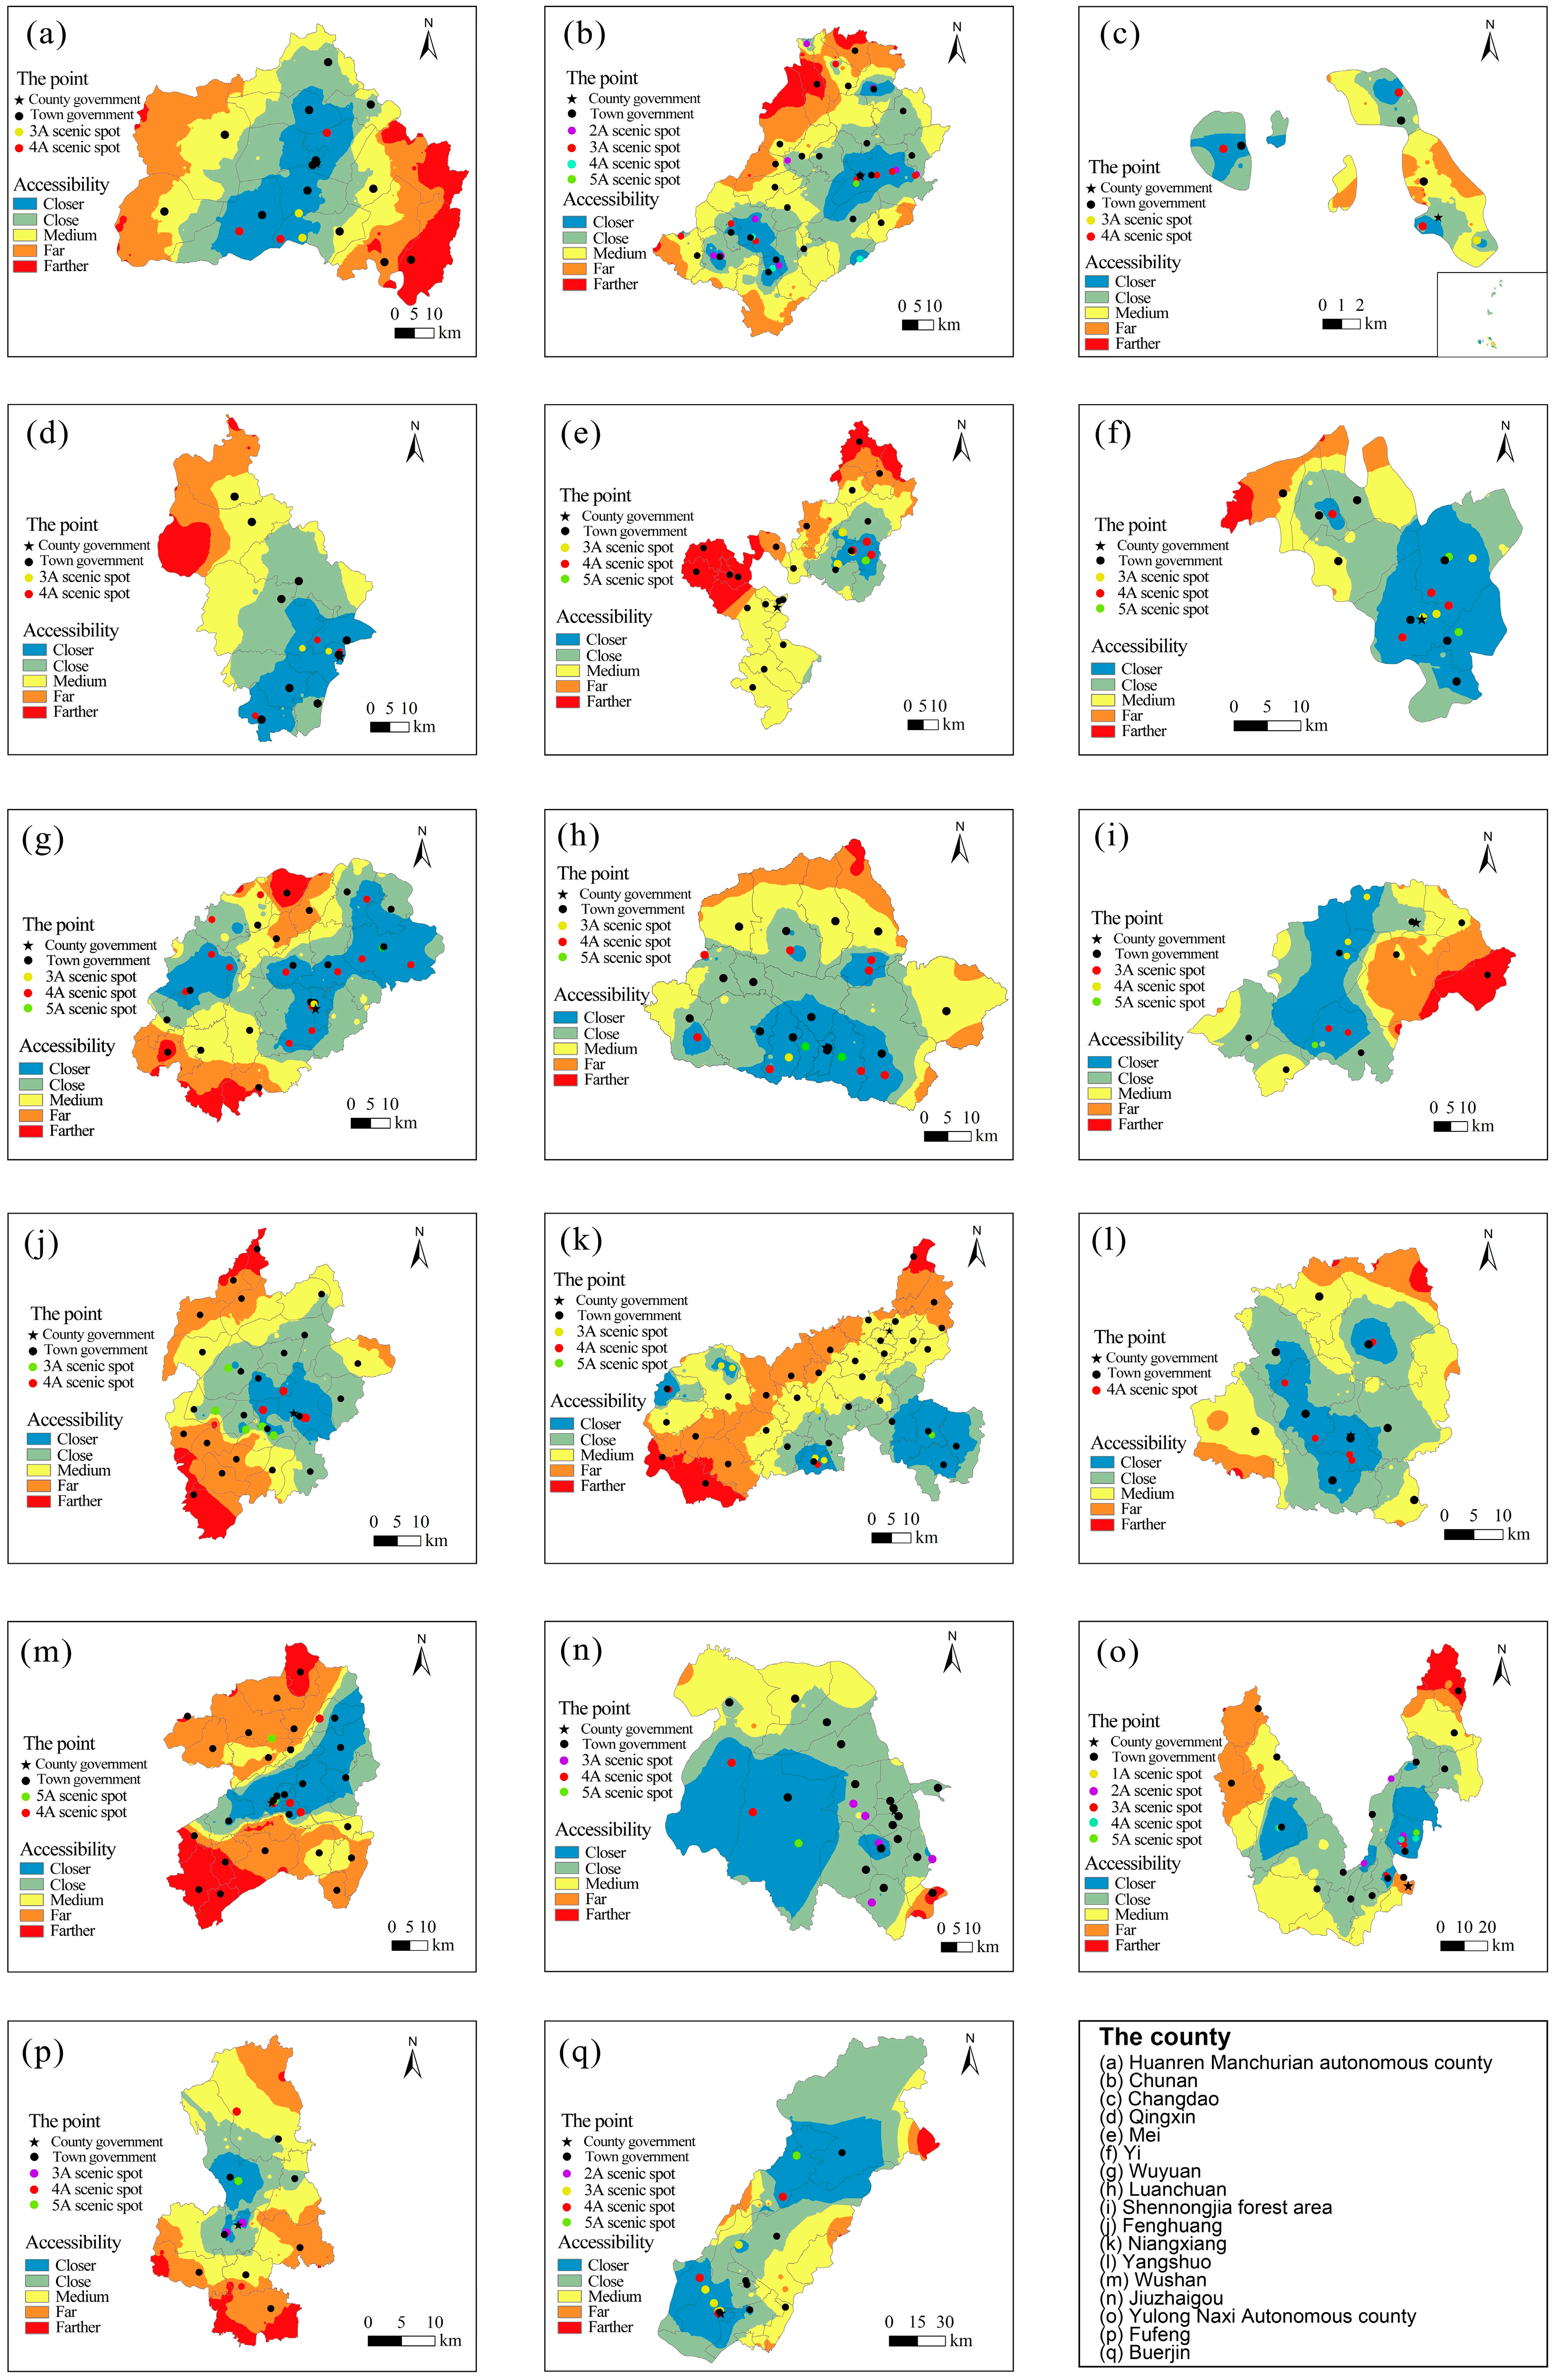
The accessibility levels of 17 counties located in different regions showed a trend of decreasing from the inside to the outside (Figure 7), with tourist attractions as the core. Almost half of the residents in the county had access to scenic spots in the “closer” and “close” ranges. For counties where the attractions were far apart, higher-level scenic spots also had higher accessibility.

Figure 7.
Accessibility analysis of tourist attractions in 17 counties.
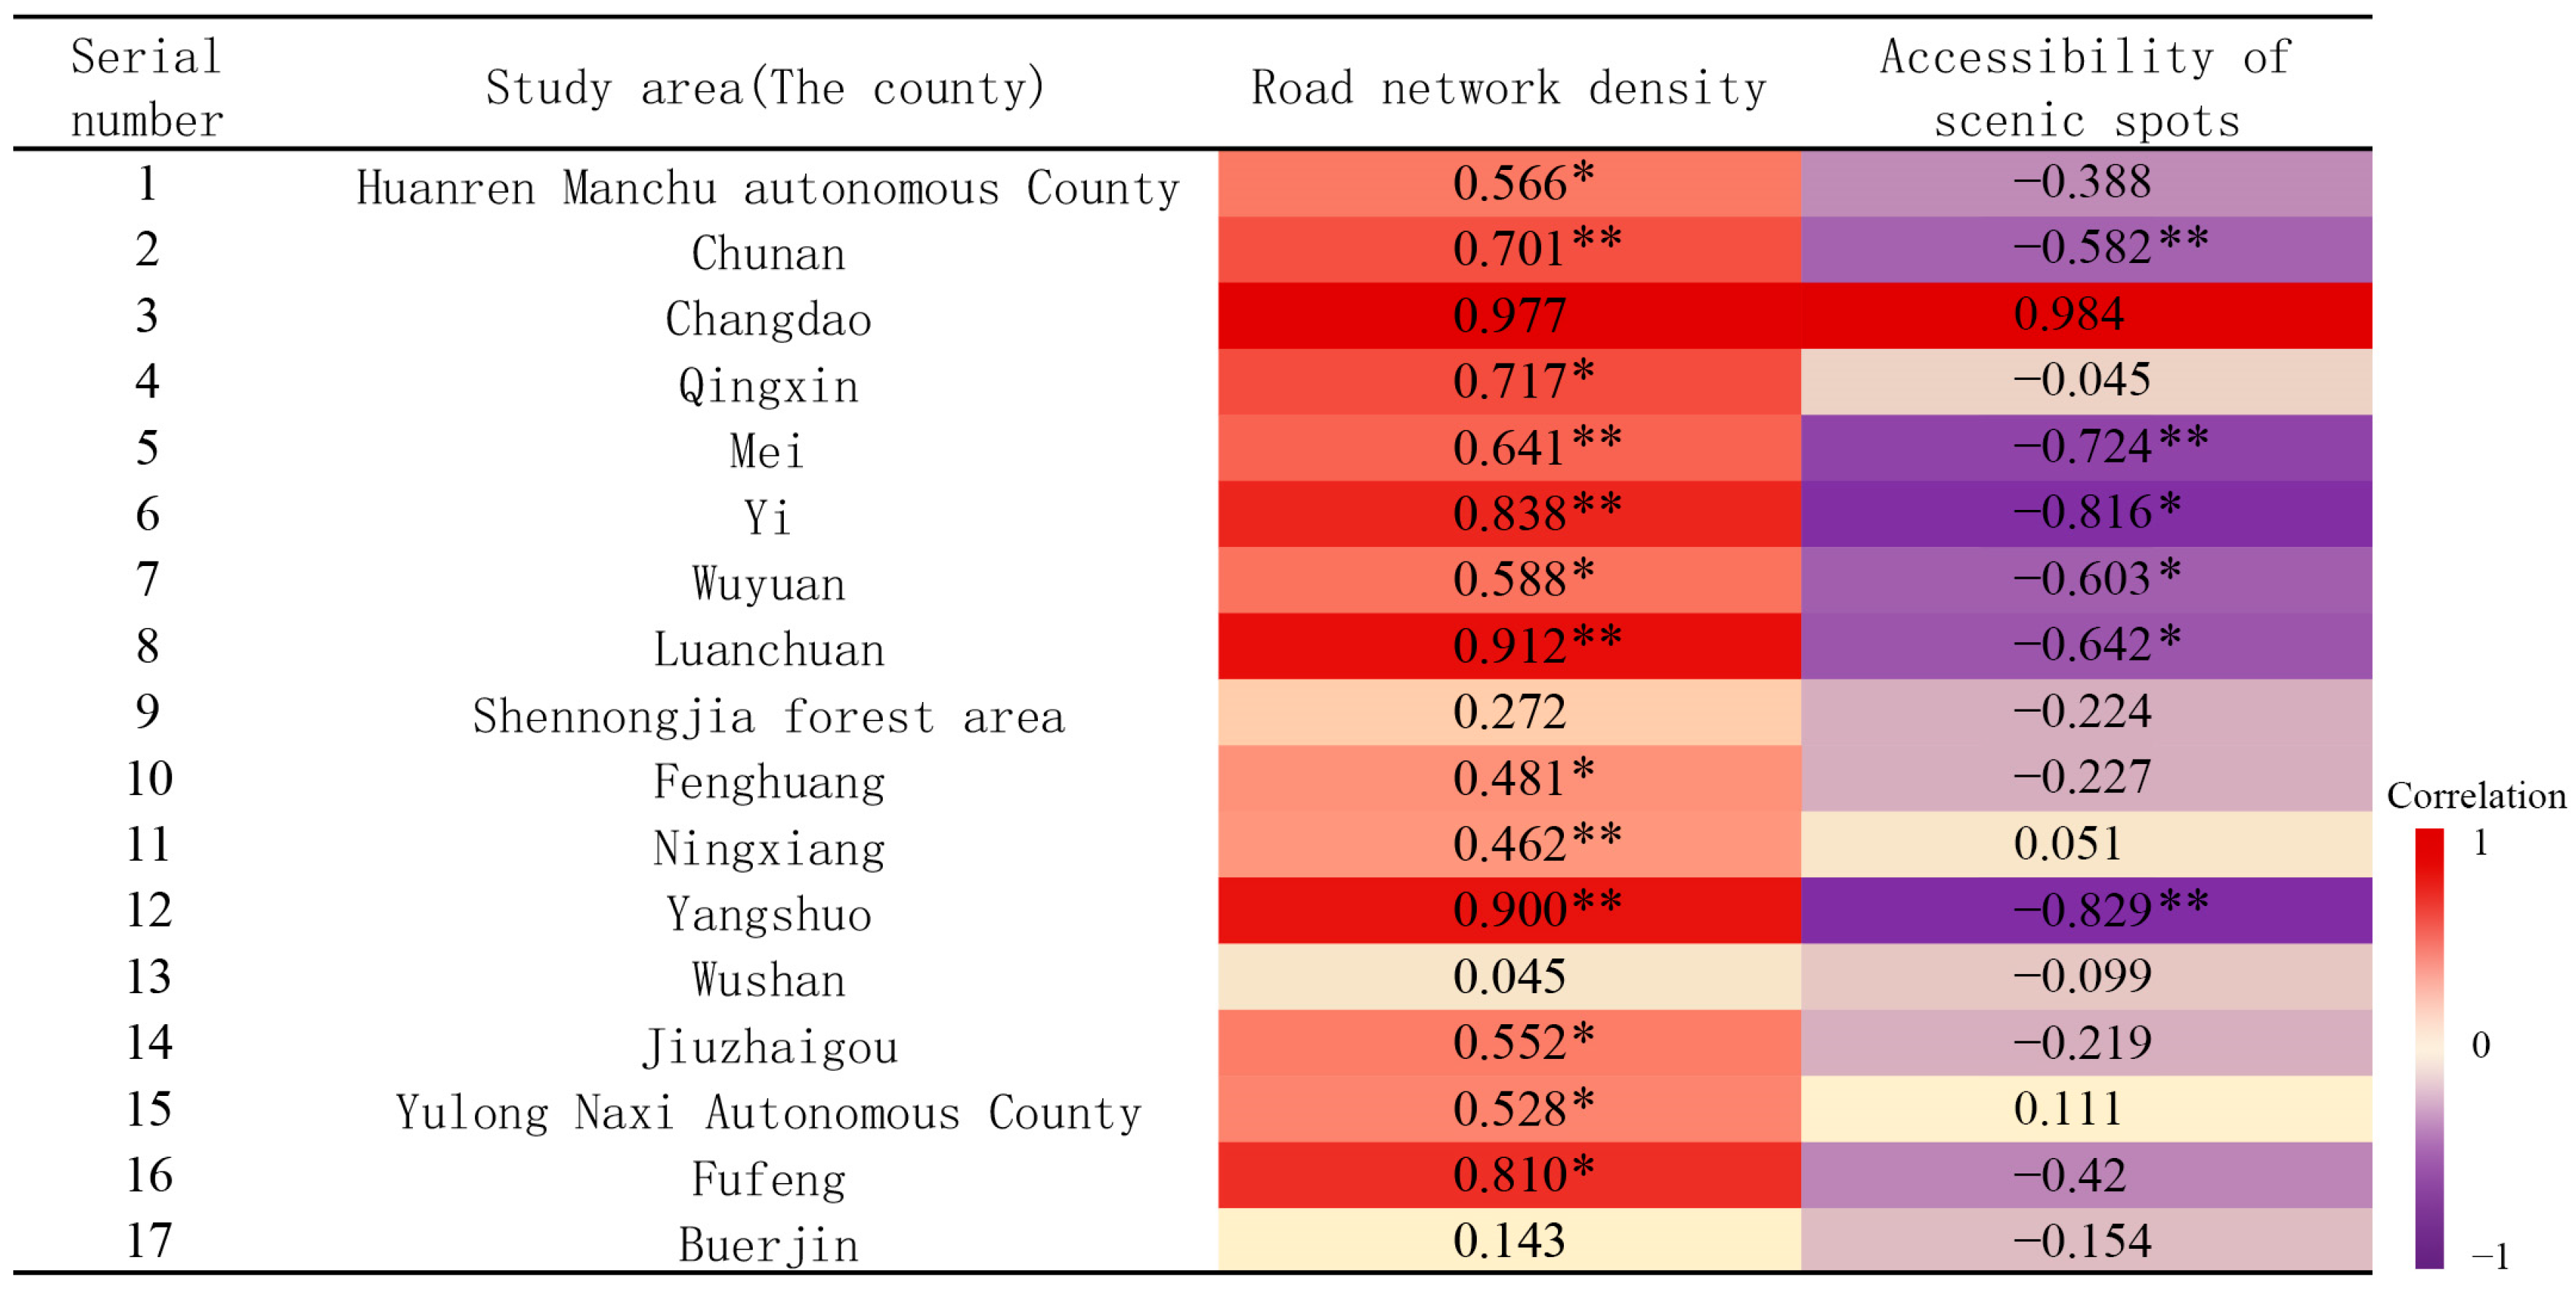
The road network density of 14 counties showed a significant positive correlation with the annual area growth. The accessibility of scenic spots in six counties showed a negative correlation with the annual area growth (p < 0.05), that is, the area closer to the scenic spots had a greater annual area growth value. In the other counties, the accessibility to tourist attractions did not show a significant correlation with urban space expansion (Figure 8).
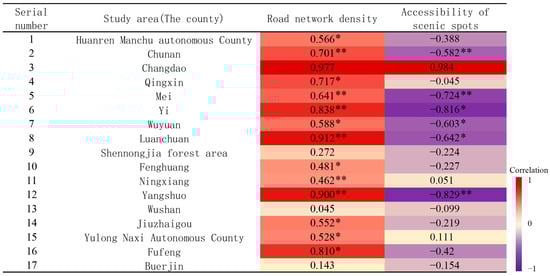
Figure 8.
Correlation coefficients between annual area growth rate and road network density or accessibility to scenic spots in 17 counties. Note: * indicates significance: * p < 0.05, and ** p < 0.01.
4. Discussion
4.1. Why the Townships’ Impervious Land Expanded
The scaling exponent between the resident population and impervious land showed three patterns: negative, first positive and then negative, and positive. The negative exponent (13 of 17 counties) indicates land expansion with a shrinking population. Even for all the positive values, they averaged at 9.3. This meant that the impervious land expanded much faster than the resident population growth. The results were comparable with that found by Ning et al. (2023) [30]; with nearly 300 prefectural-level cities in China as the study objects, their results pointed out that the urban expansion scaled super-linearly with the population growth in individual cities over the past three decades with average scaling exponents of 9.94. These values were much higher than their cross-sectional counterpart, which was usually smaller than 1.0 [31,36]. It suggested that there were diseconomies of scale for the impervious land expansion. And the waste of land resources was more severe for these individual counties. Over the past few decades, the population growth rate of global cities was, on average, twice that of the global population growth rate [37]. In many regions, land expansion exhibited the characteristics of extensive development, with low land use efficiency and even the emergence of a significant amount of idle or underutilized land resources. This phenomenon was not limited to China but was a widespread issue globally. For instance, in some developing countries, disorderly expansion in the peripheral areas of towns led to the reduction in arable land and ecological degradation [38]. Meanwhile, in some developed countries, urban sprawl triggered a series of problems such as traffic congestion and resource waste [39]. Therefore, all regions should pay close attention to this level of expansion. By adopting compact planning, policy guidance, and technological innovation, the utilization of land resources can be optimized, thereby enhancing the sustainable development of urbanization.
Why did these towns with declining populations also experience land expansion? At the macro level, national policies provided strong support for village and town construction, with increased investment in rural development from the central government to local authorities. Public service spaces and facilities were continuously enhanced, leading to an increase in per capita usage area, which reflected the improvement in people’s quality of life. Additionally, the diversification of rural economic activities, such as the gradual development of tourism, logistics, e-commerce, and other businesses, required the corresponding spatial support, which contributed to the expansion of construction land [40,41,42]. At the micro level, many villages lacked scientific planning, leading to scattered land use and low land use efficiency. Farmers’ perceptions also contributed to uneconomical land expansion. The local population desired spacious and abundant living spaces, while the floating population resulted in the dual occupation of both rural and urban construction land [43]. Although China had implemented the “one household, one homestead” policy, the increasing number of households due to adult children separating from their families led to a growing number of households in villages. Moreover, farmers were still able to purchase homes in urban areas [44]. The relevant household registration policies also indicated that farmers who had rural homesteads could continue to use the housing on their rural homesteads even after transferring their household registration to urban areas, until the homestead disappeared [45]. Additionally, influenced by the traditional concept of “returning to one’s roots”, many migrant workers expressed a desire to return to their hometowns for retirement, prompting them to retain and rebuild their rural homes at an appropriate time. The combined effects of these factors led to an increase in abandoned rural houses and the hollowing out of villages [12].
Impervious land sprawl also encroached on large amounts of cropland [46,47,48,49]. We found that 16.40% to 71.96% of impervious expansion was converted from cropland in 15 counties. The results were in consistence with existing studies that most of the developed land was converted from cropland [50,51]. Most of the arable land was located close to rural settlements and then, edge pattern expansion took place [52]. Chen et al. (2020) suggested that future impervious land expansion would occur primarily on croplands [53]. This was consistent with the phenomenon observed in many parts of the world where the expansion of construction land was accompanied by the occupation of cropland [2,54,55]. Therefore, balancing impervious expansion with cropland preservation was a huge challenge for many countries [56]. Fortunately, the relationship between them was not irreconcilable. For example, Pakistan reclaimed other types of land to compensate for the encroached farmland, although most of the increased cropland occurred on low-quality soil [57]. Japan addressed the issue of rural population decline and village shrinkage through the strategy of merging towns and villages [58]. China implemented the “Increasing vs. Decreasing: The Balance of Urban-Rural Built-up Land” policy to alleviate the contradictions between land expansion and the protection of the basic cropland redline [59,60]. These measures would alleviate, to some extent, the encroachment on the large amounts of cropland.
We also found that the impervious land expansion in the highlands increased over time. Up to 2018, the percentage of expansion in the highlands had increased to varying degrees within some counties (except for counties with no highlands); this meant that the venue of human activities was not limited to lowlands, which was consistent with the study by Yang et al. (2022) [29]. This may have been due to the complex terrain of some counties, which had limited lowland for expansion, coupled with the fact that much of the tourism industry relied on natural conditions in hills and mountains. For example, the development of ski tourism, such as the Funiu Mountain Ski Resort, is a case in point. Similar situations were observed in the United States, Switzerland, France, Norway, and other regions [61,62,63]. Due to the fact that highland areas often contained abundant mineral resources, mineral exploration and mining activities were highly active in these regions. Some factories with significant environmental impacts were also located in highland areas to reduce the pollution risks to densely populated regions. At the same time, the terrain and climatic conditions of the highlands provided advantages for certain industrial activities. Of course, we must also recognize that impervious expansion occurring in the highlands might led to ecological land loss and the fragmentation of biological habitats [29,64]. More on its ecological influence needs to be further evaluated. In order to prevent land abuse in the process of expansion in some counties, land planning should be carried out in strict accordance with the “Redline of Arable line” (RAL) and “Ecological Redline Policy” (EPR).
4.2. Township Land Expansion Patterns
In cities, urban expansion was initially dominated by leapfrogging, then became predominantly edge-expansion [22,65,66]. Our study showed that the expansion types in 17 counties were mainly dominated by infilling and edge-expansion during the early stage, after which leapfrogging occurred, and infilling increased to different extents in recent years. Leapfrogging expansion can lead to a reduction in arable land and also the increase in fragmentation for ecosystem supports [67,68]. Infilling expansion has the potential to improve land use efficiency and increase population density [69]. The patterns of urban expansion differed between the Northern and Southern Hemispheres, which were related to land use efficiency and urban density. Variations in economic development levels, population growth rates, geographical environmental factors, and historical and cultural backgrounds could all lead to diverse pathways and forms of land expansion. In the process of development, it is essential to enhance our understanding of local conditions and leverage intelligent development tools to carry out more rational land planning and implement favorable policies.
4.3. Customized Township
In recent decades, the world’s cities have developed rapidly [70]. Most cities have experienced land sprawling growth [10]. But in recent years, land expansion has led to a collapse of internal functions. And some cities experienced a loss of population, stagnant growth, and even population decline [71]. Governments were faced with the question of “whether and how to grow”, such as smart city planning [72].
Compared with cities, townships might have some advantages in traffic flow, abundant natural resources, less environmental pollution, and local characteristics, etc., thus attracting diverse people to live in them [73]. Customized development may bring about opportunities for small townships. In the recent years, China has vigorously promoted rural revitalization, in which rural tourism played an important role [74]. Tourist township was one of the customized types for promoting rural revitalization, which was conducive for stimulating economic growth and promoting employment [74]. Taking the Luanchuan county as an example, the township developed quickly with its close accessibility to scenic spots. Xi et al. (2015) also indicated that the influence of townships is gradually increasing [75]. Therefore, townships should explore their potential of unique resources in depth and improve both their livelihood and attractiveness for sustainable development.
The transportation model for customized development gave priority to saving time costs. Transportation infrastructure was conducive for economic growth, such as the high-speed rail [35,76,77]. Our study also showed that transportation density had the strongest correlation with annual area growth rate. Therefore, we suggest that road density should be reasonably enhanced to form transportation networks, such as constructing high-speed railways. The government also needs to strengthen highway maintenance and safety management, and promote the integrated construction of supporting facilities, industrial parks, tourist attractions, and key tourist townships along the route.
Over time, the development of tourist townships has brought benefits as well as some problems, which were directly reflected in the holiday-cycled mobile population, disrupted tourism industry affected by epidemics such as COVID-19, abandonment of cropland and also extensive land expansion, restricting regional economic development [71,78,79]. Therefore, development needs to be customized and also managed by the government. Carlos Costa (2001) proposed that the compilation of tourism plans for tourist towns should align with local urban planning to emphasize continuity [80]. Smith (2004) suggested that the development of small towns should be linked to their own cultural industries and marketing strategies while actively attracting investments from social enterprises to further promote economic growth [81]. During the specific development process, whether residents’ wishes or government intervention should take the lead depends on the local physical and cultural environment [82,83]. In summary, the development of distinctive towns in both Eastern and Western countries has repeatedly proven that these customized county developments should involve allocating a designated number to tourism operations, prioritizing limited development and ecological protection, and further advancing green and sustainable development. Residents should also be encouraged to adopt a multi-activity strategy, leveraging synergistic relationships between tourism and other income sources to enhance the sustainability of their livelihoods [21].
4.4. Limitations and Future Research Directions
This study has some limitations. Firstly, we only selected the first batch of tourism strong counties in China, which are typical in type but cannot represent all tourism counties in China. In future, we should expand the selection scope and number of tourism counties to establish a more comprehensive tourism county development strategy. Secondly, the study only explored the customized development of townships from the perspective of tourism. In future research, it is essential to examine other types of representative townships, such as industrial, trading, agricultural, and so on. Subsequently, through research, we can ascertain the commonalities and differences among them to provide guidance for the development of a broader range of townships. Thirdly, issues such as rural hollowing out and extensive land development should be addressed from multiple perspectives. How much land do we actually need? Future studies should delve into the needs of multiple relevant stakeholders and incorporate more socio-economic data, such as the changes in industrial structure, employment, migration, family structure, etc. Both the types of townships and analytical factors should be expanded to more comprehensively explore the policy, spatial, resource, and socio-economic factors behind township land expansion in order to provide policy recommendations for more effective land planning and management.
5. Conclusions
Our study explored the expansion dynamics of 17 counties from 1993 to 2018 based on satellite data and statistic data. The main conclusions are as follows:
- (1)
- Over the past 26 years, there has been an increasing trend in impervious area expansion in 17 counties. Six counties had annual area increases (AIs) of more than 100 ha. The increasing land expansion with a shrinking population phenomenon prevailed. The vast majority of the counties’ expansions occurred primarily in the lowlands, but expansions in the highlands were also increasing, especially in the west. A total of 15 counties converted their impervious area predominantly from cropland, ranging from 16.40% to 71.96%. Therefore, some relevant counties should strictly abide by the “Redline of Arable line” (RAL) and improve the level of agricultural management to increase crop production.
- (2)
- The expansion types in 17 counties were mainly dominated by infilling and edge-expansion during the early stage, after which leapfrogging occurred, and infilling increased again in recent years. Leapfrogging patches have increased the degree of fragmentation. Infilling sprawl has the potential to improve land use efficiency and increase population density.
- (3)
- Townships with a “closer” accessibility had the largest and fastest rate of land expansion. The tourism counties need customized development, one of which is a tourism industry with its unique natural conditions. Traffic density exhibited the strongest positive correlation with AI. Therefore, it is recommended to enhance road density in a rational manner and develop higher-level transportation networks, such as the high-speed rail.
This study delves into the spatial evolution characteristics of tourism counties in different regions and socio-economic backgrounds during China’s rapid urbanization process, providing the empirical foundation for global research on rural and urban development.
Supplementary Materials
The following supporting information can be downloaded at: https://www.mdpi.com/article/10.3390/land14020347/s1, Figure S1: Spatial distributions of township impervious land expansion in 17 counties among five neighboring periods from 1993 to 2018; Table S1: Designated route speeds by types of route.
Author Contributions
Conceptualization, W.J. and S.J.; methodology, W.J., P.L. and S.J.; software, P.L.; validation, W.J., P.L. and S.J.; formal analysis, P.L. and S.J.; investigation, P.L. and X.C.; resources, W.J.; data curation, W.J. and P.L.; writing—original draft preparation, S.J. and P.L.; writing—review and editing, W.J.; visualization, S.J. and X.C.; supervision, W.J.; project administration, W.J. All authors have read and agreed to the published version of the manuscript.
Funding
This work was supported by the National Natural Science Foundation of China under Grant No. 42201118, and the Natural Science Foundation of Shaanxi Province of China under Grant No. 2023-JC-QN-0387.
Data Availability Statement
Data are contained within the article and Supplementary Materials.
Conflicts of Interest
The authors declare no conflicts of interest.
References
- Berihun, M.L.; Tsunekawa, A.; Haregeweyn, N.; Meshesha, D.T.; Adgo, E.; Tsubo, M.; Masunaga, T.; Fenta, A.A.; Sultan, D.; Yibeltal, M. Exploring land use/land cover changes, drivers and their implications in contrasting agro-ecological environments of Ethiopia. Land Use Policy 2019, 87, 104052. [Google Scholar] [CrossRef]
- Tan, R.; Beckmann, V.; Berg, L.V.; Qu, F. Governing farmland conversion: Comparing China with the Netherlands and Germany. Land Use Policy 2009, 26, 961–974. [Google Scholar] [CrossRef]
- Wu, W.J.; Tang, J.X. Strategies for rural infrastructure construction in areas facing population decline—Experiences in rural wastewater management from Germany. Urban Plan. Int. 2016, 31, 135–142. [Google Scholar] [CrossRef]
- Tešin, A.; Dragin, A.S.; Mijatov Ladičorbić, M.; Jovanović, T.; Zadel, Z.; Surla, T.; Košić, K.; Amezcua-Ogáyar, J.M.; Calahorro-López, A.; Kuzman, B.; et al. Quality of Life and Attachments to Rural Settlements: The Basis for Regeneration and Socio-Economic Sustainability. Land 2024, 13, 1364. [Google Scholar] [CrossRef]
- Viñas, C.D. Depopulation Processes in European Rural Areas: A Case Study of Cantabria (Spain). Eur. Countrys. 2019, 11, 341–369. [Google Scholar] [CrossRef]
- Qu, Y.; Zhan, L.; Jiang, G.; Ma, W.; Dong, X. How to Address “Population Decline and Land Expansion (PDLE)” of rural residential areas in the process of Urbanization: A comparative regional analysis of human-land interaction in Shandong Province. Habitat Int. 2021, 117, 102441. [Google Scholar] [CrossRef]
- Viccaro, M.; Romano, S.; Prete, C.; Cozzi, M. Rural planning? An integrated dynamic model for assessing quality of life at a local scale. Land Use Policy 2021, 111, 105742. [Google Scholar] [CrossRef]
- National Bureau of Statistics. Available online: https://www.stats.gov.cn/ (accessed on 15 August 2023).
- Gao, J.; O’Neill, B.C. Mapping global urban land for the 21st century with data-driven simulations and Shared Socioeconomic Pathways. Nat. Commun. 2020, 11, 2302. [Google Scholar] [CrossRef]
- Zhong, C.; Guo, H.; Swan, I.; Gao, P.; Yao, Q.; Li, H. Evaluating trends, profits, and risks of global cities in recent urban expansion for advancing sustainable development. Habitat Int. 2023, 138, 102869. [Google Scholar] [CrossRef]
- Zünd, D.; Bettencourt, L.M.A. Growth and Urban Development in Prefecture-Level China. PLoS ONE 2019, 14, e0221017. [Google Scholar] [CrossRef]
- Gao, X.; Xu, A.; Liu, L.; Deng, O.; Zeng, M.; Ling, J.; Wei, Y. Understanding rural housing abandonment in China’s rapid urbanization. Habitat Int. 2017, 67, 13–21. [Google Scholar] [CrossRef]
- Wen, Q.; Li, J.; Ding, J.; Wang, J. Evolutionary process and mechanism of population hollowing out in rural villages in the farming-pastoral ecotone of Northern China: A case study of Yanchi County, Ningxia. Land Use Policy 2023, 125, 106506. [Google Scholar] [CrossRef]
- Cao, Y.; Bai, Z.; Sun, Q.; Zhou, W. Rural settlement changes in compound land use areas: Characteristics and reasons of changes in a mixed mining-rural-settlement area in Shanxi Province, China. Habitat Int. 2017, 61, 9–21. [Google Scholar] [CrossRef]
- Gong, J.; Jian, Y.; Chen, W.; Liu, Y.; Hu, Y. Transitions in rural settlements and implications for rural revitalization in Guangdong Province. J. Rural Stud. 2022, 93, 359–366. [Google Scholar] [CrossRef]
- Liu, S.; Xiao, W.; Ye, Y.; He, T.; Luo, H. Rural residential land expansion and its impacts on cultivated land in China between 1990 and 2020. Land Use Policy 2023, 132, 106816. [Google Scholar] [CrossRef]
- Yu, Z.; Wu, C.; Tan, Y.; Zhang, X. The dilemma of land expansion and governance in rural China: A comparative study based on three townships in Zhejiang Province. Land Use Policy 2018, 71, 602–611. [Google Scholar] [CrossRef]
- Bai, X.; Shi, P.; Liu, Y. Society: Realizing China’s urban dream. Nature 2014, 509, 158–160. [Google Scholar] [CrossRef]
- Jiang, H.; Guo, H.; Sun, Z.; Xing, Q.; Zhang, H.; Ma, Y.; Li, S. Projections of urban built-up area expansion and urbanization sustainability in China’s cities through 2030. J. Clean. Prod. 2022, 367, 133086. [Google Scholar] [CrossRef]
- Xue, L.; Kerstetter, D. Rural Tourism and Livelihood Change: An Emic Perspective. J. Hosp. Tour. Res. 2018, 43, 416–437. [Google Scholar] [CrossRef]
- Su, M.M.; Wall, G.; Wang, Y.; Jin, M. Livelihood sustainability in a rural tourism destination—Hetu Town, Anhui Province, China. Tour. Manag. 2019, 71, 272–281. [Google Scholar]
- Fei, W.; Zhao, S. Urban land expansion in China’s six megacities from 1978 to 2015. Sci. Total Environ. 2019, 664, 60–71. [Google Scholar] [CrossRef]
- Yu, W.; Zhou, W. The Spatiotemporal Pattern of Urban Expansion in China: A Comparison Study of Three Urban Megaregions. Remote Sens. 2017, 9, 45. [Google Scholar] [CrossRef]
- Perroux, F. Economic Space: Theory and Applications. Q. J. Econ. 1950, 64, 89–104. [Google Scholar] [CrossRef]
- He, J.M. A Study on Rural Tourism Overseas. Tour. Trib. 2003, 18, 76–80. [Google Scholar]
- Tang, J.; Gao, H.; Song, X.; Xu, H. Convergence or divergence between small towns and villages: A perspective from changes in built-up land development intensity. Habitat Int. 2023, 138, 102874. [Google Scholar] [CrossRef]
- Liu, C.; Dou, X.; Li, J.; Cai, L.A. Analyzing government role in rural tourism development: An empirical investigation from China. J. Rural Stud. 2020, 79, 177–188. [Google Scholar] [CrossRef]
- Yang, J.; Huang, X. The 30 m annual land cover dataset and its dynamics in China from 1990 to 2019. Earth Syst. Sci. Data 2021, 13, 3907–3925. [Google Scholar] [CrossRef]
- Yang, C.; Liu, H.; Li, Q.; Wang, X.; Ma, W.; Liu, C.; Fang, X.; Tang, Y.; Shi, T.; Wang, Q.; et al. Human expansion into Asian highlands in the 21st Century and its effects. Nat. Commun. 2022, 13, 4955. [Google Scholar] [CrossRef] [PubMed]
- Ning, Y.; Liu, S.; Smith, A.R.; Qiu, Y.; Gao, H.; Lu, Y.; Yuan, W.; Feng, S. Dynamic multi-dimensional scaling of 30+ year evolution of Chinese urban systems: Patterns and performance. Sci. Total Environ. 2023, 863, 160705. [Google Scholar] [CrossRef] [PubMed]
- Bettencourt, L.M.A.; Lobo, J.; Helbing, D.; Kühnert, C.; West, G.B. Growth, innovation, scaling, and the pace of life in cities. Proc. Natl. Acad. Sci. USA 2007, 104, 7301–7306. [Google Scholar] [CrossRef] [PubMed]
- Kleiber, M. Body Size and Metabolic Rate. Physiol. Rev. 1947, 27, 511–541. [Google Scholar] [CrossRef]
- Xu, C.; Liu, M.; Zhang, C.; An, S.; Yu, W.; Chen, J.M. The spatiotemporal dynamics of rapid urban growth in the Nanjing metropolitan region of China. Landsc. Ecol. 2007, 22, 925–937. [Google Scholar] [CrossRef]
- JTGB-2003; Technical Standard of Highway Engineering. Ministry of Transport of the People’s Republic of China: Beijing, China, 2004.
- Jin, S.; Yang, J.; Wang, E.; Liu, J. The influence of high-speed rail on ice–snow tourism in northeastern China. Tour. Manag. 2020, 78, 104070. [Google Scholar] [CrossRef]
- Xu, G.; Zhu, M.; Chen, B.; Salem, M.; Xu, Z.; Li, X.; Jiao, L.; Gong, P. Settlement scaling law reveals population-land tensions in 7000+ African urban agglomerations. Habitat Int. 2023, 142, 102954. [Google Scholar] [CrossRef]
- Angel, S.; Parent, J.R.; Civco, D.L.; Blei, A.; Potere, D.T. The Dimensions of Global Urban Expansion: Estimates and Projections for All Countries, 2000–2050. Prog. Plan. 2011, 75, 53–107. [Google Scholar] [CrossRef]
- Sun, Y.; Jiang, H.; Zhu, X. Drivers, Constraints, and Policy Regulation Strategies for the Abandonment of Farmland: Insights from China. Land 2024, 13, 2096. [Google Scholar] [CrossRef]
- Meehan, K.; Jurjevich, J.R.; Everitt, L.; Chun, N.M.; Sherrill, J. Urban inequality, the housing crisis and deteriorating water access in US cities. Nature Cities 2024, 2, 93–103. [Google Scholar] [CrossRef]
- Long, S.F.; Cao, K.J.; Shang, N. Spatial effect of tourism promoting rural development: An empirical analysis of 83 counties in Xinjiang Uygur Autonomous Region. Sci. Geogr. Sin. 2024, 44, 1387–1395. [Google Scholar]
- Gong, W.J.; Sun, J. Research on the Development Strategies of Rural Logistics in Hebei Province Under Rural Revitalization. Logist. Sci.-Tech. 2025, 48, 132–133+139. [Google Scholar]
- Zhao, J.M.; Zheng, J.; Li, T.W. Does e-commerce offer a solution to rural depopulation? Evidence from China. Cities 2024, 152, 105155. [Google Scholar] [CrossRef]
- Miao, Y.B.; Liu, J.J.; Wang, R.Y. Occupation of Cultivated Land for Urban–Rural Expansion in China: Evidence from National Land Survey 1996–2006. Land 2021, 12, 1378. [Google Scholar] [CrossRef]
- Chen, H.; Zhao, L.; Zhao, Z. Influencing factors of farmers’ willingness to withdraw from rural homesteads: A survey in zhejiang, China. Land Use Policy 2017, 68, 524–530. [Google Scholar] [CrossRef]
- Gu, H.; Ling, Y.; Shen, T.; Yang, L. How does rural homestead influence the hukou transfer intention of rural-urban migrants in China? Habitat Int. 2020, 105, 102267. [Google Scholar] [CrossRef]
- Ju, H.; Zhang, Z.; Zhao, X.; Wang, X.; Wu, W.; Yi, L.; Wen, Q.; Liu, F.; Xu, J.; Hu, S.; et al. The changing patterns of cropland conversion to built-up land in China from 1987 to 2010. J. Geogr. Sci. 2018, 28, 1595–1610. [Google Scholar] [CrossRef]
- Peng, H.; Xia, H.; Shi, Q.; Tang, Z.; Chen, H. Monitoring of wetland cover changes in protected areas to trade-offs between ecological conservation and food security: A case study from the Dongting Lake, China. Ecol. Inform. 2023, 78, 102338. [Google Scholar] [CrossRef]
- Wang, L.; Li, Z.; Yuan, C.; Liu, L. Exploration on the reasons for low efficiency of arable land protection policy in China: An evolutionary game theoretic model. Environ. Dev. Sustain. 2023, 26, 25173–25198. [Google Scholar] [CrossRef]
- Zhuang, H.; Chen, G.; Yan, Y.; Li, B.; Zeng, L.; Ou, J.; Liu, K.; Liu, X. Simulation of urban land expansion in China at 30 m resolution through 2050 under shared socioeconomic pathways. GISci. Remote Sens. 2022, 59, 1301–1320. [Google Scholar] [CrossRef]
- Liu, J.; Kuang, W.; Zhang, Z.; Xu, X.; Qin, Y.; Ning, J.; Zhou, W.; Zhang, S.; Li, R.; Yan, C.; et al. Spatiotemporal characteristics, patterns, and causes of land-use changes in China since the late 1980s. J. Geogr. Sci. 2014, 24, 195–210. [Google Scholar] [CrossRef]
- Zhou, Y.; Li, X.; Liu, Y. Land use change and driving factors in rural China during the period 1995–2015. Land Use Policy 2020, 99, 105048. [Google Scholar] [CrossRef]
- Xie, J.; Jin, X.; Lin, Y.; Cheng, Y.; Yang, X.; Bai, Q.; Zhou, Y. Quantitative estimation and spatial reconstruction of urban and rural construction land in Jiangsu Province, 1820–1985. J. Geogr. Sci. 2017, 27, 1185–1208. [Google Scholar] [CrossRef]
- Chen, G.; Li, X.; Liu, X.; Chen, Y.; Liang, X.; Leng, J.; Xu, X.; Liao, W.; Qiu, Y.; Wu, Q.; et al. Global projections of future urban land expansion under shared socioeconomic pathways. Nat. Commun. 2020, 11, 537. [Google Scholar] [CrossRef] [PubMed]
- Fazal, S. Urban expansion and loss of agricultural land—A GIS based study of Saharanpur City, India. Environ. Urban. 2000, 12, 133–149. [Google Scholar] [CrossRef]
- Bren d’Amour, C.; Reitsma, F.; Baiocchi, G.; Barthel, S.; Güneralp, B.; Erb, K.; Haberl, H.; Creutzig, F.; Seto, K.C. Future urban land expansion and implications for global croplands. Proc. Natl. Acad. Sci. USA 2016, 114, 8939–8944. [Google Scholar]
- Cao, Y.; Zhang, X.; Zhang, X.; Li, H. The incremental construction land differentiated management framework: The perspective of land quota trading in China. Land Use Policy 2020, 96, 104675. [Google Scholar] [CrossRef]
- Samiullah, M.A.K.; Rahman, A.U.; Mahmood, S. Evaluation of urban encroachment on farmland: A threat to urban agriculture in Peshawar City District, Pakistan. Erdkunde 2019, 73, 127–142. [Google Scholar] [CrossRef]
- Lu, S.S. Integrating Land Use Systems Based on Municipal Merger in Japan: Azumino City of Nagano Prefecture. Planners 2020, 36, 109–116. [Google Scholar]
- Chen, Y.; Chen, Z.; Xu, G.; Tian, Z. Built-up land efficiency in urban China: Insights from the General Land Use Plan (2006–2020). Habitat Int. 2016, 51, 31–38. [Google Scholar] [CrossRef]
- Yang, C.; Xia, R.; Li, Q.; Liu, H.; Shi, T.; Wu, G. Comparing hillside urbanizations of Beijing-Tianjin-Hebei, Yangtze River Delta and Guangdong–Hong Kong–Macau greater Bay area urban agglomerations in China. Int. J. Appl. Earth Obs. Geoinf. 2021, 102, 102460. [Google Scholar] [CrossRef]
- Mills, R.J. A History of the Ski Industry in the United States and Switzerland: An Examination of Industry Success and Failure; Robert Morris University: Moon Township, PA, USA, 2010. [Google Scholar]
- Xu, S.M.; Zhang, D.C.; Li, X.N. The Development Features of Snow Tourism Industry in Europe and Its Inspirations for China. Northeast Asia Forum 2011, 20, 120–127. [Google Scholar]
- Sun, H.J.; Zhang, J.J. Practices and Inspirations from European Snow Towns Development Case Studies on French, Swiss and Norwegian Snow Towns. Urban Dev. Stud. 2019, 5, 1–3+9. [Google Scholar]
- Zeng, Z.; Estes, L.; Ziegler, A.D.; Chen, A.; Searchinger, T.; Hua, F.; Guan, K.; Jintrawet, A.; Wood, E.F. Highland cropland expansion and forest loss in Southeast Asia in the twenty-first century. Nat. Geosci. 2018, 11, 556–562. [Google Scholar] [CrossRef]
- Meng, L.; Sun, Y.; Zhao, S. Comparing the spatial and temporal dynamics of urban expansion in Guangzhou and Shenzhen from 1975 to 2015: A case study of pioneer cities in China’s rapid urbanization. Land Use Policy 2020, 97, 104753. [Google Scholar] [CrossRef]
- Zhao, S.; Zhou, D.; Zhu, C.; Qu, W.; Zhao, J.; Sun, Y.; Huang, D.; Wu, W.; Liu, S. Rates and patterns of urban expansion in China’s 32 major cities over the past three decades. Landsc. Ecol. 2015, 30, 1541–1559. [Google Scholar] [CrossRef]
- Zhou, K.; Liu, Y.; Tan, R.; Song, Y. Urban dynamics, landscape ecological security, and policy implications: A case study from the Wuhan area of central China. Cities 2014, 41, 141–153. [Google Scholar] [CrossRef]
- Zhou, M.; Tan, S.; Zhang, L. Influences of different land use spatial control schemes on farmland conversion and urban development. PLoS ONE 2015, 10, e0125008. [Google Scholar] [CrossRef] [PubMed]
- Chakraborty, S.; Maity, I.; Dadashpoor, H.; Novotnẏ, J.; Banerji, S. Building in or out? Examining urban expansion patterns and land use efficiency across the global sample of 466 cities with million+ inhabitants. Habitat Int. 2022, 120, 102503. [Google Scholar] [CrossRef]
- Xu, G.; Zhou, Z.; Jiao, L.; Zhao, R. Compact Urban Form and Expansion Pattern Slow Down the Decline in Urban Densities: A Global Perspective. Land Use Policy 2020, 94, 104563. [Google Scholar] [CrossRef]
- Rao, Y.; Zou, Y.; Yi, C.; Luo, F.; Song, Y.; Wu, P. Optimization of rural settlements based on rural revitalization elements and rural residents’ social mobility: A case study of a township in western China. Habitat Int. 2023, 137, 102851. [Google Scholar] [CrossRef]
- Novotný, J.; Chakraborty, S.; Maity, I. Urban expansion of the 43 worlds’ largest megacities: A search for unified macro-patterns. Habitat Int. 2022, 129, 102676. [Google Scholar] [CrossRef]
- Zhang, H.; Wang, Z.; Liu, J.; Chai, J.; Wei, C. Selection of targeted poverty alleviation policies from the perspective of land resources-environmental carrying capacity. J. Rural Stud. 2022, 93, 318–325. [Google Scholar] [CrossRef]
- Yang, J.; Yang, R.; Chen, M.-H.; Su, C.-H.; Zhi, Y.; Xi, J. Effects of rural revitalization on rural tourism. J. Hosp. Tour. Manag. 2021, 47, 35–45. [Google Scholar] [CrossRef]
- Xi, J.; Wang, X.; Kong, Q.; Zhang, N. Spatial morphology evolution of rural settlements induced by tourism. J. Geogr. Sci. 2015, 25, 497–511. [Google Scholar] [CrossRef]
- Liu, T.-Y.; Su, C.-W. Is transportation improving urbanization in China? Socio-Econ. Plan. Sci. 2021, 77, 101034. [Google Scholar] [CrossRef]
- Wang, C.; Lim, M.K.; Zhang, X.; Zhao, L.; Lee, P.T.-W. Railway and road infrastructure in the Belt and Road Initiative countries: Estimating the impact of transport infrastructure on economic growth. Transp. Res. Part A Policy Pract. 2020, 134, 288–307. [Google Scholar] [CrossRef]
- Ma, W.; Jiang, G.; Zhou, T.; Qu, Y. Do decaying rural communities have an incentive to maintain large-scale farming? A comparative analysis of farming systems for peri-urban agriculture in China. J. Clean. Prod. 2023, 397, 136590. [Google Scholar] [CrossRef]
- Wu, W.; Li, Y.; Liu, Y. What constrains impoverished rural regions: A case study of Henan Province in central China. Habitat Int. 2022, 119, 102477. [Google Scholar] [CrossRef]
- Costa, C. An emerging tourism planning paradigm? A comparative analysis between town and tourism planning. Int. J. Tour. Res. 2001, 3, 425–441. [Google Scholar] [CrossRef]
- Smith, M.K. Seeing a new side to seasides: Culturally regenerating the English seaside town. Int. J. Tour. Res. 2004, 6, 17–28. [Google Scholar] [CrossRef]
- Madrigal, R. Residents’ perceptions and the role of government. Ann. Tour. Res. 1995, 22, 86–102. [Google Scholar] [CrossRef]
- Mayaka, M.; Akama, J.S. Systems approach to tourism training and education: The Kenyan case study. Tour. Manag. 2007, 28, 298–306. [Google Scholar] [CrossRef]


Disclaimer/Publisher’s Note: The statements, opinions and data contained in all publications are solely those of the individual author(s) and contributor(s) and not of MDPI and/or the editor(s). MDPI and/or the editor(s) disclaim responsibility for any injury to people or property resulting from any ideas, methods, instructions or products referred to in the content. |
© 2025 by the authors. Licensee MDPI, Basel, Switzerland. This article is an open access article distributed under the terms and conditions of the Creative Commons Attribution (CC BY) license (https://creativecommons.org/licenses/by/4.0/).