Abstract
Agroforestry has been widely suggested as a tool for storing carbon while also providing other ecosystem services like food and income production. A greater understanding of how carbon storage in agroforestry systems varies, and particularly how it is intertwined with the productivity of these systems, could enable farmers and policymakers to make changes that simultaneously increase carbon storage and alleviate poverty. In this study, we used allometric equations to evaluate the carbon storage in the biomass of two complex agroforestry systems in Bali, Indonesia—rustic where a native tree canopy is still present, and polyculture where all native trees have been removed, and the canopy consists only of cropping trees. We then compared these figures to that of a nearby primary forest and linked carbon storage to productivity for both agroforestry systems. We found that the primary forest (277.96 ± 149.05 Mg C ha−1) stored significantly more carbon than either the rustic (144.72 ± 188.14 Mg C ha−1) or polyculture (105.12 ± 48.65 Mg C ha−1) agroforestry systems, which were not significantly different from each other. We found productivity and carbon storage to be significantly positively correlated with each other within the polyculture system but not within the rustic system. We also found that for the rustic system, an increase in the density of native trees is accompanied by an increase in carbon storage, but no significant change in productivity. Consequently, we conclude that within the rustic system, carbon storage can be increased or maintained at a high value by the preservation and encouragement of large native trees, and that this need not necessarily result in a decrease in productivity.
Keywords:
agroforestry; carbon; productivity; rustic; polyculture; biomass; Indonesia; climate change 1. Introduction
Climate change is one of the most pressing challenges of our time. The warming climate has been shown to have a range of negative impacts such as worsening human mental and physical health [1,2,3], lowering agricultural production [4,5,6,7,8], reducing global biodiversity [4,9,10], reducing insect diversity and abundance [11,12], and destabilising ocean ecosystems [13], amongst others. In worst-case scenarios, climate change could cause ecological collapse, global catastrophe, or even human extinction [14]. As such, taking appropriate action to limit the greenhouse gases in the atmosphere that cause global warming (i.e., climate change mitigation) is critically important [15].
Carbon sequestration and storage in biomass and soils has been widely suggested as one of the more promising strategies for climate change mitigation [15,16,17,18]. Since the Kyoto Protocol in 1997, the protection and enhancement of natural carbon sinks has been an important component of climate policy [19]. This often involves limiting deforestation and planting trees, or allowing natural forestation on unforested lands, because of the vast quantities of carbon that can be stored in forest biomass and soil [20]. However, forestation potential, and hence carbon sequestration, is constrained by conflicting land use requirements, such as food production, livelihood provision, and biodiversity conservation [17]. This is especially true in developing countries such as Indonesia, which have high human population pressures and are undergoing rapid agricultural expansion and intensification [21]. Land uses combining other benefits with carbon sequestration are needed for cost-effective climate change mitigation.
Agroforestry has been promoted as a sustainable land use practice, purported to provide numerous ecosystem services, including carbon storage [22,23,24,25,26,27]. Agroforestry, that is, the intentional intermingling of trees with crops or livestock, has a long history of use in tropical climates [28]. While recognising that there are hundreds of agroforestry systems that could potentially be classified, Torquebiau [29] groups these into six distinct structural categories: crops under tree cover, agroforests, agroforestry in a linear arrangement, animal agroforestry, sequential agroforestry, and minor agroforestry techniques. Important to the present study is the distinction between ‘crops under tree cover’, where native trees are preserved (albeit to varying extents) upon the conversion of forest to agroforest, and ‘agroforests’, where native trees are removed and replaced with a canopy layer of planted trees. The currently existing agroforestry in the world (across all varieties) has been estimated to sequester 1.9 Pg C over the next 50 years, which could be further increased by improving the carbon sequestration of current agroforestry and by converting low-carbon land uses into agroforestry [30].
It is well known that there is a variation in carbon storage between tree species [31]; however, in tropical forests, tree diversity is directly increasing carbon storage potential [32]. Although a wealth of research shows tropical agroforestry systems generally store carbon at levels between those of the primary forest and monocultures, e.g., [33,34,35,36], there is far less information on how carbon storage in agroforestry systems is affected by the conservation of native trees within the farmed landscape. Guillemot et al. [37] found the introduction of non-native Grevillea robusta trees into coffee (Coffea spp.) agroforestry systems in India to negatively affect carbon storage compared to systems preserving the native tree canopy, while Schroth et al. [38], in a study on Brazilian cacao (Theobroma cacao) agroforestry, found traditional agroforests that conserved large native trees to store more carbon than intensified agroforests where most of these trees had been removed. Similarly, modelling by Middendorp et al. [39] showed that traditional cacao agroforests shaded by native trees store slightly more carbon than agroforests shaded by planted trees across a landscape in Ecuador. Whether this effect of native trees on carbon storage is consistent across locations and agroforestry types (i.e., coffee-based, cacao-based, mixed, etc.) is not known.
As well as storing carbon, agroforestry systems can provide increased pollination services [40,41,42], improve flood resilience [43,44], increase soil fertility [45,46], and even boost productivity when compared to monocultures [47]. But agroforestry is an inherently variable practice, and it is reasonable to assume that the ecosystem services provided by agroforestry systems, including carbon storage, vary considerably too. Trade-offs between different ecosystem services need to be considered in order to achieve the desired benefits of a particular agroforestry system, but research in this area is lacking.
An understanding of the interplay between the carbon storage and productivity of agroforestry systems could help inform practises and policies to maximise carbon storage without negatively impacting the livelihoods of the people who depend on these systems. Steffan-Dewenter et al. [48] and Bisseleua et al. [49] found above-ground biomass (and hence carbon storage) within cacao agroforestry to decrease along an increasing intensification gradient in Indonesia and Cameroon, respectively. Both studies represented an increase in intensification as a decrease in shade cover, and while carbon storage decreased as the agroforestry was intensified, productivity peaked at around 40–50% shade cover [48,49]. So, the relationship between carbon storage and productivity, at least for cacao agroforestry, does not seem to be a straightforward one.
If agroforestry is to play a major role in climate mitigation strategies in the tropics, the productivity of these systems must be a key consideration for researchers and policymakers. Agroforestry practises have been found to improve productivity, and consequently food security, for smallholder farming households in Malawi [50]. Similarly, agroforestry has provided economic benefits for the majority of ‘mixed garden’ agroforestry farm owners in West Java, Indonesia [51], and modelling by Nöldeke et al. [52] has predicted that farmers across Indonesia who adopt agroforestry are likely to receive an increased income. Because of the importance of agroforestry for providing food and income to farmers, the further investigation of how carbon storage and productivity intertwine could help alleviate poverty and provide climate mitigation simultaneously.
In this study, we aimed to evaluate the carbon storage in the biomass of two different agroforestry systems in Bali, Indonesia, and compared them to that of a nearby primary forest. The two agroforestry types were rustic, in which crops are grown underneath a native tree canopy [53], which would fall under Torquebiau’s category of ‘crops under tree cover’, and polyculture, in which crops are grown in a forest-like multistorey system without a persisting native tree canopy, which would be included in Torquebiau’s ‘agroforests’ category [29]. We hypothesised that the rustic system stores less carbon in biomass than the primary forest, but more than the polyculture system, because of the carbon stored in the large native trees that persist in the rustic system at a lower density than in the primary forest.
In addition to evaluating the carbon in the biomass of both agroforestry systems and the primary forest, we aimed to describe the relationship between the productivity (in terms of the income provided) and carbon storage of each agroforestry system to test the following two hypotheses:
- The productivity of the rustic system is negatively correlated with the carbon stored as biomass because the majority of carbon will be stored in the unproductive biomass of the native tree canopy;
- The productivity of the polyculture system is positively correlated with the carbon stored as biomass because carbon will only be stored in the productive biomass of the planted crops.
Finally, we aimed to find the relationship between native tree density and carbon storage, and native tree density and productivity, to test the hypothesis that within the rustic system, a higher density of native trees leads to higher carbon storage but lower productivity.
2. Materials and Methods
2.1. Study Site and Data Collection
We collected data from 54 plots in Yeh Embang Kauh in the Jembrana Regency of Bali, Indonesia. In total, 6 of these plots were within the protected primary forest, 32 were within the production forest, or community forest, adjacent to the primary forest, and 16 were near or neighbouring the homes of the village of Yeh Embang Kauh (Figure 1). The altitudes of these plots were between 220 and 480 m above sea level. The Jembrana Regency of western Bali experiences a wet season from October to March (100 to 300 mm precipitation per month) and a drier season from April to September (<100 mm precipitation per month) [54]. Monthly minimum temperatures range from 23 to 26 °C and monthly maximum temperatures range from 31 to 33 °C [54]. The crops within this study area are grown and sold by the farming cooperative Kelompok Tani Hutan (KTH), formed by members of the local community [55]. These crops are grown for both local consumption and for sale.
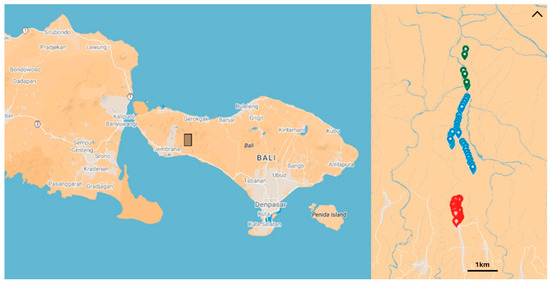
Figure 1.
Maps showing locations of all plots within Yeh Embang Kuah village, Bali, Indonesia. The box on the first map corresponds to the boundaries of the second map. Red plots are polyculture, blue are rustic, and green are primary forests. The map baseline is retrieved from [56].
The 48 plots outside of the primary forest were set up in 2023 by Campera et al. [55,57], with the help of the local farmers. These plots are roughly 25 × 25 m2 with at least 50 m of distance between each plot. The six plots within the protected forest were set up in June 2024. Starting from 500 m after the boundary of the protected forest, 25 × 25 m2 plots were set up, leaving at least 50 m between plots. Plots were not set up in areas where the gradient was too steep to work safely, and so there is some bias towards flatter areas. Plots were defined by marking GPS coordinates on the Avenza smartphone application [58].
The plots within the protected forest are classed as primary forests and consist solely of native trees, without any crops. The trees in the protected forest are illegal to cut and any harvesting conducted here by the local community is small scale and solely of non-timber forest products (NTFPs). The plots within the production forest are categorised as belonging to the rustic system. In the rustic system, native trees persist, albeit at a lower density than in the primary forest, and crops are grown underneath the native canopy, with minimal management (Figure 2) [53,59]. Within the study area, the crops grown under the rustic system consist mostly of coffee Coffea canephora, cacao Theobroma cacao, vanilla Vanilla planifolia, nutmeg Myristica fragrans, and banana Musa spp. These crops are grown within the production forest with the permission of the provincial government forest authority, Kesatuan Pengelolaan Hutan Bali Barat (KPH) [52]. The plots outside of the production forest, near the village, are classified as polyculture systems, and are characterised by an absence of native trees, with a variety of crops being grown together in a forest-like multistorey system (Figure 2). These systems are also referred to as home gardens, and within the study area, the main crops are clove Syzygium aromaticum, coconut Cocos nucifera, cacao, coffee, and banana. Both agroforestry treatments within this study area can be classed as ‘mixed’ agroforests, with a wide variety of crops being grown, although some plots are dominated by a particular crop such as coffee.
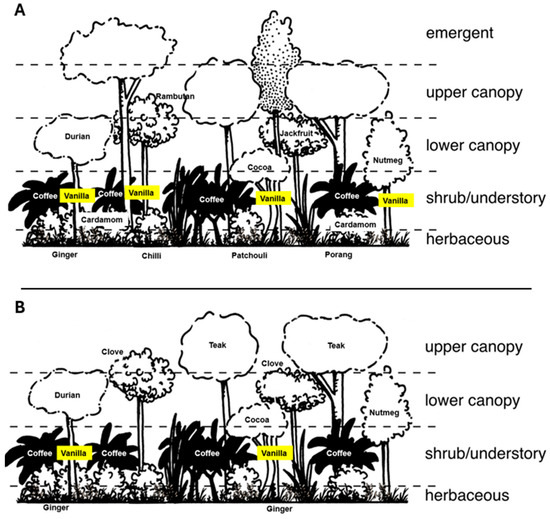
Figure 2.
Diagram showing the differences between rustic systems (A) and polyculture systems (B) in the study area. Rustic systems have an emergent layer of native trees and also more vanilla and herbaceous crops than polyculture systems. The composition of crops is also different between the two systems (see [55] for details). This figure is adapted from [60].
The boundaries of all plots were followed using the Avenza GPS application on smartphones [58]. Where necessary, stakes were inserted into the ground at each corner and string ran between them to form a visible boundary that could be followed easily. The area of each plot was found using the measure tool on Google Earth along with the GPS coordinates for the corners of each plot [61].
A full carbon estimation would include carbon stored in both living and dead biomass as well as within the soil. Because of time and resource constraints, the carbon estimations performed in this study considered only living biomass. This is a common practice in studies comparing the carbon storage of different agroforestry practises (see [62,63,64,65,66] for examples). Additionally, only the biomass of trees and large shrubs were estimated for this study. The biomass of smaller plants was ignored because the estimation of these biomasses necessitates destructive sampling and because they contribute relatively little to the overall biomass of a plot [67]. The biomasses of trees and large shrubs were estimated non-destructively by using allometric equations relating the diameter at breast height (DBH) to the above-ground biomass (AGB) of each plant.
Once a plot had been delimited, the DBH of every native tree with a diameter greater than or equal to 5 cm and the DBH of all tree or tree-like crops with a height greater than 130 cm within the limits of the plot were measured. As many coffee plants were shorter than 130 cm, the diameter at a height of 15 cm (D15) was measured instead. DBH measurements were taken at a height of 130 cm. This was performed by measuring a straight stick with a measuring tape of 2 mm accuracy and cutting to 130 cm. The same stick was used for each DBH measurement until it was damaged, whereupon a new one was cut using the same process. The 15 cm height for coffee diameter measurements was estimated by eye. Diameter measurements were taken using a diameter tape with an accuracy of 1 mm, excepting unusually large trees for which the method of diameter estimation is described below.
Diameter measurement procedure recommendations from Hairiah et al. [68] were followed. Where a tree branched below 130 cm, the six largest branches were measured at 130 cm height, or 50 cm after the branching if the branching was near 130 cm. The overall diameter was then calculated using the following equation, adapted from Magarik et al. [69]:
where Dn is the diameter of each individual branch. On a slope, the height was measured from the higher side. Where a tree grew at an angle, the 130 cm height followed the direction of the tree, rather than remaining vertical. Trees with buttresses or irregularities at 130 cm were measured at 50 cm above the end of the buttresses or irregularity.
At times, particularly large trees necessitated different methods of diameter measurements. Where possible and safe to do so, the trees were climbed, and the diameter measured at 50 cm above the end of the buttresses as normal. Where this was not possible, large sticks were used to hold the diameter tape and wrap it around the tree at 50 cm above the end of the buttresses. In four instances, trees were too large even for this method. For these cases, diameter estimations were made by holding a straight stick up to the tree at 10 m away from the trunk and measuring the apparent width of the tree against this stick, as described by Hairiah et al. [68]. The diameter estimation in metres was then calculated with the following equation, adapted from Hairiah et al. [68]:
where Db is the width of the tree as measured on the stick in cm, L1 is the distance from the trunk (10 m), and L2 is the length of the arm holding the stick. Db, L1, and L2 were all measured using a measuring tape of 2 mm accuracy. For large trees measured in this way or by using sticks to hold the diameter tape, D was recorded only to the nearest cm.
All diameter measurements were recorded immediately after measurement, along with the name of the measured tree where this was known. Trees were identified by local guides in Balinese, Indonesian, or English. The relationships between local names and scientific names are described in Appendix A.
2.2. Carbon Storage and Productivity Calculation
Allometric equations relating DBH (or D15 for coffee) to AGB were found from a variety of sources. The most widely used allometric equation in this study is the pan-tropical broadleaved tree equation developed by Chave et al. [70]. The study area is in the East Java–Bali rainforest ecoregion, which falls within the category of ‘tropical and subtropical moist broadleaf forests’ [71]. So, the specific equation used from Chave et al. [70] is the equation developed for moist tropical forest stands. This equation uses DBH and wood density to estimate the total AGB, with a 19.5% standard error without using height measurements [70].
Where available, species-specific allometric equations were used instead of the general equation from Chave et al. [70]. Most species-specific equations were found from either a database created by Anitha et al. [72] of allometric equations developed in Indonesia or the global allometric equation database GlobAllomeTree [73]. For some species, multiple equations were available. In such cases, the following factors were considered, in decreasing priority, when selecting which allometric equation to use:
- Required inputs. Tree heights were not measured in this study because of prohibitive time constraints and difficulties in measuring tree heights in dense forest stands, so only equations using DBH, and sometimes wood density, were used;
- Diameter range applicability. Allometric equations using DBH should, in general, not be used outside the range of diameters that were used to derive them, so equations with a diameter range including all diameters measured were preferred. For some species, however, equations that did not fully cover the range of diameters measured in this study had to be used;
- Geographic suitability. Preference was given to equations derived in Indonesia or Southeast Asia;
- Habitat suitability. Preference was given to equations derived in agroforestry contexts;
- Accuracy. Where all else was equal, preference was given to equations with the highest reported accuracy.
In total, 19 allometric equations, including the general pan-tropical equation, were used (Table 1).

Table 1.
Table showing all allometric equations used in this study, along with the species each equation was used/developed for, the range of diameter applicability given for each equation, and the source that each equation was derived from. D is diameter at breast height, D15 is diameter at 15 cm above ground level, and ρ is wood density.
For some allometric equations, including the general pan-tropical equation, a value for wood density was required. For this study, average wood densities for different species and genera were obtained primarily from the Global Wood Density Database [93] or the IPCC good practice guidance for land use, land use change, and forestry [94], or preference was given to wood densities reported from tropical Southeast Asia, and where there were multiple values of the same suitability, they were averaged (Table 2).
Table 2.
Table showing all wood densities used in this study, along with the species and source. All wood densities are oven-dry mass over fresh volume.
Some native trees (4.6% of the total number of individual trees measured) were either unable to be identified by local guides, or we were unable to identify a species or genus name from the local Balinese name. As no stand-level average was available for these trees, we used the closest we could, which was the Indonesian average as advised by Chave et al. [70]. Thus, a wood density of 0.61 g cm−3, the median wood density for an Indonesian forest, was used [97].
After using allometric equations with the DBH or D15 to estimate the AGB of each tree, a general root-to-shoot ratio was used to estimate the below-ground biomass (BGB) of every tree. The root-to-shoot ratio is from the IPCC guidelines for national greenhouse gas inventories and takes the following form [98]:
The total biomass for each tree was then estimated by the following simple equation:
Because carbon constitutes approximately 50% of the dry biomass of a tree [99], the carbon stored in the biomass of each tree was calculated using the following equation:
The carbon values of each tree were summed to give values for the total carbon in the living biomass for each plot. These values were divided by the area of each plot to give the final values of carbon storage in units of Mg C ha−1. This was also performed separately for each species to show the composition of carbon storage in each plot.
Plot productivity was estimated by Campera et al. [55] in 2023 using local knowledge. First, local agroforestry practitioners estimated the productivity of each crop plant per year, which was used to estimate the overall yield per year of each crop within each plot and then the total productivity in USD within each plot. We then divided these figures from Campera et al. [55] by the plot areas measured in this study to give values of productivity in USD ha-1 for all rustic and polyculture plots.
2.3. Data Analysis
The raw data collected in this study included plot, species, and DBH (D15 for coffee plants) for every tree/crop that met the criteria detailed above. For multi-stemmed plants, diameters of each stem were taken separately and then converted using Equation (1) to give singular diameter values for every tree and crop measured. These data were then used within R 4.4.1 with RStudio 2024.04.02 [100] for all statistical analyses.
The values of DBH were first converted into estimates of carbon stored within each tree, summed by species and plot, and divided by plot area using the steps detailed above to give values of carbon storage per hectare for each species within each plot. These were averaged across each treatment to give average carbon storage per hectare for each species for each treatment. Additionally, the carbon of each species within each plot was summed to give values of total carbon per hectare for each plot. These values were used for further analysis.
The values of total carbon per hectare in each plot were then log transformed to improve the normality of the distributions within each treatment. Because the variances of carbon storage within each treatment were unequal, an Analysis of Variance (ANOVA) with unequal variance using the built-in “oneway.test” function in R [100] was performed on the log-transformed carbon storage values. A post hoc Games–Howell test, suitable to compare means when group variances are unequal, was then performed using the “games_howell_test” function in the “rstatix” package [101].
Productivity values for each plot were inputted into R and divided by the area of each plot to give values for productivity per hectare for each plot. These were then log transformed to improve the normality of the distributions within each treatment before further analyses were conducted. The Pearson’s correlation coefficients between carbon storage and productivity for both rustic and polyculture systems were then found using the built-in “cor.test” function [100].
The densities of the native trees of each plot within the rustic system were found by counting the number of native trees in each plot (see Appendix A for details of which species were included as native) and dividing by the area of each plot. The Pearson’s correlation coefficients between native tree density and carbon stock, and native tree density and productivity for the rustic system, were then calculated using the same method as detailed above. We considered p = 0.05 as a threshold for significance.
3. Results
A total of 3578 tree and crop diameters were measured as part of this study. Of these, the most common plants were coffee, Gliricidia sepium, banana, cacao, Erythrina variegata, and clove with 1526, 439, 294, 267, 147, and 120 individuals, respectively. There were 107 trees which were not able to be identified and 56 trees which were identified in the local language (Balinese) but could not be translated into scientific names (see Appendix A for details).
The majority of carbon in biomass was stored in the largest trees, particularly for the rustic system. The largest 10% of trees by diameter stored 96, 75, and 80% of the total carbon in biomass of the rustic, polyculture and forest treatments, respectively (Figure 3). The compositions of the carbon in biomass were dramatically different between the two agroforestry treatments. The carbon in the biomass of the rustic system was pre-dominantly found in the native trees, which made up 90.8% of the carbon in the biomass of the rustic system on average. After native trees, the highest proportion of carbon storage was found in durian Durio spp. (2.7%), ‘vanilla trees’ (2.0%), nutmeg (1.4%), cacao (0.9%), and coffee (0.7%). ‘Vanilla trees’ is a grouping of species used within this study area primarily for the purposes of providing a host for the epiphytic vanilla plant, and includes G. sepium, Leucaena leucocephala, and E. variegata. Within the polyculture system, the carbon in biomass was found primarily in clove (55.2%), coconut (22.1%), teak Tectona grandis (8.2%), and durian (5.0%).
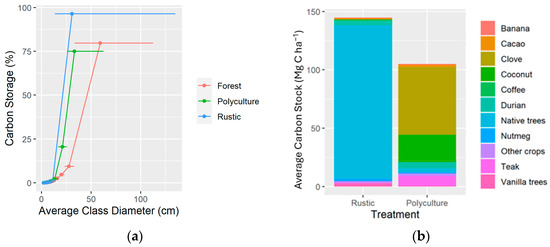
Figure 3.
(a) Percentage contribution to total carbon storage for each 10-percentile diameter class, separately for each treatment. Horizontal bars show the range of diameters included in each 10-percentile class; (b) average composition of carbon storage in different key plants/groups of plants for the two agroforestry treatments.
The mean values of carbon storage in biomass for the three treatments evaluated in this study were 277.96 Mg C ha−1 (SD 149.05) for the primary forest (six plots), 144.72 Mg C ha−1 (SD 188.14) for the rustic system (32 plots), and 105.12 Mg C ha−1 (SD 48.65) for the polyculture system (16 plots). While the rustic system has a higher mean carbon storage than the polyculture system, the median carbon storage is higher for polyculture (Figure 4). The carbon storage values of the rustic system were extremely variable, especially when compared to those of the polyculture system, despite the larger sample size of the rustic system.
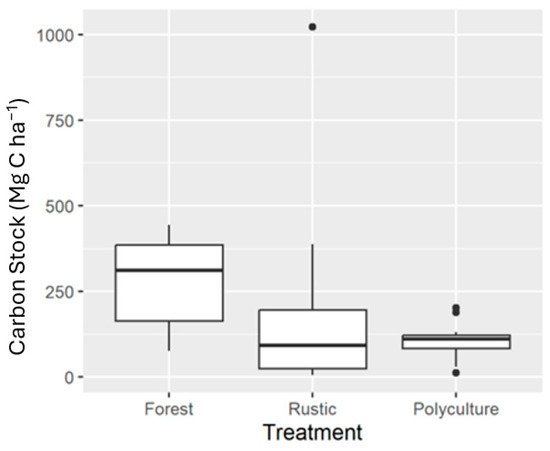
Figure 4.
Box plot (median, quartiles, range, and outliers) of carbon storage in the biomass of the three treatments.
The carbon storage in the biomass of the primary forest was significantly larger than that of either rustic or polyculture agroforestry, which were not found to be significantly different from each other (F-value = 5.21, p-value = 0.018). The post hoc Games–Howell test suggests that the carbon storage in the biomass of the primary forest is significantly larger than either of the two agroforestry treatments (Table 3). Conversely, the difference in carbon storage between the rustic and polyculture systems was not significant.
Table 3.
Results of Games–Howell test on the log-transformed carbon storage values across the three treatments. ns = not significant, * = significant.
We found a significant, positive correlation between carbon storage and productivity for the polyculture plots (ρ = 0.79, 95% CI: 0.49–0.92; p-value < 0.001), and a slightly positive but insignificant correlation between these variables for the rustic plots (ρ = 0.28, 95% CI: −0.08–0.57; p-value = 0.130) (Figure 4).
In the rustic plots, a significant positive correlation was also observed between the density of native trees and carbon storage (ρ = 0.47, 95% CI: 0.14–0.70; p-value = 0.007), while no correlation was observed between the density of native trees and productivity (ρ = 0.08, 95% CI: −0.27–0.42; p-value of 0.65) (Figure 5). These relationships were only tested for the rustic plots because of the absence of native trees within the polyculture system. Within the rustic system, native tree density ranged from 0 to 331 trees per hectare, with a mean of 84 trees per hectare.
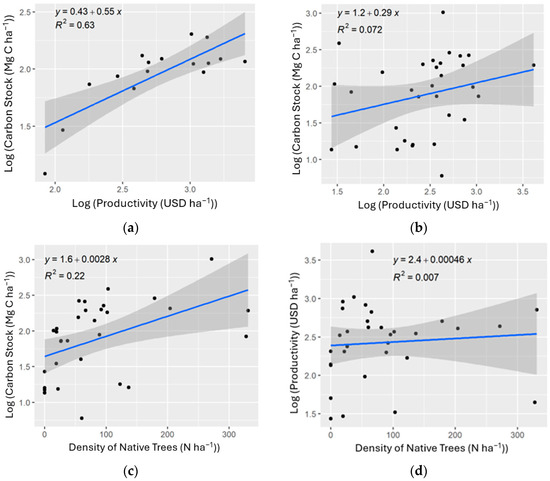
Figure 5.
Simple linear regressions of (a) log carbon stock against log productivity of the polyculture system; (b) log carbon stock against log productivity of the rustic system; (c) log carbon stock against native tree density of the rustic system; (d) log productivity against native tree density of the rustic system.
4. Discussion
4.1. Links Between Carbon Storage, Native Tree Density, and Productivity
The results of this study support our hypothesis that the primary forest stores more carbon in biomass than either the rustic or polyculture agroforestry systems. This agrees with the conclusions of a global review by Abbas et al. [102] that agroforestry stores less carbon in both biomass and soils than natural forests. Similarly, a review of the ecosystem services provided by cacao farming found natural forests to sequester more carbon than either agroforestry or monocultures [103]. Consequently, our study highlights how the preservation of primary forests should remain a top priority for climate change mitigation within Bali and across the world.
Our hypothesis that the rustic system would store more carbon in biomass than the polyculture system is not supported by the results of this study as the difference between the two systems was found to be statistically insignificant. The carbon storage in the biomass of the rustic system was found to be far more variable than that of the polyculture system, with some rustic plots storing large quantities far in excess of any of the polyculture plots. This likely stems from the overwhelming contribution to carbon storage in the rustic system of the largest trees. Because so much of the carbon stored within the rustic system is concentrated in a small number of trees, and because these trees are not evenly distributed amongst plots and over the whole community forest, the carbon storage varies considerably between plots. The carbon within the polyculture system, in contrast, was more evenly distributed amongst diameter classes.
As well as being concentrated in the largest trees, the carbon stored in the rustic system is primarily found in the native trees. This makes sense as the largest trees present in the rustic system within our study area were all native. Within the rustic system, it seems that a high level of carbon storage in biomass can be maintained if the largest native trees are preserved upon conversion from forest, or as the system is intensified. A similar conclusion was reached by Schroth et al. [38], who found that the traditional cacao agroforests of Brazil can be intensified without significantly affecting their carbon storage as long as the largest trees are preserved.
The hypothesis that the native tree density and carbon storage of the rustic system are positively correlated is supported by the results of this study. A review by Obeng and Aguilar [103] reported that carbon storage in cacao agroforests has been indicated to be correlated with the presence of certain tree species and large diameter classes rather than tree density. Likewise, Magne et al. [104] found the carbon storage of cacao agroforests in Cameroon to be positively correlated with the density of large (>30 cm diameter) trees, but neither this study, nor the review, specifically mention native trees. Our results add to this research, as they suggest a positive correlation between native tree density and carbon storage in the biomass of agroforestry systems. We believe this correlation is due to the larger size and older age of the native trees as compared to the cropping trees. Cropping trees tend to grow to smaller, more manageable sizes than those of unmanaged, native trees.
Our results do not support the hypothesis that the productivity and carbon storage of the rustic system are negatively correlated, nor the hypothesis that the productivity and density of native trees within the rustic system are negatively correlated. We found only insignificant correlations between these variables. This suggests that for rustic agroforestry, at least within our study area, the carbon storage in the biomass of the system can be increased without a concomitant decrease in productivity. While our study has shown that the majority of the carbon in the biomass of these systems is found in the large, but unproductive, native trees, the presence of these trees within a plot does not seem to negatively affect the productivity of said plot. Without the presence of other factors, it would seem reasonable to assume that a competition for light and resources between crops and native trees would lead to a decrease in productivity upon an increase in native tree density, but our results do not support this. What these factors are is outside the scope of this study but might include nutrient cycling and a beneficial amount of shade cover; further investigation of this question could prove beneficial for maximising the productivity of the rustic system without a sacrifice in carbon storage. Furthermore, it can be assumed that a density of native trees higher than what is covered in this study will eventually lead to a decrease in productivity as there becomes less and less space for crops in between the native trees. So, further studies on the relationship between native tree density and productivity could locate a ‘sweet spot’ of native tree density where carbon storage is high, but productivity has not yet decreased.
Finally, we hypothesised that the carbon storage in biomass and the productivity of the polyculture system would be positively correlated with each other, and this is strongly supported by the results of this study. More than half of the carbon in the biomass of these systems is stored in clove trees, which constitute the canopy (along with coconut trees) of these systems. Clove is also the most productive crop grown within our study area [55], and so it makes sense that plots with large clove trees would both store large amounts of carbon and be highly productive. One factor that was not considered in our study is the age of the plots. It could be that older polyculture plots have larger trees and are thus more productive and store more carbon. Further study into the contribution of age to the carbon storage and productivity of the polyculture system, along with investigating any other potential factors behind the observed correlation, could be useful to inform recommendations to agroforestry practitioners that would maximise productivity and carbon storage together. These other factors could include specific crop combinations or shade cover.
4.2. Comparison with Other Sites in Indonesia
Our value of average carbon storage in polyculture agroforestry systems is comparable to those from similar agroforestry systems in Indonesia. Wiryono et al. [105] found an average AGB value of 87.1 Mg C ha−1 in home garden systems in Bengkulu province, Sumatra, which when adjusted using the same root-to-shoot ratio as used in this study, results in a mean value of carbon in the living biomass of 119.19 Mg C ha−1, 13% larger than the average value for the polyculture system found in this study. For home gardens in another village in Bengkulu, Wiryono et al. [106] calculated an average carbon storage in the living biomass of 95.2 Mg C ha−1, 9% smaller than our figure.
In a study using satellite data to estimate the changes in carbon storage following the designation of a community forest in Gunung Kidul, Java, Sadono et al. [107] found AGB values increased by more than 100% compared to a baseline set immediately after illegal logging had started in the area. When converted using the root-to-shoot ratio used in this study, the average biomass in carbon of this community forest was estimated at 115.7 Mg C ha−1, 20% less than the average carbon storage we have estimated for the community forest in this study. These estimates, however, were found using very different methodologies; Sadono et al. [107] used satellite data and national average carbon storage values for different land cover classes, rather than directly measuring tree diameters and making use of allometric equations, as was performed in this study.
The value of average carbon storage in the biomass of the primary forest in our study area falls slightly above the average for intact forests in Kalimantan as estimated using LiDAR sampling [108]. When adjusting the figures from Ferraz et al. [108] using a root-to-shoot ratio of 1.37 and a carbon fraction of 0.5, the average carbon storage in the biomass of intact forests in Kalimantan, as estimated using lidar, is 264.9 Mg C ha−1, 5% less than the figure we obtained in Bali using diameter measurements and allometric equations. Overall, the values of carbon storage in biomass found for the two agroforestry treatments and the primary forest in this study are all comparable to other studies of similar systems in Indonesia, even where methodology differed.
4.3. Limitations
The largest sources of error in this study are likely to stem from the allometric equations used to estimate AGB and the measurements of plot area. Without the use of destructive sampling, some uncertainty in biomass estimates is inevitable [68]. This error was likely increased by the use in this study of allometric equations outside of their intended ranges—diameter, region, and habitat. This was necessitated by the paucity of allometric equations derived for the context of agroforestry within Southeast Asia, and the logistical impossibility of deriving our own equations for this study. That said, it is a common practice to use stand-level averages when species-level averages are not available [70]. More studies are needed to extend the database of allometric equations available. Plot boundaries were followed in this study using GPS on smartphones, which are typically accurate to around 5 m [109]. While the total carbon of most plots was unlikely to be strongly affected because of the outsized impact of large trees on carbon storage and the low density of these trees, the plot area of individual plots could have been affected greatly by errors in GPS measurements. These errors have led to uncertainties in the carbon storage per hectare of each plot.
Another important limitation to consider across all the results of this study is that only the carbon within the biomass of large, living trees and shrubs was estimated. The carbon found in dead material is unlikely to be substantial; Ayala-Montejo et al. [110] found litter fall and mulch to store between 1.9 and 9.4% of the carbon found in living biomass in the coffee agroforestry systems within their study, while Andrade and Zapata [111] found dead material to store between 1 and 6% of the total carbon of coffee agroforestry systems in Colombia. Similarly, the carbon in the living biomass of the herbaceous layer is small compared to that within the large trees and shrubs; an estimation of the carbon in the understorey of a temperate agroforestry system in the UK found the understorey to contain 8.5% of the total carbon in the living biomass of the system [112]. Within a tropical agroforestry system, this is likely to be even lower; Hardiwinoto and Rahayu [67] found understorey vegetation to store between 0 and 5% of the total carbon (including soil organic carbon (SOC)) stored in different agroforestry practises in Central Java, Indonesia. However, the carbon in soil is likely to make a far more considerable contribution to the total carbon of an agroforestry system; Ayala-Montejo et al. [110] found SOC to contribute 60 to 80% of the total carbon within an agroforestry system, and Andrade and Zapata [111] found 75% of the total carbon in agroforestry to be stored in the soil. So, it is likely that a considerable amount of carbon is stored within the soils of our study area and that this may counteract or add to the trends observed in this study if total carbon storage were to be measured, instead of solely the carbon in biomass.
4.4. Recommendations for Management
Notwithstanding the previously mentioned limitations, some tentative recommendations to improve the carbon storage of the agroforestry systems within our study area can be made. As the rustic system stores a highly variable amount of carbon, it is likely that some plots within the community forest could store significantly more carbon if changes were made. Most important is the preservation of large native trees, and the carbon storage of the system might be significantly increased if the planting of native trees were encouraged by the managing authority and these trees were allowed to grow to a large size. If the density of native trees within the rustic system in the community forest were increased, it is likely that the average carbon storage would then be significantly higher than that of the nearby polyculture system, and our study shows that this should be possible without a consequent decrease in productivity. Some areas of the community forest would be particularly suitable for this, as large trees are completely absent in some plots. These plots could store significantly more carbon if trees were planted and allowed to grow to a large size. While native trees would be an ideal choice for both carbon storage and biodiversity conservation, large crop trees such as clove trees could also increase carbon storage, along with productivity.
5. Conclusions
In this study, we estimated the carbon storage in the biomass of two agroforestry systems in Bali and compared them to a nearby primary forest. We found the primary forest to store significantly more carbon than either of the agroforestry treatments, which were not significantly different from each other. While the polyculture system stored relatively similar amounts of carbon across our study area, the rustic system proved to be highly variable. This variation was likely caused by an uneven distribution of large native trees. Most of the carbon in the biomass of the rustic system was found in large trees and in native trees, rather than in crops.
We also found that the productivity and carbon storage of the polyculture system were positively correlated with each other. The rustic system, in contrast, showed no significant correlation between productivity and carbon storage. This has positive implications for the climate mitigation potential of agroforestry systems as it suggests that the carbon storage of mixed agroforestry systems can be improved by increasing native tree density without sacrificing productivity, and hence without reducing the socio-economic benefits of agroforestry. Indeed, in some cases, productivity and carbon storage can be increased together. Further investigation of the causes behind this, along with methods to increase carbon storage and productivity simultaneously, could help to improve the multi-faceted benefits that agroforestry can provide to farmers and the global community.
Author Contributions
Conceptualization, L.A. and M.C.; methodology, L.A., S.M., D.K.T.S. and M.C.; software, L.A. and M.C.; validation, L.A. and M.C.; formal analysis, L.A. and M.C.; investigation, L.A., S.M., V.J., I.M.S., M.D.S., M.S., Z.A.W. and D.K.T.S.; resources, I.M.S., M.D.S., M.S., Z.A.W., D.K.T.S. and M.C.; data curation, L.A.; writing—original draft preparation, L.A.; writing—review and editing, S.M., V.J., I.M.S., M.D.S., M.S., Z.A.W., D.K.T.S. and M.C.; visualisation, L.A. and M.C.; supervision, M.C.; project administration, M.C.; funding acquisition, M.C. All authors have read and agreed to the published version of the manuscript.
Funding
This research was funded by the Oxford Brookes University HLS Developing Potential Research Excellence Award, Rolling Impact Development Award, Nigel Groome Studentship, and Turing Scheme.
Data Availability Statement
The data presented in this study are available on request from the corresponding author.
Acknowledgments
We thank Indonesia’s National Research and Innovation Agency in Jakarta (BRIN) for authorising this study. We thank colleagues at Universitas Warmadewa for facilitating this study.
Conflicts of Interest
The authors declare no conflicts of interest. The funders had no role in the design of this study; in the collection, analyses, or interpretation of data; in the writing of the manuscript; or in the decision to publish the results.
Appendix A
Table A1.
The local, English, and Latin plant names used in this study, along with the native/crop status of each plant.
Table A1.
The local, English, and Latin plant names used in this study, along with the native/crop status of each plant.
| Local Name(s) | English Name | Latin Name | Crop or Native |
|---|---|---|---|
| Alpukat | Avocado | Persea americana | C |
| Andong | Ti plant | Cordyline fruticosa | C |
| Batu | Bornean ironwood | Eusideroxylon zwageri | N |
| Bayur | Pterospermum javanicum | N | |
| Benda/Taap | Terap | Artocarpus elasticus | N |
| Besi-besi | Mallotus molissimus | N | |
| Blandingan/Lamtoro | Jumbay | Leucaena leucocephala | C |
| Bling-bing | Averrhoa racemosa | N | |
| Bungkak-bungkak | Unidentified | Unidentified | N |
| Bunut kuning | White fig | Ficus virens | N |
| Camboja | Plumeria sp. | C | |
| Cemera pandak | Coastal she-oak | Casuarina equisetifolia | N |
| Cempaga | Dysoxylum sp. | N | |
| Cengkeh | Clove | Syzygium aromaticum | C |
| Dadap | Tiger’s claw | Erythrina variegata | C |
| Dao | Argus pheasant-tree | Dracontomelon dao | N |
| Duku | Langsat | Lansium domesticum | C |
| Durian | Durian | Durio sp. | C |
| Gamal | Mother of cocoa | Gliricidia sepium | C |
| Genitri | Utrasum bean tree | Elaeocarpus angustifolius | N |
| Gmelina | Gmelina sp. | N | |
| Iseh | Unidentified | Unidentified | N |
| Jabon | Burflower-tree | Neolamarckia cadamba | N |
| Jambu | Guava | Psidium guajava | C |
| Jati | Teak | Tectona grandis | C |
| Jelema | Forest nutmeg | Knema cinerea | N |
| Jeruk | Orange | Citrus × sinensis | C |
| Jimas | Duabanga moluccana | N | |
| Juet | Malabar plum | Syzygium cumini | C |
| Kaik-kaik/Ket-ket | Unidentified | Unidentified | N |
| Kakao | Cacao | Theobroma cacao | C |
| Katulampa | Elaeocarpus glaber | N | |
| Kayu batu/Suluh | Aegiphila martinicensis | N | |
| Kayu belang | Pterospermum sp. | N | |
| Kayu jelema | Knema laurina | N | |
| Kelapa | Coconut | Cocos nucifera | C |
| Kelor | Drumstick tree | Moringa oleifera | C |
| Kenanga | Ylang-ylang | Cananga odorata | N |
| Kepuh | Bastard poon tree | Sterculia foetida | N |
| Kepundung | Baccaurea racemosa | N | |
| Kopi | Coffee | Coffea canephora | C |
| Kwanitan | Dysoxylum sp. | N | |
| Lateng | Stinging tree | Dendrocnide sinuata—many different species are referred to as ‘lateng’ or ‘jelateng’, but only D. sinuata grows to tree size | N |
| Loa/Mabi | Cluster fig | Ficus racemosa | N |
| Mahoni | Mahogany | Swietonia mahagoni | N |
| Mancitan | Unidentified | Unidentified | N |
| Mangga hutan | Forest mango | Mangifera laurina | N |
| Manggis | Mangosteen | Garcinia mangostana | C |
| Nangka | Jackfruit | Artocarpus heterophyllus | C |
| Nyam | Styrax tonkinensis | N | |
| Nyatuh | Palaquium rostratum | N | |
| Pala | Nutmeg | Myristica fragrans | C |
| Palabuah | Dysoxylum sp. | N | |
| Pamor-pamor | Unidentified | Unidentified | N |
| Peji | Pinanga coronata | C | |
| Pepaya | Papaya | Carica papaya | C |
| Pete | Bitter bean | Parkia speciosa | C |
| Pinang | Betel nut tree | Areca catechu | C |
| Pisang | Banana | Musa sp. | C |
| Pradah | Unidentified | Unidentified | N |
| Puyung-puyung | Unidentified | Unidentified | N |
| Rambutan | Rambutan | Nephelium lappaceum | C |
| Sarai/Uduh | Fishtail palm | Caryota mitis | C |
| Sengon | Moluccan albizia | Paraserianthes falcataria (syn. Falcataria falcata) | N |
| Sirsak | Soursop | Annona muricata | C |
| Suren | Indian mahogany | Toona ciliata | N |
| Tangi | Crape myrtle | Lagerstroemia indica | N |
| Temen | Graptophyllum pictum | N | |
| Uyah/Uyah-uyah | Oakleaf fig | Ficus montana | N |
| Wani | White mango | Mangifera caesia | N |
| Waru | Sea hibiscus | Hibiscus tiliaceus | N |
| Yeh-yeh | Oreocnide integrifolia | N |
References
- Agache, I.; Sampath, V.; Aguilera, J.; Akdis, C.; Akdis, M.; Barry, M.; Bouagnon, A.; Chinthrajah, S.; Collins, W.; Dulitzki, C.; et al. Climate change and global health: A call to more research and more action. Allergy 2022, 77, 1389–1407. [Google Scholar] [CrossRef] [PubMed]
- Liu, F.X.; Chang-Richards, A.; Wang, K.I.K.; Dirks, K.N. Effects of climate change on health and wellbeing: A systematic review. Sustain. Dev. 2023, 31, 2067–2090. [Google Scholar] [CrossRef]
- Walinski, A.; Sander, J.; Gerlinger, G.; Clemens, V.; Meyer-Lindenberg, A.; Heinz, A. The Effects of Climate Change on Mental Health. Dtsch. Arztebl. Int. 2023, 120, 117. [Google Scholar] [CrossRef]
- Bellard, C.; Bertelsmeier, C.; Leadley, P.; Thuiller, W.; Courchamp, F. Impacts of climate change on the future of biodiversity. Ecol. Lett. 2012, 15, 365–377. [Google Scholar] [CrossRef] [PubMed]
- Habib-ur-Rahman, M.; Ahmad, A.; Raza, A.; Hasnain, M.U.; Alharby, H.F.; Alzahrani, Y.M.; Bamagoos, A.A.; Hakeem, K.R.; Ahmad, S.; Nasim, W.; et al. Impact of climate change on agricultural production; Issues, challenges, and opportunities in Asia. Front. Plant Sci. 2022, 13, 925548. [Google Scholar] [CrossRef] [PubMed]
- Lesk, C.; Anderson, W.; Rigden, A.; Coast, O.; Jaegermeyr, J.; McDermid, S.; Davis, K.F.; Konar, M. Compound heat and moisture extreme impacts on global crop yields under climate change. Nat. Rev. Earth Environ. 2022, 3, 872–889. [Google Scholar] [CrossRef]
- Malhi, G.S.; Kaur, M.; Kaushik, P. Impact of Climate Change on Agriculture and Its Mitigation Strategies: A Review. Sustainability 2021, 13, 1318. [Google Scholar] [CrossRef]
- Singh, B.K.; Delgado-Baquerizo, M.; Egidi, E.; Guirado, E.; Leach, J.E.; Liu, H.W.; Trivedi, P. Climate change impacts on plant pathogens, food security and paths forward. Nat. Rev. Microbiol. 2023, 21, 640–656. [Google Scholar] [CrossRef]
- Trew, B.T.; Maclean, I.M.D. Vulnerability of global biodiversity hotspots to climate change. Glob. Ecol. Biogeogr. 2021, 30, 768–783. [Google Scholar] [CrossRef]
- Urban, M.C. Accelerating extinction risk from climate change. Science 2015, 348, 571–573. [Google Scholar] [CrossRef]
- Harvey, J.A.; Tougeron, K.; Gols, R.; Heinen, R.; Abarca, M.; Abram, P.K.; Basset, Y.; Berg, M.; Boggs, C.; Brodeur, J.; et al. Scientists’ warning on climate change and insects. Ecol. Monogr. 2023, 93, e1553. [Google Scholar] [CrossRef]
- Raven, P.H.; Wagner, D.L. Agricultural intensification and climate change are rapidly decreasing insect biodiversity. Proc. Natl. Acad. Sci. USA 2021, 118, e2002548117. [Google Scholar] [CrossRef] [PubMed]
- McQuaid, C.D. Understanding the effects of climate change on Southern Ocean ecosystems. Afr. J. Mar. Sci. 2023, 45, 155–163. [Google Scholar] [CrossRef]
- Kemp, L.; Xu, C.; Depledge, J.; Ebi, K.L.; Gibbins, G.; Kohler, T.A.; Rockström, J.; Scheffer, M.; Schellnhuber, H.J.; Steffen, W. Climate Endgame: Exploring catastrophic climate change scenarios. Proc. Natl. Acad. Sci. USA 2022, 119, e2108146119. [Google Scholar] [CrossRef] [PubMed]
- Vijayavenkataraman, S.; Iniyan, S.; Goic, R. A review of climate change, mitigation and adaptation. Renew. Sust. Energy Rev. 2012, 16, 878–897. [Google Scholar] [CrossRef]
- Bruce, J.P.; Frome, M.; Haites, E.; Janzen, H.; Lal, R.; Paustian, K. Carbon sequestration in soils. J. Soil. Water Conserv. 1999, 54, 382–389. [Google Scholar]
- Fawzy, S.; Osman, A.I.; Doran, J.; Rooney, D.W. Strategies for mitigation of climate change: A review. Environ. Chem. Lett. 2020, 18, 2069–2094. [Google Scholar] [CrossRef]
- Shukla, P.R.; Skeg, J.; Buendia, E.C.; Masson-Delmotte, V.; Pörtner, H.-O.; Roberts, D.; Zhai, P.; Slade, R.; Connors, S.; Van Diemen, S. Climate Change and Land: An IPCC Special Report on Climate Change, Desertification, Land Degradation, Sustainable Land Management, Food Security, and Greenhouse Gas Fluxes in Terrestrial Ecosystems; IPCC: Geneva, Switzerland, 2019. [Google Scholar]
- UNFCCC. Kyoto Protocol to the United Nations Framework Convention on Climate Change. 1997. Available online: https://unfccc.int/sites/default/files/resource/docs/cop3/l07a01.pdf (accessed on 20 October 2024).
- Keith, H.; Mackey, B.G.; Lindenmayer, D.B. Re-evaluation of forest biomass carbon stocks and lessons from the world’s most carbon-dense forests. Proc. Natl. Acad. Sci. USA 2009, 106, 11635–11640. [Google Scholar] [CrossRef] [PubMed]
- Curtis, P.G.; Slay, C.M.; Harris, N.L.; Tyukavina, A.; Hansen, M.C. Classifying drivers of global forest loss. Science 2018, 361, 1108–1111. [Google Scholar] [CrossRef] [PubMed]
- Albrecht, A.; Kandji, S.T. Carbon sequestration in tropical agroforestry systems. Agric. Ecosyst. Environ. 2003, 99, 15–27. [Google Scholar] [CrossRef]
- Cardinael, R.; Umulisa, V.; Toudert, A.; Olivier, A.; Bockel, L.; Bernoux, M. Revisiting IPCC Tier 1 coefficients for soil organic and biomass carbon storage in agroforestry systems. Environ. Res. Lett. 2018, 13, 124020. [Google Scholar] [CrossRef]
- Gupta, R.K.; Kumar, V.; Sharma, K.; Buttar, T.S.; Singh, G.; Mir, G. Carbon sequestration potential through agroforestry: A review. Int. J. Curr. Microbiol. Appl. Sci. 2017, 6, 211–220. [Google Scholar] [CrossRef]
- Jose, S.; Bardhan, S. Agroforestry for biomass production and carbon sequestration: An overview. Agrofor. Syst. 2012, 86, 105–111. [Google Scholar] [CrossRef]
- Ruark, G.; Schoeneberger, M.; Nair, P. Agroforestry–Helping to Achieve Sustainable Forest Management. In The Role of Planted Forests in Sustainable Forest Management: Reports and Papers of the United Nations Forum on Forests Intersessional Experts Meeting; United Nations: New York, NY, USA, 2003. [Google Scholar]
- van Noordwijk, M.; Coe, R.; Sinclair, F.L.; Luedeling, E.; Bayala, J.; Muthuri, C.W.; Cooper, P.; Kindt, R.; Duguma, L.; Lamanna, C.; et al. Climate change adaptation in and through agroforestry: Four decades of research initiated by Peter Huxley. Mitig. Adapt. Strateg. Glob. Chang. 2021, 26, 18. [Google Scholar] [CrossRef]
- Gordon, A. Temperate Agroforestry Systems, 2nd ed.; CAB International: Wallingford, UK, 2018. [Google Scholar]
- Torquebiau, E.F. A renewed perspective on agroforestry concepts and classification. Comptes Rendus L’académie Sci. Ser. III Sci. La Vie 2000, 323, 1009–1017. [Google Scholar] [CrossRef] [PubMed]
- Jose, S. Agroforestry for ecosystem services and environmental benefits: An overview. Agrofor. Syst. 2009, 76, 1–10. [Google Scholar] [CrossRef]
- Kirby, K.R.; Potvin, C. Variation in carbon storage among tree species: Implications for the management of a small-scale carbon sink project. For. Ecol. Manag. 2007, 246, 208–221. [Google Scholar] [CrossRef]
- Poorter, L.; van der Sande, M.T.; Thompson, J.; Arets, E.J.; Alarcón, A.; Álvarez-Sánchez, J.; Ascarrunz, N.; Balvanera, P.; Barajas-Guzmán, G.; Boit, A.; et al. Diversity enhances carbon storage in tropical forests. Glob. Ecol. Biogeogr. 2015, 24, 1314–1328. [Google Scholar] [CrossRef]
- Cristóbal-Acevedo, D.; Tinoco-Rueda, J.A.; Prado-Hernandez, J.V.; Hernández-Acosta, E. Soil carbon and nitrogen in tropical montane cloud forest, agroforestry and coffee monoculture systems. Rev. Chapingo Ser. Cienc. For. Ambiente 2019, 25, 169–184. [Google Scholar]
- De Beenhouwer, M.; Geeraert, L.; Mertens, J.; Van Geel, M.; Aerts, R.; Vanderhaegen, K.; Honnay, O. Biodiversity and carbon storage co-benefits of coffee agroforestry across a gradient of increasing management intensity in the SW Ethiopian highlands. Agric. Ecosyst. Environ. 2016, 222, 193–199. [Google Scholar] [CrossRef]
- Tadesse, G.; Zavaleta, E.; Shennan, C. Effects of land-use changes on woody species distribution and above-ground carbon storage of forest-coffee systems. Agric. Ecosyst. Environ. 2014, 197, 21–30. [Google Scholar] [CrossRef]
- Toru, T.; Kibret, K. Carbon stock under major land use/land cover types of Hades sub-watershed, eastern Ethiopia. Carbon Balance Manag. 2019, 14, 7. [Google Scholar] [CrossRef] [PubMed]
- Guillemot, J.; le Maire, G.; Munishamappa, M.; Charbonnier, F.; Vaast, P. Native coffee agroforestry in the Western Ghats of India maintains higher carbon storage and tree diversity compared to exotic agroforestry. Agric. Ecosyst. Environ. 2018, 265, 461–469. [Google Scholar] [CrossRef]
- Schroth, G.; Bede, L.C.; Paiva, A.O.; Cassano, C.R.; Amorim, A.M.; Faria, D.; Mariano-Neto, E.; Martini, A.M.; Sambuichi, R.H.; Lôbo, R.N. Contribution of agroforests to landscape carbon storage. Mitig. Adapt. Strateg. Glob. Chang. 2015, 20, 1175–1190. [Google Scholar] [CrossRef]
- Middendorp, R.S.; Vanacker, V.; Lambin, E.F. Impacts of shaded agroforestry management on carbon sequestration, biodiversity and farmers income in cocoa production landscapes. Landsc. Ecol. 2018, 33, 1953–1974. [Google Scholar] [CrossRef]
- Bentrup, G.; Hopwood, J.; Adamson, N.L.; Vaughan, M. Temperate Agroforestry Systems and Insect Pollinators: A Review. Forests 2019, 10, 981. [Google Scholar] [CrossRef]
- Centeno-Alvarado, D.; Lopes, A.V.; Arnan, X. Fostering pollination through agroforestry: A global review. Agric. Ecosyst. Environ. 2023, 351, 108478. [Google Scholar] [CrossRef]
- Manson, S.; Nekaris, K.A.I.; Nijman, V.; Campera, M. Effect of shade on biodiversity within coffee farms: A meta-analysis. Sci. Total Environ. 2024, 914, 169882. [Google Scholar] [CrossRef]
- Quandt, A.; Neufeldt, H.; McCabe, J.T. The role of agroforestry in building livelihood resilience to floods and drought in semiarid Kenya. Ecol. Soc. 2017, 22, 10. [Google Scholar] [CrossRef]
- Simelton, E.; Dam, B.V.; Catacutan, D. Trees and agroforestry for coping with extreme weather events: Experiences from northern and central Viet Nam. Agrofor. Syst. 2015, 89, 1065–1082. [Google Scholar] [CrossRef]
- Dollinger, J.; Jose, S. Agroforestry for soil health. Agrofor. Syst. 2018, 92, 213–219. [Google Scholar] [CrossRef]
- Manson, S.; Nekaris, K.A.I.; Rendell, A.; Budiadi, B.; Imron, M.A.; Campera, M. Agrochemicals and shade complexity affect soil quality in coffee home gardens. Earth 2022, 3, 853–865. [Google Scholar] [CrossRef]
- Lehmann, L.M.; Smith, J.; Westaway, S.; Pisanelli, A.; Russo, G.; Borek, R.; Sandor, M.; Gliga, A.; Smith, L.; Ghaley, B.B. Productivity and economic evaluation of agroforestry systems for sustainable production of food and non-food products. Sustainability 2020, 12, 5429. [Google Scholar] [CrossRef]
- Steffan-Dewenter, I.; Kessler, M.; Barkmann, J.; Bos, M.M.; Buchori, D.; Erasmi, S.; Faust, H.; Gerold, G.; Glenk, K.; Gradstein, S.R. Tradeoffs between income, biodiversity, and ecosystem functioning during tropical rainforest conversion and agroforestry intensification. Proc. Natl. Acad. Sci. USA 2007, 104, 4973–4978. [Google Scholar] [CrossRef] [PubMed]
- Bisseleua, D.; Missoup, A.D.; Vidal, S. Biodiversity conservation, ecosystem functioning, and economic incentives under cocoa agroforestry intensification. Conserv. Biol. 2009, 23, 1176–1184. [Google Scholar] [CrossRef]
- Quinion, A.; Chirwa, P.W.; Akinnifesi, F.K.; Ajayi, O.C. Do agroforestry technologies improve the livelihoods of the resource poor farmers? Evidence from Kasungu and Machinga districts of Malawi. Agrofor. Syst. 2010, 80, 457–465. [Google Scholar] [CrossRef]
- Parikesit; Withaningsih, S.; Rozi, F. Socio-ecological dimensions of agroforestry called kebun campuran in tropical karst ecosystem of West Java, Indonesia. Biodiversitas 2020, 22, 122–131. [Google Scholar] [CrossRef]
- Nöldeke, B.; Winter, E.; Laumonier, Y.; Simamora, T. Simulating Agroforestry Adoption in Rural Indonesia: The Potential of Trees on Farms for Livelihoods and Environment. Land 2021, 10, 385. [Google Scholar] [CrossRef]
- Escobar-López, A.; Castillo-Santiago, M.Á.; Mas, J.F.; Hernández-Stefanoni, J.L.; López-Martínez, J.O. Identification of coffee agroforestry systems using remote sensing data: A review of methods and sensor data. Geocarto Int. 2024, 39, 2297555. [Google Scholar] [CrossRef]
- Sinaga, T.P.; Nugroho, A.; Lee, Y.-W.; Suh, Y. GIS mapping of tsunami vulnerability: Case study of the Jembrana regency in Bali, Indonesia. KSCE J. Civil. Eng. 2011, 15, 537–543. [Google Scholar] [CrossRef]
- Campera, M.; Chavez, J.; Humber, C.; Jain, V.; Cioci, H.; Aulia, F.; Alua, K.A.; Prawerti, D.A.D.; Ali, S.R.R.; Swastika, I.W.; et al. Impact of Cropland Management on Invertebrate Richness and Abundance in Agroforestry Systems in Bali, Indonesia. Land 2024, 13, 493. [Google Scholar] [CrossRef]
- Google Maps. Bali, Indonesia. Available online: http://maps.google.co.uk (accessed on 29 August 2024).
- Chavez, J.; Nijman, V.; Sukmadewi, D.K.T.; Sadnyana, M.D.; Manson, S.; Campera, M. Impact of Farm Management on Soil Fertility in Agroforestry Systems in Bali, Indonesia. Sustainability 2024, 16, 7874. [Google Scholar] [CrossRef]
- Avenza Systems. Avenza. Available online: https://www.avenza.com/ (accessed on 7 August 2024).
- Moguel, P.; Toledo, V.M. Biodiversity Conservation in Traditional Coffee Systems of Mexico. Conserv. Biol. 1999, 13, 11–21. [Google Scholar] [CrossRef]
- Elevitch, C.R.; Mazaroli, D.N.; Ragone, D. Agroforestry Standards for Regenerative Agriculture. Sustainability 2018, 10, 3337. [Google Scholar] [CrossRef]
- Google LLC. Google Earth 10.59.0.2. Available online: https://earth.google.com (accessed on 8 August 2024).
- Chemeda, B.A.; Wakjira, F.S.; Hizikias, E.B. Tree diversity and biomass carbon stock analysis along altitudinal gradients in coffee-based agroforestry system of Western Ethiopia. Cogent Food Agric. 2022, 8, 2123767. [Google Scholar] [CrossRef]
- Dossa, E.L.; Fernandes, E.C.M.; Reid, W.S.; Ezui, K. Above- and belowground biomass, nutrient and carbon stocks contrasting an open-grown and a shaded coffee plantation. Agrofor. Syst. 2008, 72, 103–117. [Google Scholar] [CrossRef]
- Goncalves, N.; Andrade, D.; Batista, A.; Cullen, L.; Souza, A.; Gomes, H.; Uezu, A. Potential economic impact of carbon sequestration in coffee agroforestry systems. Agrofor. Syst. 2021, 95, 419–430. [Google Scholar] [CrossRef]
- Mellisse, B.T.; Tolera, M.; Derese, A. Traditional homegardens change to perennial monocropping of khat (Catha edulis) reduced woody species and enset conservation and climate change mitigation potentials of the Wondo Genet landscape of southern Ethiopia. Heliyon 2024, 10, e23631. [Google Scholar] [CrossRef] [PubMed]
- van Rikxoort, H.; Schroth, G.; Läderach, P.; Rodríguez-Sánchez, B. Carbon footprints and carbon stocks reveal climate-friendly coffee production. Agron. Sust. Dev. 2014, 34, 887–897. [Google Scholar] [CrossRef]
- Hardiwinoto, S.; Rahayu, S. Carbon stock potential at several agarwood-based agroforestry practices in Sragen and Karanganyar, Central Java. IOP Conf. Ser. Earth Environ. Sci. 2020, 449, 012030. [Google Scholar]
- Hairiah, K.; Sitompul, S.M.; Van Noordwijk, M.; Palm, C. Methods for Sampling Carbon Stocks Above and Below Ground; World Agroforestry Centre (ICRAF) SEA Regional Office: Bogor, Indonesia, 2001. [Google Scholar]
- Magarik, Y.A.; Roman, L.A.; Henning, J.G. How should we measure the DBH of multi-stemmed urban trees? Urban For. Urban Green. 2020, 47, 126481. [Google Scholar] [CrossRef]
- Chave, J.; Andalo, C.; Brown, S.; Cairns, M.A.; Chambers, J.Q.; Eamus, D.; Fölster, H.; Fromard, F.; Higuchi, N.; Kira, T. Tree allometry and improved estimation of carbon stocks and balance in tropical forests. Oecologia 2005, 145, 87–99. [Google Scholar] [CrossRef] [PubMed]
- Resolve. Ecoregions. 2017. Available online: https://ecoregions.appspot.com/ (accessed on 8 August 2024).
- Anitha, K.; Verchot, L.V.; Joseph, S.; Herold, M.; Manuri, S.; Avitabile, V. A review of forest and tree plantation biomass equations in Indonesia. Ann. For. Sci. 2015, 72, 981–997. [Google Scholar] [CrossRef]
- Henry, M.; Bombelli, A.; Trotta, C.; Alessandrini, A.; Birigazzi, L.; Sola, G.; Vieilledent, G.; Santenoise, P.; Longuetaud, F.; Valentini, R.; et al. GlobAllomeTree: International platform for tree allometric equations to support volume, biomass and carbon assessment. iForest 2013, 6, 326–330. [Google Scholar] [CrossRef]
- Prayogo, C.; Sari, R.R.; Asmara, D.H.; Rahayu, S.; Hairiah, K. Allometric equation for pinang (Areca catechu) biomass and C stocks. Agrivita 2018, 40, 381–389. [Google Scholar] [CrossRef]
- Santos Martin, F.; Navarro-Cerrillo, R.; Mulia, R.; Van Noordwijk, M. Allometric equations based on a fractal branching model for estimating aboveground biomass of four native tree species in the Philippines. Agrofor. Syst. 2010, 78, 193–202. [Google Scholar] [CrossRef]
- Brown, S. Estimating Biomass and Biomass Change of Tropical Forests: A Primer; Food & Agriculture Organization: Rome, Italy, 1997. [Google Scholar]
- Hairiah, K.; Dewi, S.; Agus, F.; Velarde, S.; Andree, E.; Rahayu, S.; van Noordwijk, M. Measuring Carbon Stocks Across Land Use Systems: A Manual; World Agroforestry Centre (ICRAF) SEA Regional Office: Bogor, Indonesia, 2011. [Google Scholar]
- Segura, M.; Kanninen, M.; Suárez, D. Allometric models for estimating aboveground biomass of shade trees and coffee bushes grown together. Agrofor. Syst. 2006, 68, 143–150. [Google Scholar] [CrossRef]
- Krisnawati, H.; Adinugroho, W.C.; Imanuddin, R. Allometric Models for Estimating Tree Biomass at Various Forest Ecosystem Types in Indonesia: Monograph; Wahyu Catur Adinugroho: Bogor, Indonesia, 2012. [Google Scholar]
- Dung, N.; Toai, P.; Hung, V.; Anh, L.; Khoa, P. Tree Allometric Equations in Evergreen Broadleaf and Bamboo Forests in the North Central Coastal Region, Viet Nam. In Tree Allometric Equation Development for Estimation of Forest Above-Ground Biomass in Viet Nam; Inoguchi, A., Sola, G., Henry, M., Birigazzi, L., Eds.; UN-REDD Programme: Hanoi, Vietnam, 2012; pp. 1–66. [Google Scholar]
- Rahutomo, A.B. Potensi Biomassa, Karbon dan Serapan Gas CO2 Jenis Gamal (Gliricidia sepium) Bagian Above Ground di Hutan Pendidikan Wanagama I, Yogakarta. Bachelor’s Thesis, Universitas Gadjah Mada, Yogyakarta, Indonesia, 2012. [Google Scholar]
- Agus, C.; Karyanto, O.; Hardiwinoto, S.; Na’iem, M.; Kita, S.; Haibara, K.; Toda, H. Biomass productivity and carbon stock in short rotation plantation of Gmelina arborea Roxb. in tropical forest. Indones. J. Agric. Sci. 2001, 1, 11–16. [Google Scholar]
- Micosa-Tandung, L. Biomass prediction equations for giant ipil-ipil (Leucaena leucocephala (Lam.) de Wit). Trans. Nat. Acad. Sci. Technol. 1987, 9, 243–263. [Google Scholar]
- Arifin, J. Estimasi Penyimpanan C Pada Berbagai Sistem Penggunaan Lahan di Kecamatan Ngantang, Malang, Jurusan Tanah, Fakultas Pertanian; Universitas Brawijaya: Malang, Indonesia, 2001; 61p. [Google Scholar]
- Hairiah, K.; Rahayu, S. Pengukuran Karbon Tersimpan di Berbagai Macam Penggunaan Lahan; World Agroforestry Centre: Bogor, Indonesia, 2007; p. 77. [Google Scholar]
- Kuyah, S.; Muthuri, C.; Wakaba, D.; Cyamweshi, A.R.; Kiprotich, P.; Mukuralinda, A. Allometric equations and carbon sequestration potential of mango (Mangifera indica) and avocado (Persea americana) in Kenya. Trees For. People 2024, 15, 100467. [Google Scholar] [CrossRef]
- Rodríguez-Laguna, R.; Jiménez-Pérez, J.; Meza-Rangel, J.; Aguirre-Calderón, O.; Razo-Zarate, R. Carbono contenido en un bosque tropical subcaducifolio en la reserva de la biosfera el cielo, Tamaulipas, México. Rev. Latinoam. Recur. Nat. 2008, 4, 215–222. [Google Scholar]
- Hung, N.D.; Giang, L.T.; Tu, D.N.; Hung, P.T.; Lam, P.T.; Khanh, N.T.; Thuy, H.M. Tree Allometric Equations in Evergreen Broadleaf and Bamboo Forests in the North East Region, Viet Nam. In Tree Allometric Equation Development for Estimation of Forest Above-Ground Biomass in Viet Nam; Inoguchi, A., Matieu, H., Birigazzi, L., Eds.; UN-REDD Programme: Hanoi, Vietnam, 2012. [Google Scholar]
- Badriyah, N. Penaksiran Potensi Kandungan Karbon Jenis Mahoni di Hutan Rakyat Desa Jatimulyo Kec. Jatipuro Kab. Karanganyar. Bachelor’s Thesis, Universitas Gadjah Mada, Yogyakarta, Indonesia, 2008. [Google Scholar]
- Aminudin, S. Kajian Potensi Cadangan Karbon Pada Pengusahaan Hutan Rakyat (Studi Kasus: Hutan Rakyat Desa Dengok, Kecamatan Playen, Kabupaten Gunungkidul). Master’s Thesis, IPB University, Bogor, Indonesia, 2008. [Google Scholar]
- Yuliasmara, F.; Wibawa, A.; Prawoto, A. Carbon stock in different ages and plantation system of cocoa: Allometric approach. Pelita Perkeb. 2009, 25, 175. [Google Scholar] [CrossRef]
- Sakman, E. Volume Tables for Forest Trees in Bangladesh. Field Document No. 34; Food and Agricultural Organisation of the United Nations, UNDP/FAO Project BGD/79/017: Dhaka, Bangladesh, 1983. [Google Scholar]
- Zanne, A.E.; Lopez-Gonzalez, G.; Coomes, D.A.; Ilic, J.; Jansen, S.; Lewis, S.L.; Miller, R.B.; Swenson, N.G.; Wiemann, M.C.; Chave, J. Towards a Worldwide Wood Economics Spectrum. Ecol. Lett. 2009, 12, 351–366. [Google Scholar]
- Tanabe, K.; Wagner, F. Good Practice Guidance for Land Use, Land-Use Change and Forestry; Institute for Global Environmental Strategies: Hayama, Japan, 2003. [Google Scholar]
- Nagar, B.; Rawat, S.; Pandey, R.; Kumar, M. Variation in specific gravity and carbon proportion of agroforestry tree species of Himalaya. Environ. Chall. 2021, 4, 100156. [Google Scholar] [CrossRef]
- Anna, N.; Karlinasari, L.; Sudrajat, D.J.; Siregar, I.Z. The growth, pilodyn penetration, and wood properties of 12 Neolamarckia cadamba provenances at 42 months old. Biodiversitas 2020, 21, d210332. [Google Scholar]
- van Noordwijk, M.; Rahayu, S.; Hairiah, K.; Wulan, Y.; Farida, A.; Verbist, B. Carbon stock assessment for a forest-to-coffee conversion landscape in Sumber-Jaya (Lampung, Indonesia): From allometric equations to land use change analysis. Sci. China C 2002, 45, 75–86. [Google Scholar]
- Eggleston, H.; Buendia, L.; Miwa, K.; Ngara, T.; Tanabe, K. 2006 IPCC Guidelines for National Greenhouse Gas Inventories; IPCC: Geneva, Switzerland, 2006. [Google Scholar]
- Houghton, J.; Meira Filho, L.; Lim, B.; Treanton, K.; Mamaty, I.; Bonduki, Y.; Griggs, D.; Callander, B. Revised 1996 intergovernmental panel on climate change guidelines for national greenhouse inventories. In Proceedings of the IPCC Expert Group Planning Meeting on the Elaboration of Good Practice Guidance in Land-Use Change and Forestry for the Revised 1996 IPCC Guidelines for National Greenhouse Gas Inventories, Geneva, Switzerland, 6–8 August 2001. [Google Scholar]
- R Core Team. R: A Language and Environment for Statistical Computing; R Foundation for Statistical Computing: Vienna, Austria, 2019. [Google Scholar]
- Kassambara, A. rstatix: Pipe-Friendly Framework for Basic Statistical Tests. 2023. Available online: https://rpkgs.datanovia.com/rstatix/ (accessed on 7 August 2024).
- Abbas, F.; Hammad, H.M.; Fahad, S.; Cerdà, A.; Rizwan, M.; Farhad, W.; Ehsan, S.; Bakhat, H.F. Agroforestry: A sustainable environmental practice for carbon sequestration under the climate change scenarios—A review. Environ. Sci. Pollut. Res. 2017, 24, 11177–11191. [Google Scholar] [CrossRef] [PubMed]
- Obeng, E.A.; Aguilar, F.X. Marginal effects on biodiversity, carbon sequestration and nutrient cycling of transitions from tropical forests to cacao farming systems. Agrofor. Syst. 2015, 89, 19–35. [Google Scholar] [CrossRef]
- Magne, A.N.; Nonga, N.E.; Yemefack, M.; Robiglio, V. Profitability and implications of cocoa intensification on carbon emissions in Southern Cameroun. Agrofor. Syst. 2014, 88, 1133–1142. [Google Scholar] [CrossRef]
- Wiryono; Kristiansen, P.; Lobry De Bruyn, L.; Nurliana, S. Ecosystem services provided by agroforestry home gardens in Bengkulu, Indonesia: Smallholder utilization, biodiversity conservation, and carbon storage. Biodiversitas 2023, 24, 2657–2665. [Google Scholar] [CrossRef]
- Wiryono; Puteri, V.N.U.; Senoaji, G. The diversity of plant species, the types of plant uses and the estimate of carbon stock in agroforestry system in Harapan Makmur Village, Bengkulu, Indonesia. Biodiversitas 2016, 17, d170136. [Google Scholar] [CrossRef]
- Sadono, R.; Pujiono, E.; Lestari, L. Land cover changes and carbon storage before and after community forestry program in Bleberan village, Gunungkidul, Indonesia, 1999–2018. For. Sci. Technol. 2020, 16, 134–144. [Google Scholar] [CrossRef]
- Ferraz, A.; Saatchi, S.; Xu, L.; Hagen, S.; Chave, J.; Yu, Y.; Meyer, V.; Garcia, M.; Silva, C.; Roswintiart, O. Carbon storage potential in degraded forests of Kalimantan, Indonesia. Environ. Res. Lett. 2018, 13, 095001. [Google Scholar] [CrossRef]
- Van Diggelen, F.; Enge, P. The World’s First GPS MOOC and Worldwide Laboratory Using Smartphones. In Proceedings of the 28th International Technical Meeting of the Satellite Division of the Institute of Navigation (ION GNSS+ 2015), Tampa, FL, USA, 14–18 September 2015. [Google Scholar]
- Ayala-Montejo, D.; Valdés-Velarde, E.; Benedicto-Valdés, G.S.; Escamilla-Prado, E.; Sanchez-Hernández, R.; Gallardo, J.F.; Martínez-Zurimendi, P. Soil Biological Activity, Carbon and Nitrogen Dynamics in Modified Coffee Agroforestry Systems in Mexico. Agronomy 2022, 12, 1794. [Google Scholar] [CrossRef]
- Andrade, H.J.; Zapata, P.C. Mitigation of Climate Change Of Coffee Production Systems In Cundinamarca, Colombia. Floresta Ambiente 2019, 26, e20180126. [Google Scholar] [CrossRef]
- Lehmann, L.M.; Lysák, M.; Schafer, L.; Henriksen, C.B. Quantification of the understorey contribution to carbon storage in a peri-urban temperate food forest. Urban For. Urban Green. 2019, 45, 12635. [Google Scholar] [CrossRef]
Disclaimer/Publisher’s Note: The statements, opinions and data contained in all publications are solely those of the individual author(s) and contributor(s) and not of MDPI and/or the editor(s). MDPI and/or the editor(s) disclaim responsibility for any injury to people or property resulting from any ideas, methods, instructions or products referred to in the content. |
© 2025 by the authors. Licensee MDPI, Basel, Switzerland. This article is an open access article distributed under the terms and conditions of the Creative Commons Attribution (CC BY) license (https://creativecommons.org/licenses/by/4.0/).