Article

Cropland Loss Under Different Urban Expansion Patterns in China (1990–2020): Spatiotemporal Characteristics, Driving Factors, and Policy Implications

1
Institute of Agricultural Economics and Information, Guangdong Academy of Agricultural Sciences, Guangzhou 510640, China
2
Key Laboratory of Urban Agriculture in South China, Ministry of Agriculture and Rural Affairs, Guangzhou 510640, China
*
Author to whom correspondence should be addressed.
Land 2025, 14(2), 343; https://doi.org/10.3390/land14020343
Submission received: 27 December 2024 / Revised: 24 January 2025 / Accepted: 26 January 2025 / Published: 8 February 2025

Abstract

:
It is well established that China’s rapid urban expansion has led to a substantial loss of cropland. However, few studies have examined how different urban expansion patterns contribute to cropland consumption, which has hindered the formulation of sustainable urban development and cropland protection policies. To fill this gap, we analyzed the occupation of cropland under three urban expansion patterns (leap-frogging, edge-spreading, and interior filling) in China from 1990 to 2020, using long-term land use data. The dominant driving forces of cropland loss were then explored using the XGBoost model and SHAP values. Our findings indicate that urban expansion in China from 1990 to 2020 resulted in a 6.3% reduction in cropland, with edge-spreading (4.0%) contributing the most, followed by leap-frogging (2.1%) and interior filling (0.2%). Change in urban intensity (CUI) proved to be the most critical driver of cropland loss, with SHAP values of 0.38, 0.28, and 0.37 for edge-spreading, leap-frogging, and interior filling, respectively. Over time, the driving forces evolved from a single demographic-economic dominance to a more diversified and integrated set of drivers. Based on these findings, we propose tailored planning and policies for different urban expansion patterns; for regions dominated by edge-spreading, stricter controls on urban boundaries and stronger land use planning constraints are required. For regions with prominent interior filling expansion, efforts should be made to improve internal land use efficiency while preserving existing cropland spaces. In regions characterized by leap-frogging expansion, further optimization of construction land allocation is needed to reduce the occupation of productive suburban cropland. These findings not only offer new empirical evidence for understanding the interplay between urban expansion and cropland conservation but also provide transferable insights that can inform sustainable land-use planning and cropland protection strategies in other rapidly urbanizing regions facing similar challenges.

1. Introduction

With rapid urbanization worldwide, the speed and scale of urban expansion continue to accelerate. In China, this process is particularly remarkable. The rapid urban expansion leads to a continuous decline in cropland, which poses serious challenges to national food security and the ecological environment [1,2,3]. Although numerous studies have documented the effects of urban expansion on cropland, most have focused on the overall speed and extent of growth, with relatively limited attention paid to how distinct urban expansion patterns differentially drive cropland depletion [4,5,6]. Common urban expansion patterns include leap-frogging, edge-spreading, and interior filling [7,8]. Leap-frogging expansion aligns with the multiple nuclei theory, where new urban centers emerge independently, bypassing adjacent areas. Edge-spreading reflects principles from sector theory, as urban growth radiates along transportation corridors and areas of economic activity. Interior filling, on the other hand, resonates with the compact city model, which prioritizes land use efficiency and urban densification to reduce sprawl [9]. These patterns differ significantly in spatial distribution, expansion pathways, and their impacts on cropland resources. Investigating the effects of different urban expansion patterns on cropland not only highlights the scale of land transformation but also uncovers spatial dynamics that influence agricultural resilience. These insights are critical for formulating strategies to harmonize urban development with sustainable cropland management.
First, spatial configurations of different urban expansion patterns directly influence cropland occupation. Leap-frogging, often manifested as discontinuous urban development, is not unique to China and has been observed in the United States and parts of Europe, where it similarly contributes to cropland fragmentation, higher infrastructure costs, and more complex land management challenges [10,11,12]. By contrast, edge-spreading typically involves converting high-quality peri-urban cropland into built-up areas, posing a significant threat to cropland protection [13]. Interior filling involves the development and utilization of cropland within the urban area. While this may reduce pressure on outer agricultural land to some extent, it often introduces other environmental issues—such as soil degradation, increased stormwater runoff, weakened carbon sequestration, deteriorating air quality, and reduced biodiversity [14,15].
Second, identifying the key drivers of cropland loss under different expansion patterns is critical for understanding the causes behind the rapid reduction of cropland during urban expansion. The formation and evolution of these patterns reflect diversified driving forces that influence the conversion paths and speed of cropland. For example, in the leap-frog expansion, differences in land prices, topographic constraints (e.g., mountains, rivers), and developers’ investment strategies may lead to the leap-frog expansion of urban land into far-off agricultural areas [9]. The edge-spreading pattern is more likely to spread rapidly in areas with good transportation and flat terrain, especially in suburban regions, where favorable location conditions accelerate the conversion of nearby farmland into urban land [16,17]. This phenomenon is also prevalent in rapidly urbanizing regions of Africa and East-Southeast Asia [18,19]. The interior filling pattern, driven by urban renewal and population density increases, is a major route for occupying internal land plots, which often includes remaining farmland or vacant land that can be converted into urban land [16,20]. In these patterns, natural conditions, social factors, and policy orientation collectively shape the spatiotemporal patterns of urban occupation of cropland.
Finally, the changing trajectories of urban expansion patterns influence long-term outcomes for cropland conservation. Leap-frogging, while initially having a seemingly lower immediate impact on cropland, can cause fragmentation over time, reducing agricultural efficiency and cumulatively degrading cropland ecosystems [10,21,22]. Edge-spreading may lead to immediate and substantial-high-quality cropland reduction, but its long-term ecological impacts might be relatively predictable [23,24]. Interior filling, although it can minimize direct occupation of outer cropland in the short term, may exacerbate urban environmental problems—such as soil degradation, flooding, and biodiversity decline—that indirectly affect surrounding ecosystems and cropland [25,26]. Systematically assessing the long-term outcomes of these modes provides more nuanced evidence for designing sustainable cropland protection strategies.
Given these considerations, identifying the spatial-temporal patterns of cropland loss and the predominant drivers under different urban expansion patterns not only enhances our understanding of land-use conflicts during urbanization but also offers more refined guidance for implementing differentiated land use planning and cropland protection policies. This study systematically analyzes the spatiotemporal occupation of cropland by distinct urban expansion patterns in China, investigates their underlying driving factors, and derives insights for future land use policies. The objectives are to (1) clarify the spatiotemporal distributions of cropland area changes under different urban expansion patterns, (2) determine the differential impacts of each urban expansion mode on cropland change, and (3) identify the dominant driving factors of cropland loss associated with each urban expansion patterns.

2. Study Area and Data
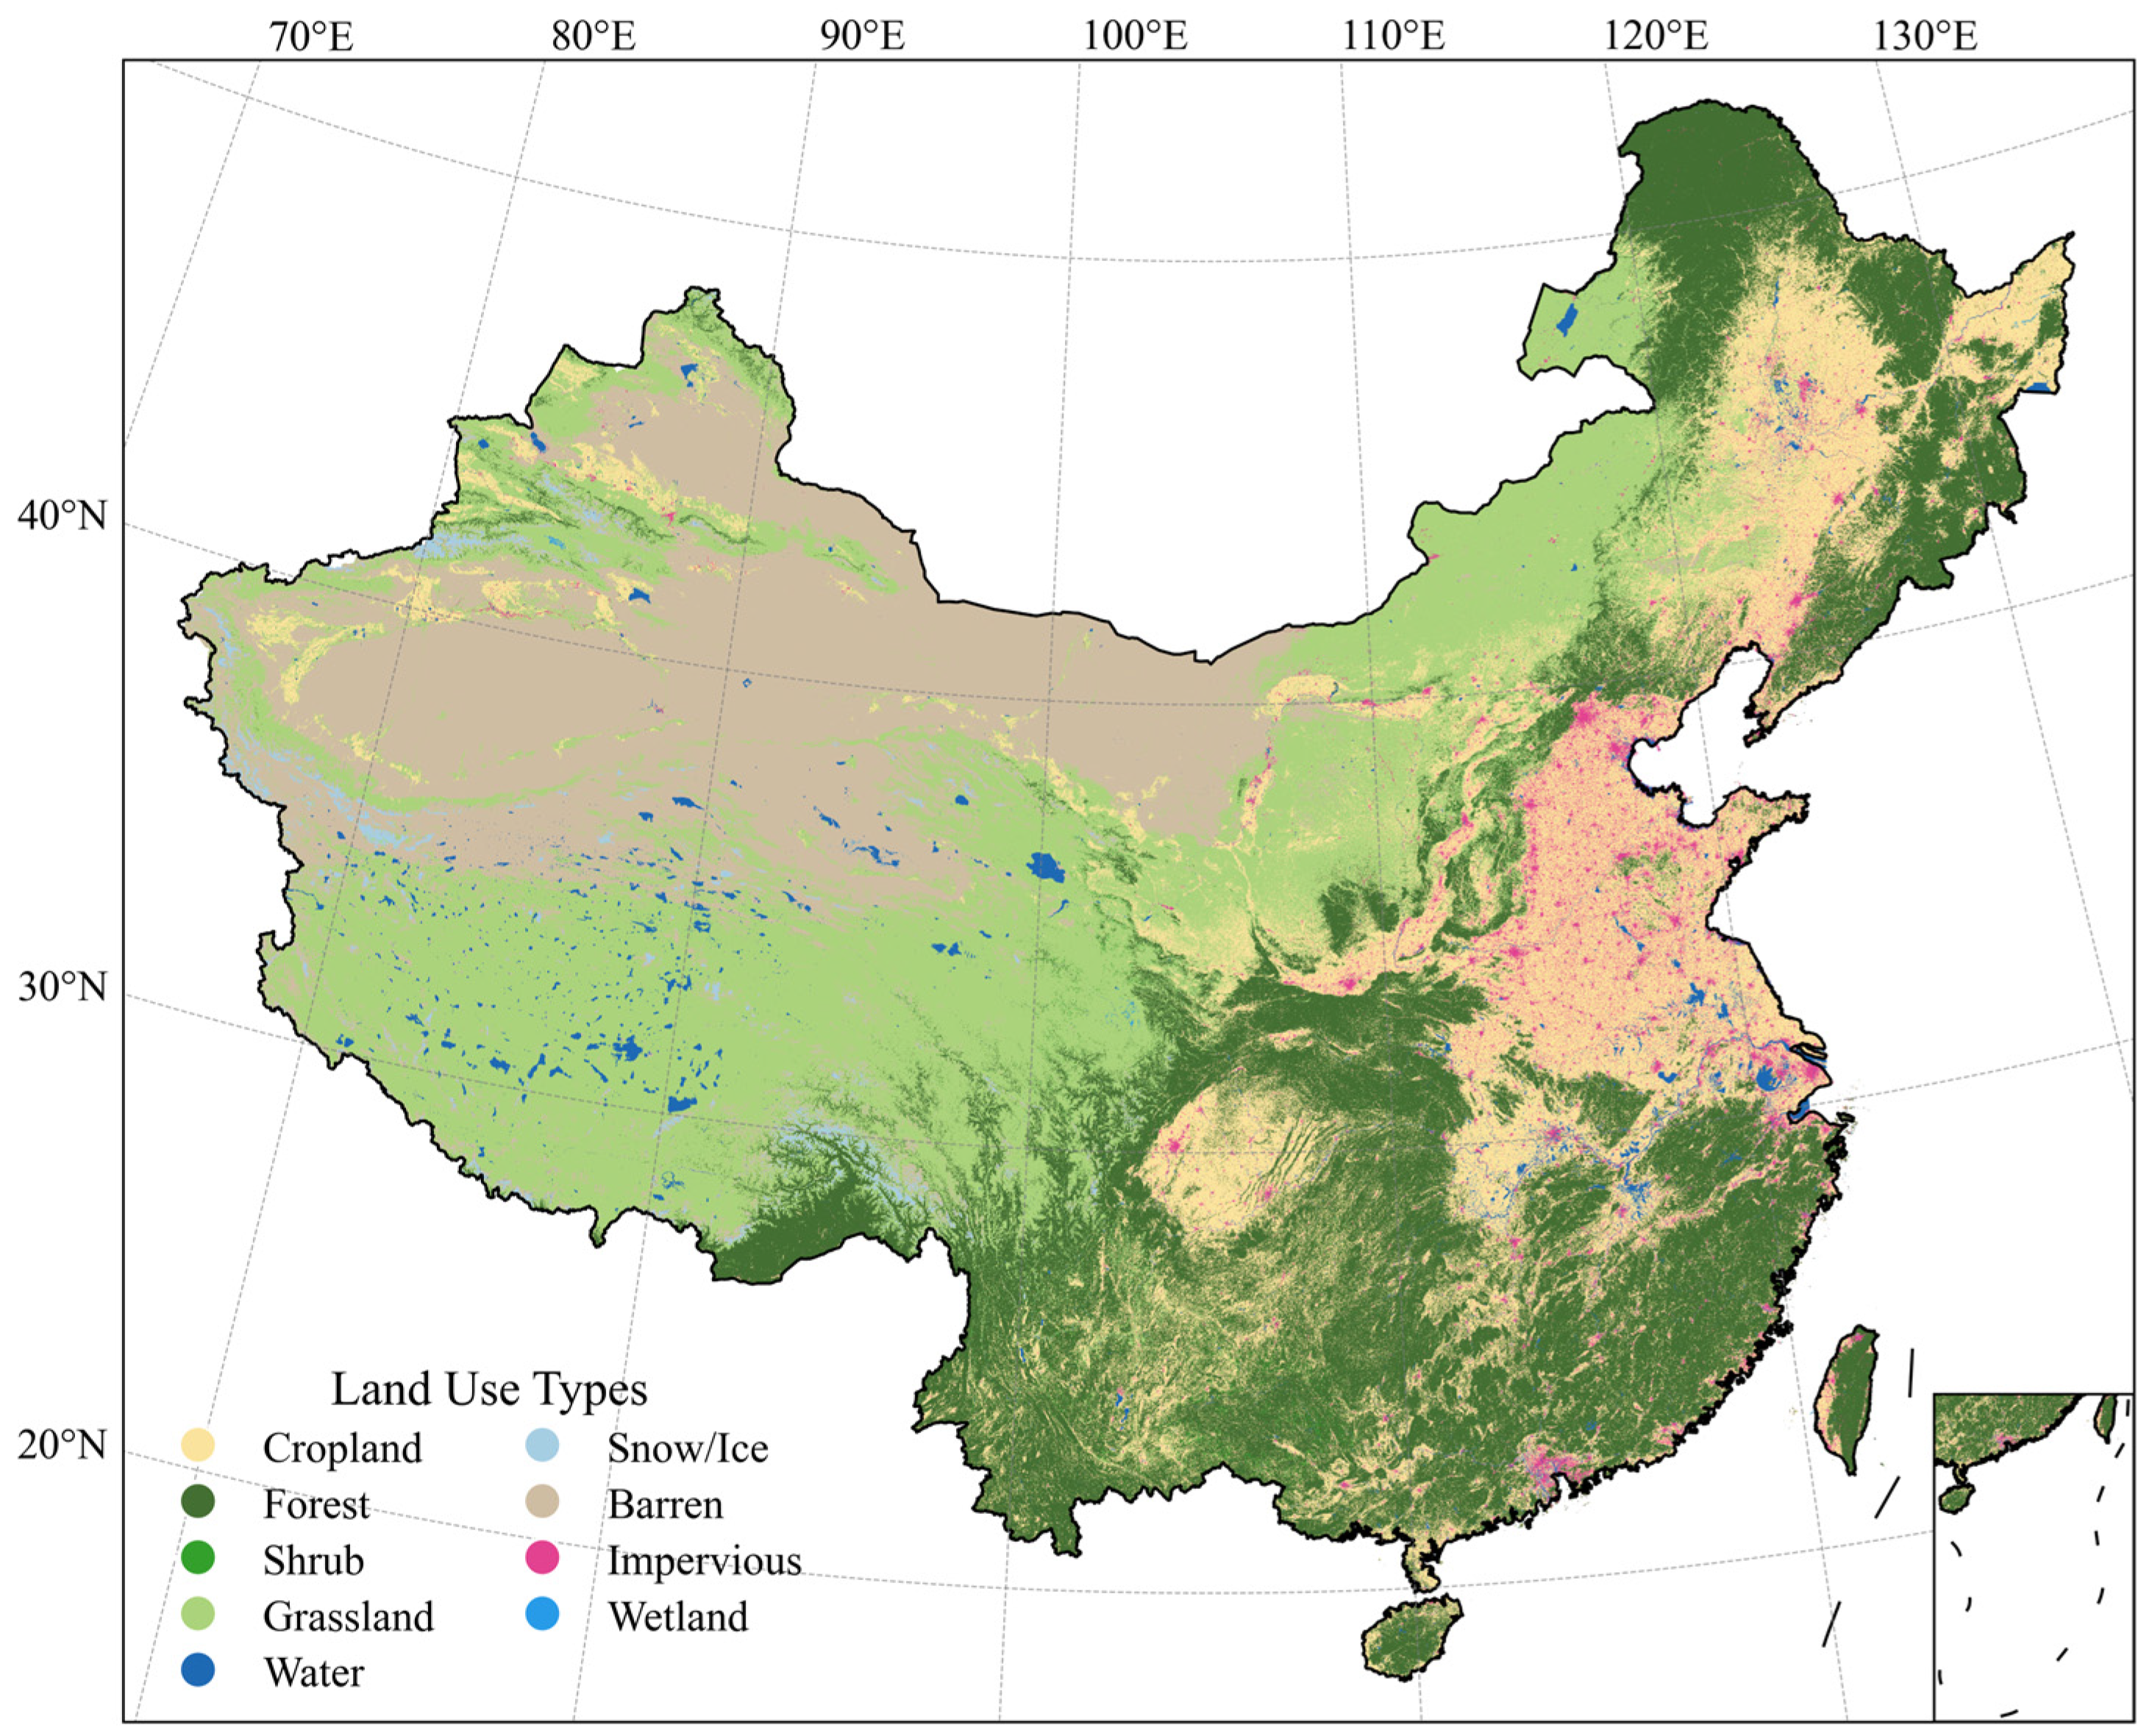
2.1. Study Area

China is located in East Asia, stretching from 3°31′ N to 53°33′ N and 73°33′ E to 135°3′ E, covering approximately 9.6 million km2 (Figure 1). Its diverse natural geography encompasses plateaus, mountains, and plains, as well as a variety of climate types. By 2020, China had about 126.3 million hectares of cropland, approximately 9% of the global total [27]. However, given its large population, China’s per capita cropland area is less than one-third of the global average [28]. Moreover, cropland distribution is highly uneven due to variations in climate, precipitation, and topography. Most cropland is concentrated in the Northeast Plain, North China Plain, and the middle-lower Yangtze River Plain, while the western plateaus and southern mountainous regions have relatively limited cropland [6].
Since the reform and opening-up, China’s urbanization has proceeded at a phenomenal pace. By 2020, the urban population reached 902 million, accounting for 63.9% of the total population [29]. Along with economic development and population concentration, the issue of cropland resource occupation caused by urban expansion has become increasingly prominent. Between 1990 and 2019, about 120,000 km2 of cropland was converted to urban land in China [3]. This conversion mostly occurs in peri-urban agricultural land, especially in the fertile plains, exposing cropland resources to greater pressures in the context of urbanization [30]. Balancing urban expansion with cropland preservation has thus become a critical task for sustainable development.

2.2. Data

This study utilized four types of data. The first is land use data from 1990 to 2020, sourced from the China Land Cover Dataset (CLCD) (https://zenodo.org/records/4417810, accessed on 4 August 2024). This dataset includes nine categories: Cropland, Forest, Shrub, Grassland, Water, Snow/Ice, Barren, Impervious, and Wetland, with a spatial resolution of 30 m and an overall classification accuracy of over 79% [31]. This dataset has been widely applied in land use studies [6,32,33]. We used it to analyze urban expansion and cropland loss dynamics.
The second dataset is related to the natural driving factors of cropland loss under different urban expansion patterns, including precipitation, temperature, normalized difference vegetation index (NDVI), slope, digital elevation model (DEM), and soil organic carbon. Precipitation and temperature data are sourced from the National Tibetan Plateau Data Center, with a spatial resolution of 1 km (https://data.tpdc.ac.cn, accessed on 4 August 2024). NDVI data (MOD13Q1) at 250 m resolution were sourced from NASA (https://ladsweb.modaps.eosdis.nasa.gov, accessed on 4 August 2024). DEM data at 30 m resolution were obtained from the Geospatial Data Cloud (http://www.gscloud.cn, accessed on 4 August 2024), and the slope was derived from the DEM. Soil data were from the National Tibetan Plateau Data Center, with a spatial resolution of 1 km (https://data.tpdc.ac.cn/, accessed on 4 August 2024).
The third dataset contains socio-economic factors for analyzing cropland loss under different urban expansion patterns, including nighttime lights, GDP, and population. Nighttime light data is sourced from the NPP VIIRS-like nighttime light data released by Chen et al. [34], with a spatial resolution of 500 m (https://doi.org/10.7910/DVN/YGIVCD, accessed on 4 August 2024). GDP data at 1 km resolution were obtained from the Resource and Environment Data Cloud Platform (https://www.resdc.cn/, accessed on 4 August 2024). Population density at 1 km resolution was derived from WorldPop dataset (https://www.worldpop.org/, accessed on 4 August 2024).
The fourth dataset consists of geographical auxiliary data, including administrative boundaries, rivers, and roads, sourced from the National Geomatics Center of China (http://www.ngcc.cn/, accessed on 4 August 2024). All data were projected into Albers equal-area projection and resampled to 1 km resolution.

3. Methods

3.1. Identifying Urban Expansion Patterns

Following Liu et al. [8], we utilized the Landscape Expansion Index (LEI) to identify urban expansion patterns, including edge-spreading, interior filling, and leap-frogging. The LEI, a commonly used landscape metric, assesses spatiotemporal dynamics in rapidly urbanizing areas [33,35,36]. LEI is defined as:
L E I = A o A o + A v × 100
where LEI is the expansion index for new urban landscapes, which ranges from 0 to 100 [8]. When LEI = 0, the new urban land is classified as leap-frogging; when 0 < LEI ≤ 50, it is edge-spreading; when 50 < LEI ≤ 100, it is interior filling. A o is the area of newly urban land intersecting with existing urban land within a buffer, and A v represents the area of that buffer intersecting with non-urban land.
In this study, LEI was calculated using a 1 km grid as the basic spatial unit, consistent with the spatial resolution of other datasets used in this analysis. The choice of 1 km resolution aligns with the overall study design and ensures consistency across all datasets, facilitating the integration of spatial and temporal dynamics of urban expansion and cropland loss.

3.2. Analyzing Cropland Dynamics

We employed the Theil-Sen median slope and the Mann-Kendall test to detect the dynamics of cropland loss during the study period. Theil-Sen median slope provides a non-parametric estimate of trend magnitude, making it less sensitive to extreme values, while the Mann-Kendall test is a rank-based method that does not require data to follow a specific distribution, ensuring its reliability in detecting monotonic trends [6,37]. These methods are robust to outliers and widely used in time-series trend analyses [38,39,40]. The calculation of the Theil-Sen median trend is as follows:
β = M e d i a n A r e a j A r e a i j i ,   j > i
where β represents the rate of change in cropland area. If β > 0, it indicates a positive trend; otherwise, it indicates a negative trend. A r e a i and A r e a j represent the area at time i and time j, respectively. The calculation formula for the Mann-Kendall test is as follows:
Z = S 1 V a r ( S ) , S > 0 0 , S = 0 S + 1 V a r ( S ) , S < 0
S = i = 1 n 1 j = i + 1 n s g n ( A r e a j A r e a i )
s g n ( A r e a j A r e a i ) = 1 , A r e a j A r e a i > 0 0 , A r e a j A r e a i = 0 1 , A r e a j A r e a i < 0
where Z and S are statistical variables, and n represents the length of the time series during the study period. For a given significance level α, if Z > Z 1 α / 2 , it indicates that there has been a significant change in cropland area at the α significance level. In this study, we used a significance level of 0.05.

3.3. Determining the Driving Forces of Cropland Change Under Different Urban Expansion Patterns

Cropland systems involve complex interactions between human society and the natural environment [41,42]. Therefore, changes in cropland area result from the interaction of natural and social factors. To quantify the contributions of various factors, we selected 12 representative variables influencing cropland changes based on previous studies (Table 1). The selected factors encompass key natural and socio-economic variables that have been demonstrated to influence land-use changes, particularly the transition from cropland to urban land [43,44]. For instance, NDVI change (CNDVI) reflects vegetation dynamics and ecological resilience, which are critical in determining land-use transitions in regions where cropland is vulnerable to urban encroachment [44]. Similarly, soil organic carbon (SOC) is indicative of soil fertility and productivity, influencing the prioritization of cropland for protection or conversion during urban expansion [45].
Furthermore, we integrated the eXtreme Gradient Boosting (XGBoost) model with Shapley Additive exPlanations (SHAP) to explore the role of these factors under different urban expansion patterns. XGBoost is a highly efficient and scalable machine learning algorithm known for its ability to handle large datasets, capture nonlinear relationships, and prevent overfitting through regularization [46,47]. SHAP provides a consistent and interpretable framework for understanding feature contributions by assigning each factor a Shapley value, ensuring transparency and facilitating the identification of key drivers across diverse scenarios [48].
First, we trained the XGBoost model to predict cropland changes, using 80% of the data for training and 20% for validation. We selected several key hyperparameters for the XGBoost model, including learning_rate, which controls the contribution of each tree and helps prevent overfitting; max_depth, which regulates the complexity of individual trees; n_estimators, determining the number of trees to build; colsample_bytree, controlling the fraction of features considered in each tree to prevent overfitting; and alpha, which applies L1 regularization to control model complexity. To improve accuracy, we optimized these hyperparameters using grid search. Specifically, we defined a parameter grid covering several values for each hyperparameter and used 5-fold cross-validation to evaluate performance. The best combination was achieved with max_depth = 9, colsample_bytree = 0.6, learning_rate = 0.05, and n_estimators = 300, yielding an MSE of 10.1. To ensure reliability, the results were averaged over 100 runs, confirming the consistency and robustness of the model’s performance. The final optimized parameters performed well on the training set and were able to predict cropland change effectively. Second, we applied SHAP to interpret the contribution of each factor to the model’s predictions. SHAP values contribute each feature to the model output, effectively illustrating the nonlinear relationships between features and the dependent variable [46,47]. By examining the mean SHAP values, we identified key drivers of cropland change under different urban expansion patterns.
Table 1. Drivers of cropland loss.
TypeDriversCodeUnitReference
Natural ecological
drivers
Digital Elevation ModelDEMmQiao et al. [45]
SlopeSlopeQiao et al. [45]
Change in NDVICNDVIWu et al. [44]
Soil organic carbonSOC%Qiao et al. [45]
TemperatureCTEM°CYu et al. [49]
Change in precipitationCPREmmYu et al. [49]
River densityRiverkm/km2Qiao et al. [45]
Socio-economic
drivers
Road densityRoadkm/km2Azadi et al. [43]
Change in nighttime lightCNTLHasan et al. [50]
Change in urban intensityCUIWu et al. [44]
Change in GDP CGDP¥/km2Tu et al. [3]
Change in population density CPOPpersons/km2Zhang et al. [51]
Note: Urban intensity is defined as the proportion of urban land area to the total area of a given region; Indicators of the changes (e.g., CNDVI, CGDP, and CPOP, etc.) were calculated as the difference between their respective values in 2020 and 1990 at the pixel level.

4. Results

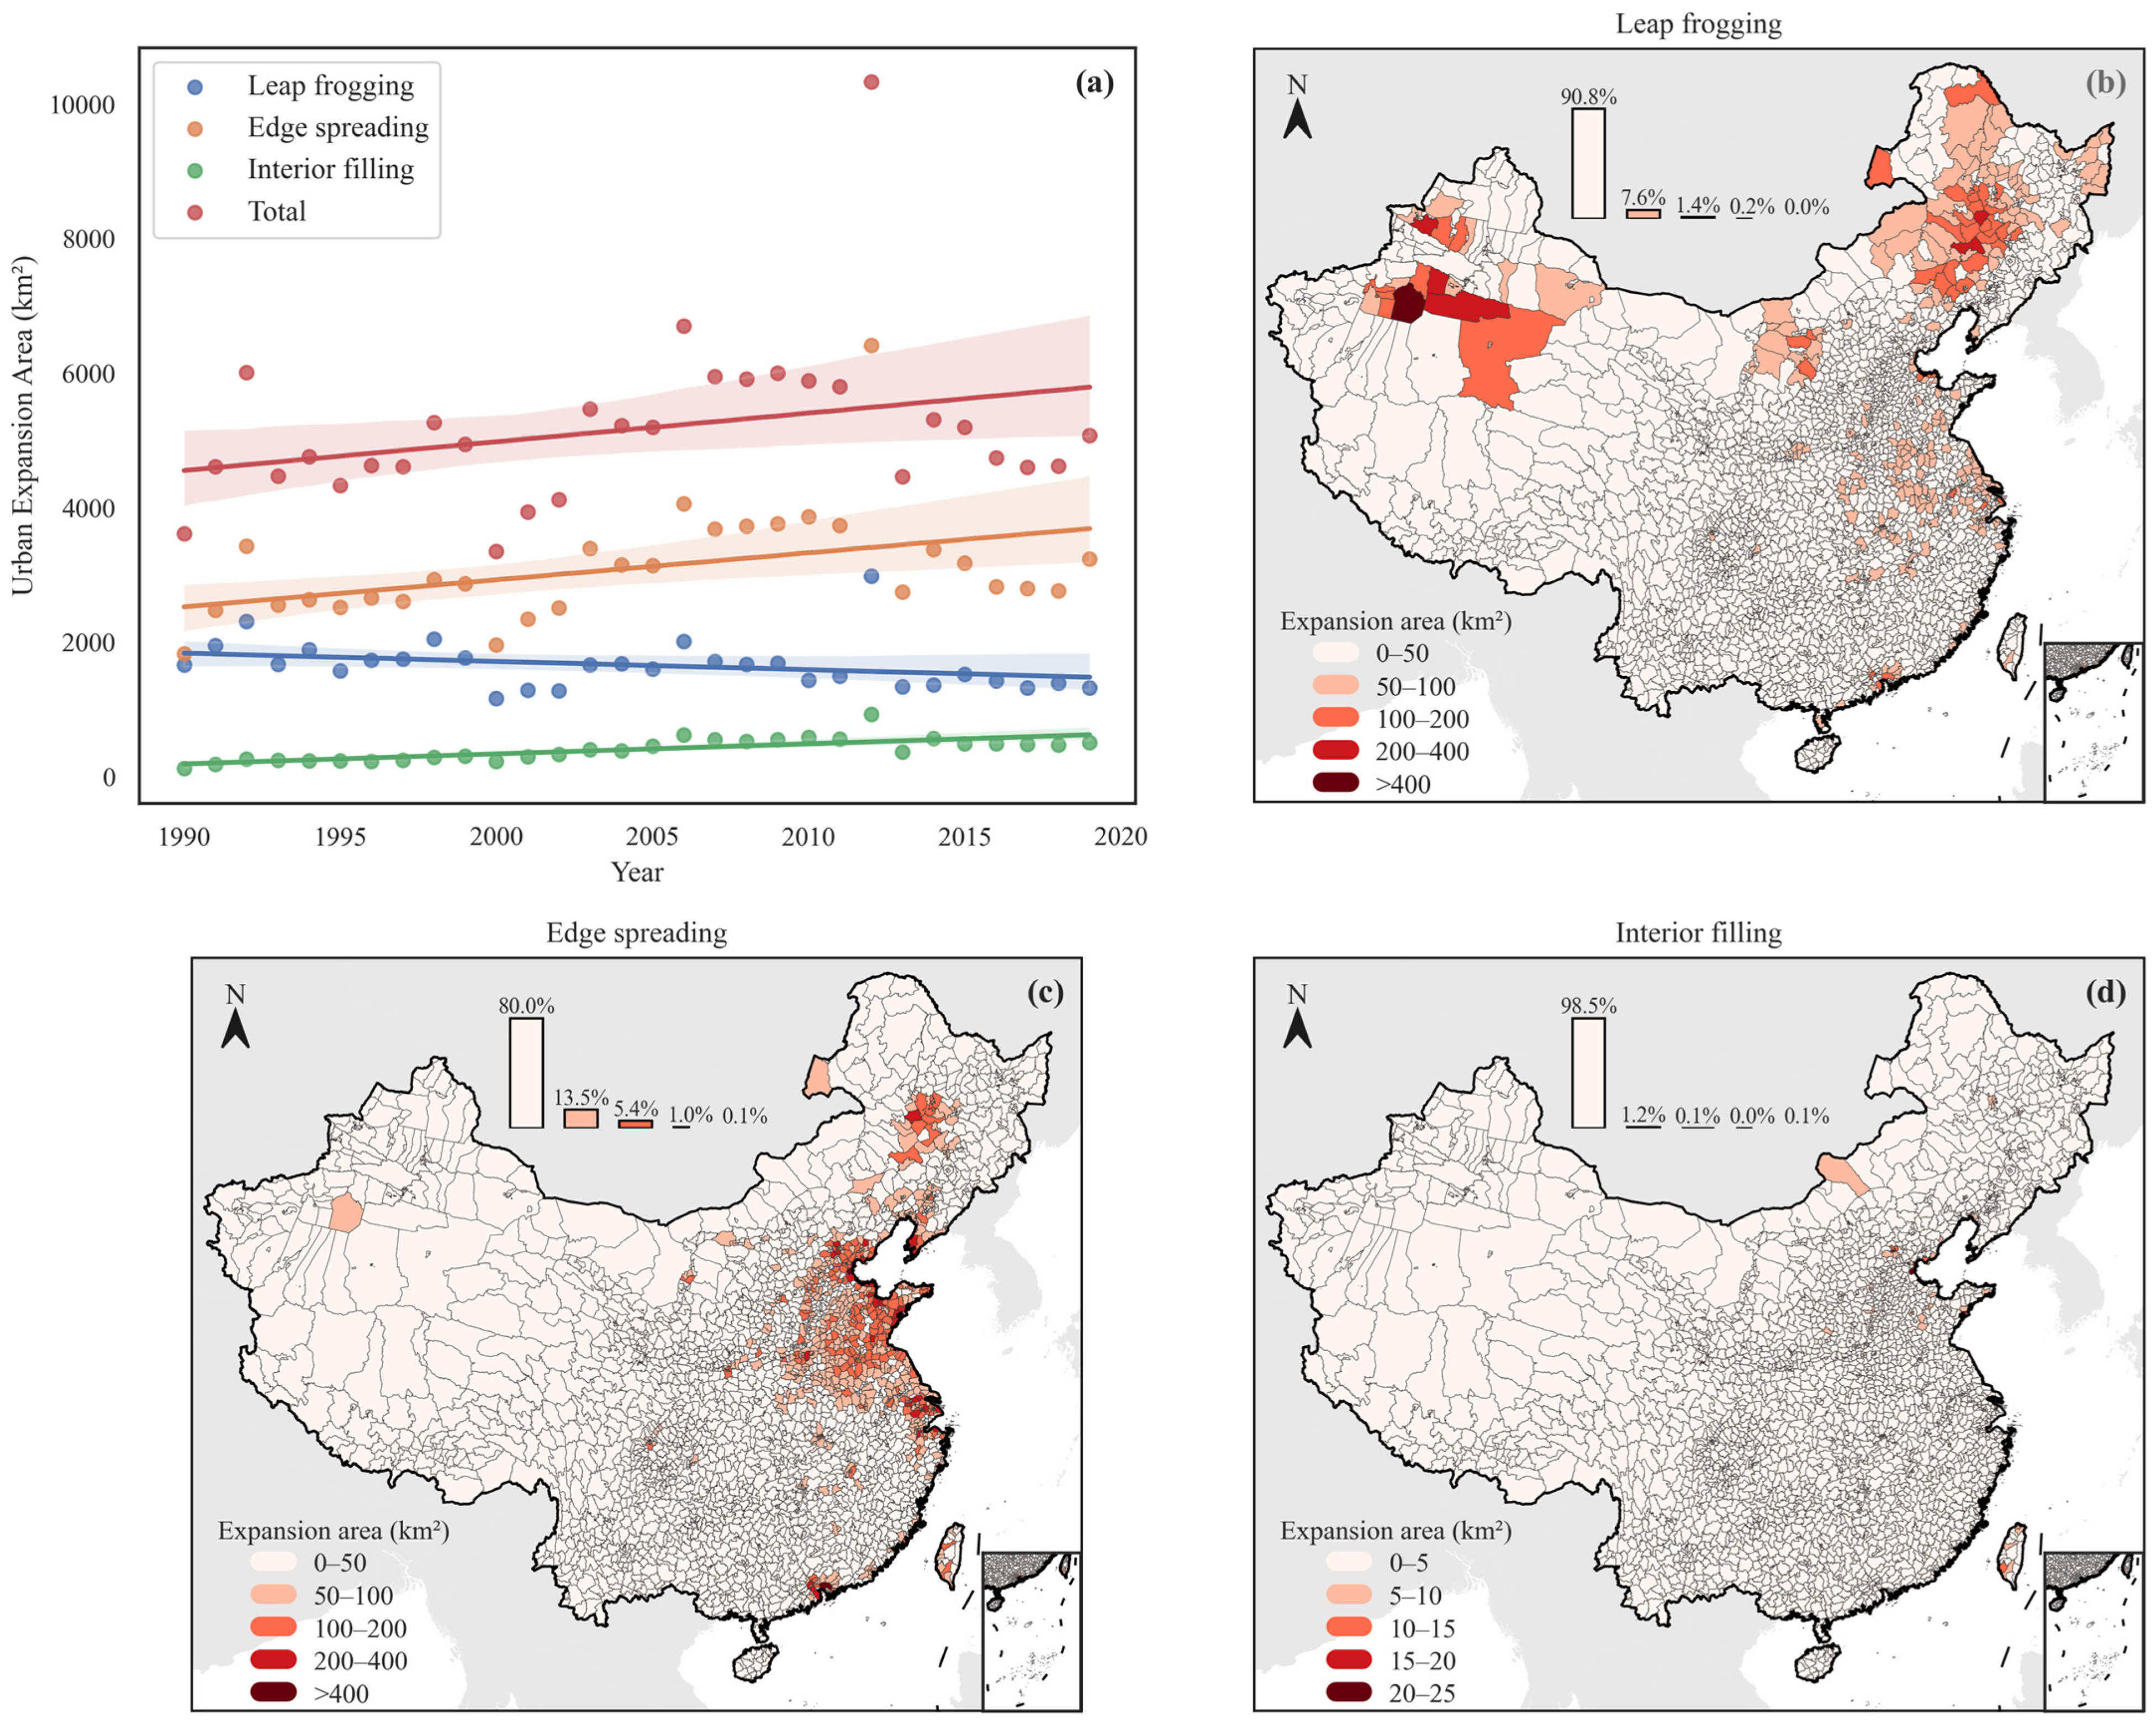
4.1. Spatiotemporal Dynamics of Urban Expansion Patterns

Between 1990 and 2020, the urban area in China expanded by 148,880 km2, averaging nearly 5000 km2 per year (Figure 2a). Edge-spreading accounted for the largest share, at 89,428 km2, or 60.1% of the total urban expansion area, followed by leap-frogging (47,736 km2, 32.1%), and interior filling (11,716 km2, 7.8%). Notably, the growth rate of leap-frogging expansion declined over time, suggesting that with the reduction of developable land on the urban periphery, leap-frogging faced increasing resource constraints and policy regulation, thus pushing urban development toward more compact and efficient patterns.
There are significant spatial differences in the expansion areas of different urban expansion patterns. For leap-frogging, 90.8% of counties expanded by less than 50 km2, and only 1.6% expanded by more than 100 km2. These highly expansive counties were primarily located in Northeast, Southwest, and East China, showing clear spatial clustering (Figure 2b). In contrast, edge-spreading areas larger than 100 km2 occurred in 6.5% of counties, mainly in East China, with scattered distributions in South Central and South China (Figure 2c). Interior filling was minimal, with 98.5% of counties expanding by less than 5 km2 (Figure 2d).

4.2. Spatiotemporal Dynamics of Cropland

From 1990 to 2020, cropland in China showed a consistent declining trend, decreasing from 1.97 × 10⁶ km2 to 1.89 × 10⁶ km2—an overall reduction of 4.30% or about 2828 km2 per year (Figure 3a). The period from 2003 to 2011 witnessed the most rapid cropland loss, totaling 52,441 km2 (61.8% of total loss). This dramatic decline can be attributed to intensified urbanization and industrialization during this period, as rapid economic growth and large-scale infrastructure development exerted significant pressure on cropland resources, particularly in economically active regions [52,53]. However, in the following three years, the cropland area experienced a brief increase, with an annual rise of 4568 km2. This brief recovery may reflect the implementation of cropland protection measures, such as the “Land Reclamation Regulation” issues in 2011 [54,55].
Between 1990 and 2020, 82.7% of counties experienced significant changes in cropland area (Figure 3b). Among these, 45.2% showed a significant decline, primarily concentrated in the Northeast, North, Central, East, and South China regions, collectively accounting for 38.3% of China’s total area. In contrast, 37.5% of counties experienced an increase in cropland, primarily distributed in Inner Mongolia, Northwest, and Southwest China, covering 36.2% of the country’s total area. A few counties in South China also exhibited increasing cropland trends, potentially influenced by cropland consolidation policies, agricultural scaling development, and reclamation efforts [56]. Favorable climatic conditions and supportive agricultural policies may have contributed to these short-term cropland gains [57].

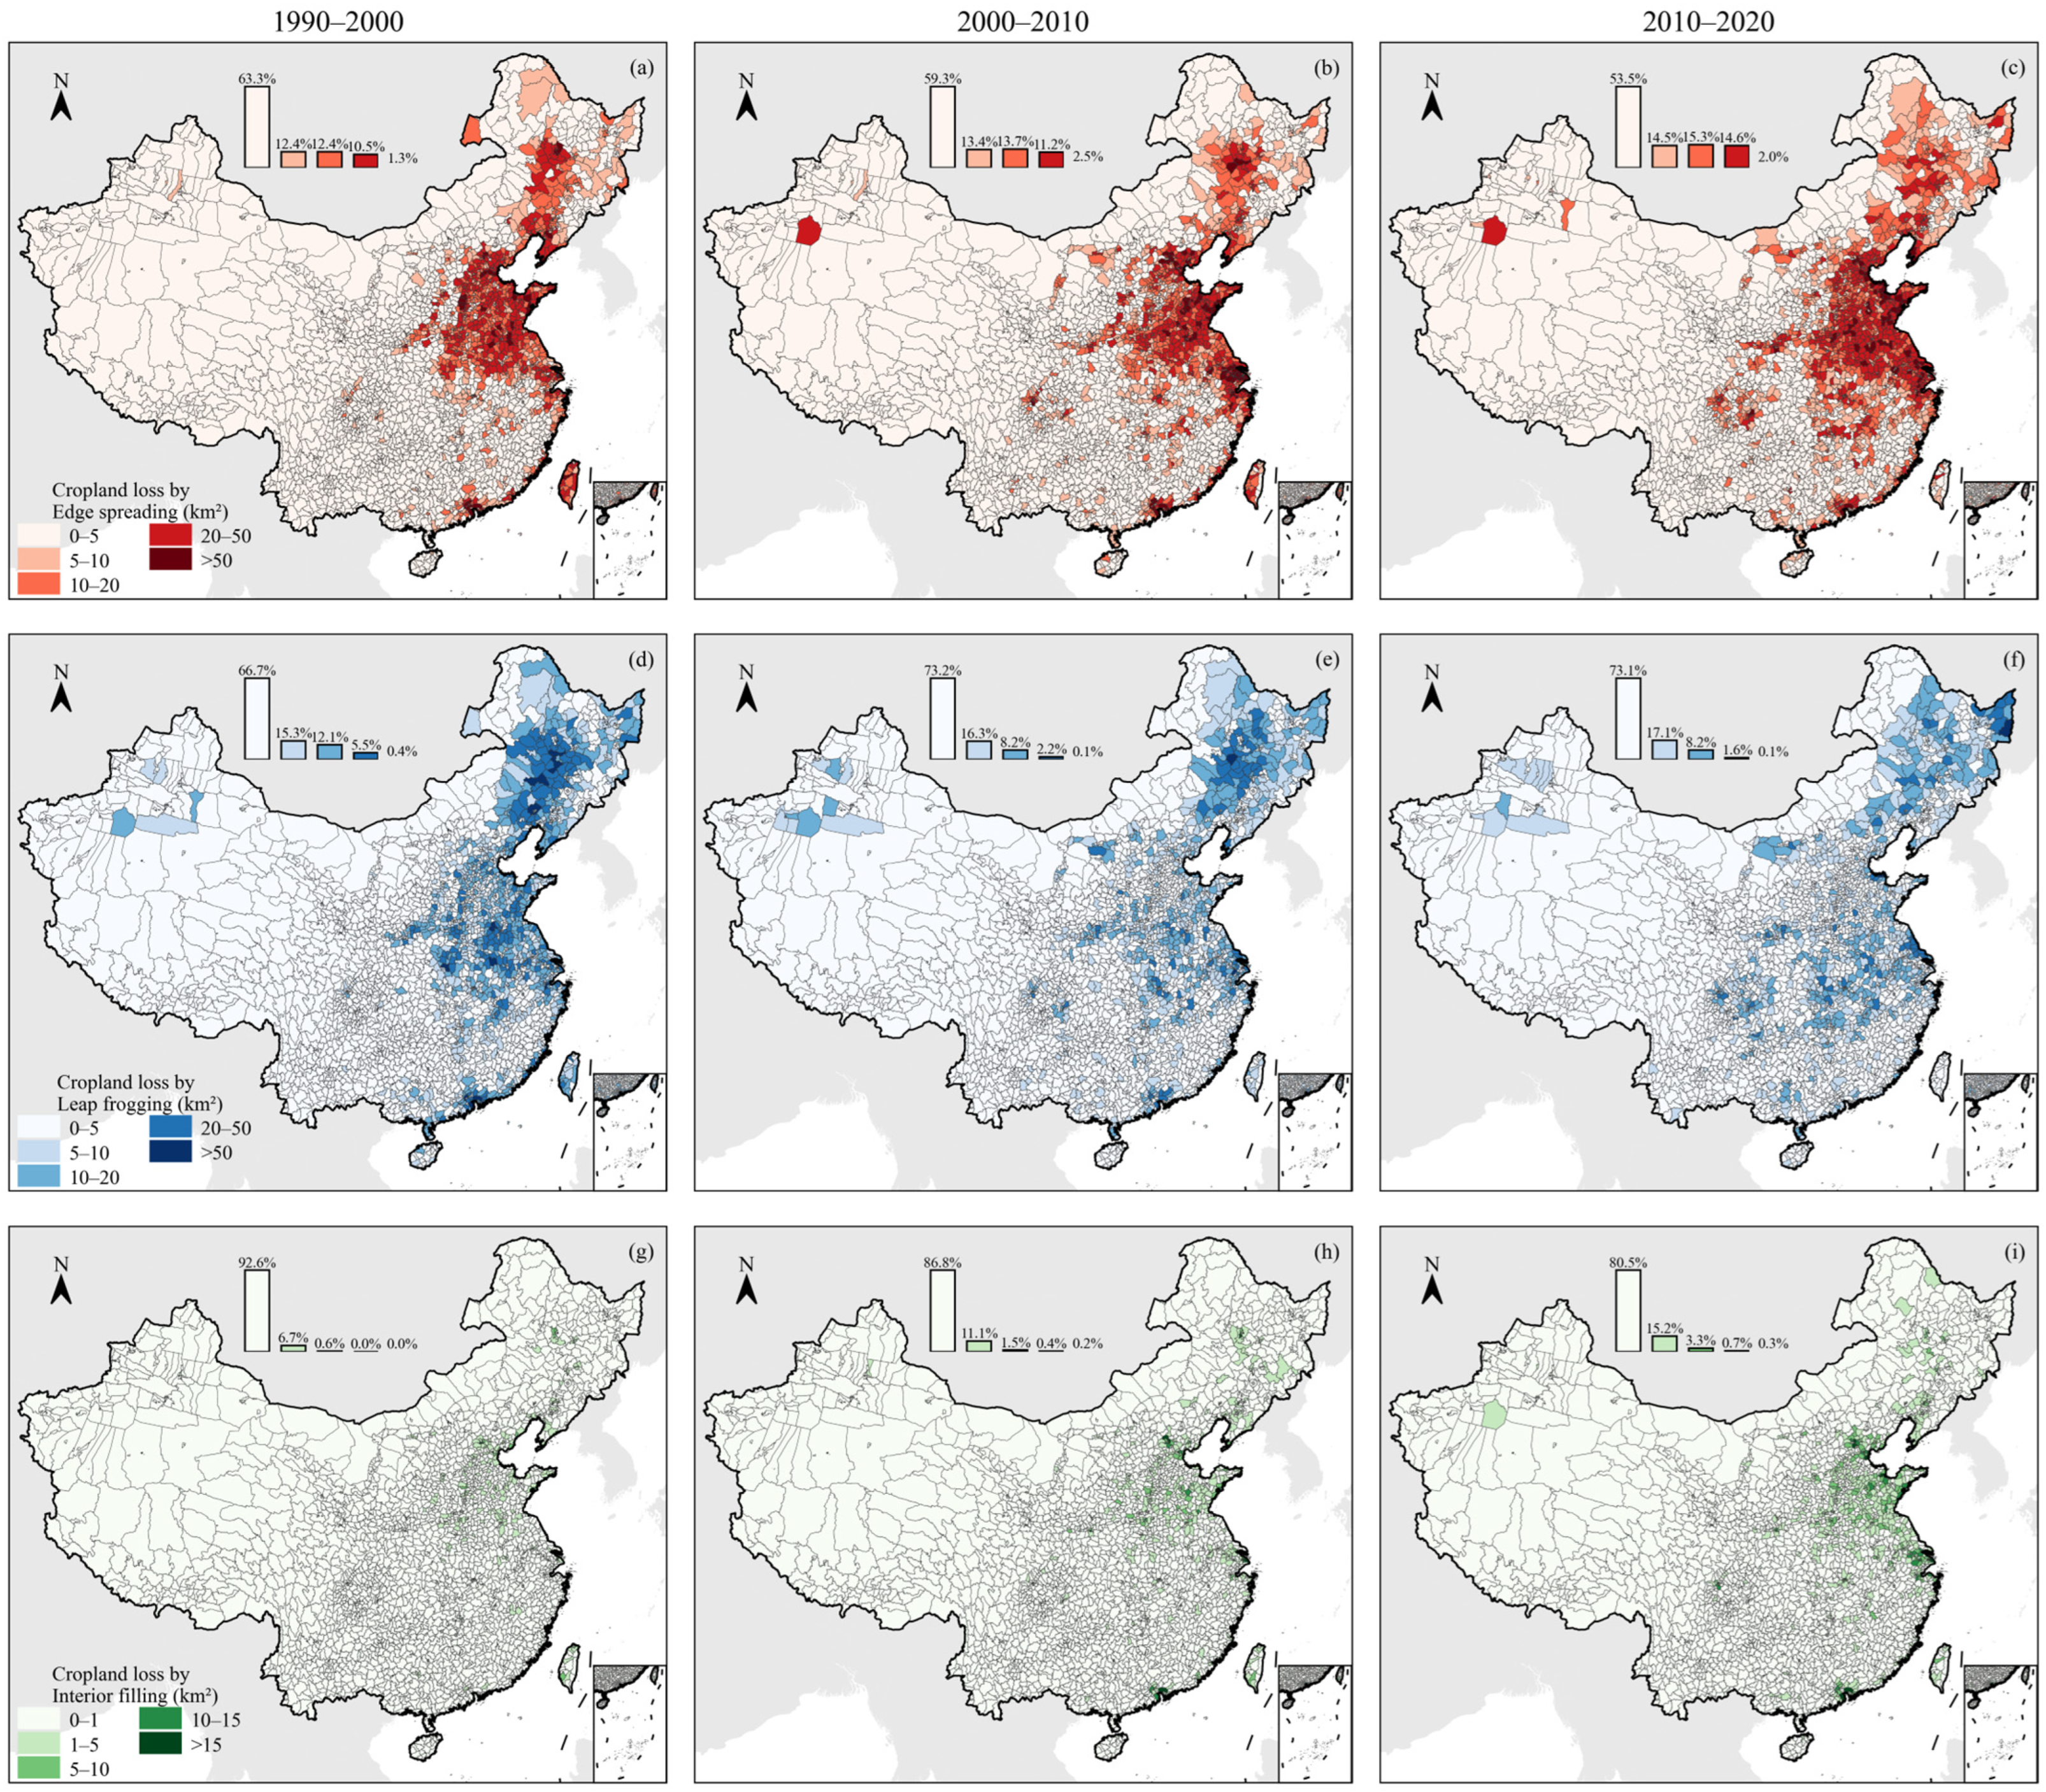
4.3. Cropland Occupation Under Different Urban Expansion Patterns

The effects of different urban expansion patterns on cropland occupation varied significantly over space and time (Figure 4, Table 2). From 1990 to 2000, edge-spreading dominated cropland occupation: 36.7% of counties lost more than 5 km2 of cropland to edge-spreading, mainly in the Northeast, East, and Pearl River Delta regions. This dominance in these regions can be attributed to their relatively flat terrain, favorable infrastructure conditions, and rapid economic development, which made peri-urban cropland highly susceptible to urban conversion. Leap-frogging also had a major impact on cropland: 33.3% of counties lost more than 5 km2, with a distribution similar to edge-spreading. Interior filling contributed less during this period, as only 7.4% of counties lost more than 1 km2 of cropland to it, scattered mainly in East China.
From 2000 to 2010, the spatial pattern of cropland occupation by edge-spreading remained largely unchanged, but the area occupied increased. Specifically, counties losing more than 5 km2 of cropland to edge-spreading increased to 40.7%, a 4% increase from the previous decade. Meanwhile, 40.7% of counties had cropland occupied by more than 5 km2 due to interior filling—1.8 times the previous decade. This growth occurred mainly in East China and the Pearl River Delta. In contrast, the impact of leap-frogging declined slightly, with 26.8% of counties losing more than 5 km2, a decrease of 6.5% from the previous period.
From 2010 to 2020, edge-spreading continued to intensify, with 46.5% of counties losing more than 5 km2 of cropland—1.3 times that of the first period and 1.1 times the second. This intensification was particularly evident in economically vibrant regions such as the Yangtze River Delta and Pearl River Delta, where expanding suburban and peri-urban areas met the growing demands for residential, commercial, and industrial land. Meanwhile, interior filling urban expansion saw a substantial increase in its occupation of cropland. More than 5 km2 of cropland was lost to interior filling in 19.5% of counties—2.6 and 1.5 times greater than in the two previous periods, respectively. These counties were concentrated in East and South China’s coastal regions, where limited availability of external land resources, rising urban land prices, and intensified policy enforcement on cropland protection have collectively driven urban development into underutilized and low-quality cropland within urban. Urban renewal and reconstruction initiatives, aiming to optimize land use efficiency, further contributed to this trend [58,59]. In contrast, the occupation of cropland by leap-frogging expansion remained relatively stable during this period, likely due to the narrowing of regional land price disparities and the enforcement of stricter urban planning regulations.

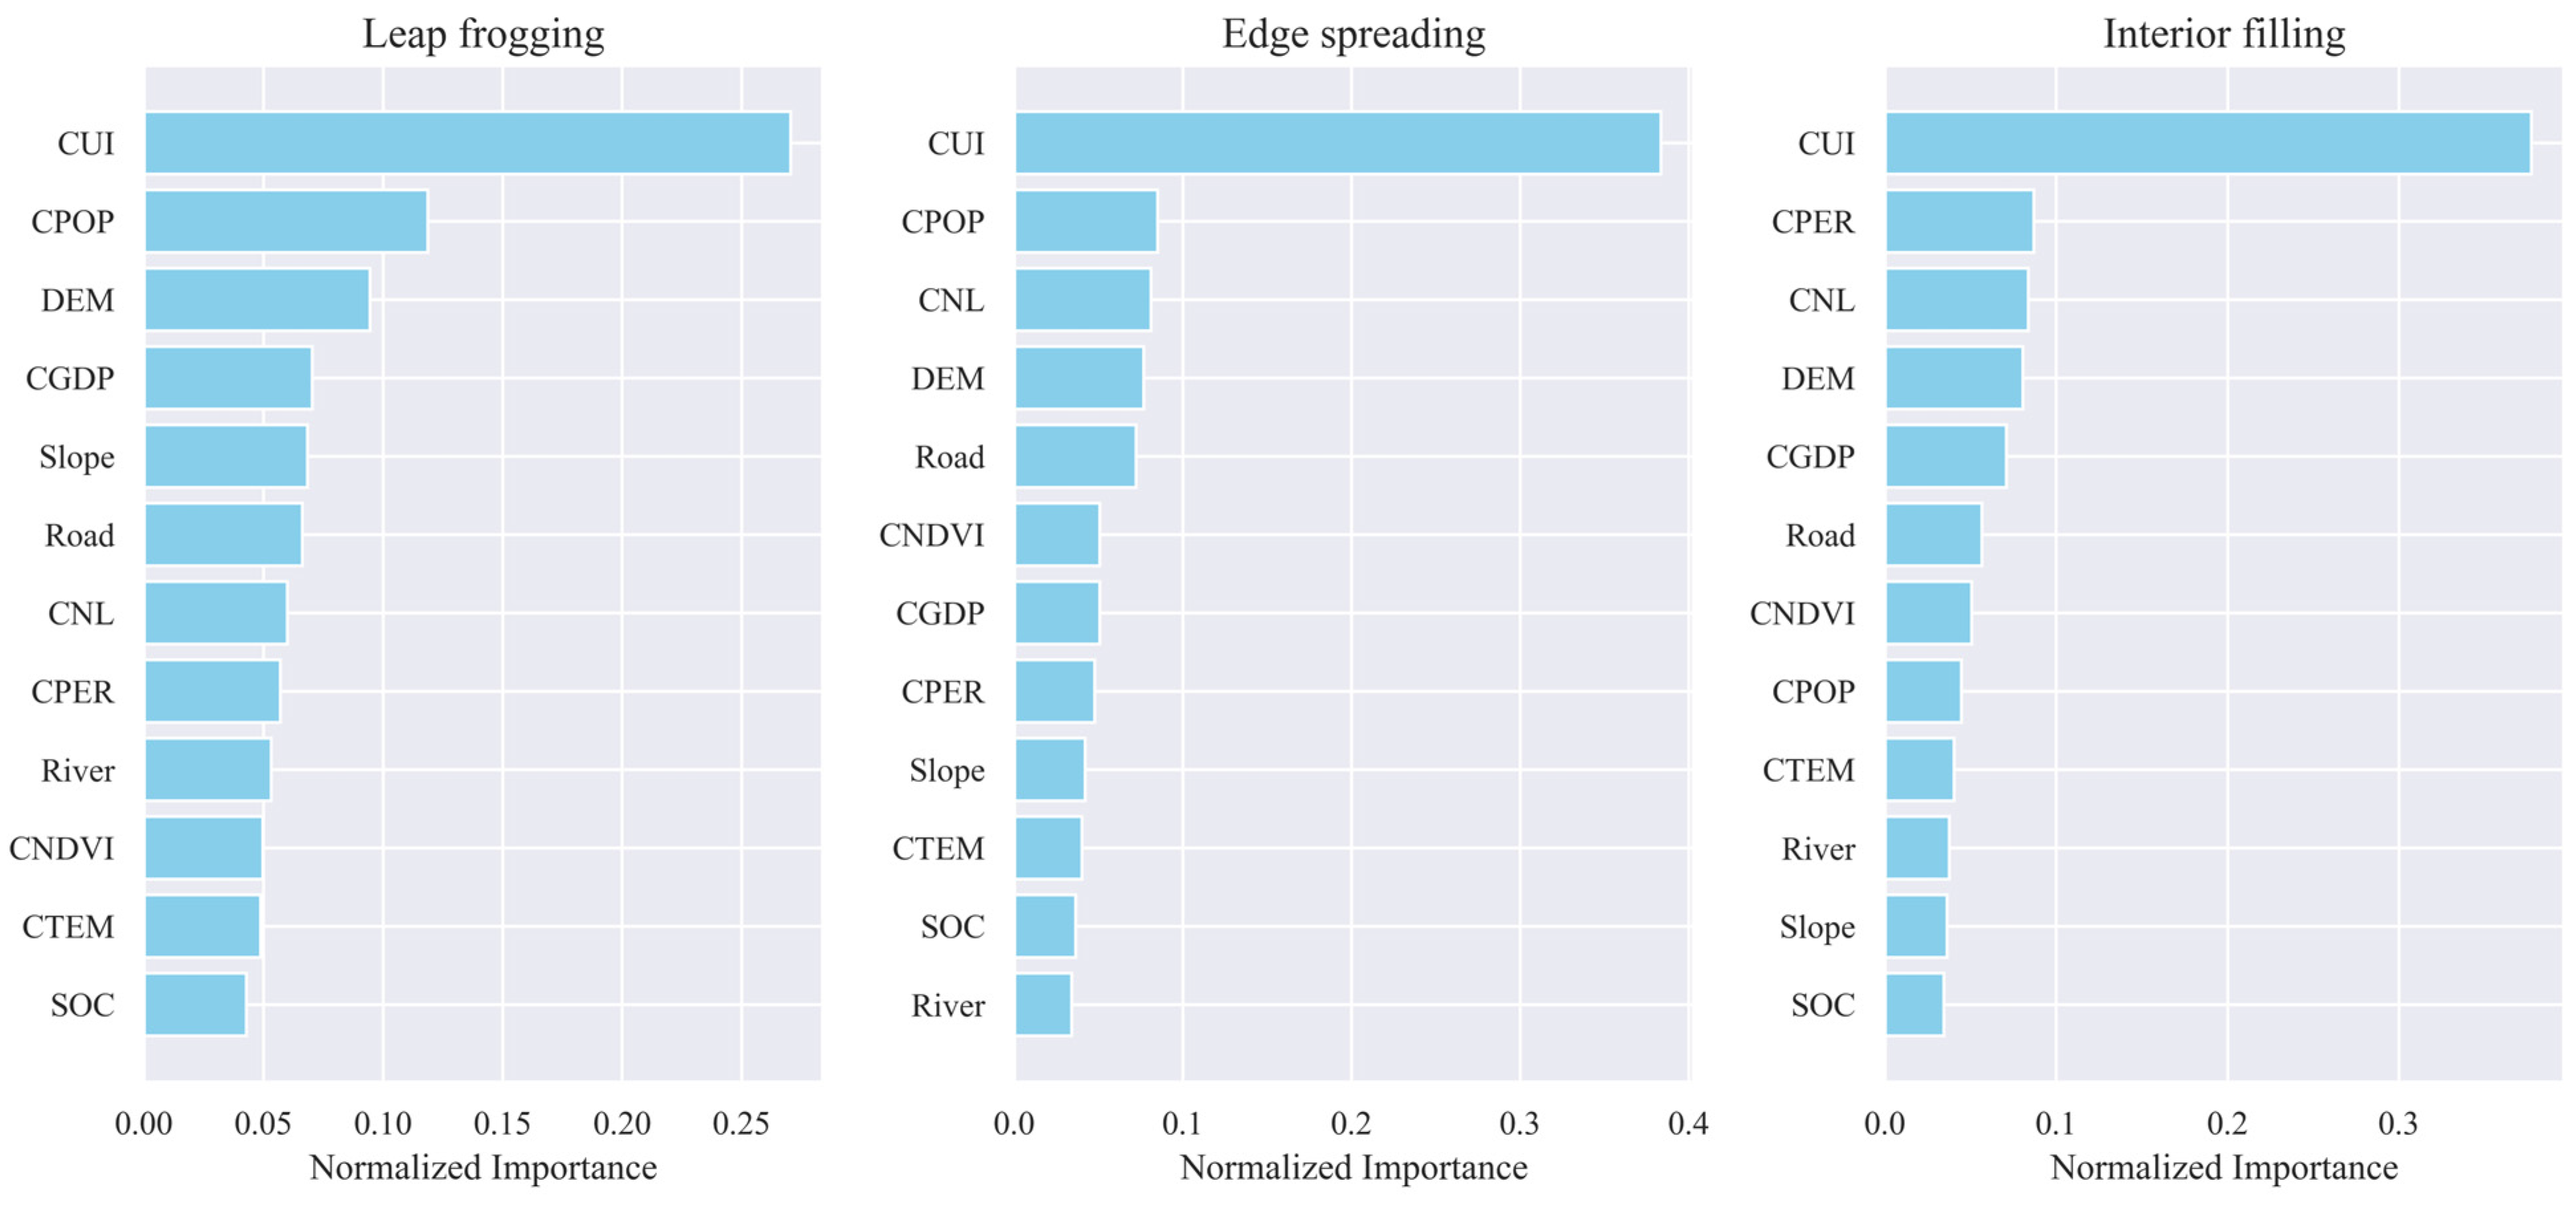
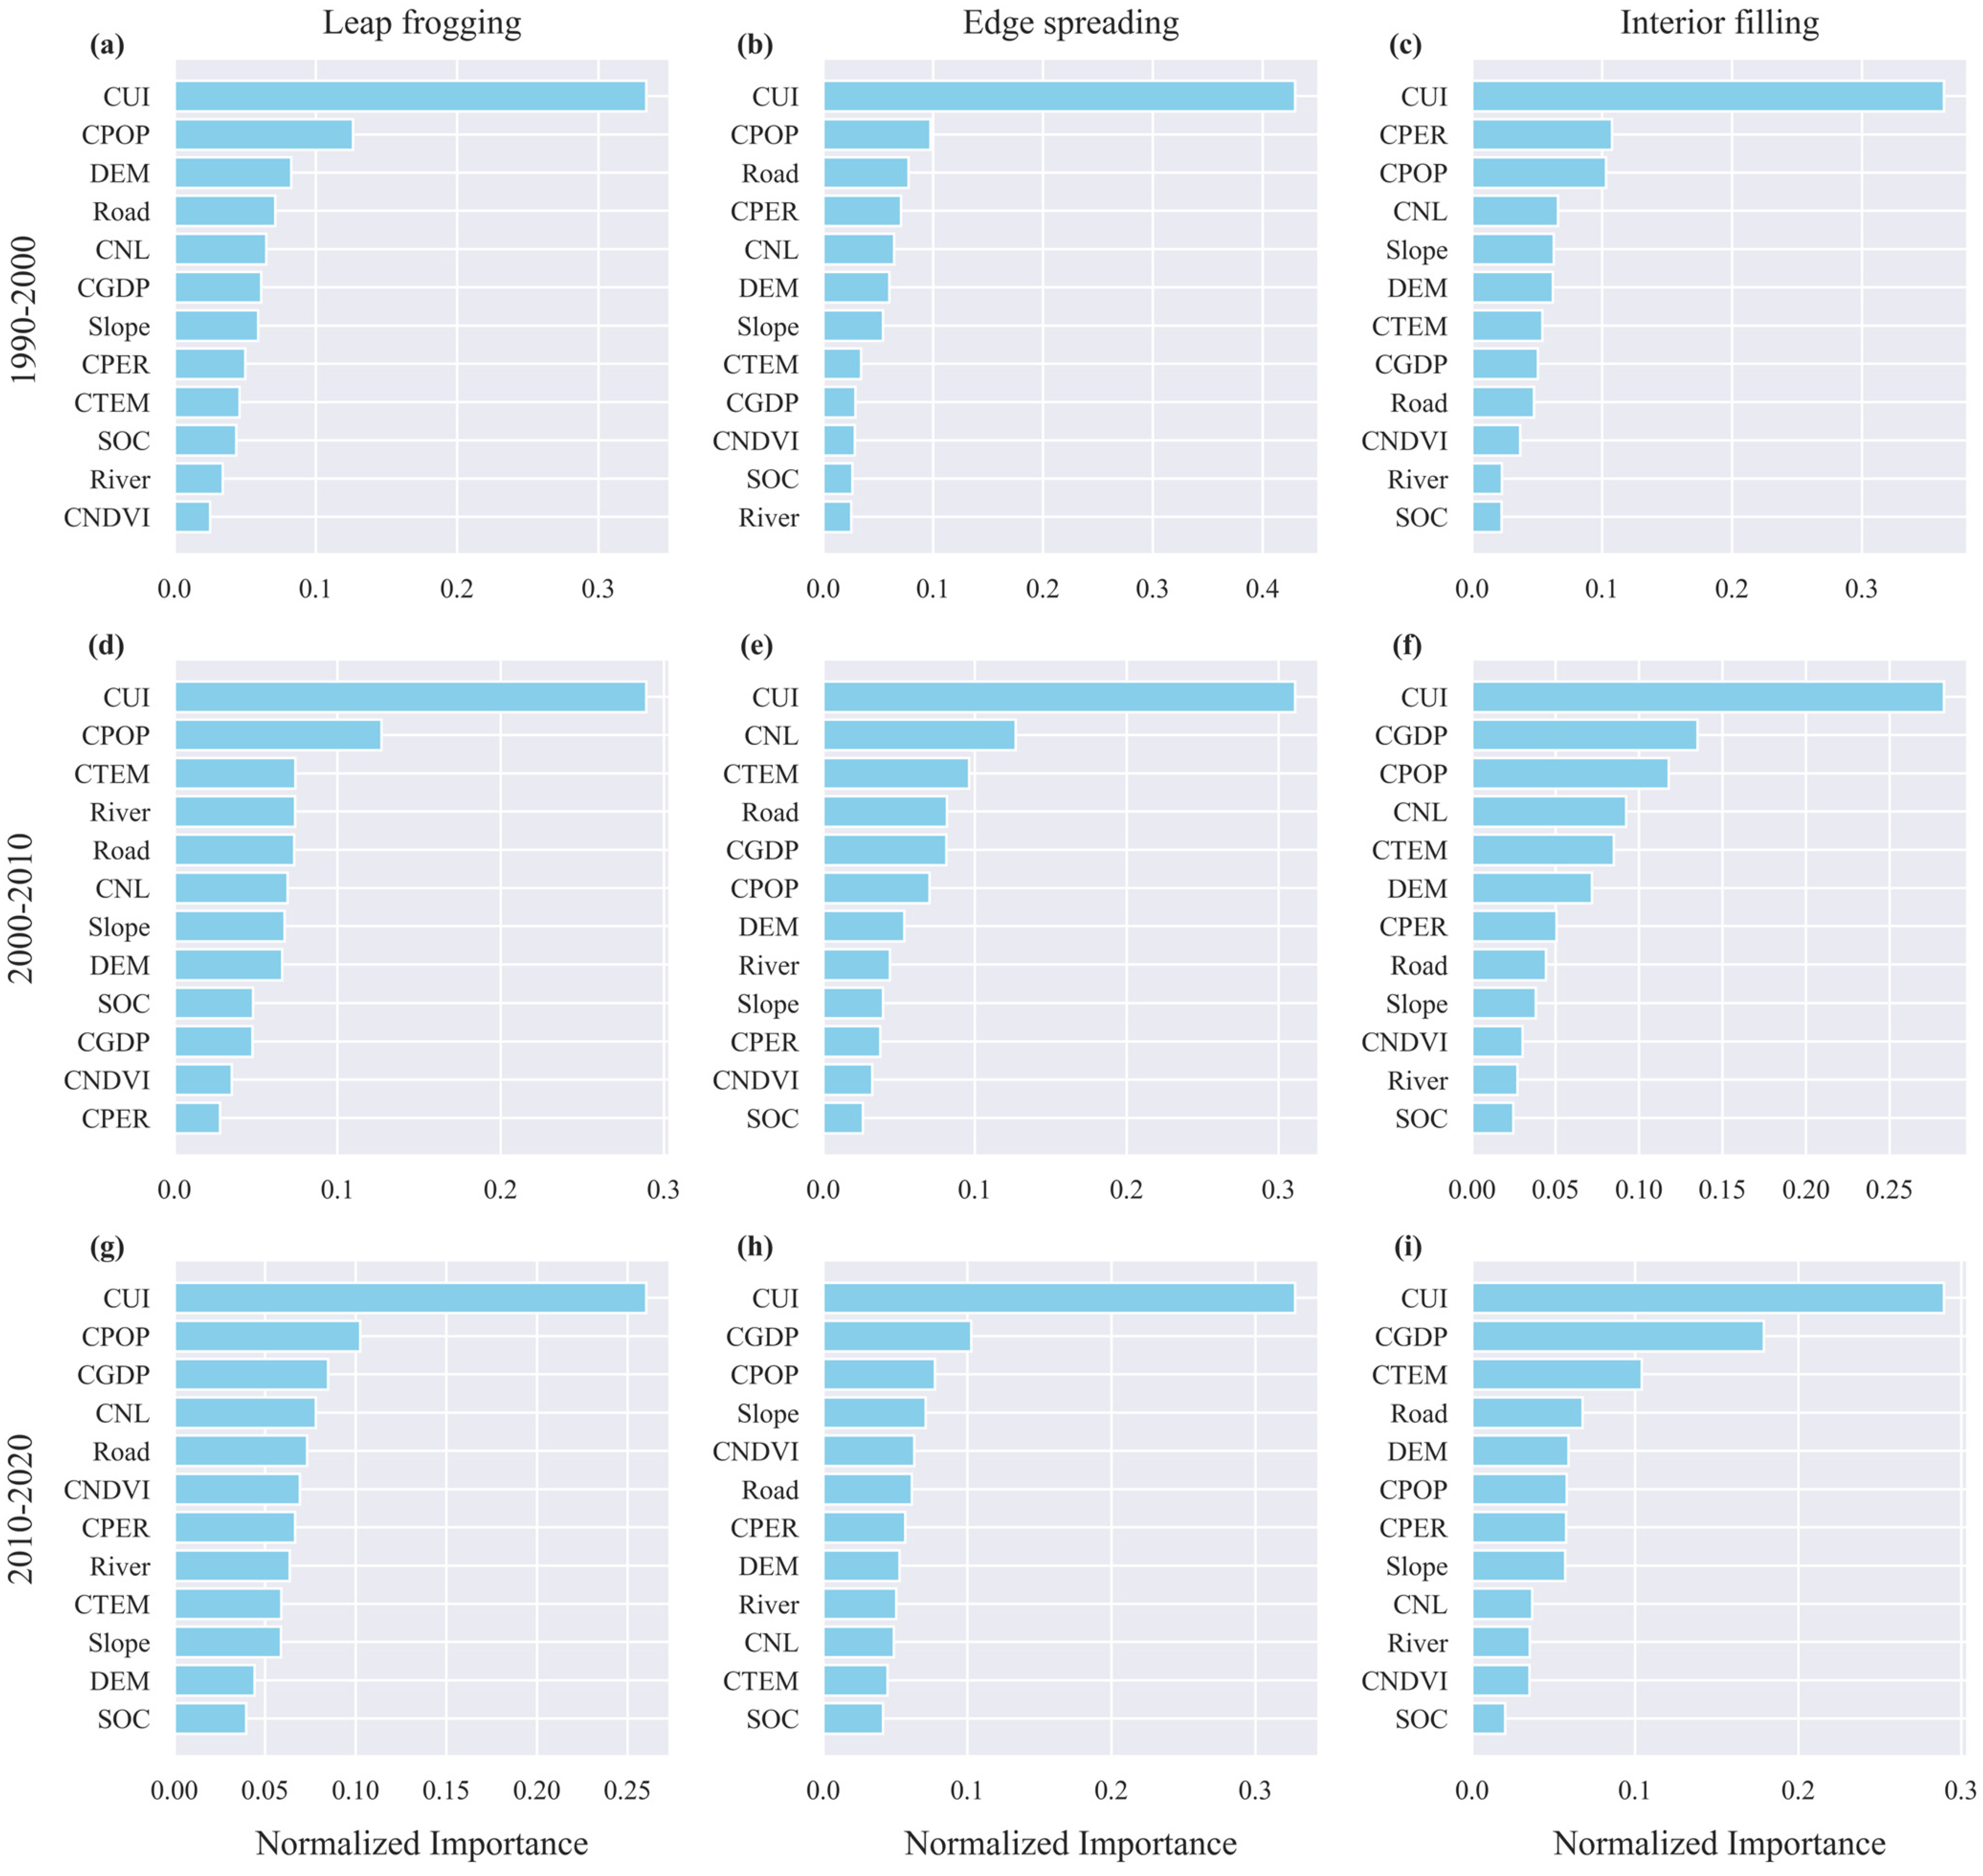
4.4. Key Driving Factors of Cropland Changes Under Different Urban Expansion Patterns

The key drivers of cropland loss vary significantly across different urban expansion patterns (Figure 5). Overall, CUI consistently emerged as the most critical driver across all types of expansion, underscoring the universal importance of urban expansion in reshaping cropland systems. Nevertheless, secondary drivers differed substantially among patterns, highlighting the complexity and diversity of cropland occupation processes.
In leap-frogging, the influence of CUI was particularly pronounced (SHAP = 0.28), far surpassing other factors. CPOP (0.12) and DEM (0.09) followed, suggesting that leap-frogging often targets populous, flat terrains, making cropland in such regions more vulnerable to urban expansion. In edge-spreading, the importance of CUI increases further (SHAP = 0.38), indicating that its dominant role in the loss of cropland is more pronounced in this pattern. CPOP and CNL also played significant roles (SHAP = 0.09 and 0.08, respectively), indicating that as cities spread outward, population concentration and urban activity levels become key auxiliary drivers. In interior filling, CUI remained the dominant factor (SHAP = 0.37). This indicates that high-intensity land use within urban areas is the primary cause of cropland loss in this pattern. Additionally, the influence of CPER, CNL, and DEM, with SHAP values ranging from 0.08 to 0.09, reflects the integrated sensitivity of the interior filling process to resource availability, environmental conditions, and locational factors.

5. Discussion

5.1. The Relationship Between Urban Expansion Patterns and Cropland Loss

Our findings investigate the distinct spatiotemporal impacts of different urban expansion patterns on cropland occupation. The results reveal significant spatiotemporal differences in arable land occupation, which may be closely linked to regional economic development, land resource conditions, and policy directions.
Edge-spreading emerged as the dominant form of urban expansion in China, accounting for 60.1% of the total expansion area. This pattern predominantly occurs in peri-urban areas, often leading to the occupation of high-quality, flat cropland [60,61]. These prime croplands exhibit high productivity, so edge expansion tends to be both concentrated and efficient, resulting in the rapid and large-scale loss of cropland resources [62,63]. This phenomenon is particularly pronounced in the eastern coastal and northeastern regions (Figure 4), where rapid urbanization and a high demand for land intensified cropland conversion.
In contrast, leap-frogging showed a decreasing trend in its impact on cropland loss. Between 2000 and 2010, the proportion of counties losing more than 5 km2 of cropland to leap-frogging dropped by 6.5% (Figure 4). Characterized by leap-frog development away from the urban boundary, this pattern primarily affects agricultural or underutilized lands on the urban periphery. The quality of arable land in these areas is generally lower than that of high-quality farmland near urban centers, and the land use is more dispersed, resulting in relatively smaller direct threats to arable land [64]. With the gradual optimization of land use planning, leap-frog expansion has increasingly considered the avoidance of high-productivity cropland during the site selection phase, thus alleviating pressure on arable land resources [65]. This shift reflects the implementation of arable land protection policies and the transition towards a more scientific and sustainable urban development approach.
Interior filling followed a more complex trajectory. Although initially modest, its occupation of cropland grew significantly from 2000 to 2020, especially in economically advanced regions like East China and the Pearl River Delta (Figure 4). Interior filling expansion typically occurs within existing urban areas, achieving urban growth by improving land use efficiency and increasing building density. While interior filling can theoretically spare peripheral cropland, intensification and infill development often come at the expense of urban green spaces or previously spared cropland pockets [66,67].

5.2. Evolution of Dominant Drivers of Cropland Loss Under Different Expansion Patterns

During the accelerated urbanization and transformation process from 1990 to 2020, the dominant factors driving arable land loss exhibited significant phase changes (Figure 6). In the early stage (1990–2000), CUI was the most significant driving factor across all expansion patterns (SHAP = 0.33, 0.43, 0.36). In addition, cropland loss during this period was notably influenced by urban activity indicators (such as CPOP and CNL) and basic locational characteristics (such as DEM and Road). The significant role of these factors indicates that early urban expansion was more likely to occur in relatively flat terrain and areas with a certain population base to meet the demands of industrialization and urbanization [68,69].
During 2000–2010, the driving forces became more diversified, with the influence of environmental and industrial factors gradually increasing. For example, in leap-frogging, the contribution of CTEM and River increased significantly, suggesting that urban expansion was progressively extending into areas with favorable climate and abundant water resources for agriculture [70]. In edge-spreading, the contribution of CNL reached 0.13, reflecting that the rapid development of the urban periphery has put significant pressure on the surrounding cropland. This pressure was especially pronounced in high-activity areas such as industrial parks and logistics hubs, where the demand for land for construction was likely more intense [71]. In interior filling, the influence of CGDP clearly increased. This may be due to the fact that, during the process of optimizing internal urban stock and land intensification, the development of cropland was often associated with the layout of high-value-added industries [72].
From 2010 to 2020, as China transitioned towards high-quality economic development, the driving factors for cropland loss became further complicated. In interior filling, CGDP emerged as the key factor after CUI, reflecting the profound influence of industrial restructuring and innovation-driven growth on internal land use patterns [73,74]. Meanwhile, in leap-frogging and edge-spreading, the importance of factors such as CPRE, River, and CNDVI steadily increased, demonstrating the gradual internalization of environmental and ecological values in land use decisions [75,76].
Overall, compared to the earlier expansion logic, which was primarily driven by basic conditions and population carrying capacity, the driving factors for cropland loss in the later period more profoundly reflect the combined effects of macroeconomic transformation, resource allocation strategies, and sustainable development policies [77,78]. This shift not only reveals the dynamic characteristics of China’s urbanization process but also provides a reference for future land use decision-making.

5.3. Implications for Policy and Planning

The findings of this study highlight the dynamic nature and regional differences of cropland loss under different urban expansion patterns, offering valuable insights for future land planning, land use policies, and cropland protection strategies.
First, for areas dominated by edge-spreading, tighter boundary controls and stricter enforcement of cropland protection policies are imperative. For example, China’s Basic Cropland Protection Regulation could be more rigorously implemented to designate permanent agricultural zones and prevent encroachment [79]. Additionally, integrating satellite-based monitoring systems, such as the Gaofen Earth Observation Program, can help detect and prevent unauthorized expansion. Strengthening land use planning constraints and promoting high-density development within urban cores can mitigate large-scale, high-quality cropland conversion.
Second, for regions historically characterized by leap-frogging expansions but now shifting toward more regulated development, improving planning frameworks can steer new construction toward areas with higher environmental carrying capacity and away from highly productive cropland. This can include revising land transfer policies to reflect the ecological and social value of cropland, thereby increasing both the incentive and attractiveness of cropland protection. Additionally, targeted zoning measures can prioritize construction on lower-quality cropland or underutilized lands. For example, preferential zoning for brownfield redevelopment, as seen in urban renewal projects in Futian, effectively reduces pressure on high-quality agricultural lands [80].
Finally, the rise of interior filling expansions suggests that policymakers should exercise caution in promoting intensive urban renewal and densification. Preserving some internal agricultural and green areas enhances urban multifunctionality and resilience, balancing the trade-offs between land efficiency and resource sustainability. For instance, integrating urban agriculture into urban planning, as demonstrated by Beijing’s peri-urban agricultural initiatives, effectively balances land efficiency with ecological benefits [81]. Moreover, enforcing the “no net loss” principle—such as mandating compensation with equal or higher quality for occupied cropland—can ensure a sustainable equilibrium between land occupation and restoration.
Overall, this study offers a fresh perspective on the mechanisms underlying cropland changes in the context of China’s urbanization, providing robust theoretical and empirical support for planning and policymaking. Integrating economic development, resource conservation, and environmental security into a coherent planning framework can guide urban expansion toward approaches that align with sustainable cropland management.

5.4. Future Perspectives

While this study provides valuable insights into cropland loss under different urban expansion patterns, several limitations warrant further exploration. First, the focus on cropland quantity overlooks the structural and functional impacts on cropland landscapes, such as fragmentation, connectivity, and agricultural productivity. Future research could adopt landscape ecology metrics to systematically assess these structural changes under varying urban expansion patterns.
Second, this study primarily relies on historical land use datasets with predefined geographic resolutions, which may introduce uncertainties in identifying finer-scale patterns of cropland loss. For instance, the resolution of the dataset might obscure small-scale leap-frogging developments or interior filling changes within highly urbanized areas. Future studies should consider integrating high-resolution remote sensing data, validation against ground truth observations, and uncertainty analysis to enhance the accuracy and reliability of spatial pattern identification.
Finally, this study primarily adopts a quantitative perspective to analyze the impact of urban expansion on the occupation of cropland, which under-discusses the societal implications of cropland loss, such as its impacts on food security and environmental sustainability. Future research should delve deeper into how cropland loss under different urban expansion patterns influences agricultural productivity, regional food supply stability, and ecological functions. Assessing the cascading effects of cropland reduction on ecosystem services and rural livelihoods will provide a more comprehensive understanding of the trade-offs involved in urban expansion.

6. Conclusions

This study systematically examined the patterns of cropland loss under different urban expansion patterns in China between 1990 and 2020, identified their key driving factors, and derived policy implications. The main conclusions are:
(1)
Between 1990 and 2020, China’s rapid urban expansion led to a substantial loss of cropland. Among the three patterns, edge-spreading accounted for the largest share, with 78,549 km2 of cropland lost—63.1% of the total. This highlights the urgent need for stricter urban boundary control and enhanced enforcement of cropland protection policies in peri-urban areas.
(2)
CUI was the most important driver of cropland loss across three patterns, with SHAP values of 0.28 (leap-frogging), 0.37 (interior filling), and 0.38 (edge-spreading). Over time, the factors evolved from a singular emphasis on demographic and economic metrics to a more intricate combination of industrial development, environmental attributes, and spatial considerations. This transformation reflects the increasing complexity of urban expansion processes and their diverse impacts on cropland loss.
(3)
Differentiated policy measures are needed to address the cropland loss arising from each urban expansion pattern. For edge-spreading regions, stricter urban boundary controls and robust cropland protection policies are critical to safeguarding high-quality cropland. In interior filling areas, enhancing land use efficiency while preserving green spaces and remaining cropland is vital. For regions with regulated leap-frogging expansion, optimizing existing construction land and focusing development on lower-quality areas can reduce pressure on distant, productive cropland. These targeted strategies promote sustainable urbanization and cropland conservation.

Author Contributions

C.M.: Conceptualization, Methodology, Investigation, Visualization, Writing—original draft. S.F.: Investigation, Writing—review and editing. C.Z.: Supervision, Writing—review and editing. All authors have read and agreed to the published version of the manuscript.

Funding

This work was supported by the National Natural Science Foundation of China (42401221) and the Science and Technology Projects of Guangzhou (Grant No. 2023A04J0923). It was also supported by the Special Funds for Science and Technology Talent Introduction of Guangdong Academy of Agricultural Sciences (Grant No. R2022YJ-YB1002).

Data Availability Statement

The data that support the findings of this study are available from the corresponding author upon reasonable request.

Conflicts of Interest

The authors declare that they have no known competing financial interests or personal relationships that could have appeared to influence the work reported in this paper.

References

  1. Li, F.; Wu, S.; Liu, H.; Yan, D. Biodiversity loss through cropland displacement for urban expansion in China. Sci. Total Environ. 2024, 907, 167988. [Google Scholar] [CrossRef]
  2. Ju, H.; Zhang, Z.; Zhao, X.; Wang, X.; Wu, W.; Yi, L.; Wen, Q.; Liu, F.; Xu, J.; Hu, S.; et al. The changing patterns of cropland conversion to built-up land in China from 1987 to 2010. J. Geogr. Sci. 2018, 28, 1595–1610. [Google Scholar] [CrossRef]
  3. Tu, Y.; Chen, B.; Yu, L.; Song, Y.; Wu, S.; Li, M.; Wei, H.; Chen, T.; Lang, W.; Gong, P.; et al. Raveling the nexus between urban expansion and cropland loss in China. Landsc. Ecol. 2023, 38, 1869–1884. [Google Scholar] [CrossRef]
  4. Deng, X.; Xu, X.; Cai, H.; Li, J. Assessment the impact of urban expansion on cropland net primary productivity in Northeast China. Ecol. Indic. 2024, 159, 111698. [Google Scholar] [CrossRef]
  5. Tu, Y.; Chen, B.; Yu, L.; Xin, Q.; Gong, P.; Xu, B. How does urban expansion interact with cropland loss? A comparison of 14 Chinese cities from 1980 to 2015. Landsc. Ecol. 2020, 36, 243–263. [Google Scholar] [CrossRef]
  6. Wu, X.; Zhao, N.; Wang, Y.; Zhang, L.; Wang, W.; Liu, Y. Cropland non-agriculturalization caused by the expansion of built-up areas in China during 1990–2020. Land Use Policy 2024, 146, 107312. [Google Scholar] [CrossRef]
  7. Forman, R.T.T. Land Mosaics: The Ecology of Landscapes and Regions; Cambridge University Press: Cambridge, UK, 1995. [Google Scholar]
  8. Liu, X.; Li, X.; Chen, Y.; Tan, Z.; Li, S.; Ai, B. A new landscape index for quantifying urban expansion using multi-temporal remotely sensed data. Landsc. Ecol. 2010, 25, 671–682. [Google Scholar] [CrossRef]
  9. Carol, E.H. Leapfrogging, urban sprawl, and growth management: Phoenix, 1950-2000. Am. J. Econ. Sociol. 2001, 60, 245–283. [Google Scholar]
  10. Hall, J. The Benefits and Costs of Urban Sprawl or Leapfrogging Urban Development; University of Western Sydney: Parramatta, Australia, 2009. [Google Scholar]
  11. Han, Y.; Qiao, D.; Zhang, Y.; Wang, J. Urban expansion dynamic and its potential effects on dry-wet circumstances in China’s national-level agricultural districts. Sci. Total Environ. 2022, 853, 158386. [Google Scholar] [CrossRef]
  12. Shrestha, M.K.; York, A.M.; Boone, C.G.; Zhang, S. Land fragmentation due to rapid urbanization in the Phoenix Metropolitan Area: Analyzing the spatiotemporal patterns and drivers. Appl. Geogr. 2012, 32, 522–531. [Google Scholar] [CrossRef]
  13. Tu, Y.; Chen, B.; Yu, L.; Xin, Q.; Gong, P.; Xu, B. Urban expansion driven farmland loss follows with the environmental Kuznets curve hypothesis: Evidence from temporal analysis in Beijing, China. In Geoinformatics in Sustainable Ecosystem and Society; Springer: Berlin/Heidelberg, Germany, 2019; pp. 394–412. [Google Scholar]
  14. Terfa, B.; Chen, N.; Liu, D.; Zhang, X.; Niyogi, D. Urban Expansion in Ethiopia from 1987 to 2017: Characteristics, Spatial Patterns, and Driving Forces. Sustainability 2019, 11, 2973. [Google Scholar] [CrossRef]
  15. Zhao, S.; Zhou, D.; Zhu, C.; Qu, W.; Zhao, J.; Sun, Y.; Huang, D.; Wu, W.; Liu, S. Rates and patterns of urban expansion in China’s 32 major cities over the past three decades. Landsc. Ecol. 2015, 30, 1541–1559. [Google Scholar] [CrossRef]
  16. Jia, L.; Ma, Q.; Du, C.; Hu, G.; Shang, C. Rapid urbanization in a mountainous landscape: Patterns, drivers, and planning implications. Landsc. Ecol. 2020, 35, 2449–2469. [Google Scholar] [CrossRef]
  17. Zhu, J. The formation of a market-oriented local property development industry in transitional China: A Shenzhen case study. Environ. Plann. A 1999, 31, 1839–1856. [Google Scholar] [CrossRef]
  18. Ranagalage, M.; Morimoto, T.; Simwanda, M.; Murayama, Y. Spatial Analysis of Urbanization Patterns in Four Rapidly Growing South Asian Cities Using Sentinel-2 Data. Remote Sens. 2021, 13, 1531. [Google Scholar] [CrossRef]
  19. Schneider, A.; Mertes, C.M.; Tatem, A.J.; Tan, B.; Sulla-Menashe, D.; Graves, S.J.; Patel, N.N.; Horton, J.A.; Gaughan, A.E.; Rollo, J.T.; et al. A new urban landscape in East–Southeast Asia, 2000–2010. Environ. Res. Lett. 2015, 10, 034002. [Google Scholar] [CrossRef]
  20. Meng, L.; Sun, Y.; Zhao, S. Comparing the spatial and temporal dynamics of urban expansion in Guangzhou and Shenzhen from 1975 to 2015: A case study of pioneer cities in China’s rapid urbanization. Land Use Policy 2020, 97, 104753. [Google Scholar] [CrossRef]
  21. Drake, E. The Leap-Frog Effect in the Context of Ontario’s Greenbelt: An Analysis of Farmland Loss in the Unprotected Countryside; University of Guelph: Guelph, ON, Canada, 2019. [Google Scholar]
  22. Zhou, K.; Liu, Y.; Tan, R.; Song, Y. Urban dynamics, landscape ecological security, and policy implications: A case study from the Wuhan area of central China. Cities 2014, 41, 141–153. [Google Scholar] [CrossRef]
  23. Tian, G.; Qiao, Z.; Gao, X. Rural settlement land dynamic modes and policy implications in Beijing metropolitan region, China. Habitat Int. 2014, 44, 237–246. [Google Scholar] [CrossRef]
  24. Xu, M.; He, C.; Liu, Z.; Dou, Y. How Did Urban Land Expand in China between 1992 and 2015? A Multi-Scale Landscape Analysis. PLoS ONE 2016, 11, e0154839. [Google Scholar] [CrossRef] [PubMed]
  25. Tarawneh, W.M.A. Urban sprawl on agricultural land litera. J. Environ. Earth Sci. 2014, 4, 97–124. [Google Scholar]
  26. Xu, Y.; Jia, R.; Liu, J.; Han, D.; He, T.; Xu, X.; Liu, L.; Sun, Z.; Qiao, Z. The population exposure risk of urban heat island effect: From the perspective of urban spatial expansion in China. Build. Environ. 2024, 258, 111565. [Google Scholar] [CrossRef]
  27. Ministry of Natural Resources of the People’s Republic of China. The Third National Land Survey; Ministry of Natural Resources of the People’s Republic of China: Beijing, China, 2021.
  28. Ma, L.; Long, H.; Tu, S.; Zhang, Y.; Zheng, Y. Farmland transition in China and its policy implications. Land Use Policy 2020, 92, 104470. [Google Scholar] [CrossRef]
  29. National Bureau of Statistics. Major Figures on 2020 Population Census of China; National Bureau of Statistics: Beijing, China, 2021. [Google Scholar]
  30. Zhou, Y.; Chen, T.; Feng, Z.; Wu, K. Identifying the contradiction between the cultivated land fragmentation and the construction land expansion from the perspective of urban-rural differences. Ecol. Inform. 2022, 71, 101826. [Google Scholar] [CrossRef]
  31. Yang, J.; Huang, X. The 30 m annual land cover dataset and its dynamics in China from 1990 to 2019. Earth Syst. Sci. Data 2021, 13, 3907–3925. [Google Scholar] [CrossRef]
  32. Han, J.; Han, F.; He, B.; Ma, X.; Wang, T. Spatiotemporal changes and driving factors of alpine land cover in Tianshan world natural heritage sites. Sci. Rep. 2024, 14, 20895. [Google Scholar] [CrossRef]
  33. Zhong, J.; Hao, L.; Sajinkumar, K.S.; Yan, D. Changes of ecological vulnerability in areas with different urban expansion patterns—A case study in the Yanhe river basin, China. J. Environ. Manag. 2024, 370, 122607. [Google Scholar] [CrossRef] [PubMed]
  34. Chen, Z.; Yu, B.; Yang, C.; Zhou, Y.; Yao, S.; Qian, X.; Wang, C.; Wu, B.; Wu, J. An extended time series (2000–2018) of global NPP-VIIRS-like nighttime light data from a cross-sensor calibration. Earth Sys. Sci. Data 2021, 13, 889–906. [Google Scholar] [CrossRef]
  35. Peng, L.; Huang, K.; Zhang, H.; Sun, W. Exploring the impacts of urbanization on vegetation growth from the perspective of urban expansion patterns and maturity: A case study on 40 large cities in China. Sustain. Cities Soc. 2024, 115, 105841. [Google Scholar] [CrossRef]
  36. Zhang, Y.; Shen, W.; Li, M.; Lv, Y. Assessing spatio-temporal changes in forest cover and fragmentation under urban expansion in Nanjing, eastern China, from long-term Landsat observations (1987–2017). Appl. Geogr. 2020, 117, 102190. [Google Scholar] [CrossRef]
  37. Zhao, K.; Fang, Z.; Li, J.; He, C. Spatial-temporal variations of groundwater storage in China: A multiscale analysis based on GRACE data. Resour. Conserv. Recy. 2023, 197, 107088. [Google Scholar] [CrossRef]
  38. Theil, H. A rank-invariant method of linear and polynomial regression analysis. In Henri Theil’s Contributions to Economics and Econometrics. Advanced Studies in Theoretical and Applied Econometrics; Raj, B., Koerts, J., Eds.; Springer: Dordrecht, The Netherlands, 1992; Volume 23. [Google Scholar]
  39. Yue, S.; Pilon, P.; Cavadias, G. Power of the Mann–Kendall and Spearman’s rho tests for detecting monotonic trends in hydrological series. J. Hydrol. 2002, 259, 254–271. [Google Scholar] [CrossRef]
  40. Dinpashoh, Y.; Jhajharia, D.; Fakheri-Fard, A.; Singh, V.P.; Kahya, E. Trends in reference crop evapotranspiration over Iran. J. Hydrol. 2011, 399, 422–433. [Google Scholar] [CrossRef]
  41. Coupe, R.H.; Barlow, J.R.B.; Capel, P.D. Complexity of human and ecosystem interactions in an agricultural landscape. Environ. Dev. 2012, 4, 88–104. [Google Scholar] [CrossRef]
  42. Peng, H.; Zhang, X.; Ren, W.; He, J. Spatial pattern and driving factors of cropland ecosystem services in a major grain-producing region: A production-living-ecology perspective. Ecol. Indic. 2023, 155, 111024. [Google Scholar] [CrossRef]
  43. Azadi, H.; Ho, P.; Hasfiati, L. Agricultural land conversion drivers: A comparison between less developed, developing and developed countries. Land Degrad. Dev. 2010, 22, 596–604. [Google Scholar] [CrossRef]
  44. Wu, Y.; Wu, Z.; Liu, X. Dynamic Changes of Net Primary Productivity and Associated Urban Growth Driving Forces in Guangzhou City, China. Environ. Manag. 2020, 65, 758–773. [Google Scholar] [CrossRef] [PubMed]
  45. Qiao, X.; Liu, H.; Liu, Y.; Gong, P.; Li, P.; Li, L. Analysis of spatial and temporal evolution and drivers of cropland in the economic zone of the northern slope of Tianshan mountain. Environ. Res. Commun. 2023, 5, 105010. [Google Scholar] [CrossRef]
  46. Lu, D.; Su, K.; Wang, Z.; Hou, M.; Li, X.; Lin, A.; Yang, Q. Patterns and drivers of terrace abandonment in China: Monitoring based on multi-source remote sensing data. Land Use Policy 2024, 148, 107388. [Google Scholar] [CrossRef]
  47. Wang, S.; Peng, H. Multiple spatio-temporal scale runoff forecasting and driving mechanism exploration by K-means optimized XGBoost and SHAP. J. Hydrol. 2024, 630, 130650. [Google Scholar] [CrossRef]
  48. Zhang, G.; Li, X.; Zhang, L.; Wei, X. Dynamics and causes of cropland Non-Agriculturalization in typical regions of China: An explanation Based on interpretable Machine learning. Ecol. Indic. 2024, 166, 112348. [Google Scholar] [CrossRef]
  49. Yu, Z.; Li, Z.; Yang, H.; Wang, Y.; Cui, Y.; Lei, G.; Ye, S. Contrasting responses of spatiotemporal patterns of cropland to climate change in Northeast China. Food Secur. 2023, 15, 1197–1214. [Google Scholar] [CrossRef]
  50. Hasan, S.; Shi, W.; Zhu, X.; Abbas, S. Monitoring of Land Use/Land Cover and Socioeconomic Changes in South China over the Last Three Decades Using Landsat and Nighttime Light Data. Remote Sens. 2019, 11, 1658. [Google Scholar] [CrossRef]
  51. Zhang, Y.; Li, C.; Wang, T.; Cai, C.; Bao, Y. County-level patterns of cropland and their relationships with socio-economic factors in northwestern China. Agr. Ecosyst. Environ. 2015, 203, 11–18. [Google Scholar] [CrossRef]
  52. Li, Y.; Li, Y.; Westlund, H.; Liu, Y. Urban–rural transformation in relation to cultivated land conversion in China: Implications for optimizing land use and balanced regional development. Land Use Policy 2015, 47, 218–224. [Google Scholar] [CrossRef]
  53. Liu, J.; Kuang, W.; Zhang, Z.; Xu, X.; Qin, Y.; Ning, J.; Zhou, W.; Zhang, S.; Li, R.; Yan, C.; et al. Spatiotemporal characteristics, patterns, and causes of land-use changes in China since the late 1980s. J. Geogr. Sci. 2014, 24, 195–210. [Google Scholar] [CrossRef]
  54. PRC China National Committee to Implement the UNCCD (CCICCD). China Final National Report of the Voluntary Land Degradation Neutrality (LDN) Target Setting Programme; CCICCD: Beijing, China, 2017. [Google Scholar]
  55. Zhou, T.; Tan, R.; Shu, X. Rigidity with partial elasticity: Local government adaptation under the centralized land quota system in China. Land Use Policy 2022, 118, 106138. [Google Scholar] [CrossRef]
  56. Huo, C.; Chen, L. The impact of land transfer policy on sustainable agricultural development in China. Sci. Rep. 2024, 14, 7064. [Google Scholar] [CrossRef] [PubMed]
  57. Li, X.; Zhang, X.; Jin, X. Spatio-temporal characteristics and driving factors of cultivated land change in various agricultural regions of China: A detailed analysis based on county-level data. Ecol. Indic. 2024, 166, 112485. [Google Scholar] [CrossRef]
  58. Rahimi, A. A methodological approach to urban land-use change modeling using infill development pattern—A case study in Tabriz, Iran. Ecol. Process. 2016, 5, 1. [Google Scholar] [CrossRef]
  59. Shen, X.; Wang, X.; Zhang, Z.; Lu, Z.; Lv, T. Evaluating the effectiveness of land use plans in containing urban expansion: An integrated view. Land Use Policy 2019, 80, 205–213. [Google Scholar] [CrossRef]
  60. Pribadi, D.O.; Pauleit, S. The dynamics of peri-urban agriculture during rapid urbanization of Jabodetabek Metropolitan Area. Land Use Policy 2015, 48, 13–24. [Google Scholar] [CrossRef]
  61. Tian, P.; Liu, Y.; Li, J.; Pu, R.; Cao, L.; Zhang, H. Spatiotemporal patterns of urban expansion and trade-offs and synergies among ecosystem services in urban agglomerations of China. Ecol. Indic. 2023, 148, 110057. [Google Scholar] [CrossRef]
  62. Bren d’Amour, C.; Reitsma, F.; Baiocchi, G.; Barthel, S.; Guneralp, B.; Erb, K.H.; Haberl, H.; Creutzig, F.; Seto, K.C. Future urban land expansion and implications for global croplands. Proc. Natl. Acad. Sci. USA 2017, 114, 8939–8944. [Google Scholar] [CrossRef] [PubMed]
  63. Li, W.; Wang, D.; Li, Y.; Zhu, Y.; Wang, J.; Ma, J. A multi-faceted, location-specific assessment of land degradation threats to peri-urban agriculture at a traditional grain base in northeastern China. J. Environ. Manag. 2020, 271, 111000. [Google Scholar] [CrossRef]
  64. Jiang, P.; Li, M.; Sheng, Y. Spatial regulation design of farmland landscape around cities in China: A case study of Changzhou City. Cities 2020, 97, 102504. [Google Scholar] [CrossRef]
  65. Xia, N.; Wang, Y.; Xu, H.; Sun, Y.; Yuan, Y.; Cheng, L.; Jiang, P.; Li, M. Demarcation of Prime Farmland Protection Areas around a Metropolis Based on High-Resolution Satellite Imagery. Sci. Rep. 2016, 6, 37634. [Google Scholar] [CrossRef] [PubMed]
  66. Liu, X.; Li, Y.; Zhang, S.; Niu, Q. Spatiotemporal patterns, driving mechanism, and multi-scenario simulation of urban expansion in Min Delta Region, China. Ecol. Indic. 2024, 158, 111312. [Google Scholar] [CrossRef]
  67. Zhou, X.; Wang, Y.-C. Spatial–temporal dynamics of urban green space in response to rapid urbanization and greening policies. Landsc. Urban Plan. 2011, 100, 268–277. [Google Scholar] [CrossRef]
  68. Hu, Y.; Connor, D.S.; Stuhlmacher, M.; Peng, J.; Turner Ii, B.L. More urbanization, more polarization: Evidence from two decades of urban expansion in China. NPJ Urban Sustain. 2024, 4, 33. [Google Scholar] [CrossRef]
  69. Rustiadi, E.; Pravitasari, A.E.; Setiawan, Y.; Mulya, S.P.; Pribadi, D.O.; Tsutsumida, N. Impact of continuous Jakarta megacity urban expansion on the formation of the Jakarta-Bandung conurbation over the rice farm regions. Cities 2021, 111, 103000. [Google Scholar] [CrossRef]
  70. Liu, X.; Huang, Y.; Xu, X.; Li, X.; Li, X.; Ciais, P.; Lin, P.; Gong, K.; Ziegler, A.D.; Chen, A.; et al. High-spatiotemporal-resolution mapping of global urban change from 1985 to 2015. Nat. Sustain. 2020, 3, 564–570. [Google Scholar] [CrossRef]
  71. Kuang, W.; Liu, J.; Dong, J.; Chi, W.; Zhang, C. The rapid and massive urban and industrial land expansions in China between 1990 and 2010: A CLUD-based analysis of their trajectories, patterns, and drivers. Landsc. Urban Plan. 2016, 145, 21–33. [Google Scholar] [CrossRef]
  72. Kang, L.; Ma, L.; Liu, Y. Comparing the driving mechanisms of different types of urban construction land expansion: A case study of the Beijing-Tianjin-Hebei region. J. Geogra. Sci. 2024, 34, 722–744. [Google Scholar] [CrossRef]
  73. Cao, H.; Chen, W.; Tan, X.; Li, Q. Identification and driving mechanism of the industrial land use transition in China. Habitat Int. 2023, 138, 102848. [Google Scholar] [CrossRef]
  74. Dong, Y.; Jin, G.; Deng, X. Dynamic interactive effects of urban land-use efficiency, industrial transformation, and carbon emissions. J. Clean. Prod. 2020, 270, 122547. [Google Scholar] [CrossRef]
  75. Tonne, C.; Adair, L.; Adlakha, D.; Anguelovski, I.; Belesova, K.; Berger, M.; Brelsford, C.; Dadvand, P.; Dimitrova, A.; Giles-Corti, B.; et al. Defining pathways to healthy sustainable urban development. Environ. Int. 2021, 146, 106236. [Google Scholar] [CrossRef]
  76. Zhou, L.; Zhou, C.; Che, L.; Wang, B. Spatio-temporal evolution and influencing factors of urban green development efficiency in China. J. Geogr. Sci. 2020, 30, 724–742. [Google Scholar] [CrossRef]
  77. Hu, Y.; Li, Y.; Li, Y.; Wu, J.; Zheng, H.; He, H. Balancing urban expansion with a focus on ecological security: A case study of Zhaotong City, China. Ecol. Indic. 2023, 156, 111105. [Google Scholar] [CrossRef]
  78. Colsaet, A.; Laurans, Y.; Levrel, H. What drives land take and urban land expansion? A systematic review. Land Use Policy 2018, 79, 339–349. [Google Scholar] [CrossRef]
  79. Zhong, T.; Mitchell, B.; Scott, S.; Huang, X.; Li, Y.; Lu, X. Growing centralization in China’s farmland protection policy in response to policy failure and related upward-extending unwillingness to protect farmland since 1978. Environ. Plan. C-Polit. 2017, 35, 1075–1097. [Google Scholar] [CrossRef]
  80. Cheng, F.; Geertman, S.; Kuffer, M.; Zhan, Q. An integrative methodology to improve brownfield redevelopment planning in Chinese cities: A case study of Futian, Shenzhen. Comput. Environ. Urban. 2011, 35, 388–398. [Google Scholar] [CrossRef]
  81. Yang, Z.; Hao, P.; Liu, W.; Cai, J. Peri-urban agricultural development in Beijing: Varied forms, innovative practices and policy implications. Habitat Int. 2016, 56, 222–234. [Google Scholar] [CrossRef]
Figure 1. Land use distribution for the study area in 2020.
Land 14 00343 g001
Figure 2. Changes in urban expansion patterns, 1990–2020. Note: (a) Time series of urban expansion areas for each pattern; (bd) spatial distributions of leap-frogging, edge-spreading, and interior filling expansion pattern, respectively.
Land 14 00343 g002
Figure 3. Trend and pattern of cropland area change in 1990–2020. Note: (a) Trend of cropland area; (b) Spatial pattern of cropland change. The pie chart shows the proportion of counties at different levels, with those designated as “white” indicating no statistically significant trend.
Land 14 00343 g003
Figure 4. Cropland occupation by different urban expansion patterns. Note: (a,d,g) show edge-spreading, leap-frogging, and interior filling for 1990–2000; (b,e,h) for 2000–2010; (c,f,i) for 2010–2020. The bar charts indicate the proportion of counties under different levels of cropland loss.
Land 14 00343 g004
Figure 5. Contribution of driving factors to cropland loss under different urban expansion patterns.
Land 14 00343 g005
Figure 6. Contribution of driving factors to cropland loss under different periods and urban expansion patterns. Note: (ac) show leap-frogging, edge-spreading, and interior filling for 1990–2000; (df) for 2000–2010; (gi) for 2010–2020.
Land 14 00343 g006
Table 2. Cropland loss under different urban expansion patterns.
Leap-Frogging/km2Edge-Spreading/km2Interior Filling/km2Total/km2
1990–200016,58722,32891539,830
2000–201012,23626,981176740,984
2010–202011,71929,240279443,753
Total40,54278,5495476124,567
Disclaimer/Publisher’s Note: The statements, opinions and data contained in all publications are solely those of the individual author(s) and contributor(s) and not of MDPI and/or the editor(s). MDPI and/or the editor(s) disclaim responsibility for any injury to people or property resulting from any ideas, methods, instructions or products referred to in the content.

