Article

Intrinsic Mechanisms of Differences in Wetting-Induced Deformation of Soils on Chinese Loess Plateau: Insights into Land Stability and Sustainable Management

1
State Key Laboratory of Continental Dynamics, Northwest University, Xi’an 710069, China
2
Department of Geology, Northwest University, Xi’an 710069, China
3
Xi’an Key Laboratory of Prevention of Loess Dynamic Disaster and Restoration of Environment, Northwest University, Xi’an 710069, China
*
Author to whom correspondence should be addressed.
Land 2025, 14(2), 312; https://doi.org/10.3390/land14020312
Submission received: 24 December 2024 / Revised: 24 January 2025 / Accepted: 1 February 2025 / Published: 3 February 2025
(This article belongs to the Section Land, Soil and Water)

Abstract

:
Wetting-induced soil deformation significantly impacts land stability and management on the Chinese Loess Plateau. This study analyzed silt soils from the Late Pleistocene (1 m depth) and Middle Pleistocene (25 m depth) to investigate compression and collapsible deformation during wetting. The compression in both soils progressed through three stages: slow deformation under low pressure, accelerated deformation under moderate pressure, and decelerated deformation under high pressure. Wetting intensified the compression in the 1 m sample but reduced it in the 25 m sample, with the deformation becoming more sensitive to the initial water content under higher pressures. Collapse tests showed contrasting behaviors: the 1 m sample exhibited collapsibility, while the 25 m sample displayed expansiveness (a negative collapsibility coefficient). Microstructural analysis revealed that the 1 m sample with abundant macropores and overhead structures had a lower structural stability than the 25 sample with more stable, rounded micropores. The wetting-induced deformation was governed by the balance between clay mineral expansion and structural collapse, with collapsibility prevailing when collapse dominated and expansiveness prevailing when expansion was predominant. These findings provide valuable insights into soil–water interactions and support improved land use and management strategies in the loess region.

1. Introduction

Natural soils often undergo significant changes in their engineering properties due to rainfall, irrigation, or rising groundwater levels [1,2,3]. Typically, soils exhibit high strength at low water contents, but water infiltration rapidly reduces their strength, causing deformation and potential disasters [4,5]. Wetting-induced soil deformation has led to numerous geotechnical issues, such as ground subsidence, slope instability, and road collapses [6,7]. The occurrence of these issues not only incurs substantial economic losses but also poses significant challenges to the sustainable development of regional economies [8]. Thus, understanding the processes of soil deformation under wetting conditions and their underlying mechanisms is crucial for assessing land stability and enhancing land management strategies.
Loess, a loosely structured, silty soil, is extensively distributed across mid-latitude regions globally, particularly on the Chinese Loess Plateau (CLP) [9,10]. Its water sensitivity, stemming from its unique metastable structure, has been a key research focus in soil science [11,12]. Current studies on wetting-induced deformation in loess mainly focus on influencing factors [13], construction treatments [14], and predictive evaluations [15]. Factors influencing wetting-induced deformation in loess can be broadly categorized into macroscopic and microscopic aspects. Macroscopic factors include the loading pressure, initial water content, and compaction degree, while microscopic factors primarily involve the pore size distribution, particle size distribution, and mineral composition [16,17,18,19,20]. For unsaturated loess, the pressure exerts the most significant influence, followed by the compaction degree and initial water content. Under identical pressure, higher compaction and a higher initial water content result in reduced wetting-induced deformation [18,21]. Microscopically, the pore and particle size distributions are strongly linked to the soil compaction and structural stability [22]. Variations at the microscopic level directly influence the macroscopic differences in the wetting-induced deformation of loess.
The wetting-induced deformation in loess shows substantial variation across regions and depths. Spatially, the intensity of the wetting deformation in loess increases with the proximity to its source area [23]. For example, in the CLP, wetting-induced deformation intensifies from the southeast to the northwest due to the higher coarse particle content near the source, forming a metastable structure with abundant large pores [24,25]. These microstructures and large pores provide the prerequisites and spatial foundation for the wetting-induced deformation in loess [26]. While loess typically undergoes collapsible deformation upon wetting, some studies have reported expansive characteristics in loess [27,28,29]. Vertically, high collapsibility is often observed in shallow Late Pleistocene (Q3) loess layers (Malan loess), while deeper Middle Pleistocene (Q2) loess layers (Lishi loess) typically show greater stability [30]. These differences are closely linked to factors such as the water content, mineral composition, and structural features [19,31,32]. However, most of the existing research has focused on wetting deformation in shallow loess, with limited attention to the differences in the wetting-induced deformation across loess layers from different geological periods.
The constitutive relationships of collapsible soils and their wetting-induced deformation mechanisms have been a major focus of geotechnical engineering research [33,34]. Studies on the constitutive models of collapsible soils began in the 1950s, emphasizing volume changes induced by wetting in practical applications [35]. Early models relied on incremental elastic predictions of volume changes in unsaturated soils [36,37]. As the understanding of wetting-induced swelling advanced, incremental, three-dimensional elastic models were extended to collapsible soils [38]. However, wetting collapse causes irreversible soil damage, indicating that the deformation process aligns more closely with elastoplastic behavior [39]. Elastoplastic constitutive models, such as the BExM [40] and BBM [39], employ multiple yield surfaces to simulate and predict wetting deformation in unsaturated collapsible soils. Despite their utility, these models are limited and cannot be universally applied to both expansive and collapsible soils. To address these limitations, Zhang and Riad [41] introduced a unified approach, the Modified State Surface Approach. Over time, various numerical methods have been developed to simulate wetting-induced deformation, including the critical state model employed by Komolvilas et al. [42] to examine the effects of the density and stress state. Advances in soil microstructure research and quantification have highlighted its crucial role in wetting-induced deformation [24,43]. Dual-structure (micro-/macro-)models have been proposed for expansive soils [44]. Metastable particle contacts and open pore structures are key conditions for collapsible deformation [9,20,45]. Soils with high fine-grained contents exhibit more stable microstructures, which reduce wetting deformation [46]. Additionally, studies emphasize the critical role of cementing materials, such as calcium carbonate, in wetting deformation. Their dissolution during wetting accelerates structural damage and collapse [16,47]. Nevertheless, the coupled effects of the microstructure and mineral composition on wetting-induced deformation remain underexplored.
To address this gap, this study investigated loess samples from different geological periods on the CLP, focusing on undisturbed samples subjected to consolidation–collapse tests and microstructural analysis under varying initial water contents. The primary objectives were to (1) analyze the evolution of the deformation during wetting, (2) compare the wetting-induced deformation differences across loess layers from different geological periods, and (3) investigate how the microstructure and mineral composition influence the collapsible deformation. The findings offer valuable insights into soil–water interactions causing land degradation and hold significant scientific and practical relevance for land use and sustainable management in loess regions.

2. Materials and Experimental Methods

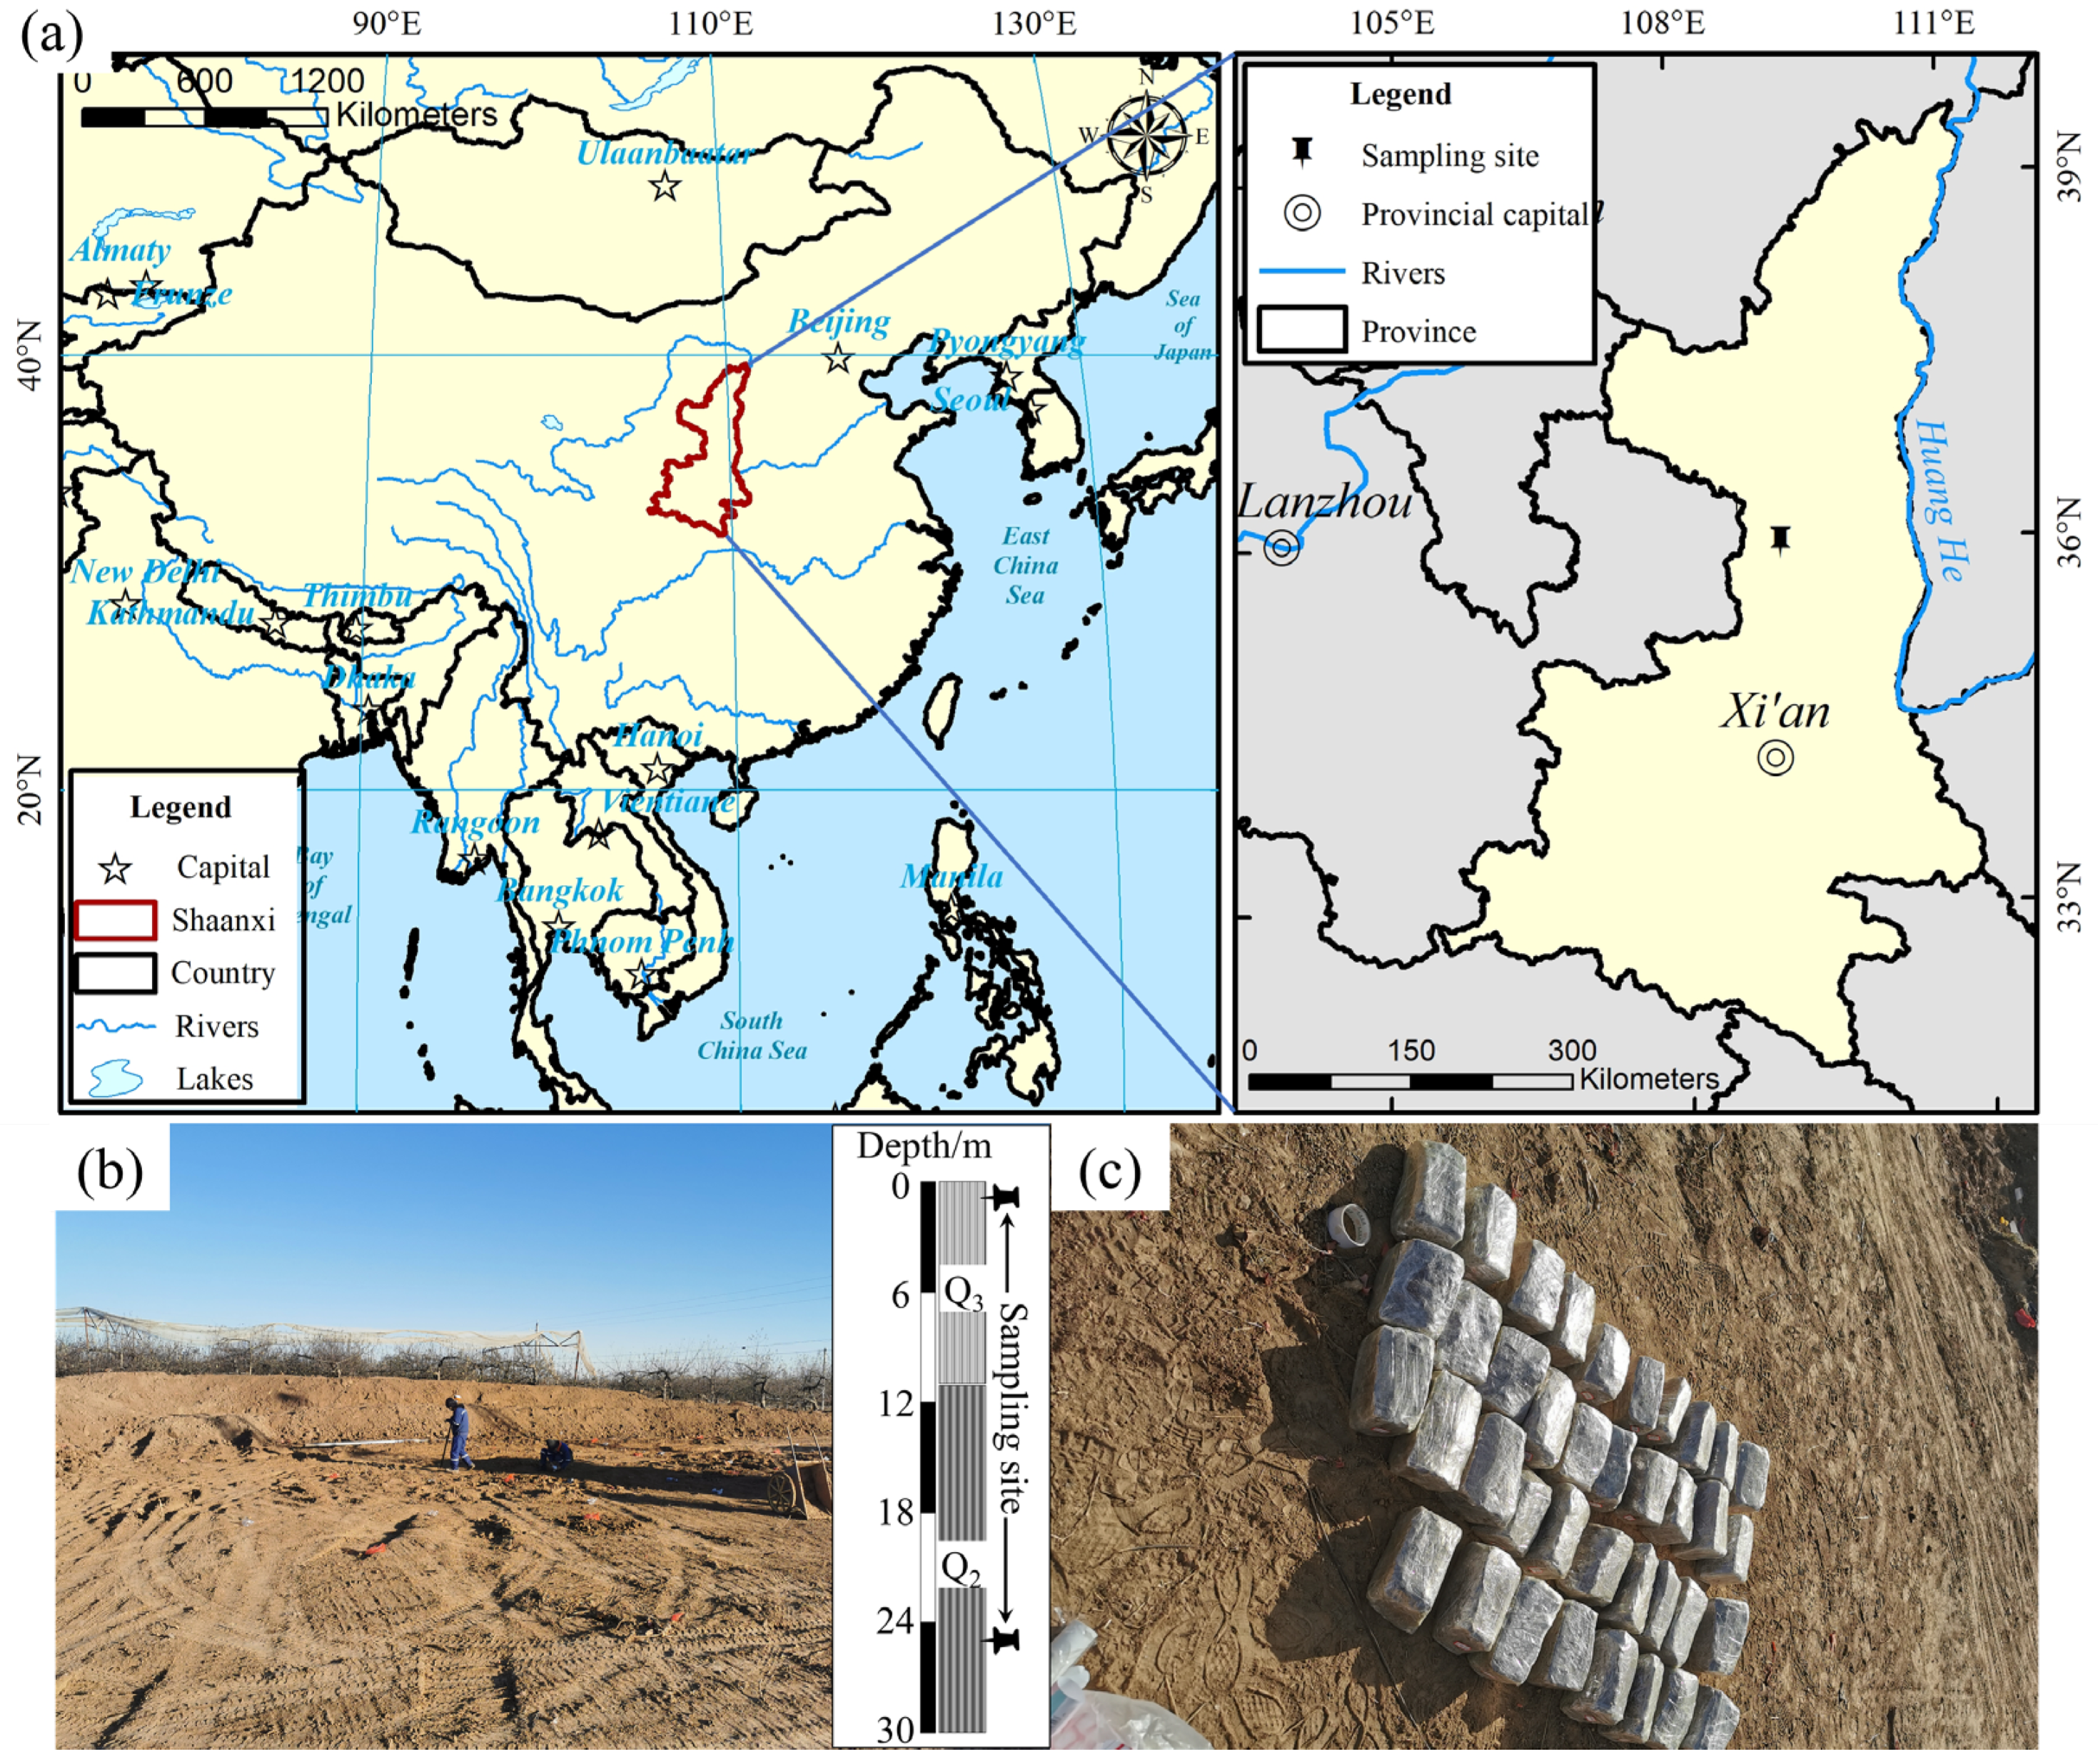
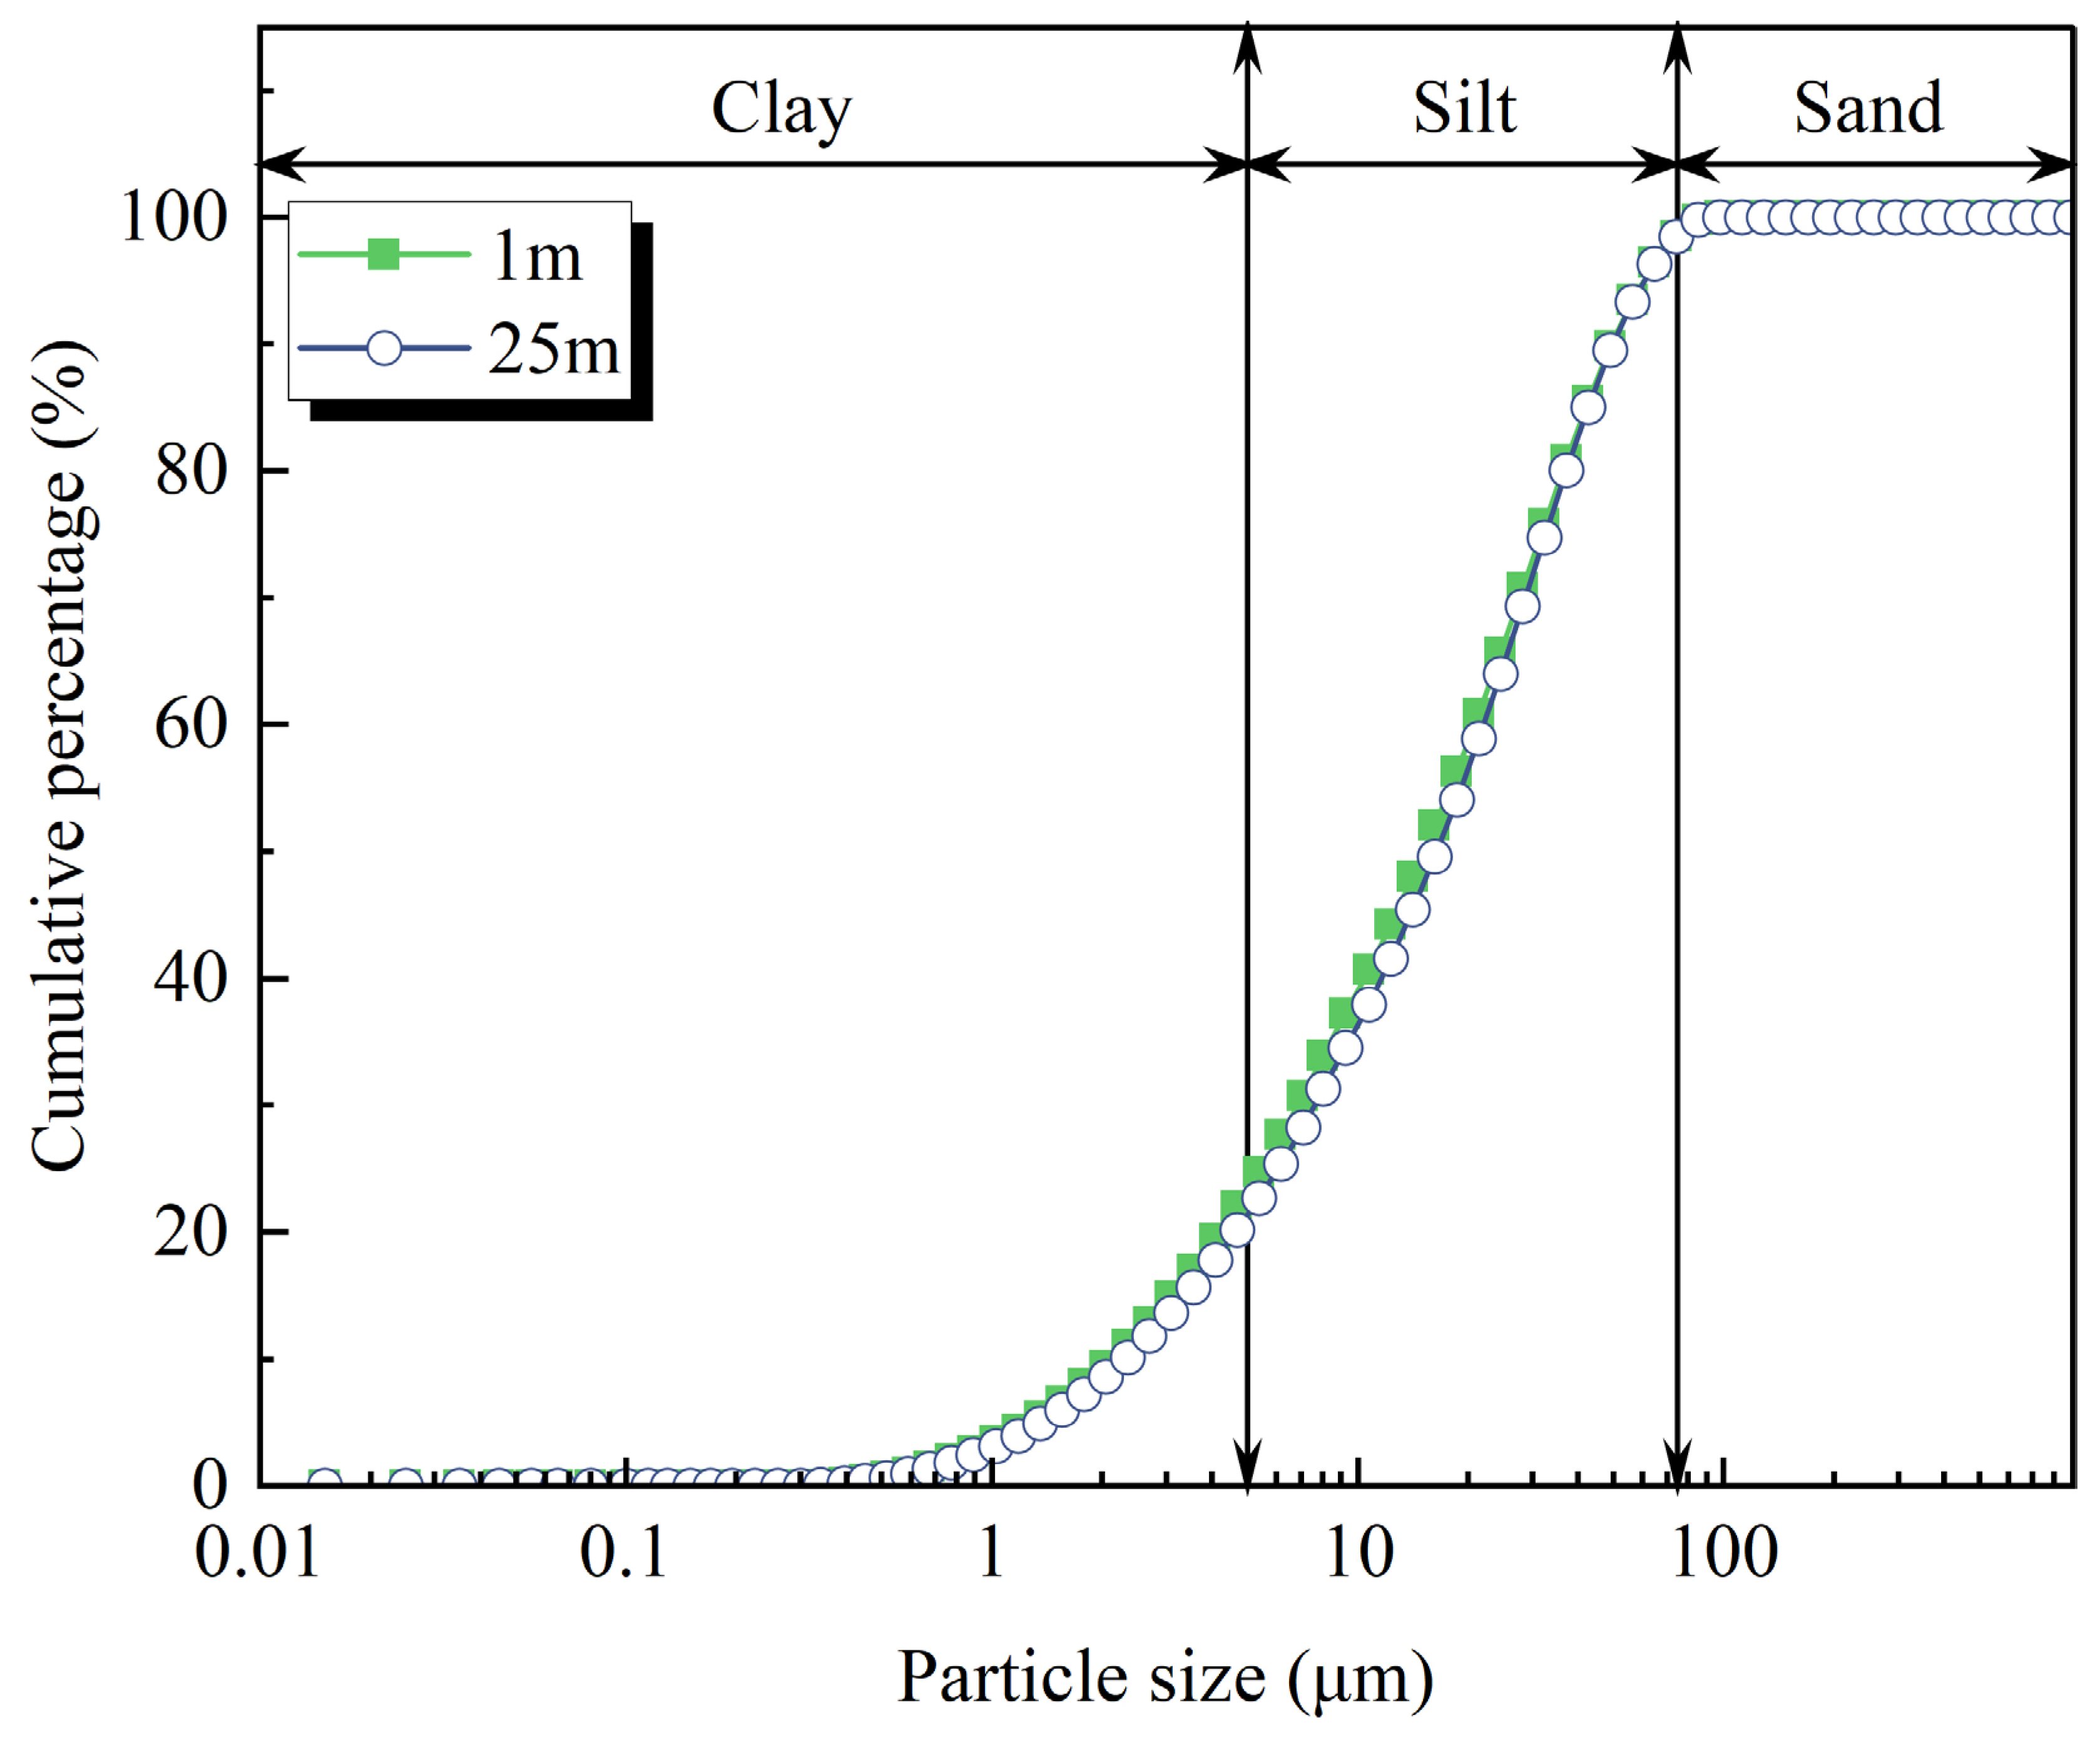
2.1. Sampling Site and Materials

The silt soils were loess collected from Fuxian County, Yan’an City, Shaanxi Province, China (Figure 1a). The terrain is a gently sloping plain that gradually declines from northwest to southeast, with a slope gradient of less than 2%. The study area is covered by thick loess deposits, primarily composed of Late Pleistocene (Q3) and Middle Pleistocene (Q2) loess layers (Figure 1b). Typical Q3 and Q2 soil samples (20 × 10 × 10 cm) were collected at depths of 1 m and 25 m, respectively, for this study (Figure 1c). A mechanical Luoyang shovel was employed to excavate a test pit to a depth of 25 m. At the two target depths, 15 samples were extracted from the test pit walls by manually carving grooves. The samples were immediately sealed with cling film to prevent moisture evaporation and subsequently transported to the laboratory for further testing.
The basic physical properties of the samples were tested according to the Standard for Geotechnical Testing Methods [48], with the results presented in Table 1. The samples exhibited relatively high moisture contents; the 25 m sample had a lower void ratio and greater compactness compared to the 1 m sample. The particle size distribution was analyzed using a laser particle size analyzer, as shown in Figure 2. The 1 m sample contained 23.23% clay particles (<5 μm), 75.41% silt particles (5–75 μm), and 1.36% sand particles (>75 μm). The 25 m sample contained 21.28% clay particles, 77.14% silt particles, and 1.58% sand particles. According to the Unified Soil Classification System, and based on the liquid and plastic limits, both the 1 m and 25 m samples are classified as low-plasticity clays (CLs).
The mineral compositions of the soil samples were analyzed via X-ray diffraction (XRD), with the results presented in Table 2. Quartz and feldspar were the dominant minerals, comprising 66.1% and 61.8% of the 1 m and 25 m samples, respectively. Clay minerals primarily consisted of illite, kaolinite, chlorite, and vermiculite, with illite being the predominant component. Notably, the two samples exhibited significant differences and a swap in the contents of calcite and illite. The 1 m sample contained 1.64 times more calcite than the 25 m sample, whereas the 25 m sample contained 1.73 times more illite than the 1 m sample. These differences directly influenced the wetting-induced deformation characteristics of the soil samples.

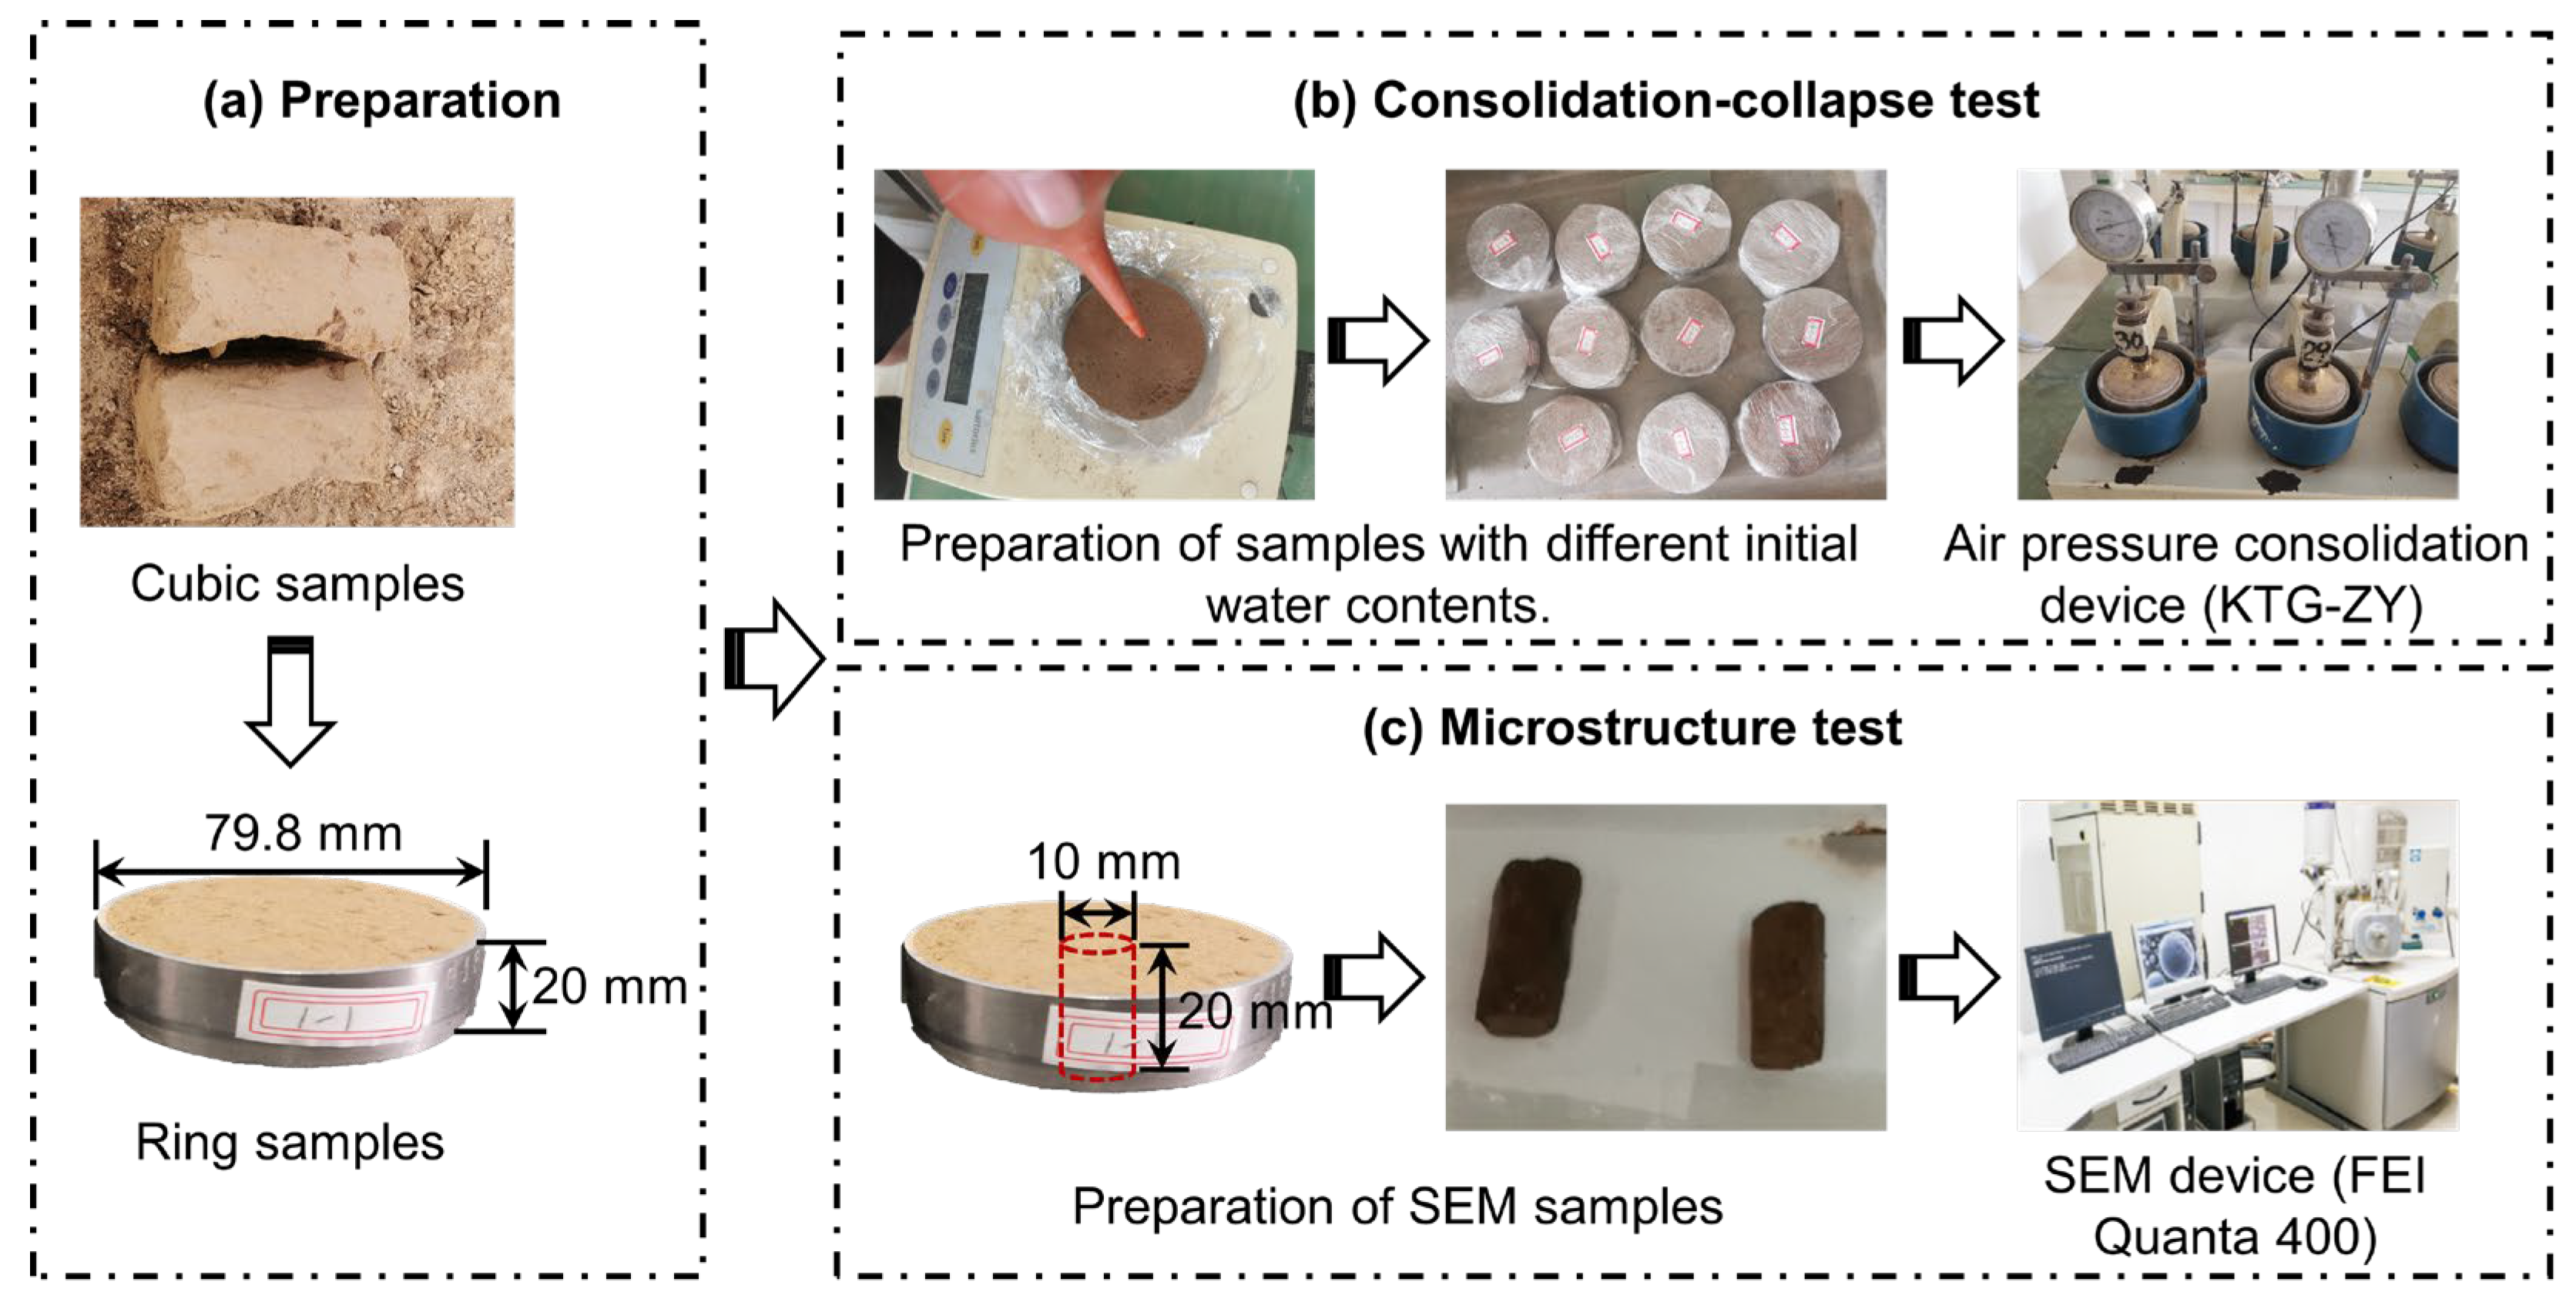
2.2. Sample Preparation

Undisturbed field soil samples were stripped of surface-disturbed loose soil before being trimmed into ring samples with a diameter of 79.8 mm and a height of 20 mm (Figure 3a). To minimize sample variability in the test results, the mass difference between the large ring samples was controlled within ±5 g. Wetting–collapse tests were performed at five initial water contents: natural, 24%, 27%, 30%, and saturated (Figure 3b). The amount of water needed to adjust the initial water content was calculated using Equation (1), and the samples were prepared via the water film transfer method. Distilled water was evenly sprayed onto both surfaces of the samples using a syringe to minimize damage. Prepared samples were sealed with plastic wrap and placed in a humidity chamber for at least 48 h to ensure uniform moisture distribution before subsequent consolidation–collapse tests.
m w = ω t ω c 100 + ω c × m c
where mw represents the required mass of distilled water to be added (g), mc is the current mass of the soil sample (g), and ωc and ωt denote the current water content and target water content of the sample (%), respectively.

2.3. Consolidation–Collapse Test

The consolidation–collapse test was performed with the KTG-ZY fully automatic air pressure consolidation device, manufactured by Beijing Luda Weiye Technology Co., Ltd. in Beijing China (Figure 3b). The test employed a graded-loading method, with vertical pressures incrementally set at 12.5, 25, 50, 100, 150, 200, 300, 400, 500, 600, 700, and 800 kPa. Deformation was considered stabilized when the vertical deformation rate dropped below 0.01 mm/h, after which the next loading step was applied. To comprehensively evaluate both compression and collapsible deformation, a double-oedometer test was utilized. For each initial water content, two samples were tested: one underwent continuous stepwise loading until the deformation stabilized, while the other was submerged after the first loading step to achieve equilibrium for collapsible deformation, followed by the subsequent loading steps (Figure 4).
The collapsibility coefficient was used to evaluate the collapsible deformation of the soil, and the calculation formula is as follows:
δ s = h p h p s h 0
where δs represents the collapsibility coefficient under a specific pressure level, while h0, hps, and hp denote the initial height of the sample, the vertical compression under the specific pressure, and the vertical compression after water infiltration under the same pressure, respectively (mm). The collapsibility degree of soil can be classified based on the collapsibility coefficient into non-collapsibility (δs < 0.015), weak collapsibility (0.015 ≤ δs ≤ 0.03), moderate collapsibility (0.03 < δs ≤ 0.07), and strong collapsibility (δs > 0.07) [48].

2.4. Microstructure Test and Quantitative Analysis

The undisturbed soil samples were placed in a dry, ventilated area for natural air drying over 48 h, after which they were sealed for preservation to facilitate the subsequent SEM analysis of the microstructure. Cylindrical subsamples with a diameter of approximately 1 cm and a height of 2 cm were extracted from the dried, undisturbed soil at 1 m and 25 m depths, and their surfaces were treated with resin for solidification. To prepare for observation, the cylindrical samples were manually broken 1–2 h prior to testing to obtain fresh fracture surfaces. Microstructural images of the specimens were acquired using an FEI Quanta 400 FEG (FEI, Hillsboro, OR, USA) field emission scanning electron microscope after spraying gold on the surfaces of the fresh fractures (Figure 3c).
The microstructural parameters of the pores in the electron microscope images were extracted using Avizo 2019 software to quantitatively analyze the differences in the pore structures between the two soil samples. The details of each parameter are as follows:
The equivalent pore diameter (EqD) is used to represent the pore size, and it is calculated as follows:
E q D = 4 A π 1 / 2
where A represents the pore area.
The pore orientation is assessed using orientation probability entropy (Hm), with the calculation formula as follows:
H m = i = 1 n P i log n P i
where Pi represents the pore area proportion in a certain orientation zone, n represents the number of orientation zones (in this study, n = 18). Hm takes values ranging from 0 to 1; the larger the value, the more disordered the pore arrangement [49].
The pore morphology is comprehensively described using the roundness, elongation, and fractal dimension (Df), and the calculation methods are as follows:
R o u n d n e s s = 4 π A P e 2
E l o n g a t i o n = W L
Ln P e = 1 2 D f × L n A + c
where A represents the pore area, Pe is the pore perimeter, W and L denote the short and long axes of the pore, respectively, and c is the fitting constant. Both the roundness and elongation range from 0 to 1, where larger roundness values indicate a more circular shape, and smaller elongation values signify a more elongated shape. A larger Df corresponds to greater complexity in the pore morphology [50].

3. Results

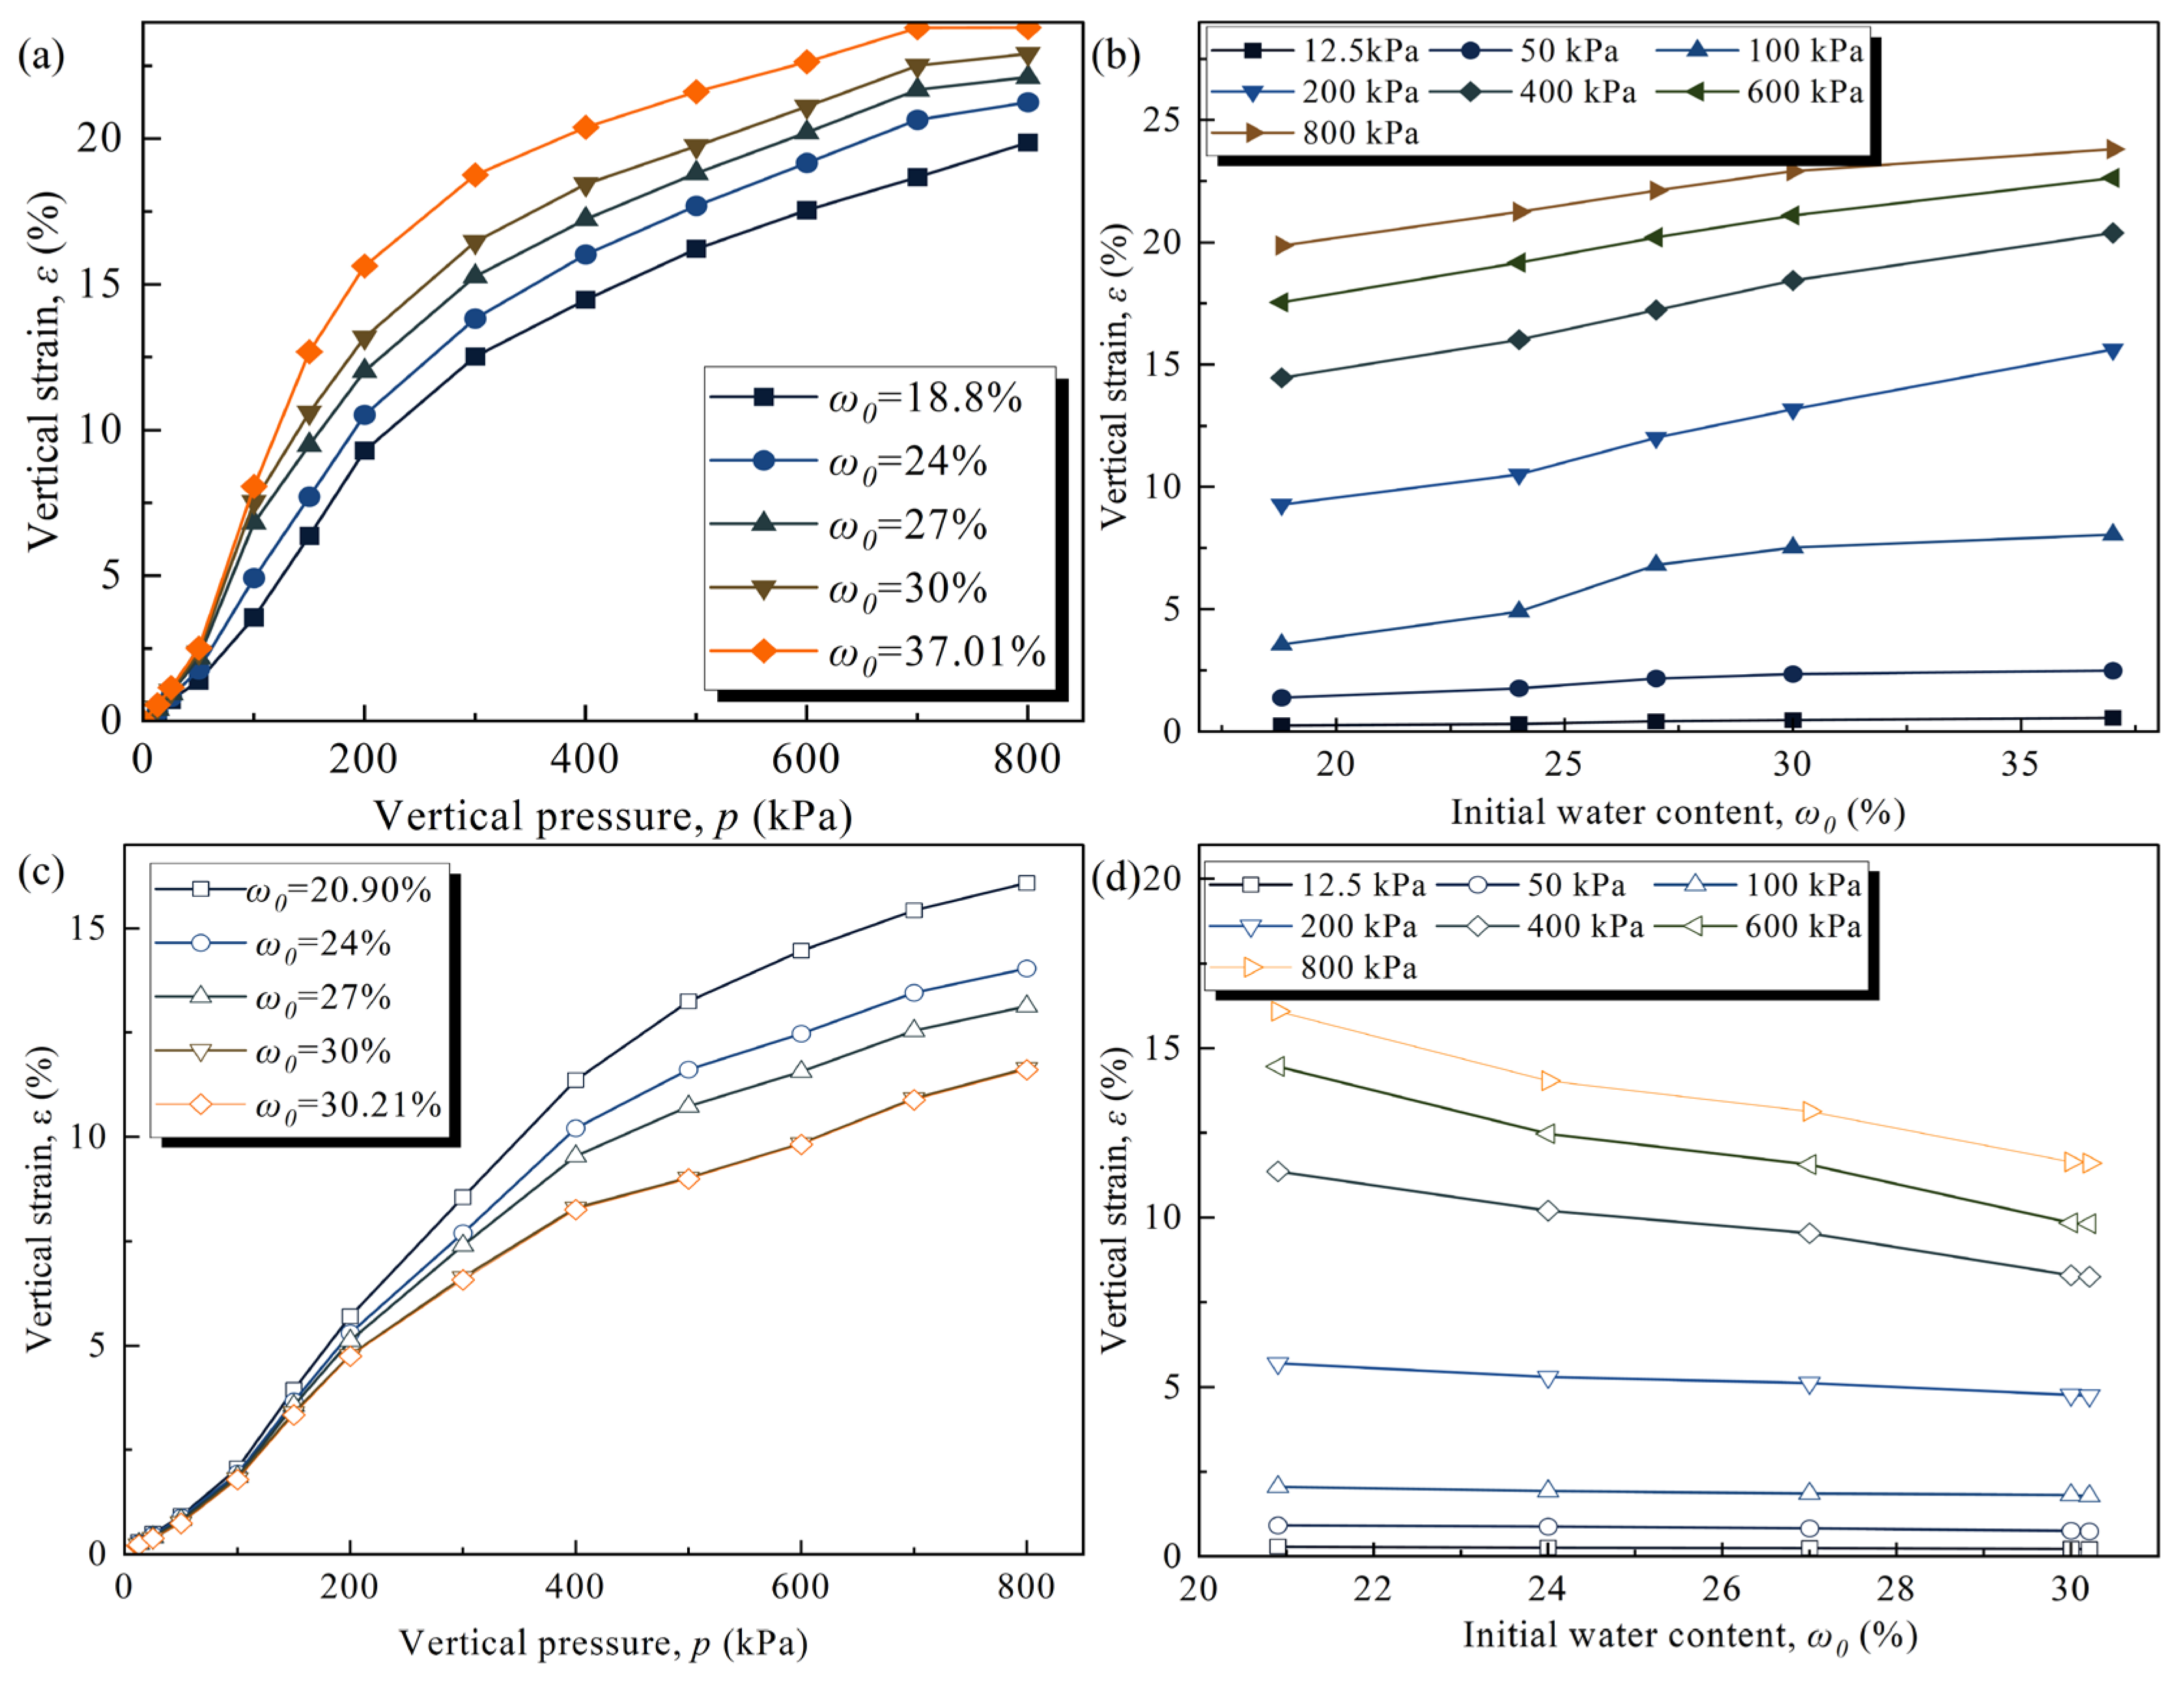
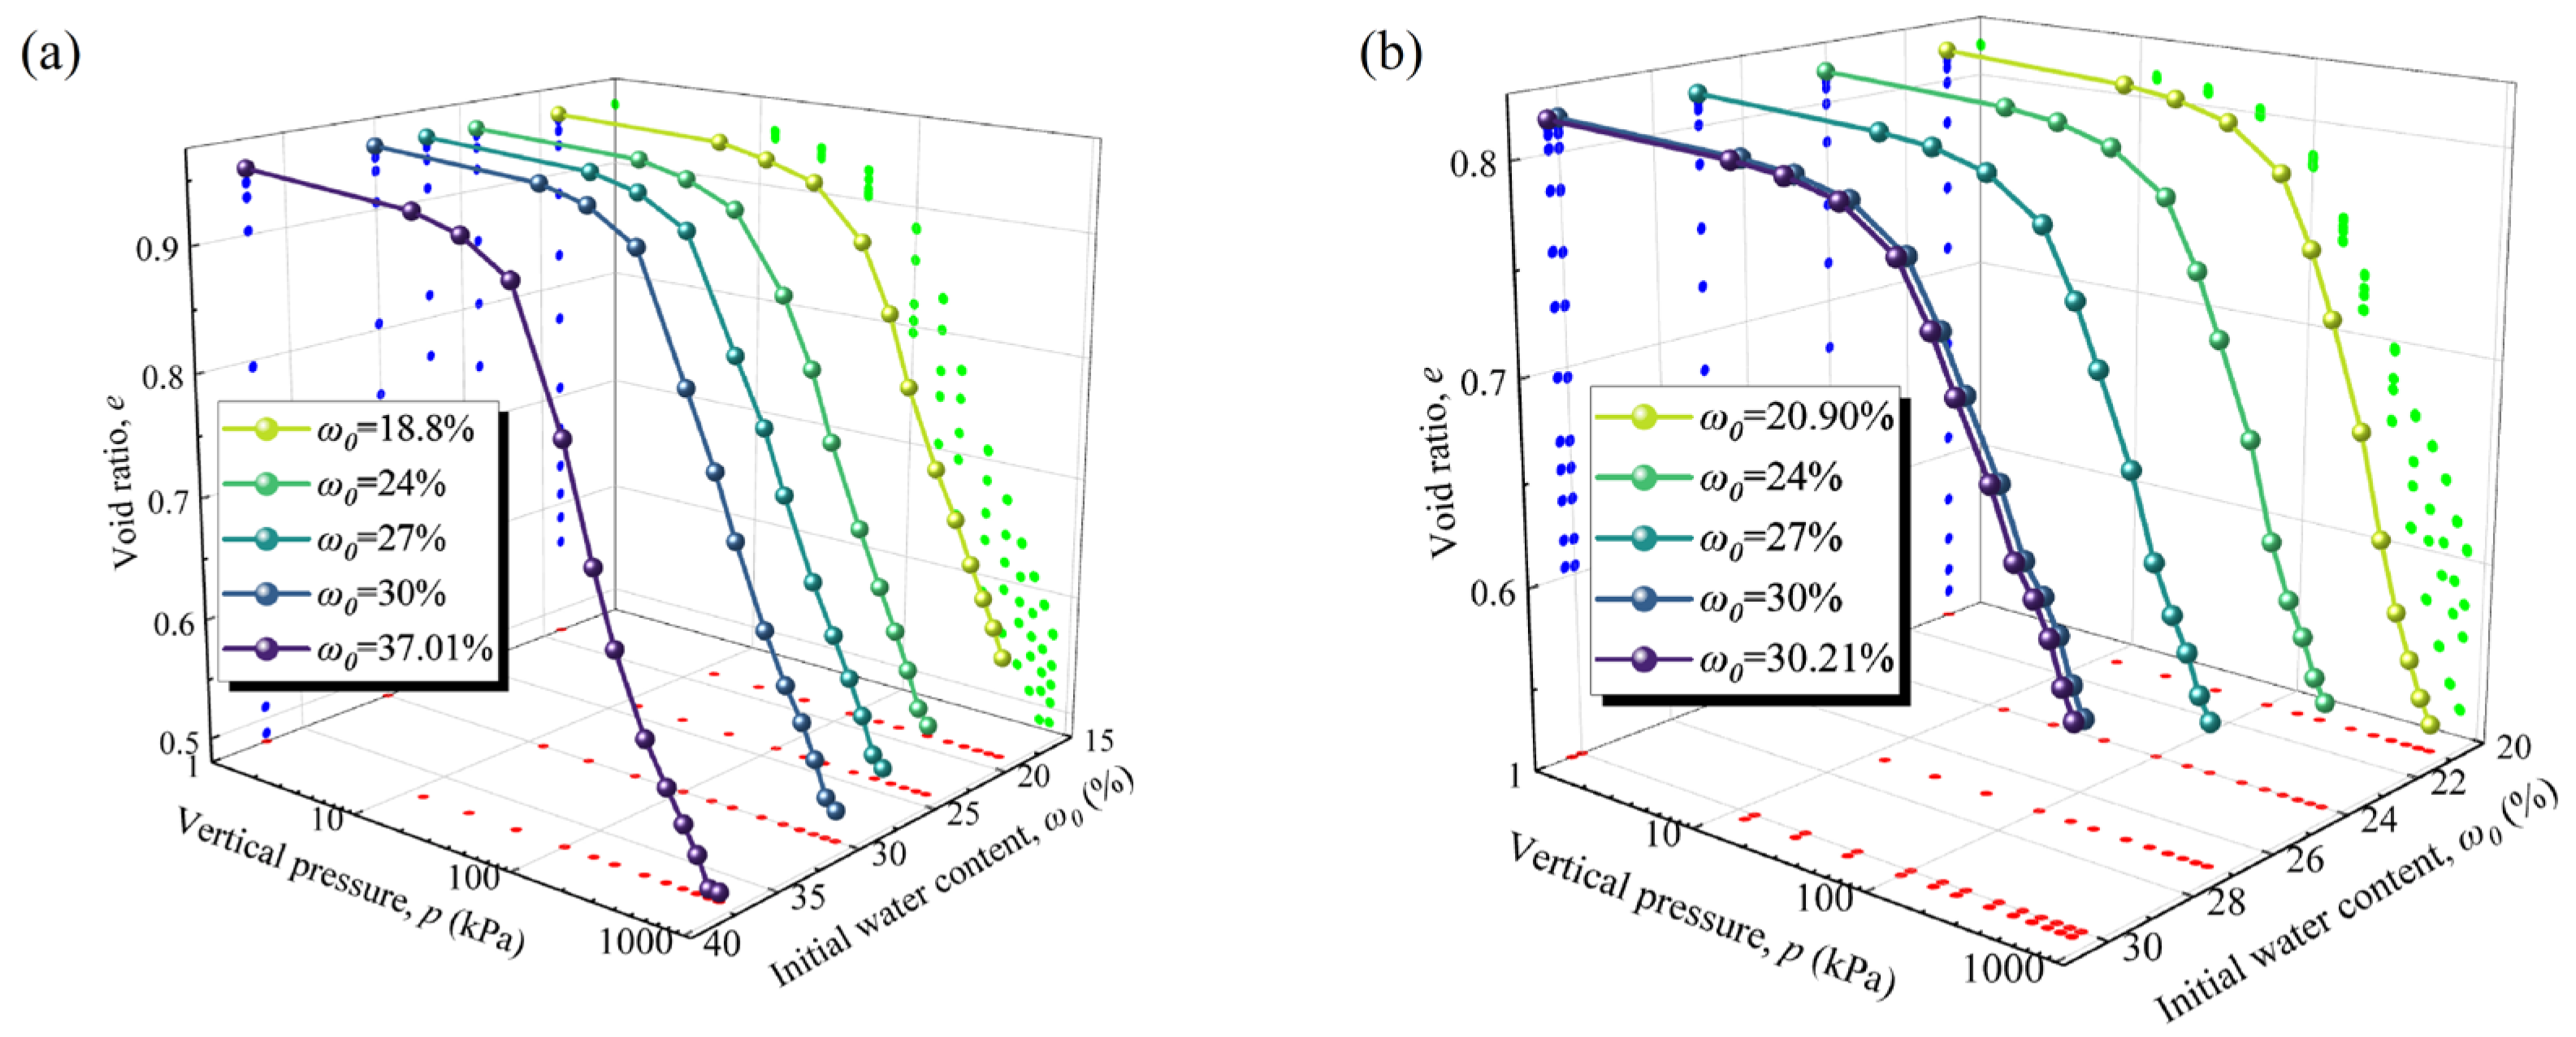
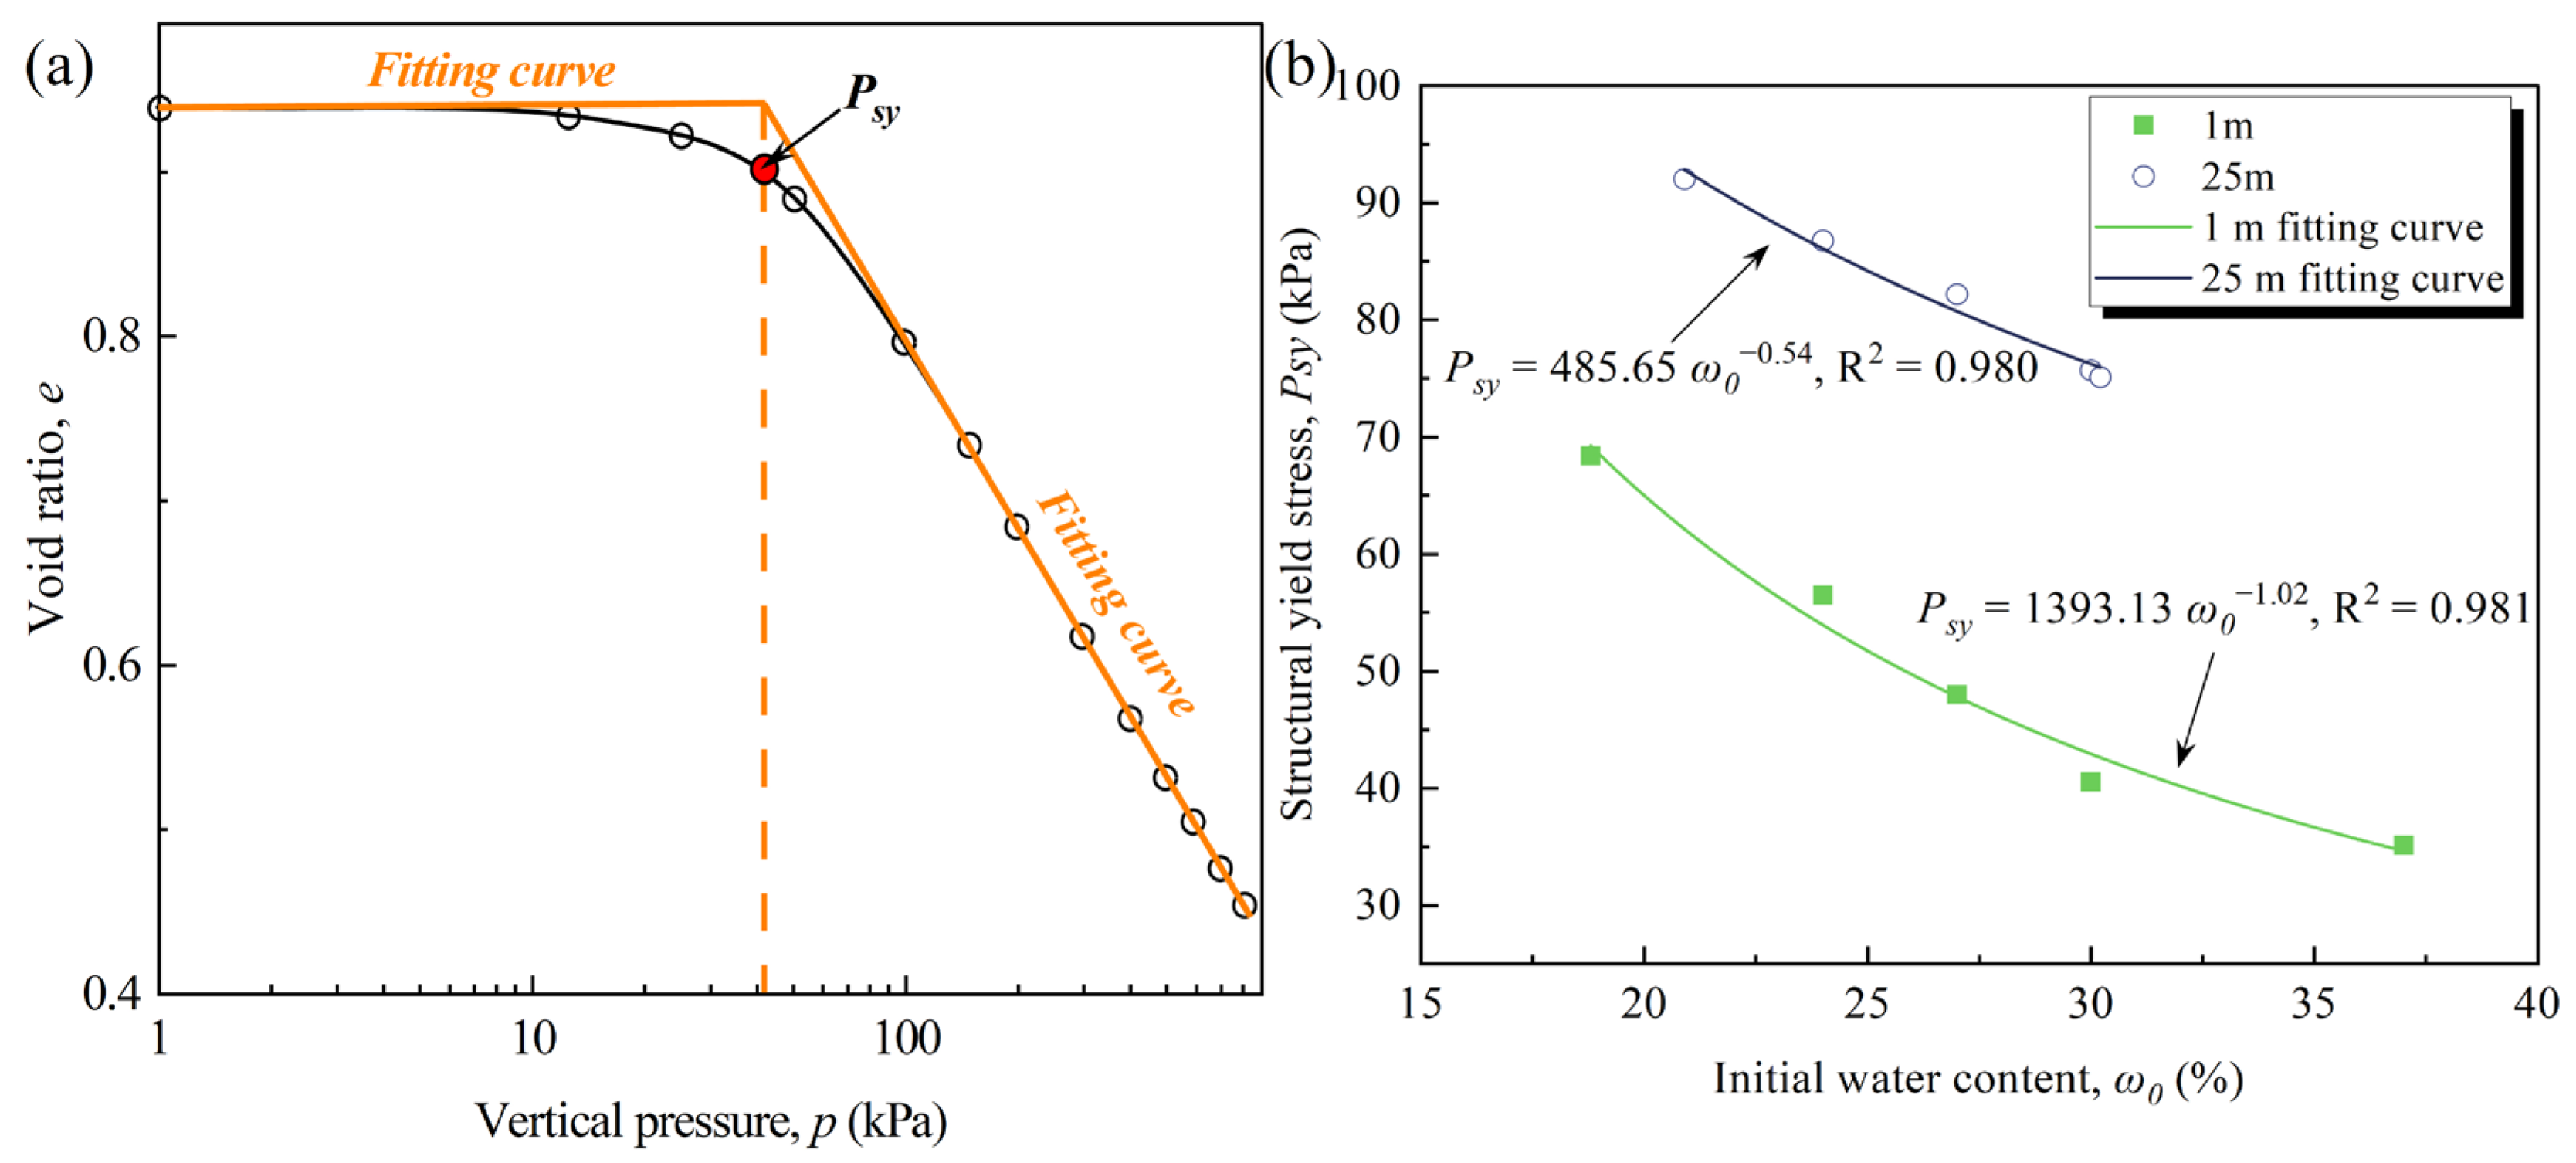
3.1. Compression Characteristics

Overall, the strain observed in the 1 m samples was generally greater than that in the 25 m samples, reflecting higher compressibility (Figure 5a,c). The axial strain (ε) exhibited a non-linear increase with the rising vertical pressure (p). The ε-p curves for the 1 m and 25 m samples can be categorized into three stages: (1) slow deformation at low pressures (p < 50 kPa), (2) accelerated deformation at intermediate pressures (50 ≤ p < 400 kPa), and (3) decelerating deformation at high pressures (p > 400 kPa). At low pressures, the ε-p curves for the loess samples with varying water contents remained relatively close. As the pressure increased, the curves diverged, highlighting that the compressive deformation became more sensitive to water content variations at higher pressures.
With the increasing initial water content, the two sets of samples displayed contrasting trends. For the 1 m sample under the natural water content, the strain increased at the slowest rate with the pressure, reaching 19.87% at 800 kPa. As the initial water content rose, the strain gradually increased, reaching 23.81% at saturation under 800 kPa. For the 25 m sample under the natural water content, the strain increased at the fastest rate with the pressure, reaching 16.09% at 800 kPa. As the initial water content rose, the strain gradually decreased, reaching 11.61% at saturation under 800 kPa. This indicates that the initial water content affected the compressive strength of the soil differently at the two depths. Under identical initial water contents, the strain exhibited a more pronounced increase with the pressure for the 1 m sample. For instance, at an initial water content of 27%, when the pressure rose from 0 to 800 kPa, the strain in the 1 m and 25 m samples reached 22.12% and 13.14%, respectively. This demonstrates that the 1 m sample was more pressure-sensitive compared to the 25 m sample.
Under identical vertical pressures, the strain increased with the initial water content (ω0) for the 1 m samples but decreased for the 25 m samples (Figure 5b,d). Under low-pressure conditions (p < 50 kPa), the strain for both samples remained relatively stable as the water content increased. For instance, at 50 kPa, when the water content rose from natural levels to saturation, the strain in the 1 m sample increased by only 1.11%, while the strain in the 25 m sample decreased by 0.18%. This indicates that under low-pressure conditions, variations in the water content exerted a minimal influence on the consolidation deformation of the samples. As the pressure increases, the ε-ω0 curve steepens significantly, though the trends for the two depths are opposite. At 800 kPa, as the initial water content rose from 24% to 30%, the strain in the 1 m sample increased from 21.25% to 22.92%, whereas the strain in the 25 m sample decreased from 14.04% to 11.65%. This demonstrates that during wetting, the compressive deformation response to variations in the water content differed for the two samples, with the 1 m sample showing a more pronounced response.
The point where the e-lgp curve’s rate of decrease sharply accelerates (yield point) corresponds to the vertical pressure, termed the structural yield stress (Psy) [51], and is closely linked to the soil structural characteristics. The structural yield stress indirectly reflects how the soil microstructure affects its compressive behavior. Like the ε-p curves, the e-lgp curves are divided into three stages: (1) a slow decrease under low pressure, (2) yielding at intermediate pressure, and (3) a rapid decrease under high pressure. The division points of the curves at varying water contents differ and are associated with the structural yield stresses of the samples (Figure 6).
During the first stage, when the vertical pressure is below the structural yield stress, the soil structure remains stable, and the void ratio decreases gradually. In the second stage, as the vertical pressure nears and then surpasses the yield stress, the soil structure starts collapsing, leading to an accelerated reduction in the void ratio. In the third stage, intensified structural collapse results in a pronounced reduction in the void ratio. With increasing initial water contents, the 1 m curve cluster exhibits a shorter first stage and an extended third stage (Figure 6a). Conversely, the 25 m curve cluster displays shortened durations for both the first and third stages (Figure 6b). This occurred because the higher initial water content reduced the structural yield stresses of both soil layers, shifting the yield point to the left.
Overall, the void ratio of all the samples decreases as the pressure increases, indicating enhanced soil compaction. The initial water content exerts a significant influence on the compression of loess pores. Under identical pressure conditions, the void ratio of the 1 m sample decreases with the increasing initial water content, whereas the 25 m sample exhibits the opposite trend. For instance, at 800 kPa, as the water content transitions from natural to saturation, the void ratio of the 1 m sample reduces from 0.56 to 0.49, whereas the void ratio of the 25 m sample rises from 0.52 to 0.60. This indicates that, under constant pressure, structural collapse intensified for the 1 m sample with the increasing water content, whereas for the 25 m sample, it diminished. Compared to the 25 m sample, the 1 m sample exhibits a larger initial void ratio, indicating greater available space for compression within the soil. At the same initial water content, the 1 m sample demonstrates greater compressibility. For instance, at an initial water content of 27%, as the pressure reaches 800 kPa, the void ratios of the 1 m and 25 m samples reduce by 0.43 and 0.24, respectively. This finding suggests that the soil structure of the 1 m sample is more pressure-sensitive, making it more susceptible to collapse and compaction under loading.
Linear fitting was conducted on the gradual and steep decline segments of the e-lgp curves, with the intersection of the two lines corresponding to the vertical pressure, defined as the structural yield stress (Psy). A schematic illustration of the calculation is presented in Figure 7a. The calculated Psy values for the 1 m and 25 m samples at varying initial water contents are shown in Figure 7b. The Psy of the soil decreased with the increasing initial water contents, with the 1 m sample exhibiting a more pronounced reduction. This indicates that the Psy of the 1 m sample was more sensitive to variations in the water content. The relationship between the ω0 and Psy for the 1 m and 25 m samples can be modeled using power functions, as represented in Equations (8) and (9).
P s y = 1393.13 ω 0 1.02
P s y = 485.65 ω 0 0.54

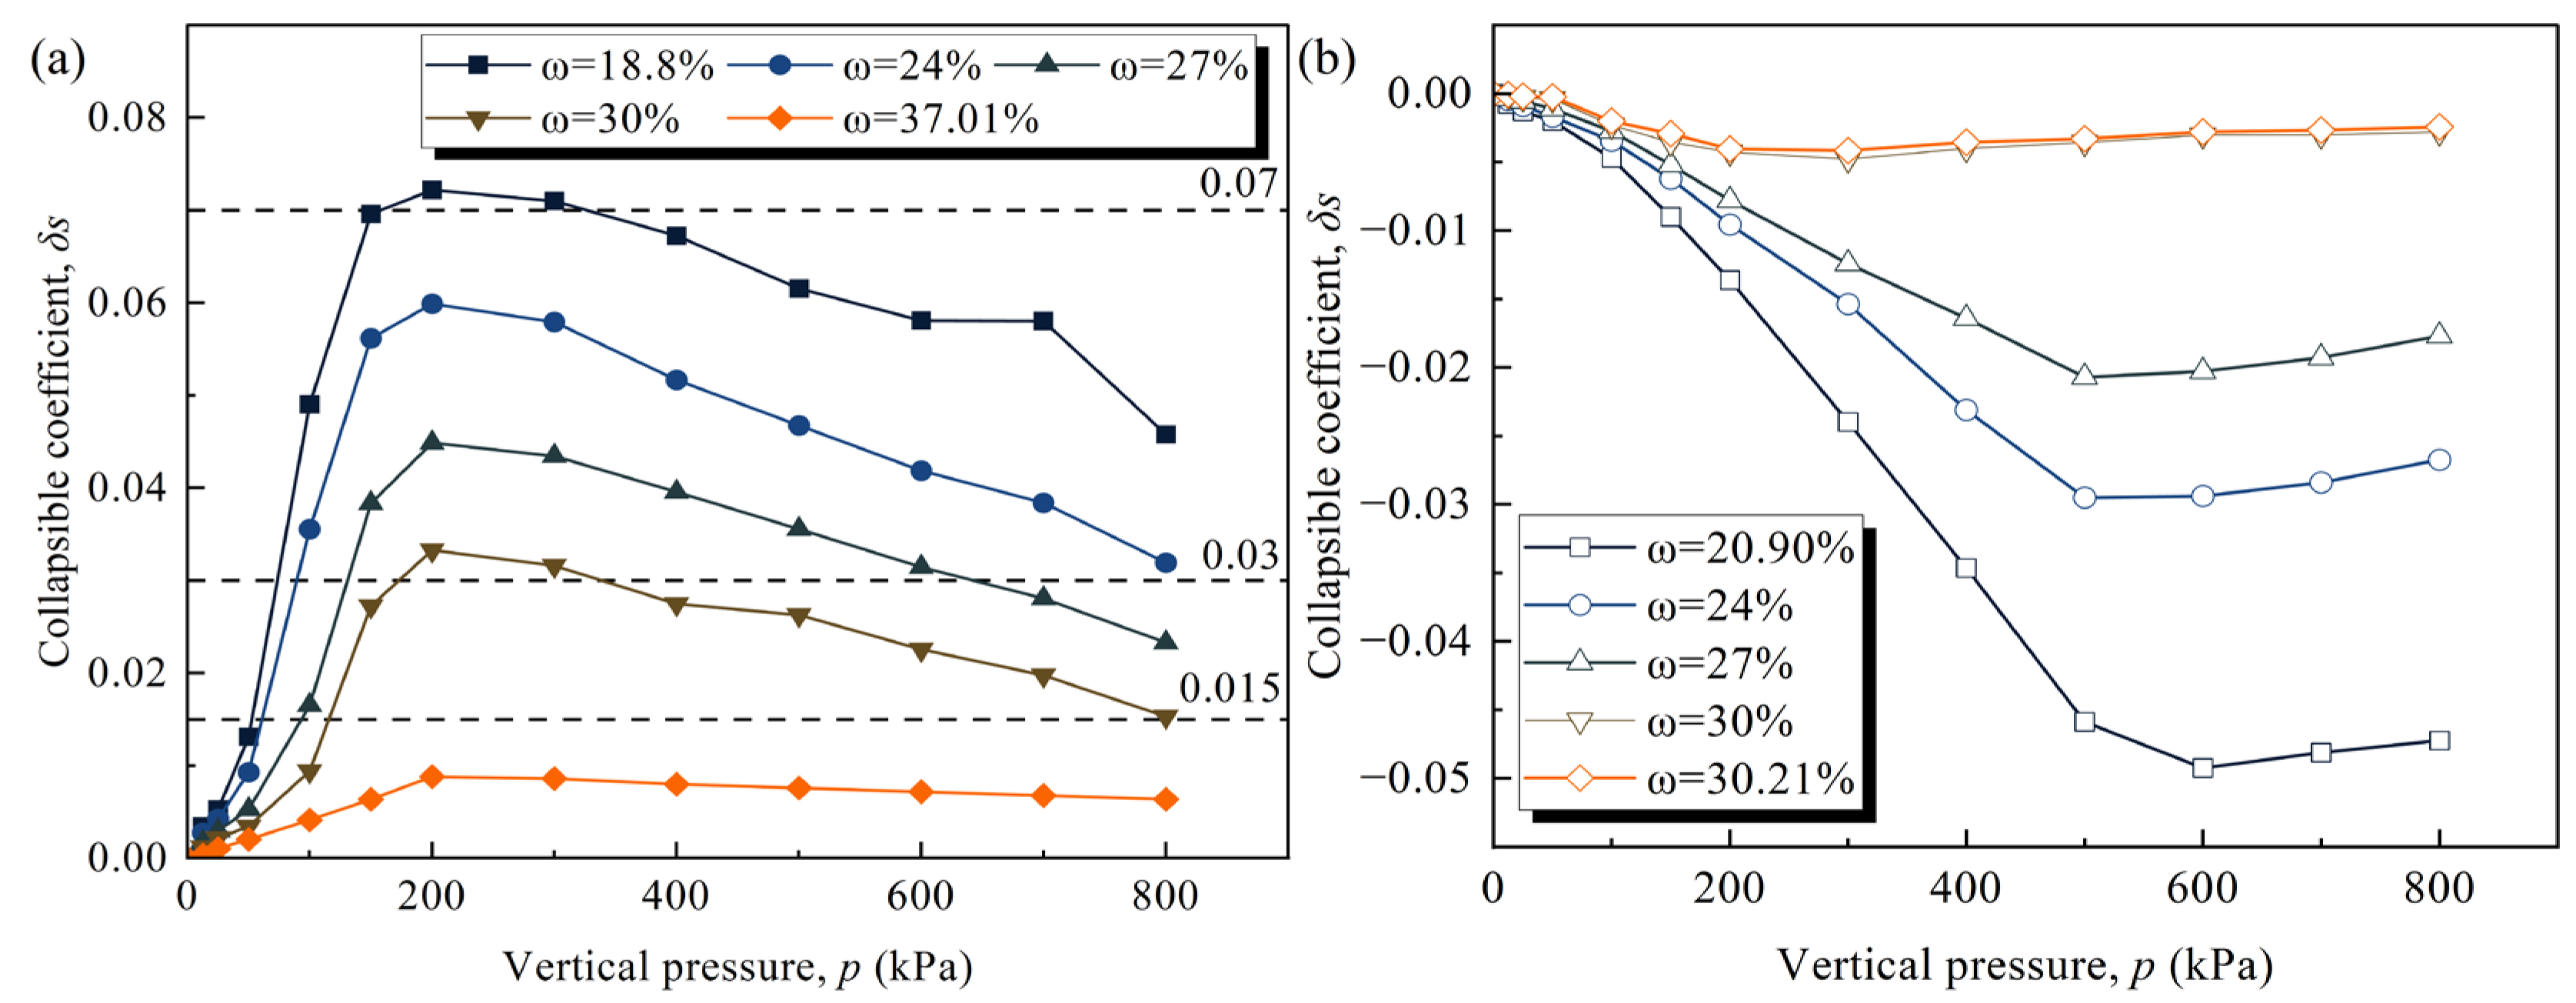
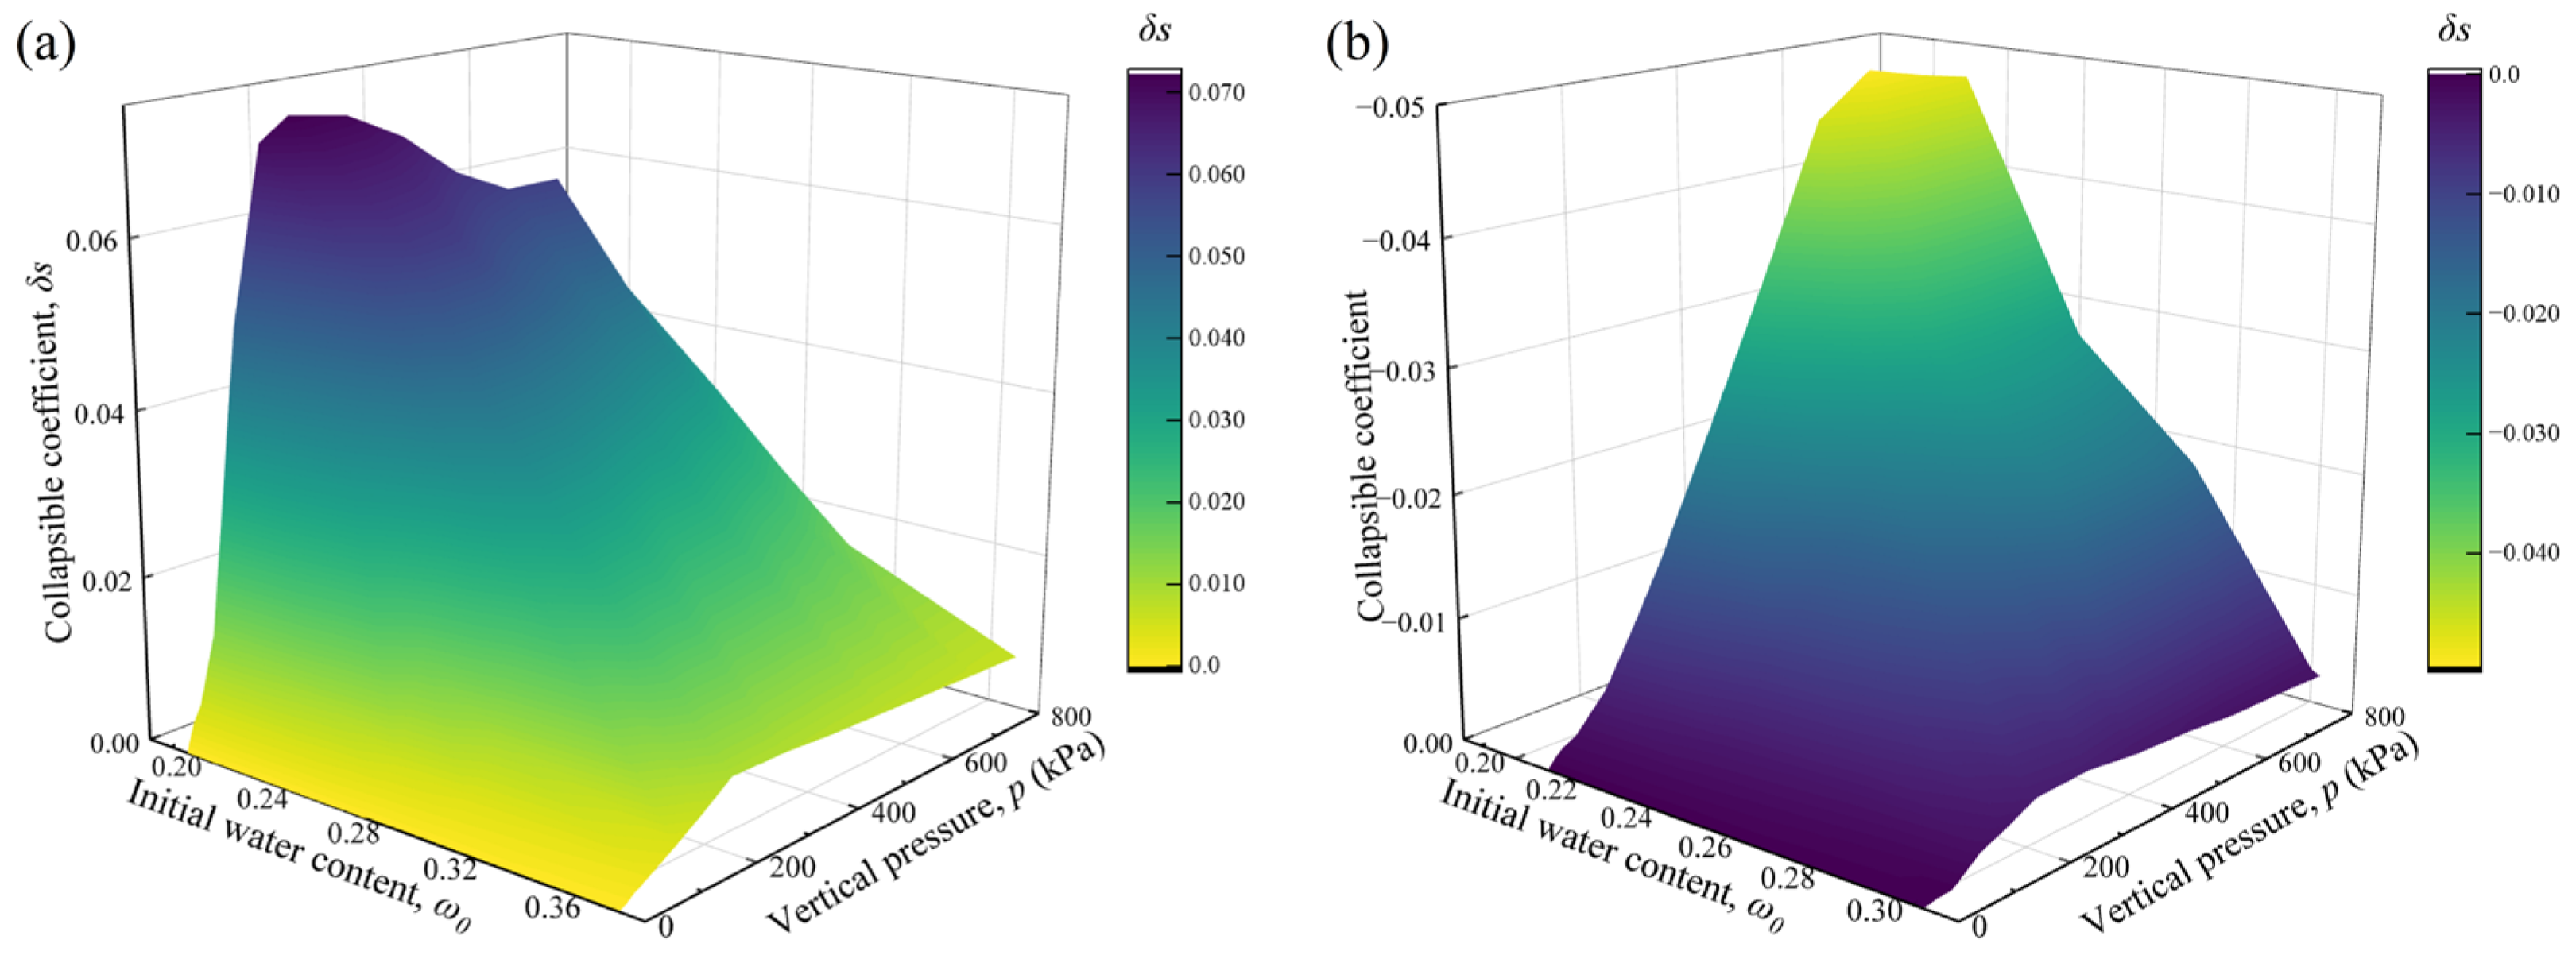
3.2. Collapsibility Results

In their natural state, the curves of both samples exhibit distinctly opposite trends (Figure 8). The collapsibility coefficient of the 1 m sample initially increases with the pressure up to a specific point and then decreases. A similar trend is observed for the 25 m sample, where the coefficient increases and then decreases with the pressure. The collapsibility coefficient values for the two soil layers display opposite signs: positive for the 1 m sample throughout the test pressure range and negative for the 25 m sample. This observation indicates that with the increasing pressure, the 1 m sample exhibited collapsible behavior, whereas the 25 m sample displayed expansive characteristics. For the 1 m sample, the initial collapse pressure in its natural state was 53 kPa, and a maximum collapsibility coefficient of 0.722 was observed at 200 kPa, indicating strong collapsibility. Conversely, the 25 m sample achieved its minimum collapsibility coefficient of −0.049 at 600 kPa.
The collapsibility coefficient–pressure curves for the 1 m sample under varying initial water contents exhibit similar characteristics. The coefficient increases gradually with the pressure below 50 kPa, rises rapidly between 50 and 200 kPa, and then either decreases slowly or levels off beyond 200 kPa. As the initial water content increases, the slope of the curve during the rapid-increase phase decreases significantly. The starting collapse pressure rises with the increasing water content, corresponding to pressures of 60, 93, and 115 kPa for water contents of 24%, 27%, and 30%, respectively. The saturated samples do not exhibit collapsibility within the tested pressure range. Below 50 kPa, the curves are relatively concentrated, gradually dispersing as the pressure increases, which suggests that the collapsibility coefficient becomes more sensitive to water content variations under higher-pressure conditions.
The collapsibility coefficient–pressure curves for the 25 m sample at varying initial water contents exhibit similar characteristics, though contrasting with those of the 1 m sample. The curves display three distinct phases: a slow decrease, a rapid decrease, and a slow increase or leveling off as the pressure rises. With increasing initial water contents, the rapid decrease phase becomes shorter, and the slope diminishes. At all pressures and water contents, the collapsibility coefficient for the 25 m sample remains negative, indicating expansive behavior. Like the 1 m sample, the collapsibility coefficient of the 25 m sample is more responsive to water content variations under high-pressure conditions.
Figure 9 illustrates that the collapsibility coefficient is governed by the combined effects of the initial water content and pressure. For the 1 m sample, the initial water content negatively influenced the collapsibility coefficient, whereas the effect of the pressure was more nuanced. Pressures below 200 kPa positively affected the collapsibility coefficient, whereas pressures above 200 kPa exhibited either minimal positive or negative effects (Figure 8a). Under the combined influence of the pressure and initial water content, the collapsibility grade of the 1 m sample transitioned from non-collapsibility to weak, moderate, and strong collapsibility (Figure 9a).
For the 25 m sample, the initial water content positively influenced the collapsibility coefficient, causing the coefficient to gradually increase and the expansive behavior to weaken as the water content rose. A critical pressure exists where the impact of the pressure on the collapsibility coefficient transitions. At lower pressures, the pressure negatively affected the collapsibility coefficient; however, beyond the critical pressure, its effect became either positive or negligible. For the natural moisture content, the critical pressure was 600 kPa, gradually decreasing with the rising initial water content (Figure 8b). Across the tested water contents and pressures, the 25 m sample consistently exhibited non-collapsible behavior (Figure 9b).

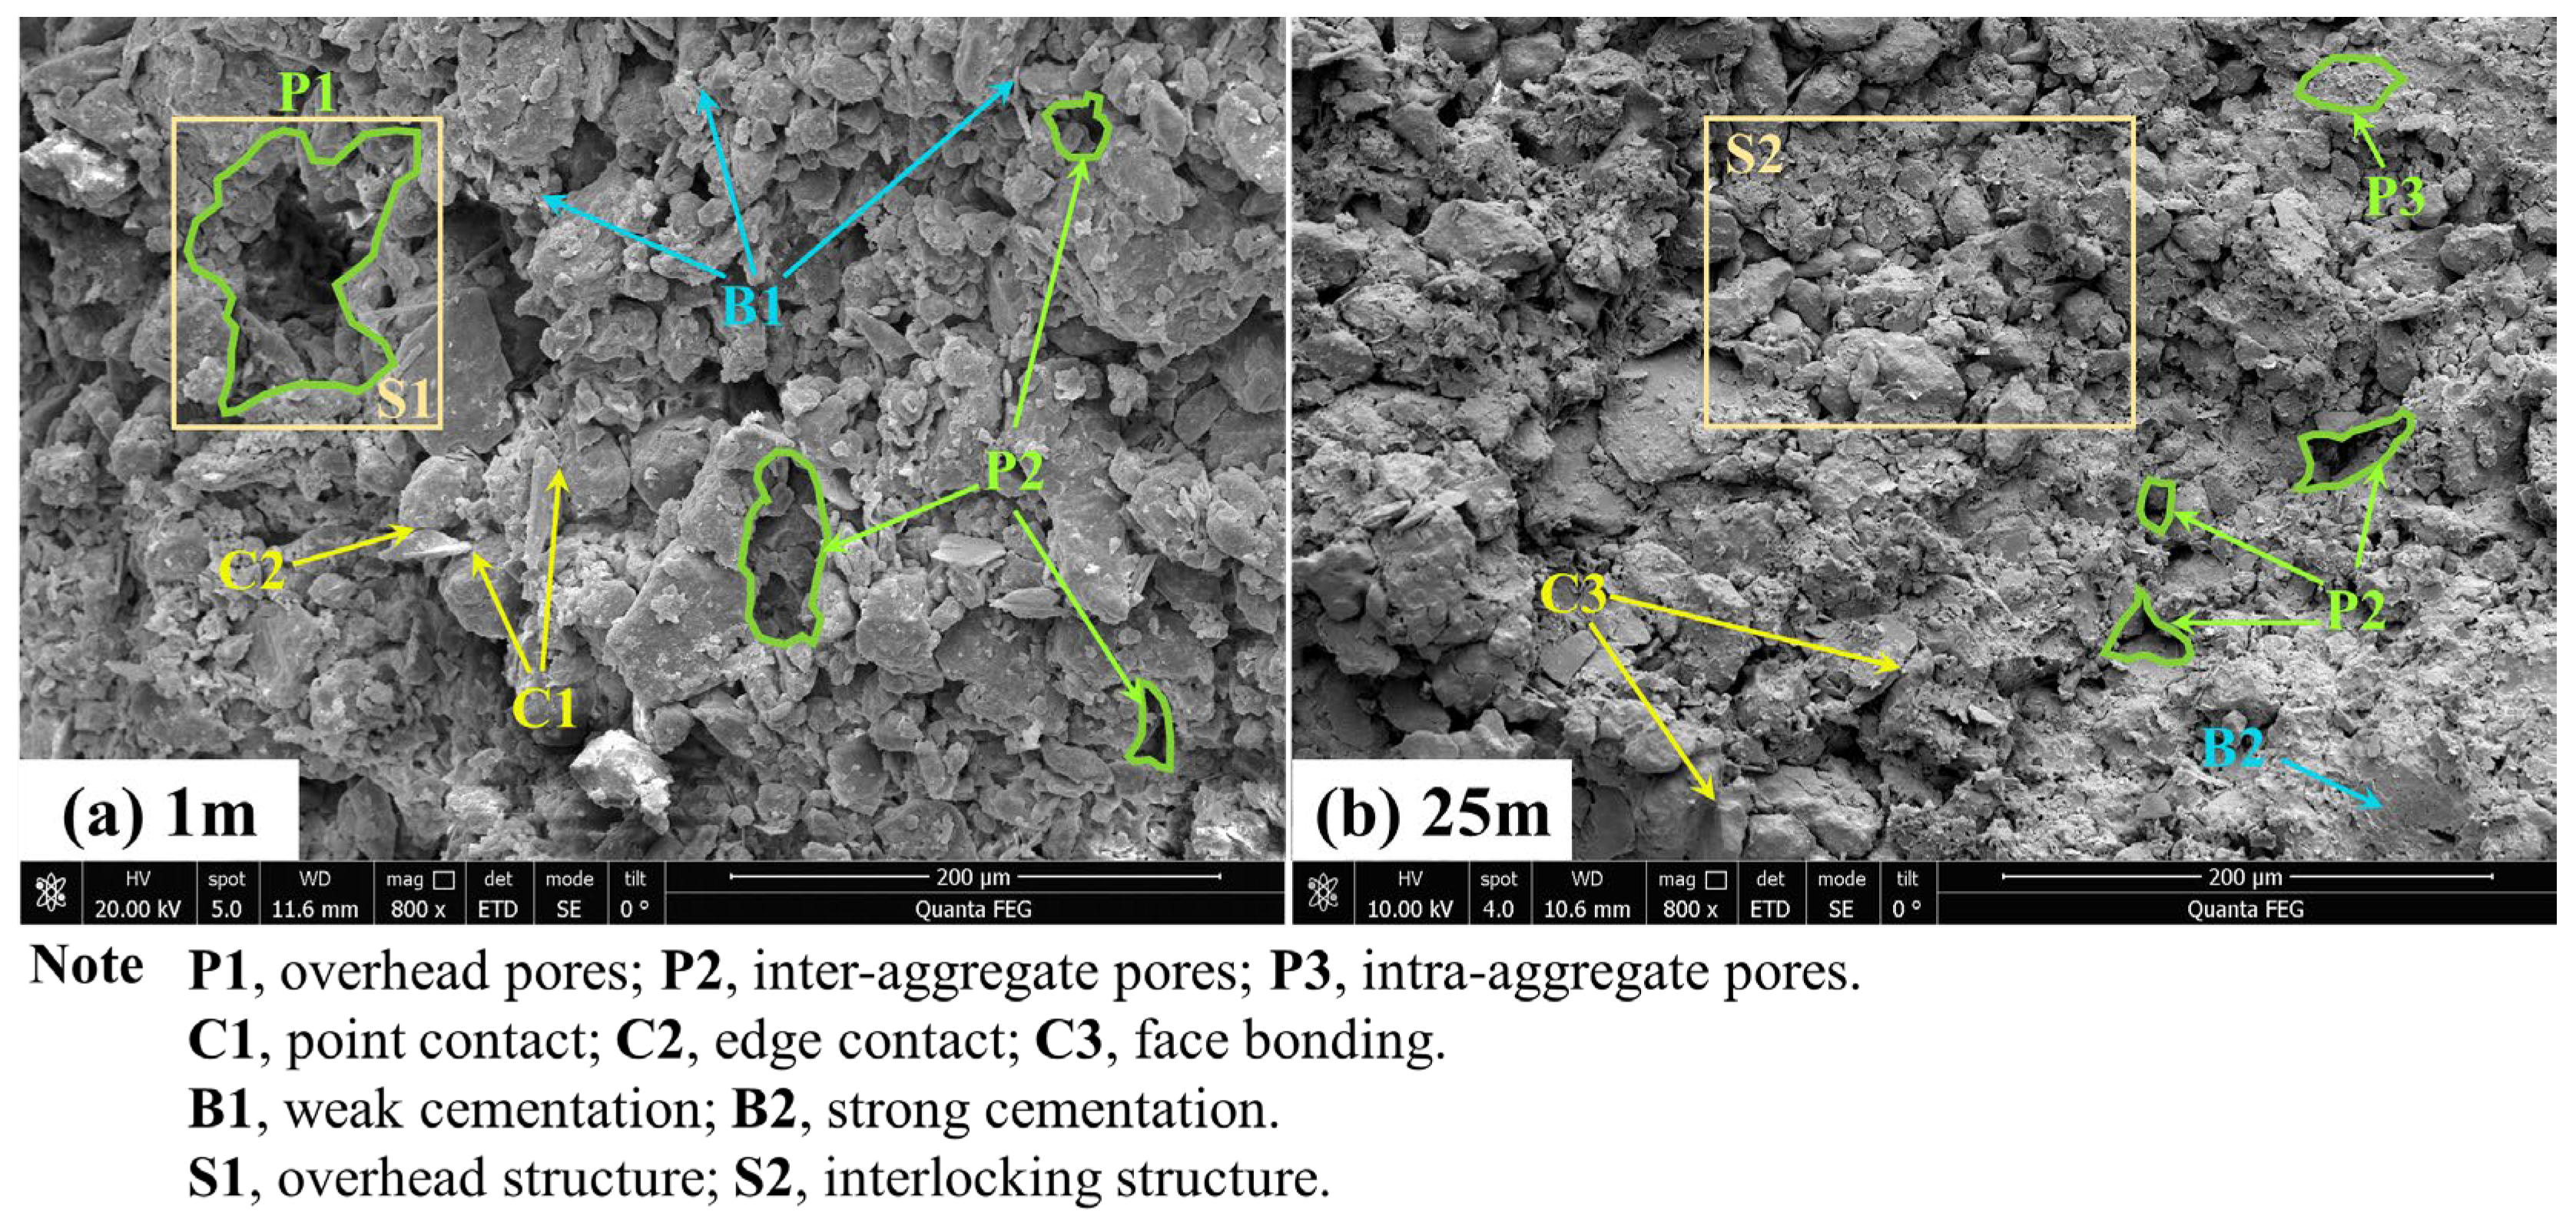
3.3. Qualitative Analysis of Microstructure

As shown in Figure 10, significant differences in the particle packing, pore characteristics, and cementation features are closely linked to macroscopic deformation behaviors. The microstructure of the 1 m sample is characterized by loose packing and weak particle cementation. Numerous point and edge contacts between the particles result in unstable overhead structures and overhead pores (pores exceeding the maximum particle diameter of the surrounding particles). The primary pore types in the 1 m sample are overhead pores and inter-aggregate pores (with diameters between the smallest and largest particle diameters of the surrounding particles). These structures create the spatial capacity for macro-deformations, including compression and collapsibility. These metastable microstructures make particles susceptible to slippage, rotation, and rearrangement under external loads or moisture infiltration, leading to reduced compressive strength and increased collapsibility. During moisture increase, the dissolution of the cementing materials (e.g., calcite) further destabilizes the microstructure, significantly amplifying the soil collapsibility.
In contrast, the 25 m sample exhibits a denser particle arrangement, with the microstructure characterized by a stable, interlocking structure. The degree of particle cementation is higher, with face bonding as the dominant mode. The predominant pore types are inter-aggregate and intra-aggregate pores (pores smaller than the smallest particle diameter of the surrounding particles), while overhead pores are rare. Stable particle contacts enhance the structural stability, contributing to higher compressive strength and lower collapsibility in the samples. The reduction in the overhead pore content compresses collapse-prone spaces, resulting in non-collapsibility at the macroscopic level.

3.4. Quantitative Analysis of Microstructure

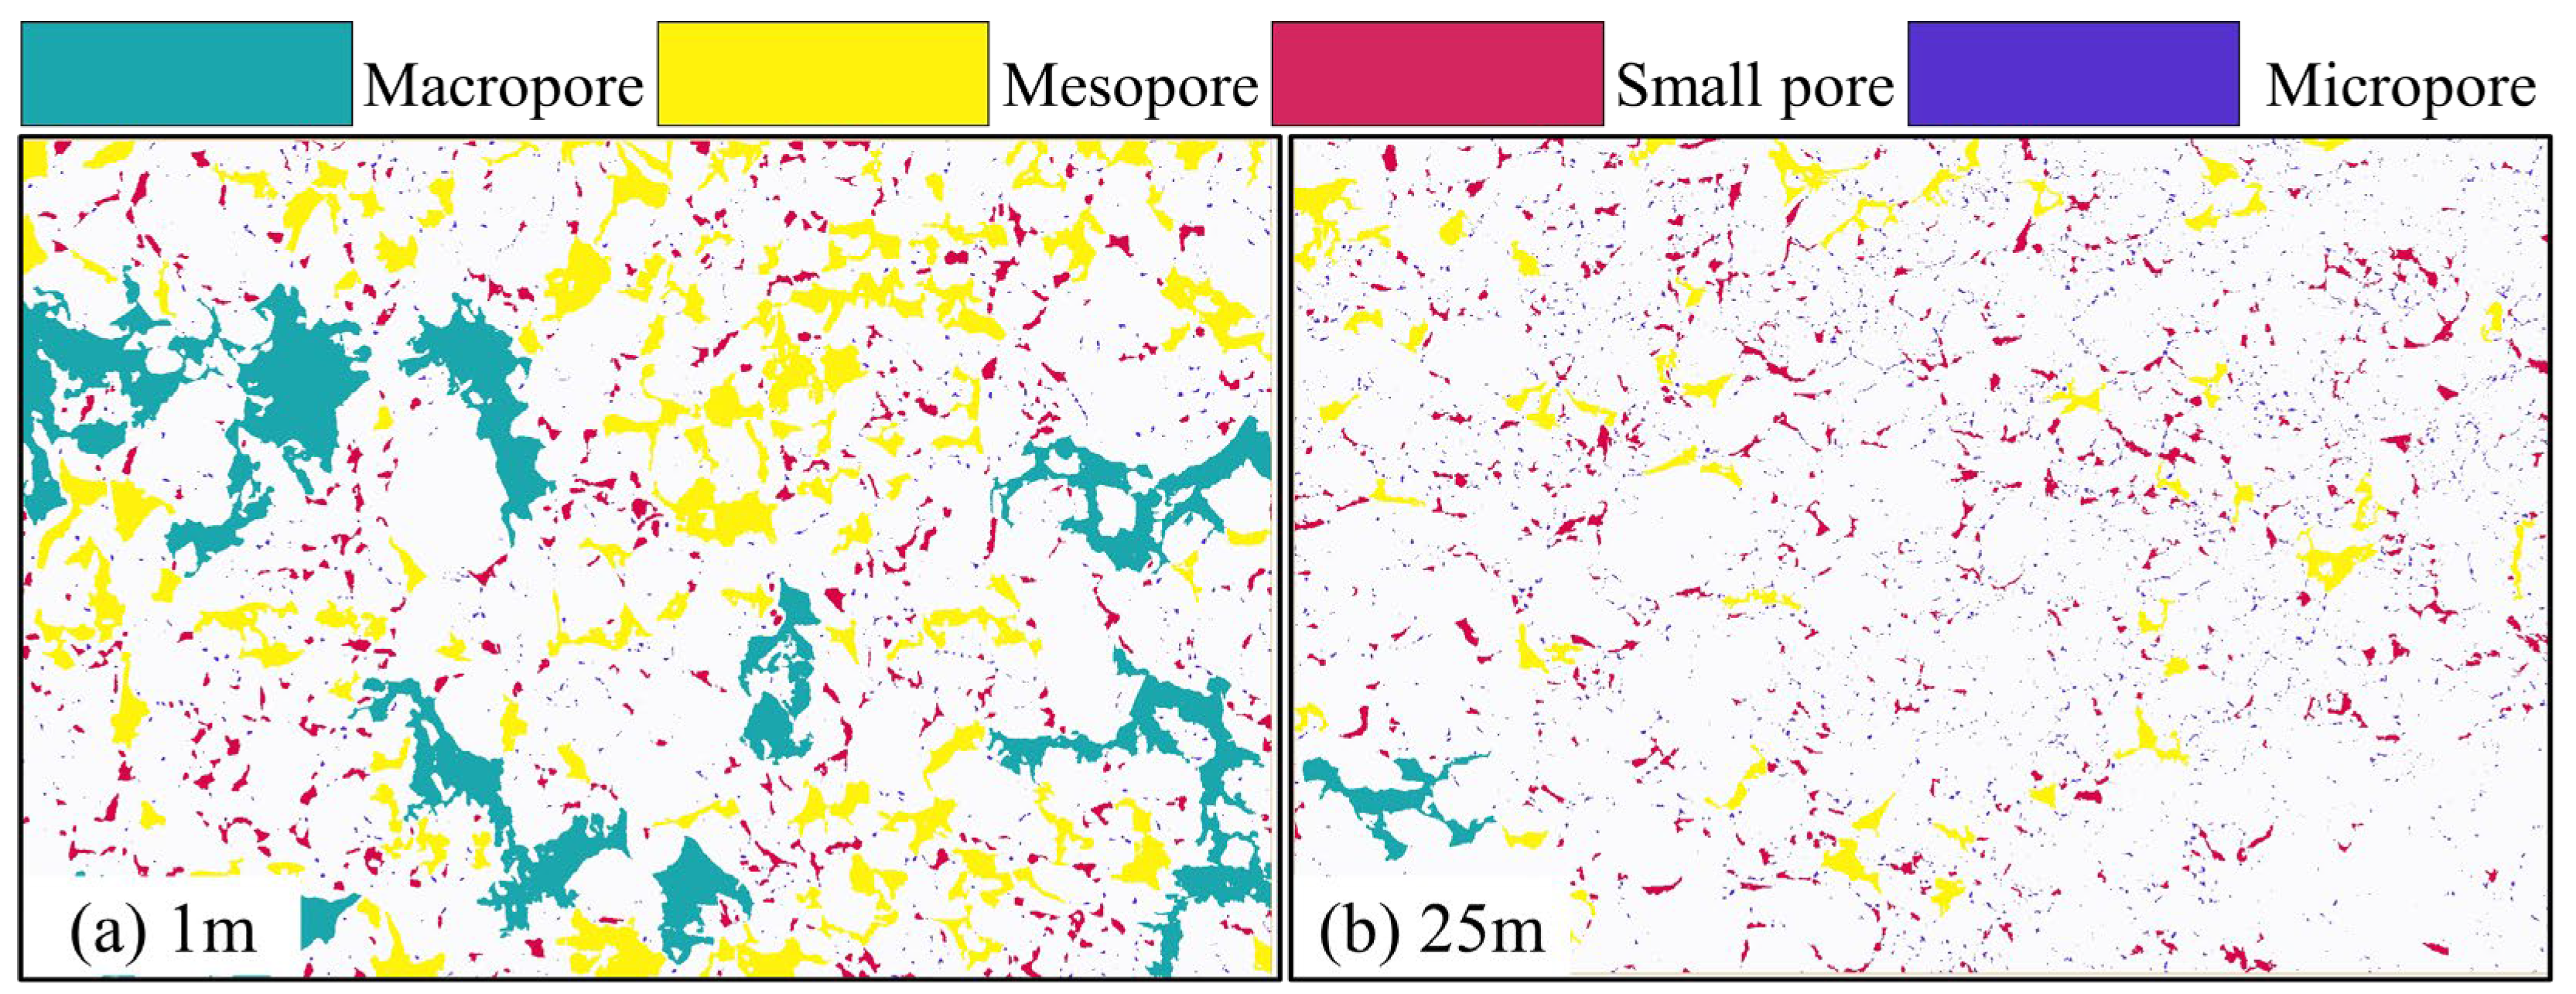
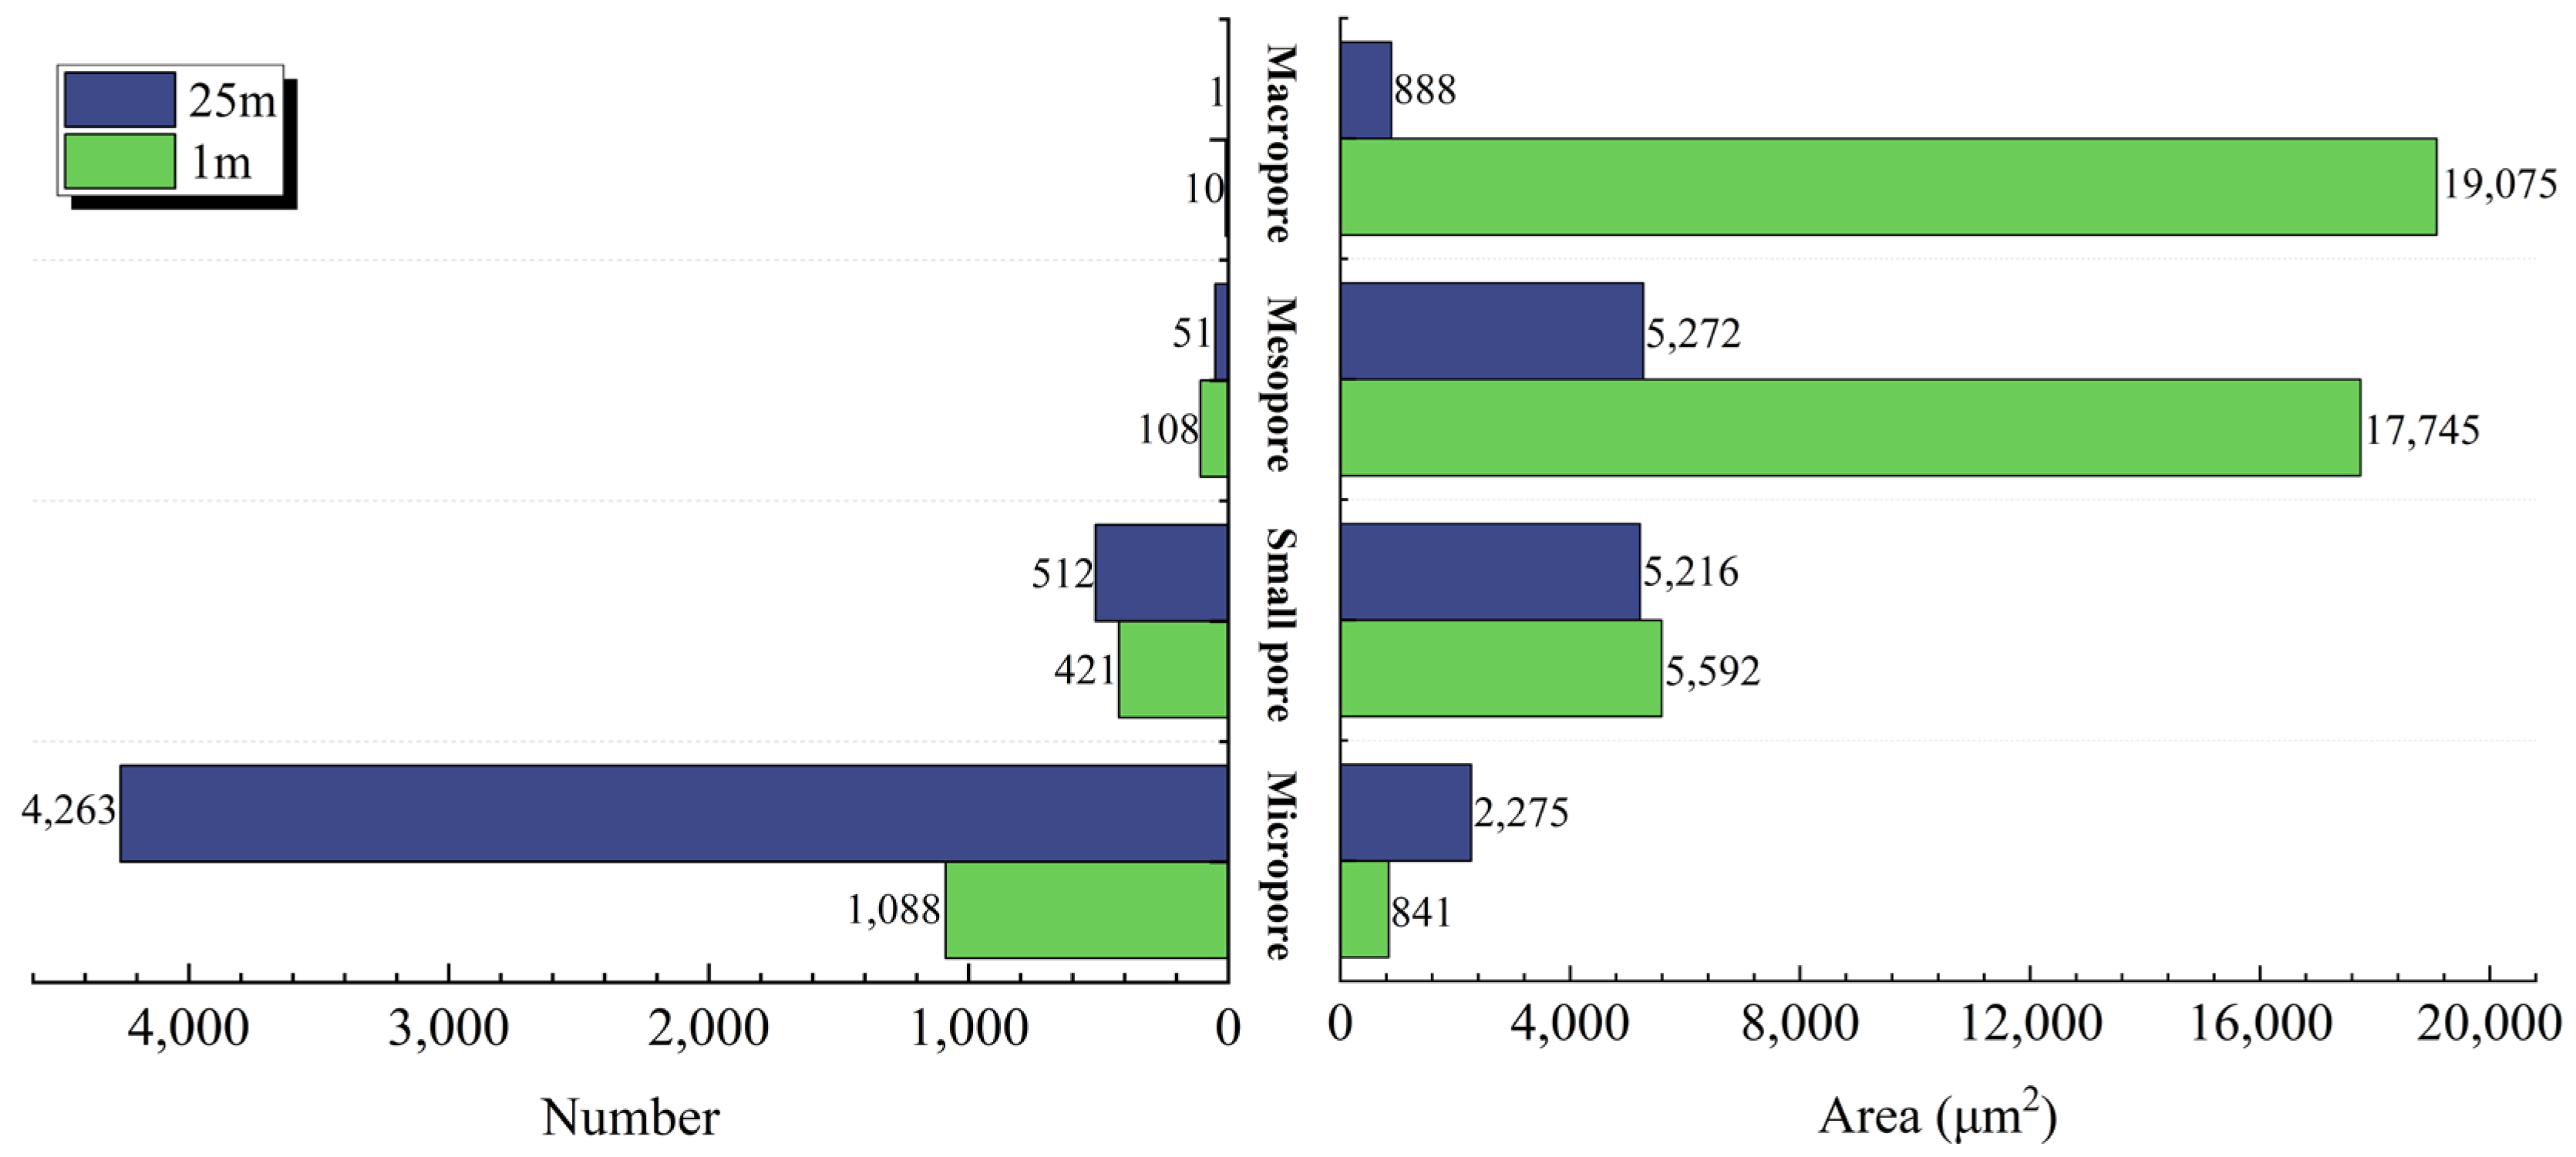
3.4.1. Pore Size Distribution

To quantify the microstructural differences between the two samples, the pore size distributions (equivalent pore diameters) were extracted from the SEM images, as shown in Figure 11. The violin plot of the 1 m sample’s pore size distribution reveals a broad range, indicative of a loose pore structure and dispersed distribution. This implies the presence of various pore types, including overhead and inter-aggregate pores. The average and maximum pore sizes of the 1 m sample are 2.77 μm and 62.50 μm, respectively. In contrast, the 25 m sample’s pore size distribution is more concentrated, dominated by pores smaller than 10 μm. The average and maximum pore sizes of the 25 m sample are 1.12 μm and 33.57 μm, respectively. The 1 m sample contains significantly larger pores compared to the 25 m sample, particularly those exceeding 10 μm in diameter. Larger pores facilitate water infiltration and structural collapse, enhancing compression and wetting-induced deformation. Conversely, the smaller pores in the 25 m sample contribute to reduced deformation under wet conditions and greater structural stability.
Based on Lei’s [52] classification, the pores were categorized according to their diameter into micropores (<2 μm), small pores (2–8 μm), mesopores (8–32 μm), and macropores (>32 μm). The distributions of these four types of pores in the 1 m and 25 m samples are shown in Figure 12. It is evident that the 25 m sample has significantly fewer macropores and mesopores, with poorer pore connectivity, indicating a denser soil structure.
Both samples are dominated by micropores and small pores, constituting 92.7% and 98.9% of the total pore counts for the 1 m and 25 m samples, respectively (Figure 13). For the pore area, macropores and mesopores dominate the 1 m sample, accounting for 85.13% of the total area, whereas mesopores and small pores dominate in the 25 m sample, occupying 76.82% of the total area.
Differences in the pore numbers and areas between the two samples are primarily attributed to variations in the macropores, mesopores, and micropores, with small pores showing minimal variation. The 1 m sample contains 1627 pores, whereas the 25 m sample has 4827. The 25 m sample has higher numbers of micropores and small pores compared to the 1 m sample, with micropores being particularly abundant. In contrast, the 1 m sample exhibits a greater abundance of macropores and mesopores. Regarding the pore area, the 1 m sample displays larger areas of macropores, mesopores, and small pores relative to the 25 m sample, with the macropore area surpassing that of the 25 m sample by a factor of 20. Conversely, the micropore area in the 25 m sample is 2.7 times greater than that in the 1 m sample.

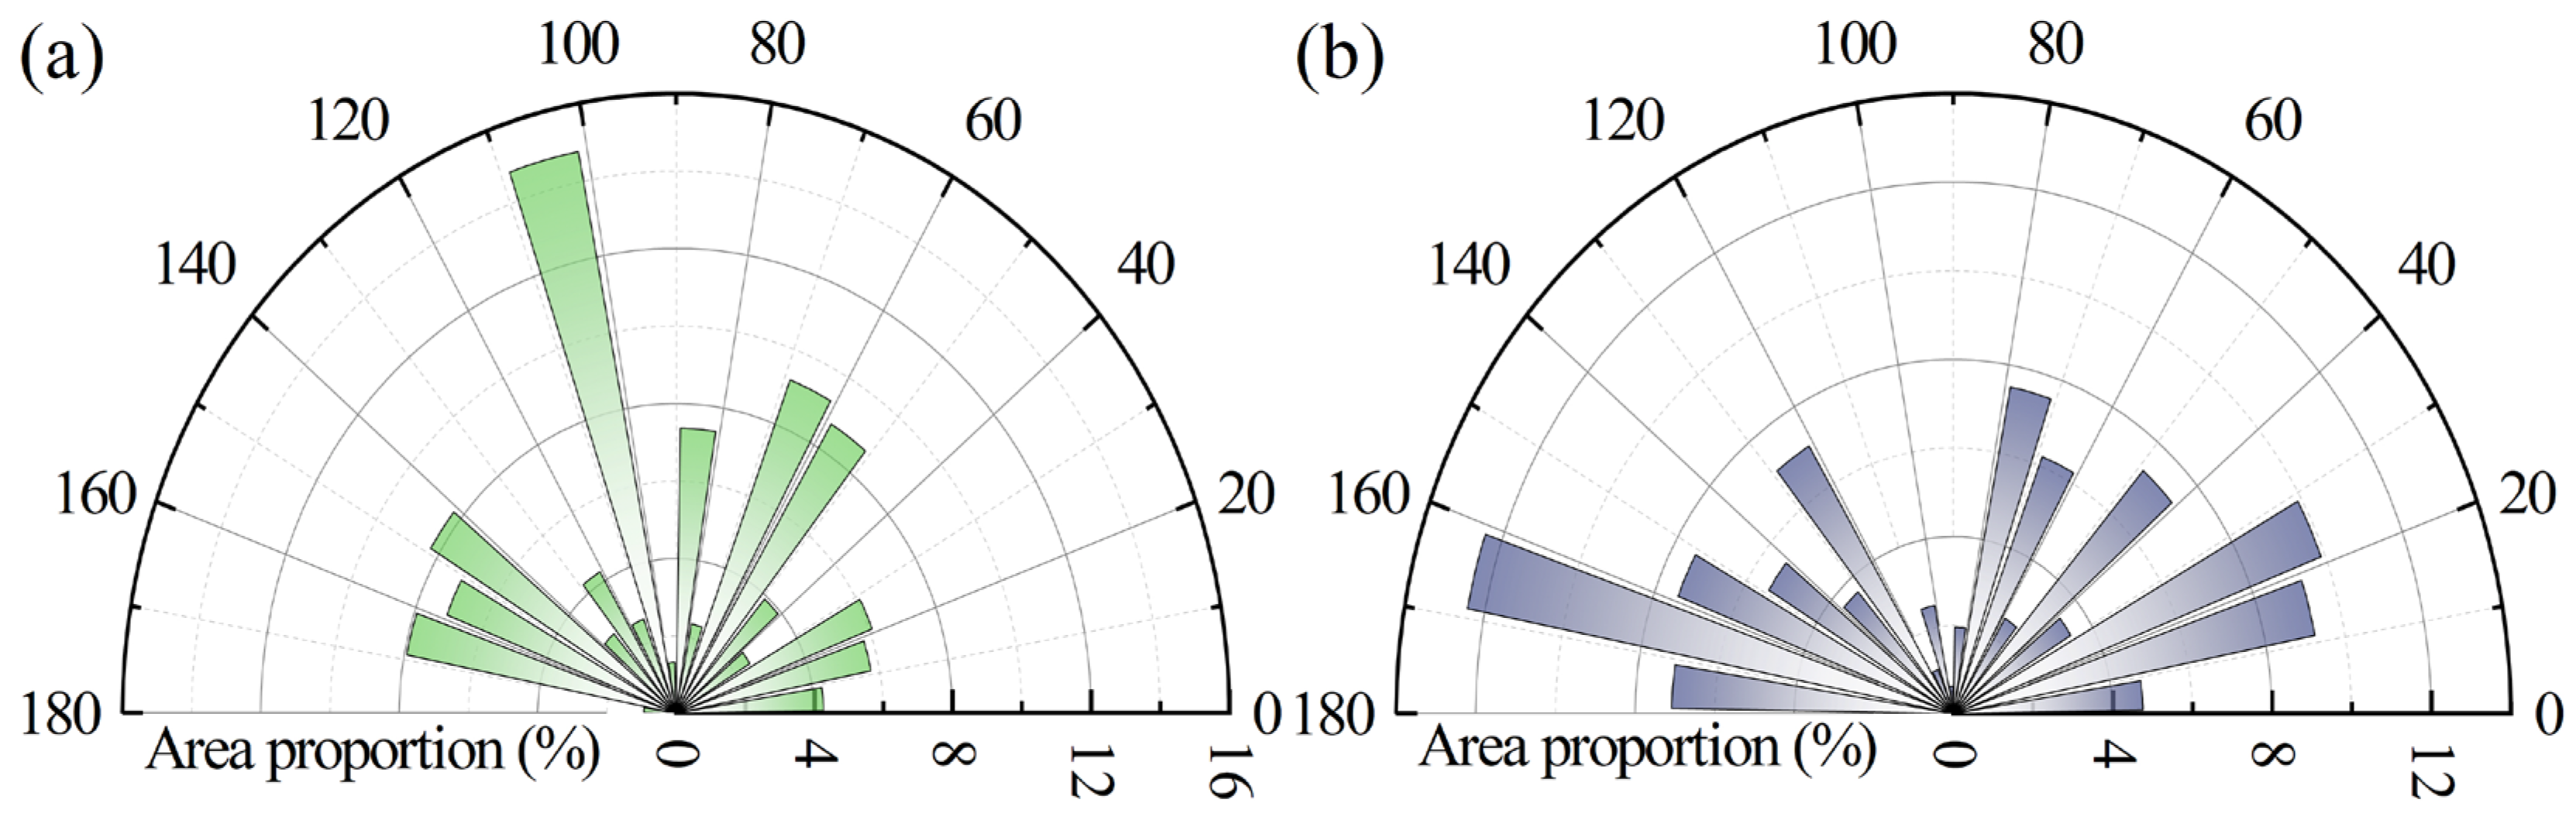
3.4.2. Pore Orientation Angle

The pore orientation angle in this study was defined by the long-axis direction of the pores, ranging from 0° to 180°. Pores were divided into 18 groups at 10° intervals, with their distribution characteristics illustrated in Figure 14. The pore orientation angles in both the 1 m and 25 m samples appear relatively randomly and exhibit weak orderliness. The 1 m sample exhibits a peak pore area proportion of 14.77% within the range of [100°, 110°], whereas the 25 m sample peaks at 12.43% in the range of [160°, 170°].
The Hm values for the 1 m and 25 m soil samples are 0.9359 and 0.9390, respectively, suggesting slightly greater orderliness in the former. Aligned pore directions promote the development of microcracks and permeation channels during water infiltration. Consequently, the 1 m soil sample exhibits higher water sensitivity and enhanced collapsibility.

3.4.3. Pore Morphology Characteristics

The roundness values predominantly range from 0.55 to 0.90, comprising 52.84% and 57.70% of the pores in the 1 m and 25 m samples, respectively (Figure 15). The average roundness value is 0.648 for the 25 m sample, marginally higher than the 0.617 for the 1 m sample. The elongation values are primarily distributed between 0.30 and 0.80, with averages of 0.522 for the 1 m sample and 0.576 for the 25 m sample. The fractal dimension (Df) indicates that the 25 m sample exhibits slightly greater morphological complexity than the 1 m sample. These findings imply that the pores in the 25 m sample are more circular, facilitating stress dispersion and enhancing structural stability and compressive resistance.

4. Discussion

4.1. Mechanisms of Difference in Mechanical Properties

Soil compressibility and collapsibility are influenced by both internal and external factors [53]. Influencing factors include external conditions, such as the water content and loading, alongside intrinsic properties, including the mineral composition and microstructure [54]. Carbonate minerals like calcite commonly act as primary cementing agents between soil particles [55]. These minerals, however, are susceptible to dissolution or softening upon exposure to external moisture, causing structural collapse. Clay minerals like illite and montmorillonite exhibit water absorption and swelling characteristics, affecting both microstructural changes and macroscopic deformation during wetting. Porous and loose microstructures, from a microstructural perspective, create the spatial foundation for compression and collapsibility. Macropores and overhead structures are widely recognized as critical factors contributing to collapsibility [30]. This section explores the mechanisms underlying the mechanical property differences between the 1 m and 25 m soil samples, emphasizing their mineral compositions and microstructures.
In the natural state, the 1 m soil sample exhibited loosely packed particles, forming a metastable microstructure characterized by large overhead and inter-aggregate pores. In contrast, the 25 m sample featured more tightly arranged particles, with pores mainly composed of smaller inter-aggregate and intra-aggregate pores (Figure 10, Figure 12, Figure 13, and Figure 16a). Under vertical loading or pressure, the deformation differences between the two soils were largely governed by their microstructural characteristics, particularly their pore structures. Macropores and mesopores are more susceptible to compression compared to small and micropores. Differences in their microstructural stabilities, particularly in their abundances of overhead pores and macropores, resulted in the 1 m sample exhibiting more pronounced compressive deformation compared to that of the 25 m sample (Figure 5, Figure 6, Figure 10, Figure 12, and Figure 16b).
During wetting, the deformation differences between the two layers were governed by the interplay of their mineral compositions and microstructures, with the soil structure experiencing further collapse upon submersion. The dissolution of cementing materials, such as calcite, between particles accelerates structural breakdown in the soil. Due to its higher calcite content, the 1 m sample exhibited faster structural yielding and failure (Figure 7). Certain clay minerals, such as illite, expand during water absorption, partially inhibiting structural collapse or even inducing expansion. The differences in the wetting-induced deformation between the two samples were primarily determined by the balance between clay mineral swelling-induced expansion and structural collapse. Notably, while the grain size distributions of the two soil samples largely overlap, the contents of calcite and illite exhibit a significant exchange (Figure 2, Table 2). In loess, illite and calcite mainly occur as fine particles that fill the voids between skeletal grains. The overlapping grain size distributions suggest that the fine-grained mineral contents are generally similar, although their compositions differ substantially. The 1 m sample has a higher proportion of calcite filling the voids between skeletal particles, whereas the 25 m sample is enriched with illite. Calcite readily dissolves in water, causing soil structure collapse, while illite swells upon wetting. These differences in their mineral compositions directly affected the contrasting wetting-induced deformation behaviors of the two depth samples.
The 1 m sample, characterized by a higher macropore content and lower clay mineral proportion, underwent structural collapse that outweighed expansion during wetting, resulting in significant macroscopic collapsible deformation. In contrast, the 25 m sample, with a higher micropore content and greater clay mineral proportion, exhibited weaker structural collapse relative to the expansion caused by clay mineral swelling. Consequently, the expansion induced by clay mineral swelling surpassed structural collapse, leading to expansive deformation at the macroscopic scale (Table 2, Figure 8, Figure 9, and Figure 16c).

4.2. Implications for Land Stability and Sustainable Management

Studies on wetting-induced deformation in loess offer essential insights for addressing geohazards, including ground subsidence, slope instability, and soil erosion, which pose substantial threats to land stability and sustainable development in loess-dominated regions [56]. The distinct wetting behaviors of loess layers from different geological periods underscore the necessity for tailored management strategies to address challenges arising from collapsibility and expansiveness.
The Late Pleistocene loess layer at a 1 m depth exhibited significant collapsibility, attributed to its metastable microstructure characterized by abundant macropores and overhead structures. These features heighten the vulnerability of shallow loess layers to deformation during water infiltration, emphasizing their importance as critical zones for hazard mitigation. In contrast, the Middle Pleistocene loess layer at a 25 m depth exhibited enhanced microstructural stability and expansiveness, driven by a higher clay mineral content and prevalence of micropores, presenting distinct challenges for construction and land use, particularly for tunneling through deeper strata.
To address these challenges, the following management strategies are proposed based on the findings of this study:
  • Controlled irrigation systems and drainage networks should be implemented to minimize water infiltration into susceptible zones, particularly in areas dominated by shallow loess layers;
  • The development of targeted early warning systems based on the differences in the wetting-induced deformation of shallow and deep loess can help predict and mitigate potential hazards;
  • Land use planning should account for the variability in the wetting deformation between shallow and deep loess layers. Agricultural and infrastructural development should prioritize regions with greater structural stability while applying reinforcement measures in areas with high collapsibility;
  • Deep loess exhibits greater stability but also shows expansiveness. Therefore, water management and support measures should be prioritized in deep engineering projects, such as tunnel construction.
By integrating these findings into sustainable land management practices, this study provides a framework to enhance land stability and mitigate risks in regions with loess deposits. Interdisciplinary collaboration among scientists, engineers, and policymakers is essential to implement holistic solutions that address the unique challenges posed by wetting-induced deformation in loess regions.

4.3. Limitations and Prospects

This study integrated macroscopic and microscopic analyses to investigate how the mineral composition and microstructure influence the deformation behaviors of shallow and deep loess layers, offering critical insights into the wetting-induced deformation mechanisms and their implications for land stability and sustainable management. Despite its significant contributions to understanding wetting-induced deformation in loess, this study has certain limitations that warrant acknowledgment.
For unsaturated soils, collapsible deformation is strongly influenced by the water content and matric suction [24,57]. Previous studies indicate that transient and dynamic changes in the water content exert distinctly different impacts on the soil suction. Transient wetting can cause a rapid reduction in the soil suction, leading to structural collapse and particle rearrangement [58,59]. Conversely, transient drying raises the soil suction, inducing rapid shrinkage and the formation of cracks [60]. Dynamic suction changes, such as those caused by multiple wetting–drying cycles, may diminish the soil’s water retention capacity and collapsibility [61,62,63]. This study primarily examined the wetting-induced deformation mechanisms from a microscopic perspective, focusing on the mineral composition and microstructure, without addressing the interaction between matric suction and macro-mechanical behavior. The pore analysis in this study emphasizes the initial pore structure and size distribution, which are critical factors in determining whether collapsible deformation occurs and its extent [20,30]. However, the transformation of the pore size distribution during the wetting–collapse process is not included in the analysis. Late Pleistocene loess typically exhibits metastable structures and collapsible properties similar to those of the 1 m sample in this study [9,26]. In contrast, Middle Pleistocene loess (the 25 m sample in this study) varies significantly in its burial depth across regions, and the applicability of the findings and recommendations to other areas requires further investigation.
These limitations underscore critical avenues for future research. Future research should integrate soil–water characteristic curves and the pore size distribution evolution during wetting to refine the multiscale understanding of the wetting-induced deformation mechanisms. Expanding the study area to validate the generalizability of these findings and recommendations is also essential.

5. Conclusions

To investigate the differences in the wetting-induced deformation of soils from different geological periods (depths) and their underlying mechanisms, this study focused on soil samples from 1 m (Late Pleistocene) and 25 m (Middle Pleistocene) depths in Fuxian, Shaanxi Province. Through a series of macro- and microscopic tests, including X-ray diffraction, scanning electron microscopy, and consolidation–collapse tests, the wetting-induced deformation characteristics and the intrinsic mechanisms behind the differences between the two soil layers were systematically analyzed. The main conclusions are as follows:
(1)
The 1 m sample demonstrated greater compressibility compared to the 25 m sample, with contrasting trends in their compressive deformation under wetting conditions. While the 1 m sample’s compressibility increased progressively with wetting, the 25 m sample’s compressibility decreased. The increasing initial water content reduced the structural yield stresses of both samples, with a more pronounced decline in the 1 m sample;
(2)
The collapsibility coefficients of the two samples displayed contrasting trends in response to the pressure and initial water content. In its natural state, the 1 m sample exhibited pronounced collapsibility that reduced with the increasing water content. Conversely, the 25 m sample demonstrated expansion (a negative collapsibility coefficient) in its natural state, which gradually transitioned to lower expansiveness as the water content increased;
(3)
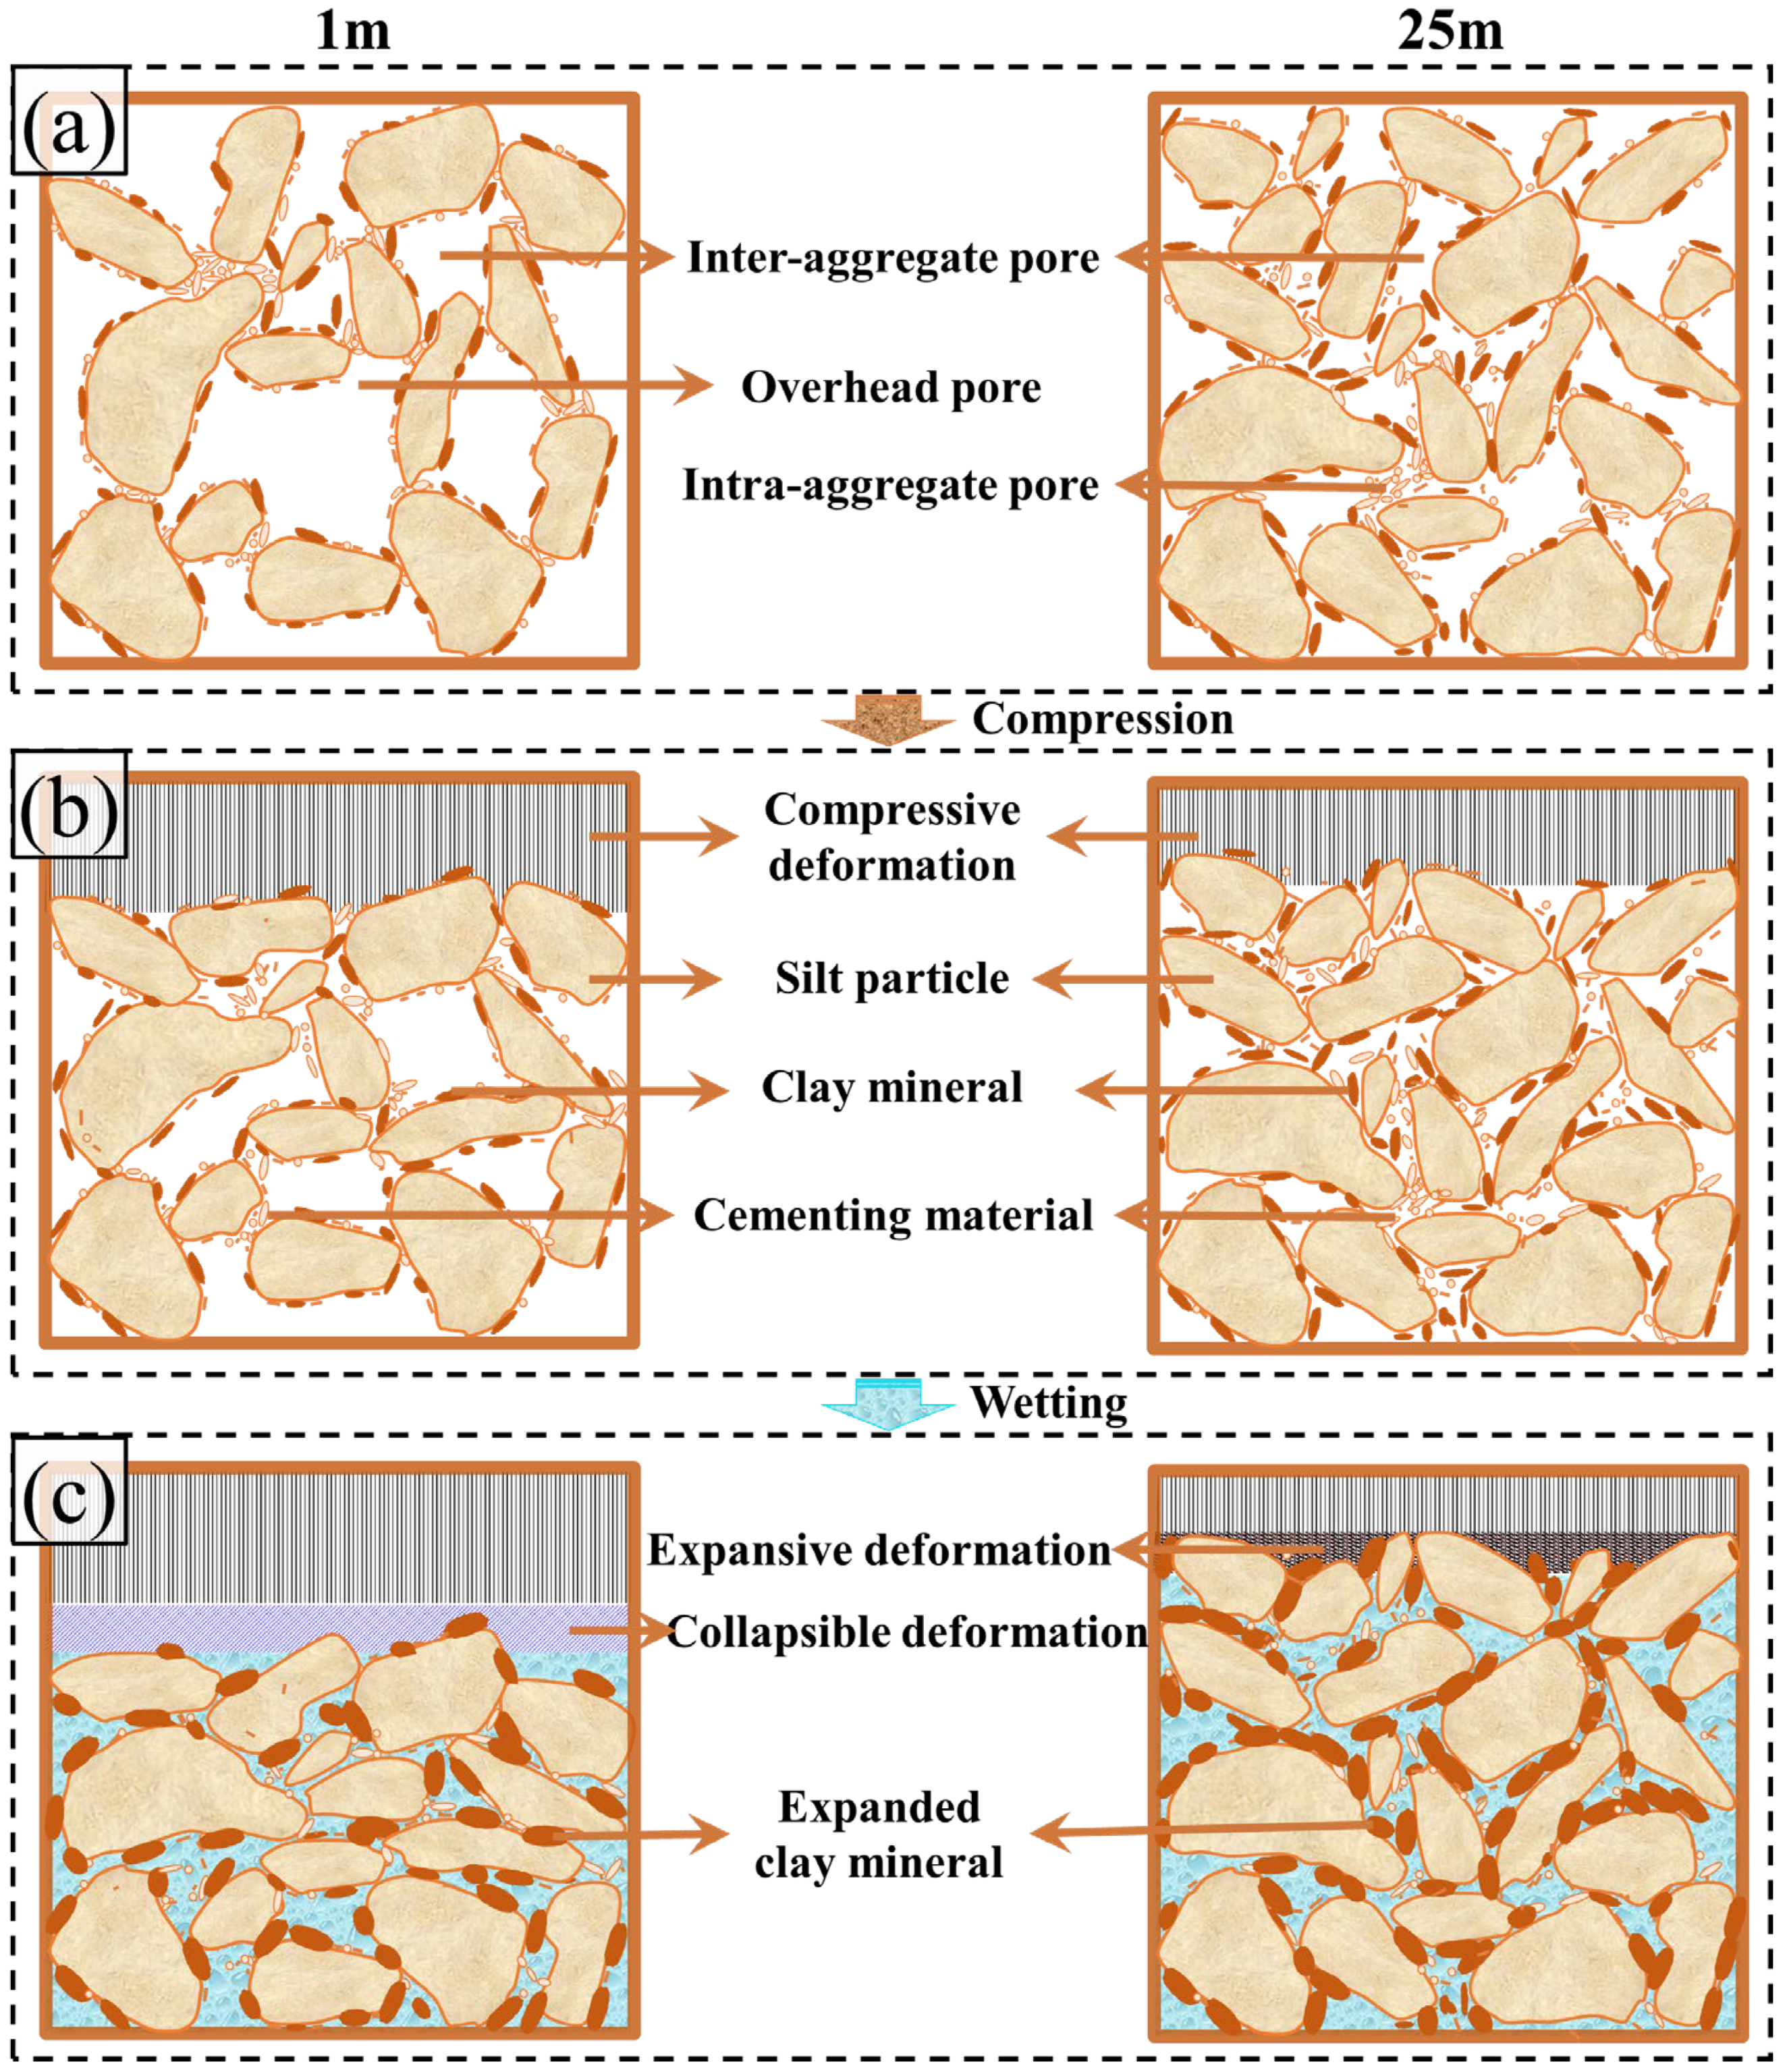
The 1 m sample exhibited lower microstructural stability with prominent overhead pores and structures, while the 25 m sample displayed densely packed particles with higher structural stability. Micropores were dominant in the 25 m sample, whereas macropores and mesopores were more prevalent in the 1 m sample. The 1 m sample’s higher pore order contrasts with the greater roundness, elongation, and fractal complexity observed in the 25 m sample. These differences in the microstructure and pore characteristics contributed to the greater compressibility and collapsibility of the 1 m sample;
(4)
Differences in macroscopic deformation arise from the interplay between the microstructure and mineral composition. Compression behavior is dictated by the microstructural stability and macropore content, while wetting-induced deformation depends on the balance between clay mineral-driven expansion and structural collapse. For the 1 m sample, the abundant macropores and lower clay mineral content led to dominant collapse, resulting in pronounced collapsibility. Conversely, the 25 m sample’s higher micropore content and clay mineral proportion promoted swelling, resulting in expansive deformation.
This study offers valuable insights into the mechanisms of wetting-induced deformation in loess, highlighting the critical roles of the mineral composition and microstructure in governing collapsible and expansive behaviors. These findings hold practical significance for enhancing land stability and informing sustainable management practices in loess regions. Nevertheless, limitations include the exclusion of matric suction and the evolution of the pore size distribution during the wetting–collapse process. Future investigations should incorporate these aspects and extend the research to diverse geographical locations to validate the findings and refine land use strategies in loess areas.

Author Contributions

Conceptualization, Q.L., W.X., H.Y. and K.Y.; methodology, Q.L. and W.X.; software, Q.L. and H.Y.; validation, Q.L. and K.Y.; formal analysis, Q.L. and H.Y.; investigation, Q.L., P.Q., Z.W., X.G. and W.X.; data curation, Q.L., P.Q., Z.W. and S.Z.; writing—original draft preparation, Q.L., W.X., K.Y., H.Y., X.L. and J.Z.; writing—review and editing, Q.L., W.X., K.Y. and H.Y.; visualization, Q.L.; supervision, W.X.; project administration, W.X.; funding acquisition, W.X. and Q.L. All authors have read and agreed to the published version of the manuscript.

Funding

This study would not have been possible without the financial support from the National Natural Science Foundation of China under the State Council of China (Grant No. 42372320, Grant No. 41972292), the Innovation Capability Support Program of Shaanxi Province under the Department of Science and Technology of Shaanxi Province (Grant No. 2021TD-54), the Key Research and Development Projects of Shaanxi Province (Grant No. 2022ZDLSF06-03), and the Graduate Innovation Program of Northwest University (Grant No. CX2023137).

Data Availability Statement

Data will be made available upon request from the corresponding author due to the fact that the research project is not yet completed.

Conflicts of Interest

The authors declare that there are no known competing financial interests or personal relationships that could have appeared to influence the work reported in this paper.

References

  1. Cucci, G.; Lacolla, G.; Mastro, M.A.; Caranfa, G. Leaching Effect of Rainfall on Soil under Four-Year Saline Water Irrigation. Soil Water Res. 2021, 11, 181–189. [Google Scholar] [CrossRef]
  2. Vaezi, A.R.; Ahmadi, M.; Cerdà, A. Contribution of Raindrop Impact to the Change of Soil Physical Properties and Water Erosion under Semi-Arid Rainfalls. Sci. Total Environ. 2017, 583, 382–392. [Google Scholar] [CrossRef] [PubMed]
  3. Wei, Y.; Wu, X.; Xia, J.; Miller, G.A.; Cai, C.; Guo, Z.; Arash, H. The Effect of Water Content on the Shear Strength Characteristics of Granitic Soils in South China. Soil Tillage Res. 2019, 187, 50–59. [Google Scholar] [CrossRef]
  4. Zhang, Z.; Zeng, R.; Meng, X.; Zhao, S.; Wang, S.; Ma, J.; Wang, H. Effects of Changes in Soil Properties Caused by Progressive Infiltration of Rainwater on Rainfall-Induced Landslides. Catena 2023, 233, 107475. [Google Scholar] [CrossRef]
  5. Luo, P.; Ma, M. Failure Mechanisms and Protection Measures for Expansive Soil Slopes: A Review. Sustainability 2024, 16, 5127. [Google Scholar] [CrossRef]
  6. Zhou, X.; He, J.; Chi, S.; Wang, J. Study on Collapse Settlement and Cracks of Core Wall Rockfill Dams under Wetting Deformation. Int. J. Numer. Anal. Methods Geomech. 2023, 47, 106–128. [Google Scholar] [CrossRef]
  7. Xiao, W.; Tian, W. Experimental Study on the Failure Process and Modes of Loess Spoil Slope Induced by Rainfall and Engineering Disturbance. PLoS ONE 2024, 19, e0305871. [Google Scholar] [CrossRef]
  8. Opukumo, A.W.; Davie, C.T.; Glendinning, S.; Oborie, E. A Review of the Identification Methods and Types of Collapsible Soils. J. Eng. Appl. Sci. 2022, 69, 1–21. [Google Scholar] [CrossRef]
  9. Yang, H.; Xie, W.; Liu, Q.; Zhu, R.; Liu, Y. Three-Stage Collapsibility Evolution of Malan Loess in the Loess Plateau. Catena 2022, 217, 106482. [Google Scholar] [CrossRef]
  10. Zhang, Z.; Pan, H.; Liu, Y.; Sheng, S. Ecosystem Services’ Response to Land Use Intensity: A Case Study of the Hilly and Gully Region in China’s Loess Plateau. Land 2024, 13, 2039. [Google Scholar] [CrossRef]
  11. Qiao, F.; Chang, C.; Bo, J.; Wang, L.; Wang, J. Study on the Dynamic Characteristics of Loess. Sustainability 2023, 15, 5428. [Google Scholar] [CrossRef]
  12. Xu, P.; Lin, Q.; Fang, L. Study on the Mechanical Properties of Loess Improved by Lignosulfonate and Its Mechanism Analysis and Prospects. Appl. Sci. 2022, 12, 9843. [Google Scholar] [CrossRef]
  13. Wei, L.; Zeng, Z.; Yan, J. Factors Affecting the Stability of Loess Landslides: A Review. Appl. Sci. 2024, 14, 2735. [Google Scholar] [CrossRef]
  14. Gao, C.; Du, G.; Liu, S.; He, H.; Zhang, D. The Microscopic Mechanisms of Treating Collapsible Loess with Vibratory Probe Compaction Method. Transp. Geotech. 2021, 27, 100492. [Google Scholar] [CrossRef]
  15. Xie, W.L.; Li, P.; Vanapalli, S.K.; Wang, J.D. Prediction of the Wetting-Induced Collapse Behaviour Using the Soil-Water Characteristic Curve. J. Asian Earth Sci. 2018, 151, 259–268. [Google Scholar] [CrossRef]
  16. Wang, Y.; Li, Y. Wetting-Induced Collapse of Loess: Tracing Microstructural Evolution. Eng. Geol. 2024, 340, 107673. [Google Scholar] [CrossRef]
  17. Zheng, H.; Li, X.-A.; Deng, Y.-H.; Hao, Z.-T.; Wen, F.; Zheng, H.; Li, X.-A.; Deng, Y.-H.; Hao, Z.-T.; Wen, F. Study on the Influence of Initial State on Loess Erosion Characteristics and Microscopic Mechanism. Sustainability 2023, 15, 4676. [Google Scholar] [CrossRef]
  18. Zhang, L.; Li, T.; Zhang, Y. A Simple Method for Predicting Wetting-Induced Collapse Behavior of Compacted Loess with Various Initial Void Ratios and Moisture Contents. Environ. Earth Sci. 2023, 82, 1–12. [Google Scholar] [CrossRef]
  19. Meng, J.; Li, X.A. Effects of Carbonate on the Structure and Properties of Loess and the Corresponding Mechanism: An Experimental Study of the Malan Loess, Xi’an Area, China. Bull. Eng. Geol. Environ. 2019, 78, 4965–4976. [Google Scholar] [CrossRef]
  20. Wei, Y.; Fan, W.; Yu, B.; Deng, L.; Ma, G. Investigation of the Collapse Potential of Malan Loess from Different Regions on the Loess Plateau in Terms of Pore Size Distribution and Clay Distribution Form. Acta Geotech. 2023, 18, 6595–6613. [Google Scholar] [CrossRef]
  21. Yan, G.; Li, Z.; Torres, G.; Scheuermann, S.A.; Li, A.; Yan, G.; Li, Z.; Andres, S.; Scheuermann, A.; Li, L. Transient Two-Phase Flow in Porous Media: A Literature Review and Engineering Application in Geotechnics. Geotechnics 2022, 2, 32–90. [Google Scholar] [CrossRef]
  22. Zaffar, M.; Lu, S.G. Pore Size Distribution of Clayey Soils and Its Correlation with Soil Organic Matter. Pedosphere 2015, 25, 240–249. [Google Scholar] [CrossRef]
  23. Derbyshire, E.; Meng, X.; Wang, J.; Zhou, Z.; Li, B. Collapsible Loess on the Loess Plateau of China. In Genesis and Properties of Collapsible Soils: Proceedings of the NATO Advanced Research Workshop, Loughborough, UK, 11–14 April 1994; Springer: Berlin/Heidelberg, Germany, 1995; pp. 267–293. [Google Scholar] [CrossRef]
  24. Li, P.; Vanapalli, S.; Li, T. Review of Collapse Triggering Mechanism of Collapsible Soils Due to Wetting. J. Rock Mech. Geotech. Eng. 2016, 8, 256–274. [Google Scholar] [CrossRef]
  25. Liu, Z.; Liu, F.; Ma, F.; Wang, M.; Bai, X.; Zheng, Y.; Yin, H.; Zhang, G. Collapsibility, Composition, and Microstructure of Loess in China. Can. Geotech. J. 2016, 53, 673–686. [Google Scholar] [CrossRef]
  26. Nan, J.; Peng, J.; Zhu, F.; Zhao, J.; Leng, Y. Multiscale Characteristics of the Wetting Deformation of Malan Loess in the Yan’an Area, China. J. Mt. Sci. 2021, 18, 1112–1130. [Google Scholar] [CrossRef]
  27. Mu, Q.Y.; Zhou, C.; Ng, C.W.W. Compression and Wetting Induced Volumetric Behavior of Loess: Macro- and Micro-Investigations. Transp. Geotech. 2020, 23, 100345. [Google Scholar] [CrossRef]
  28. Chen, Y.; Li, P.; Wang, Y.; Li, J. Unraveling the Mystery of Water-Induced Loess Disintegration: A Comprehensive Review of Experimental Research. Sustainability 2024, 16, 2463. [Google Scholar] [CrossRef]
  29. Abduhell, A.; Zhang, Z.; Cheng, W.; Zhang, Y. Shrinkage Characteristics and Microstructure Evolution of Yili Loess under Different Wetting and Drying Cycles. Water 2023, 15, 2932. [Google Scholar] [CrossRef]
  30. Wei, Y.; Huang, Z. Variations in Microstructure and Collapsibility Mechanisms of Malan Loess across the Henan Area of the Middle and Lower Reaches of the Yellow River. Appl. Sci. 2024, 14, 8220. [Google Scholar] [CrossRef]
  31. Li, L.; Wang, J.; Gu, Q.; Zhang, D. Effects of Paleosol on the Collapsibility of Loess Sites under Immersion Test Conditions. Sustainability 2024, 16, 447. [Google Scholar] [CrossRef]
  32. Chen, H.; Jiang, Y.; Gao, Y.; Yuan, X. Structural Characteristics and Its Influencing Factors of Typical Loess. Bull. Eng. Geol. Environ. 2019, 78, 4893–4905. [Google Scholar] [CrossRef]
  33. Barden, L.; McGown, A.; Collins, K. The Collapse Mechanism in Partly Saturated Soil. Eng. Geol. 1973, 7, 49–60. [Google Scholar] [CrossRef]
  34. Houston, S.L.; Houston, W.N. Suction-Oedometer Method for Computation of Heave and Remaining Heave. Geotech. Spec. Publ. 2018, 2017, 93–116. [Google Scholar] [CrossRef]
  35. Jennings, J.E.B.; Burland, J.B. Limitations to the Use of Effective Stresses in Partly Saturated Soils. Géotechnique 2015, 12, 125–144. [Google Scholar] [CrossRef]
  36. Wray, W.K.; El-Garhy, B.M.; Youssef, A.A. Three-Dimensional Model for Moisture and Volume Changes Prediction in Expansive Soils. J. Geotech. Geoenviron. Eng. 2005, 131, 311–324. [Google Scholar] [CrossRef]
  37. Vu, H.Q.; Fredlund, D.G. The Prediction of One-, Two-, and Three-Dimensional Heave in Expansive Soils. Can. Geotech. J. 2011, 41, 713–737. [Google Scholar] [CrossRef]
  38. Zhang, X.; Briaud, J.L. Three Dimensional Numerical Simulation of Residential Building on Shrink–Swell Soils in Response to Climatic Conditions. Int. J. Numer. Anal. Methods Geomech. 2015, 39, 1369–1409. [Google Scholar] [CrossRef]
  39. Alonso, E.E.; Gens, A.; Josa, A. A Constitutive Model for Partially Saturated Soils. Géotechnique 2015, 40, 405–430. [Google Scholar] [CrossRef]
  40. Alonso, E.E.; Vaunat, J.; Gens, A. Modelling the Mechanical Behaviour of Expansive Clays. Eng. Geol. 1999, 54, 173–183. [Google Scholar] [CrossRef]
  41. Riad, B.; Zhang, X. Modified State Surface Approach to Study Unsaturated Soil Hysteresis Behavior. Transp. Res. Rec. 2020, 2674, 484–498. [Google Scholar] [CrossRef]
  42. Komolvilas, V.; Kikumoto, M.; Kyokawa, H. Mechanism of Wetting–Induced Deformation and Failure of Unsaturated Soils. Int. J. Numer. Anal. Methods Geomech. 2022, 46, 1064–1092. [Google Scholar] [CrossRef]
  43. Zhang, X.; Zuo, Y.; Wang, T.; Han, Q. Salinity Effects on Soil Structure and Hydraulic Properties: Implications for Pedotransfer Functions in Coastal Areas. Land 2024, 13, 2077. [Google Scholar] [CrossRef]
  44. Lin, B.; Cerato, A.B. Applications of SEM and ESEM in Microstructural Investigation of Shale-Weathered Expansive Soils along Swelling-Shrinkage Cycles. Eng. Geol. 2014, 177, 66–74. [Google Scholar] [CrossRef]
  45. Assallay, A.M.; Rogers, C.D.F.; Smalley, I.J. Formation and Collapse of Metastable Particle Packings and Open Structures in Loess Deposits. Eng. Geol. 1997, 48, 101–115. [Google Scholar] [CrossRef]
  46. Ma, R.; Cai, C.; Li, Z.; Wang, J.; Xiao, T.; Peng, G.; Yang, W. Evaluation of Soil Aggregate Microstructure and Stability under Wetting and Drying Cycles in Two Ultisols Using Synchrotron-Based X-Ray Micro-Computed Tomography. Soil Tillage Res. 2015, 149, 1–11. [Google Scholar] [CrossRef]
  47. Li, P.; Xie, W.; Pak, R.Y.S.; Vanapalli, S.K. Microstructural Evolution of Loess Soils from the Loess Plateau of China. Catena 2019, 173, 276–288. [Google Scholar] [CrossRef]
  48. GB/T 50123-2019; (GB/T 50123-2019 Newer Version) PDF Standard for Geotechnical Testing Method. China Planning Press: Beijing, China, 2019; pp. 85–99. Available online: https://www.chinesestandard.net/PDF.aspx/GBT50123-1999 (accessed on 22 December 2024).
  49. Nie, Y.; Ni, W.; Lü, X.; Tuo, W.; Yuan, K. Macroscopic Mechanical Behavior and Microstructural Evolution of Compacted Loess in the Chinese Loess Plateau. Soil Tillage Res. 2023, 232, 105767. [Google Scholar] [CrossRef]
  50. Duan, Z.; Li, Z.Y.; Wu, Y.B.; Niu, B.; Shen, R.J. Mechanical and Microscopic Properties of Soil According to the Rate of Increase in Pore Water Pressure. Soil Tillage Res. 2023, 225, 105530. [Google Scholar] [CrossRef]
  51. Consoli, N.C.; Rotta, G.V.; Prietto, P.D.M. Yielding–Compressibility–Strength Relationship for an Artificially Cemented Soil Cured under Stress. Géotechnique 2015, 56, 69–72. [Google Scholar] [CrossRef]
  52. Lei, X. The Types of Loess Pores in China and Their Relationship with Collapsibility. Sci. Sin. B 1988, 31, 1398–1410. [Google Scholar]
  53. Smith, C.W.; Johnston, M.A.; Lorentz, S. Assessing the Compaction Susceptibility of South African Forestry Soils. II. Soil Properties Affecting Compactibility and Compressibility. Soil Tillage Res. 1997, 43, 335–354. [Google Scholar] [CrossRef]
  54. Garakani, A.A.; Haeri, S.M.; Cherati, D.Y.; Givi, F.A.; Tadi, M.K.; Hashemi, A.H.; Chiti, N.; Qahremani, F. Effect of Road Salts on the Hydro-Mechanical Behavior of Unsaturated Collapsible Soils. Transp. Geotech. 2018, 17, 77–90. [Google Scholar] [CrossRef]
  55. Sun, Q.; Zamanian, K.; Huguet, A.; Wiesenberg, G.L.B.; Zhao, T.; Lei, Z. Carbonate Cementing Minerals in Rhizoliths from Badain Jaran Desert: Implication for Pedo-Diagenesis and Environment of Dune Soil. Rhizosphere 2023, 25, 100647. [Google Scholar] [CrossRef]
  56. Zhu, C.; Peng, S.; Li, Z.; Xu, J.; Deng, G.; Wang, S. Evaluation on Wetting Effect of Loess High-Fill Embankment under Rainfall and Groundwater Uplift. Transp. Geotech. 2023, 38, 100916. [Google Scholar] [CrossRef]
  57. Mahmood, M.S.; Abrahim, M.J. A Review of Collapsible Soils Behavior and Prediction. IOP Conf. Ser. Mater. Sci. Eng. 2021, 1094, 012044. [Google Scholar] [CrossRef]
  58. Ito, M.; Azam, S.; Clifton, W. Suction-Based Model for Predicting Cyclic and Transient Volume Changes in Expansive Clays Using a Material Property Function. Eng. Geol. 2022, 296, 106491. [Google Scholar] [CrossRef]
  59. Bordoni, M.; Bittelli, M.; Valentino, R.; Chersich, S.; Meisina, C. Improving the Estimation of Complete Field Soil Water Characteristic Curves through Field Monitoring Data. J. Hydrol. 2017, 552, 283–305. [Google Scholar] [CrossRef]
  60. Dong, Y.; Wang, L. Determination of Soil-Shrinkage Curve Using Transient Water Evaporation Method. Int. J. Geomech. 2021, 21. [Google Scholar] [CrossRef]
  61. Nguyen, L.C.; van Tien, P.; Do, T.N. Deep-Seated Rainfall-Induced Landslides on a New Expressway: A Case Study in Vietnam. Landslides 2020, 17, 395–407. [Google Scholar] [CrossRef]
  62. Yuan, K.; Ni, W.; Della Vecchia, G.; Lü, X.; Wang, H.; Nie, Y. Influence of Dry Density and Wetting–Drying Cycles on the Soil–Water Retention Curve of Compacted Loess: Experimental Data and Modeling. Acta Geotech. 2024, 19, 8111–8128. [Google Scholar] [CrossRef]
  63. Zhao, N.F.; Ye, W.M.; Chen, B.; Chen, Y.G.; Cui, Y.J. Modeling of the Swelling–Shrinkage Behavior of Expansive Clays during Wetting–Drying Cycles. Acta Geotech. 2019, 14, 1325–1335. [Google Scholar] [CrossRef]
Figure 1. Sampling location and site photos: (a) geographical location of the sampling site, (b) site topography and sampling depths, (c) collected rectangular soil samples.
Land 14 00312 g001
Figure 2. Particle size distributions of samples.
Land 14 00312 g002
Figure 3. Flowchart of consolidation–collapse tests and microstructure tests.
Land 14 00312 g003
Figure 4. Schematic diagram of the calculation method for soil collapsable deformation (collapsibility coefficient) using the double-oedometer test.
Land 14 00312 g004
Figure 5. Consolidation compression test results of soil samples: (a,c) the relationship between the axial strain and vertical pressure for the 1 m and 25 m samples, respectively; (b,d) the relationship between the axial strain and initial water content for the 1 m and 25 m samples, respectively.
Land 14 00312 g005
Figure 6. e-lgp curve clusters for (a) 1 m and (b) 25 m soil samples under different initial water contents.
Land 14 00312 g006
Figure 7. Variation in structural yield stresses (Psy) of the 1 m and 25 m soils: (a) schematic diagram of the method for determining structural yield stress and (b) relationship between structural yield stress and initial water content.
Land 14 00312 g007
Figure 8. Relationship between collapsibility coefficient and vertical pressure for samples with different initial water contents: (a) 1 m sample and (b) 25 m sample.
Land 14 00312 g008
Figure 9. Collapsibility coefficient surfaces for soil samples under different initial water contents: (a) 1 m sample and (b) 25 m sample.
Land 14 00312 g009
Figure 10. Microstructural characteristics of samples under SEM: (a) 1 m and (b) 25 m.
Land 14 00312 g010
Figure 11. Comparison of pore size distributions between the two soil samples.
Land 14 00312 g011
Figure 12. Distributions of four types of microstructural pores in soil sample images: (a) 1 m and (b) 25 m.
Land 14 00312 g012
Figure 13. Statistical results of differences in four types of microstructural pores between two soil samples.
Land 14 00312 g013
Figure 14. Statistical results of pore orientation angle distribution: (a) 1 m and (b) 25 m.
Land 14 00312 g014
Figure 15. Statistical results of pore morphology parameter distribution: (a) 1 m and (b) 25 m.
Land 14 00312 g015
Figure 16. Schematic diagram of the mechanisms underlying wetting deformation differences between the two soil samples under the coupled effects of their microstructures and mineral compositions: (a) initial microstructures, (b) microstructures after compressive deformation, (c) microstructures after wetting deformation.
Land 14 00312 g016
Table 1. Statistical results of the basic physical properties of the soil samples.
Physical PropertyValue
1 m25 m
Natural density, ρ (g/cm3)1.641.80
Natural water content, ω (%)18.8020.90
Dry density, ρd (g/cm3)1.351.49
Porosity, n0.500.45
Void ratio, e1.000.82
Atterberg limits
Plastic limit, ωp (%)15.4019.40
Liquid limit, ωl (%)29.5029.20
Plasticity index, Ip14.109.80
Soil classificationCLCL
Table 2. Statistical results of the mineral compositions of the soil samples.
Composition of MineralsValue (%)
1 m25 m
Quartz49.4045.40
Illite10.8018.70
Calcite12.507.60
Feldspar16.7016.40
Chlorite2.902.40
Kaolinite5.805.60
Vermiculite1.903.90
Disclaimer/Publisher’s Note: The statements, opinions and data contained in all publications are solely those of the individual author(s) and contributor(s) and not of MDPI and/or the editor(s). MDPI and/or the editor(s) disclaim responsibility for any injury to people or property resulting from any ideas, methods, instructions or products referred to in the content.

