Article

Understanding the Spatial Differentiation and Driving Mechanisms of Human Settlement Satisfaction Using Geographically Explainable Machine Learning: A Case Study of Xiamen’s Urban Physical Examination

1
School of Architecture and Civil Engineering, Xiamen University, Xiamen 361005, China
2
School of Business, Nanjing University of Information Science and Technology, Nanjing 210044, China
3
Xiamen Planning Digital Technology Research Center, Xiamen 361005, China
*
Author to whom correspondence should be addressed.
Land 2025, 14(12), 2325; https://doi.org/10.3390/land14122325
Submission received: 22 October 2025 / Revised: 23 November 2025 / Accepted: 25 November 2025 / Published: 26 November 2025
(This article belongs to the Special Issue Urban Land Use Dynamics and Smart City Governance)

Abstract

In recent years, as Chinese cities have entered a stage of high-quality transformation, enhancing livability and achieving refined governance within existing urban spaces has become a central issue in urban planning and management. The establishment of the Urban Physical Examination mechanism has provided a scientific framework for evaluating urban performance. However, most existing studies focus primarily on objective indicators, paying insufficient attention to residents’ subjective perceptions and their spatial variations. As a result, the multi-scale mechanisms underlying human settlement satisfaction remain poorly understood. Using Xiamen City as a case, this study draws on data from the 2025 Urban Physical Examination Resident Survey and constructs a Geographically Random Forest (GRF) model to examine how block, community, housing, and personal attributes jointly shape human settlement satisfaction (HSS) and its spatial heterogeneity. The results show that (1) overall, block’ business vitality is the most influential factor affecting HSS, followed by community management and housing safety, highlighting the dominant roles of the built environment and grassroots management in shaping residential experience; (2) management and safety issues at the community level are more prominent in suburban areas, old neighborhoods, and zones surrounding tourist attractions, reflecting a mismatch between service provision and urban expansion; (3) housing-scale factors display significant spatial variation, with tenure and housing affordability emerging as key determinants of satisfaction among residents in newly developed districts; and (4) at the personal characteristic, age, residential duration, occupational prestige, and household income exhibit marked spatial heterogeneity, revealing satisfaction patterns jointly shaped by social mobility and urban growth. The study concludes that multi-scale spatial identification and resident perception feedback mechanisms should be strengthened within the Urban Physical Examination framework. Such efforts can promote a shift from static indicator monitoring to dynamic spatial governance, providing theoretical and methodological support for refined urban management and the improvement of human settlement environments.

1. Introduction

As China’s urbanization shifts from rapid expansion to high-quality development, the focus of urban governance has gradually moved from construction scale to quality of life [1,2]. Urban development is no longer centered solely on physical construction but increasingly emphasizes residents’ subjective experiences and life satisfaction. In recent years, factors such as housing conditions, community environments, public service provision, and social participation have been regarded as key dimensions for assessing urban livability [3,4,5,6]. Scientifically identifying how these factors influence residents’ human settlement satisfaction (HSS) and uncovering their spatial disparities has become a central issue in urban studies and governance practice [7,8].
Human settlement satisfaction (HSS) serves as a key subjective indicator of urban livability and an important measure of urban development quality [9]. Extant research has evolved from a narrow focus on housing conditions to a multidimensional framework encompassing the built environment, social services, and individual socioeconomic attributes. At the level of the built environment, factors such as neighborhood walkability, land-use mix, and access to green spaces and cultural facilities have been consistently linked to residents’ well-being [4,10,11,12]. Concurrently, at the community level, the effectiveness of grassroots governance, property management, and the provision of care services (e.g., for the elderly and children) are critical in shaping daily lived experiences [5,13,14,15]. Furthermore, individual characteristics—including age, income, and length of residence—modulate satisfaction by influencing expectations and needs [16,17,18]. This multi-scale understanding underscores that HSS is the product of a complex interplay between objective spatial conditions and subjective resident perceptions.
However, a significant gap remains in understanding the spatial heterogeneity of these influencing factors. The majority of existing studies rely on traditional statistical models, such as Ordinary Least Squares (OLS) or multilevel linear models, which operate on the assumption of spatial stationarity—that the relationship between predictors and HSS is constant across geographic space [10,13]. While techniques like Geographically Weighted Regression (GWR) introduce spatial weights to account for locality, they are often limited in capturing the complex nonlinear relationships and higher-order interactions among variables that characterize urban systems [10]. Consequently, the current body of literature provides a somewhat “averaged” or “global” perspective, failing to reveal how and where specific determinants of HSS, such as community management or business vitality, become critically important. This lack of a fine-grained, spatially explicit understanding hinders the development of targeted and effective urban governance interventions.
The “Urban Physical Examination” (UPE) mechanism, launched by the Chinese Ministry of Housing and Urban–Rural Development (MOHURD) in 2019, provides a scientific framework for evaluating urban health and addressing emerging “urban ailments” through problem-oriented governance [19,20]. After years of implementation, a relatively comprehensive indicator system has been established nationwide [21]. This system, particularly the inclusion of resident survey data, offers a unique opportunity to integrate subjective perceptions into urban performance assessment. Yet, a critical disconnect persists. Most UPE evaluations remain focused on objective quantitative metrics—such as infrastructure density and housing security—while paying insufficient attention to the spatial heterogeneity of residents’ subjective perceptions and the multi-scale mechanisms that underlie them [22,23]. As a result, while UPE can capture the overall performance of urban systems, it often falls short in diagnosing the spatially varying “symptoms” that affect residents’ well-being [24]. Introducing multi-scale spatial cognition and advanced analytical methods capable of deciphering nonlinearity and spatial heterogeneity into the UPE framework is, therefore, an urgent and necessary step to enhance its diagnostic sensitivity and explanatory power.
As one of China’s pilot cities for UPE, Xiamen has conducted annual assessments for six consecutive years since 2019, accumulating extensive data and practical experience [25]. Its examination system covers not only objective indicators such as infrastructure and ecological environment but also subjective perception data derived from resident surveys [26]. This provides a unique opportunity to explore the multi-scale spatial characteristics of HSS. Moreover, Xiamen embodies both “old city renewal” and “new city expansion,” exhibiting a heterogeneous spatial structure that reflects general patterns of residential experience differentiation during urbanization [27,28]. These characteristics make Xiamen a representative and transferable case for empirical study.
To address the aforementioned methodological limitations, this study introduces the Geographically Random Forest (GRF) model [29]. The Random Forest model itself excels at explaining nonlinear interactions among variables without pre-specified functional forms [30], while the GRF further integrates spatial locality to identify region-specific important features. This integration offers a novel methodological approach for revealing the spatial heterogeneity of HSS, overcoming the constraints of both traditional global models and linear spatial regression.
Based on these considerations, this study uses Xiamen City as a case and employs data from the 2025 Urban Physical Examination Resident Survey to construct a multi-dimensional indicator system across four scales—block, community, housing, and personal attributes. A GRF model is then applied to identify key multi-scale determinants and their spatial patterns. The objectives of this study are to (1) reveal the spatial distribution and differentiation of HSS in Xiamen; (2) identify the key influencing factors at different scales and their spatial heterogeneity; (3) analyze how the built environment, governance effectiveness, and social structure interact to shape residents’ satisfaction; and (4) discuss policy implications for improving indicator design and promoting refined spatial governance within the Urban Physical Examination framework.
The study makes three primary contributions. First, methodologically, it introduces the Geographically Random Forest into UPE research, combining nonlinear interpretation with spatial locality to overcome the limitations of traditional models. Second, it establishes a block–community–housing–personal multi-scale analytical framework, enabling systematic analysis from the physical environment to social structure. Third, at the practical level, the study develops a replicable spatial perception analysis approach based on the Xiamen datasets, providing valuable insights for enhancing Urban Physical Examination practices and urban livability in other Chinese cities.

2. Data and Methods

2.1. Study Area

Xiamen City is located in the southeastern part of Fujian Province, China, along the central section of the western coast of the Taiwan Strait (see Figure 1). It consists of Xiamen Island, Gulangyu Island, and adjacent coastal mainland areas. As a sub-provincial city of Fujian and one of China’s five specifically designated cities in the national plan, Xiamen holds significant economic and social importance in the southeastern coastal region of China. Since the establishment of the Xiamen Special Economic Zone in 1980, the city has served as a crucial window for China’s reform and opening-up, undertaking vital roles in external exchange, port trade, and cross-strait cooperation [31].
Administratively, Xiamen consists of six districts, which are strategically grouped into two distinct spatial entities based on their geographical and developmental stages: the “island area” (Siming and Huli districts on Xiamen Island) and the “outer-island area” (Xiang’an, Tong’an, Jimei, and Haicang districts). This well-defined “island–outer-island” duality is not merely a geographical fact but a reflection of sequential urban development. The island area represents the mature urban core, characterized by high population density and advanced socioeconomic development. In contrast, the outer-island area functions as the primary zone for urban expansion, industrial relocation, and new town construction [32]. This intrinsic contrast, encapsulating both a developed core and rapidly urbanizing peripheries within a single city, makes Xiamen an ideal and transferable case study for examining human settlement satisfaction across diverse urban contexts.
Since being selected in 2019 as one of China’s first eleven Urban Physical Examination pilot cities, Xiamen has continuously implemented an annual assessment mechanism and has completed six consecutive examination cycles. Through a tripartite evaluation framework that integrates departmental self-assessment, coordinated evaluation, and public participation, Xiamen has developed the nationally recognized “Xiamen Model” of Urban Physical Examination [25]. In 2025, the program entered its seventh year. At this new stage, systematically exploring the scientific validity of the examination indicator system and its relationship with human settlement satisfaction (HSS) holds significant theoretical and practical implications for improving urban governance and enhancing urban livability.

2.2. Data

The data used in this study come from the resident survey conducted as part of Xiamen’s 2025 Urban Physical Examination program. The survey was completed online by residents with the assistance of community staff. The data were anonymized by the relevant authorities during collection and comply with applicable data privacy and ethical regulations. The questionnaire systematically collected residents’ subjective evaluations across multiple dimensions, including perceptions of block environments, community management, and public service provision, as well as socioeconomic characteristics and overall satisfaction with the city. These perception-based data form an essential component of Xiamen’s Urban Physical Examination indicator system, providing a crucial empirical foundation for evaluating urban performance and residents’ well-being.
After consistency and completeness checks—requiring all mandatory questions to be answered and a minimum completion time of three minutes—a total of 6848 valid questionnaires were obtained, representing 71.3% of the original 9600 responses. These 6848 questionnaires cover 62.6% of the community units in Xiamen. Communities without survey samples (referred to as “no data” in subsequent analyses) account for 30.6% of the city’s area and 6.7% of its population, based on WorldPop 2025 population data at 100-m resolution (https://hub.worldpop.org/geodata/summary?id=72927, accessed on 1 October 2025). To assess potential spatial bias due to survey gaps and the spatial representativeness of the questionnaire samples, we used the 2025 WorldPop 100-m population distribution data as a benchmark. First, both the population raster data and survey sample points were aggregated to the community level to ensure consistency of comparison units and alignment with the units used in subsequent analyses. Next, we applied a two-dimensional spatial KS test (Fasano–Franceschini test) to quantify the difference between the spatial distributions of the survey samples and the population. The test yielded a D statistic of 0.0845 (range 0–1) with a p-value < 0.001. While the p-value indicates a statistically significant difference between the two distributions, the D value is below the commonly used empirical threshold of 0.1 in spatial analysis, suggesting that the actual spatial difference is relatively small [33]. Therefore, we conclude that the survey samples are highly similar to the population distribution in spatial terms, and the minor statistically significant difference is practically acceptable, indicating that the sample has good spatial representativeness.
In data processing, 25 variables were selected as explanatory factors, covering four analytical dimensions—block, community, housing, and personal attributes—while residents’ multidimensional satisfaction with the city served as the dependent variable.
This multi-scale framework is conceptually grounded in the understanding that urban lived experience is shaped by a nested hierarchy of spatial and administrative units, each governed by distinct yet interconnected logics. The block scale captures the immediate built environment and economic vitality; the community scale reflects the efficacy of grassroots governance and service provision; the housing scale pertains to the physical quality and tenure security of the dwelling; and the personal scale embodies socioeconomic status and place attachment. By systematically integrating these four dimensions, our analytical framework moves beyond a simple descriptive checklist to provide a comprehensive and explanatory lens for diagnosing the complex mechanisms underlying Human Settlement Satisfaction.
(1)
Block Scale
At the block level, four perception indicators were selected: cultural facilities, parks and green spaces, parking facilities, and business vitality. The first three indicators were derived from multiple-choice questions. To construct a comparable measure of perceived severity, we defined the severity score as: Severity = n × 0.1, where n denotes the number of items selected by the respondent indicating existing problems, and N represents the maximum number of selectable items for the question. The resulting severity score ranges from 0 to N × 0.1 and forms an ordered categorical variable, reflecting increasing perceived severity as more items are selected. Business vitality, measured using an ordinal rating scale, was directly incorporated into the model, with higher values representing stronger perceived vitality.
(2)
Community Scale
At the community level, eight indicators were included, covering community care (3 items), local retail, EV charging, public space, waste sorting, and community management. These variables collectively capture diverse aspects of community life. Like the block-scale variables, the data were derived from multiple-choice questions, normalized to a 0–1 scale to represent the severity of problems perceived by residents.
(3)
Housing Scale
At the housing level, seven indicators were selected: corridor safety, kitchen, bathroom, elevator availability, tenure, housing affordability, and construction era. Among them, the first four (kitchen, bathroom, elevator, and tenure) are binary variables (1 = yes). The construction era is an ordinal variable, with higher values representing newer housing.
Corridor safety was constructed from three correlated items: structural safety, fire safety, and pipeline safety. Given their strong intercorrelations (KMO = 0.69, Bartlett’s test p < 0.001), principal component analysis (PCA) was applied to integrate them into a single standardized continuous index, thereby reducing collinearity.
Housing affordability was measured by combining rental and property management costs and categorized into an ordinal variable (1 = low, 2 = medium, 3 = high). The specific coding rules are as follows: low affordability burden: residents living in self-built houses, employer dormitories, or borrowed accommodations (no rent or management costs); medium affordability burden: residents living in self-owned or guaranteed housing, or renting guaranteed/self-built housing (bearing only one type of cost); high affordability burden: residents renting commodity housing or apartments (bearing both rent and management costs).
(4)
Personal Characteristics
At the personal level, variables include age, career, education, income, household size, and duration of residence in the city (Table 1). These are standard socioeconomic and residential attributes used to explain individual variations in satisfaction. Except for occupation (a nominal variable), all others are ordinal variables in the raw data. Following Gao [34], occupation was converted into an ordered variable based on the Chinese Occupational Prestige Scale to ensure consistency of measurement scales.
In the series of variables measuring perceived severity, such as the severity of parking problems and retail issues, almost all variables have standard deviations greater than their means, reflecting a highly skewed distribution: most respondents tend to select “no problem” or indicate only one problem, resulting in right skewness. As these variables are limited ordered categorical measures, they generally cannot satisfy the normality assumption even after numerical transformation. However, the primary estimation model used in this study is Random Forest, a nonparametric tree-based model that does not rely on variable distributions [35]. Therefore, the skewness has minimal impact on the model results and can be safely ignored.
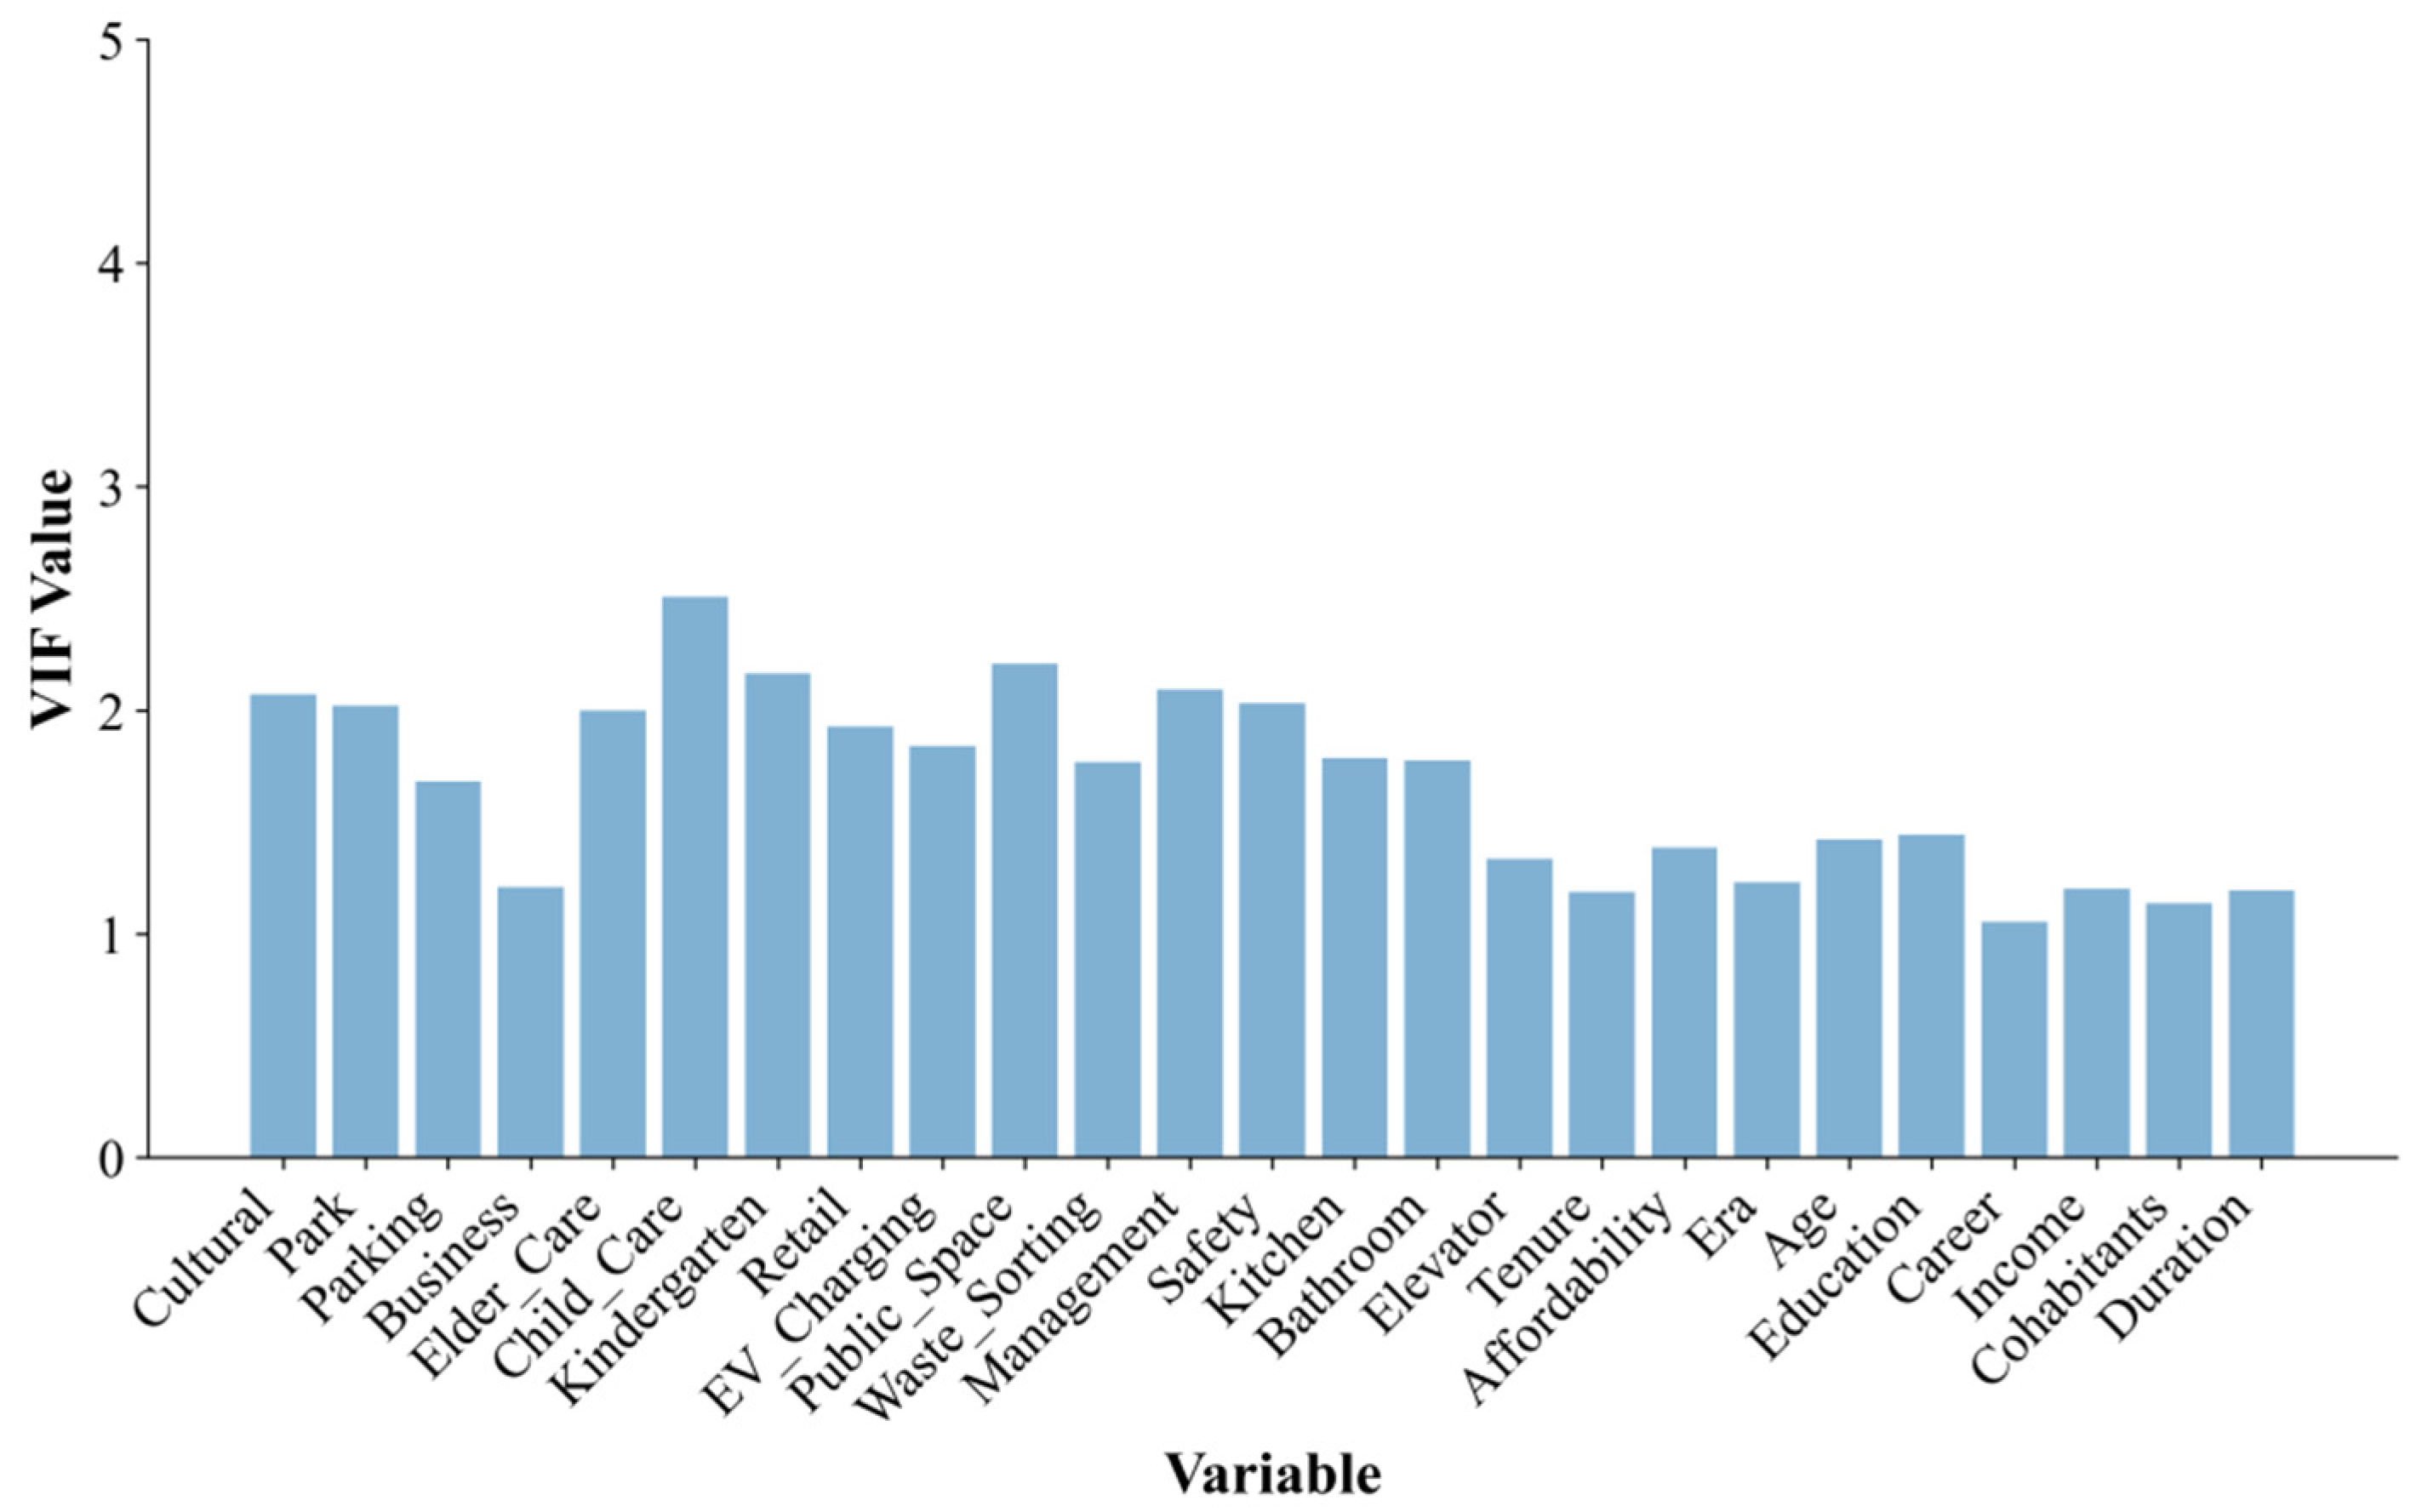
Multicollinearity among explanatory variables was assessed using the variance inflation factor (VIF). As shown in Figure 2, all 25 variables had VIF values below the conventional threshold of 5, indicating no significant multicollinearity issues; hence, all variables were retained for model estimation.

2.3. Methods

2.3.1. Random Forest Model

The Random Forest (RF) model, proposed by Breiman [36], is an ensemble learning algorithm that integrates multiple decision trees and is applicable to both classification and regression tasks. Owing to its strong predictive performance and robustness, it has been widely adopted in social science and spatial research [35,37]. Each decision tree in the forest recursively partitions the feature space through a sequence of threshold-based splits, resulting in a piecewise, nonlinear mapping between predictors and outcomes. By aggregating the predictions of numerous such trees—each trained on randomly sampled data and subsets of variables—RF effectively captures complex nonlinear relationships and higher-order interactions without requiring explicit functional form assumptions [38].
Furthermore, it provides measures of variable importance, offering a direct basis for assessing the relative influence of various factors—such as those affecting human settlement satisfaction (HSS) in this study [39]. The feature importance in this study is measured using the MDI (mean decrease in impurity) method inherent to the Random Forest training process. MDI is automatically generated during model training and has low computational cost, making it particularly suitable for large-scale local estimation under the GRF framework, as in this study, where 6848 local trainings are performed [40]. Although MDI can overestimate the importance of continuous variables or variables with many categories when calculating node impurity reduction, all input variables in this study are binary or low-level ordered categorical variables, so this bias does not apply. Compared with permutation importance or SHAP, MDI is more suitable in terms of computational efficiency and practical applicability for this research [41].

2.3.2. Geographical Random Forest Model

The Geographically Random Forest (GRF) model represents a spatial extension of the traditional RF framework [29]. Its core principle is to incorporate geographical weighting into the bootstrap sampling process of the RF, ensuring that the training data for each local node are drawn from geographically proximate samples. In this way, the GRF retains the RF’s capacity to capture nonlinear relationships while simultaneously accounting for spatial heterogeneity [42]. This makes it particularly suitable for urban-scale social science research, where substantial spatial variability is often observed across different neighborhoods [43].
After conducting a spatial autocorrelation test on the residuals of the global Random Forest, Moran’s I = 0.026 (p = 0.001 < 0.05) indicates significant positive spatial autocorrelation, suggesting that the model does not fully capture the geographic spatial structure. Therefore, we further introduce a geographically weighted extension model to characterize spatial heterogeneity. To obtain locally heterogeneous estimates that meet the research objectives, we did not use global parametric models (e.g., SAR, SEM) that capture spatial dependence but cannot reflect spatial non-stationarity [44]. The local R2 distribution shown in Section 3.3.1 reveals pronounced spatial nonstationarity, further justifying the need for a varying-coefficient model to capture spatial differences. Moreover, we aim to compare not only the effects of the same factor across different communities (horizontally) but also the relative contributions of different factors within the same community (vertically). Since the local regression coefficients in GWR and MGWR are affected by the variable scales and thus cannot be directly compared across variables, we chose Geographical Random Forest (GRF), whose local feature importance can reliably reflect the relative contributions of variables in each community.
The calculation of local relative importance for each community proceeded in two steps following the GRF estimation. First, for each respondent within a community, we obtained the local feature importance values (using MDI) from their corresponding geographically local Random Forest model. These individual-level importance scores were then aggregated to the community level by computing the arithmetic mean for each variable. This step synthesizes the fine-grained, individual-based predictions into a stable, community-representative importance profile [29,45]. Second, to enable a direct comparison of the dominant drivers within each community, these aggregated importance scores were normalized to a percentage scale (0–100%) for each community separately. This final output—community-level relative importance—identifies the most critical factors shaping resident satisfaction in each specific spatial unit [43,46].
In this study, the GRF model adopts an adaptive bandwidth, with the number of nearest neighbors set to 250. This choice is based on two main considerations. Statistically, given 25 explanatory variables, the “ten-times rule” (number of observations ≥ 10 × number of variables) ensures sufficient data for stable local estimation. Spatially, this bandwidth corresponds to an average influence distance of approximately 2.041 km across all local estimation points—slightly larger than a typical block scale but still within the range of a reasonable urban neighborhood unit. This ensures that local estimations remain geographically meaningful while maintaining statistical robustness.
To ensure comparability between local and global estimations, the local RF models adopt identical parameter configurations as the global model, specifically: n_trees = 200, mtry = 9, and nodesize = 9.
The statistical results (see Table 2) indicate that the GRF model significantly outperforms the RF model, confirming its strong capacity to capture spatial heterogeneity. Moreover, the performance metrics of the training and testing sets after tenfold cross-validation are highly consistent, suggesting that the model parameters are well-tuned—effectively avoiding overfitting and ensuring good generalization performance.

3. Result and Discussion

3.1. Spatial Distribution of HSS

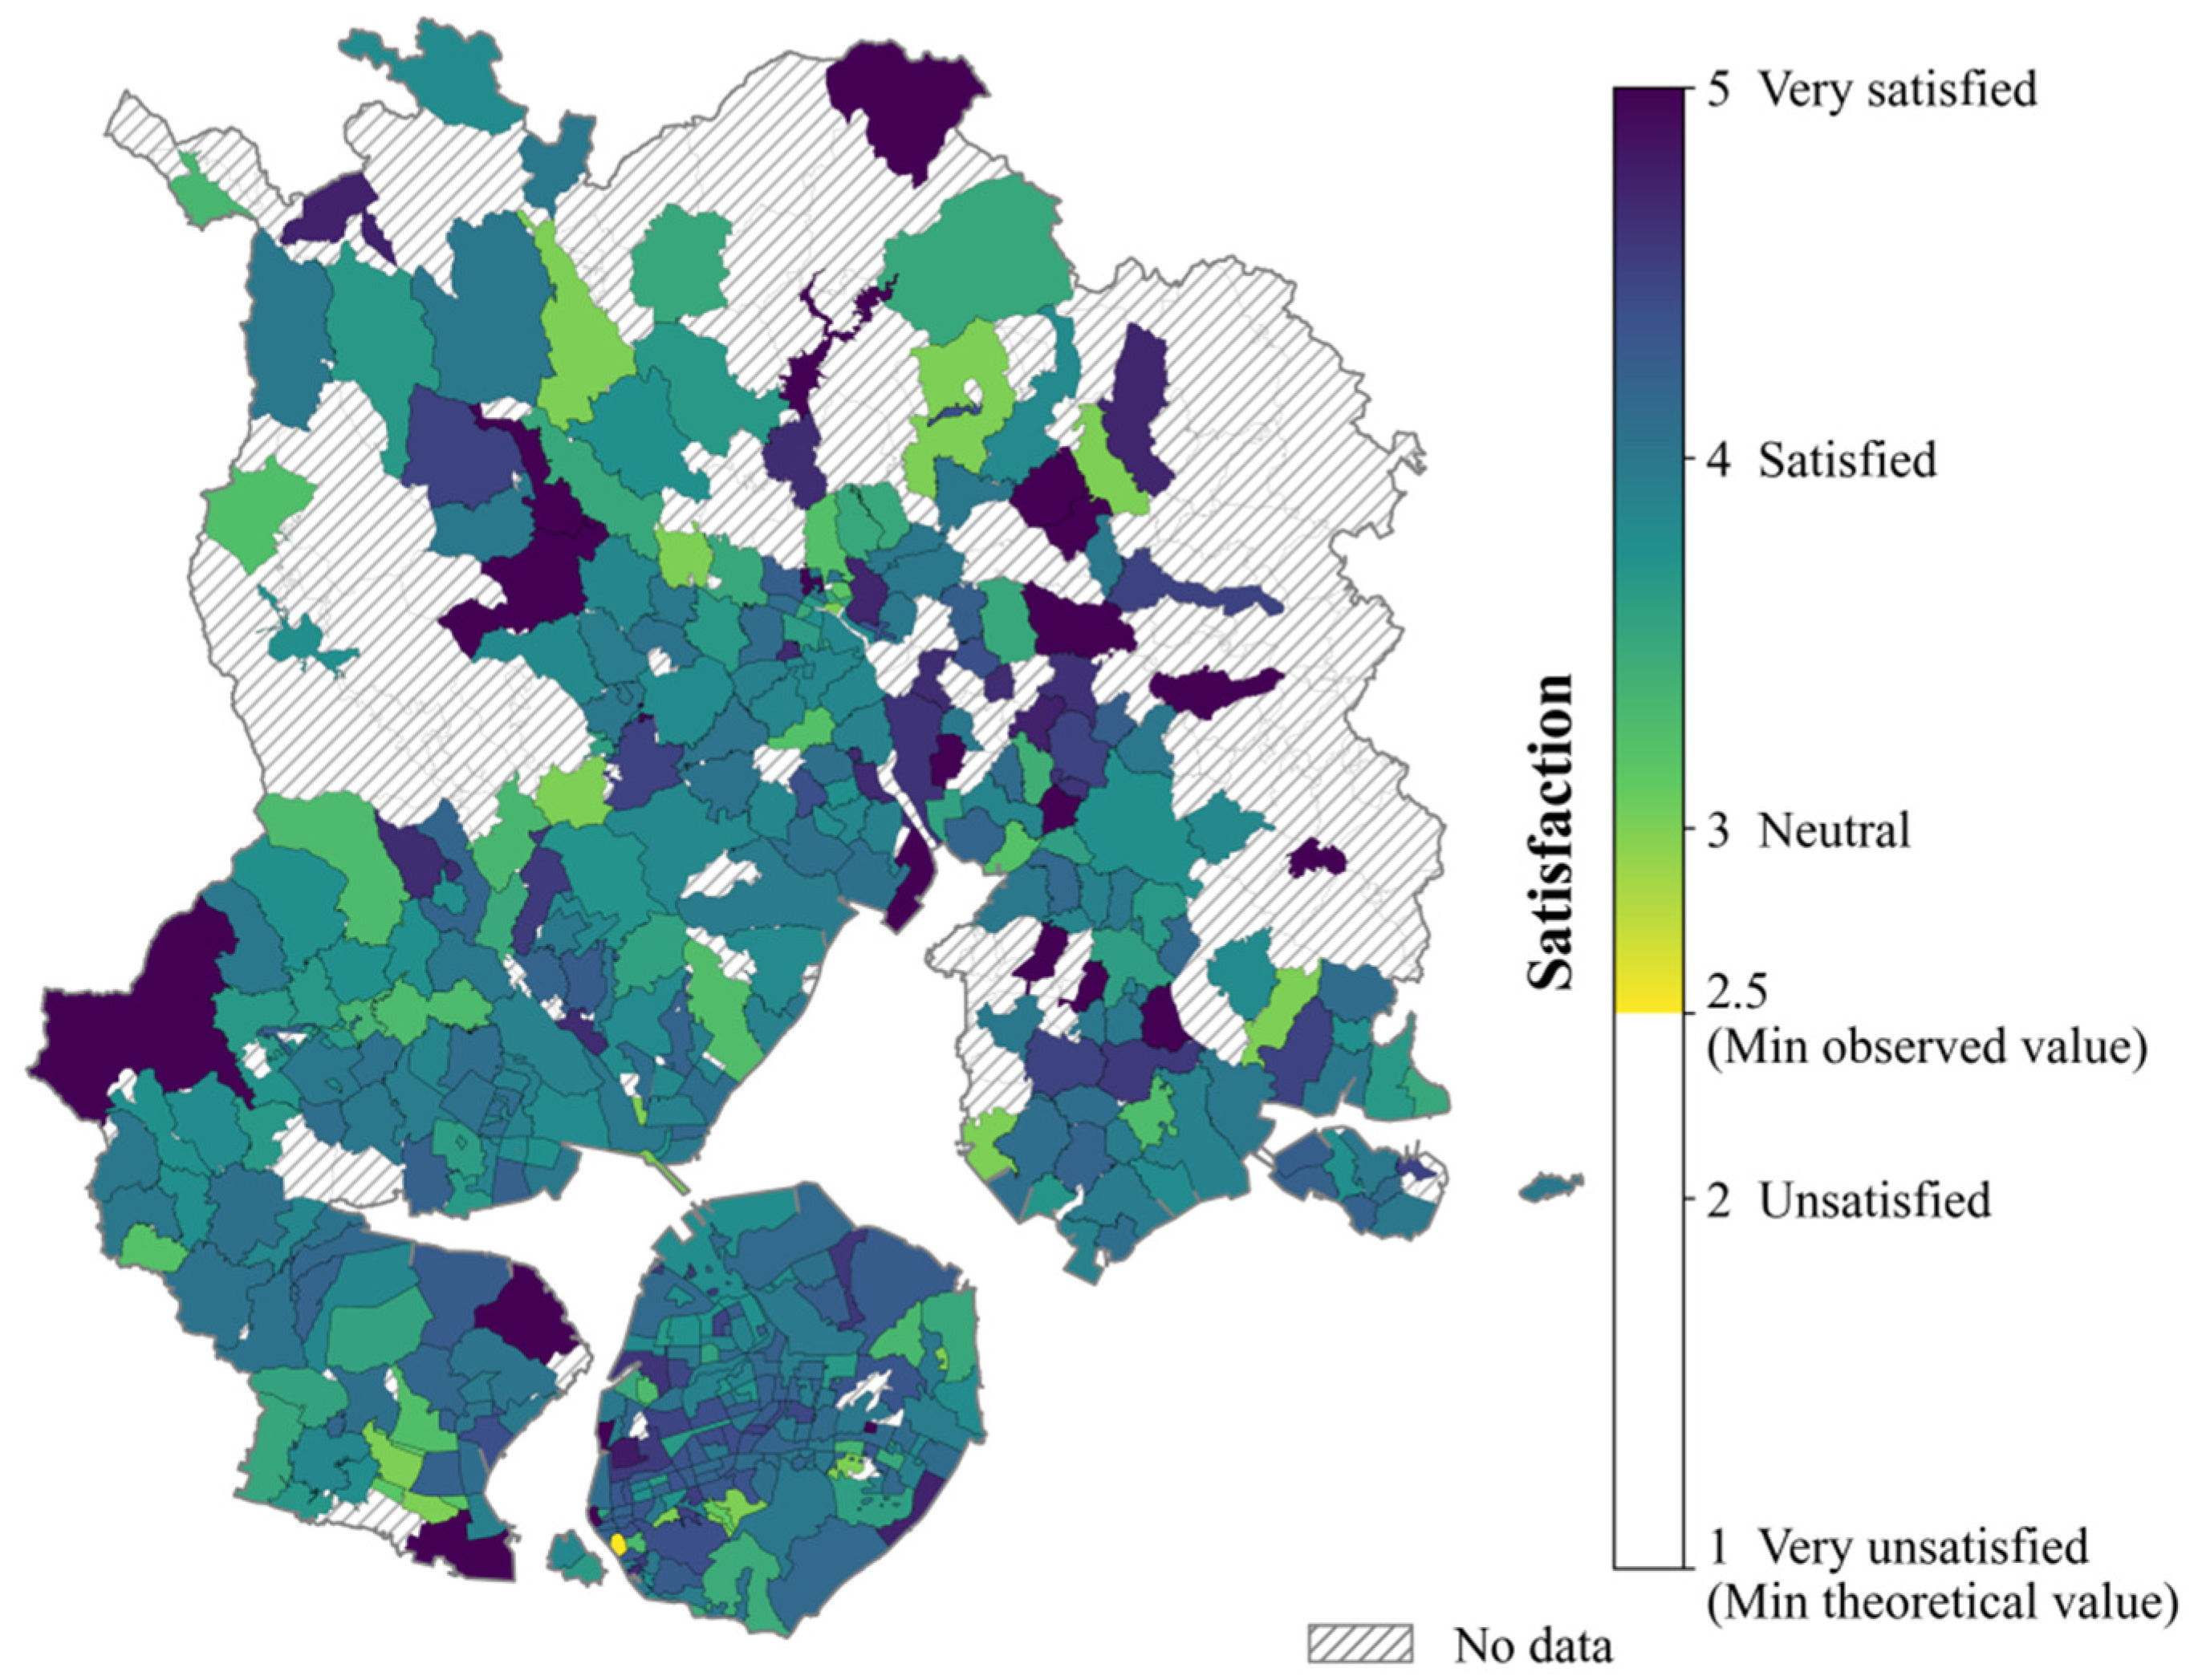
As shown in Figure 3, the spatial distribution of human settlement satisfaction (HSS) exhibits a certain degree of dispersion but also presents a clear spatial gradient—from the inner-island core areas to the outer-island new districts and peripheral suburbs, satisfaction gradually declines. The built-up inner-island areas generally show higher satisfaction levels, reflecting the maturity of their residential environments, the completeness of public service systems, and the balanced nature of urban management. In contrast, outer-island and peripheral areas display significant inter-community variation and stronger spatial differentiation, suggesting uneven development levels, infrastructural gaps, and disparities in community governance. In addition, coastal zones and central urban areas exhibit consistently higher satisfaction, which not only relates to the advantages of scenic landscapes and high densities of open spaces but also reflects the composite livability benefits derived from the built environment and the clustering of lifestyle services.

3.2. The Relationship Between HSS and Influencing Factors

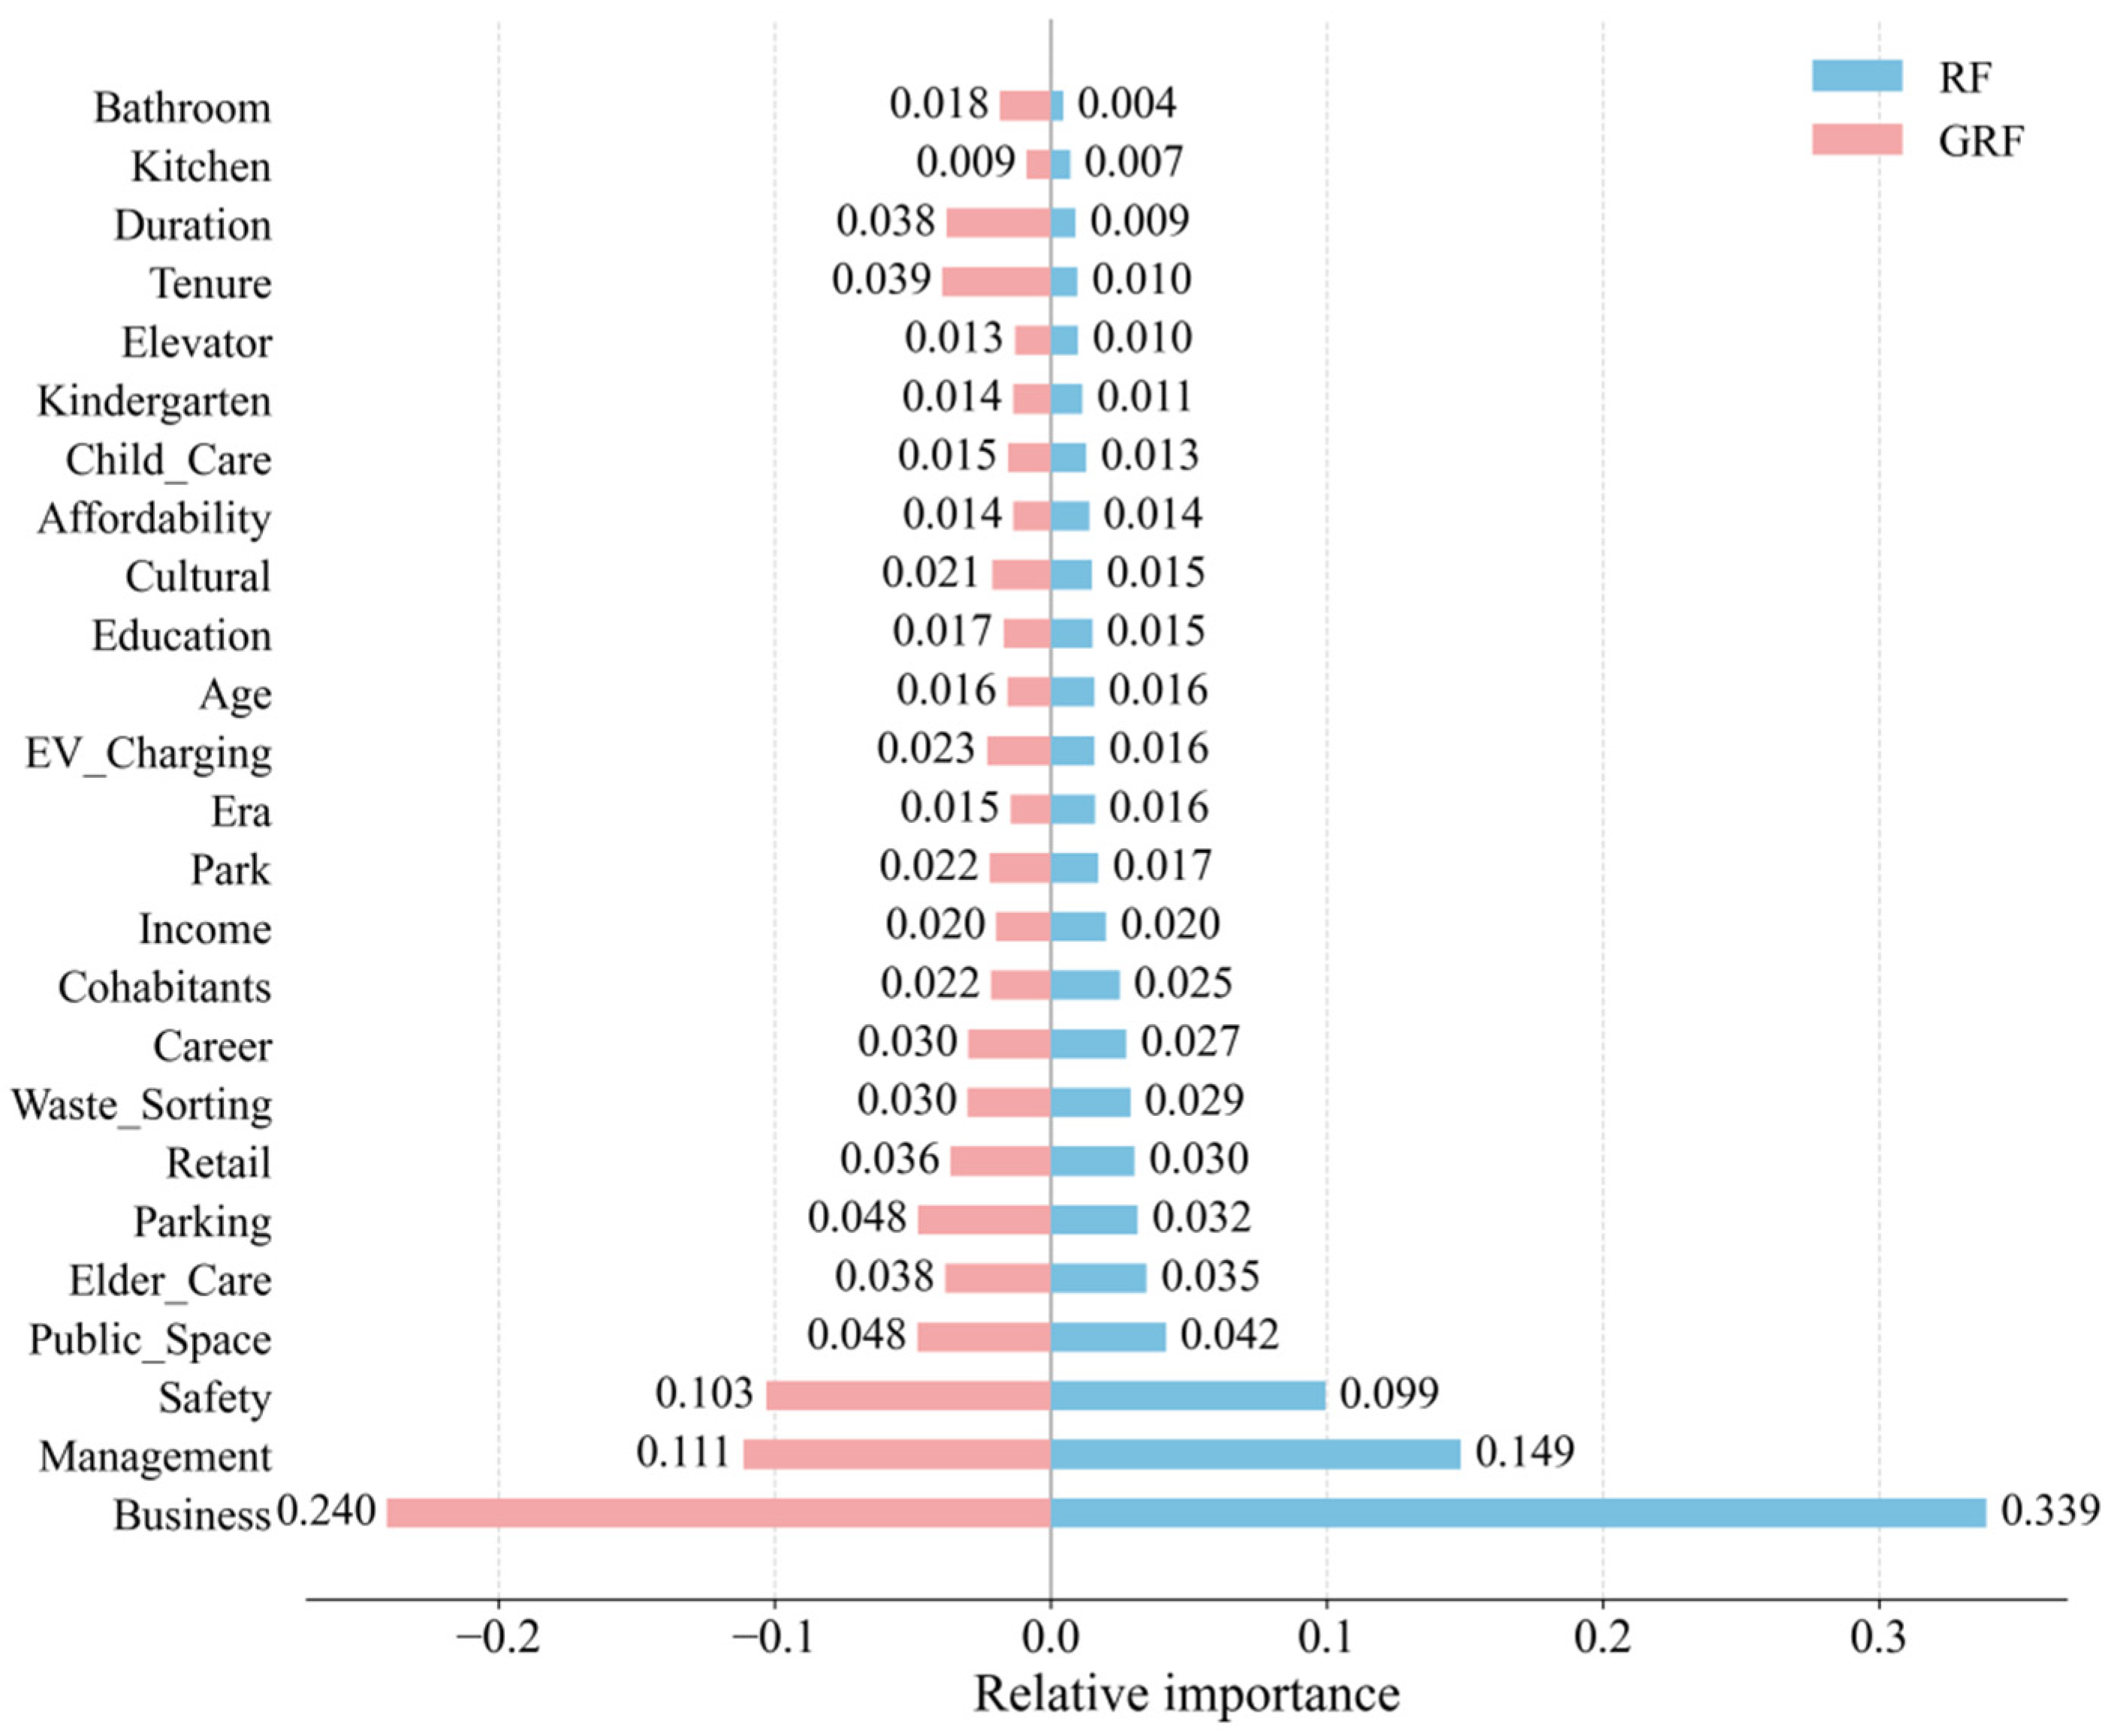
Overall (see Figure 4), block-scale business vitality (Business, 33.9%, share of global importance, similarly hereinafter) appears to be the factor most strongly associated with HSS, followed by community-level management (Management, 14.9%) and housing safety (Safety, 9.9%). Although the proportions of local average importance differ slightly, these three categories remain the most prominent factors across the city.
At the scale level, the cumulative shares of global importance for block-, community-, housing-, and individual-scale variables are 40.3%, 32.4%, 16.1%, and 11.2%, respectively, while their corresponding local average shares are 33.2%, 31.6%, 21.0%, and 14.2%. The block scale has the largest share, suggesting that built-environment features and daily convenience may play a relatively stronger role in variations of HSS. The community scale ranks second, suggesting that governance effectiveness and service provision may also be relevant. Although housing and personal characteristics contribute less in aggregate, they remain statistically meaningful; notably, their local importance is markedly higher than their global importance, indicating substantial spatial heterogeneity in factor effects. In other words, the strength of influence varies considerably across regions. This pattern suggests the limitations of traditional homogeneous governance and macro-level assessment approaches, which may not fully reflect the complex spatial mechanisms underlying HSS. These observations motivate a multi-scale, dynamically responsive governance framework that may enhance data-driven diagnostic capacity and support differentiated Urban Physical Examination models and spatial governance strategies for highly heterogeneous areas.
At the block scale, the global importance of business vitality (33.9%) far exceeds that of cultural facilities (Cultural, 1.5%), parks and green spaces (Park, 1.7%), and parking facilities (Parking, 3.2%). Although its local average importance decreases slightly, business vitality remains the most prominent factor overall. This pattern indicates a stronger association of residents’ HSS with everyday consumption and lifestyle convenience rather than merely by the availability of recreational, cultural, or supporting facilities. Business vitality may capture aspects of local economic vibrancy, pedestrian activity, and service accessibility, making it a perceptible indicator of urban quality of life. In contrast, cultural and green-space facilities play a positive but relatively limited role, partly due to their more balanced spatial distribution or lower usage frequency. This pattern implies that enhancing daily convenience and business atmosphere could be a potential avenue for supporting higher HSS at the block level.
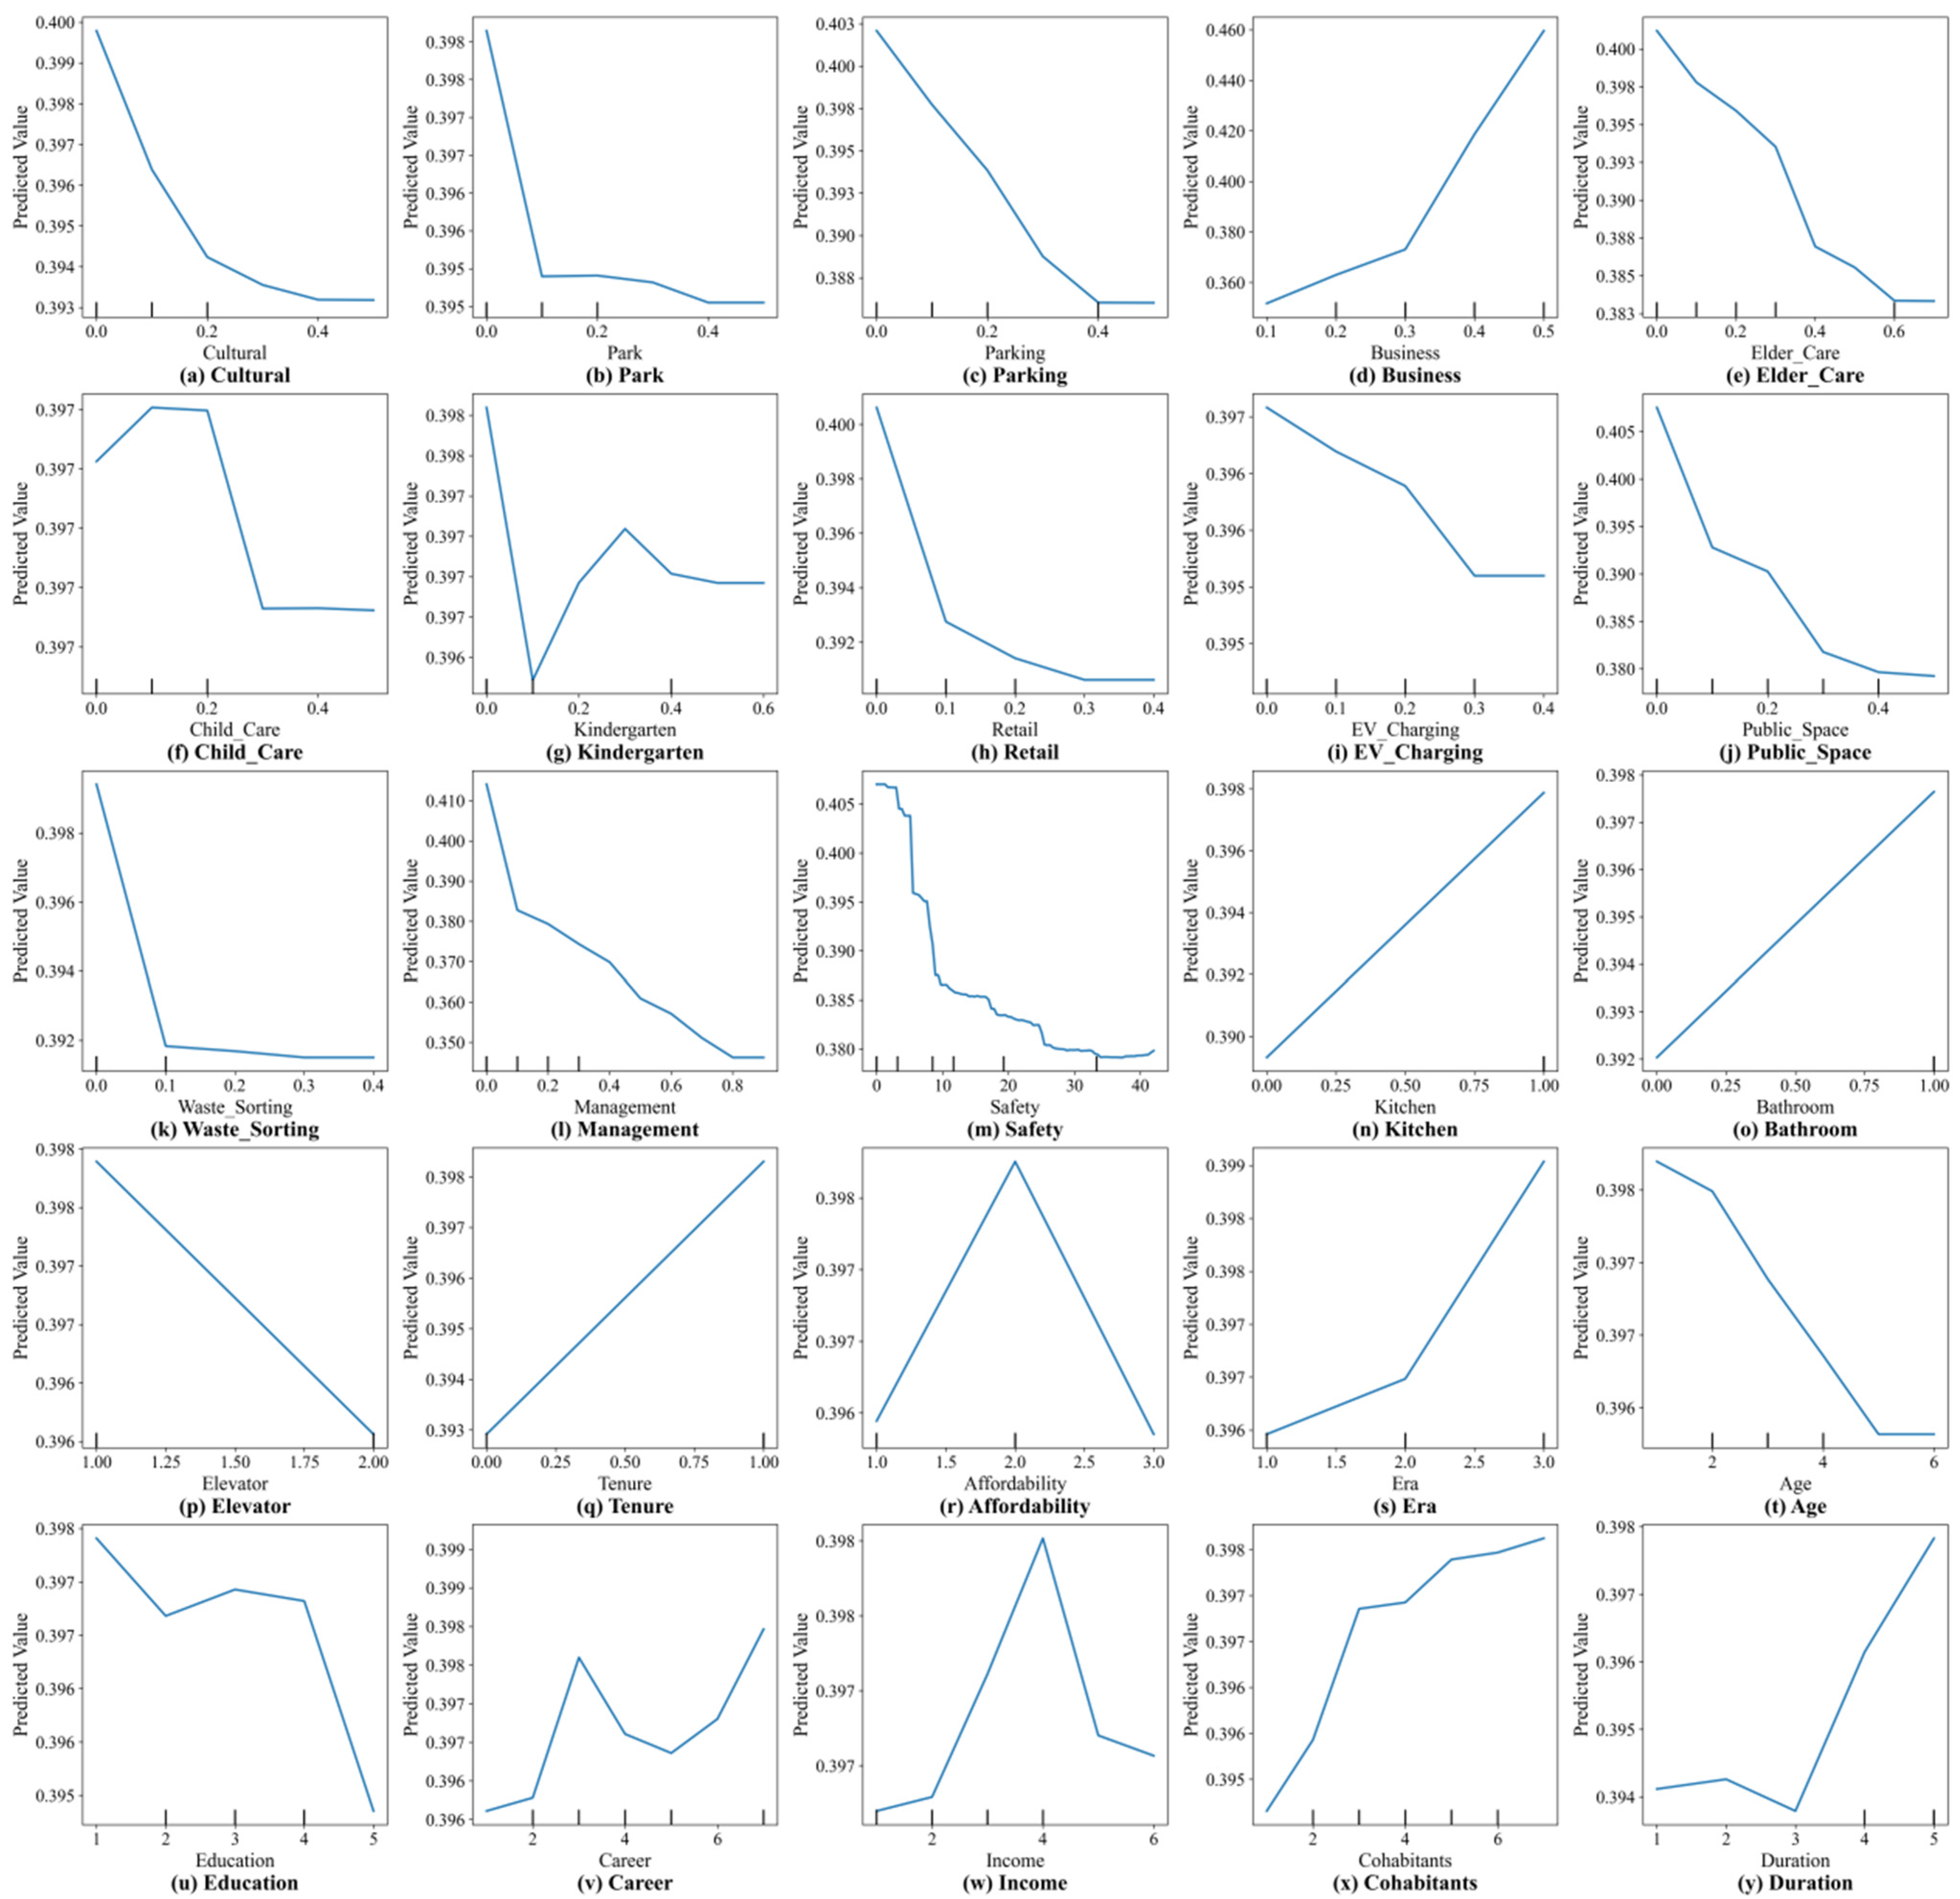
Further examining the marginal effects (Figure 5d), higher business vitality tends to correspond with higher reported satisfaction, and the association may be stronger in high-vitality areas—potentially reflecting an agglomeration pattern. Spatially, this pattern varies across blocks: in low-vitality blocks, even well-equipped facilities appear to have a more modest association with satisfaction, underscoring the threshold effect of business vitality. From a policy perspective, efforts could consider stimulating local economic vitality, optimizing the spatial layout of small and micro businesses, and enhancing the diversity and accessibility of daily services to potentially improve perceived convenience and satisfaction. Future Urban Physical Examination research may explore how residents perceive business vitality and its interactions with urban spatial structures and service systems. Such understanding could inform more nuanced interpretations of Urban Physical Examination results in diagnosing urban problems, guiding spatial governance, and evaluating livability outcomes.
Community management and housing safety rank as the second and third most important global factors. Figure 5l,m suggests a tendency for resident satisfaction to decline as related issues increase, with diminishing marginal patterns in some areas. This may reflect that prominent issues have a relatively stronger association with lower satisfaction in sensitive areas. Issues such as cluttered stairwells or safety hazards appear linked to residents’ sense of security and well-being. Governance, therefore, could consider prioritizing residents’ most sensitive pain points, establishing rapid response mechanisms, and strengthening collaboration between community self-governance and property management through targeted interventions such as “micro-updates” and “micro-maintenance” to improve HSS. Other community-related variables, including community retail (Retail, 3.0%), waste sorting (Waste_Sorting, 2.9%), and block parks (Park, 1.7%), also exhibit similar associations (Figure 5b,h,k).
Among the remaining block-scale variables, cultural facilities (Cultural, 1.5%) and parking facilities (Parking, 3.2%) have global importance values between 1% and 5%, showing generally negative associations with HSS. Notably, parking, second only to business vitality, in block-scale, appears relevant to daily mobility and convenience, and its local importance (4.8%) is approximately 50% higher than the global value, indicating significant spatial heterogeneity in its effects.
Among the remaining community-scale variables, public spaces (Public_Space, 4.2%), EV charging facilities (EV_Charging, 1.6%), and community care issues—including elder care (Elder_Care, 3.5%), child care (Child_Care, 1.3%), and kindergarten services (Kindergarten, 1.1%)—all have global importance values between 1% and 5%, with generally negative marginal effects. Public spaces, second only to community management, in community-scale, appear important for fostering social interaction, leisure, and community activities. Among community care dimensions, elder care stands out with a considerably larger importance than child care or kindergarten services—likely reflecting stronger demand for elderly services under ongoing population aging.
The relatively lower global importance of these traditionally valued livability factors (e.g., parks, cultural facilities, childcare) does not imply they are unimportant for quality of life. Rather, it suggests that in the context of Xiamen, these foundational needs may be adequately met for a majority of the population, resulting in less variation in satisfaction explained by these factors compared to more salient issues like business vitality and community management.
Among the remaining housing-scale variables, construction era (Era), housing affordability (Affordability), and housing tenure (Tenure) have global importance values of 1.6%, 1.4%, and 1.0%, ranking 13th, 18th, and 22nd, respectively. The local average importance of housing era and affordability remains roughly consistent with their global values, whereas the local importance of tenure increases to 3.9%, suggesting considerable spatial variation and potential local sensitivity. Its spatial distribution could be explored further in future studies. Regarding marginal effects, homeownership and newly constructed housing tend to correspond with higher reported HSS. In contrast, housing affordability shows a nonlinear pattern: households with very low or high burdens report relatively lower HSS compared to medium-burden households. This may be because high-burden households face greater financial stress, reducing well-being, whereas low-burden households primarily reside in unit-provided housing, dormitories, or self-built homes with relatively limited facilities and convenience, which negatively affects overall satisfaction.
Examining internal housing facilities, the global importance of having a bathroom, kitchen, and elevator is relatively low, ranking at the bottom—1st, 2nd, and 5th from the end—and all below 1.0%. However, their local importance rises, particularly for bathroom provision, which increases from 0.4% to 1.8%, a 4.5-fold increase, suggesting notable local variation. In terms of marginal effects, housing with an independent kitchen and bathroom tends to be associated with higher satisfaction, whereas elevator provision appears linked to lower satisfaction in some contexts, possibly due to management or social coordination issues.
For personal characteristics, the global importance of career prestige (Career), number of cohabitants (Cohabitants), household annual income (Income), age (Age), educational attainment (Education), and residential duration (Duration) are 2.7%, 2.5%, 2.0%, 1.6%, 1.5%, and 0.9%, respectively. The local average importance of the first five factors is generally similar to their global importance, suggesting relatively consistent associations across space. In contrast, the local importance of residential duration increases to 3.8%, indicating spatial differences in its association with HSS. This pattern may reflect differences between new and long-term residents and variations in residential experiences.
Examining marginal effects of personal characteristics, age, and education tend to be associated with lower reported satisfaction, possibly reflecting higher expectations or demand for environmental improvements among older or more educated residents. Career prestige has a nonlinear pattern on HSS, with medium-prestige groups showing an initial increase, followed by a decrease and subsequent rise in marginal effects, suggesting complex social needs. Household income shows an inverted-U-like pattern, with middle-income households reporting relatively higher satisfaction. Cohabitant number and residential duration generally tend to be positively associated with satisfaction, potentially reflecting social support and place attachment in larger or long-term households.

3.3. Spatial Heterogeneity of Factors Influencing HSS

3.3.1. Spatial Variation in the Model’s Goodness-of-Fit

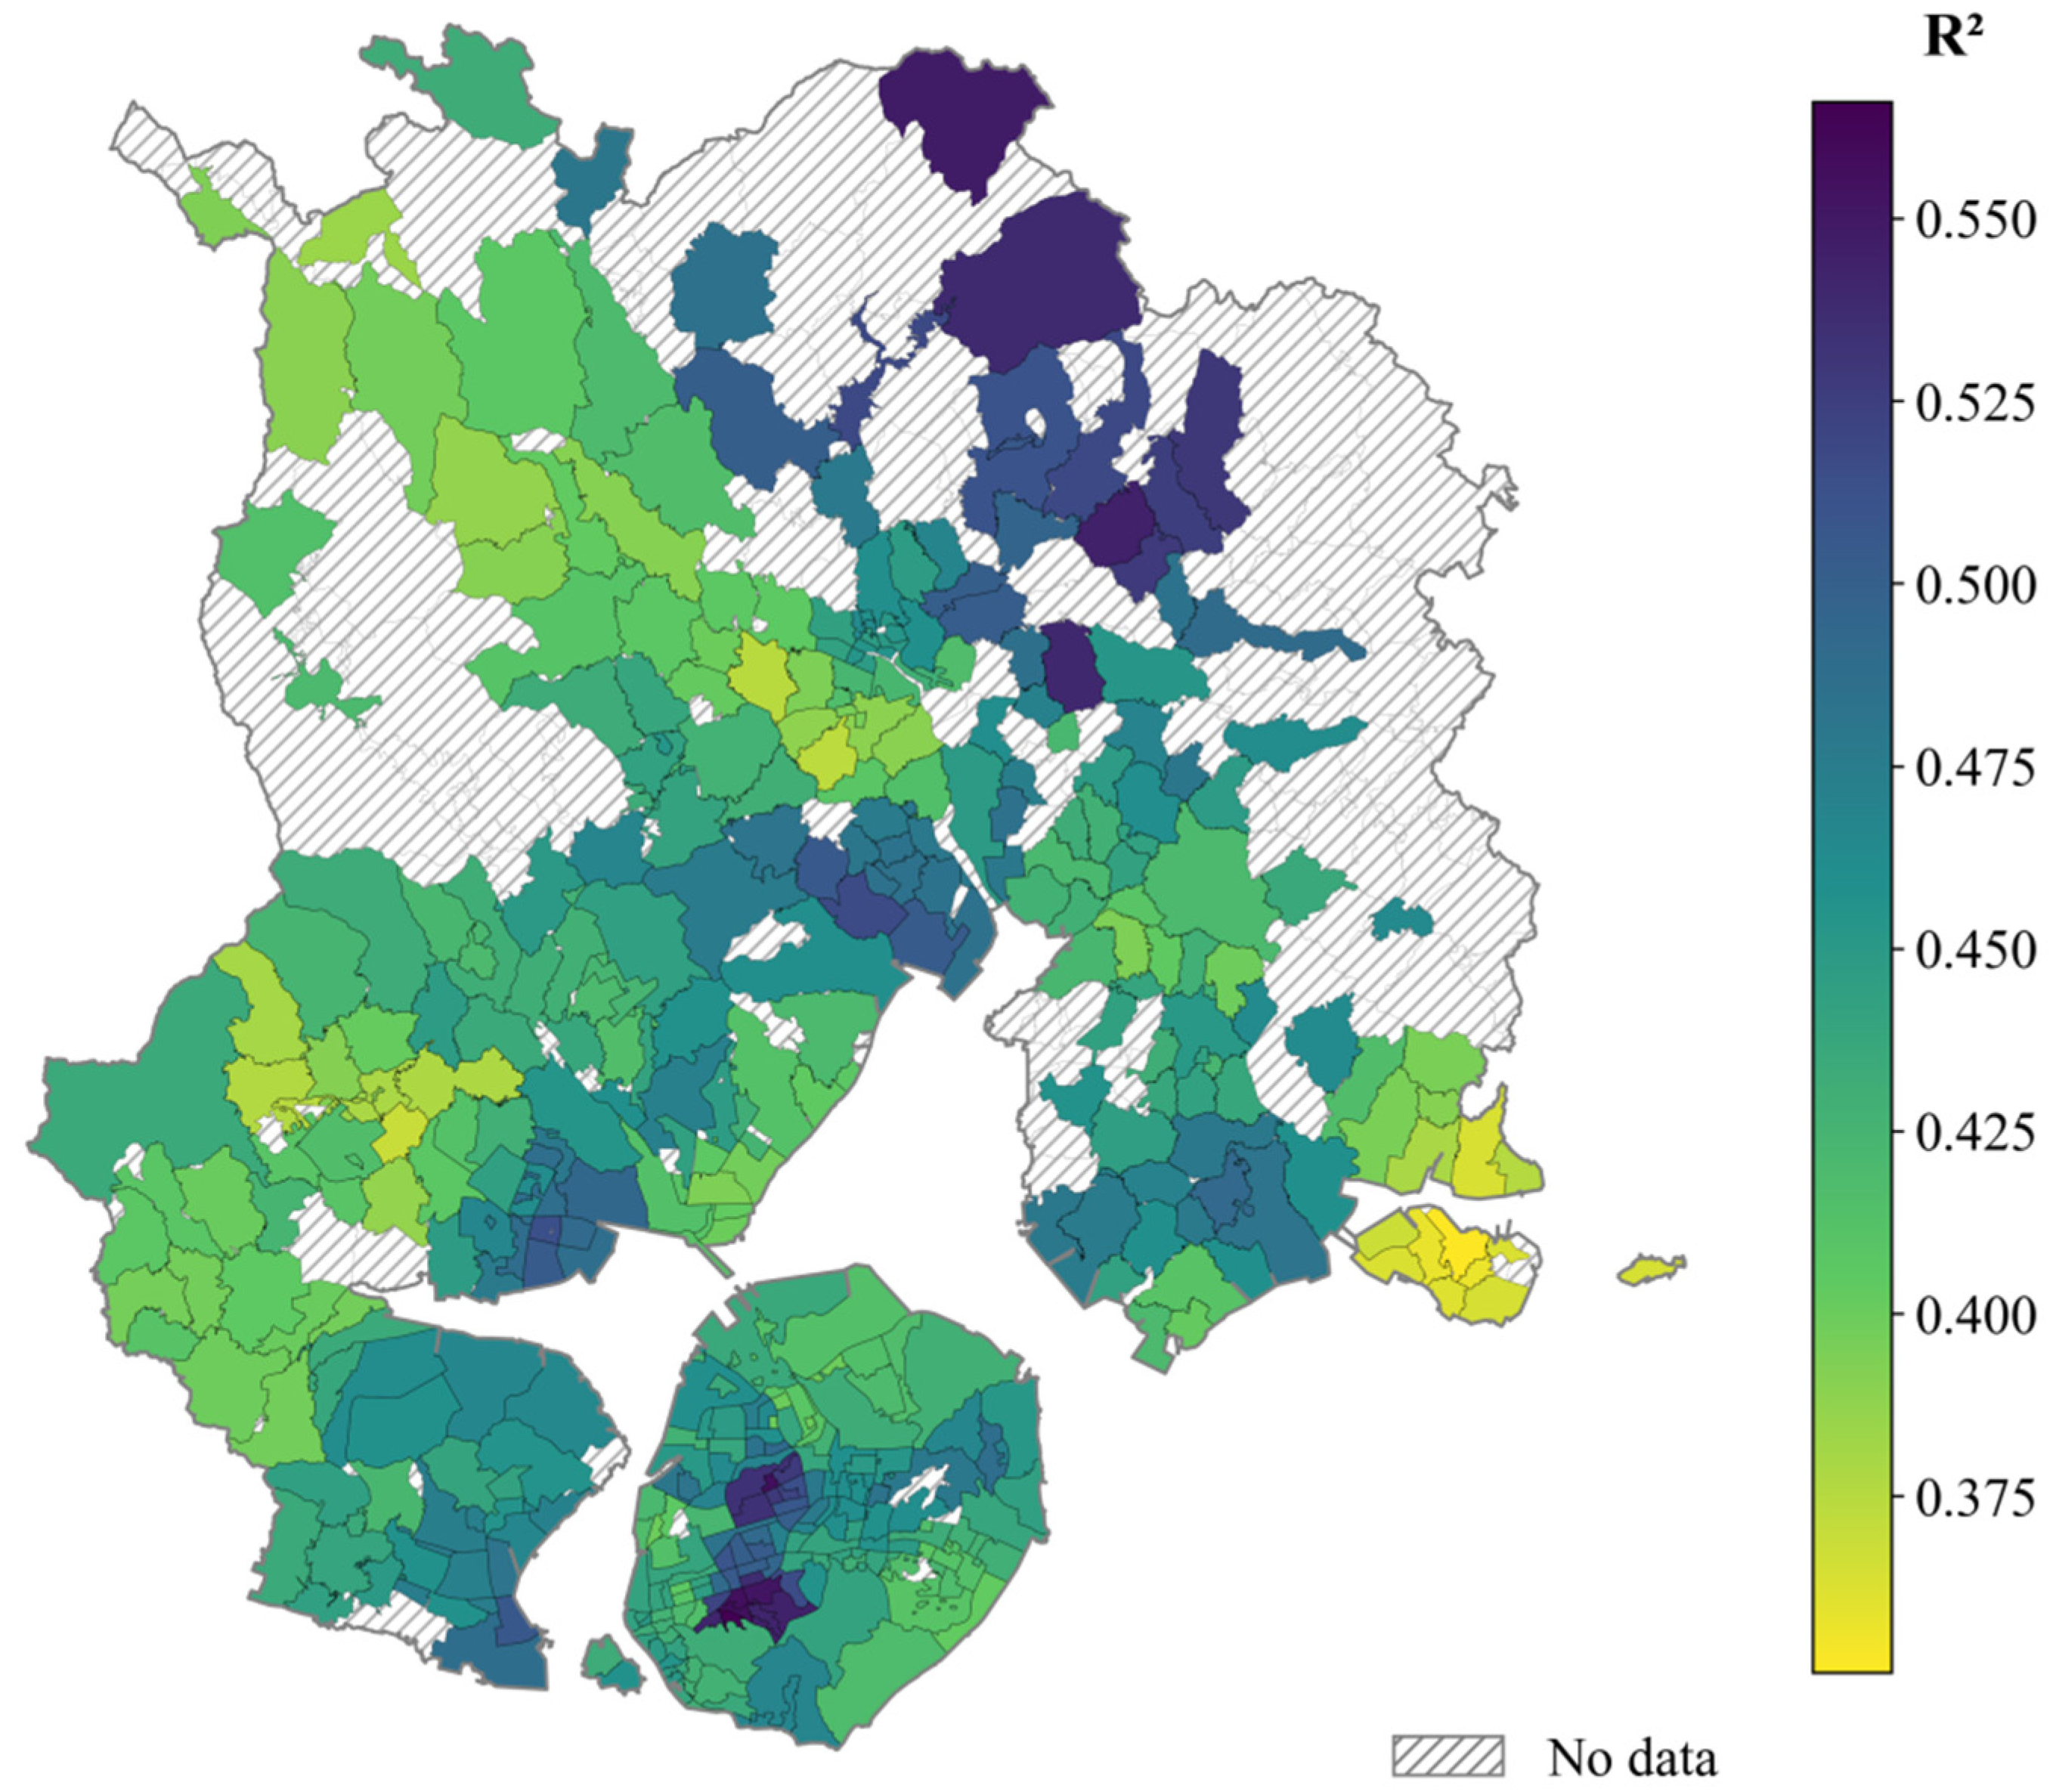
Based on the local R2 distribution from the Geographically Random Forest (GRF) model (Figure 6), the model’s goodness-of-fit for HSS in Xiamen exhibits pronounced spatial heterogeneity and regional clustering. Overall, local R2 values across the city mostly range between 0.42 and 0.52, indicating good overall model performance, yet clear differences in explanatory power are observed across districts. High-value clusters are concentrated in the core areas of Siming and Huli districts on Xiamen Island, as well as in parts of Jimei and northeastern Tong’an districts off the island, suggesting strong model explanatory power in these areas. These regions typically feature a mature built environment, well-established public services, and stable population structures, allowing the model to effectively capture the stable relationship between residents’ perceptions and HSS, which indirectly validates the applicability of the current Urban Physical Examination indicator system.
In contrast, R2 values are generally lower in newly developed or peripheral districts such as Xiang’an and Haicang, indicating weaker model fit. This may be attributed to insufficient sample coverage and potential spatial sampling bias, as well as high internal heterogeneity and the difficulty of capturing soft perceptual factors—such as public service accessibility and community cohesion—using existing indicators. In the future, Urban Physical Examination efforts could prioritize these districts by strengthening on-site survey collection in underrepresented areas, enhancing measurements of public service provision and social capital, and integrating multi-source dynamic perception data, thereby improving model explanatory power and policy relevance in heterogeneous regions.
In summary, the spatial pattern of local R2 clearly demonstrates that the explanatory power of the GRF model is closely linked to the degree of urbanization, environmental maturity, and governance effectiveness in each area, revealing the spatially non-stationary mechanisms underlying human settlement satisfaction in Xiamen.

3.3.2. Spatial Distribution of the Dominant Factors

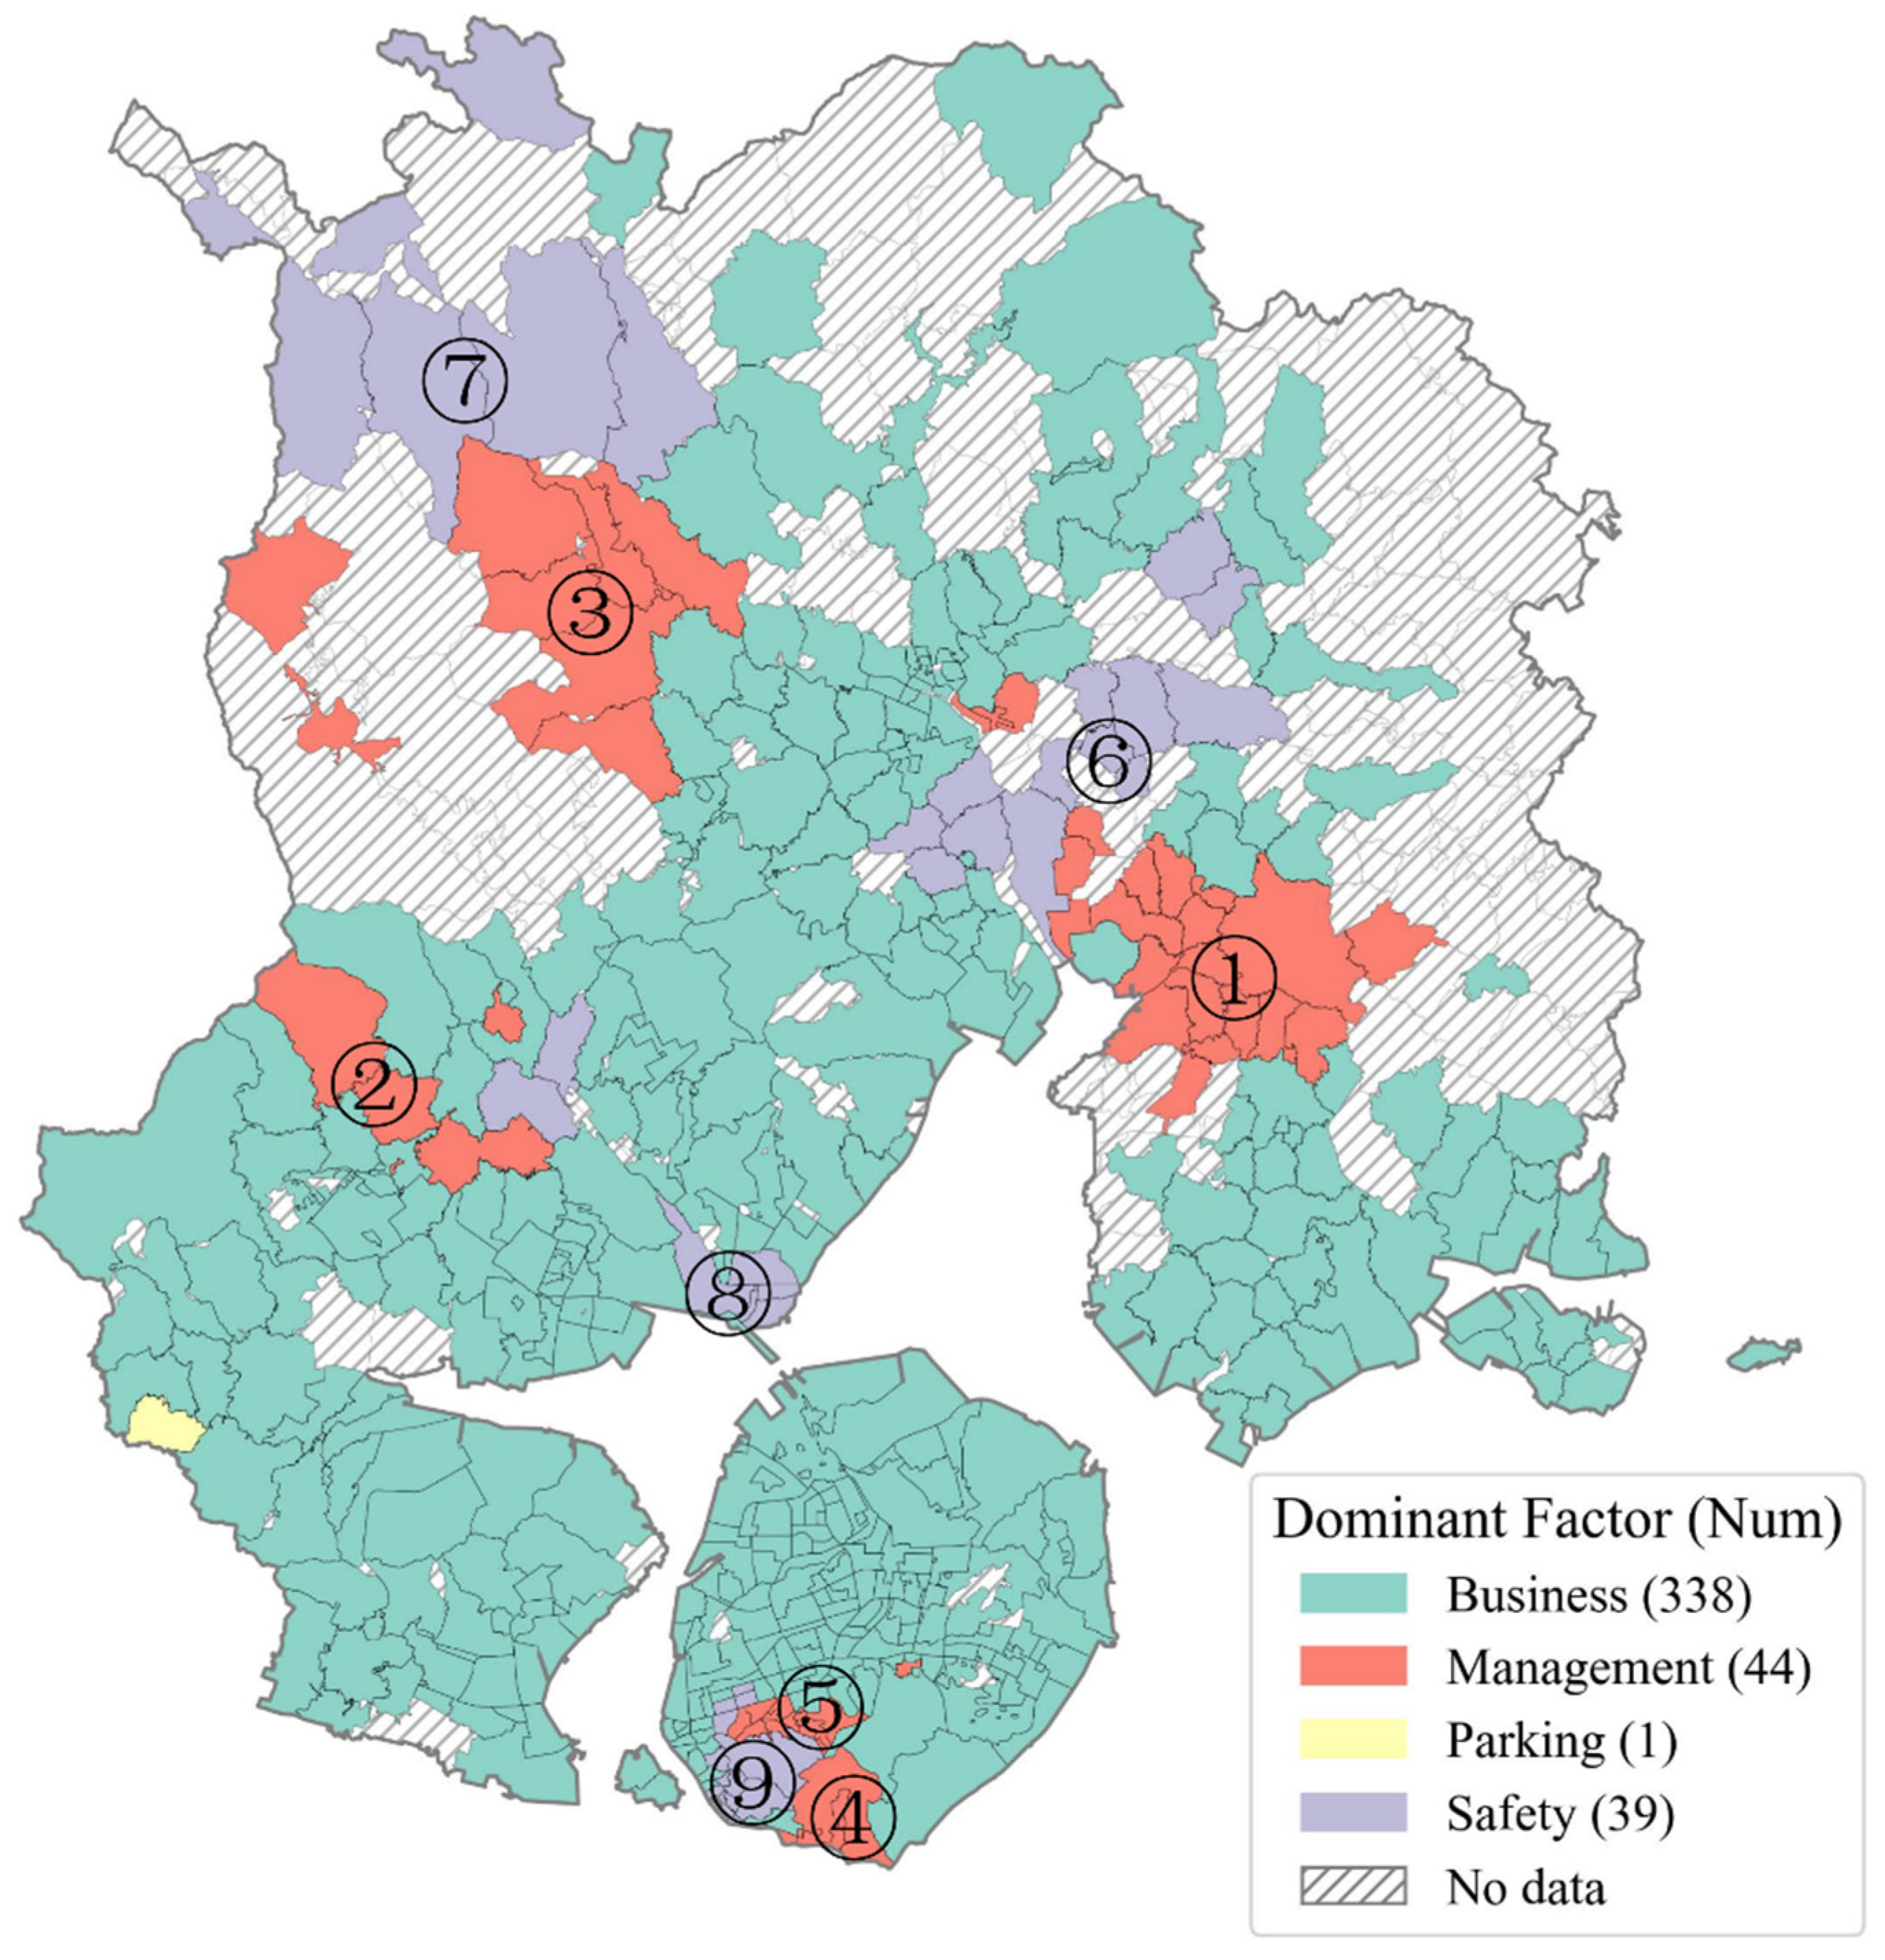
Figure 7 presents the factor with the highest local relative importance in individual communities. Among the dominant influencing factors, 80.1% of communities are primarily driven by block-level business vitality (Business), consistent with the trend in global importance. This indicates that business vitality, as a key determinant of residents’ human settlement satisfaction (HSS), has a widespread and stable influence across the city.
Community management issues (Management) emerge as the dominant factor in approximately 10.4% of communities, exhibiting clear spatial patterns. In the outer-island districts, they are mainly concentrated in Hongtang Town of Tong’an District (①, see Figure 7), Maxiang Town of Xiang’an District (①), Guankou Town of Jimei District (②), and the southern part of Lianhua Town in Tong’an District (③). These areas are typically at the urban expansion frontier, characterized by dense industrial parks, active construction sites, or high traffic pressure at key nodes, leading to frequent population mobility and heavier community governance burdens. Within the island, they are mainly located in the Shangli and Zengcuoan communities of Binhai Subdistrict in Siming District (④), as well as older residential areas on the northern foothills of Wanshi Mountain (⑤). The former represents a typical urban village with a high proportion of migrant residents and complex rental relationships, while the latter suffers from aging infrastructure and weak property management due to its older construction age. The community management difficulties in these areas reflect the tension between governance capacity and spatial transformation amid rapid urban development. Urban Physical Examination efforts should prioritize such communities, dynamically adjusting management strategies according to residents’ actual needs to improve service responsiveness and grassroots coordination efficiency.
Safety issues in housing (Safety) are the dominant factor in 9.2% of communities, mainly occurring in two types of areas. The first type is concentrated in the eastern part of the central area of Tong’an District (⑥) and village communities in central Lianhua Town (⑦), which are often peri-urban or remote rural areas with mixed spatial planning and a lack of systematic property management. Residents’ perceptions of safety risks directly affect satisfaction, giving these issues strong explanatory power in the model. The second type is found near tourist attractions, such as the Jimei Academic Village (⑧), areas around Xiamen University (⑨), the Botanical Garden (⑨), and Shapowei (⑨). These areas have high population density, a high proportion of short-term rentals, and frequent turnover of community members. Ambiguity in the use of corridors and public spaces increases management and coordination costs, highlighting weak points in fine-grained urban governance. In areas with diverse populations and high functional mixing, the dual pressures of safety and management are especially pronounced.
Parking issues (Parking) are the dominant factor in only one community in the northwest of Haicang District. This community is surrounded by industrial parks, railway facilities, and highways, with a closed residential layout, limited accessibility, and severely inadequate parking facilities. Long-term parking shortages combined with restricted mobility directly affect residents’ daily travel experience and life convenience, making it a key local determinant of satisfaction.

3.3.3. Spatial Variation in Local Feature Importance

(1)
Block Scale
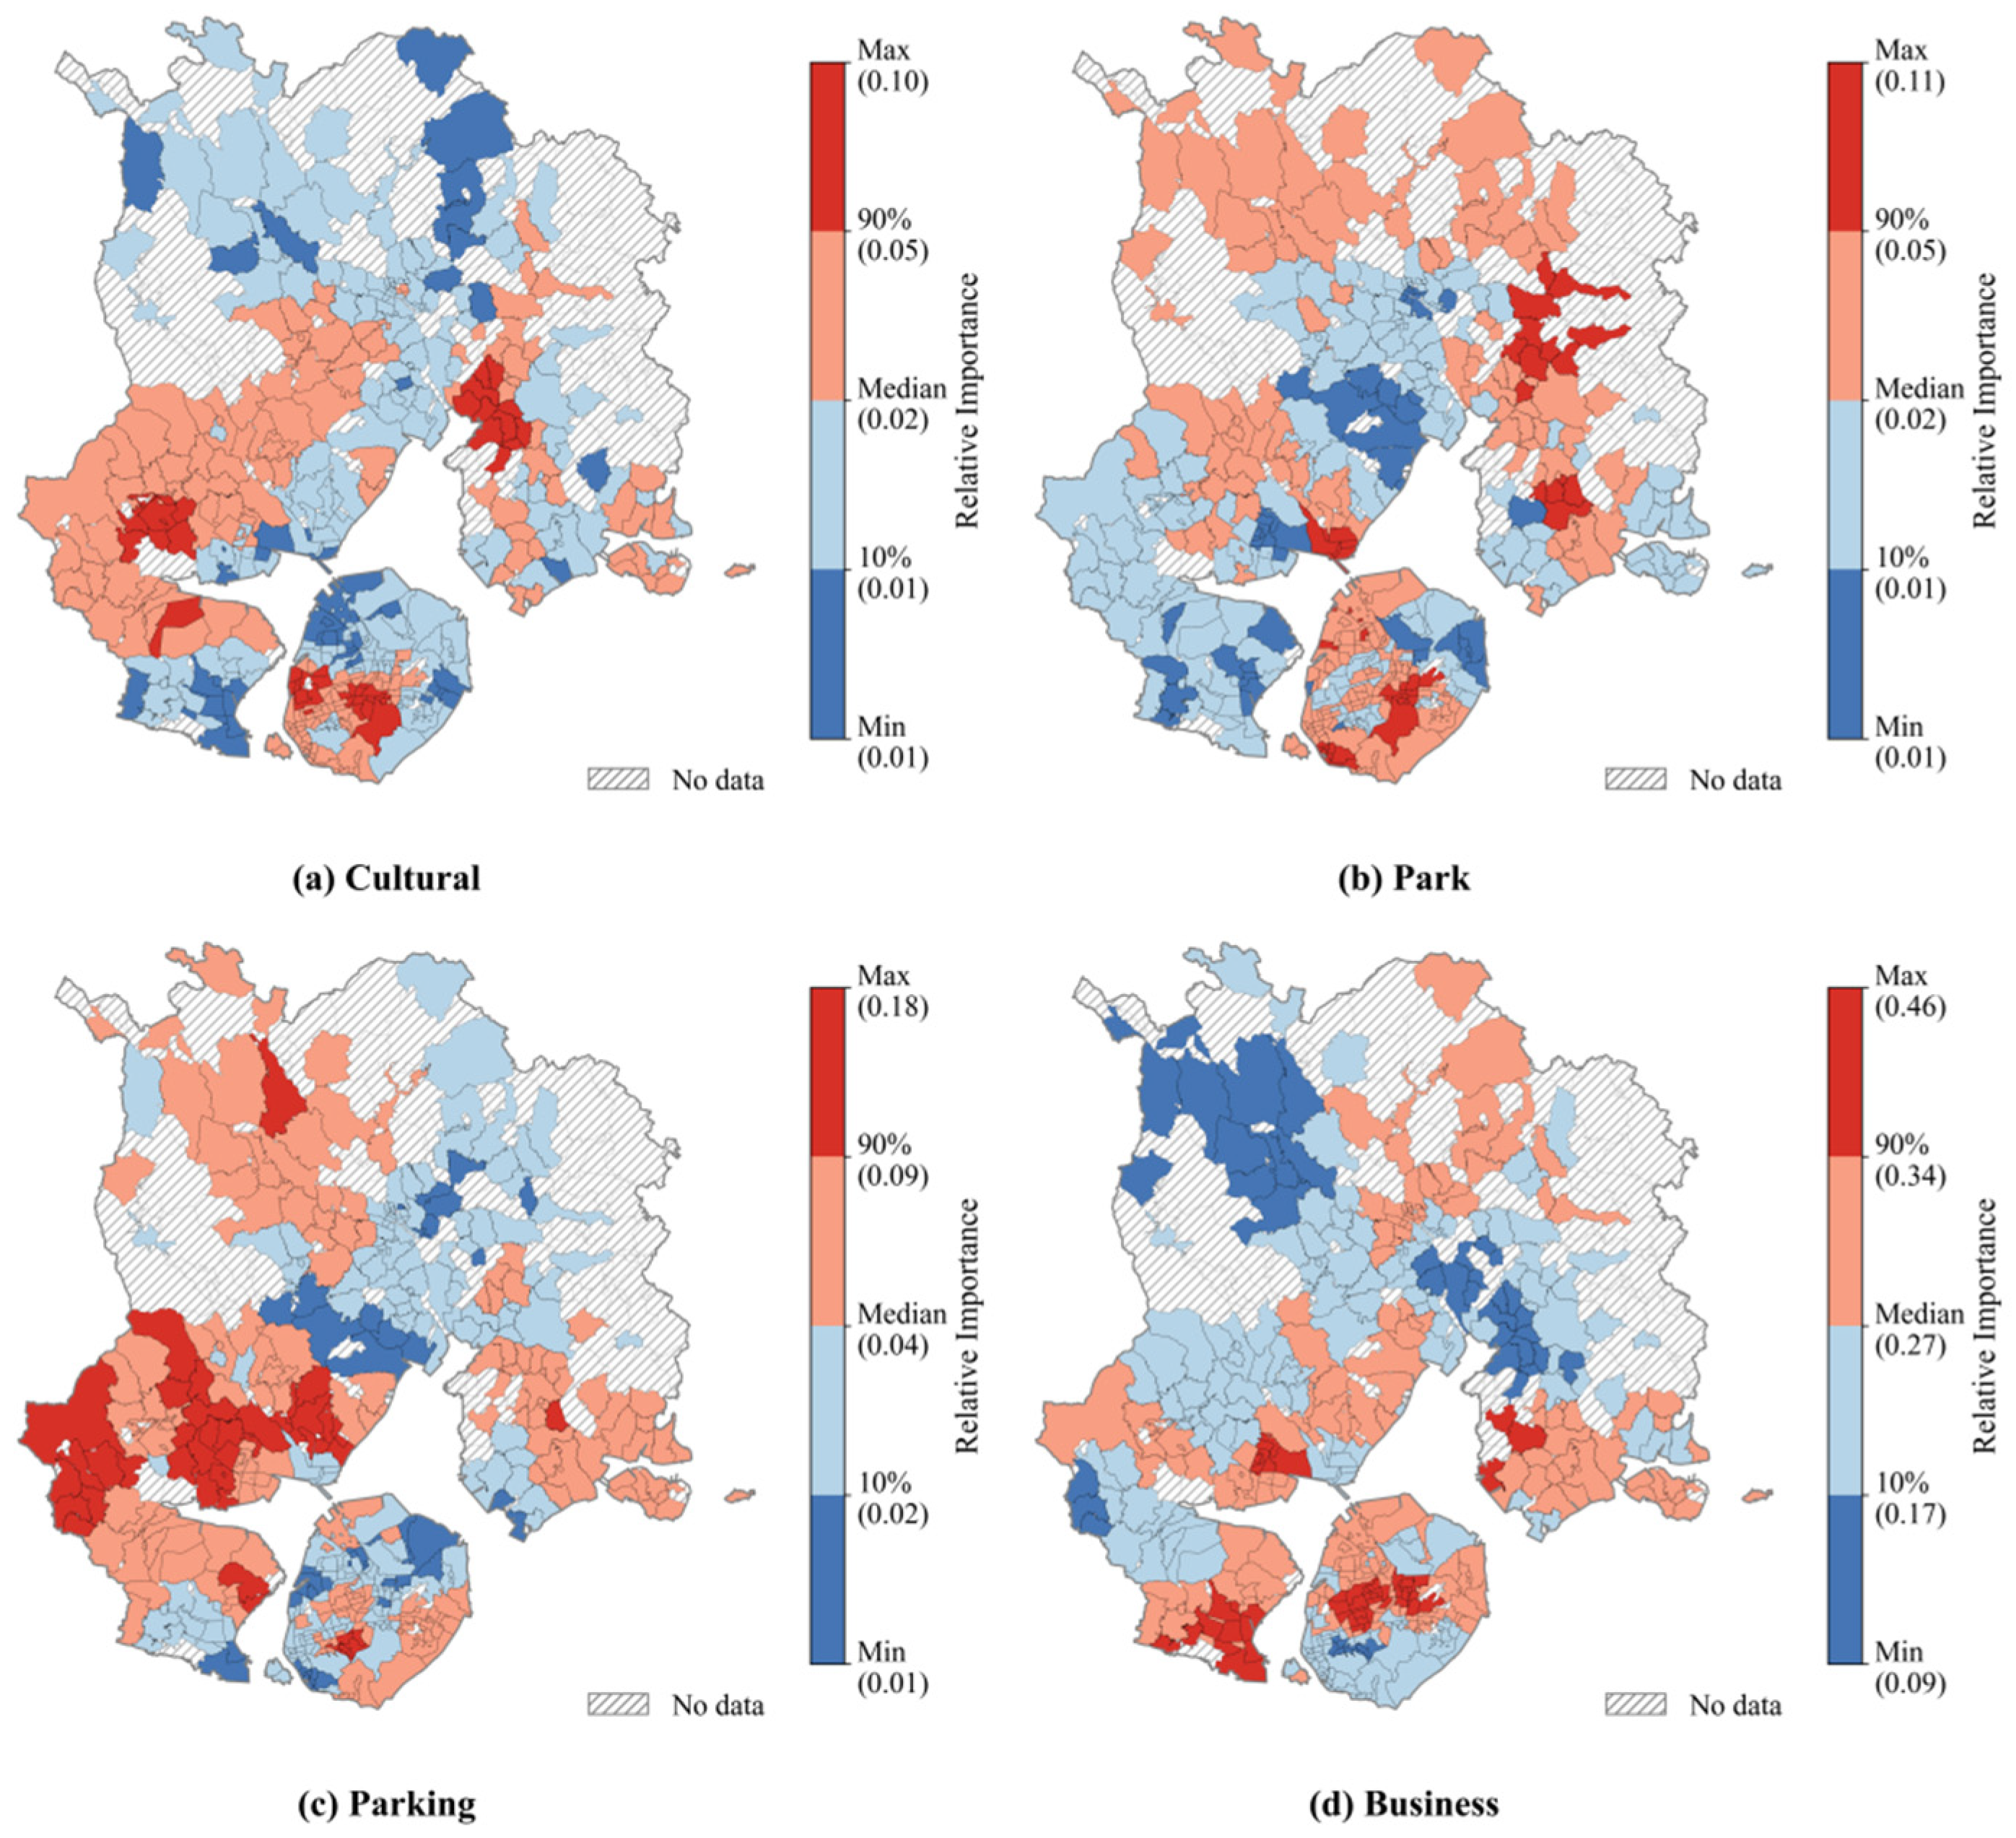
From the spatial distribution of local importance at the block scale, different types of facilities exhibit distinct patterns between the inner- and outer-island districts. High-value areas for cultural facilities (top 10% in local importance, see Figure 8a) are primarily located in outer-island industrial zones and their surrounding areas, while on the island, they are concentrated in the older districts of central and western Siming District. This indicates that residents living in or near industrial zones and older districts are more sensitive to the accessibility and experience of cultural facilities, reflecting regional shortcomings in life-support infrastructure and venue management. Low-value areas (bottom 10%) are concentrated in Haicang New Town, northern Huli District, and rural areas of Tong’an District, suggesting that residents in these areas are less sensitive to cultural facility issues, or that their demand for cultural services is overshadowed by other daily life concerns.
High-value areas for park facilities (see Figure 8b) are concentrated in the central island’s mountainous park belt, as well as around Jimei Academic Village and the central park in Xiang’an District. These areas serve as key spaces for residents’ daily recreation and social interaction, and residents are highly sensitive to park accessibility and environmental quality. High-value areas in northern Xiang’an District exhibit a “compensatory sensitivity” pattern: being distant from the urban core and dominated by industrial and urban-village land, insufficient public green space makes residents’ perceived access to parks strongly affect overall satisfaction. Low-value areas appear around Tianma Mountain in Tong’an District and the eastern coastal belt of the island (e.g., southern Wuyuan Bay), where green space is abundant, and the environment is favorable, resulting in lower resident attention to park facility issues.
High-value areas for parking issues (see Figure 8c) are mainly concentrated in the northwest Haicang District, the industrial areas of Jimei, and around Xiamen Railway Station on the island. These areas have high traffic volumes and intensive land use, leading to significant conflicts between parking availability and commuting demand, making residents particularly sensitive to parking problems. Low-value areas are mainly in the southern Tong’an District and Wuyuan Bay on the island; the former is dominated by low-density residential and rural land, with relatively low parking pressure, while the latter is newly developed with a more complete parking provision system.
High-value areas for the local importance of business vitality (see Figure 8d) are concentrated in the central island, covering major commercial districts and high-density, active street areas, where commercial agglomeration significantly enhances residents’ convenience and social interaction. In the outer-island districts, a “strong core–weaker periphery” pattern emerges: residents in built-up areas perceive commercial vitality strongly, whereas distant villages (especially northern Tong’an and Lianhua Town) exhibit low values due to sparse commercial outlets and reliance on central urban areas for services. This gradient distribution again highlights the “threshold effect” of business vitality on satisfaction—its marginal impact on HSS is limited in low-vitality areas.
(2)
Community Scale
From the spatial distribution at the community scale, the local importance of various issues generally exhibits a clear “construction sequence effect” and differences in infrastructure maturity. In older districts, where infrastructure is well-developed and community organizational systems are mature, residents’ satisfaction is less sensitive to facility-related issues. In contrast, in new towns and urban–rural fringe areas, shorter construction cycles, lagging infrastructure, and insufficient service provision create high-value areas where the importance of these issues is concentrated. This pattern reflects the practical challenge during rapid urban expansion: the mismatch between construction speed and the quality of life-support services.
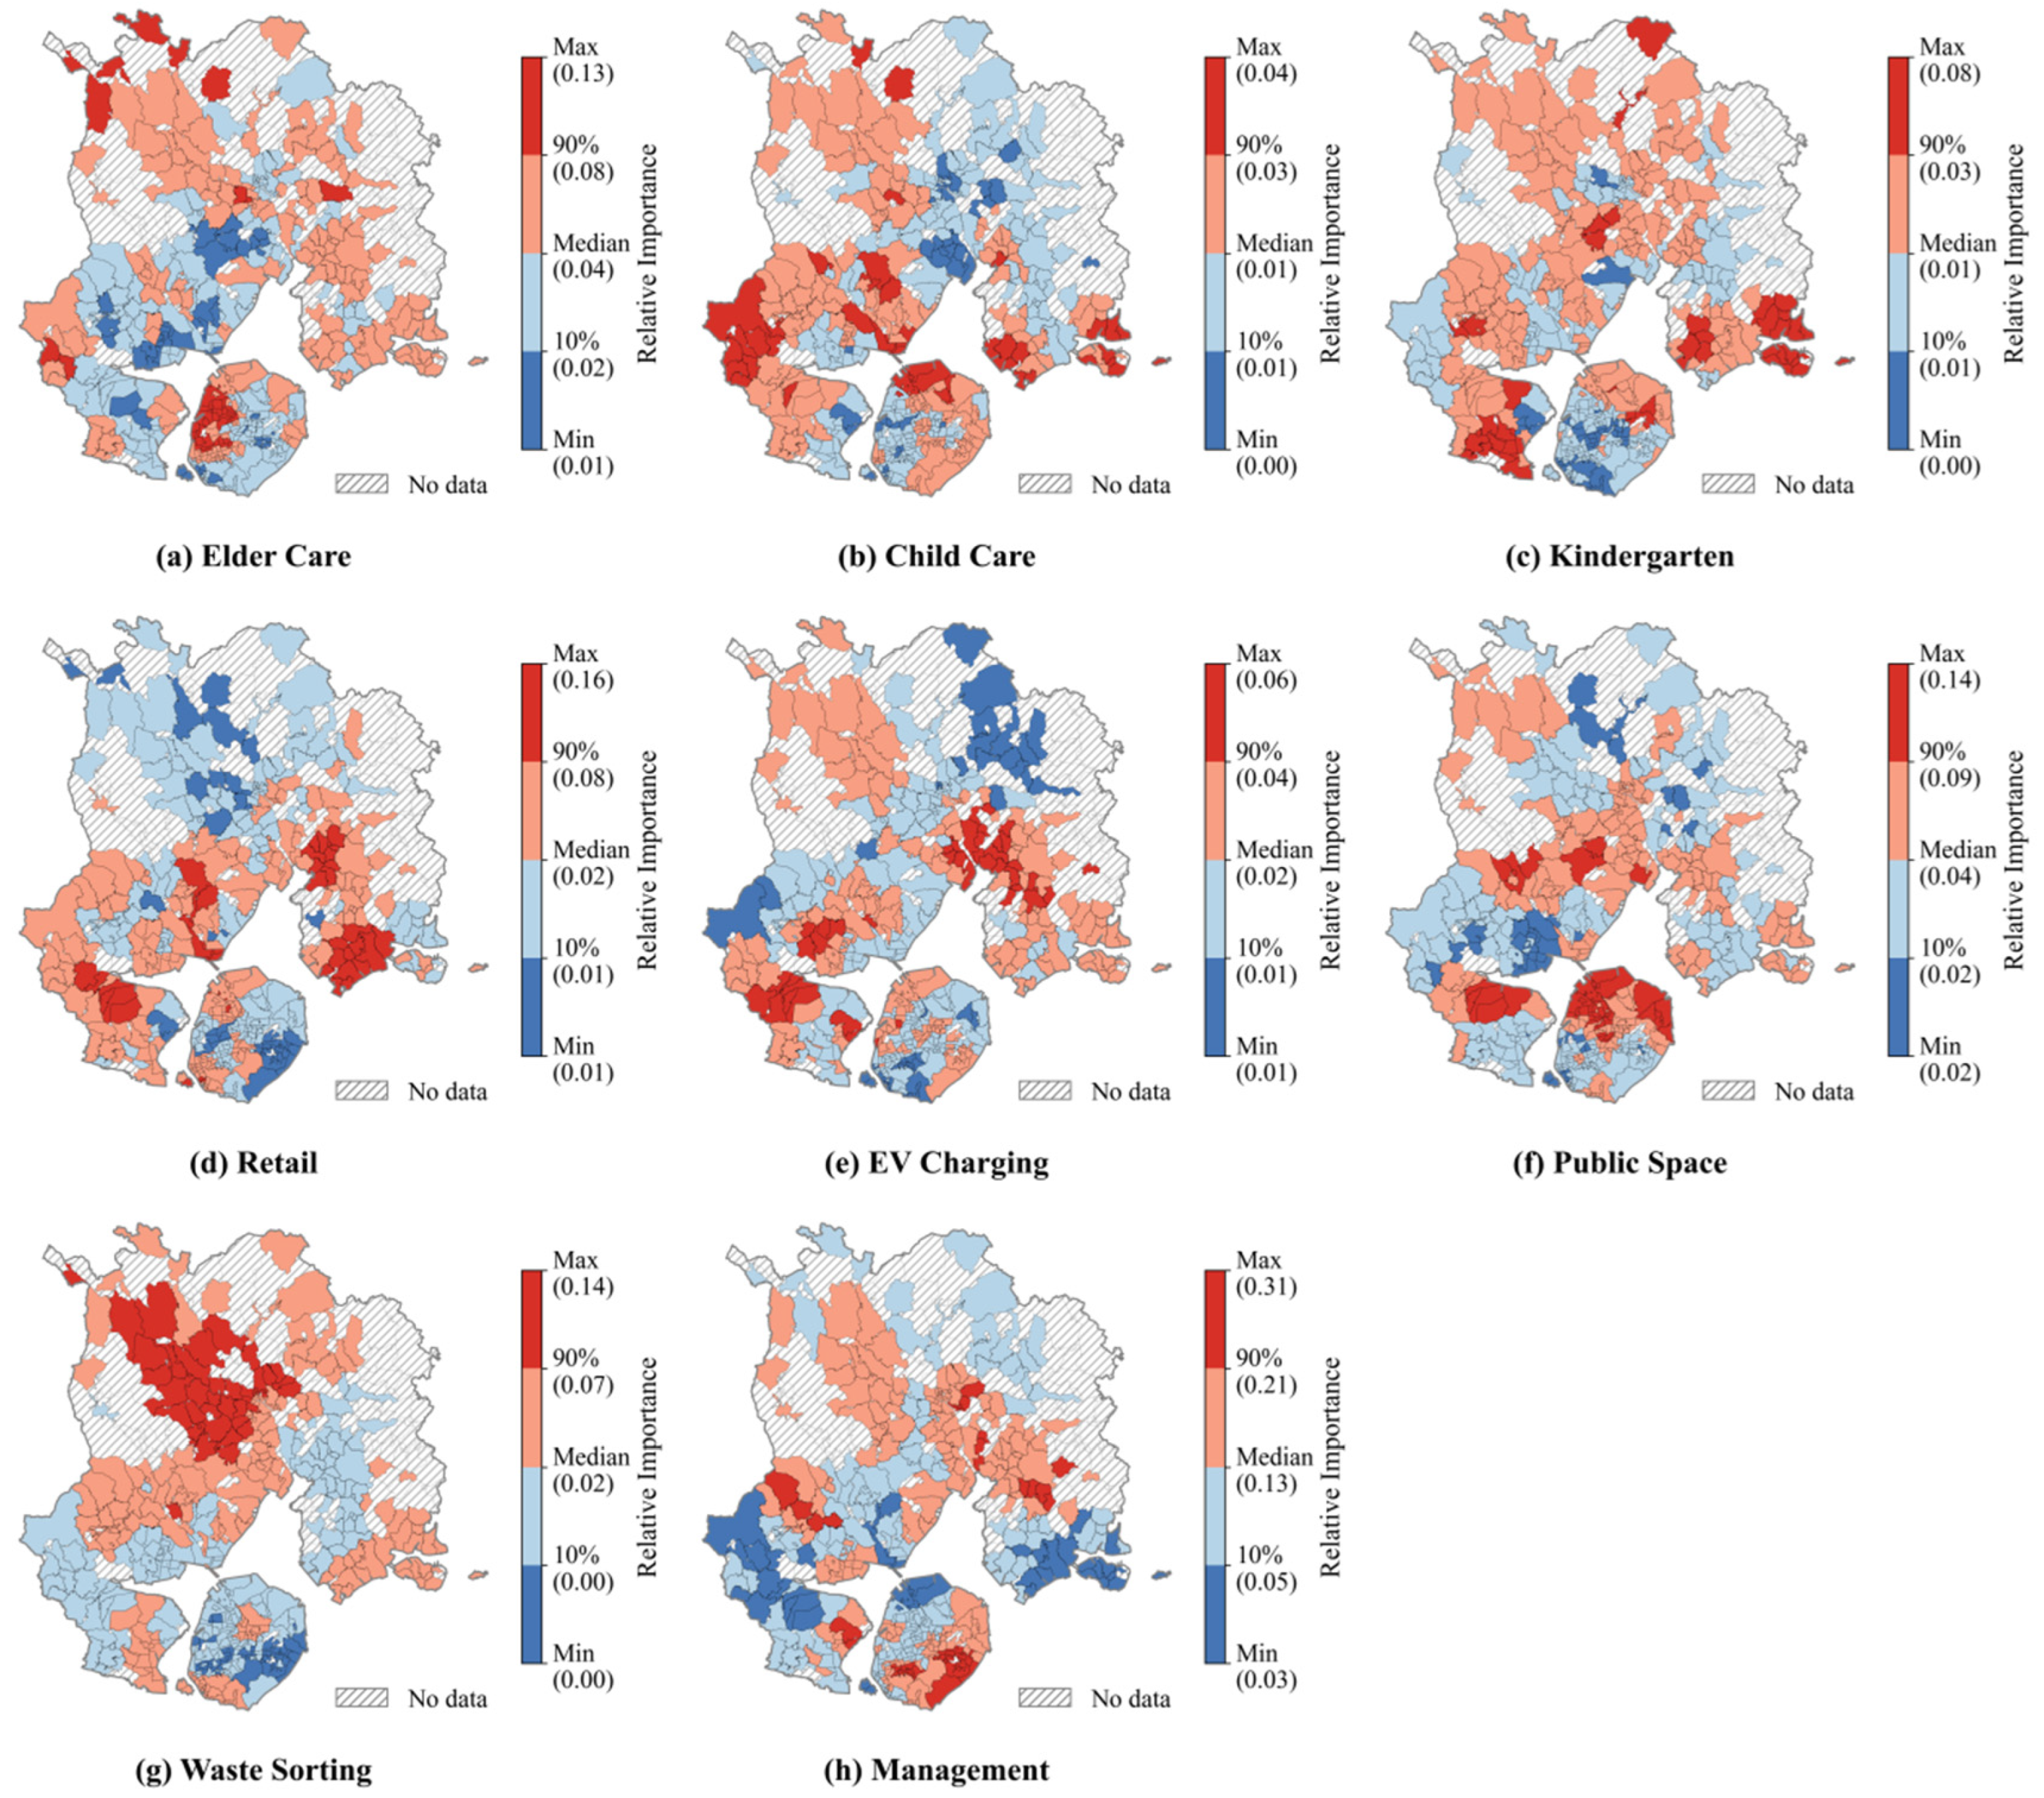
Among community care issues, high-value areas for elderly care issues (top 10% in local importance, see Figure 9a) on the island are mainly concentrated in the western old city on the island, where many long-term residents of Xiamen live. Demand-driven factors make residents particularly sensitive to elderly care issues. Outer-island high-value areas mostly appear in peripheral urban and rural zones, reflecting shortages in basic elderly care services. Low-value areas (bottom 10%) are concentrated in industrial zones of Tong’an and Jimei District and around the university town, where the population is younger and elderly care is not yet a central concern. High-value areas for childcare issues (see Figure 9b) are primarily in newly built eastern communities on the island, and in Jimei and Xiang’an new towns on the outer island. These areas have high proportions of young families with strong demand for childcare and early education services. Urban areas in Tong’an and Haicang exhibit low values, indicating that service provision is relatively complete. However, industrial zones in northwest Haicang and rural areas in northwest Tong’an show high values, highlighting weak childcare services in suburban and rural areas. High-value areas for kindergarten-related issues (see Figure 9c) are mainly in the southern Haicang District and the new town areas of Xiang’an District, reflecting a mismatch between new urban construction and education service management. Low-value areas are concentrated in the central-southern island, including the surroundings of Xiamen University, where kindergarten resources are high-quality and densely distributed, resulting in lower resident sensitivity to these issues.
High-value areas for retail facility issues (see Figure 9d) appear in Xiang’an New Town, northern Haicang, and Jimei New Town, indicating that commercial infrastructure in newly developed residential areas is not yet fully established. Low-value areas are mainly in the central island and southeastern coastal mature districts, where commercial systems are complete and daily life is convenient, leading to lower perceived importance among residents.
High-value areas for electric vehicle (EV) charging issues (see Figure 9e) are concentrated at the junction of Tong’an and Xiang’an District, as well as industrial zones in Jimei and Haicang District. High demand and reliance on specialized equipment in industrial areas make residents particularly sensitive to charging facilities. Low-value areas are mainly in rural zones, where charging options are flexible and facility dependence is low, resulting in lower perceived importance.
For public space issues, high-value areas are located in the northern Huli District (see Figure 9f, an area where industry and urban villages coexist) and the Wuyuan Bay area (high-density new residential zones). Although the causes differ, both reflect a “supply-demand mismatch”: in the former, public space is insufficient; in the latter, space exists but is under-managed or does not meet usage expectations. Outer-island industrial zones and mixed urban–village areas also show high importance. Low-value areas are mainly around the Garden Expo Park, benefiting from a high-quality park and green space system.
High-value areas for waste sorting issues (see Figure 9g) are concentrated within Tong’an District, especially in rural and urban–rural fringe areas, reflecting lagging infrastructure and management systems. Low-value areas are almost entirely in the Siming District, highlighting the mature experience of older urban areas in waste sorting and daily management.
High-value areas for community management issues (see Figure 9h) align closely with the distribution patterns revealed in Section 3.3.2 for dominant factors. They are mainly concentrated in urban–suburban fringe zones and areas with high population mobility. Low-value areas appear in the eastern Xiang’an District, northern Haicang District, and northern Huli District—recently developed districts or directions of urban expansion. Although these areas are still in the process of establishing community governance systems, residents experience relatively low governance pressure in daily life, thanks to well-developed infrastructure, reasonable spatial planning, and moderate population density. Consequently, their subjective sensitivity to community management issues is relatively low.
(3)
Housing Scale
Housing-scale variables generally exhibit a spatial gradient of “old city with aging facilities—new city with complete construction—suburban areas with weak infrastructure,” reflecting a strong correlation between residential quality and the urban development timeline. The spatial patterns of different indicators not only reveal differences in residents’ subjective perceptions of housing conditions but also reflect spatial imbalances in housing renewal and property ownership structure.
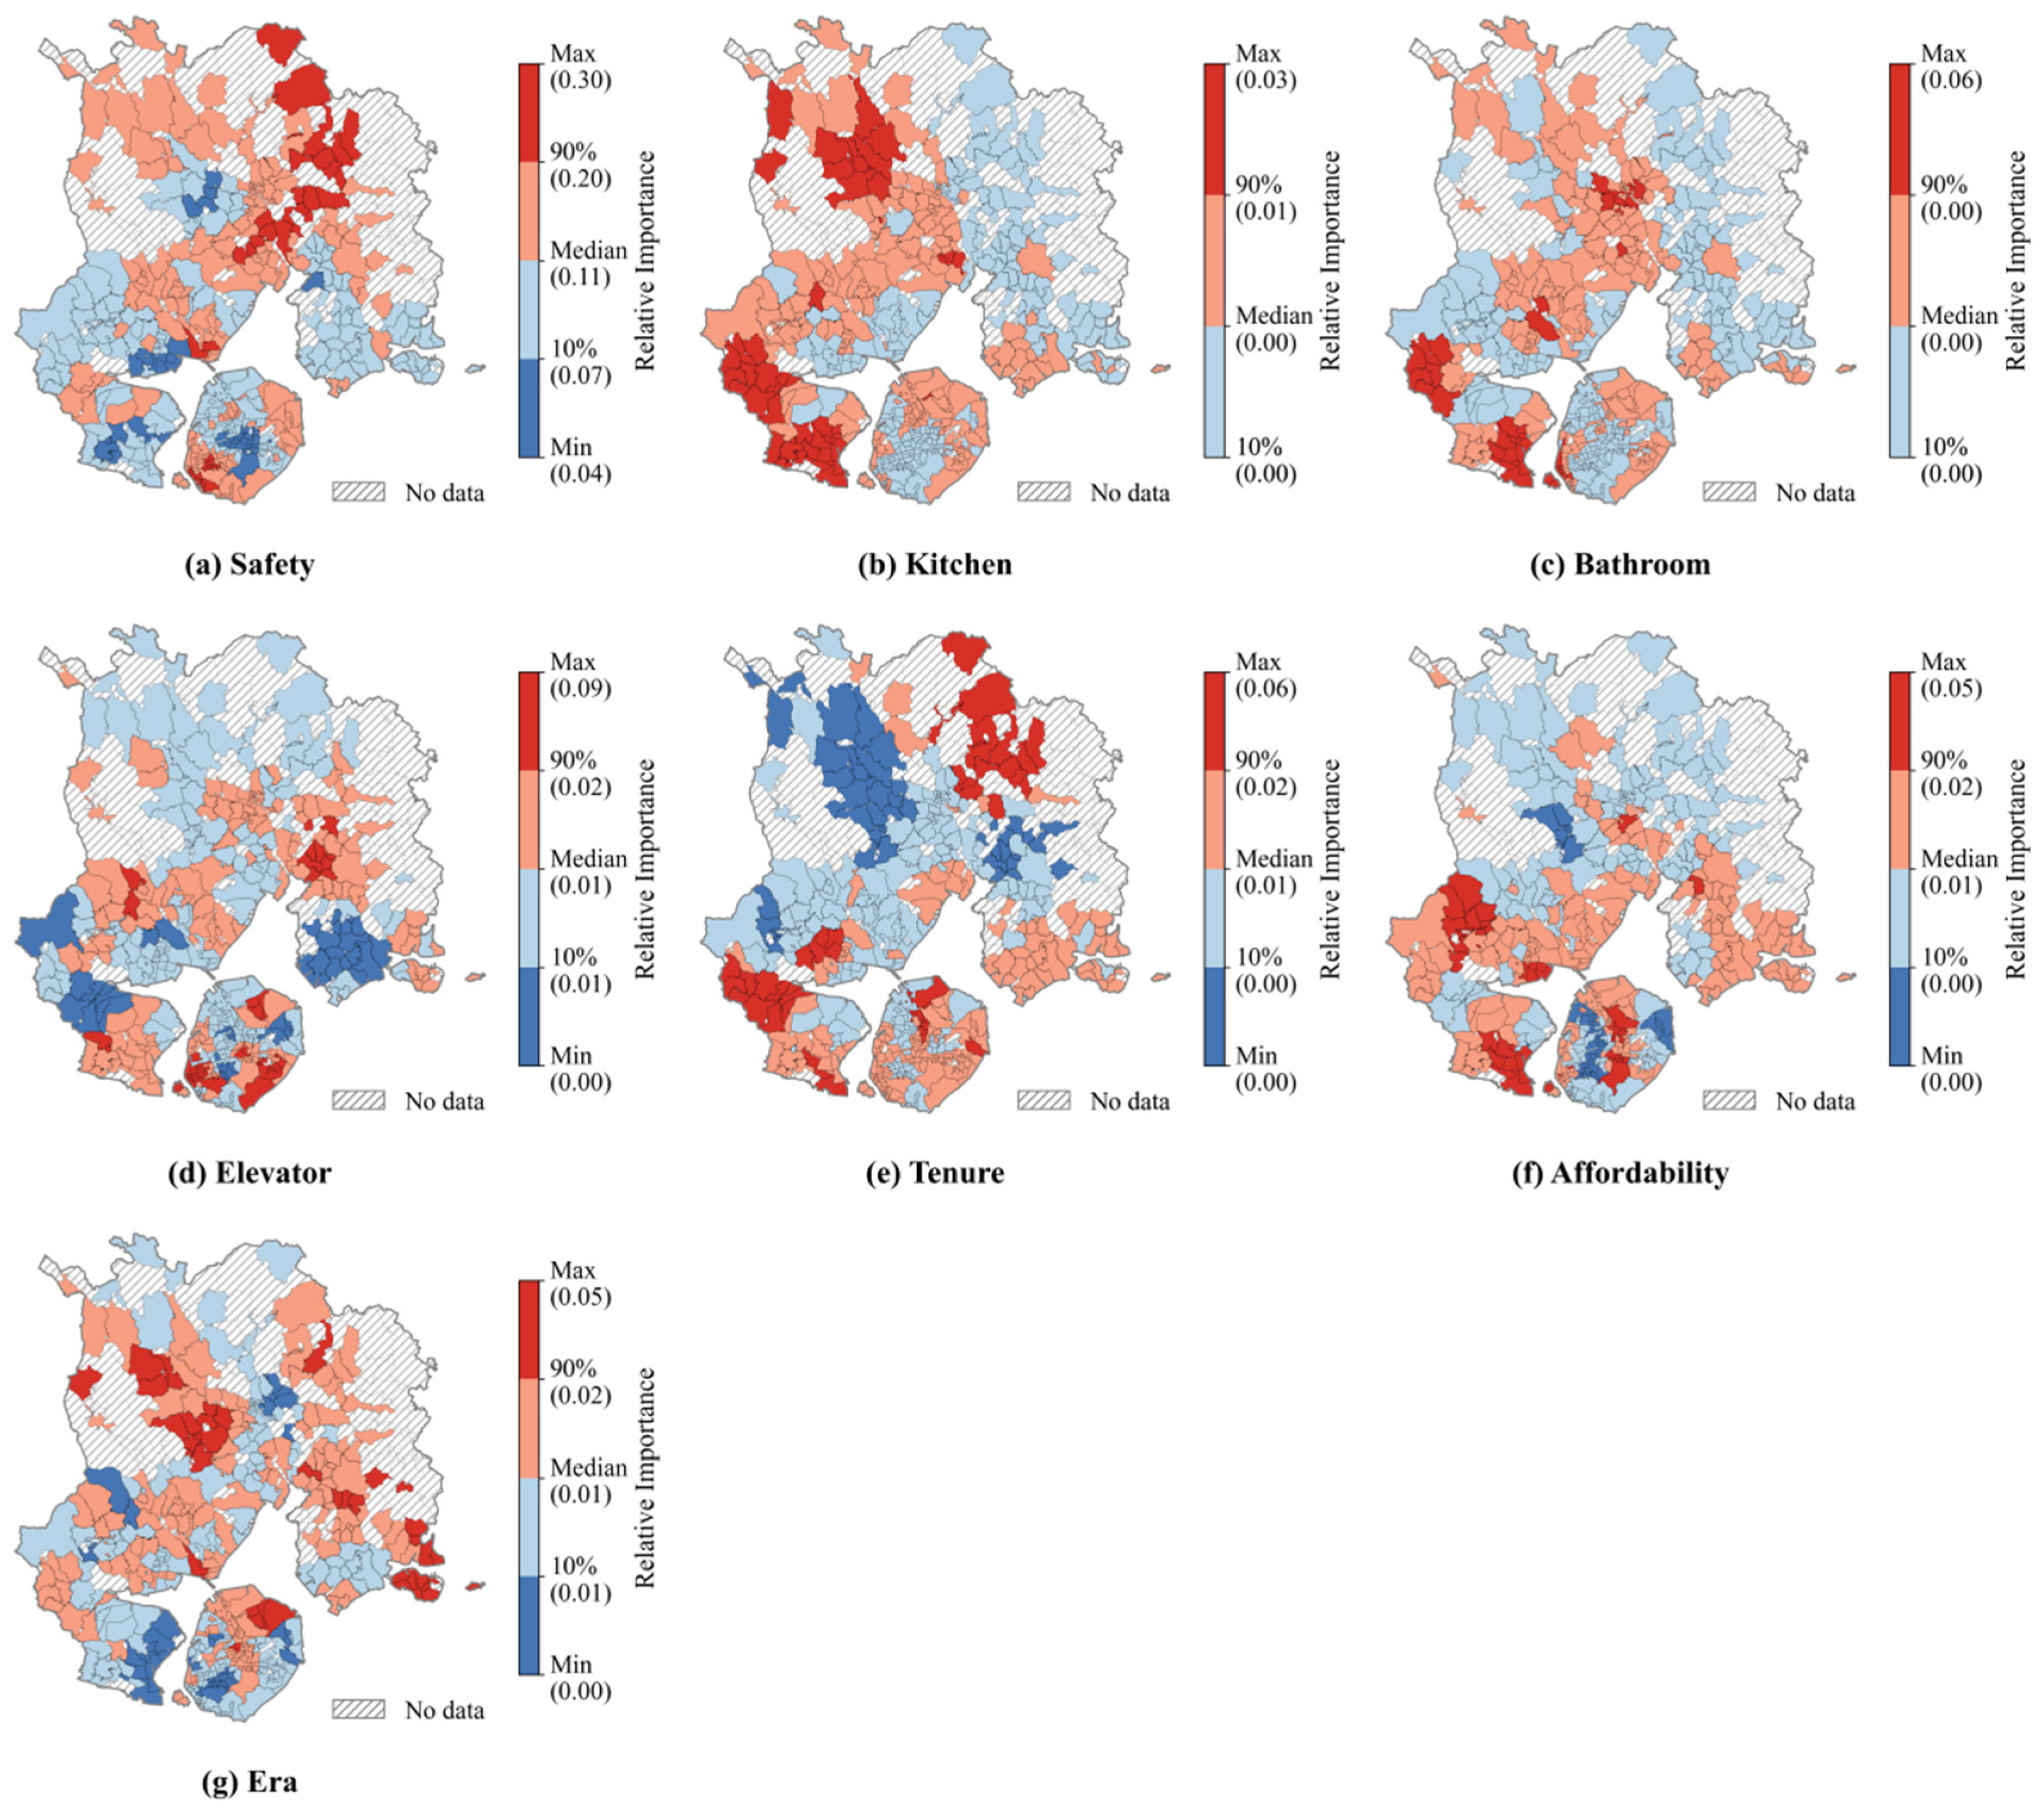
High-value areas for housing safety issues (top 10% of local importance, see Figure 10a) largely align with the distribution patterns of dominant factors discussed in Section 3.3.2, mainly concentrated around popular tourist spots and remote rural areas. These regions experience high population flow or have limited management resources, making safety hazards more noticeable to residents. Low-value areas (bottom 10% of local importance) are mostly located in the urban core, where public services are dense, security measures are well-established, and residents generally have higher social capital and stronger recognition of community governance, resulting in a weaker perception of housing safety issues.
The spatial patterns of kitchen and bathroom availability are highly similar (see Figure 10b,c). In over 90% of areas, their importance is close to zero, indicating that these basic facilities are largely widespread throughout Xiamen. Higher importance is observed only in parts of Haicang and Tong’an districts, reflecting that in peripheral or older residential areas, some housing units still lack complete facilities or have restricted usability. These local high-value areas indicate that residents in certain communities remain sensitive to basic living facilities, especially in urban–rural fringe zones.
High-value areas for elevator availability (see Figure 10d) are primarily located in island urban villages and old residential neighborhoods. These areas were mostly built in the last century, with high building density and multiple floors, making elevator retrofitting difficult; residents are therefore acutely aware of the inconvenience caused by the absence of elevators. Low-value areas are concentrated in newly built communities such as Xiang’an New Town, where modern construction standards and comprehensive infrastructure make elevators standard, and residents’ sensitivity to this issue is significantly reduced.
High-value areas for tenure (see Figure 10e) are mainly distributed in the northwest of Haicang District and central Jimei District, urban expansion zones where rapid housing commodification increases residents’ housing pressure, and perceived ownership directly affects residential satisfaction. In Tong’an District, this variable shows pronounced spatial differentiation: the western suburban areas are dominated by collective or rental housing, with weaker ownership awareness and lower perceived importance; the eastern suburban areas, where commercial housing and resettlement housing coexist, show elevated importance due to psychological disparities arising from property differences.
High-value areas for housing affordability (see Figure 10f) are mainly concentrated in the built-up areas and expansion fringes outside the island, where the rapid commercialization of housing has driven up both purchase and rental costs. Within the island, a pattern of “high in the center and low in the east and west” is observed. The central area, characterized by mature commercial districts and core residential zones, faces soaring housing prices and heavy financial burdens on residents. In contrast, the eastern and western sides, though featuring higher-priced high-end residential communities, are primarily owner-occupied, resulting in relatively lower housing cost pressures.
High-value areas for housing age (see Figure 10g) are concentrated near Wuyuan Bay on the island and in the western suburbs of Tong’an District and eastern Xiang’an outer the island. These areas feature a mix of old and new housing with uneven renewal rhythms, making residents highly sensitive to differences in building age. Low-value areas are concentrated in Haicang New Town and the northern slopes of Wanshi Mountain on the island; in the former, as a newly built area, residents are relatively less concerned about building age, whereas in the latter, although housing age varies, the mature built environment and well-established living services mitigate residents’ sensitivity to building age.
(4)
Personal Characteristics
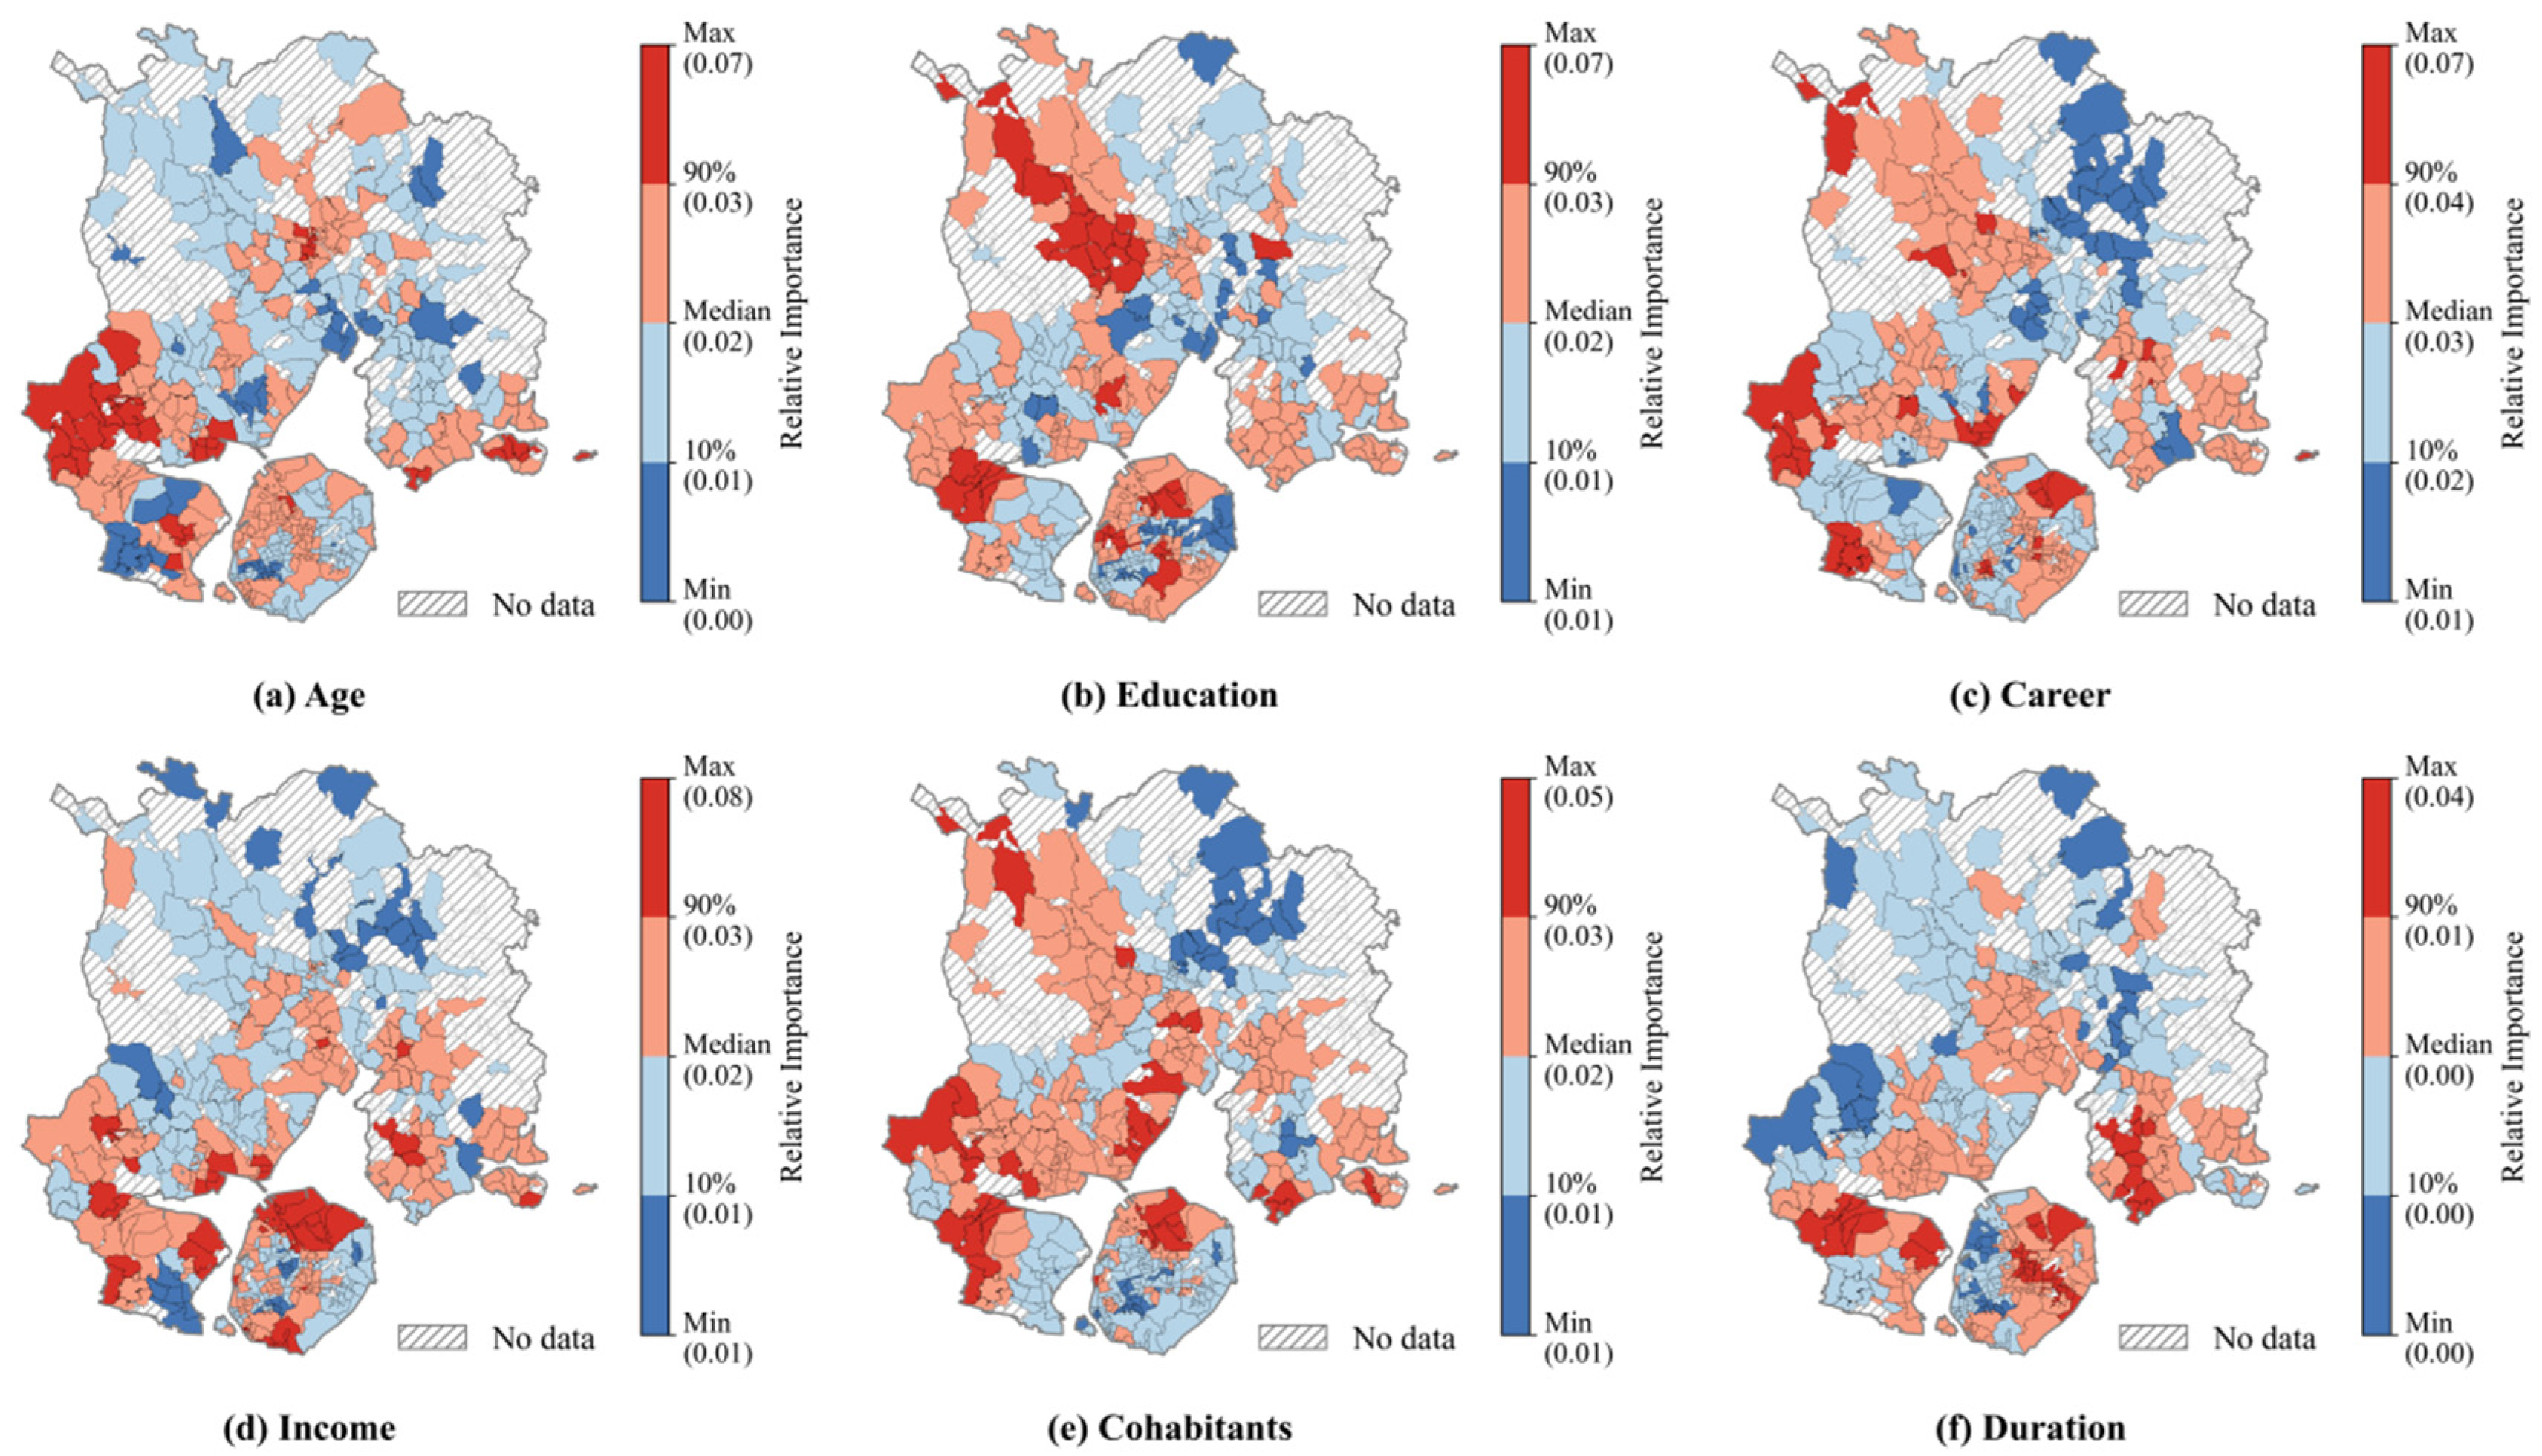
High-value areas for age characteristics (top 10% of local importance, see Figure 11a) are mainly concentrated in Jimei District and western communities of Haicang District. These regions are located in zones of rapid urban expansion, where both migrant and local populations coexist, resulting in a pronounced age structure divergence. Different age groups have substantial differences in housing needs, community belonging, and expectations for public resources, which amplifies the impact of age on HSS. Low-value areas (bottom 10% of local importance) are scattered without obvious clustering. Residents in these areas have relatively balanced age structures, stable daily routines, and well-established social networks, reducing the explanatory power of age differences on satisfaction.
The higher local importance of educational attainment (see Figure 11b) is primarily distributed on the northern and southern wings of the central inner-island area, while outer-island it is concentrated in the western suburban areas of Tong’an District. Highly educated groups generally have stronger housing choice capabilities, making their satisfaction more influenced by a combination of housing quality, commuting efficiency, and community environment. Low-value areas are concentrated in the mid-eastern coastal section of the island, such as emerging industrial clusters like the Xiamen Software Park. Although these areas have high education levels, the population is highly mobile and dominated by “new Xiamen residents,” resulting in relatively weak community belonging and a weaker correlation between education and satisfaction.
Local importance for career prestige (see Figure 11c) is higher in the Jimei Academic Village area and western Haicang District on the outer island, and mainly concentrated in high-end residential areas such as Wuyuan Bay on the island. High-value areas reflect that residents with higher occupational status tend to choose communities with superior functions and environments, exhibiting a pronounced social stratification effect on satisfaction formation. Low-value areas are concentrated in the eastern suburban areas of Tong’an District, where the local economy in urban–rural fringe areas is dominated by lower-status occupations, reducing the explanatory power of career prestige on satisfaction.
Local importance of household income (see Figure 11d) shows that island high-value areas are mainly distributed in the northern and southern coastal streets, which attract many middle- and high-income migrants with higher demands for housing quality and living environment. In the outer-island region, high-value areas are concentrated in urban village edges of Haicang District, likely reflecting mixed-income groups formed during rapid urbanization. Low-value areas are concentrated around the Haicang port and its logistics hinterlands, where industrial homogeneity leads to relatively uniform incomes, weakening the explanatory power of income differences on satisfaction.
High-value areas for the number of cohabitants (see Figure 11e) are mainly concentrated in northern inner-island districts and on the outer-island urban expansion areas, such as western Haicang District and Qiaoying Subdistrict on the eastern coast of Jimei District. These areas are undergoing substantial social restructuring, with both established multi-generational households and newly arrived small families coexisting. This diversity in household structure generates significant differences in HSS, giving the number of cohabitants high relative importance in the model. In contrast, low-value areas are mainly located in the eastern suburban areas of Tong’an District, where households are primarily long-established residents and social structures are stable, resulting in weaker explanatory power of cohabitant numbers on satisfaction.
For residential duration (see Figure 11f), high-value areas are mainly concentrated in the eastern inner-island and central zones of the four peripheral districts. These are mostly newly built communities where residents have short occupancy periods, so differences in residential duration directly influence the formation of satisfaction perceptions—the longer the residence, the stronger the familiarity with the environment and sense of community belonging. Low-value areas are concentrated in western inner-island old neighborhoods and outer-island surrounding rural areas, where differences in residential duration have limited explanatory power, reflecting the stable expectations and environmental inertia of long-term residents.

4. Conclusions

This study leverages the 2025 Xiamen Urban Physical Examination survey to investigate the spatial differentiation of human settlement satisfaction (HSS). Methodologically, we introduce the Geographically Random Forest (GRF) model into urban livability research, effectively capturing complex nonlinear relationships and spatial heterogeneity that traditional models often miss. This approach allows for both global interpretation and local explanation, providing a robust analytical framework for diagnosing urban issues. Our primary contributions are threefold: (1) advancing the theoretical understanding of HSS by revealing its multi-scale spatial determinants and their interactive effects; (2) establishing a replicable, multi-scale spatial analysis paradigm for urban livability research; and (3) providing empirically grounded insights for refining the Urban Physical Examination system and supporting targeted urban governance strategies.
The study leverages Xiamen’s distinct “island–outer-island” duality, a strategic case setting that encapsulates multiple urban development stages within a single city. This spatial binary is fundamentally a manifestation of phased land development, where the mature island core faces challenges of intensive land use and regeneration, while the expanding outer-island grapples with land consumption and the integration of new urban fabric. This intrinsic contrast enables our findings to reveal land-use and governance mechanisms transferable to a wide spectrum of cities experiencing core-periphery dynamics. The differential governance implications—optimizing the mature island core through land re-densification and functional upgrades versus managing outer-island expansion through compact development and pre-emptive reservation of land for public services—demonstrate the practical value of this binary perspective for diverse urban contexts.
Furthermore, the empirical results affirm the explanatory power of our multi-scale framework. The notable disparities in variable importance across scales demonstrate that HSS is shaped by a nested system of factors, wherein the distinct governance and experiential logics of each spatial level jointly produce the urban lived experience. Critically, this multi-scale logic mirrors the hierarchical nature of spatial planning: block-level vitality is rooted in zoning and land-use mix; community-level governance is contingent on the allocation of land for public facilities; and housing-scale conditions are directly shaped by land supply policies and redevelopment paradigms. Our framework thus provides a diagnostic tool to trace satisfaction outcomes back to their specific land-use and planning determinants, bridging the gap between resident perception and the material consequences of spatial policy.
The findings are as follows: First, at the overall level, multi-scale features differ significantly, with the built environment dominating HSS. Block-level business vitality emerges as the most influential factor, followed by community management and housing safety. Multi-scale comparisons show that block-scale features contribute the most, followed by community-scale features, while housing and personal characteristics are relatively weaker but still significant. This indicates that HSS is spatially driven primarily by a combination of the built environment and governance effectiveness.
Second, at the block scale, business vitality dominates, with facility accessibility and living convenience being key. Business vitality significantly enhances HSS and exhibits reinforced marginal effects in high-vitality areas, highlighting a positive “convenience–satisfaction” relationship. In contrast, the importance of cultural and parking facilities is lower but displays notable spatial heterogeneity, particularly in emerging industrial zones and peripheral areas where facility shortages or poor management are major sources of dissatisfaction.
Third, at the community scale, governance and service provision exhibit significant disparities, with a pronounced “governance shortfall” effect. Community management issues are particularly evident in suburban and high-mobility areas, reflecting a mismatch between grassroots service capacity and the pace of urban expansion. Other aspects, such as public space and community care, also display differentiated patterns across functional zones, revealing diversified demands for community governance.
Fourth, at the housing scale, residential conditions and economic pressures coexist, and variations in housing quality lead to differentiated satisfaction levels. Housing safety issues are mainly concentrated around tourist attractions and remote rural areas, reflecting risks arising from inadequate management in high-traffic zones and housing deterioration. In newly developed urban expansion areas, the sense of property ownership serves as a core determinant of residents’ satisfaction. The high-value distribution of housing affordability in both built-up and expansion-edge areas highlights the tension between economic pressure and well-being. Although the overall influence of housing infrastructure is relatively weak, certain local sensitivities still exist.
Finally, at the individual level, social structure reshapes satisfaction differences. Personal characteristics factors are generally of low importance but show significant spatial heterogeneity. Age and residential duration are more important in expansion areas, reflecting differentiated perceptions between migrants and local residents. Career prestige and household income show social stratification patterns, with high-prestige and middle-income groups experiencing greater fluctuations in satisfaction. The importance of the number of cohabitants rises in the expansion areas, highlighting differences in residential experience arising from mixed social structures.
Despite the pronounced spatial heterogeneity in the underlying drivers of HSS across all scales (as detailed in Findings 1–5 and visualized in Figure 8, Figure 9, Figure 10 and Figure 11), the outcome—overall satisfaction (Figure 3)—exhibits a considerable degree of spatial homogeneity, with more than 60% of the city reporting being “Satisfied” or “Very Satisfied.” This apparent paradox can be reconciled through two key mechanisms: (1) the “ceiling effect” and expectation adaptation, where high baseline development in Xiamen compresses satisfaction scores at the upper end of the scale, and residents calibrate their expectations to local contexts and (2) factor compensation and substitution, whereby different combinations of strengths and weaknesses across neighborhoods can yield similar net satisfaction levels (e.g., superior business vitality compensating for parking stress in the core, or newer housing compensating for nascent community services in the periphery). This critical insight underscores that aggregate satisfaction scores can mask vastly different local realities and needs.
Consequently, the management implications derived from this study are twofold: it is necessary not only to maintain the overall high standard of living that generates widespread satisfaction but also to implement targeted, spatially sensitive interventions that address the specific and heterogeneous deficiencies identified herein.
Based on these findings, three policy recommendations are proposed: (1) Embed spatial and land-use diagnostics into the UPE indicator system. Future assessments should move beyond aggregate metrics to incorporate key land-use performance indicators, such as functional mix, accessibility to amenities, and provision of community service land. This will directly link satisfaction drivers like commercial vitality and management efficacy to their spatial and planning foundations, enabling more precise problem identification. (2) Leverage land-use tools for multi-scale governance. Spatial planning is critical for addressing the identified heterogeneity. At the block scale, use zoning and land disposition to promote vibrant, mixed-use environments and ensure adequate land allocation for public facilities. At the community scale, safeguard land for grassroots governance sites and community services in urban plans to address governance shortfalls in expanding areas. At the housing scale, guide housing quality and safety through land supply policies that prioritize residential infill and the redevelopment of deteriorating housing stock. (3) Emphasize residents’ subjective spatial feedback. Assessment data reflect not only objective urban operation but also collective resident perceptions. Future work should establish dynamic mechanisms for collecting residents’ perceptions and use geographic information and AI models to capture changes in perceptual space, enabling intelligent urban health monitoring and early warning.
Future research can expand in two directions: first, conducting longitudinal analyses of urban physical survey data across years to reveal temporal relationships between policy adjustments and changes in resident perceptions; second, integrating multi-source spatial big data (e.g., street view, POI, mobile signals) to improve spatial precision of indicators, thereby establishing UPE models with stronger predictive and explanatory power; and third, examining heterogeneity across different population groups—such as rural-to-urban migrants, residents in informal housing—and incorporating community-level Human Development Index (HDI) values to better understand how social and demographic contexts shape perceptions and urban satisfaction.

Author Contributions

R.Z.: conceptualization, methodology, funding acquisition, writing—original draft, and writing—review and editing. Y.Z.: methodology, validation, visualization, writing—original draft, and writing—review and editing. Y.C.: visualization, data curation, and writing—original draft. L.L.: conceptualization and writing—review and editing. All authors have read and agreed to the published version of the manuscript.

Funding

This paper is supported by the National Natural Science Foundation of China (Grant No. 52478072) and the Social Science Foundation of Fujian, China (Grant No. FJ2024B209).

Data Availability Statement

Restrictions apply to the availability of these data. Data were obtained from Xiamen Planning Digital Technology Research Center and are available from the authors with the permission of Xiamen Planning Digital Technology Research Center.

Acknowledgments

We appreciate the data support provided by the Xiamen Urban Physical Examination Task Force team for 2025.

Conflicts of Interest

The authors declare that they have no known competing financial interests or personal relationships that could have appeared to influence the work reported in this paper.

References

  1. Chen, H.; Wang, X.; Guo, Z. Transformation of Urban Planning: Thoughts on Incremental Planning, Stock-Based Planning, and Reduction Planning. China City Plan. Rev. 2016, 25, 26. [Google Scholar]
  2. Pan, W.; Du, J. Towards Sustainable Urban Transition: A Critical Review of Strategies and Policies of Urban Village Renewal in Shenzhen, China. Land Use Policy 2021, 111, 105744. [Google Scholar] [CrossRef]
  3. Zhan, D.; Kwan, M.-P.; Zhang, W.; Fan, J.; Yu, J.; Dang, Y. Assessment and Determinants of Satisfaction with Urban Livability in China. Cities 2018, 79, 92–101. [Google Scholar] [CrossRef]
  4. Zhang, L.; Zhang, R.; Yin, B. The Impact of the Built-up Environment of Streets on Pedestrian Activities in the Historical Area. Alex. Eng. J. 2021, 60, 285–300. [Google Scholar] [CrossRef]
  5. Chao, H.; Kong, H. Changes in Family Structure during Shantytown Redevelopment and Their Correlation with the Living Space. Land 2024, 13, 1025. [Google Scholar] [CrossRef]
  6. Chao, H.; Ma, X.; Wang, Y.; Kong, H. Changes of School Travel during Shantytown Redevelopment: Evidence from Heze, China. Ann. Am. Assoc. Geogr. 2025, 115, 2071–2094. [Google Scholar] [CrossRef]
  7. Ahmed, N.O.; El-Halafawy, A.M.; Amin, A.M. A Critical Review of Urban Livability. Eur. J. Sustain. Dev. 2019, 8, 165. [Google Scholar] [CrossRef]
  8. Kashef, M. Urban Livability across Disciplinary and Professional Boundaries. Front. Archit. Res. 2016, 5, 239–253. [Google Scholar] [CrossRef]
  9. Samavati, S.; Veenhoven, R. Happiness in Urban Environments: What We Know and Don’t Know yet. J. Hous. Built Environ. 2024, 39, 1649–1707. [Google Scholar] [CrossRef]
  10. Li, X.; Liu, H. The Influence of Subjective and Objective Characteristics of Urban Human Settlements on Residents’ Life Satisfaction in China. Land 2021, 10, 1400. [Google Scholar] [CrossRef]
  11. Liu, Z.; Kemperman, A.; Timmermans, H. Social-Ecological Correlates of Older Adults’ Outdoor Activity Patterns. J. Transp. Health 2020, 16, 100840. [Google Scholar] [CrossRef]
  12. Cen, L.; Xiao, Y. Assessing Urban Park Accessibility via Population Projections: Planning for Green Equity in Shanghai. Land 2025, 14, 1580. [Google Scholar] [CrossRef]
  13. Zhan, D.; Wang, Z.; Zhang, W.; Dang, X.; Zhou, J. Impact of multi-scale perceptions of urban human settlements on residents’ subjective well-being: Based on the “four good” construction concept and city health examination data. City Plan. 2025, 45, 4–15+110. Available online: http://www.planning.com.cn/WKE/WebPublication/paperDigest.aspx?paperID=2f02abf5-239a-443f-b7b7-0ff870b77dc2 (accessed on 22 October 2025). (In Chinese).
  14. Means, R.; Richards, S.; Smith, R. Community Care: Policy and Practice; Bloomsbury Publishing: London, UK, 2008. [Google Scholar]
  15. Bowles, S.; Gintis, H. Social Capital and Community Governance. Econ. J. 2002, 112, F419–F436. [Google Scholar] [CrossRef]
  16. Zhang, F.; Zhang, C.; Hudson, J. Housing Conditions and Life Satisfaction in Urban China. Cities 2018, 81, 35–44. [Google Scholar] [CrossRef]
  17. Sun, R.; Li, W.; He, H.; Leng, S.; Cheng, J.; Yang, X.; Yu, Z.; Chen, L. Declining Subjective Well-Being Disparities Concurrent with Urbanization in China. Natl. Sci. Rev. 2025, 12, nwaf362. [Google Scholar] [CrossRef]
  18. Liu, Z.; Kemperman, A.; Timmermans, H.; Yang, D. Heterogeneity in Physical Activity Participation of Older Adults: A Latent Class Analysis. J. Transp. Geogr. 2021, 92, 102999. [Google Scholar] [CrossRef]
  19. MOHURD. Promote the High-Quality Development of Housing and Urban-Rural Construction with Full Efforts to Contribute to Achieving the Great Victory of Building a Moderately Prosperous Society in All Respects and Realizing the First Centenary Goal-The National Housing and Urban-Rural Construction Work Conference Was Held. Available online: https://www.mohurd.gov.cn/xinwen/jsyw/art/2019/art_303_243195.html (accessed on 22 October 2025). (In Chinese)
  20. MOHURD. Guidance from the Ministry of Housing and Urban-Rural Development on Comprehensively Carrying out Urban Health Examination Work. Available online: https://www.gov.cn/zhengce/zhengceku/202312/content_6918801.htm (accessed on 22 October 2025). (In Chinese)
  21. Zhang, W.; Cao, J.; He, J.; Chen, L. City Health Examination in China: A Methodology and Empirical Study. Chin. Geogr. Sci. 2021, 31, 951–965. [Google Scholar] [CrossRef]
  22. He, H.; Ren, Y.; Shen, L.; Xiao, J.; Lai, Y.; Yang, Y.; Zhang, L. A Guiding Methodology for “Urban Physical Examination”: Indicator Checklist, Benchmark Setting and Empirical Study. Sustain. Cities Soc. 2023, 98, 104835. [Google Scholar] [CrossRef]
  23. Chen, W.; Wang, Y.; Ren, Y.; Yan, H.; Shen, C. A Novel Methodology (WM-TCM) for Urban Health Examination: A Case Study of Wuhan in China. Ecol. Indic. 2022, 136, 108602. [Google Scholar] [CrossRef]
  24. Zhan, D.; Kwan, M.-P.; Zhang, W.; Chen, L.; Dang, Y. The Impact of Housing Pressure on Subjective Well-Being in Urban China. Habitat Int. 2022, 127, 102639. [Google Scholar] [CrossRef]
  25. Xiamen HURDB. Notice of Xiamen Municipal Housing and Construction Bureau on Issuing the 2025 Xiamen Urban Physical Examination Work Plan. Available online: https://szjj.xm.gov.cn/zwgk/tzgg/202506/t20250604_2937046.htm (accessed on 22 October 2025). (In Chinese)
  26. Xiamen GOMPG. Notice of the General Office of the Xiamen Municipal People’s Government on Issuing the Work Plan for Urban Physical Examination and Evaluation Under the Territorial Spatial Planning Framework. Available online: https://www.xm.gov.cn/zwgk/flfg/sfbwj/202303/t20230306_2723190.htm (accessed on 22 October 2025). (In Chinese)
  27. Xiamen GOMPG. Notice of the General Office of the Xiamen Municipal People’s Government on Issuing the Guiding Opinions for Implementing Urban Renewal Actions. Available online: https://www.xm.gov.cn/zwgk/flfg/sfbwj/202209/t20220930_2692084.htm (accessed on 22 October 2025). (In Chinese)
  28. Jiang, Y.; Sun, S.; Zheng, S. Exploring Urban Expansion and Socioeconomic Vitality Using NPP-VIIRS Data in Xia-Zhang-Quan, China. Sustainability 2019, 11, 1739. [Google Scholar] [CrossRef]
  29. Georganos, S.; Grippa, T.; Niang Gadiaga, A.; Linard, C.; Lennert, M.; Vanhuysse, S.; Mboga, N.; Wolff, E.; Kalogirou, S. Geographical Random Forests: A Spatial Extension of the Random Forest Algorithm to Address Spatial Heterogeneity in Remote Sensing and Population Modelling. Geocarto Int. 2021, 36, 121–136. [Google Scholar] [CrossRef]
  30. Li, A.; Zhang, Z.; Hong, Z.; Liu, L.; Liu, L.; Ashraf, T.; Liu, Y. Spatial Suitability Evaluation Based on Multisource Data and Random Forest Algorithm: A Case Study of Yulin, China. Front. Environ. Sci. 2024, 12, 1338931. [Google Scholar] [CrossRef]
  31. Tang, L.; Zhao, Y.; Yin, K.; Zhao, J. Xiamen. Cities 2013, 31, 615–624. [Google Scholar] [CrossRef]
  32. Li, X.; Lin, T.; Zhang, G.; Xiao, L.; Zhao, Q.; Cui, S. Dynamic Analysis of Urban Spatial Expansion and Its Determinants in Xiamen Island. J. Geogr. Sci. 2011, 21, 503–520. [Google Scholar] [CrossRef]
  33. Fasano, G.; Franceschini, A. A Multidimensional Version of the Kolmogorov–Smirnov Test. Mon. Not. R. Astron. Soc. 1987, 225, 155–170. [Google Scholar] [CrossRef]
  34. Gao, J. How does family socioeconomic status influence college students’ employment risk: The mediating effects of parental involvement and academic achievement. Nankai Econ. Res. 2022, 7, 162–181. [Google Scholar] [CrossRef]
  35. Cutler, D.R.; Edwards, T.C.; Beard, K.H.; Cutler, A.; Hess, K.T.; Gibson, J.; Lawler, J.J. Random Forests for Classification in Ecology. Ecology 2007, 88, 2783–2792. [Google Scholar] [CrossRef] [PubMed]
  36. Breiman, L. Random Forest. Mach. Learn. 2001, 45, 5–32. [Google Scholar] [CrossRef]
  37. Liaw, A.; Wiener, M. Classification and Regression by randomForest. R News 2002, 2, 18–22. [Google Scholar]
  38. Hengl, T.; Nussbaum, M.; Wright, M.N.; Heuvelink, G.B.; Gräler, B. Random Forest as a Generic Framework for Predictive Modeling of Spatial and Spatio-Temporal Variables. PeerJ 2018, 6, e5518. [Google Scholar] [CrossRef] [PubMed]
  39. Chao, H.; Xu, M.; Jin, S.T.; Kong, H. Understanding Temporary Residential Mobility during Urban Renewal: Insights from a Structured Community Survey and Machine Learning Analysis. Appl. Geogr. 2024, 172, 103425. [Google Scholar] [CrossRef]
  40. Athey, S.; Tibshirani, J.; Wager, S. Generalized Random Forests. Ann. Statist. 2019, 47, 1148–1178. [Google Scholar] [CrossRef]
  41. Wager, S.; Athey, S. Estimation and Inference of Heterogeneous Treatment Effects Using Random Forests. J. Am. Stat. Assoc. 2018, 113, 1228–1242. [Google Scholar] [CrossRef]
  42. Luo, Y.; Yan, J.; McClure, S. Distribution of the Environmental and Socioeconomic Risk Factors on COVID-19 Death Rate across Continental USA: A Spatial Nonlinear Analysis. Environ. Sci. Pollut. Res. 2021, 28, 6587–6599. [Google Scholar] [CrossRef]
  43. Zhao, H.; Liu, Y.; Yue, L.; Gu, T.; Tang, J.; Wang, Z. Unraveling the Factors behind Self-Reported Trapped Incidents in the Extraordinary Urban Flood Disaster: A Case Study of Zhengzhou City, China. Cities 2024, 155, 105444. [Google Scholar] [CrossRef]
  44. Anselin, L. Spatial Econometrics: Methods and Models; Kluwer Academic Publishers: Boston, MA, USA, 1988; Volume 2, pp. 283–291. [Google Scholar]
  45. Molnar, C. Interpretable Machine Learning; Lulu.com: Morrisville, NC, USA, 2020. [Google Scholar]
  46. Grömping, U. Variable Importance Assessment in Regression: Linear Regression versus Random Forest. Am. Stat. 2009, 63, 308–319. [Google Scholar] [CrossRef]
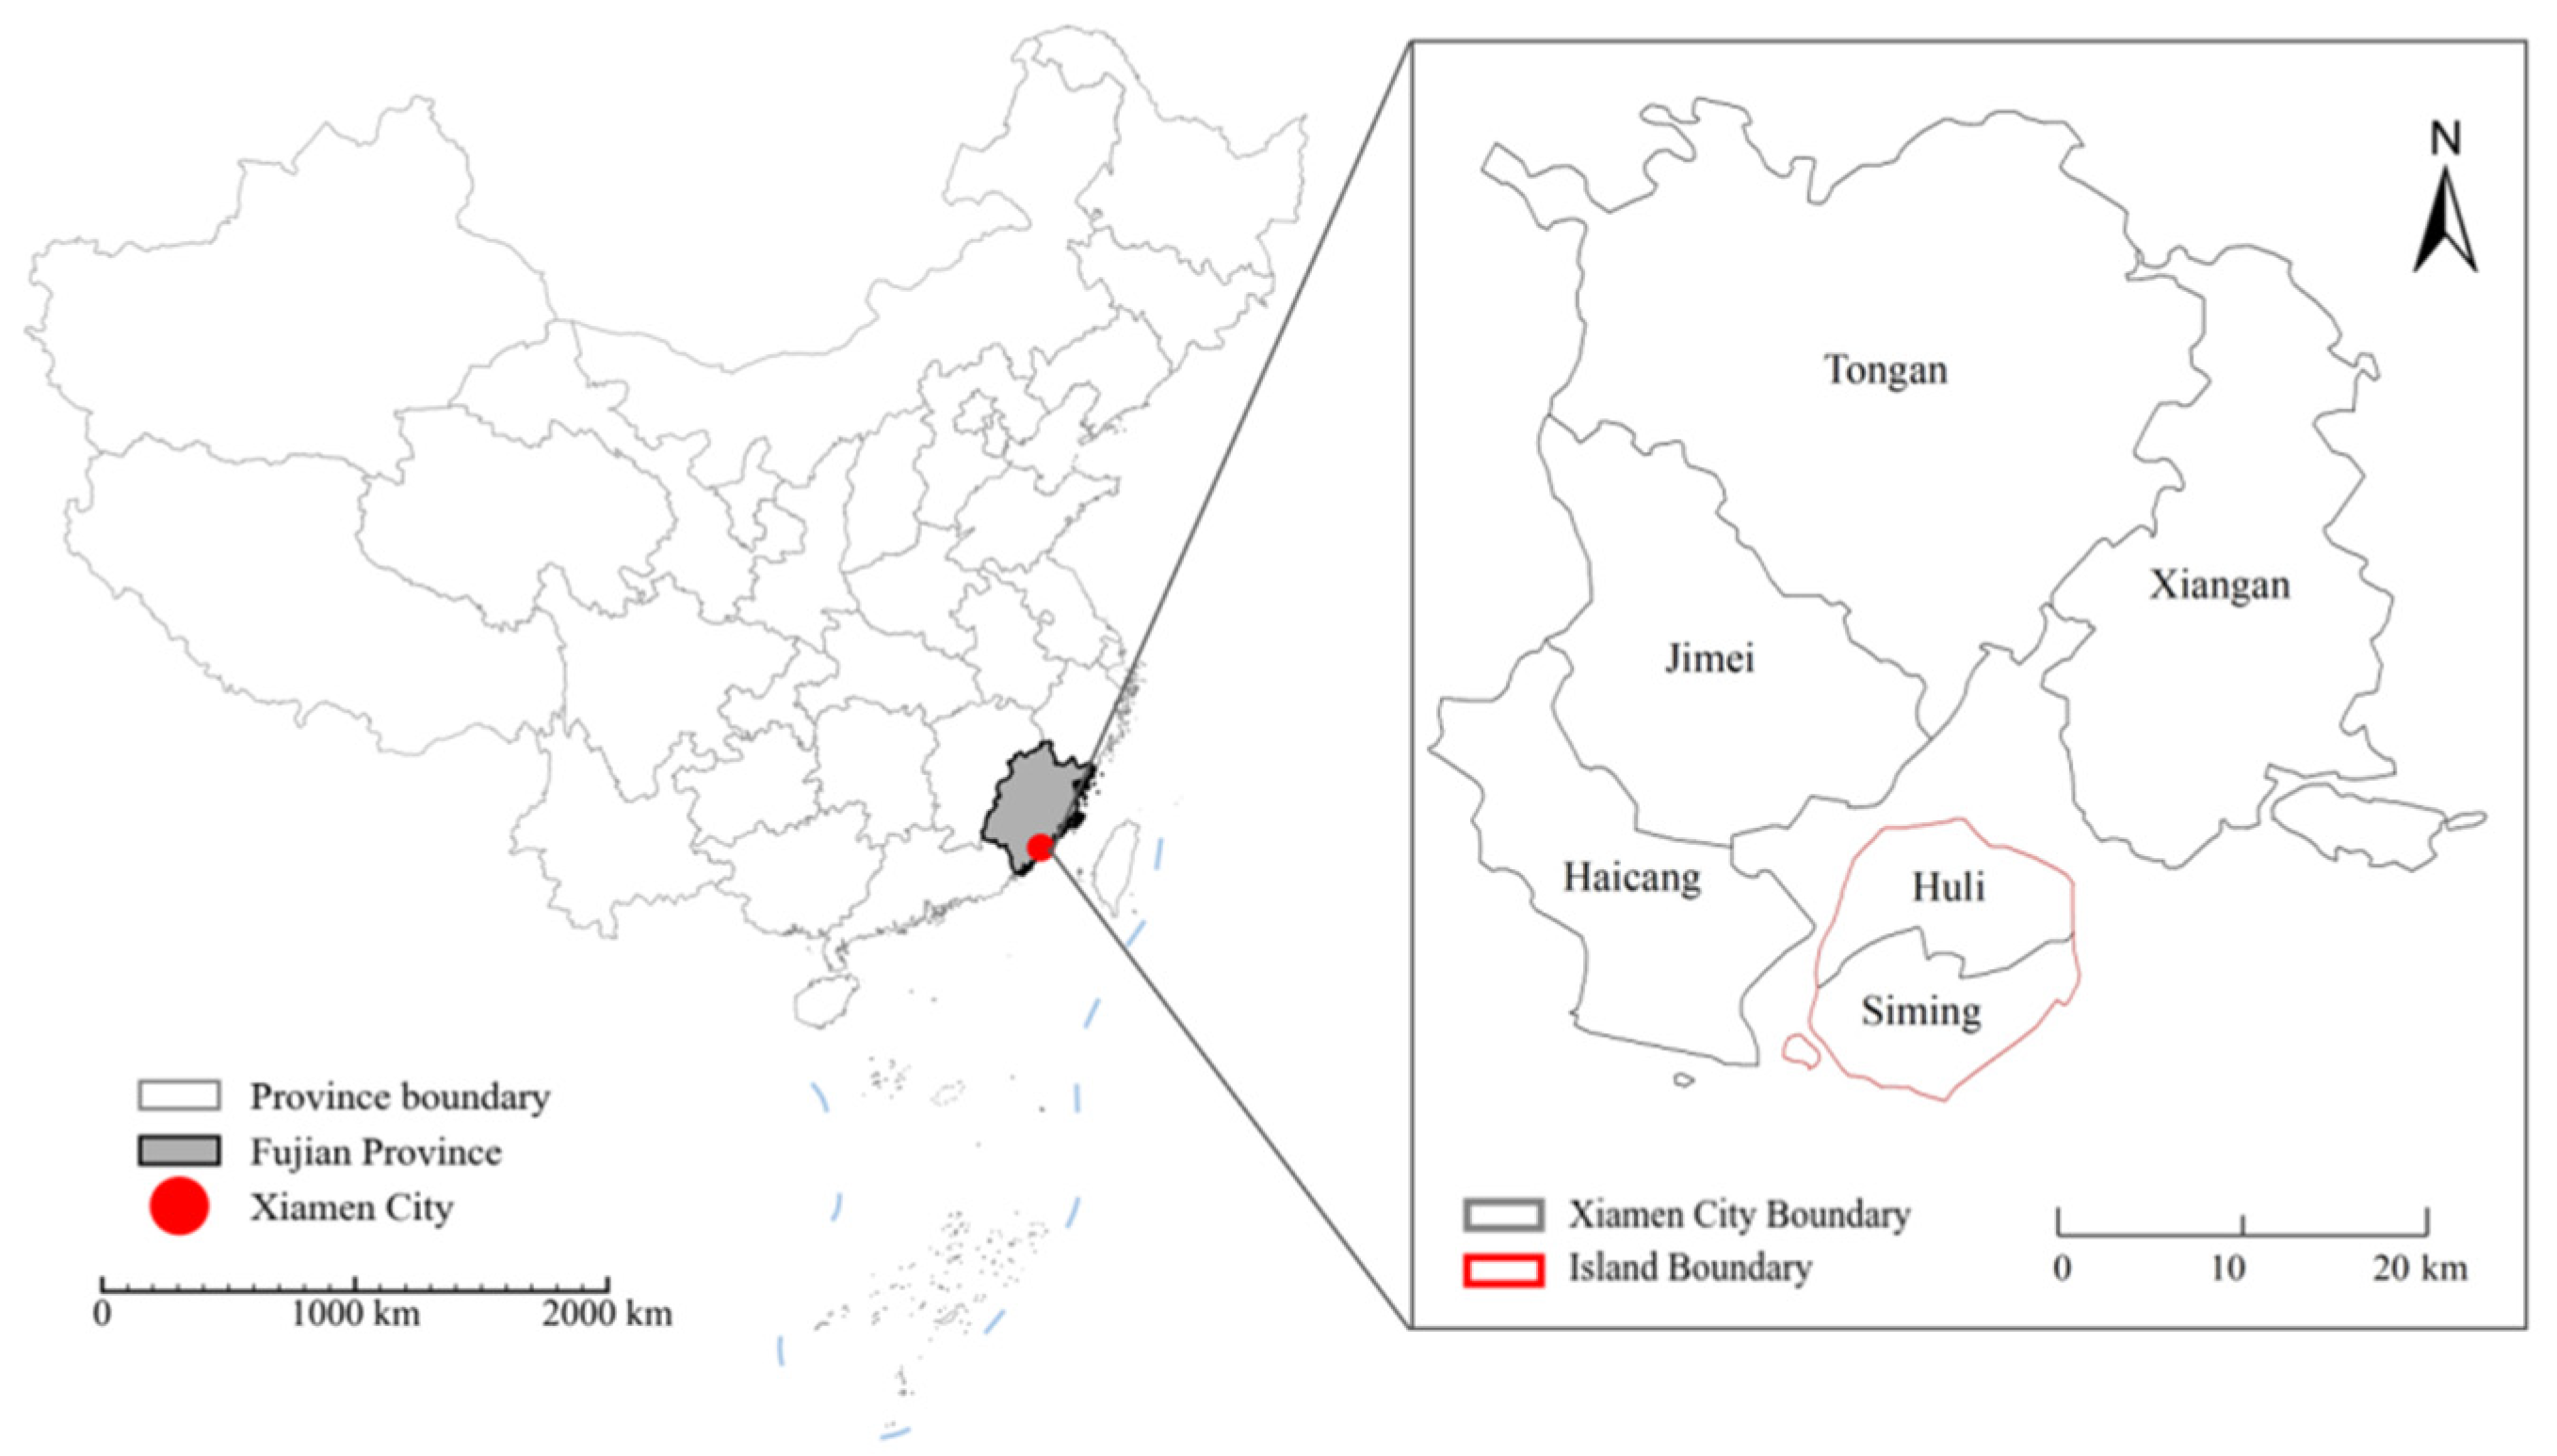
Figure 1. Study Area.
Land 14 02325 g001
Figure 2. VIF values of explanatory variables.
Land 14 02325 g002
Figure 3. Spatial Distribution of HSS Scores. Note: The HSS score represents the community-level average of resident responses on a 5-point scale (1: Very Dissatisfied to 5: Very Satisfied). Thus, a score of 4.3 signifies an average community sentiment between ‘Satisfied’ and ‘Very Satisfied’.
Land 14 02325 g003
Figure 4. Feature importance from RF and GRF models.
Land 14 02325 g004
Figure 5. Partial dependence plot of variables.
Land 14 02325 g005
Figure 6. Spatial distribution of Local R2 of the GRF model.
Land 14 02325 g006
Figure 7. Spatial distribution of dominant factors.
Land 14 02325 g007
Figure 8. Spatial variation in local feature importance at the block scale.
Land 14 02325 g008
Figure 9. Spatial variation in local feature importance at the community scale.
Land 14 02325 g009
Figure 10. Spatial variation in local feature importance at the housing scale.
Land 14 02325 g010
Figure 11. Spatial variation in local feature importance of personal characteristics.
Land 14 02325 g011
Table 1. Presents the descriptive statistics for the variables used in this study.
VariableDescriptionMeanStdMinMax
Explained Variables
SatisfactionComposite satisfaction score3.9720.86315
Explanatory Variables
Block Scale
CulturalPerceived severity of cultural facilities issues0.0810.0870.0000.500
ParkPerceived severity of park facilities issues0.0610.0780.0000.500
ParkingPerceived severity of Parking issues0.1350.1190.0000.500
BusinessPerceived level of business vitality0.3460.0940.1000.500
Community Scale
Elder_CarePerceived severity of elderly care issues0.1070.1500.0000.700
Child_CarePerceived severity of child care issues0.0670.0940.0000.500
KindergartenPerceived severity of kindergarten issues0.0420.0770.0000.600
RetailPerceived severity of retail service issues0.0660.0820.0000.400
EV_ChargingPerceived severity of EV charging issues0.0880.0930.0000.400
Public_SpacePerceived severity of public space issues0.1070.1250.0000.500
Waste_SortingPerceived severity of waste sorting issues0.0350.0660.0000.400
ManagementPerceived severity of community
management issues
0.1020.1530.0000.900
Housing Scale
SafetyPerceived severity of corridor safety issues0.1070.1550.0001.000
KitchenAvailability of a kitchen94.7%01
BathroomAvailability of a bathroom95.4%01
ElevatorAvailability of an elevator 46.4%01
TenureHome-ownership status83.1%01
AffordabilityHousing cost burden1.7250.61413
EraConstruction era of the building1.9570.77213
Personal Characteristics
AgeOrdinal age category2.9970.86916
EducationEducational attainment level3.3180.83615
CareerOccupational prestige score4.2511.73517
IncomeHousehold income bracket2.6471.05216
CohabitantsHousehold size category3.8651.43017
DurationResidence duration in the local area4.7070.75215
Table 2. The performance of the RF and GRF models.
ModelsRMSE 1MAE 2R-Squared
RFtest_data0.0710.0550.320
train_data_cv10 3,40.070 (0.002)0.055 (0.002)0.335 (0.029)
GRFtest_data0.0610.0480.501
train_data_cv10 3,40.060 (0.002)0.048 (0.002)0.514 (0.018)
Note: 1 RMSE: root mean square error; 2 MAE: mean absolute error; 3 values in parentheses represent the standard deviation from 10-fold cross-validation; 4 the training and testing datasets were randomly split in an 80/20% ratio.
Disclaimer/Publisher’s Note: The statements, opinions and data contained in all publications are solely those of the individual author(s) and contributor(s) and not of MDPI and/or the editor(s). MDPI and/or the editor(s) disclaim responsibility for any injury to people or property resulting from any ideas, methods, instructions or products referred to in the content.