From Perception to Behavior: Exploring the Impact Mechanism of Street Built Environment on Mobile Physical Activity Using Multi-Source Data and Explainable Machine Learning
Abstract
1. Introduction
2. Materials and Methods
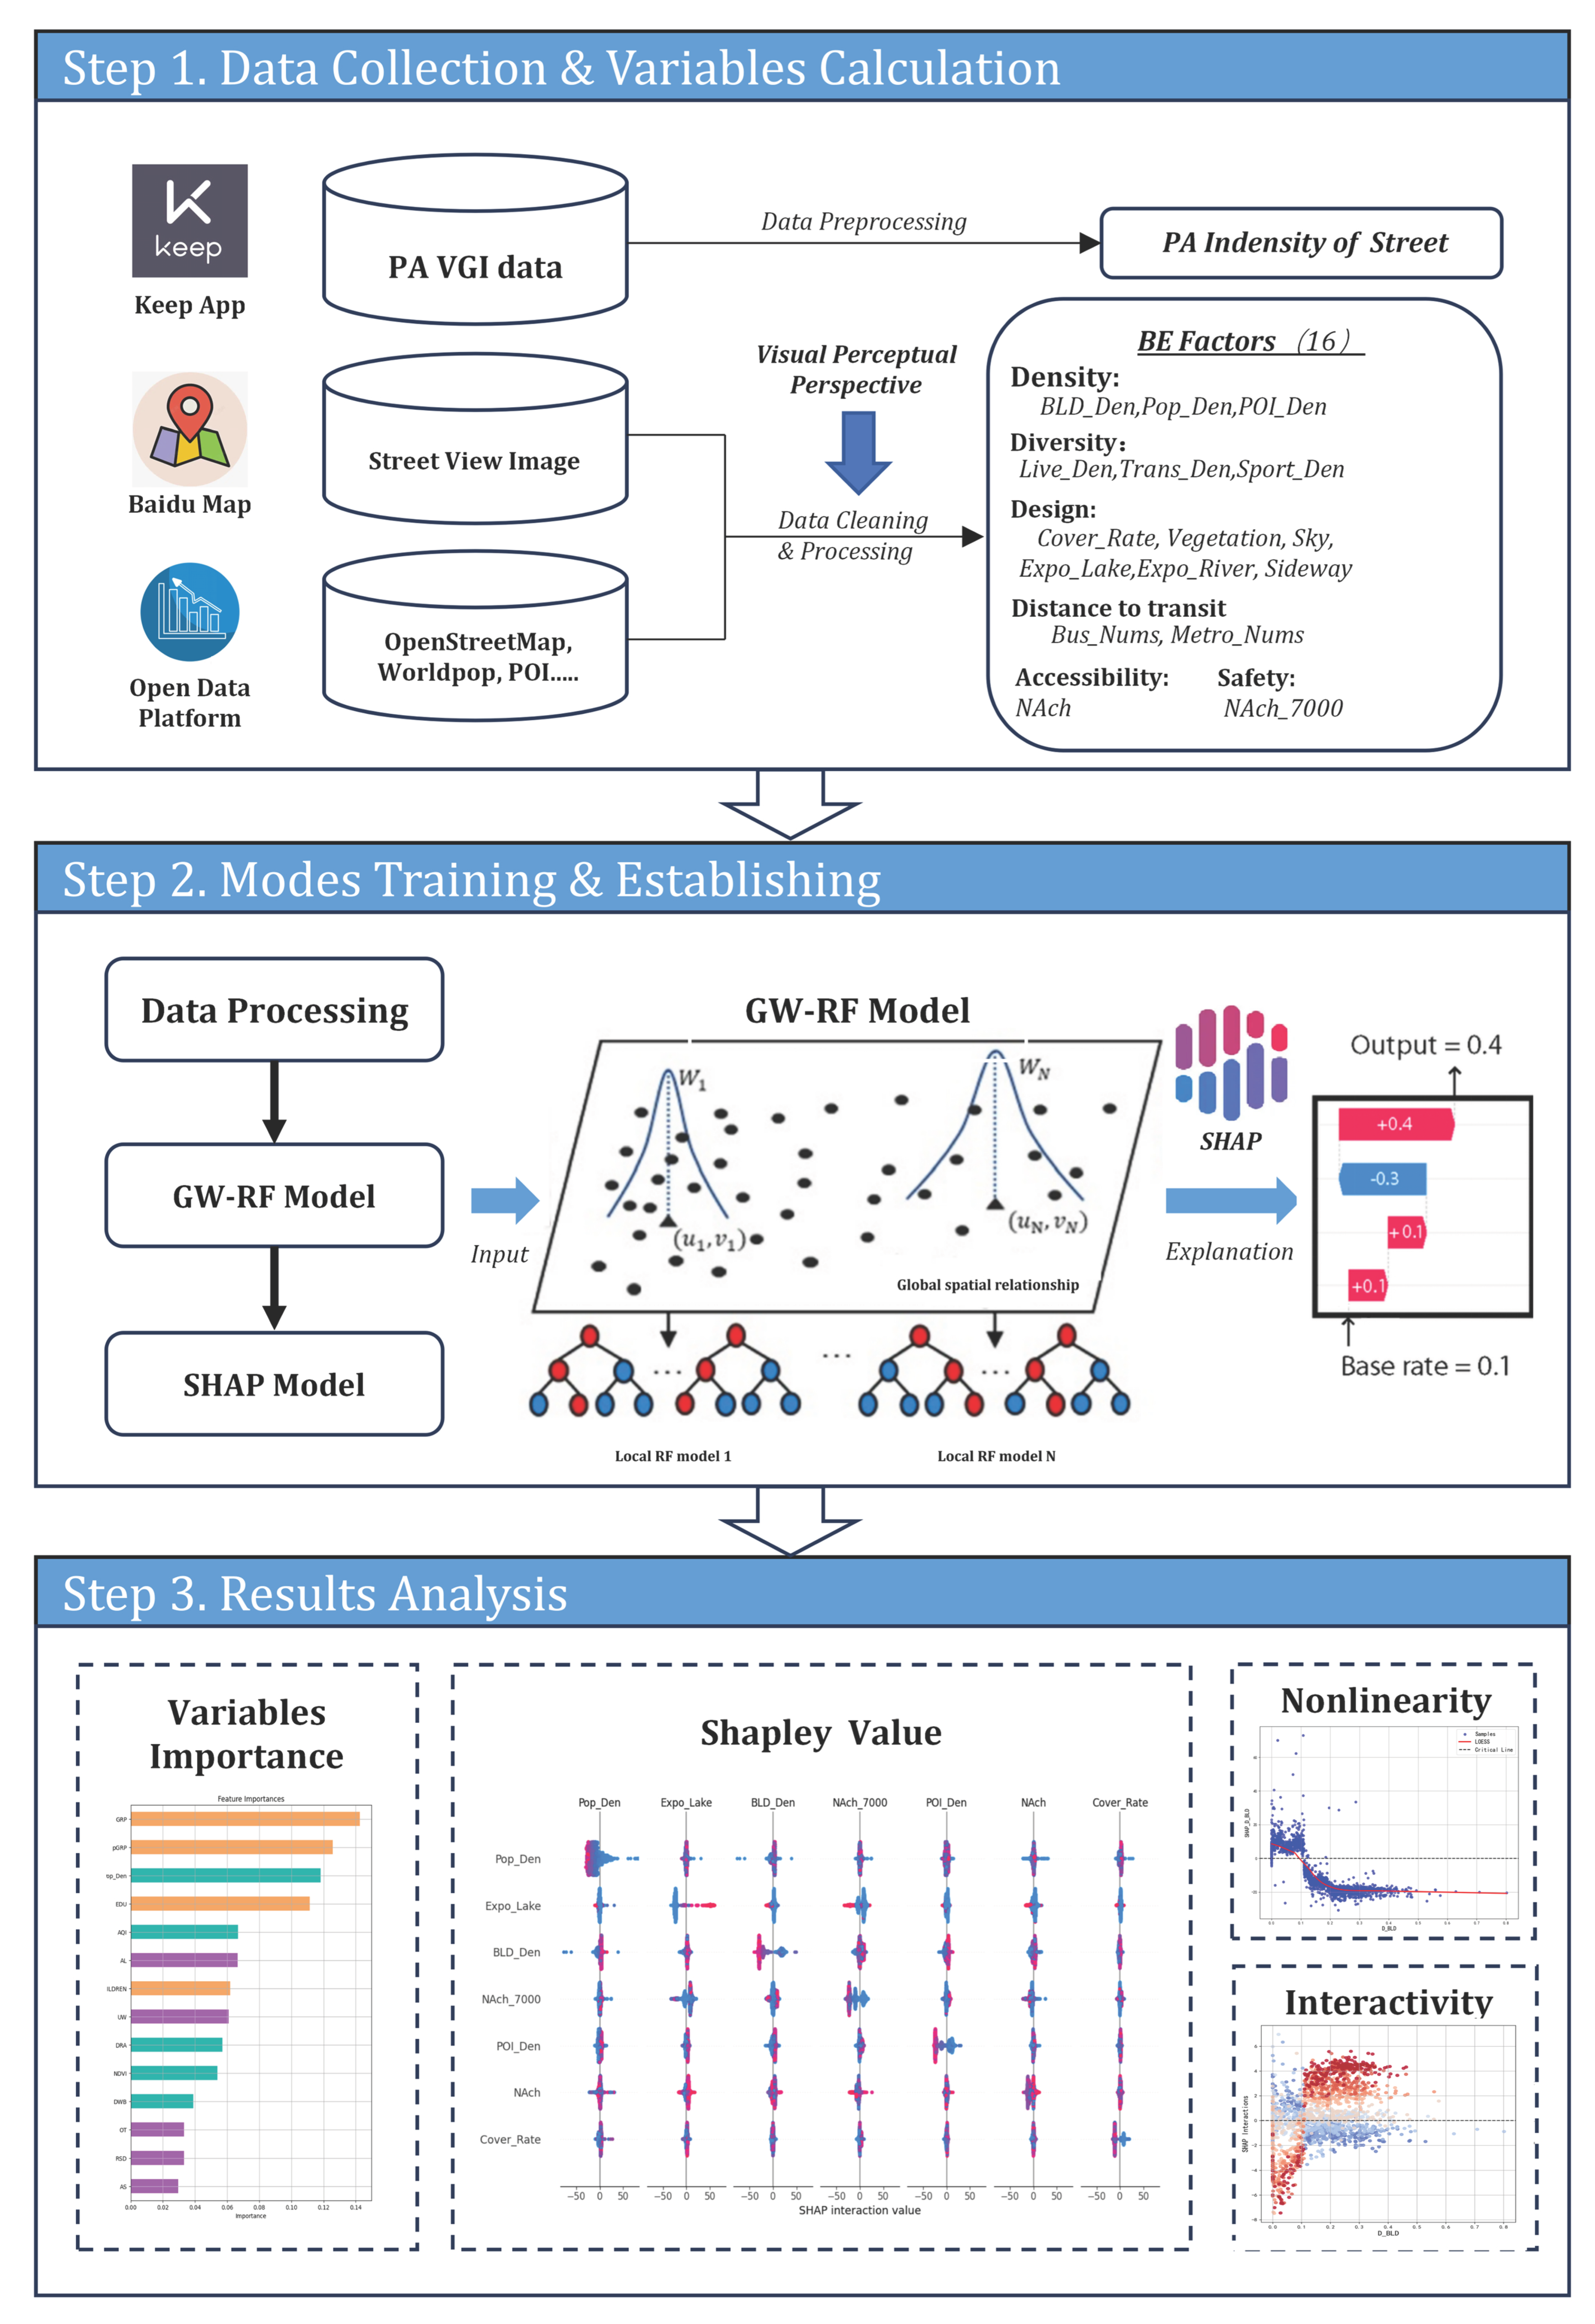
2.1. Framework
- (1)
- Data processing and variable calculation, which includes improving the traditional “5Ds” built environment indicator system from a perceptual perspective to form the built environment variable set used in this study;
- (2)
- Model training and result interpretation, which involves the construction and interpretation of the GW-RF machine learning regression model, balancing the “perception-behavior” logical framework with the “spatial heterogeneity processing ability”;
- (3)
- Result analysis, which includes variable importance, direction of effects, nonlinear effects, variable interactions, and spatial interpretation of the effects of some variables.
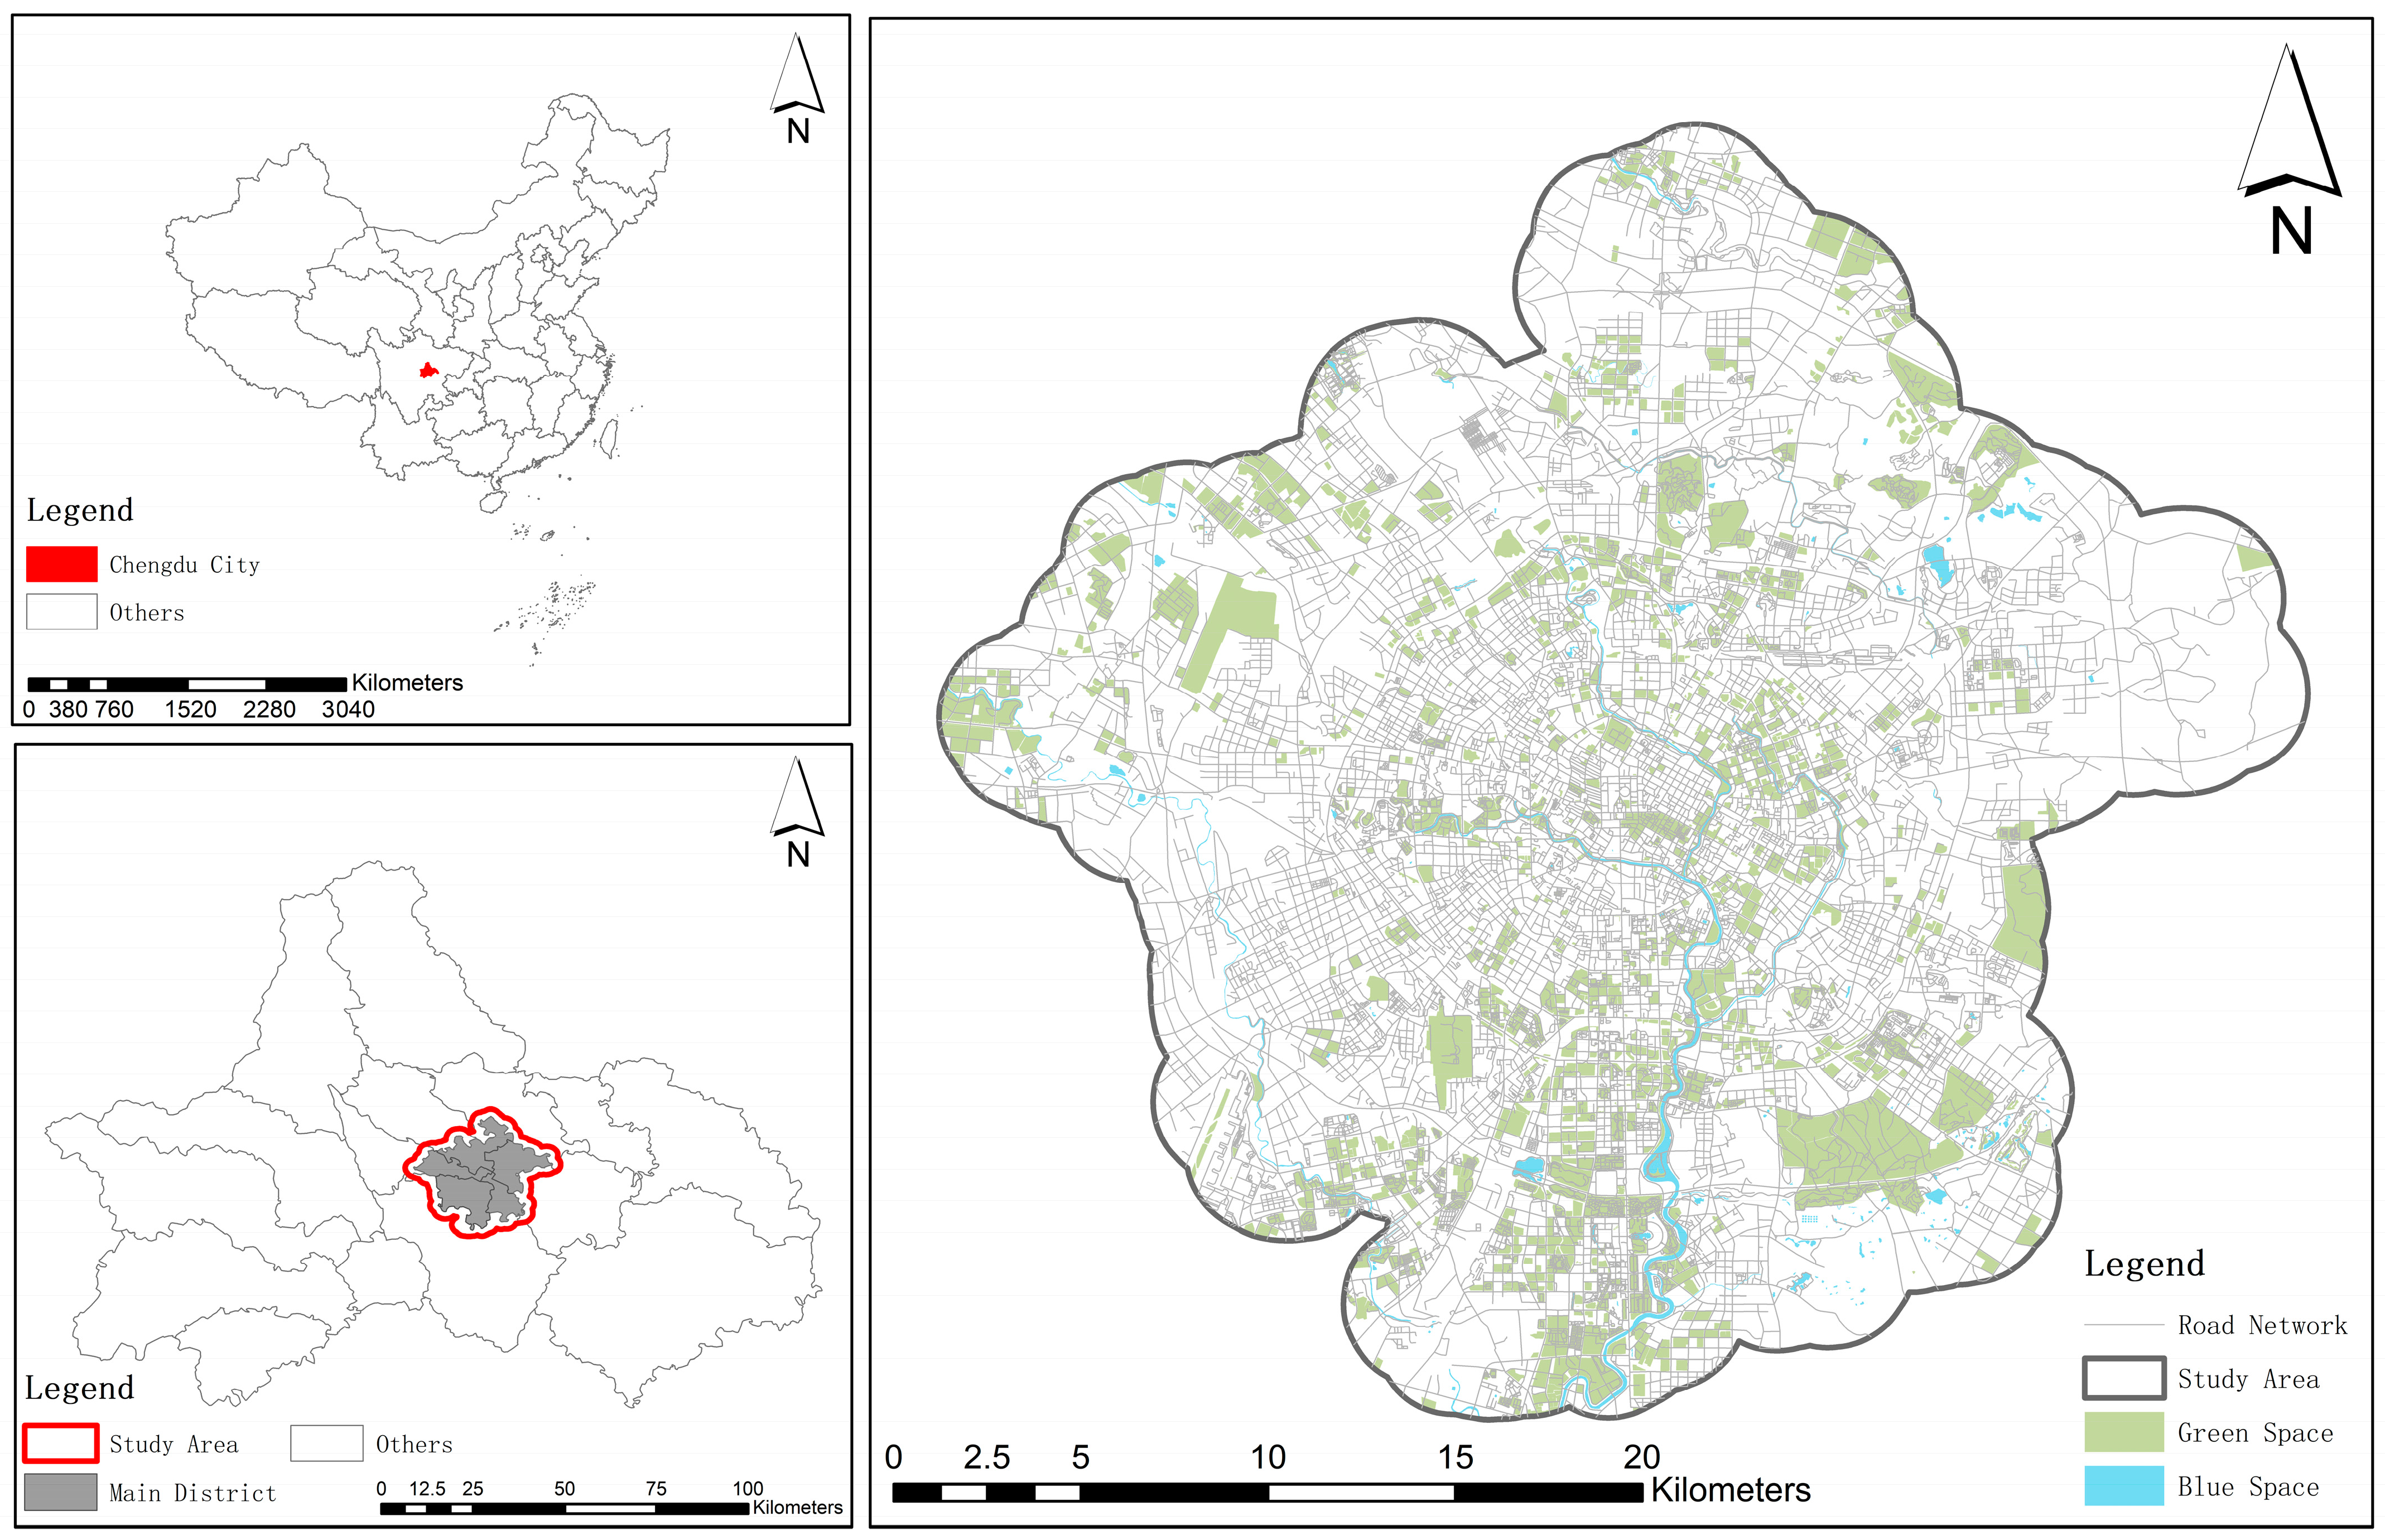
2.2. Study Area
2.3. Datasets
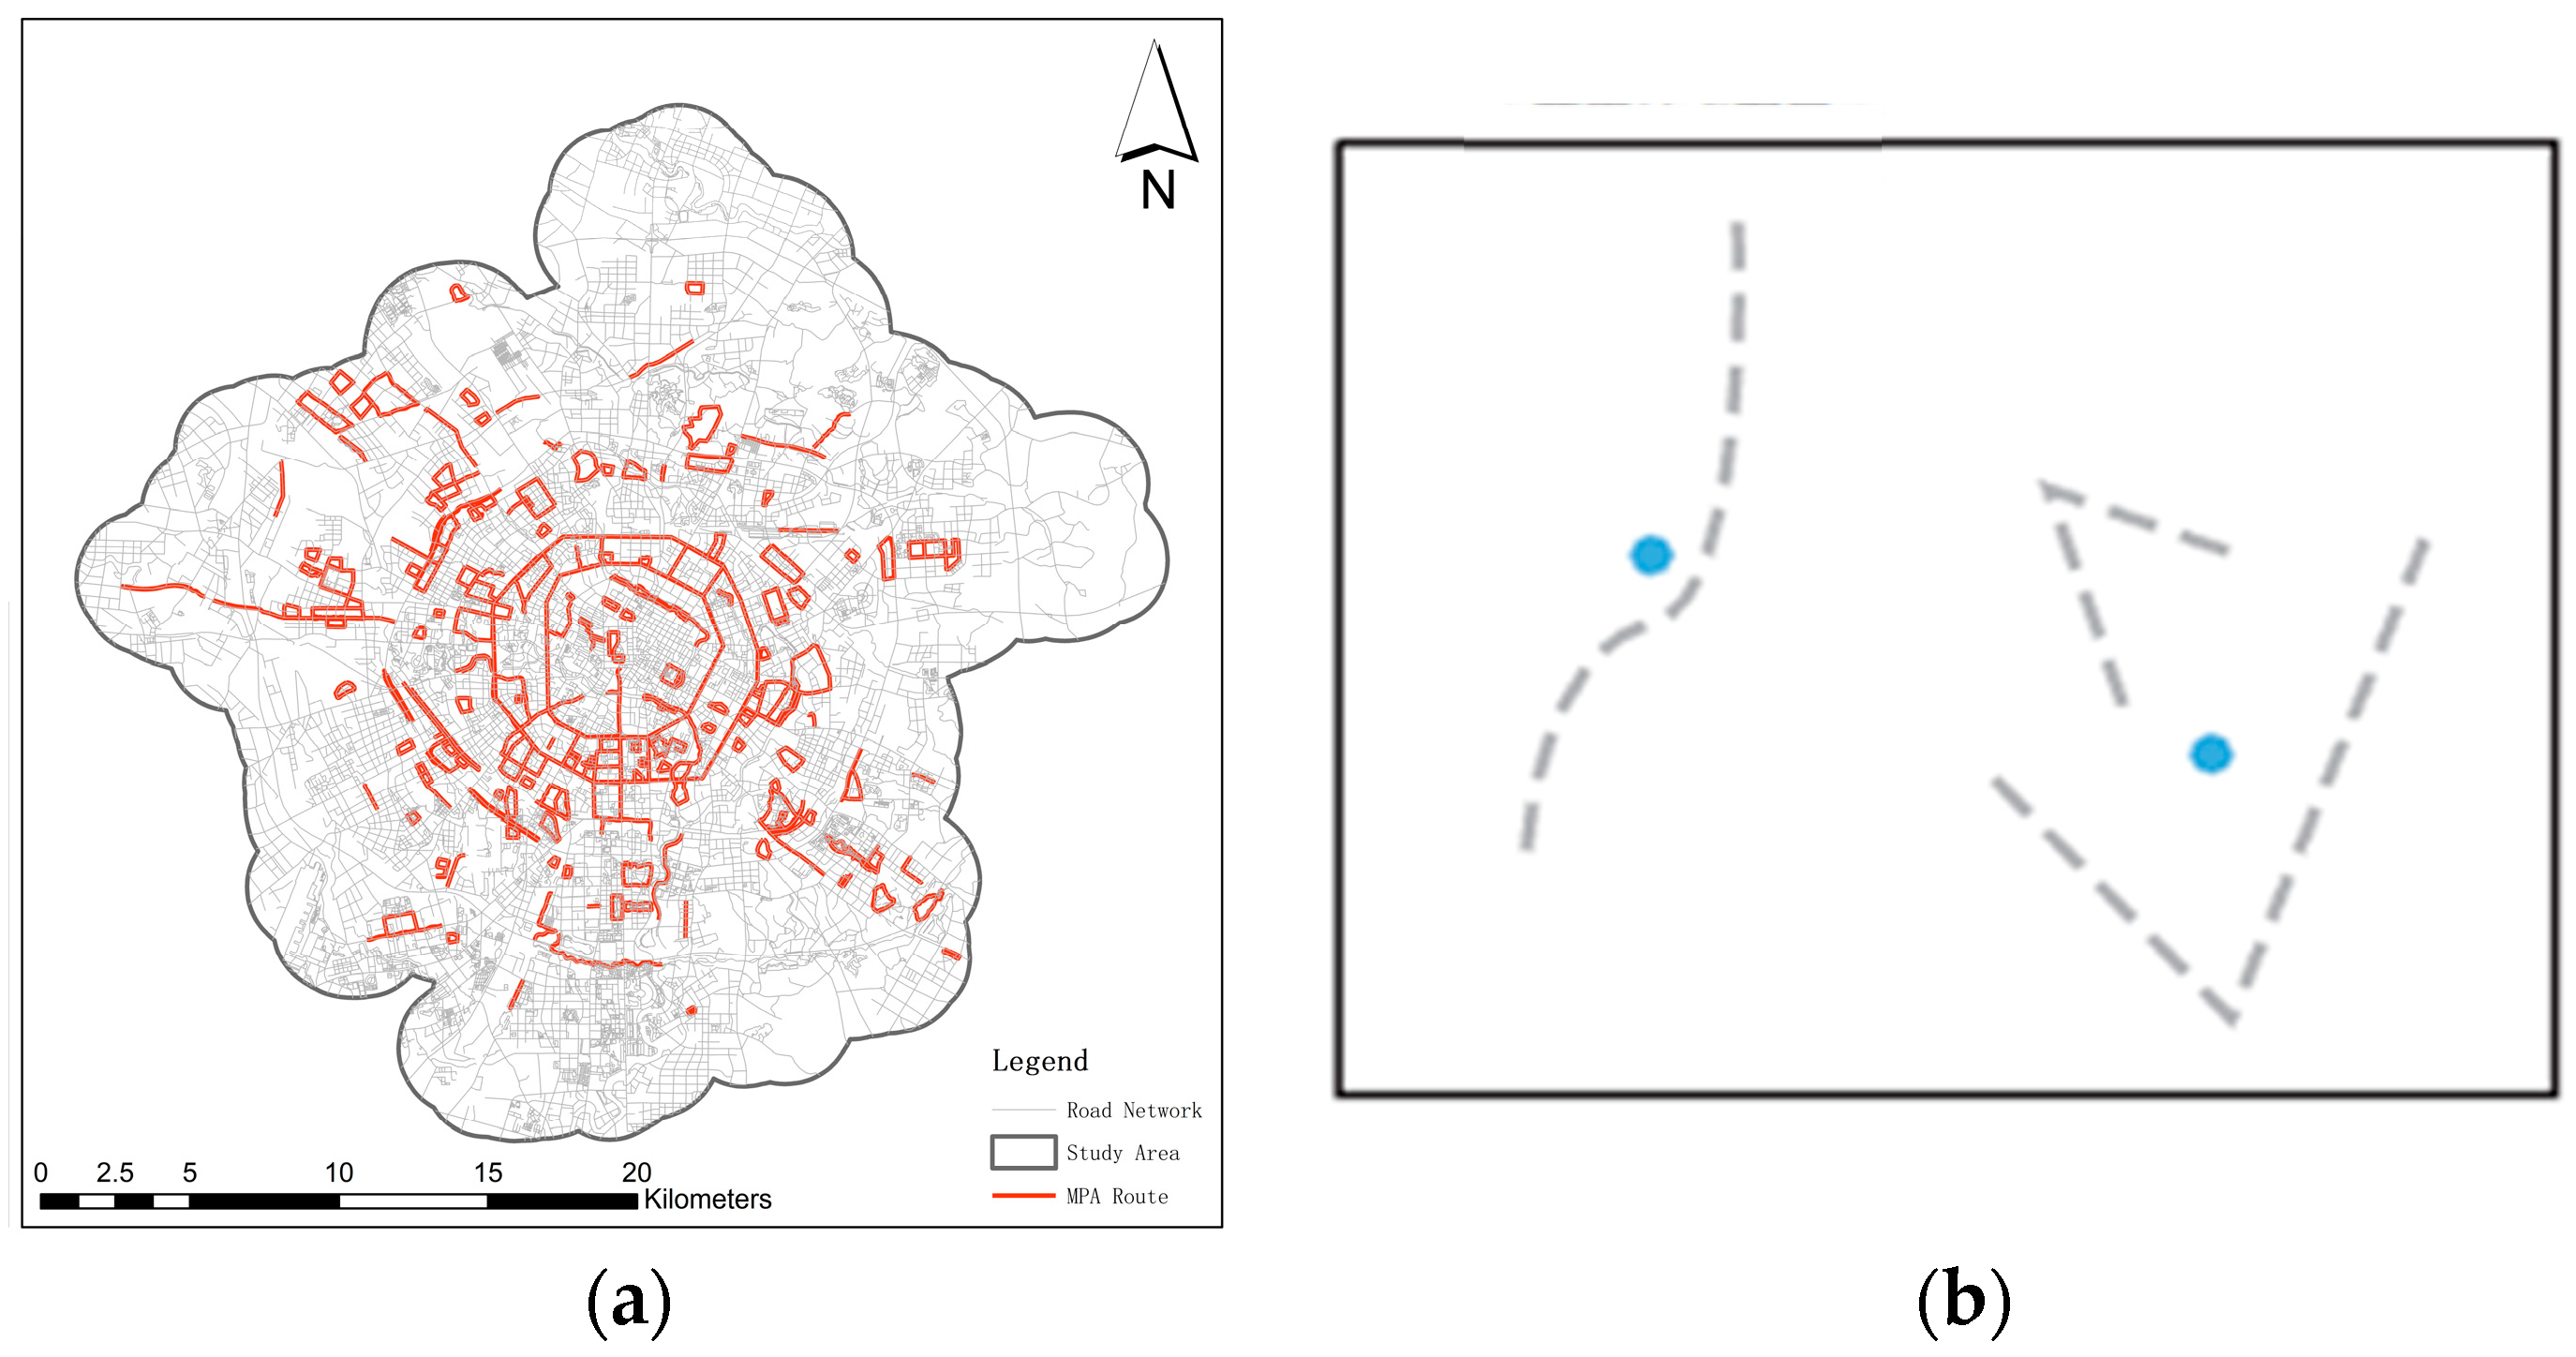
2.3.1. PA Data
2.3.2. Multi-Source Urban Data
2.4. Variables
2.4.1. Dependent Variables
2.4.2. Environmental Variables
- ①
- Density
- ②
- Diversity
- ③
- Design
- Street network structure: Including road intersection density, street network density, etc.
- Environmental design: Such as building interface continuity, street width-to-height ratio, blue-green landscapes, etc.
- Facility dimension: Including pedestrian facilities, accessibility facilities, etc.
- ④
- Distance to Transit
- ⑤
- Accessibility
- ⑥
- Safety
2.5. Methods
2.5.1. GW-RF Model
2.5.2. SHAP Model
3. Results
3.1. Model Performance
3.2. Model Results
3.2.1. Variables’ Importance and SHAP Value
3.2.2. Nonlinear and Threshold Effect of BE Variables
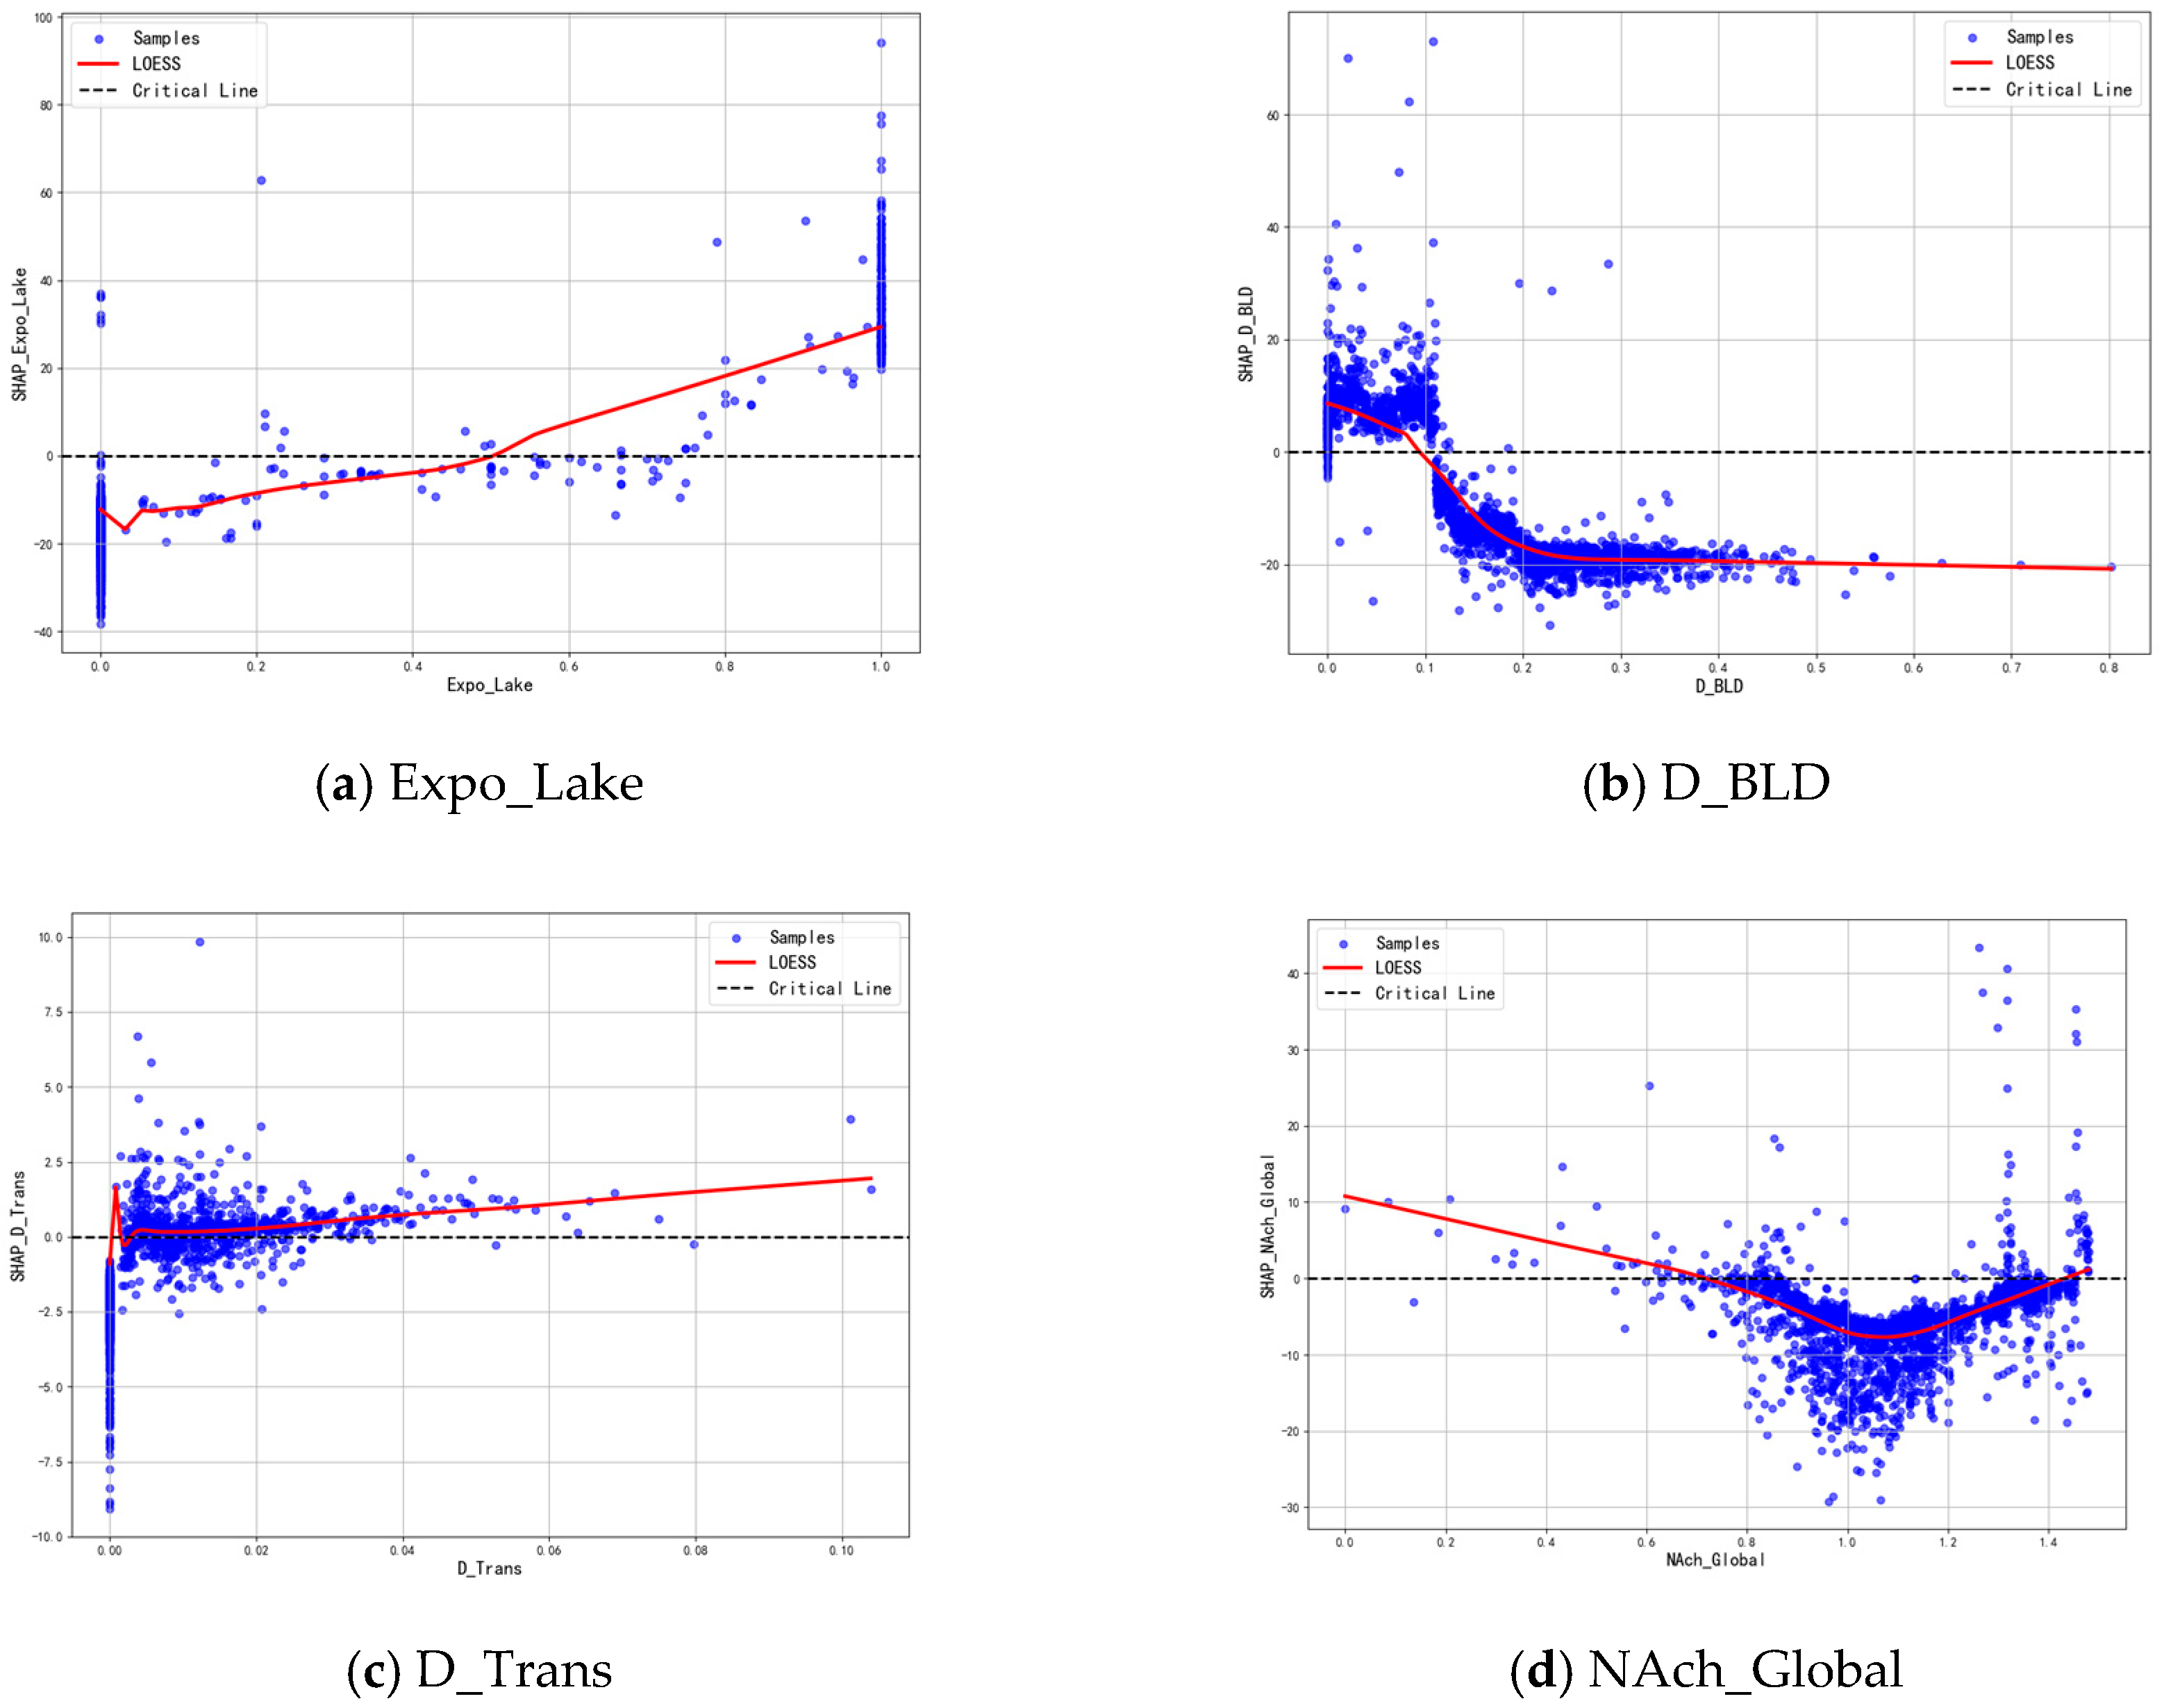
- (1)
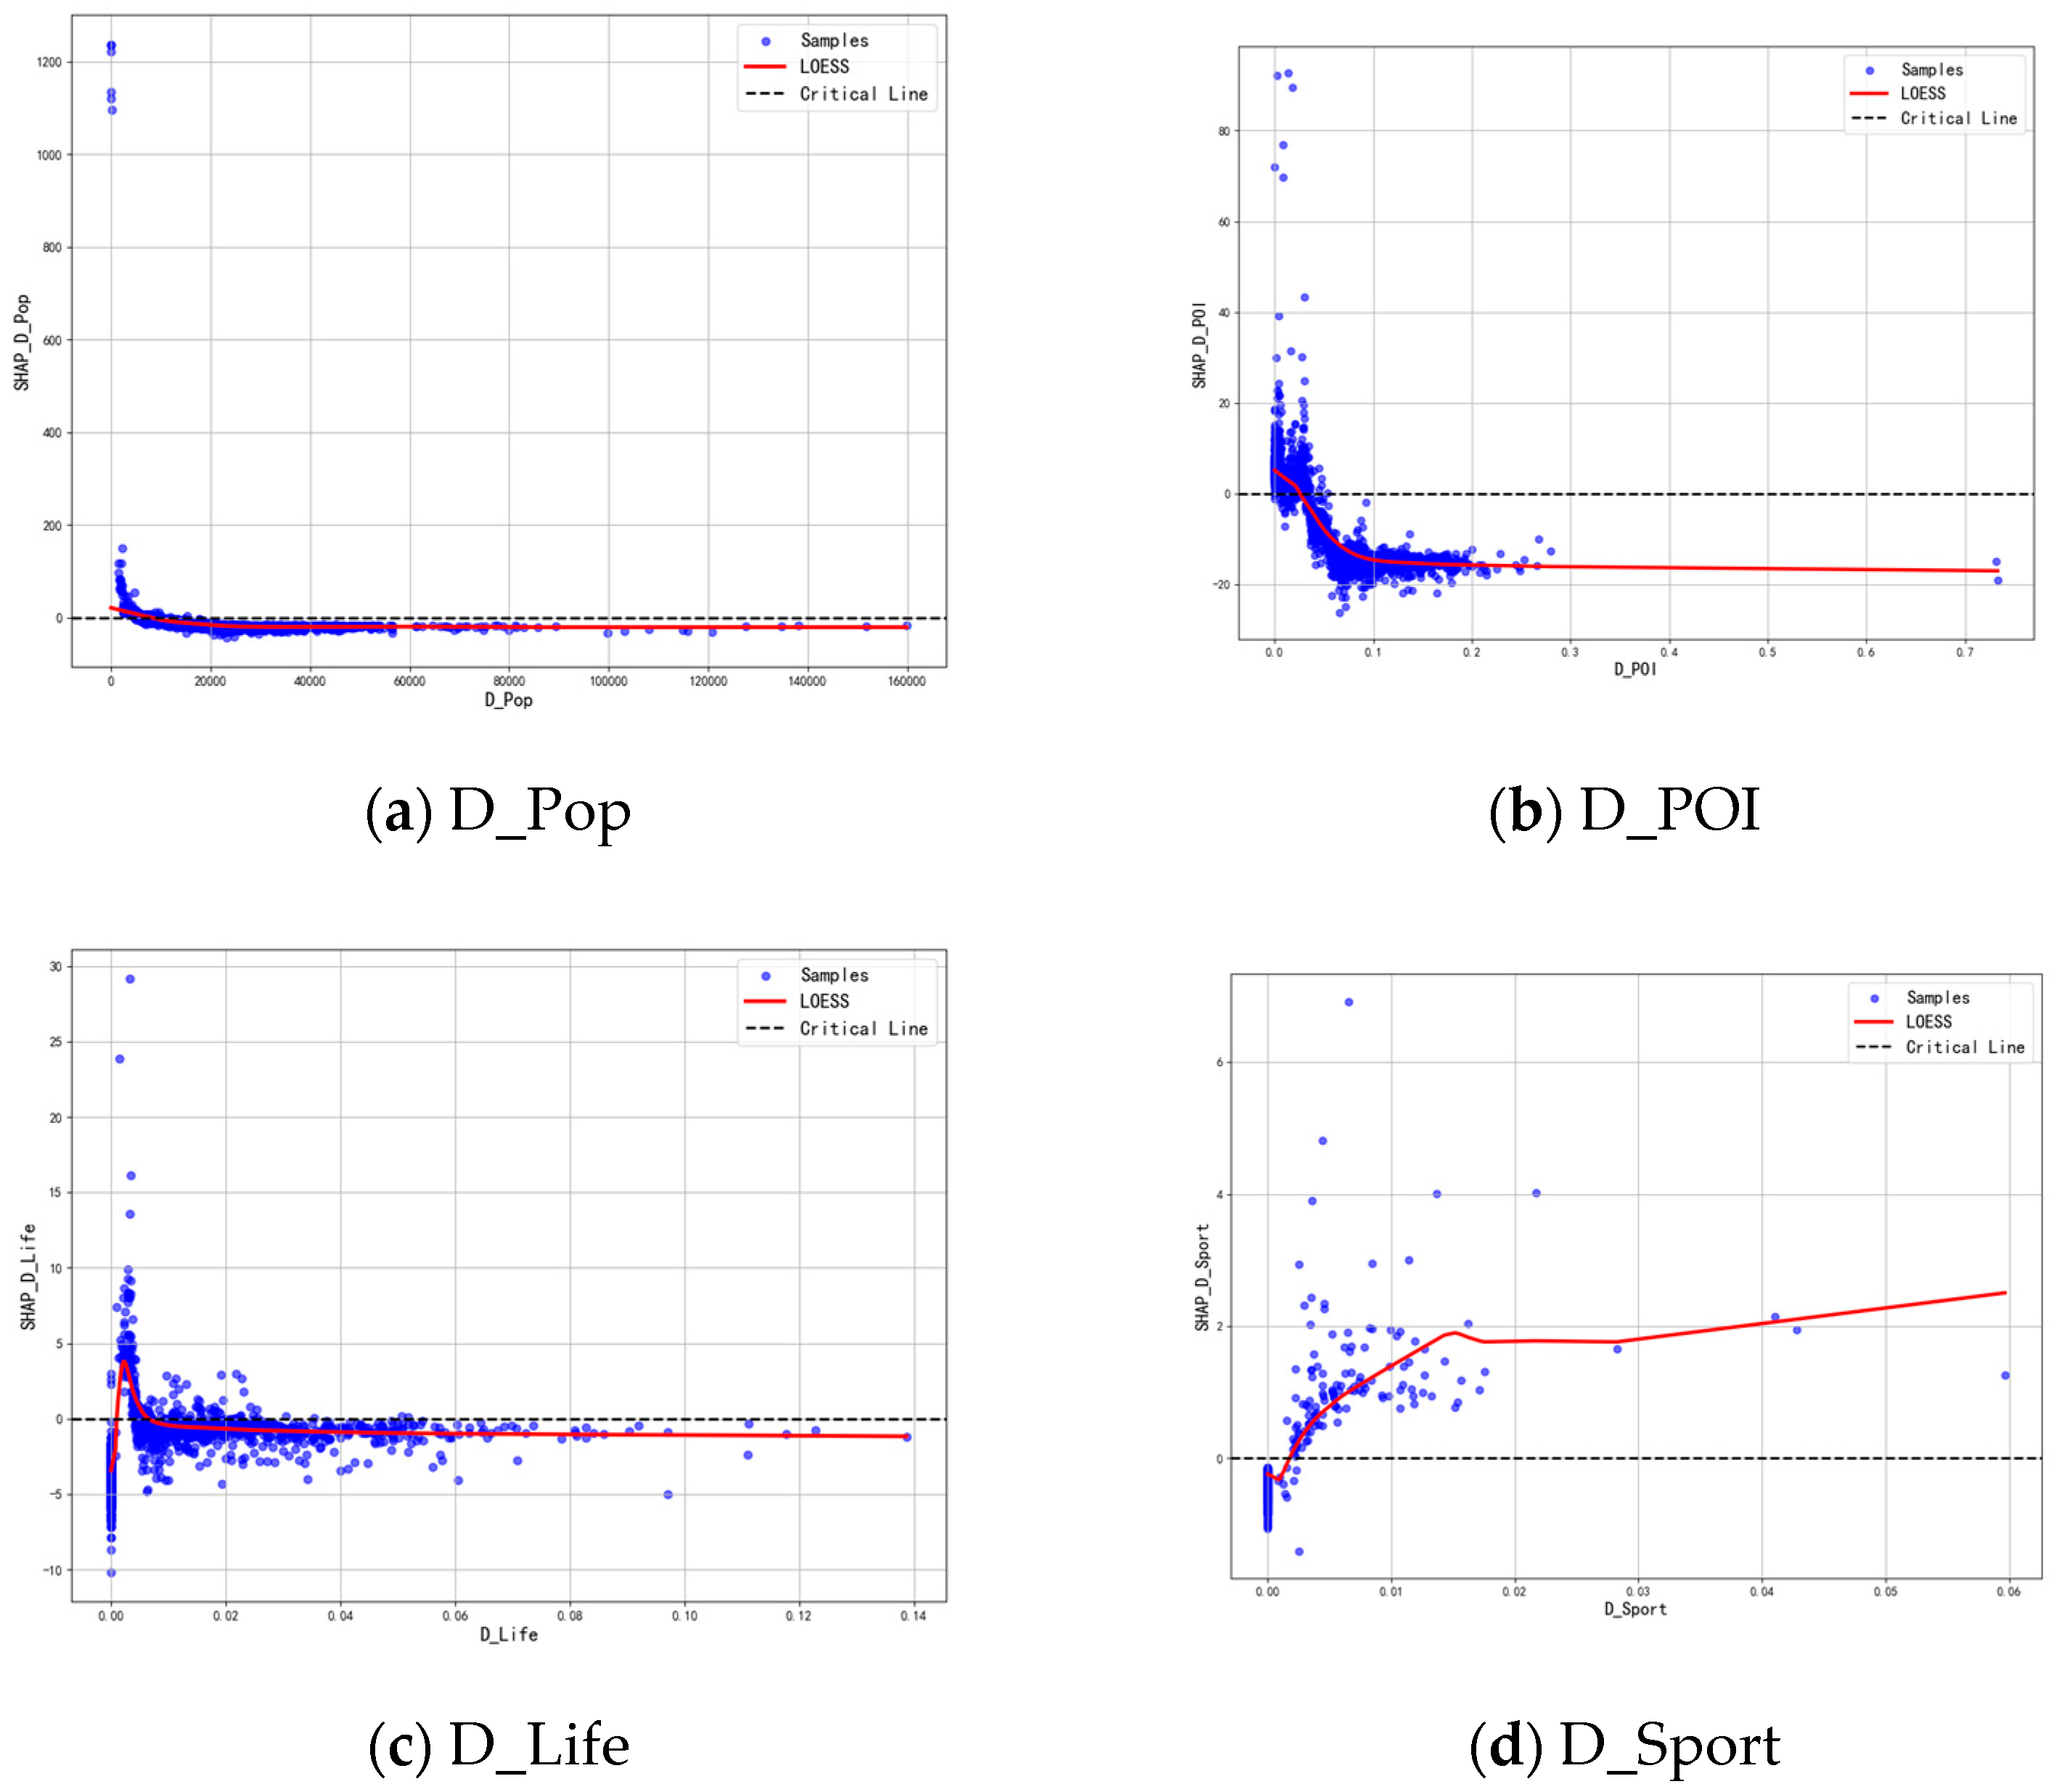
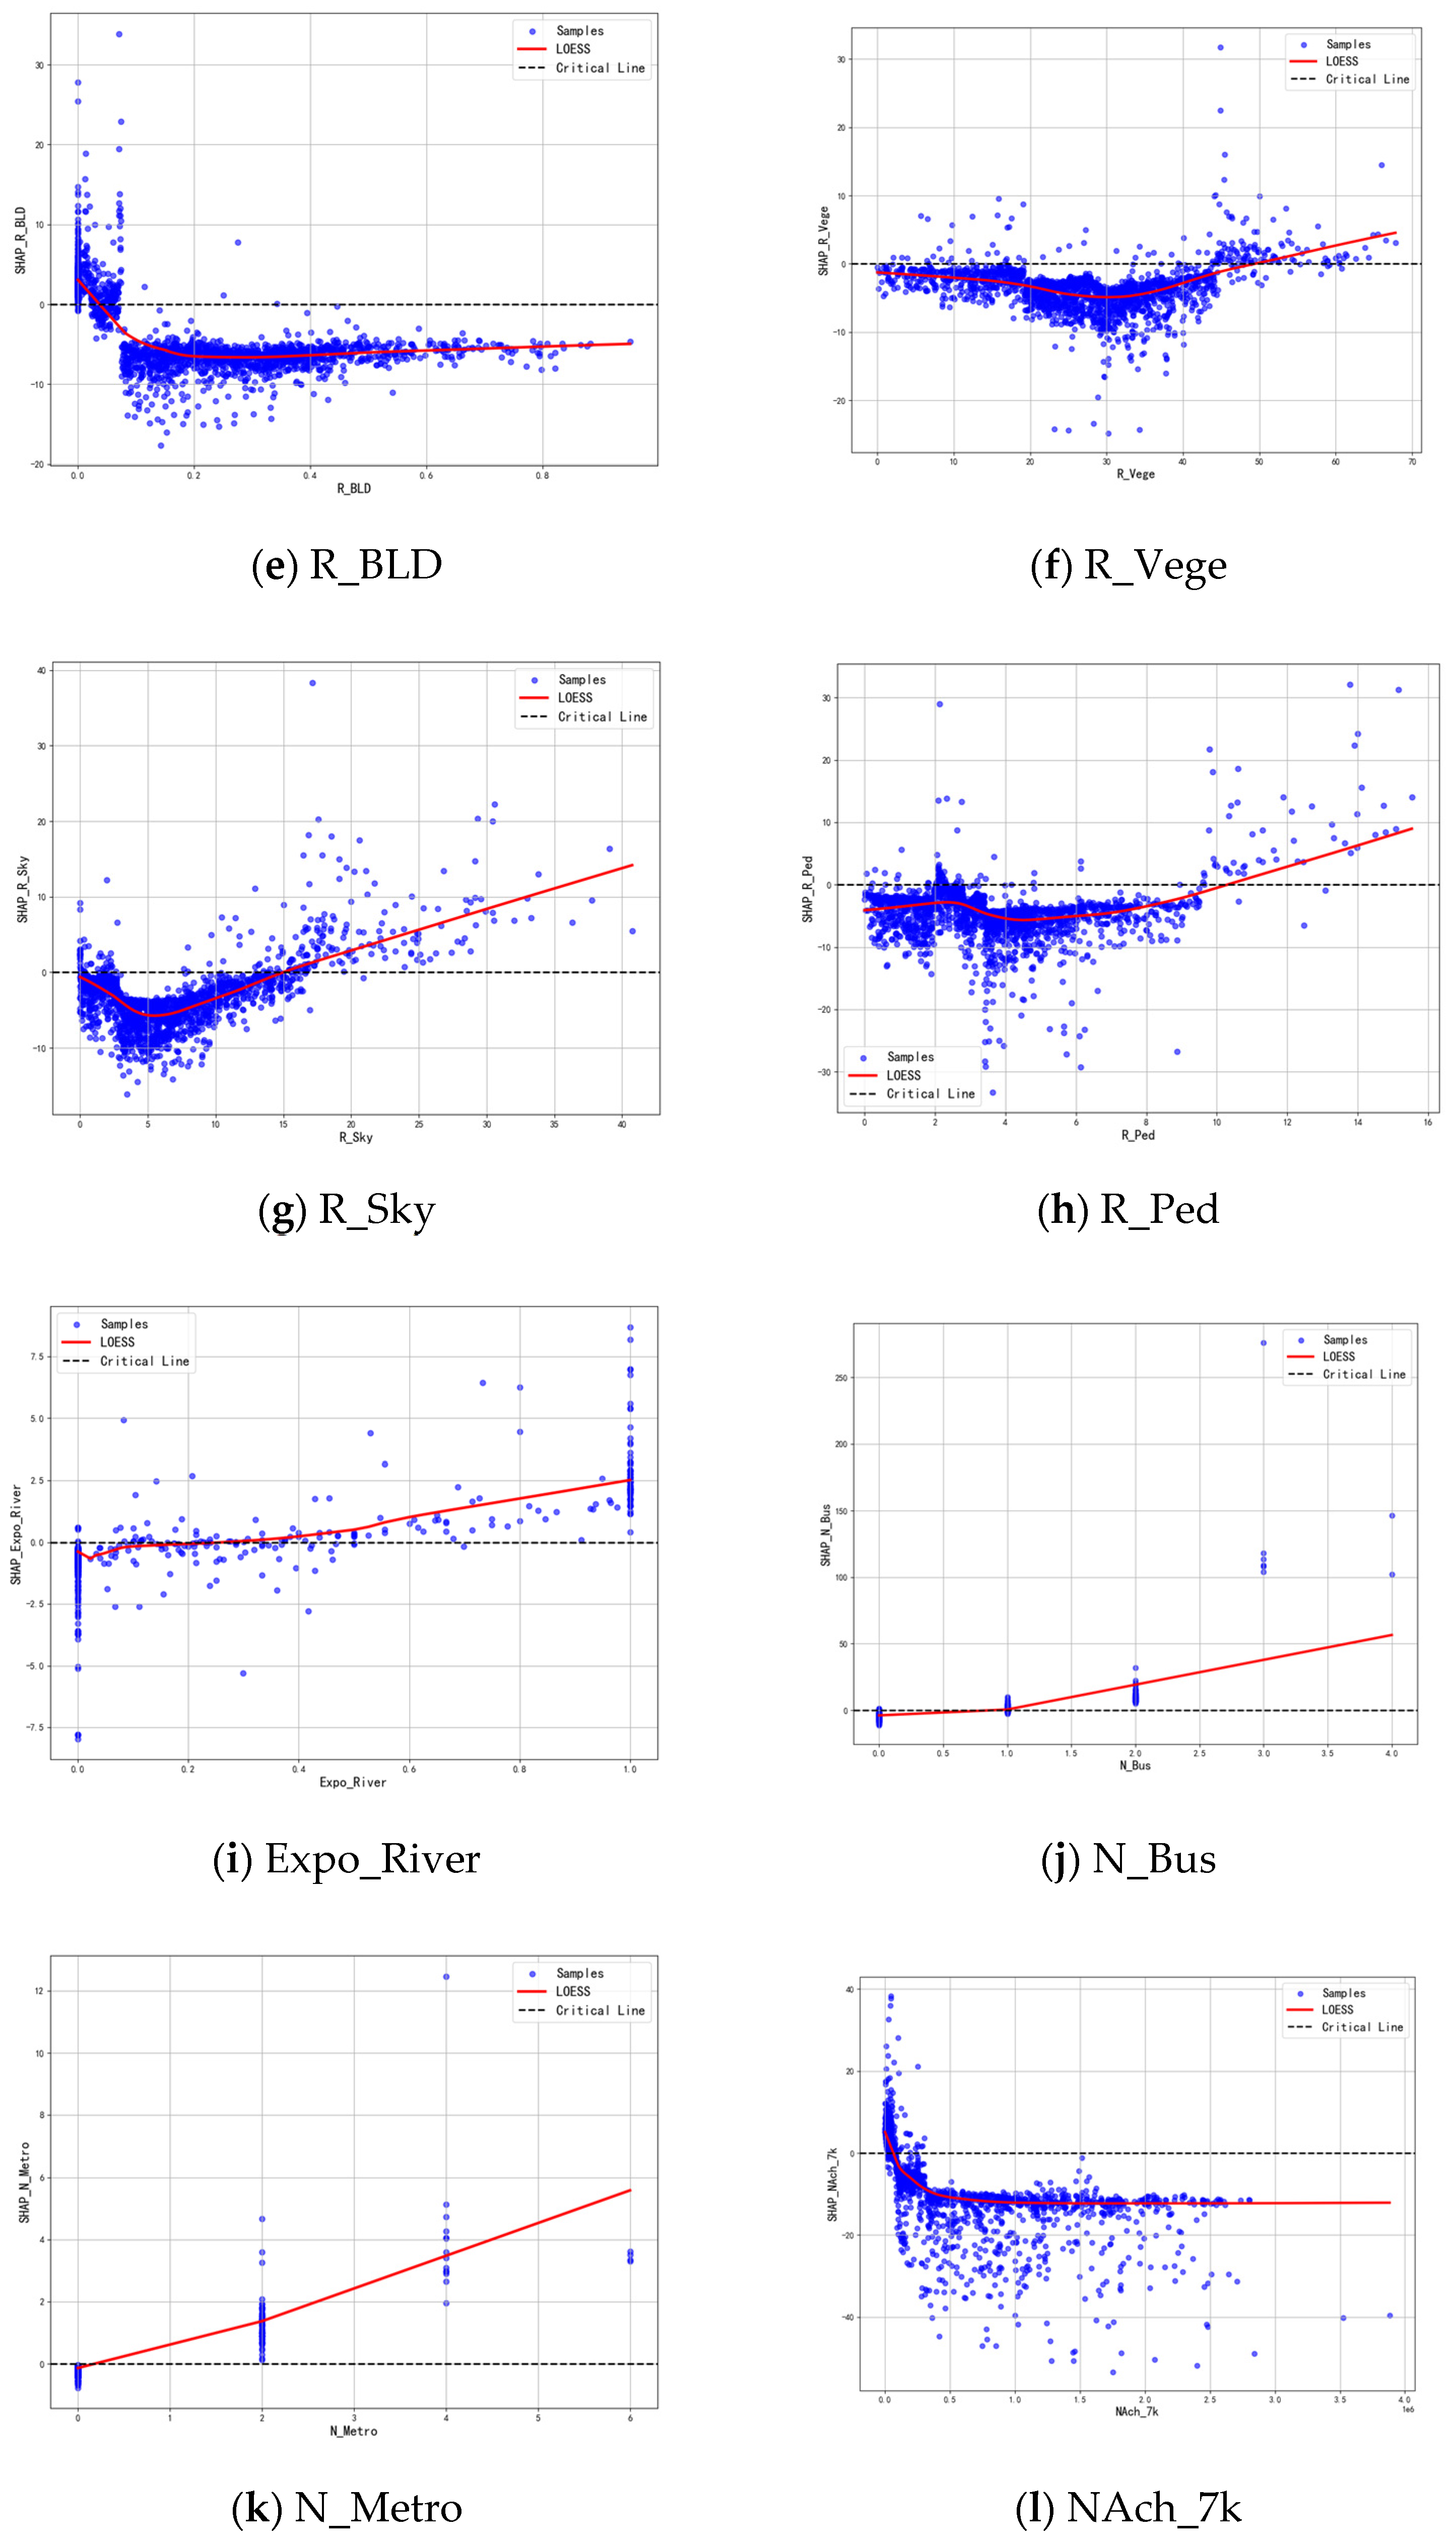
- Determine whether the variable’s contribution to MPA is “Promotion” or “Inhibition” based on the y-axis values: a y-value of 0 indicates no contribution to MPA; y > 0 indicates a promotional contribution to MPA; and y < 0 indicates an inhibitory effect on MPA.
- (2)
- Further judge the changing trend of this influence by observing the slope variation in the fitted curve (e.g., “Positive”, “Negative”, and “Neutral”).
- (1)
- A nearly linear influence pattern, as shown in Figure 8a;
- (2)
- An “L-shaped” pattern characterized by “initial promotion followed by inhibition, with the inhibitory effect stabilizing after exceeding a certain threshold”, as shown in Figure 8b;
- (3)
- An “inverted L-shaped” pattern featured by “initial inhibition followed by promotion, with the promotional effect stabilizing or slowly enhancing after exceeding a certain threshold”, as shown in Figure 8c;
- (4)
- An “V-shaped” pattern where “the slope of the curve shifts from Negative to Positive”, as shown in Figure 8d.
3.2.3. Main Effects and Interaction Effects of BE Variables
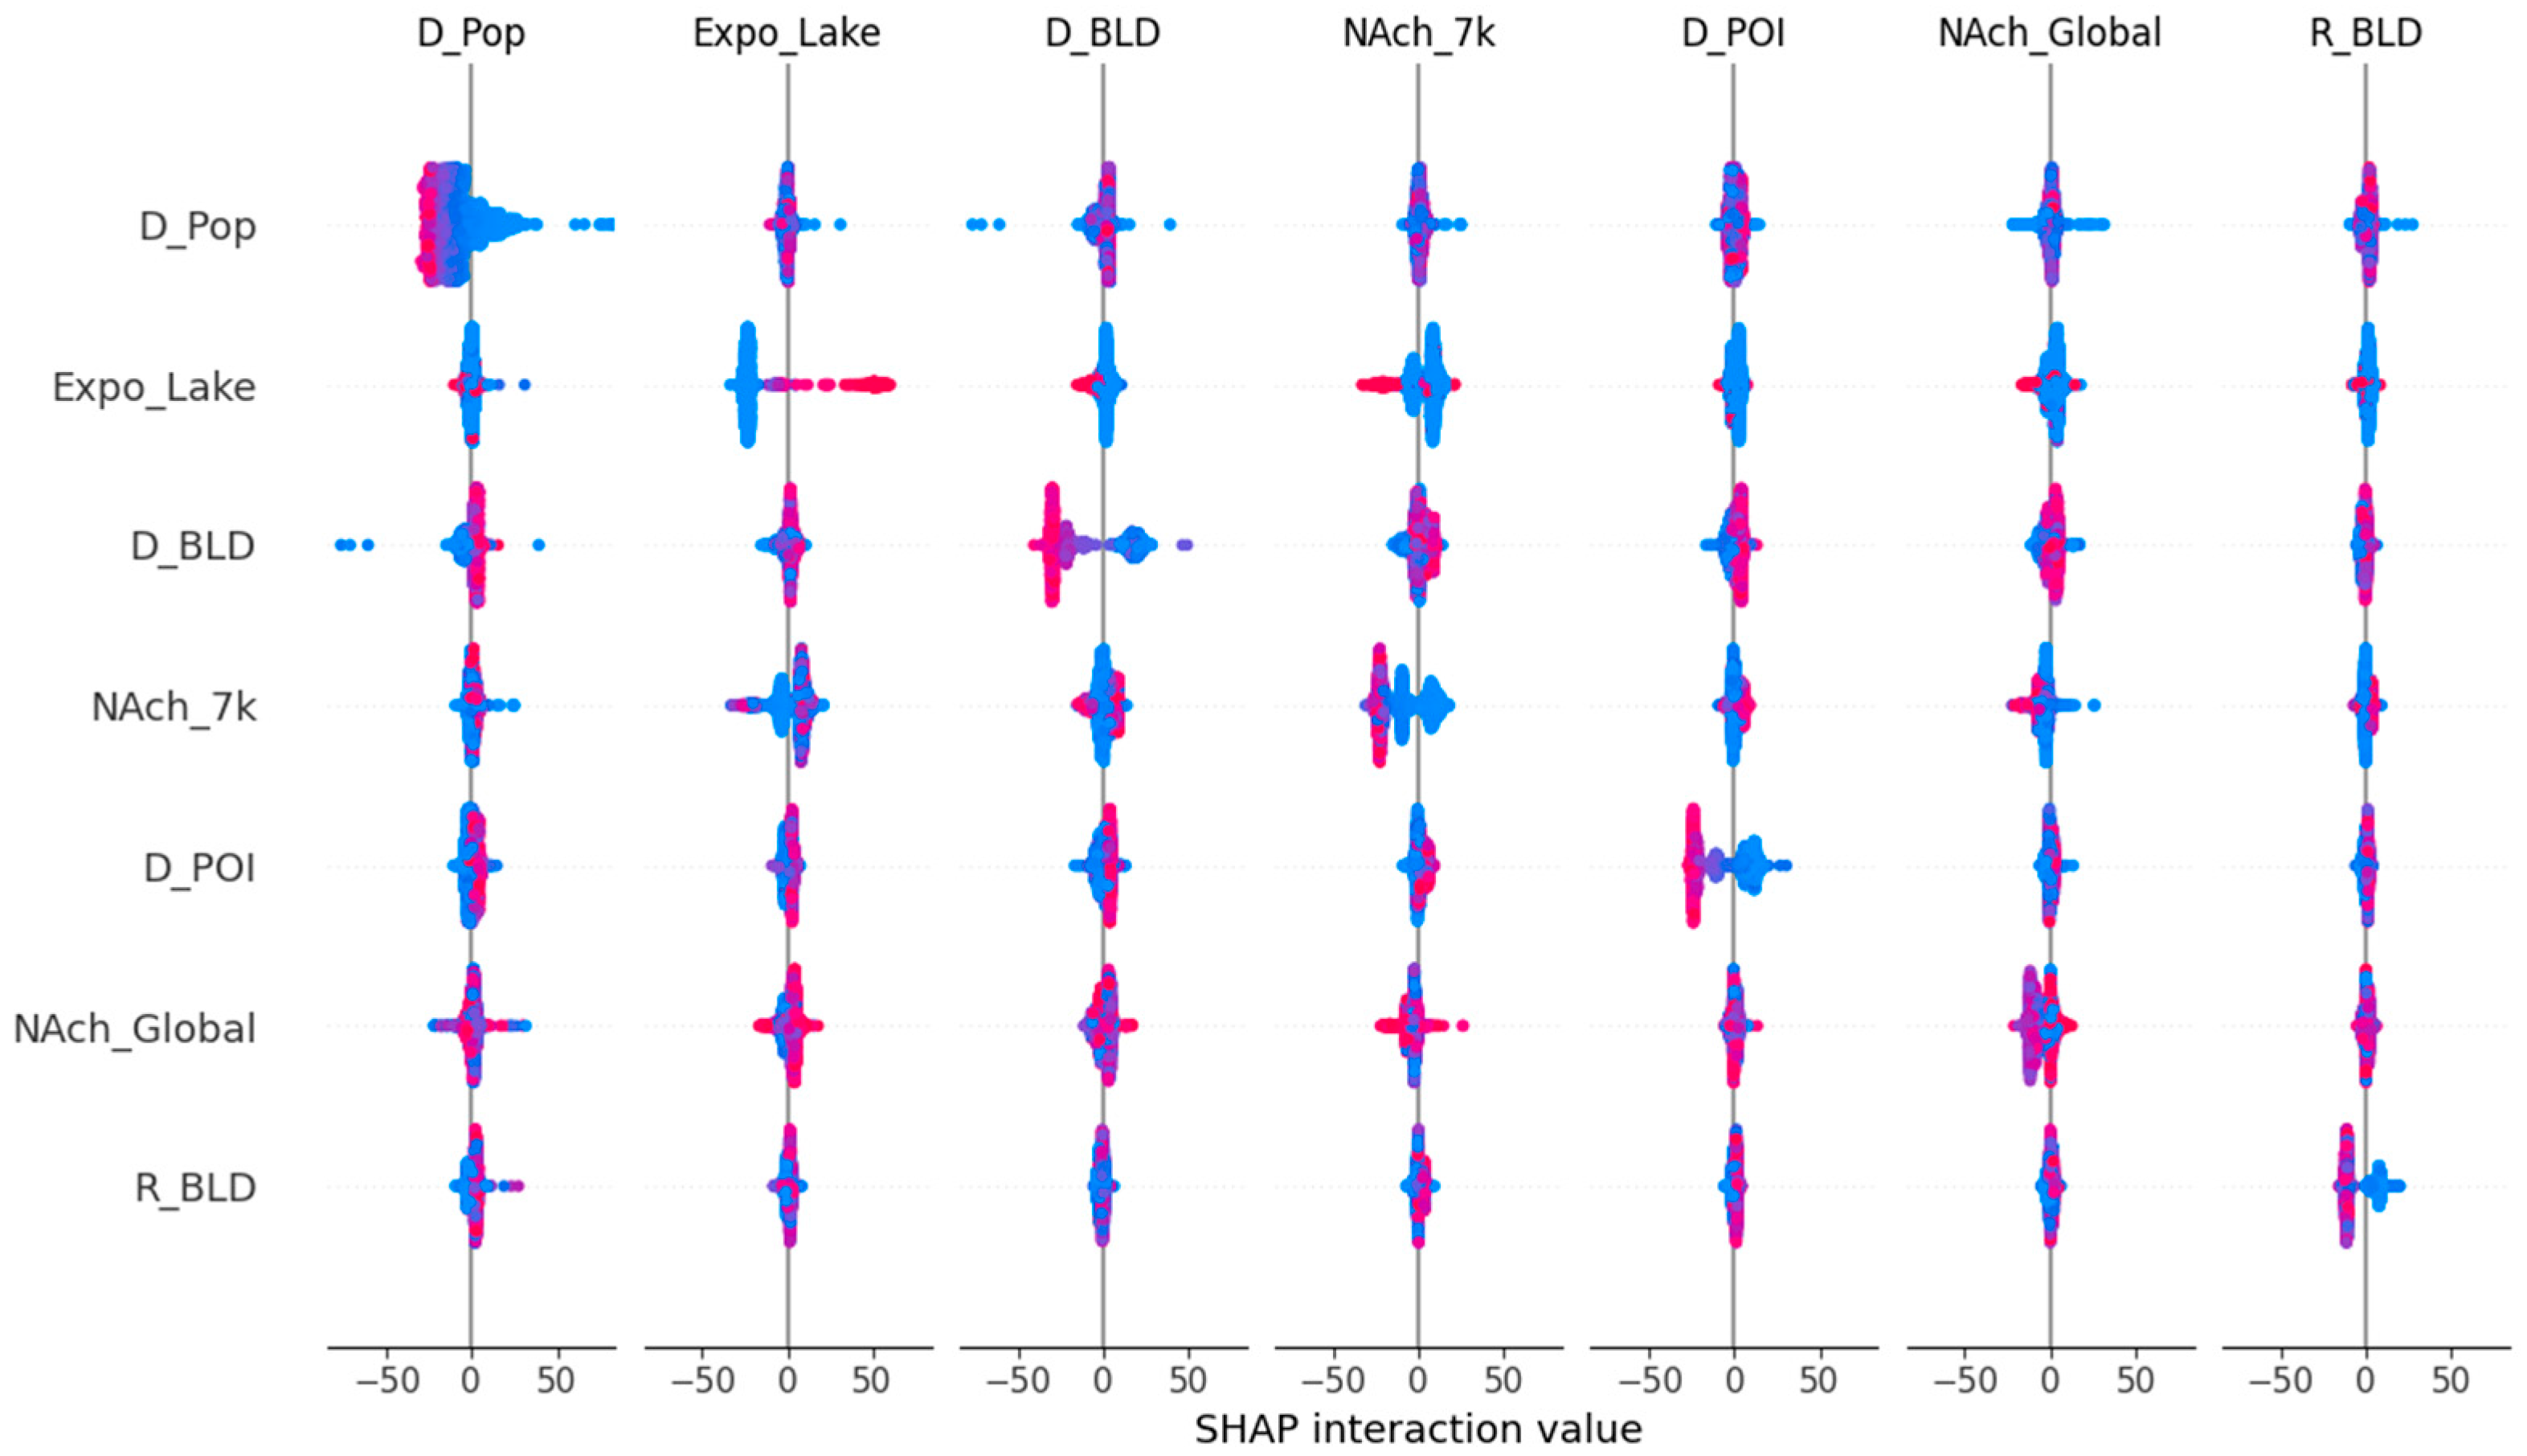
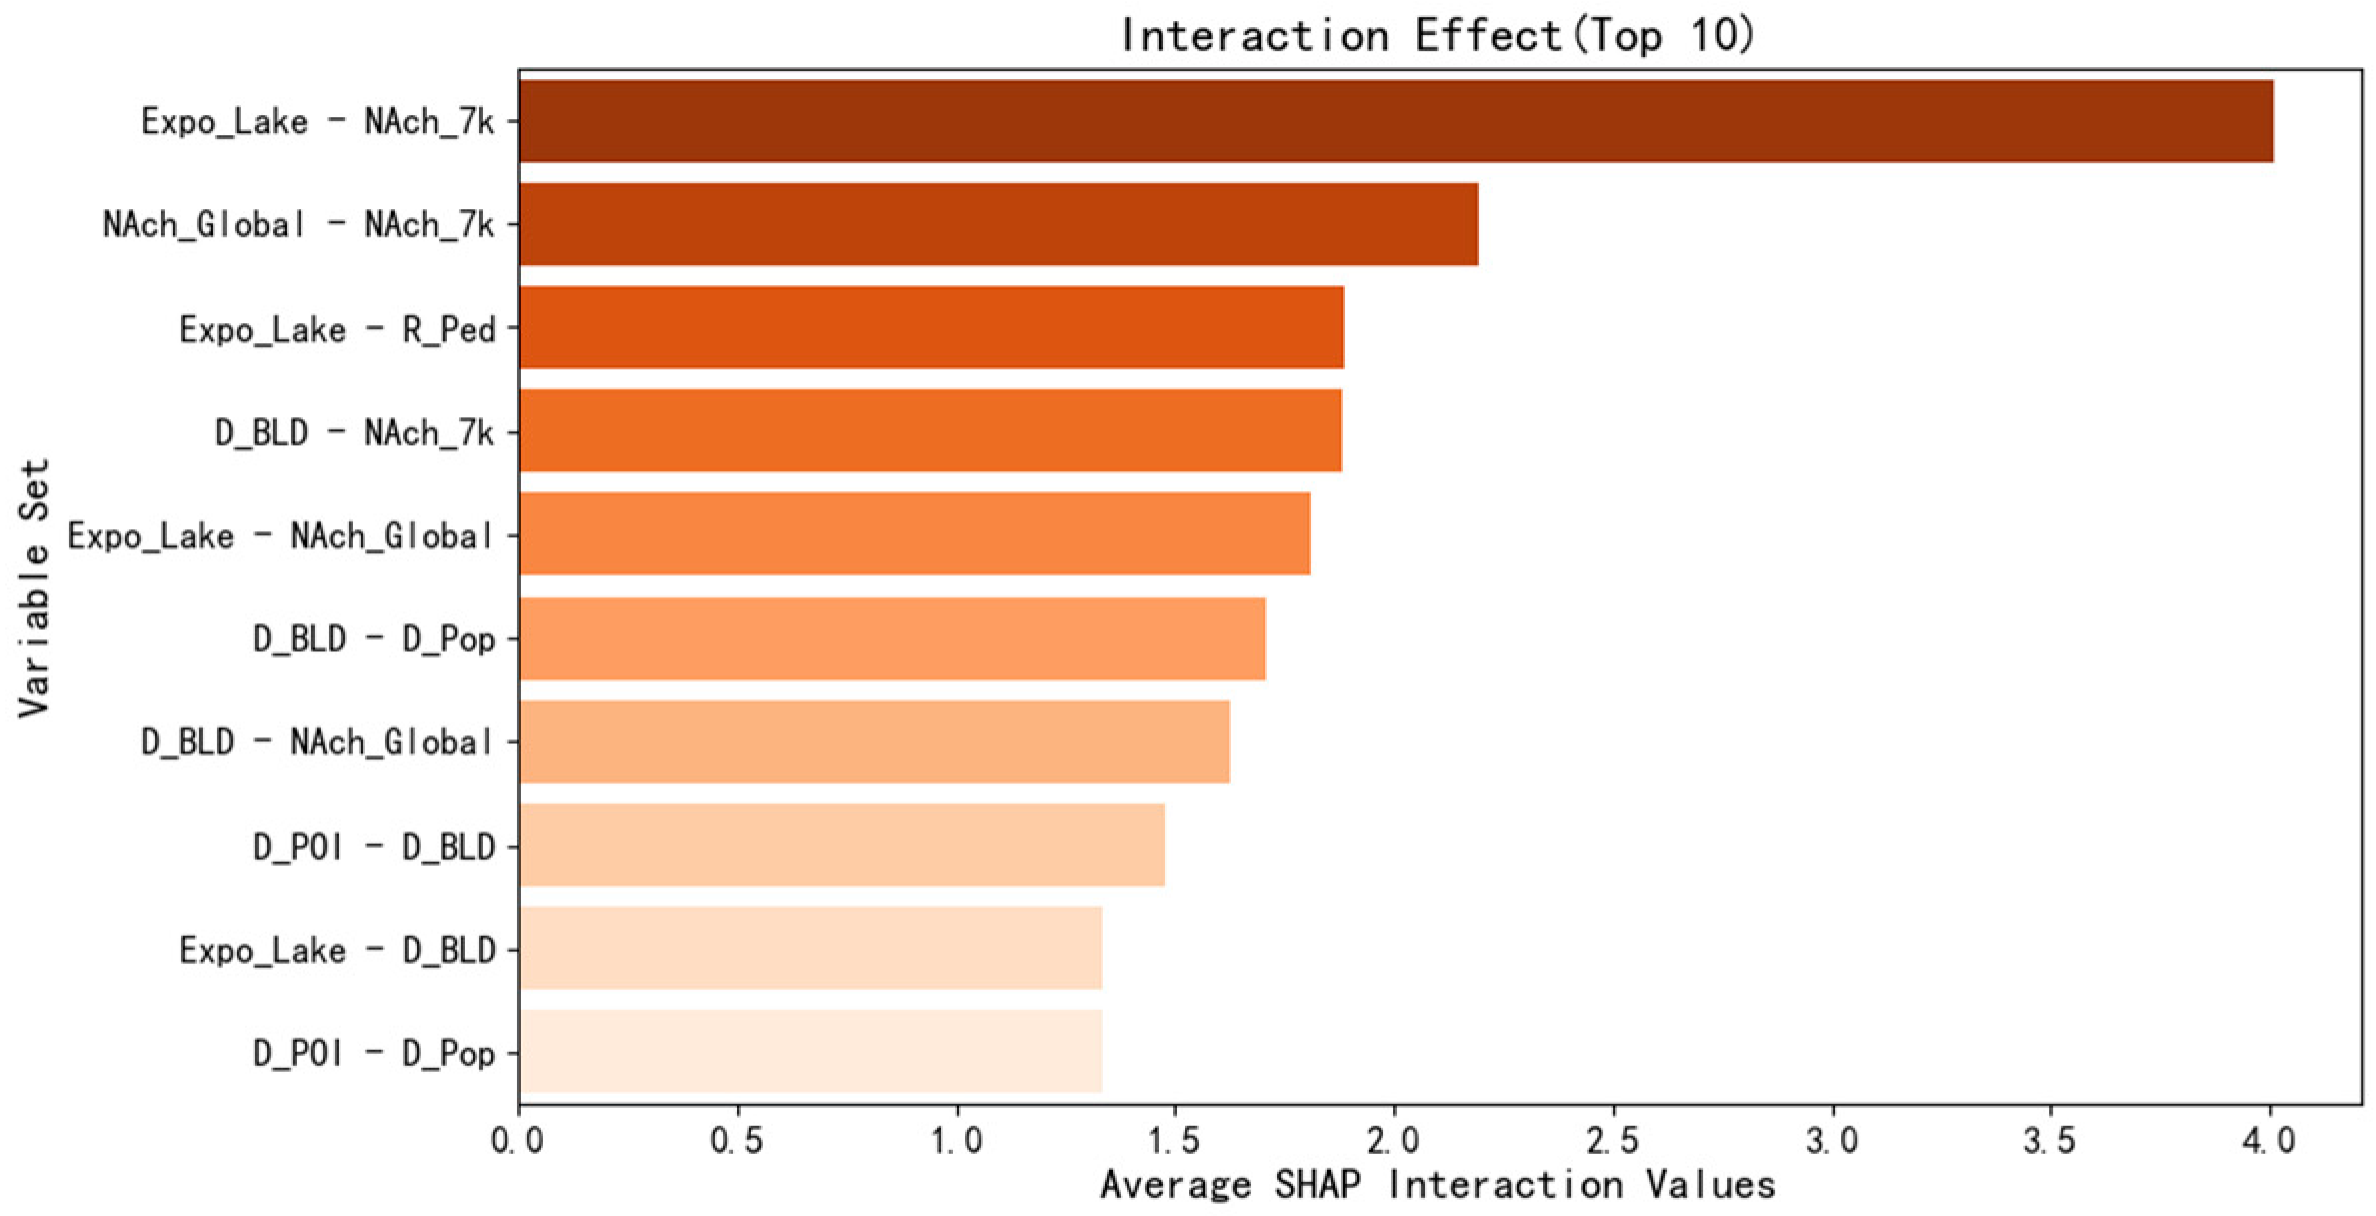
3.2.4. Interaction Effects Among BE Variables
- (1)
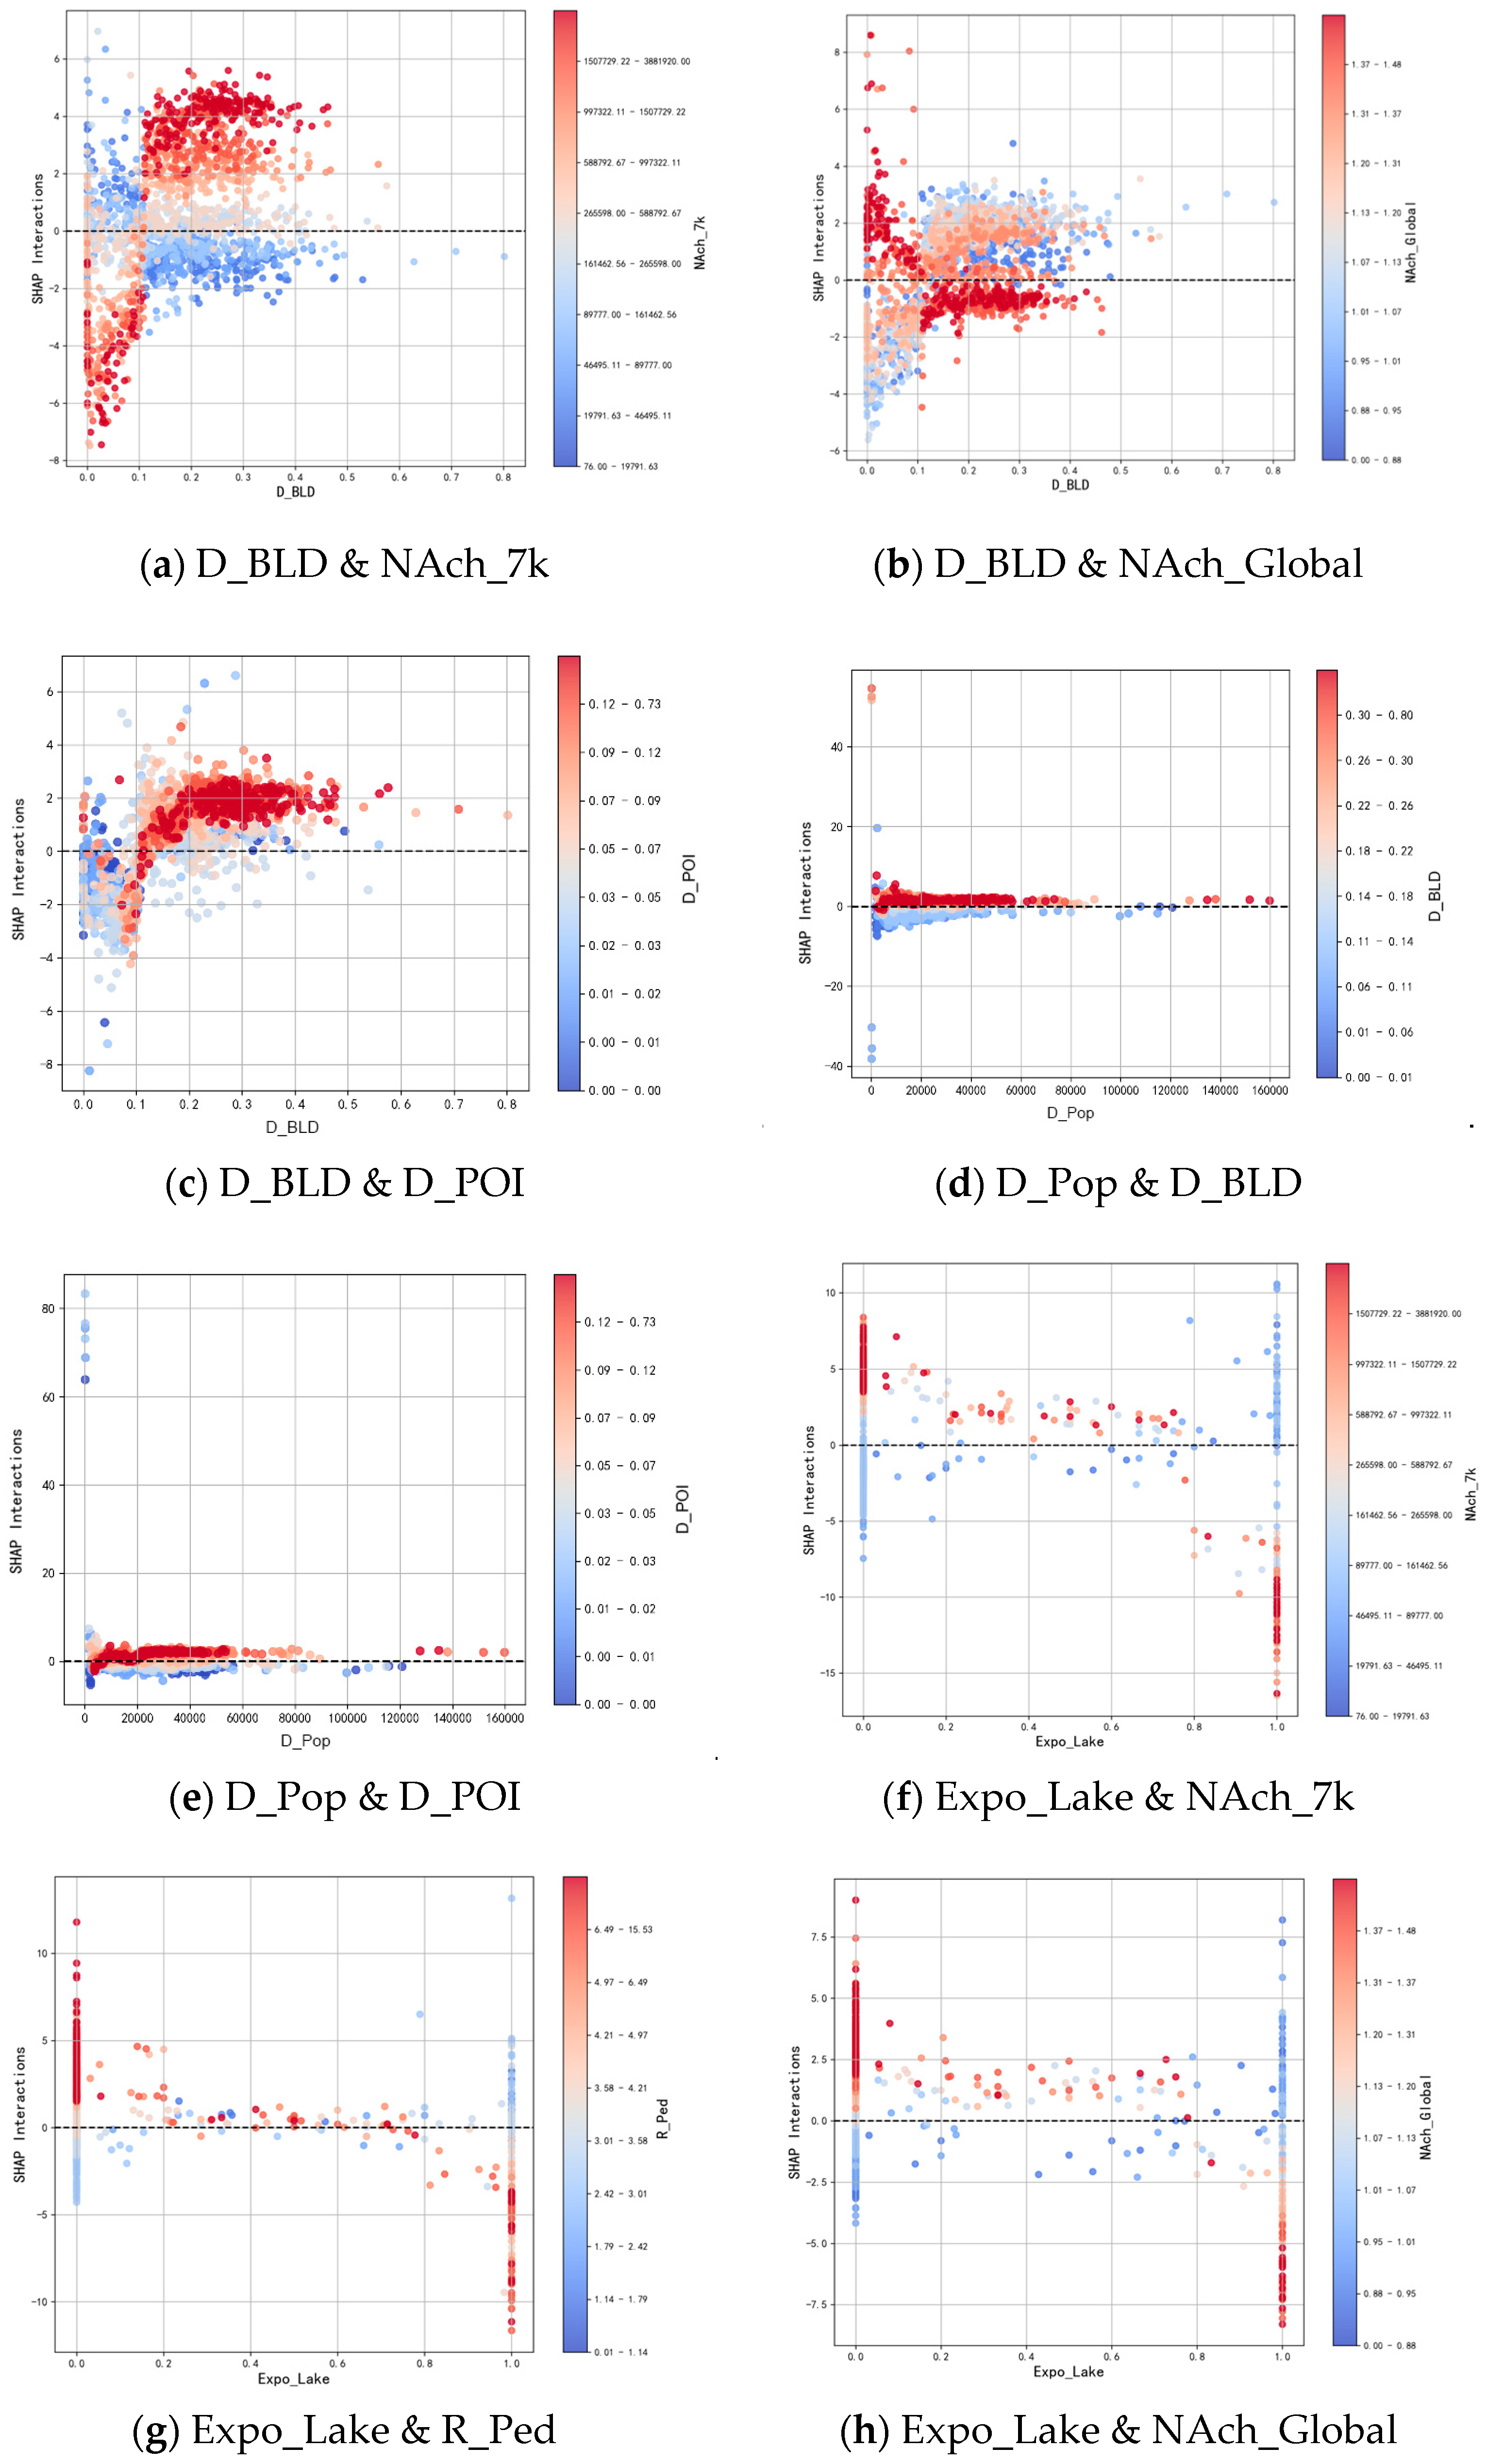
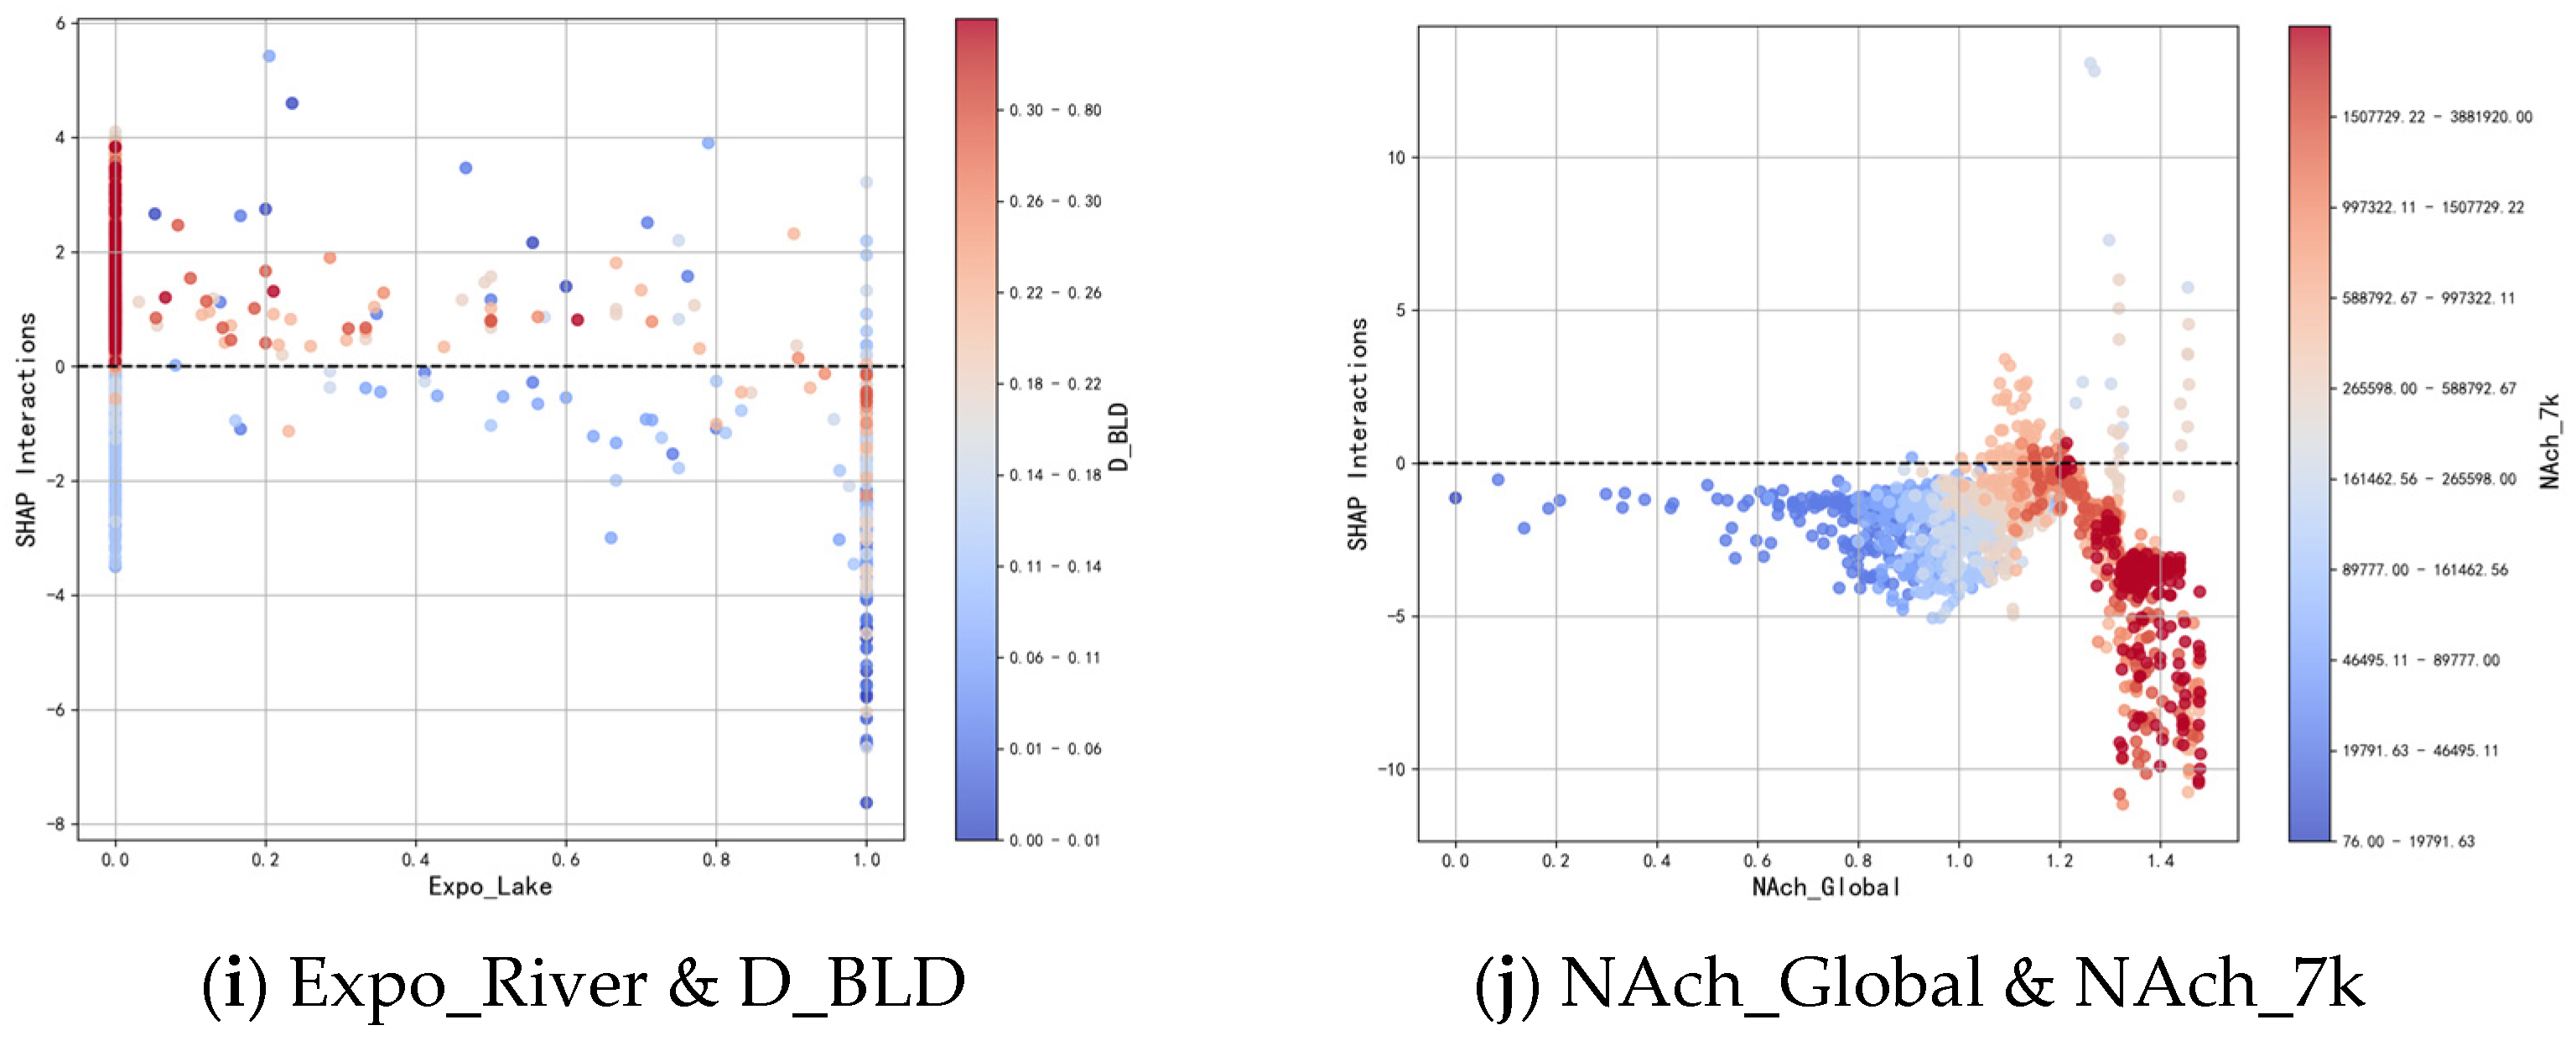
- The 4 interaction variable pairs formed by Expo_Lake and the 4 variables (NAch_7k, R_Ped, NAch_Global, and D_BLD) rank 1st, 3rd, 5th, and 9th in importance, respectively. When Expo_Lake < 80%, the other 4 variables all exhibit an interaction pattern of “low + high” promoting effect and “low + low” inhibiting effect with Expo_Lake; when Expo_Lake≥80%, the form of the interaction effect transforms, showing a state of “high + low” promoting effect and “high + high” inhibiting effect.
- (2)
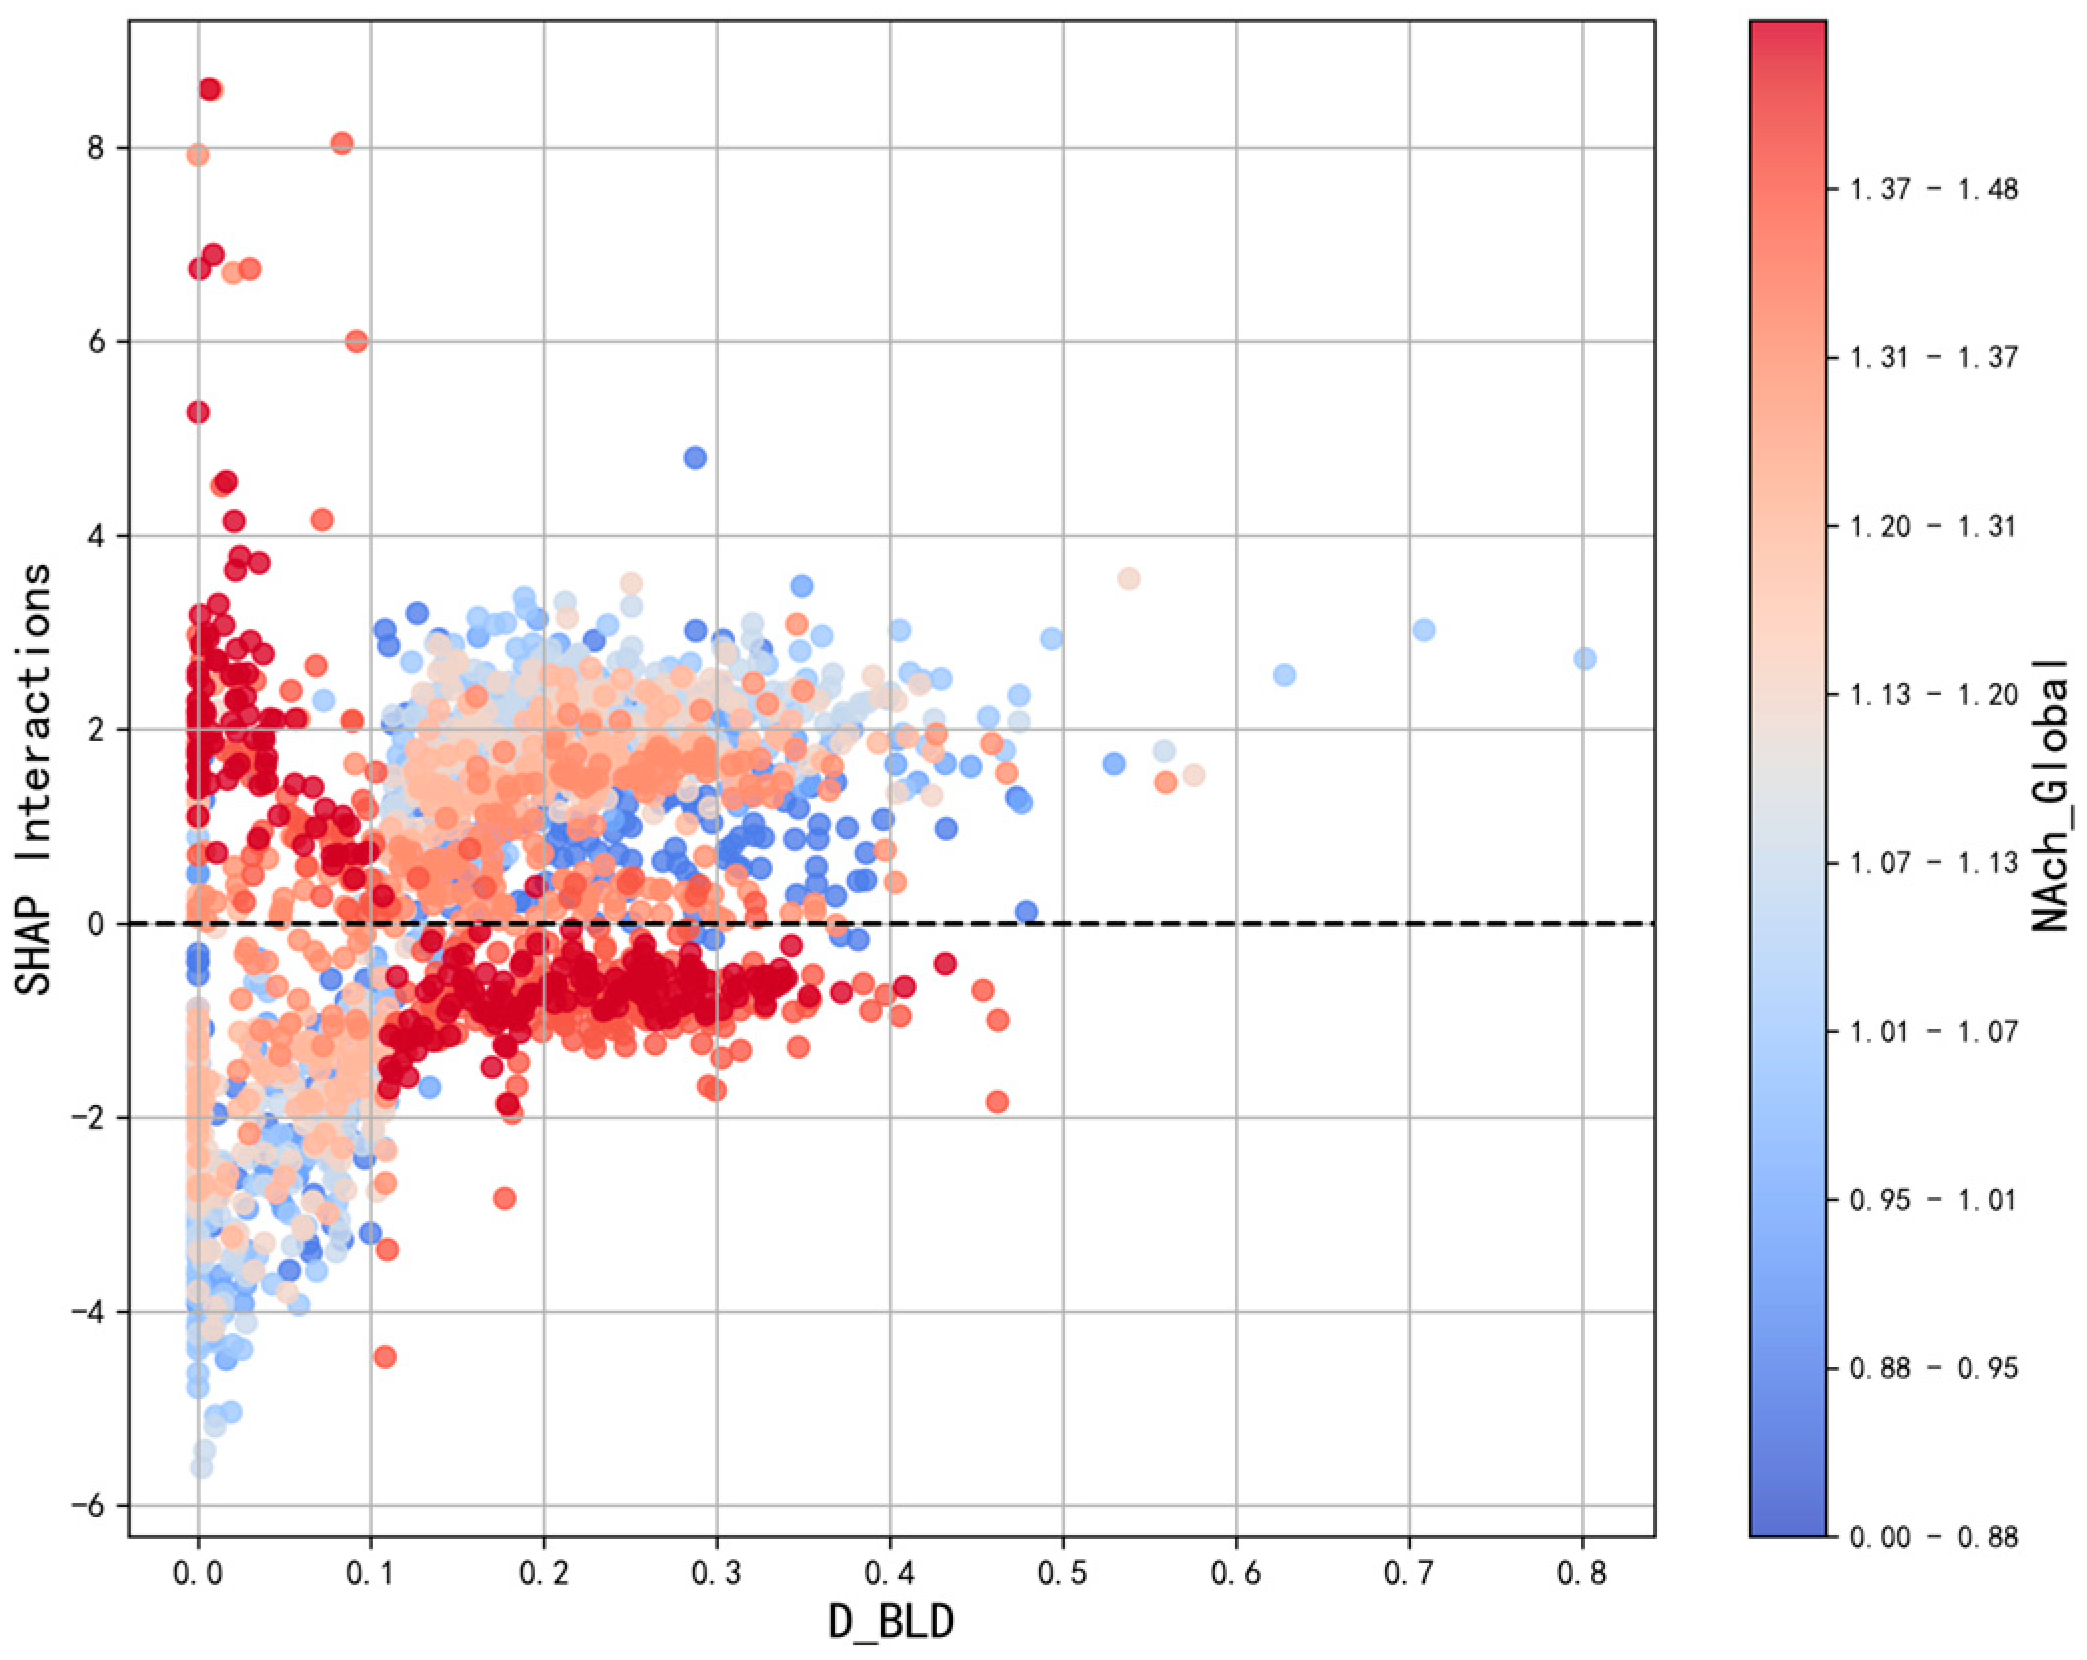
- The interaction effects between D_BLD and NAch_7k, NAch_Global, and D_POI rank 2nd, 7th, and 8th in importance, respectively. For the above 3 variable pairs, D_BLD = 10% serves as the critical point for the change in interaction effects.
- (3)
- The interaction patterns between D_Pop and D_BLD, as well as between D_Pop and D_POI, differ from the above. When D_Pop falls within the range of 0–60,000 people/km2 (the interval where the vast majority of samples are concentrated), both pairs of variables exhibit a certain degree of interaction; when D_Pop exceeds this range, the interaction effect approaches a value of 0 increasingly. In fact, excluding the scenario where D_Pop is at an extremely low value (close to 0)—where some outliers of D_BLD and D_POI inflate the contribution of the interaction effect (i.e., the absolute value on the y-axis)—the interaction effects of the vast majority of samples are very close to 0.
- (4)
- This section focuses on the interaction between NAch_Global (representing accessibility) and NAch_7k (representing traffic volume). Their overall interaction effect is negative, ranking 2nd in importance. Given that the majority of global samples are concentrated in the NAch_Global range of 0.8–1.5, this study designates the first half of this interval as the low-value range and the second half as the high-value range. The key conclusions are as follows:
4. Discussion
4.1. Comparison with Existing Research Results
4.1.1. Nonlinear and Threshold Effect
4.1.2. Interaction Effect of Variables
4.2. Policy Recommendations and Practical Implications
4.2.1. Guiding Planning Recommendations
- (1)
- Optimize Street Space Density: When planning new communities or renovating existing neighborhoods, building density should be controlled to avoid overcrowded street environments. Properly reducing building and population density can increase residents’ willingness and intensity to engage in MPA, especially in the renovation of core areas or old neighborhoods.
- (2)
- Improve Traffic Safety: Reducing traffic flow, especially around residential and commercial areas, can effectively minimize the negative impact on residents’ MPA. Increasing green transportation infrastructure (such as sidewalks, pedestrian streets, slow-moving lanes) and traffic safety measures (such as speed bumps, traffic light settings) will help improve the suitability of streets for MPA.
- (3)
- Enhance Public Transportation Accessibility: Increasing the density of bus and subway stations and improving the quality of public transportation services can effectively promote outdoor MPA among residents. In areas with limited public transportation, providing more convenient transportation connections can encourage residents to participate in more outdoor exercise.
- (4)
- Optimize Street Landscape Design: Improving water exposure and green space design, especially on streets frequented by residents, can enhance the attractiveness of the street and encourage MPA. In addition, appropriately increasing the openness of streets and reducing the continuity of building facades can provide a more open and comfortable walking environment.
- (5)
- Strengthen Community Health Interventions: Specific strategies for promoting MPA should be developed for different urban areas, especially low-income or traffic-congested areas. By implementing targeted interventions to improve the built environment in specific regions, resources can be allocated more precisely, and MPA can be more effectively promoted.
4.2.2. Indicator-Based Planning Recommendations
- (1)
- Indicators that can be directly intervened in based on quantitative results:
- (2)
- Indicators that can be intervened in through the synergistic effects among variables.
4.3. Research Limitations and Future Outlook
5. Conclusions
Author Contributions
Funding
Data Availability Statement
Conflicts of Interest
Appendix A
Appendix B
References
- Strain, T.; Flaxman, S.; Guthold, R.; Semenova, E.; Cowan, M.; Riley, L.M.; Bull, F.C.; Stevens, G.A. National, Regional, and Global Trends in Insufficient Physical Activity Among Adults from 2000 to 2022: A Pooled Analysis of 507 Population-Based Surveys with 5·7 Million Participants. Lancet Glob. Health 2024, 12, e1232–e1243. [Google Scholar] [CrossRef]
- Rhodes, R.E.; Janssen, I.; Bredin, S.S.D.; Warburton, D.E.R.; Bauman, A. Physical Activity: Health Impact, Prevalence, Correlates and Interventions. Psychol. Health 2017, 32, 942–975. [Google Scholar] [CrossRef]
- Roberts, I.; Norton, R.; Jackson, R.; Dunn, R.; Hassall, I. Effect of Environmental Factors on Risk of Injury of Child Pedestrians by Motor Vehicles: A Case-Control Study. BMJ 1995, 310, 91–94. [Google Scholar] [CrossRef]
- Yang, D.; Wang, X.; Han, R. Nonlinear and Synergistic Effects of the Built Environment on Street Vitality: The Case of Shenyang. Urban Plan. Forum 2023, 5, 93–102. [Google Scholar] [CrossRef]
- Yang, W.; Fei, J.; Li, Y.; Chen, H.; Liu, Y. Unraveling Nonlinear and Interaction Effects of Multilevel Built Environment Features on Outdoor Jogging with Explainable Machine Learning. Cities 2024, 147, 104813. [Google Scholar] [CrossRef]
- Yang, L.; Yu, B.; Liang, P.; Tang, X.; Li, J. Crowdsourced Data for Physical Activity-Built Environment Research: Applying Strava Data in Chengdu, China. Front. Public Health 2022, 10, 883177. [Google Scholar] [CrossRef] [PubMed]
- Shen, H.; Shu, B.; Zhang, J.; Liu, Y.; Li, A. What Factors Influence the Willingness and Intensity of Regular Mobile Physical Activity?—A Machine Learning Analysis Based on a Sample of 290 Cities in China. Front. Public Health 2025, 13, 1511129. [Google Scholar] [CrossRef] [PubMed]
- Ewing, R.; Cervero, R. Travel and the Built Environment. J. Am. Plann. Assoc. 2010, 76, 265–294. [Google Scholar] [CrossRef]
- Schnohr, P.; O’Keefe, J.H.; Marott, J.L.; Lange, P.; Jensen, G.B. Dose of Jogging and Long-Term Mortality: The Copenhagen City Heart Study. J. Am. Coll. Cardiol. 2015, 65, 411–419. [Google Scholar] [CrossRef]
- Yang, L.; Ao, Y.; Ke, J.; Lu, Y.; Liang, Y. To Walk or Not to Walk? Examining Non-Linear Effects of Streetscape Greenery on Walking Propensity of Older Adults. J. Transp. Geogr. 2021, 94, 103099. [Google Scholar] [CrossRef]
- Cheng, L.; De Vos, J.; Zhao, P.; Yang, M.; Witlox, F. Examining Non-Linear Built Environment Effects on Elderly’s Walking: A Random Forest Approach. Transp. Res. Part Transp. Environ. 2020, 88, 102552. [Google Scholar] [CrossRef]
- Smith, R.A.; Schneider, P.P.; Cosulich, R.; Quirk, H.; Bullas, A.M.; Haake, S.J.; Goyder, E. Socioeconomic Inequalities in Distance to and Participation in a Community-Based Running and Walking Activity: A Longitudinal Ecological Study of Parkrun 2010 to 2019. Health Place 2021, 71, 102626. [Google Scholar] [CrossRef]
- Karusisi, N.; Bean, K.; Oppert, J.-M.; Pannier, B.; Chaix, B. Multiple Dimensions of Residential Environments, Neighborhood Experiences, and Jogging Behavior in the RECORD Study. Prev. Med. 2012, 55, 50–55. [Google Scholar] [CrossRef]
- Chen, E.; Ye, Z.; Wu, H. Nonlinear Effects of Built Environment on Intermodal Transit Trips Considering Spatial Heterogeneity. Transp. Res. Part Transp. Environ. 2021, 90, 102677. [Google Scholar] [CrossRef]
- Jiang, H.; Dong, L.; Qiu, B. How Are Macro-Scale and Micro-Scale Built Environments Associated with Running Activity? The Application of Strava Data and Deep Learning in Inner London. ISPRS Int. J. Geo-Inf. 2022, 11, 504. [Google Scholar] [CrossRef]
- Javanmard, R.; Lee, J.; Kim, J.; Liu, L.; Diab, E. The Impacts of the Modifiable Areal Unit Problem (MAUP) on Social Equity Analysis of Public Transit Reliability. J. Transp. Geogr. 2023, 106, 103500. [Google Scholar] [CrossRef]
- Lu, Y. Using Google Street View to Investigate the Association Between Street Greenery and Physical Activity. Landsc. Urban Plan. 2019, 191, 103435. [Google Scholar] [CrossRef]
- Huang, D.; Liu, Y.; Zhou, P. Meta-analysis on Associations Between the Built Environment and Mobile Physical Activity Using Volunteered Geographic Information. Landsc. Archit. 2024, 31, 12–20. [Google Scholar] [CrossRef]
- Biddle, S.J.H.; Nigg, C.R. Theories of Exercise Behavior. Int. J. Sport Psychol. 2000, 31, 290–304. [Google Scholar]
- Li, K.; Yang, D.; Jiang, L. Analysis of the Relationship between Built Environment and Physical Activity Willingness of the Elderly: From the Perspective of Perception and Mediation Effect. J. Hum. Settl. West China 2025, 40, 73–80. [Google Scholar]
- Yang, W.; Li, Y.; Liu, Y.; Fan, P.; Yue, W. Environmental Factors for Outdoor Jogging in Beijing: Insights from Using Explainable Spatial Machine Learning and Massive Trajectory Data. Landsc. Urban Plan. 2024, 243, 104969. [Google Scholar] [CrossRef]
- Alshahrani, N.Z. Predictors of Physical Activity and Public Safety Perception Regarding Technology Adoption for Promoting Physical Activity in Jeddah, Saudi Arabia. Prev. Med. Rep. 2024, 43, 102753. [Google Scholar] [CrossRef]
- Yang, W.; Hu, J.; Liu, Y. Association and Interaction Between Built Environment and Outdoor Jogging Based on Crowdsourced Geographic Information. Landsc. Archit. 2024, 31, 44–52. [Google Scholar] [CrossRef]
- Swapan, A.Y.; Bay, J.H.; Marinova, D. Built Form and Community Building in Residential Neighbourhoods: A Case Study of Physical Distance in Subiaco, Western Australia. Sustainability 2018, 10, 1703. [Google Scholar] [CrossRef]
- Friesen, A. The Importance of Place A Role for the Built Environment in the Etiology and Treatment of Problematic Substance Use. Master’s Thesis, University of Waterloo, Waterloo, ON, Canada, 2018. [Google Scholar]
- Ishikawa, A.; Suzuki, H. Relationship Between Distance of Visible Road on Road Network and Occurrence of Snatch—A Study in Redential Area in Osaka City. J. Environ. Eng. Trans. Archit. Inst. Jpn. 2008, 73, 101–106. [Google Scholar] [CrossRef]
- Yamanoto, H.; Marumo, H.; Takahashi, A.; Saitou, K. On the Effect of Unobstructed View Distance in Residential Street on Landscape Evaluation. J. City Plan. Inst. Jpn. 1991, 26, 817–822. [Google Scholar] [CrossRef]
- Gehl, J. Life Between Buildings—Using Public Space, 6th ed.; Island Press: Washington, DC, USA, 2011; ISBN 978-1-59726-827-1. [Google Scholar]
- Sheng, Q.; Yang, T.; Hou, J. Continuous Movement and Hyper-Link Spatial Mechanisms—A Large-Scale Space Syntax Analysis on Chongqing’s Vehicle and Metro Flow Data. J. Hum. Settl. West China 2015, 30, 16–21. [Google Scholar] [CrossRef]
- Hillier, W.; Yang, T.; Turner, A. Advancing DepthMap to Advance Our Understanding of Cities: Comparing Streets and Cities and Streets with Cities. In Proceedings of the 8th International Space Syntax Symposium, Santiago, Chile, 3–6 January 2012. [Google Scholar]
- Chiaradia, A.; Moreau, E.; Raford, N. Configurational Exploration of Public Transport Movement Networks: A Case Study, the London Underground. In Proceedings of the 5th International Space Syntax Symposium, Delft, The Netherlands, 13–17 June 2005. [Google Scholar]
- Yamu, C.; Van Nes, A.; Garau, C. Bill Hillier’s Legacy: Space Syntax—A Synopsis of Basic Concepts, Measures, and Empirical Application. Sustainability 2021, 13, 3394. [Google Scholar] [CrossRef]
- Hillier, W.R.G.; Yang, T.; Turner, A. Normalising Least Angle Choice in Depthmap—And How It Opens up New Perspectives on the Global and Local Analysis of City Space. J. Space Syntax 2012, 3, 155–193. [Google Scholar]
- Bringolf-Isler, B.; Hänggi, J.; Kayser, B.; Suggs, L.S.; De Hoogh, K.; Dössegger, A.; Probst-Hensch, N. Does Growing up in a Physical Activity-Friendly Neighborhood Increase the Likelihood of Remaining Active during Adolescence and Early Adulthood? BMC Public Health 2024, 24, 2883. [Google Scholar] [CrossRef] [PubMed]
- Tao, W.; Gu, H.; Zhang, L.; Shen, M.; Huang, M. Study on the Prediction of Urban Road Traffic from the Perspective of Syntax: A Case Study on Renmin Viaduct Demolition in Guangzhou. J. South China Norm. Univ. Nat. Sci. Ed. 2017, 49, 80–86. [Google Scholar] [CrossRef]
- Luo, Y.; Yan, J.; McClure, S.C.; Li, F. Socioeconomic and Environmental Factors of Poverty in China Using Geographically Weighted Random Forest Regression Model. Environ. Sci. Pollut. Res. 2022, 29, 33205–33217. [Google Scholar] [CrossRef]
- Su, Z.; Lin, L.; Xu, Z.; Chen, Y.; Yang, L.; Hu, H.; Lin, Z.; Wei, S.; Luo, S. Modeling the Effects of Drivers on PM2.5 in the Yangtze River Delta with Geographically Weighted Random Forest. Remote Sens. 2023, 15, 3826. [Google Scholar] [CrossRef]
- Lundberg, S.M.; Lee, S.-I. A Unified Approach to Interpreting Model Predictions. In Proceedings of the Advances in Neural Information Processing Systems, Long Beach, CA, USA, 4–9 December 2017; Curran Associates, Inc.: New York, NY, USA, 2017; Volume 30. [Google Scholar]
- Ribeiro, M.T.; Singh, S.; Guestrin, C. “Why Should I Trust You?”: Explaining the Predictions of Any Classifier. In Proceedings of the 22nd ACM SIGKDD International Conference on Knowledge Discovery and Data Mining, San Francisco, CA, USA, 13–17 August 2016; Association for Computing Machinery: New York, NY, USA, 2016; pp. 1135–1144. [Google Scholar]
- Li, Z. Extracting Spatial Effects from Machine Learning Model Using Local Interpretation Method: An Example of SHAP and XGBoost. Comput. Environ. Urban Syst. 2022, 96, 101845. [Google Scholar] [CrossRef]
- Wei, D.; Yang, L. Non-Linear and Synergistic Effects of Built Environment Factors on Older People’s Walking Frequency in Chengdu: A Shapley Additive Explanations Analysis. J. Hum. Settl. West China 2024, 39, 75–82. [Google Scholar] [CrossRef]
- Koç, T. Bandwidth Selection in Geographically Weighted Regression Models via Information Complexity Criteria. J. Math. 2022, 2022, 1527407. [Google Scholar] [CrossRef]
- Li, B.; Cao, J.; Guan, L.; Mazur, M.; Chen, Y.; Wahle, R.A. Estimating Spatial Non-Stationary Environmental Effects on the Distribution of Species: A Case Study from American Lobster in the Gulf of Maine. ICES J. Mar. Sci. 2018, 75, 1473–1482. [Google Scholar] [CrossRef]
- Wang, J.; Du, H.; Li, X.; Mao, F.; Zhang, M.; Liu, E.; Ji, J.; Kang, F. Remote Sensing Estimation of Bamboo Forest Aboveground Biomass Based on Geographically Weighted Regression. Remote Sens. 2021, 13, 2962. [Google Scholar] [CrossRef]
- Liu, Y.; Li, Y.; Yang, W.; Hu, J. Exploring Nonlinear Effects of Built Environment on Jogging Behavior Using Random Forest. Appl. Geogr. 2023, 156, 102990. [Google Scholar] [CrossRef]
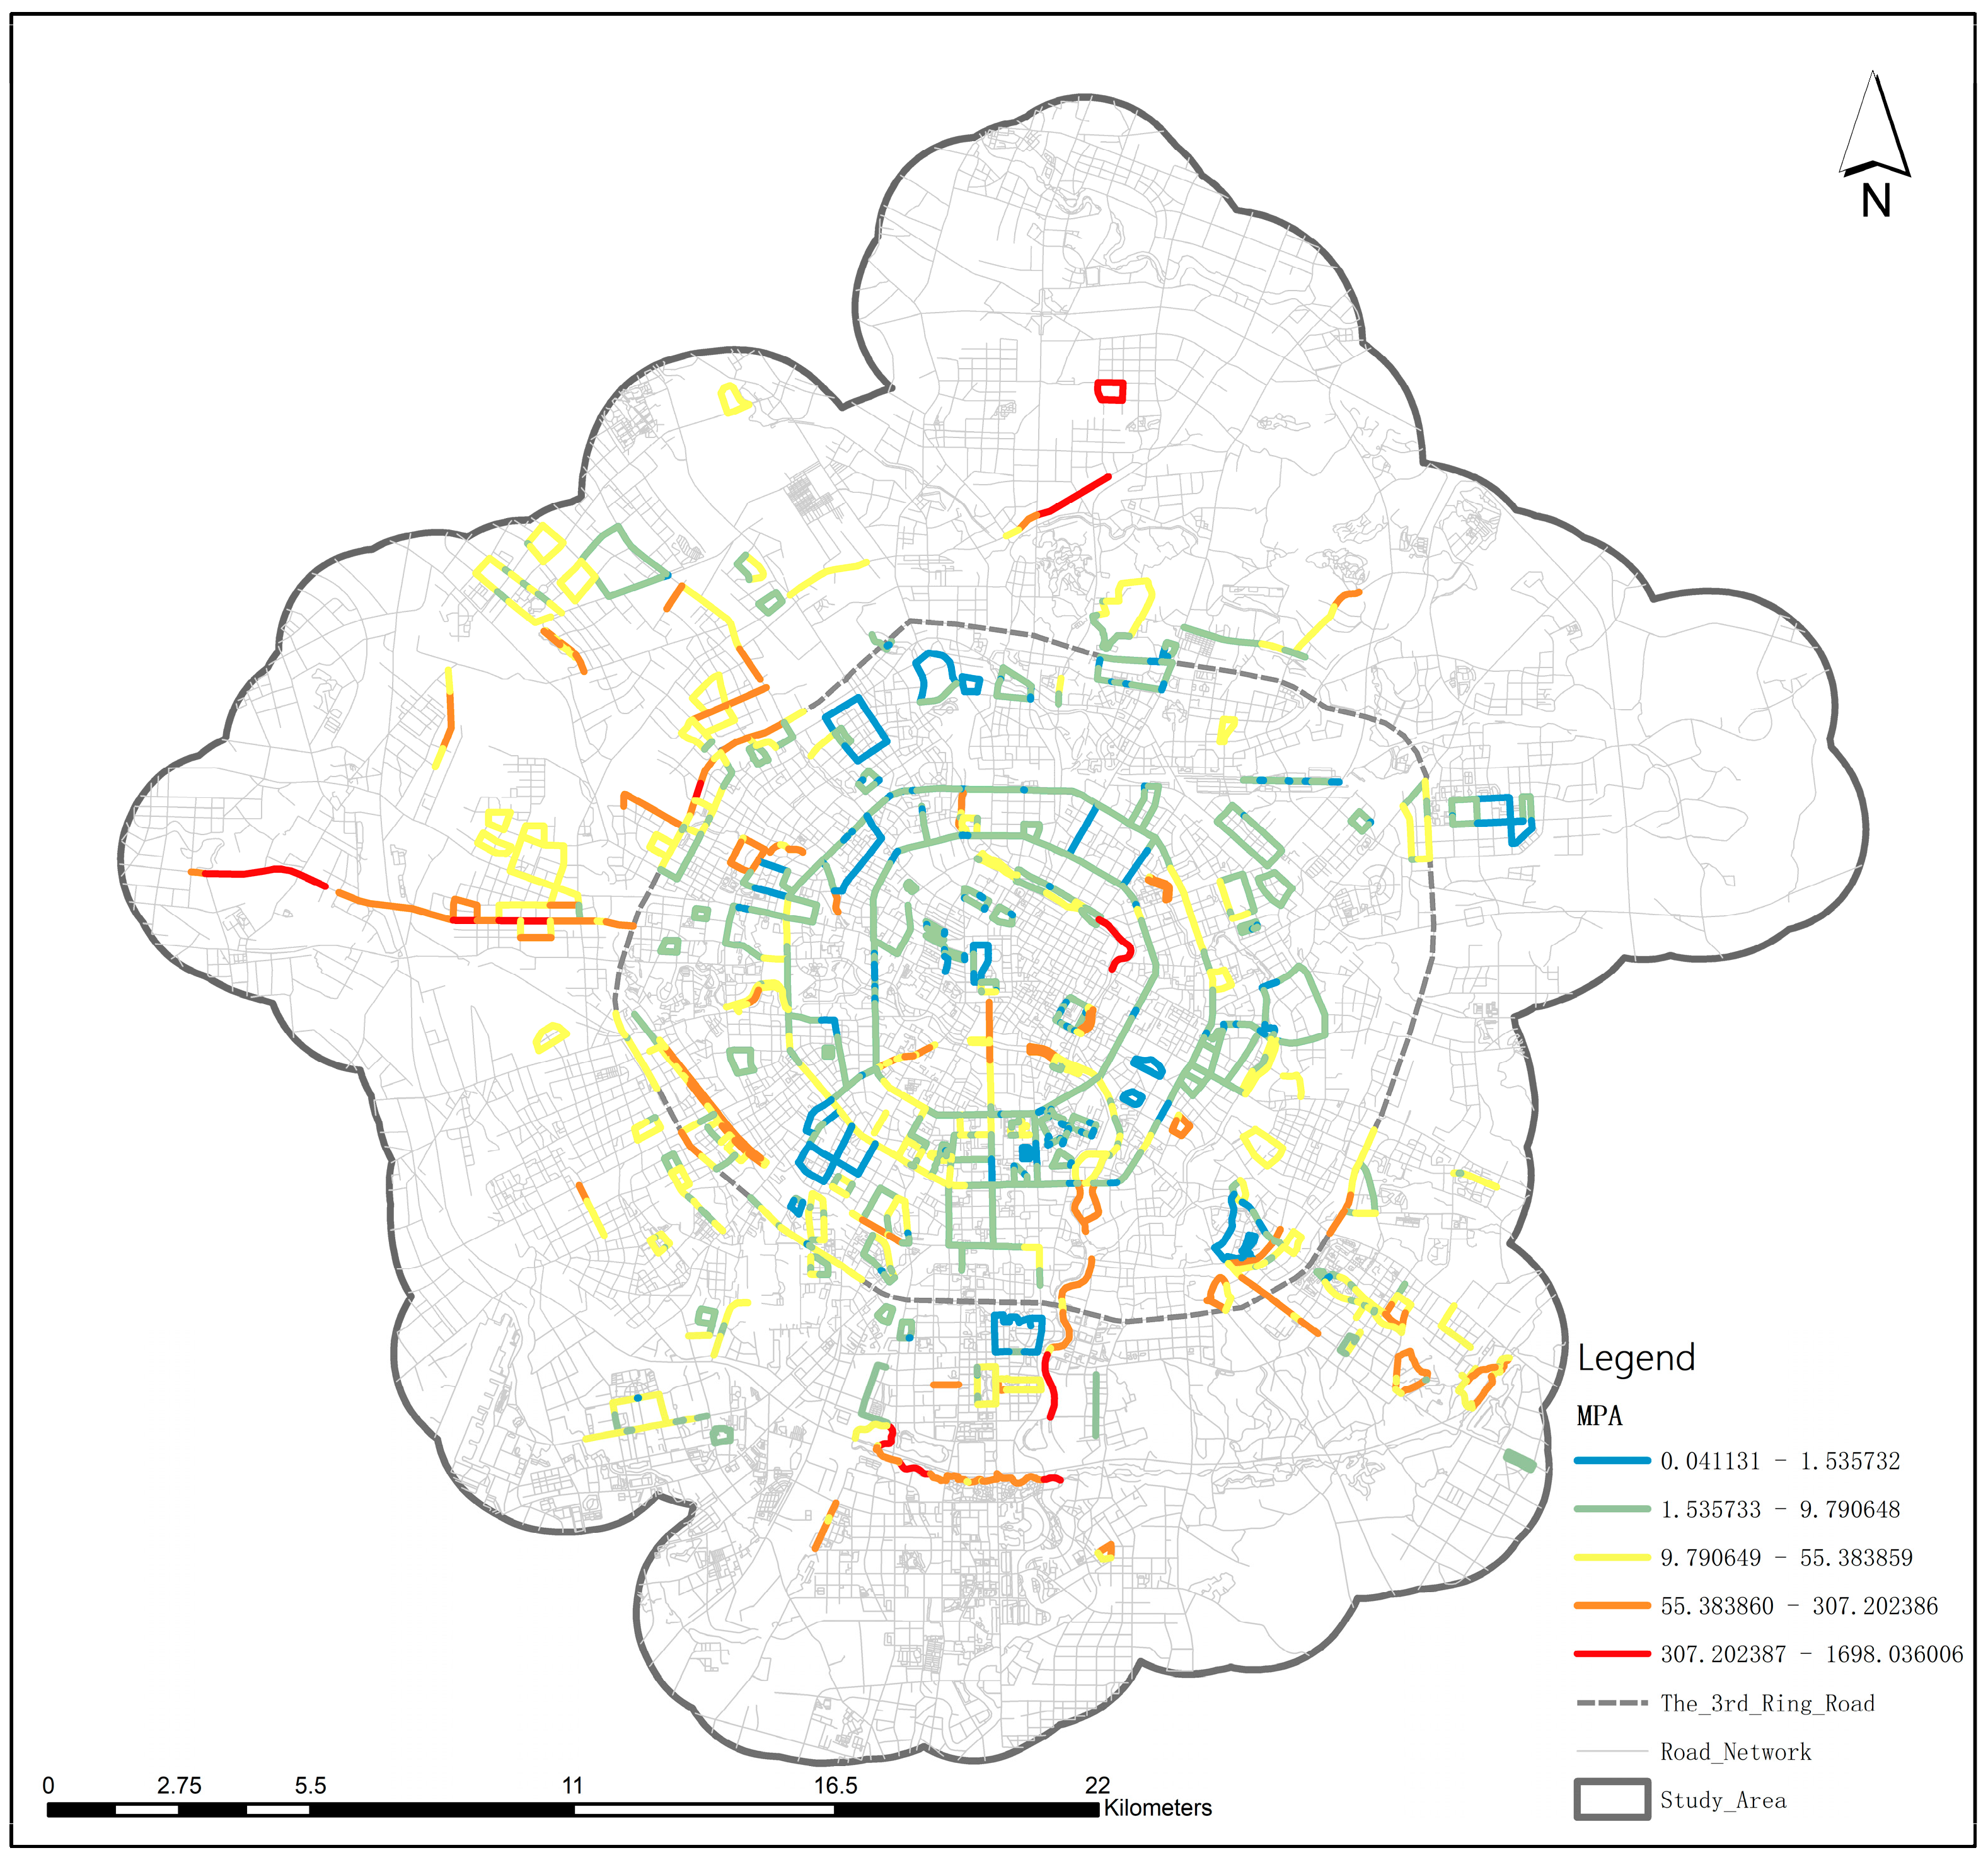
| District | Include Spatial Scope | Area | Population |
|---|---|---|---|
| Qingyang | Entire | 64.49 km2 | 1,373,897 |
| Wuhou | 123.67 km2 | 1,571,181 | |
| Jinniu | 106.67 km2 | 1,634,905 | |
| Jinjiang | 60.37 km2 | 767,034 | |
| Chenghua | 109.39 km2 | 1,373,897 | |
| Longquanyi | Partial | 50.54 km2 | 178,789 |
| Pidu | 31.54 km2 | 208,118 | |
| Shuangliu | 103.46 km2 | 598,735 | |
| Xindu | 79.94 km2 | 163,640 | |
| Wenjiang | 23.14 km2 | 54,392 | |
| Total | - | 753.21 km2 | 7,924,588 |
| Information | Description | Sample |
|---|---|---|
| Route name | The custom name provided by the user when creating a route. | Vanke Loop Line |
| Route ID | Assigned by the system upon creation. | 5f145f0a88d6fe70e739556f |
| Route location | Geographical coordinates of the starting point of the route. | Longitude: 30.5908 Latitude: 104.1723 |
| Venue type | Including: Park, Street, Playground, Field and Others. | Street |
| Route length | - | 1671.2 m |
| Check-in count | Cumulative check-ins since the creation of the route. | 814 times |
| Proportion of PA types | Proportion of running, walking, and cycling activities. | Running: 75% Walking: 9% Cycling: 16% |
| Route creation date | - | 19 July 2020, 22:56:10 |
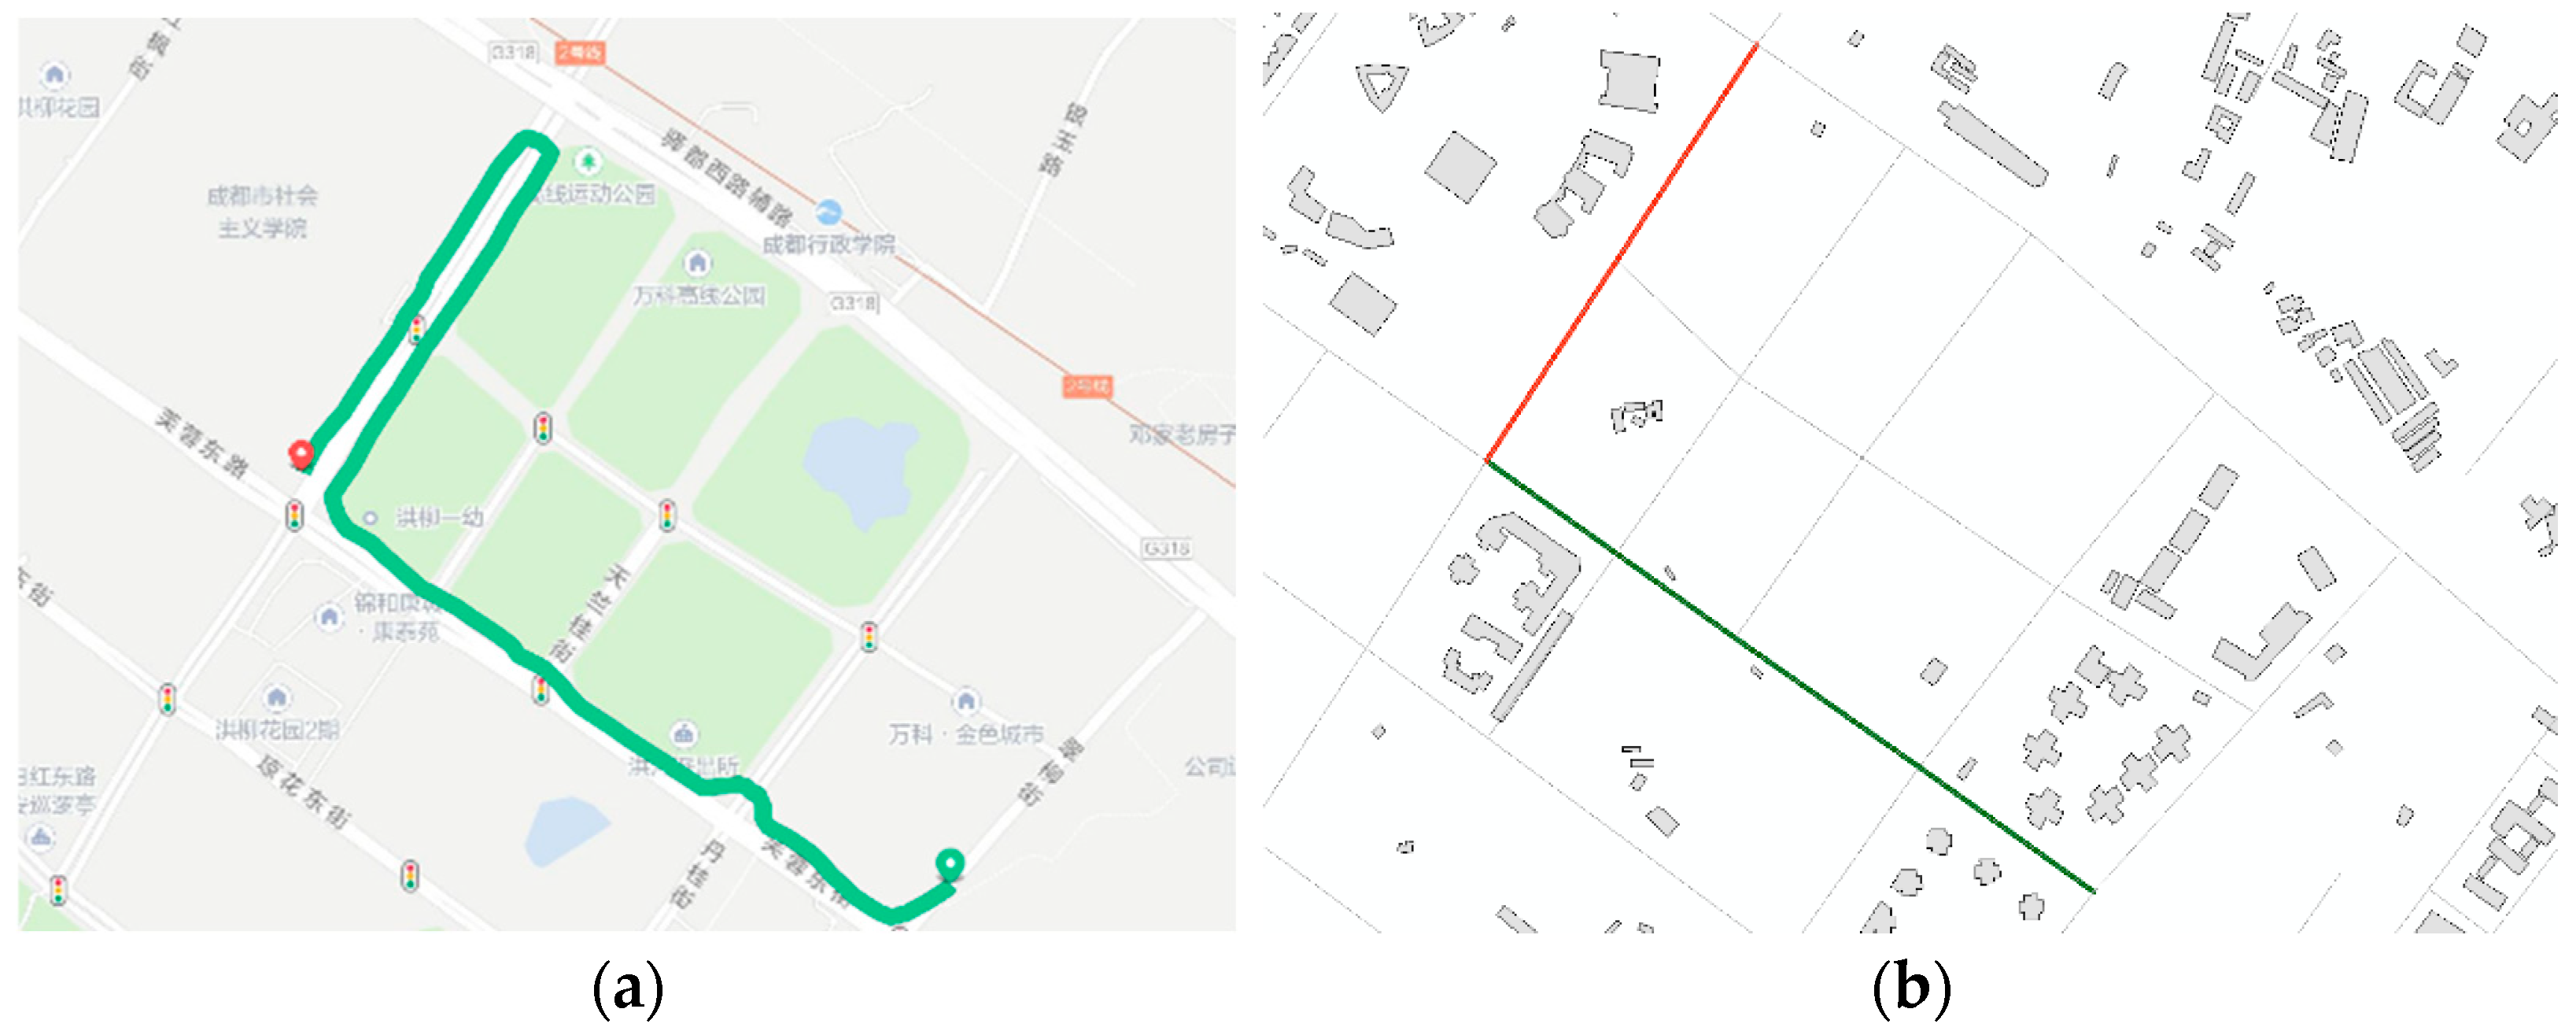
| Route shape | The shape of the route on the online map. (Since the images are screenshots from the APP, the Chinese characters in the figures represent the names of streets and facilities on the online map.) | 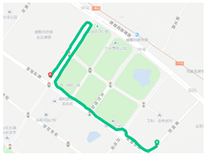 |
| Data | Source | Recency | Accuracy | Data Acquisition Time |
|---|---|---|---|---|
| Road Network Data | Open Street Map (www.openstreetmap.org) | June 2024 | - | June 2024 |
| Water Body Data | Open Street Map | - | ||
| Population Raster Data | WorldPop (www.worldpop.org) | 2018 | 100m | |
| Street View Image | Baidu Map (https://lbsyun.baidu.com) | June 2024 | - | |
| Point of Interest | Gaode Map (http://lbs.amap.com) | - | ||
| Building Footprint | Baidu Map | - |
| Dimensions | Variables | Abbr. | Description or Calculation | Scale | Units |
|---|---|---|---|---|---|
| Density | Building Density | D_BLD | Building/Population/POI density within the street visual perception range. | 100 m | % |
| Population Density | D_Pop | 100 m | Persons/km2 | ||
| POI Density | D_POI | Along the Street | Nums/m | ||
| Diversity | Density of Life and Education-related POIs | D_Life | Types of POI density within the street visual perception range. | Along the Street | Nums/m |
| Density of Sports and Leisure-related POIs | D_Sport | ||||
| Density of Transportation-related POIs | D_Trans | ||||
| Design | Building Façade Enclosure | R_BLD | The ratio of total building façade width to street length. | Along the Street | % |
| Green View Ratio | R_Vege | The Proportion of Sky, Greenery, and Pedestrian Path Extracted from Street View Images. | - | ||
| Sky View Ratio | R_Sky | ||||
| Pedestrian Path Coverage Ratio | R_Ped | ||||
| Polygonal Water Exposure Ratio | Expo_Lake | The ratio of the area visible to pedestrians, where the view through buildings reveals water bodies, to the total length of the street. | 80 m | ||
| Linear Water Exposure Ratio | Expo_River | 50 m | |||
| Distance to Transit (The number of public transport and subway stations in this paper includes those located on opposite streets) | Number of Bus Stops | N_Bus | The number of public transportation stops along the street. | Along the Street | Nums |
| Number of Metro Stations | N_Metro | ||||
| Accessibility | Road Network Accessibility | NAch_Global | Use the global and local NAch indicators from space syntax to express accessibility and simulate street motor vehicle flow. | Global | - |
| Safety | Simulated Traffic Flow in the Road Network | NAch_7k | 7000 m | - |
| Dimensions | Indicators | Max | Min | Mean | Std.Dev | Units |
|---|---|---|---|---|---|---|
| Density | D_BLD | 100.00% | 0.00% | 17.11% | 0.14 | % |
| D_Pop | 186,191.09 | 25.87 | 14,987.16 | 13711.98 | Persons/m2 | |
| D_POI | 6.92 | 0 | 0.05 | 0.09 | Nums/m | |
| Diversity | D_Life | 0.29 | 0 | 0.01 | 0.02 | Nums/m |
| D_Sport | 0.20 | 0 | 0.005 | 0.01 | ||
| D_Trans | 0.10 | 0 | 0.004 | 0.003 | ||
| Design | R_BLD | 99.55% | 0.00% | 20.26% | 0.20 | % |
| R_Vege | 91.12% | 0.00% | 27.02% | 0.12 | ||
| R_Sky | 44.50% | 0.00% | 8.69% | 0.07 | ||
| R_Ped | 17.06% | 0.00% | 3.31% | 0.02 | ||
| Expo_Lake | 100.00% | 0.00% | 5.28% | 0.20 | ||
| Expo_River | 100.00% | 0.00% | 10.27% | 0.28 | ||
| Distance to Transit | N_Bus | 5 | 0 | 0.15 | 0.42 | Nums |
| N_Metro | 8 | 0 | 0.04 | 0.31 | ||
| Accessibility | NAch_Global | 1.48 | 0 | 0.90 | 0.28 | - |
| Safety | NAch_7k | 3,907,158 | 0 | 174,492.87 | 377,905.64 |
| Bandwidth | Model Performance | ||
|---|---|---|---|
| Max | Min | Std. Dev | |
| 1500 m | 0.5605 | 20.65 | 56.74 |
| 1600 m | 0.5668 | 20.15 | 56.34 |
| 1700 m | 0.5546 | 20.79 | 57.12 |
| 1800 m | 0.5852 | 20.12 | 55.13 |
| 1900 m | 0.5690 | 21.12 | 56.19 |
| 2000 m | 0.5643 | 20.26 | 56.50 |
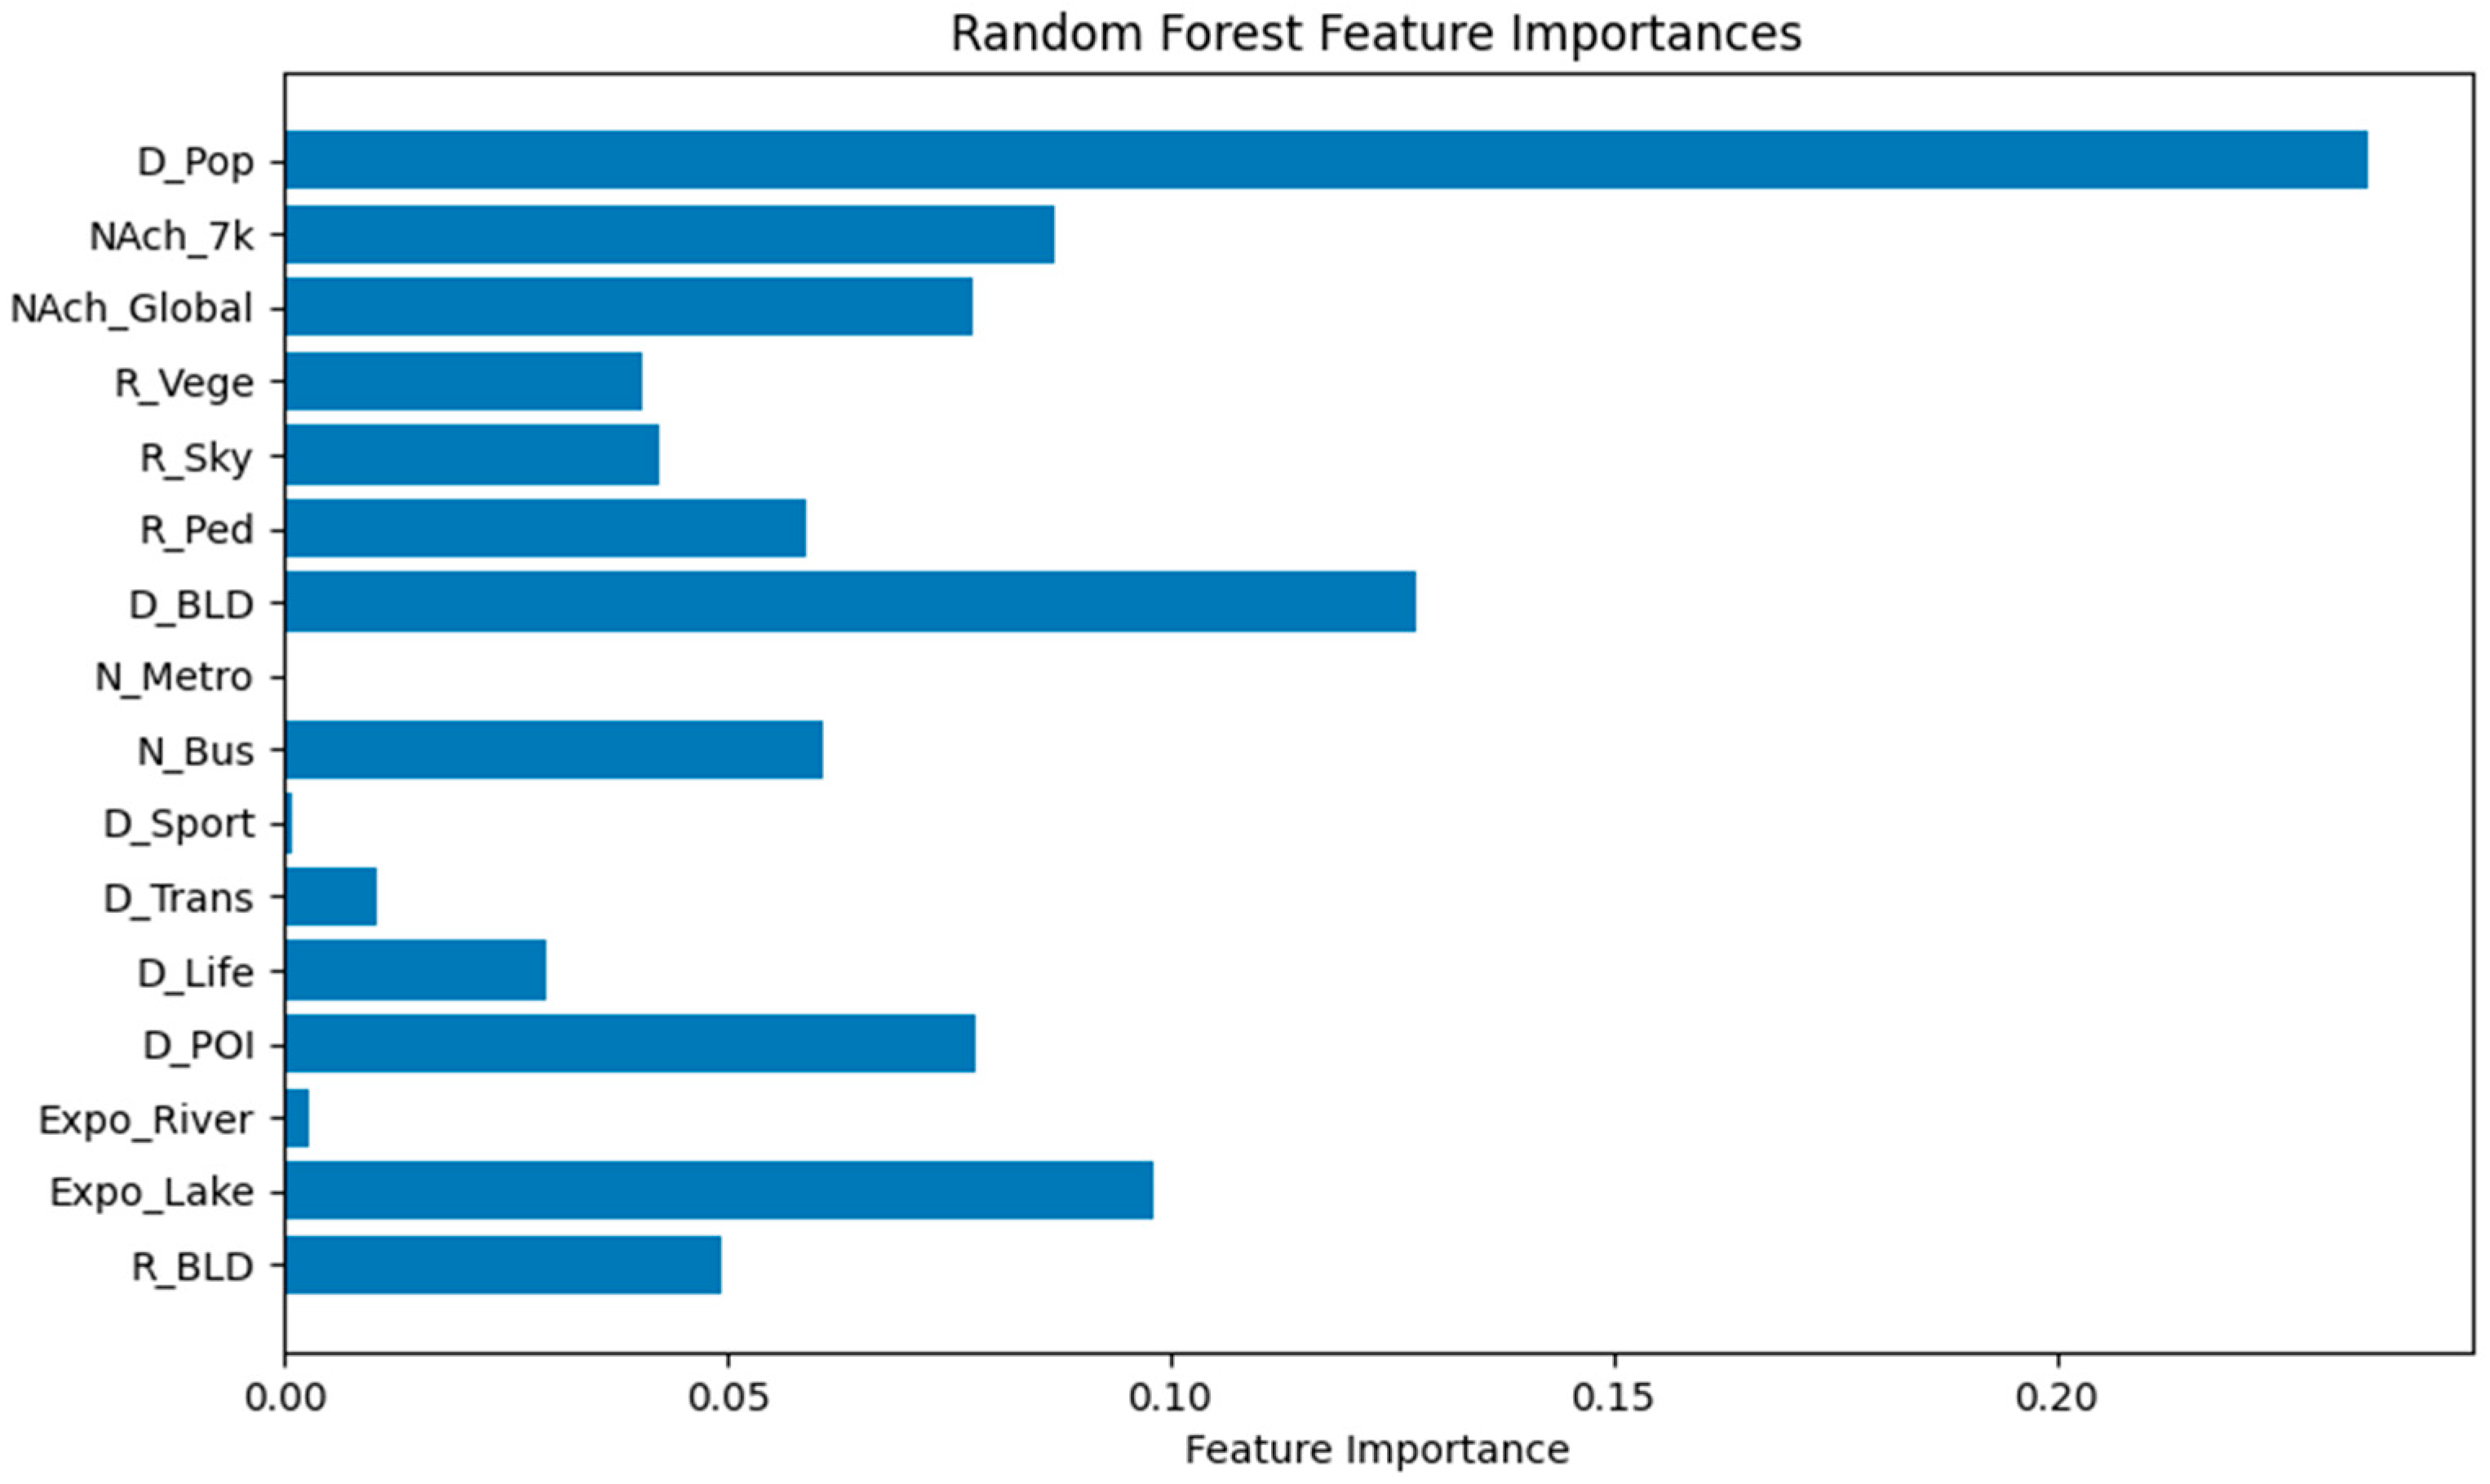
| Dimensions | Variables | Importance Value | Ranking |
|---|---|---|---|
| Density | D_BLD | 0.1277 | 2 |
| D_Pop | 0.2351 | 1 | |
| D_POI | 0.0782 | 5 | |
| Diversity | D_Life | 0.0295 | 12 |
| D_Sport | 0.0008 | 15 | |
| D_Trans | 0.0105 | 13 | |
| Design | R_BLD | 0.0494 | 8 |
| R_Vege | 0.0405 | 11 | |
| R_Sky | 0.0423 | 10 | |
| R_Ped | 0.0513 | 9 | |
| Expo_Lake | 0.0982 | 3 | |
| Expo_River | 0.0030 | 14 | |
| Distance to Transit | N_Bus | 0.0608 | 7 |
| N_Metro | 0.0004 | 16 | |
| Accessibility | NAch_Global | 0.0778 | 6 |
| Safety | NAch_7k | 0.0870 | 4 |
| Dimensions | Variables | Effect Type | Units | Promotion Interval | Inhibition Interval | Positive Slope | Negative Slope | Neutral Slope |
|---|---|---|---|---|---|---|---|---|
| Density | D_BLD | Nonlinear | - | <10% | >10% | - | 0–70% | >70% |
| D_Pop | Nonlinear | Persons/km2 | <8000 | >8000 | - | 0–15000 | >15000 | |
| D_POI | Nonlinear | Nums/m | <0.03 | >0.03 | - | 0–0.1 | >0.1 | |
| Diversity | D_Life | Nonlinear | Nums/m | 0.002–0.01 | <0.001 | 0–0.004 | 0.004–0.012 | >0.012 |
| >0.01 | ||||||||
| D_Sport | Nonlinear | Nums/m | >0.002 | <0.002 | >0.001 | <0.001 | None | |
| D_Trans | Nonlinear | Nums/m | >0.002 | <0.002 | All | - | - | |
| Design | R_BLD | Nonlinear | - | <4% | >4% | - | <20% | >20% |
| R_Vege | Nonlinear | - | >50% | <50% | >30% | <30% | - | |
| R_Sky | Nonlinear | - | >15% | <15% | >5% | <5% | - | |
| R_Ped | Nonlinear | - | >10% | <10% | >8% | - | 0–8% | |
| Expo_Lake | Linear | - | >50% | <50% | All | - | - | |
| Expo_River | Linear | - | >20% | <20% | >40% | - | <40% | |
| Distance to Transit | N_Bus | Nonlinear | Nums | >1 | <1 | >1 | - | <1 |
| N_Metro | Linear | Nums | >0.4 | <0.4 | All | - | - | |
| Accessibility | NAch_Global | Nonlinear | - | <0.75 | 0.75–1.42 | >1.08 | <1.08 | - |
| >1.42 | ||||||||
| Safety | NAch_7k | Nonlinear | - | <0.1 × 10⁶ | >0.1 × 10⁶ | - | 0–0.4 × 10⁶ | >0.4 × 10⁶ |
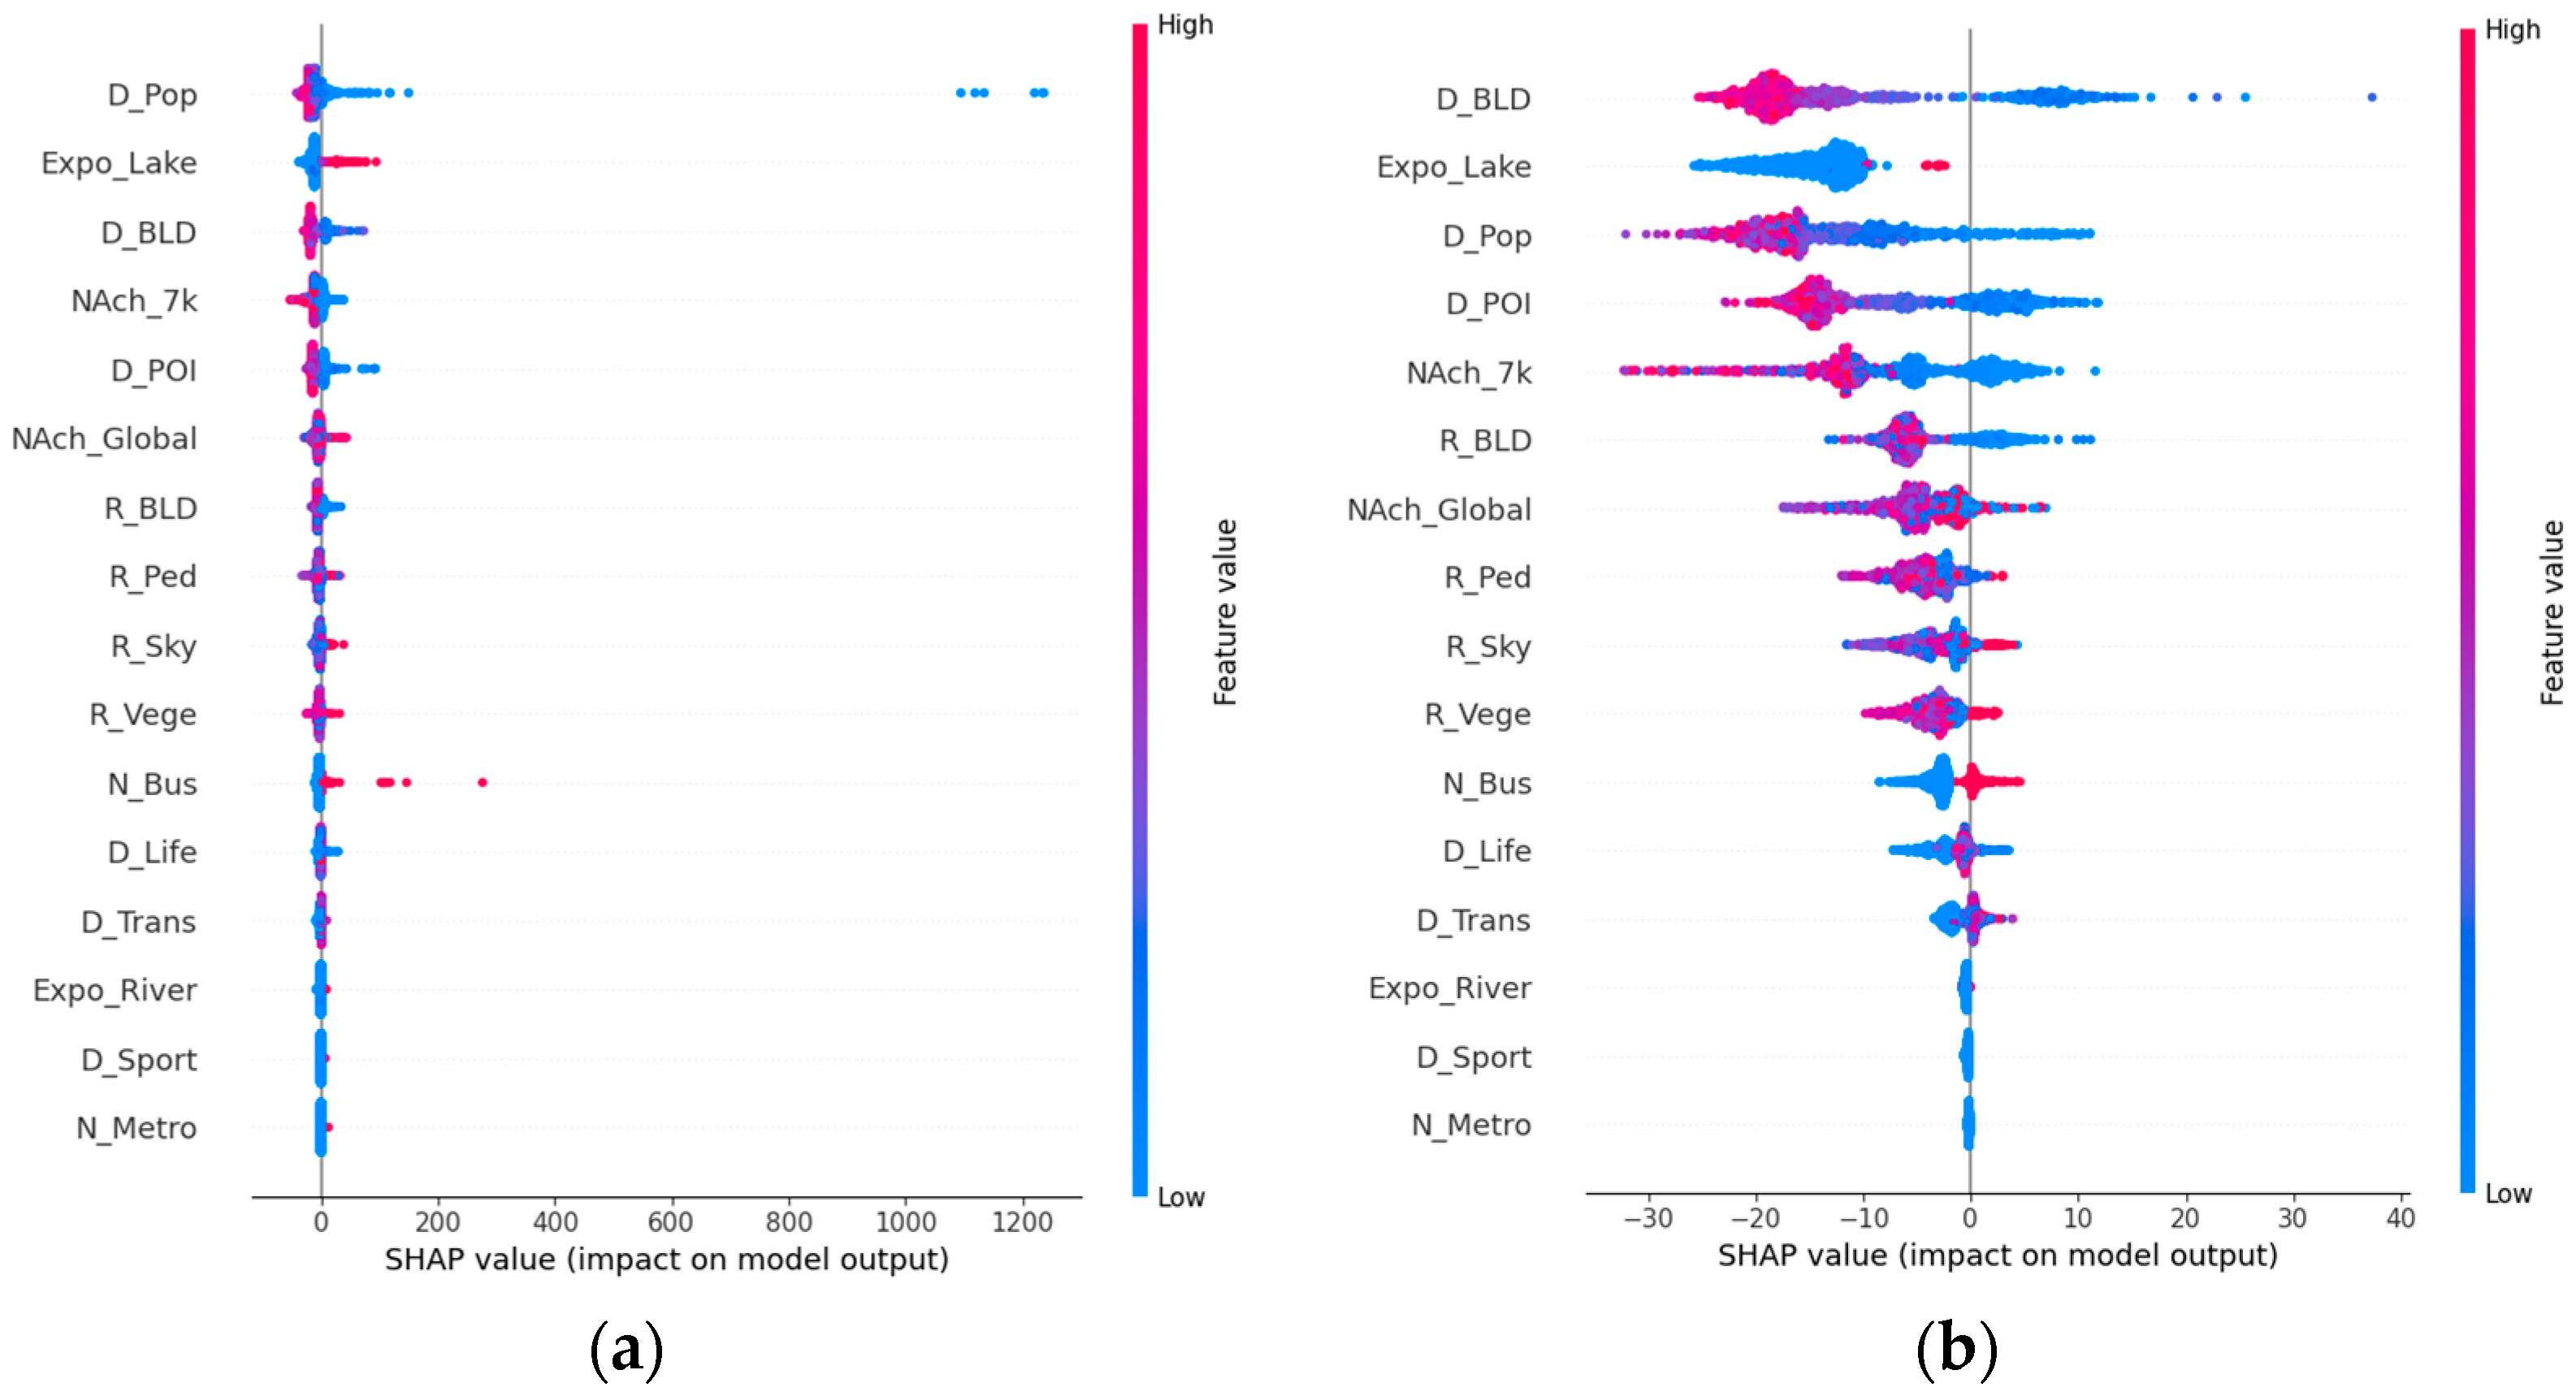
| Variables | Ranking of Main Effects | Ranking of Global Importance |
|---|---|---|
| Expo_Lake | 1 | 3 |
| D_BLD | 2 | 2 |
| D_Pop | 3 | 1 |
| D_POI | 4 | 5 |
| Nach_7k | 5 | 4 |
| R_BLD | 6 | 9 |
| R_Ped | 7 | 8 |
| NAch_Global | 8 | 6 |
| Indicators | Basic Requirements | Optimal Interval | Planning Recommendations |
|---|---|---|---|
| R_Vege | - | 50–85% (Considering that R_Vege and R_Sky are variables that conflict with each other to a certain extent, the calculation of the optimal interval takes their contradiction into account. Specifically, the maximum value of the optimal interval for the vegetation view ratio should not affect the minimum value of the optimal interval for the sky view ratio) | Considering that tall trees may affect the sky view ratio by shading the sky, it is recommended to add diverse low-growing plants to enrich the landscape experience of the street. |
| R_Sky | - | 15–50% | Newly built blocks must pay attention to building height and the continuity of building facades (with reasonable openings set in continuous building facades to ensure the openness of space); at the same time, optimize the proportion of facilities such as tall street trees and billboards. |
| R_Ped | 10% | - | Add non-motorized traffic facilities such as dedicated street walkways, with their length accounting for more than 10% of the street width. |
| D_POI | >0.01 | Ensure that there is at least one daily service facility per 100 m of street to provide basic supplies (such as drinking water) for MPA activities through on-site purchases, while also maintaining a basic level of human activity on the street. |
| Variables | Indicator Interval (This Indicator Range Refers to the Actual Situation Rather Than the Intervention Target) | Planning Recommendations |
|---|---|---|
| D_Pop | <2000 p/km2 | Maintain the basic pedestrian flow on the street by setting an appropriate number of public facilities that can gather people (such as street plazas with good environments), so as to provide basic human presence and a sense of security for MPA activities. |
| 0–60,000 p/km2 | More than 30% of BLD and a D_POI greater than 0.13 can promote MPA through synergistic effects. | |
| D_BLD | <10% | Improve road network accessibility or add public transportation facilities to facilitate public access to such low-density spaces. |
| >10% | Increase D_POI to above 0.12, while enhancing the richness of POI types; | |
| Expo_Lake | 0–80% | Ensure basic pedestrian walkway facilities (R_Ped > 3.58); |
| 80–100% | Attempt to reduce the traffic flow in the area through certain traffic control measures. |
Disclaimer/Publisher’s Note: The statements, opinions and data contained in all publications are solely those of the individual author(s) and contributor(s) and not of MDPI and/or the editor(s). MDPI and/or the editor(s) disclaim responsibility for any injury to people or property resulting from any ideas, methods, instructions or products referred to in the content. |
© 2025 by the authors. Licensee MDPI, Basel, Switzerland. This article is an open access article distributed under the terms and conditions of the Creative Commons Attribution (CC BY) license (https://creativecommons.org/licenses/by/4.0/).
Share and Cite
Shen, H.; Zhang, J.; Li, A.; Liu, Y. From Perception to Behavior: Exploring the Impact Mechanism of Street Built Environment on Mobile Physical Activity Using Multi-Source Data and Explainable Machine Learning. Land 2025, 14, 2315. https://doi.org/10.3390/land14122315
Shen H, Zhang J, Li A, Liu Y. From Perception to Behavior: Exploring the Impact Mechanism of Street Built Environment on Mobile Physical Activity Using Multi-Source Data and Explainable Machine Learning. Land. 2025; 14(12):2315. https://doi.org/10.3390/land14122315
Chicago/Turabian StyleShen, Hao, Jian Zhang, Ali Li, and Yaoqian Liu. 2025. "From Perception to Behavior: Exploring the Impact Mechanism of Street Built Environment on Mobile Physical Activity Using Multi-Source Data and Explainable Machine Learning" Land 14, no. 12: 2315. https://doi.org/10.3390/land14122315
APA StyleShen, H., Zhang, J., Li, A., & Liu, Y. (2025). From Perception to Behavior: Exploring the Impact Mechanism of Street Built Environment on Mobile Physical Activity Using Multi-Source Data and Explainable Machine Learning. Land, 14(12), 2315. https://doi.org/10.3390/land14122315


