Article

How Ecological Compensation Reshapes Ecosystem Service Trade-Offs and Synergies: A Multi-Scale Analysis of the Miyun Reservoir Basin (2010–2023)

by
Liwen Zhang
1,
Haixia Zheng
1,2,*,
Jieying Bi
1 and
Xuebiao Zhang
1,2
1
Agricultural Information Institute, Chinese Academy of Agricultural Sciences, Beijing 100081, China
2
Key Laboratory of Agricultural Big Data, Ministry of Agriculture and Rural Affairs, Beijing 100081, China
*
Author to whom correspondence should be addressed.
Land 2025, 14(12), 2305; https://doi.org/10.3390/land14122305 (registering DOI)
Submission received: 22 October 2025 / Revised: 18 November 2025 / Accepted: 21 November 2025 / Published: 23 November 2025

Abstract

Understanding how ecological compensation policies reshape ecosystem service (ES) interactions is critical for sustainable watershed management. Using the Miyun Reservoir Basin in northern China as a case study, we examined the dynamic changes in land use, provision of ES, and their trade-offs and synergies (TOS) from 2010 to 2023. Four ES—food production (FP), water yield (WY), nutrient retention (nitrogen and phosphorus, NR and PR), and soil retention (SR)—were quantified using the InVEST model. Spearman’s rank correlation was employed to assess TOS at 1 km, 3 km, and township-level administrative units, and geographically weighted regression (GWR) was applied to explore spatial heterogeneity of ES TOS. Results show: (1) Land use change reflected ecological restoration efforts, with cropland decreasing by 1.69% and forest expanding by 2.16%. (2) ES exhibited spatial heterogeneity; regulating services (WY, NR, PR, SR) improved substantially after 2018, while the FP centroid shifted from downstream to upstream areas. (3) Before 2018, FP showed strong trade-offs with regulating services; following intensified policy implementation, these relationships transformed into synergies. (4) Scale effects were evident: grid-scale TOS were stable, while township-level interactions weakened due to administrative aggregation. Overall, ecological compensation reduced ES trade-offs and enhanced synergies, supporting ecological protection in key water source areas while highlighting the need for performance-based policy refinement.

1. Introduction

With the advancement of economic development and urbanization, land use has undergone continuous transformation. Meanwhile, ecological degradation has emerged as a prominent environmental issue in many regions [1], calling for scientific management and policy interventions to balance regional ecological protection with socioeconomic development. In recent years, ecosystem services (ES), which contribute to human well-being and sustainable environmental development, have gained increasing attention in ecological decision-making [2].
Ecosystem services denote the diverse benefits that human societies derive from natural systems, underpinned by ecological structures, processes, and functions that support or enhance human well-being [2,3,4,5]. The widely adopted Millennium Ecosystem Assessment (2005) framework categorizes ES into four types: provisioning, regulating, supporting, and cultural services. Interactions among these services are often characterized by trade-offs—where gains in one service lead to losses in another—or synergies, in which multiple services improve concurrently [6,7,8,9]. Recognizing such interdependencies is critical for integrated ecosystem management and informed spatial planning [10].
Over the past few years, academic interest in the interactions—particularly trade-offs and synergies—among ecosystem services has risen steadily, with studies conducted at global, regional, and local levels [11,12,13,14]. Research has covered diverse ecosystem types, including forests [15,16], peatlands [17], river and lake basins [18,19], and urban agglomerations [20]. Recent studies have applied multi-scale approaches to examine ES trade-offs in Chinese watersheds, and findings show that food production typically exhibits trade-offs with other ES, while water yield shows a strong positive association with nutrient retention, and interactions among regulating and supporting services vary across ecosystems and socio-ecological contexts [21,22,23]. Common methods for quantifying ES trade-offs include spatial overlay analysis [19], the Land-Use Conflict Identification Strategy (LUCIS) model [24], Pearson or Spearman correlation analysis [25,26,27,28], geographically weighted regression [20,29], bivariate spatial autocorrelation [30], and mechanical equilibrium models [31]. Given its non-parametric nature, Spearman’s rank correlation is frequently applied to analyze relationships among ecosystem service indicators that lack normal distribution.
Evidence suggests that ES interactions often vary across spatial scales, indicating scale effects in ES assessments [32,33]. Therefore, selecting an appropriate spatial scale is essential to ensure reliable scientific references for ecosystem management decisions. Furthermore, the patterns of trade-offs and synergies among ecosystem services are shaped by an interplay of natural, ecological, socioeconomic, and policy-related factors [34]. Previous studies have investigated how precipitation, vegetation patterns, population density, GDP, and agricultural production affect ES relationships [10,26,35]. However, most research has emphasized spatial differentiation while paying limited attention to temporal evolution [19,36], especially concerning the impacts of major ecological restoration projects and environmental policies on ES interactions. Recently, policy-related studies have begun to explore the influence of ecological restoration [30], ecological redlines [37], and cultivated land protection [23] on ES trade-offs and synergies.
Ecological compensation (EC), particularly through Payment for Ecosystem Services (PES) schemes, provides financial incentives for environmental stewardship and has been widely adopted as a mechanism to reconcile regional development and ecological protection [38]. Many countries have initiated PES programs through legislative or policy frameworks [39]. In China, ecological compensation originated with the Grain-to-Green Program in 1999 and has since expanded to forests, grasslands, wetlands, watersheds, marine ecosystems, and agricultural lands [40]. Currently, China invests approximately 220 billion CNY annually in ecological compensation.
River, lake, and wetland ecosystems surrounding cities provide essential ES that support rural livelihoods and urban economic development. Situated in northeastern Beijing, the Miyun Reservoir is northern China’s largest reservoir and plays a vital role as both a primary drinking water supply and a strategic water reserve for the capital. The upstream Chaohe and Baihe river systems originate in Hebei Province, where two-thirds of the basin area is located. Due to the mobility of ecological services, upstream areas play a vital role in maintaining water quality and supply for downstream users [41]. To strengthen watershed protection, Beijing and Hebei launched a horizontal ecological compensation program in 2018, implementing water conservation measures, industrial restructuring, and ecological restoration initiatives across upstream and downstream counties. These measures have significantly affected multiple ES within the basin. However, different ES respond unevenly to compensation policies, and the dynamics of trade-offs and synergies under PES remain unclear.
To bridge these gaps, this study addresses the following research questions: (1) How have land use patterns and key ecosystem services changed in the Miyun Reservoir Basin from 2010 to 2023? (2) How do trade-offs and synergies among these ecosystem services vary across spatial scales (1 km, 3 km, and township levels)? (3) To what extent do shifts in ES interactions after 2018 coincide with the implementation of the Beijing–Hebei horizontal ecological compensation scheme?
In contrast to existing work that typically relies either on observations at fixed decadal or quinquennial intervals or on single-scale assessments, this study uniquely integrates a policy intervention timeline (pre- vs. post-2018), multi-scale correlation analysis (1 km, 3 km, township), and a transboundary ecological compensation context, offering new insights into institutional influences on ES relationships. The findings aim to provide policy-relevant insights for improving ecosystem-based management and optimizing ecological compensation mechanisms in critical water source regions.

2. Materials and Methods

2.1. Overview of the Study Area

The Miyun Reservoir, located in northeastern Beijing within the central region of Miyun District (40°19′–41°38′ N, 115°25′–117°35′ E), is the largest reservoir in northern China. At normal high-water level, the reservoir has a surface area of approximately 188 km2, with water depths ranging from 40 to 60 m, and a total storage capacity of 4.375 billion m3. The Miyun Reservoir Basin is defined as the upper catchment area of the Chaohe and Baihe River Basin controlled by the Miyun Reservoir. It consists of two main river systems—the Chaohe River and the Baihe River—and encompasses a drainage area of 15,788 km2, accounting for about 88% of the entire Chaohe and Baihe River Basin. Roughly one-quarter of the basin lies within the Beijing municipality, while the remaining three-quarters extend into neighboring cities, Chengde and Zhangjiakou in Hebei Province (Figure 1). In this study, the basin boundary is delineated according to the actual administrative boundaries of towns and villages within the watershed.
This basin is positioned in a temperate continental monsoon climate zone at mid-latitudes, marked by a transitional regime between semi-arid and semi-humid conditions. Characterized by hot, humid summers and frigid, arid winters, the area receives approximately 80% of its annual rainfall within the summer monsoon months of June through September. Topographically, the basin slopes from northwest to southeast. The northwestern area is dominated by mid-altitude mountains with elevations ranging from 1000 to 2300 m, whereas the southeastern area consists mainly of low mountains, hills, and alluvial plains along river channels. Although the drainage system features steep terrain, deep valleys, and rapid surface runoff, the basin often suffers from limited surface water availability and persistent low flows due to climatic and geological constraints. Moreover, significant socioeconomic disparities exist within the basin due to administrative division between Beijing and Hebei Province, leading to differences in development levels and land-use intensity.
As a focal area for watershed conservation and ecosystem service management, the Miyun Reservoir Basin has been subject to intensive conservation efforts to safeguard its water quality and quantity, including afforestation, farmland retirement, and restrictions on industrial and agricultural activities since the early 2000s. A landmark institutional development occurred in 2018, when Beijing and Hebei jointly established a horizontal ecological compensation mechanism for source water protection. This initial three-year agreement (2018–2020) was succeeded by a second-phase agreement signed in August 2022, extending the framework through 2025. The mechanism integrates multiple efforts for watershed protection, including water environment management, soil and water conservation, watershed ecological restoration, water resource conservation, and performance evaluation in the source conservation zone of the Chaohe and Baihe River Basin upstream of the Miyun Reservoir. It marks the institutionalization, normalization, and stabilization of integrated watershed governance throughout the upper and lower reaches of the Miyun Reservoir Basin.

2.2. Data Sources

This study utilizes two primary types of data: natural environmental and socio-economic datasets (Table 1). The natural environmental data primarily include raster datasets on land use/land cover, soil characteristics, atmospheric conditions, topography, and vegetation indices. The socio-economic data mainly consist of rasterized crop production data. Grain yield statistics were obtained from local statistical yearbooks and supplementary data released by municipal and county-level statistical authorities. Detailed descriptions and sources of all datasets are presented in Table 1.
To ensure spatial consistency, all datasets were preprocessed before analysis. All vector and raster datasets were first reprojected to a common coordinate system (WGS_1984_UTM_Zone_50N). Raster layers were then resampled to a 100 m spatial resolution to meet model input specifications and enable cross-scale analyses at 1 km and 3 km grid levels. Third, all datasets were clipped to the boundary of the Miyun Reservoir Basin, which was delineated based on township-level administrative boundaries within the watershed. Finally, missing values were handled through spatial interpolation or nearest-neighbor assignment depending on the data type, and multi-year datasets were normalized to maintain temporal comparability.
Based on the land cover classification system developed by the Chinese Academy of Sciences, the land use/land cover (LULC) dataset was divided into six main types: cropland, forest, grassland, water bodies, built-up land, and unused land. Climate variables, including annual precipitation and potential evapotranspiration, were obtained from the “China Monthly Precipitation Dataset with 1 km Spatial Resolution (1901–2023)” [42,43,44,45]. Potential evapotranspiration (PET) data were derived from the “China Monthly Potential Evapotranspiration Dataset with 1 km Spatial Resolution (1901–2023)” [46]. The original precipitation and potential evapotranspiration datasets were provided in NetCDF (.nc) format. These data were preprocessed in ArcMap using the Multidimensional Tools module and subsequently converted into GeoTIFF (.tif) raster format to ensure compatibility with spatial analysis and ecosystem service modeling. Soil data required by the InVEST model, such as soil depth and texture, were extracted from the Harmonized World Soil Database.

2.3. Methodology

2.3.1. Land Use Change Assessment Approach

Land use competition is commonly identified as a primary factor underlying trade-offs between ecosystem services [16]. Following the signing of the horizontal ecological compensation agreement between Beijing and Hebei, a series of ecological control and restoration measures were implemented across upstream and downstream administrative regions of the Miyun Reservoir Basin to ensure water quality and water supply security. Consequently, significant land use transformations have occurred within the basin. For example, measures such as cropland retirement have led to the conversion of cropland into forest or grassland, while fluctuations in water levels downstream near the reservoir have resulted in the inundation of agricultural land and rural settlements, converting them into water bodies in certain years. To examine these dynamics, this study employed LULC datasets from the Chinese Academy of Sciences and conducted spatial analysis using ArcMap 10.8 (Esri, Redlands, CA, USA) analyze the spatiotemporal dynamics of land use within the basin.

2.3.2. Quantification of Ecosystem Services

Healthy freshwater ecosystems provide multiple ecological functions and services. In selecting ecosystem service types, this study referred to mainstream ES classification frameworks and aimed to cover provisioning, regulating, and supporting services. Meanwhile, consideration was given to the relevance of ESs to the ecological compensation policy implemented in the region. Under compensation-related measures, agricultural activity restrictions have directly affected food production, while water yield and water purification services are closely aligned with the policy’s water quality and water supply objectives. In addition, soil retention has been a priority target in ecological restoration efforts in the upper basin, as it reduces sediment loads in surface runoff—thereby contributing to water quality—while also mitigating reservoir siltation, protecting storage capacity, and supporting water supply regulation.
Based on policy relevance, data availability, and feasibility of quantitative assessment, the analysis focused on five indicators across four ES categories: food production (FP), water yield (WY), water purification (nutrient retention: nitrogen and phosphorus), and soil retention (SR). Among these, nitrogen retention (NR) and phosphorus retention (PR) are key indicators in water quality assessments under the ecological compensation scheme of the Miyun Reservoir Basin. The quantification of these ESs was carried out using the InVEST (Integrated Valuation of Ecosystem Services and Tradeoffs) version 3.14.2 modeling toolkit in combination with spatial analysis tools in ArcMap.
Following the Millennium Ecosystem Assessment (2005) and recent conceptual advances, we distinguish between ecosystem functions (biophysical processes) and ecosystem services (benefits humans derive from those functions). However, consistent with widely adopted modeling frameworks such as InVEST, this study quantifies the potential supply or flow of ecosystem services—i.e., the biophysical capacity of ecosystems to deliver benefits—rather than their actual use, demand, or monetary value. For brevity and alignment with common practice in spatial ES assessment literature, we refer to these biophysical indicators (e.g., water yield, nutrient retention) as “ecosystem services”, while acknowledging that they represent service potentials that may or may not be realized depending on socio-ecological context and human demand.
Food Production
Previous studies have demonstrated a significant linear correlation between the Normalized Difference Vegetation Index (NDVI) and crop yields [47,48]. To estimate the supply of food production services within the Miyun Reservoir Basin, this study used township-level grain yield statistics acquired from the annual statistical publications of local counties and municipalities within the basin. The total grain yield for each township was spatially allocated to cropland pixels through NDVI-based downscaling. Specifically, the grain yield for each pixel was allocated based on its NDVI value as a proportion of the total NDVI sum across all cropland pixels within the same township [49]. This method accounts for spatial heterogeneity in crop productivity. The core calculation formulas are as follows:
F P i = N D V I i N D V I i t × C Y i t
where FPi denotes the grain production functional amount of the i-th cropland grid cell, NDVIi indicates the annual maximum NDVI value of the i-th cropland grid cell, NDVIit signifies the sum of NDVI values for township t to which the i-th cropland grid cell belongs, and CYit represents the grain yield of township t to which the i-th cropland grid cell belongs.
Water Yield
Estimation of the water yield ecosystem service in the Miyun Reservoir Basin was carried out with the InVEST Annual Water Yield model (Integrated Valuation of Ecosystem Services and Tradeoffs). The model is raster-based and calculates annual water yield as the difference between precipitation and actual evapotranspiration, without distinguishing among surface runoff, subsurface flow, and baseflow components. The core equations are as follows:
Y ( x ) = ( 1 A E T ( X ) P R E ( x ) ) × P R E ( x )
where Y(x) denotes the annual water yield of grid cell x, AET(x) signifies the annual actual evapotranspiration of grid cell x, and PRE(x) indicates the annual precipitation of grid cell x.
Water Quality Purification
Water quality purification is a critical regulating ecosystem service that directly reflects the health and resilience of watershed ecosystems. Evaluating the nutrient retention capacity of the Miyun Reservoir Basin helps to reveal the ecosystem’s ability to mitigate non-point source pollution, identify ecological vulnerability zones, and support sustainable watershed management.
In this study, water purification services were quantified using the Nutrient Delivery Ratio (NDR) module of the InVEST model, which evaluates the retention of total nitrogen (TN) and total phosphorus (TP) from non-point source pollution. The NDR model estimates the potential transport of nutrients from terrestrial landscapes to river systems and identifies critical source areas of nutrient loading. It simulates nutrient generation, retention, and transport dynamics based on spatially explicit land use data, hydrological processes, and terrain characteristics.
The model assumes that nutrient loading (e.g., fertilizer application, rural wastewater discharge) varies across land use types and human activities, while nutrient transport efficiency is influenced by factors such as slope, soil properties, precipitation, and vegetation cover. The key concept of the NDR model is the nutrient delivery ratio (NDR), which represents the proportion of nutrient loads that are actually delivered to the stream network from each pixel. In this study, only surface nutrient transport pathways for nitrogen and phosphorus were considered, following common practice in watershed-scale assessments [50].
The nutrient delivery ratio for each pixel is calculated as follows:
N D R i = N D R 0 , i 1 + e x p ( I C 0 I C i k ) 1
where NDRi denotes the nutrient delivery ratio of pixel i; NDR0,i indicates the baseline or maximum potential nutrient delivery ratio for the land use type of pixel i; ICi is the hydrological connectivity index of pixel i; IC0 denotes the calibration parameter representing the inflection point of the logistic function; k is a shape parameter controlling the steepness of the nutrient delivery response curve.
Soil Retention
Soil retention is an essential regulating ecosystem service whereby natural ecosystems mitigate soil erosion and sediment deposition caused by rainfall and other natural forces through physical, chemical, and biological processes. This service plays a critical role in maintaining soil structure stability, preserving soil fertility, sustaining land productivity, and ensuring ecological security. The Miyun Reservoir is instrumental in ensuring water availability and managing flood risks across the Beijing–Tianjin–Hebei region. The soil retention capacity within its basin directly affects the intensity of soil erosion and ultimately determines the amount of sediment transported into the reservoir. Studies have shown that by 2015, sediment deposition in the Miyun Reservoir had reached 170 million cubic meters. Sediment generated by soil erosion is transported into the reservoir via runoff, which not only degrades water quality but also reduces storage capacity through siltation, thereby weakening the reservoir’s regulation capacity and undermining regional water security [51]. Therefore, assessing the soil retention function is essential for identifying high-risk areas of soil erosion and for implementing targeted ecological conservation measures to mitigate siltation and support water security in the capital region.
The soil retention service in the Miyun Reservoir Basin was evaluated using the Sediment Delivery Ratio (SDR) module of the InVEST model. First, the Revised Universal Soil Loss Equation (RUSLE) was used to estimate potential soil erosion for each pixel. Then, based on the sediment delivery ratio, the actual sediment export from each pixel was calculated. Finally, the supply of soil retention services was quantified as the difference between potential soil erosion and actual sediment export. The calculation formulas are as follows:
  U S L E   =   R   ×   K   ×   L S   ×   C   ×   P
E = U S L E × S D R
S S R = S R = U S L E E
where USLE denotes the annual total soil erosion, R indicates the rainfall erosivity factor, K signifies the soil erodibility factor, LS represents the slope length and steepness factor, C refers to the cover-management factor, and P denotes the support practice factor. SSR indicates the supply of soil retention service, and SR represents the soil retention amount.

2.3.3. Analysis of TOS Among ESs

Correlation Analysis
To assess trade-offs and synergies among the five ecosystem service indicators—FP, WY, NR, PR, and SR—correlation analysis was conducted across three spatial scales: 1 km and 3 km grid cells, and township-level units. The 1 km × 1 km and 3 km × 3 km fishnet grids covering the study area were created using the Fishnet tool in ArcMap. Subsequently, the Spearman rank correlation coefficient was calculated in R (version 4.4.3; R Core Team, 2024) to examine the relationships among changes in the four categories of ecosystem services during four time intervals: 2010–2015, 2015–2018, 2018–2020, and 2020–2023. This approach enabled the identification of trade-off (negative correlation) or synergy (positive correlation) relationships among ESs.
Geographically Weighted Regression
In order to investigate the spatial heterogeneity of the TOS of the four key ESs (including five quantified indicators) in the Miyun Reservoir Basin, we employed geographically weighted regression (GWR) based on the net change in ES indicators (∆ES) at the township-level from 2010–2023:
E S = E S 2023 E S 2010
Prior to modeling, all five ∆ES variables were standardized via z-score transformation to ensure comparability across variables with different units:
z = x x ¯ s
where x ¯ is the mean and s is the standard deviation.
GWR analyses were conducted using GWR tool in ArcMAP 10.8. The GWR approach addresses spatial non-stationarity by calibrating local regression coefficients that vary across space, offering a more nuanced understanding of ES interactions. Its mathematical formulation is:
y i = β 0 ( u i , v i ) + k = 1 4 β k ( u i , v i ) x i k + ε i
where yi denotes the change in one ecosystem service indicator for township i, xik represents the corresponding changes in the other four ES indicators; and (uivi) are the geographic coordinates of the administrative center of township i; β0(ui, vi) is the local intercept; βk(ui, vi) is the local regression coefficient for the k-th explanatory variable at location (ui, vi); and εi is the error term.

3. Results

3.1. Land Use Change

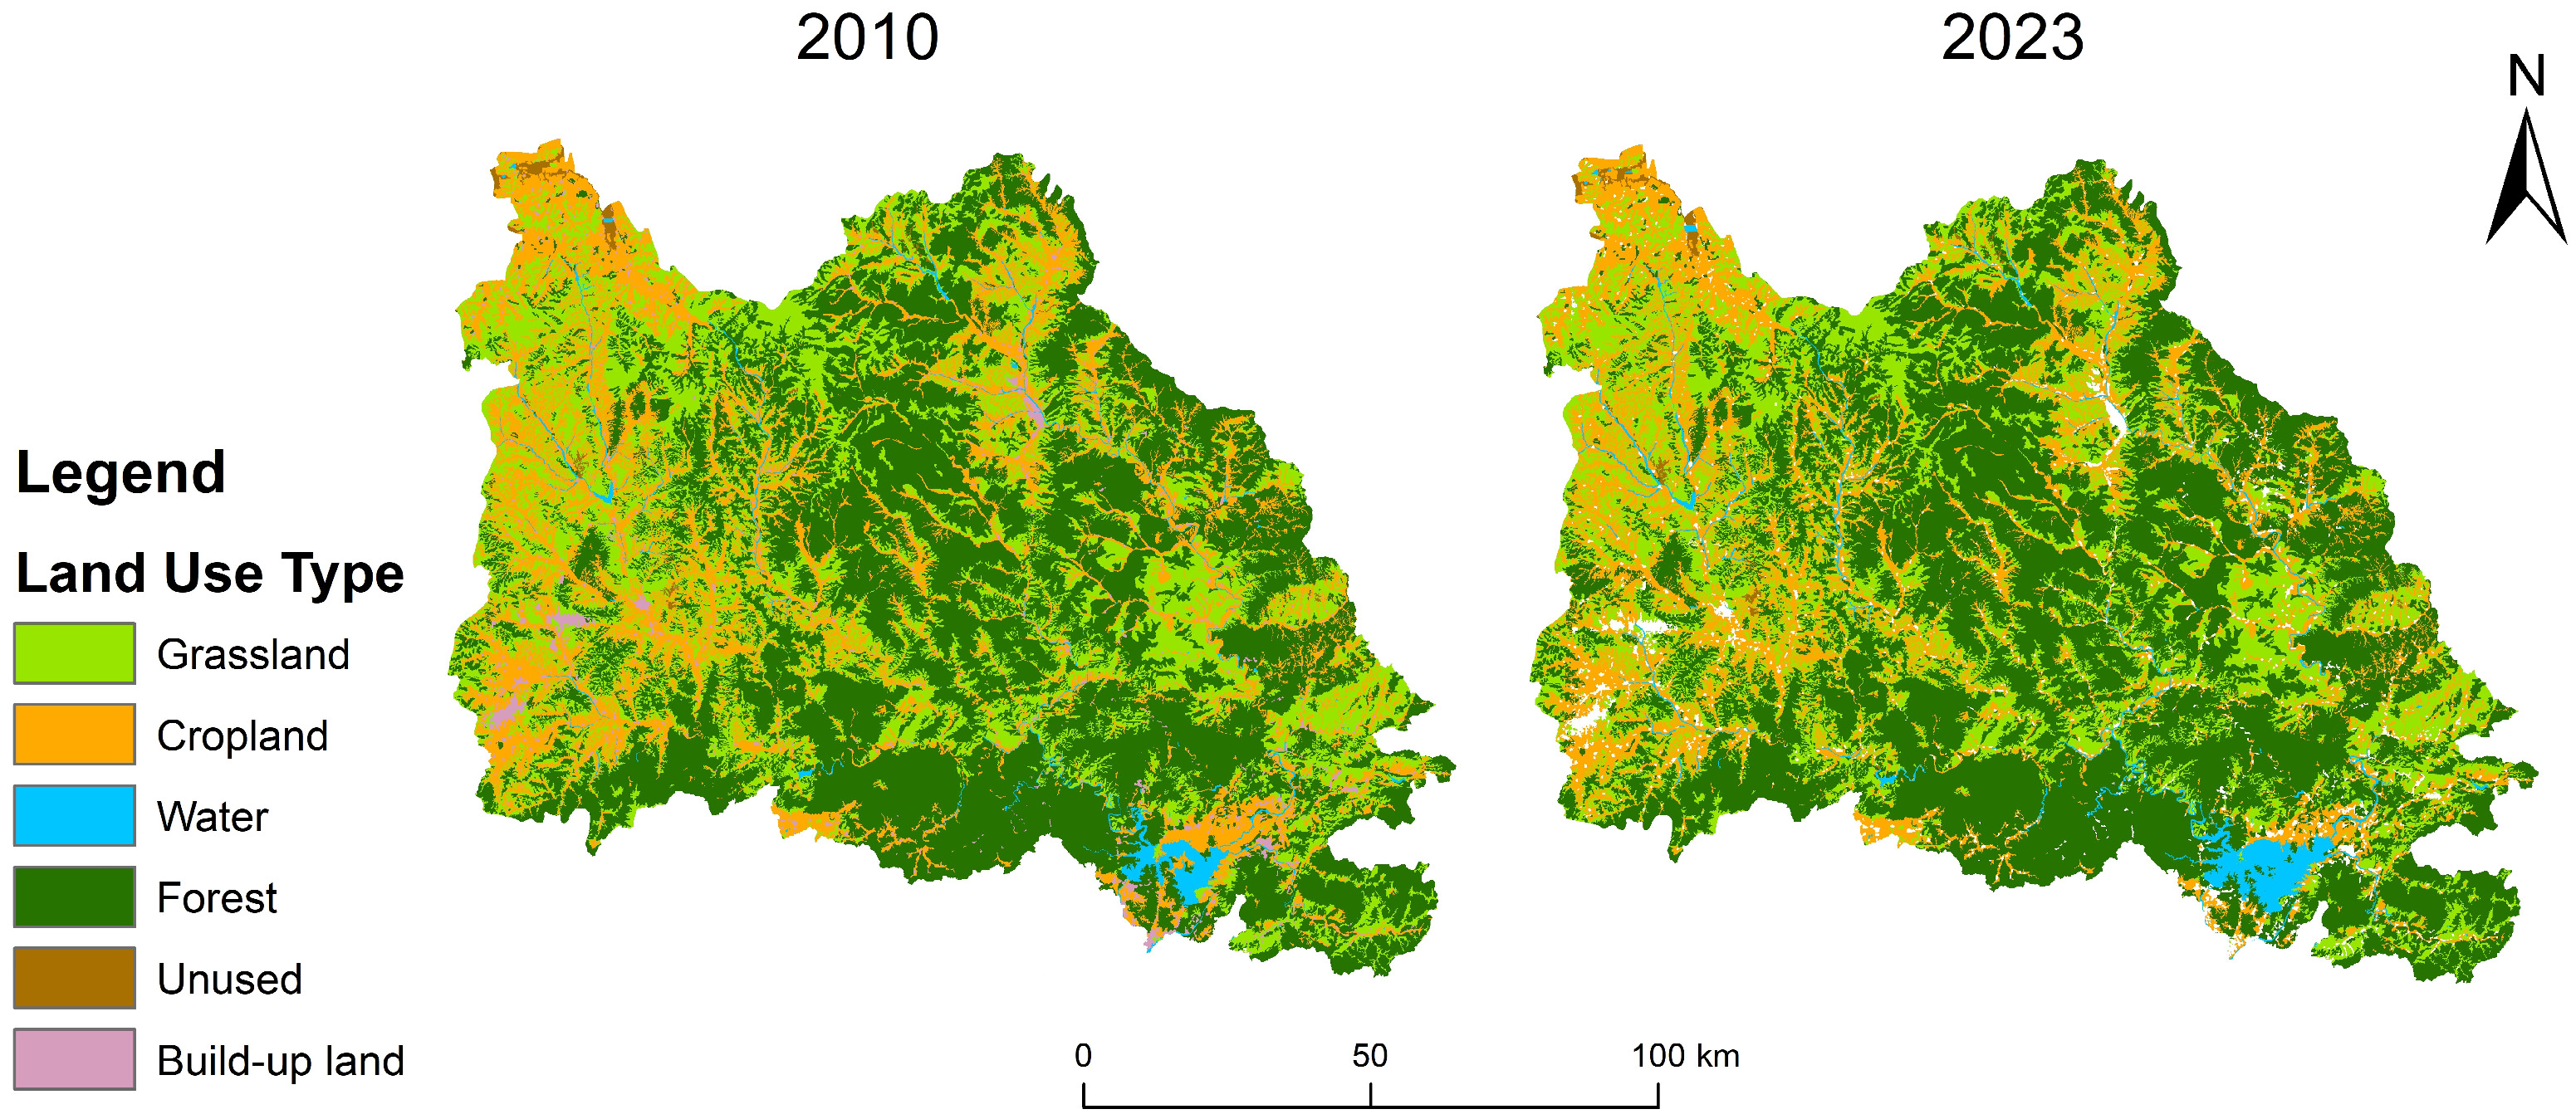
Among the land use types in the Miyun Reservoir Basin, forest land accounts for the largest proportion, followed by grassland, cropland, construction land, and unused land (Table 2). From 2010 to 2023, an overall growth in forest land proportion was observed, rising from 48.02% in 2010 to 50.18% in 2023. In contrast, the proportion of cropland declined from 22.41% to 20.72% over the same period. These changes reflect the ecological afforestation and cropland-to-forest conversion projects implemented in the basin. Grassland area also showed a decreasing trend, shrinking from 26.17% in 2010 to 24.27% in 2023.
The water body area increased significantly, rising from 1.41% in 2010 to 2.10% in 2023, which is likely related to hydrological regulation efforts and changes in reservoir water storage. Similarly, urban, industrial, mining, and construction land expanded steadily from 1.67% to 2.41%, indicating continued human activities and land development within the basin. Unused land remained relatively stable at around 0.30–0.32%, with minimal change during the study period (Figure 2).

3.2. Spatiotemporal Changes in Ecosystem Services (ESs)

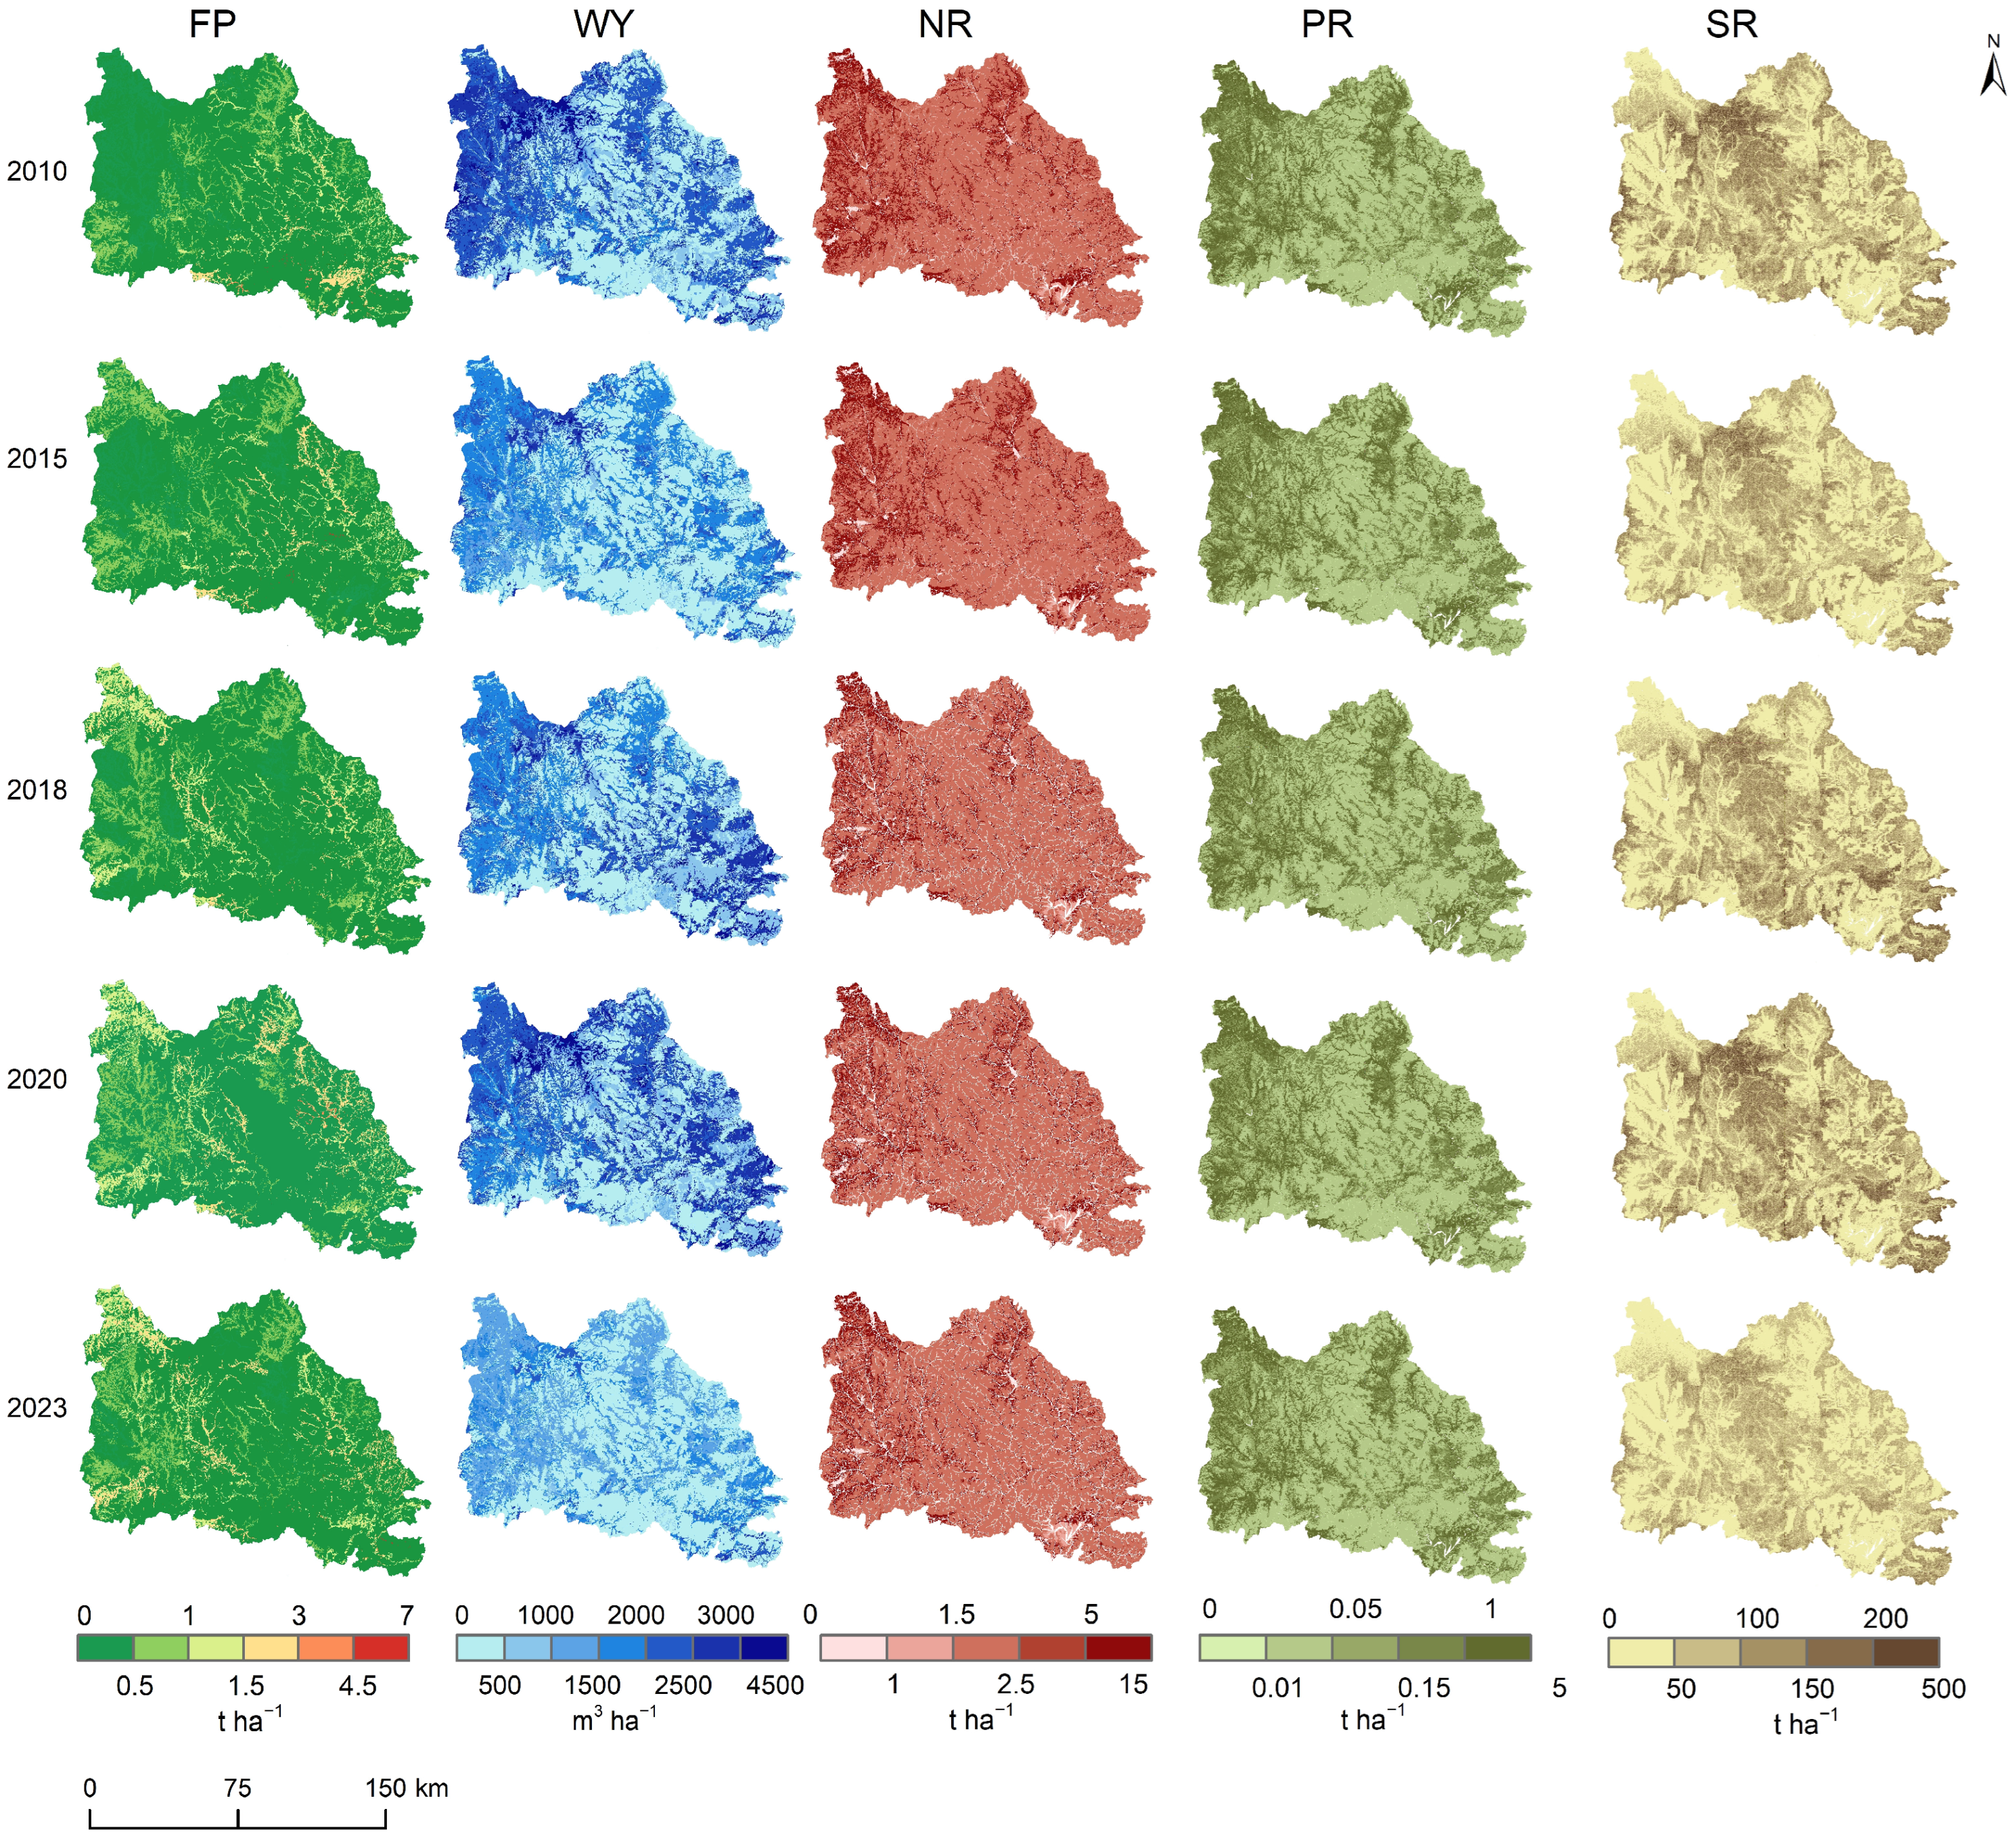
FP in the Miyun Reservoir Basin increased by 26.35% from 2010 to 2023. This increase was driven by growth between 2010 and 2020, followed by a slight decline in 2023. Grain yield continued to rise from 2010 to 2020, but dropped slightly in 2023. Spatially, FP exhibited a pattern of high values in the eastern and western regions and low values in the central area, with high-value clusters mainly distributed in the upper reaches of the Chaohe and Baihe Rivers and certain areas surrounding the Miyun Reservoir. The spatial centroid of FP shifted from downstream areas—especially around the reservoir—to upstream agricultural zones in the Chao–Bai River Basin during the study period (Figure 3).
WY showed a decrease–increase–decrease trend. It declined from 2010 to 2015, recovered from 2015 to 2020, and decreased again in 2023, mirroring interannual variability in precipitation and actual evapotranspiration. Its spatial distribution also exhibited a pattern of high values in the east and west and low values in the central region.
For water purification services, both NR and PR showed an overall declining trend from 2010 to 2023. Total NR decreased from 4420.5 t in 2010 to 3904.6 t in 2023, while PR decreased from 723.5 t to 665.5 t over the same period. However, the maximum retention values did not follow this downward trend and instead showed a fluctuating pattern of increase–decrease–increase, with a temporary decline only in 2020, indicating internal spatial heterogeneity. Notably, the reduction in nutrient retention aligned with reductions in nutrient loading and surface runoff nutrient export, with significant decreases in 2018 and 2023, suggesting the efficacy of implemented pollution control and ecological restoration measures in the basin. Spatially, NR and PR also showed a distribution pattern of higher values in the east and west and lower values in the central region.
SR also exhibited a decline–increase–decline pattern, decreasing in 2015 and 2023 while increasing in other years, corresponding to the trend in soil erosion. Spatially, SR showed a high-value zone in the central basin and lower values in the eastern and western areas. Regions with declining SR were concentrated in the central and southeastern parts of the basin, overlapping with areas of severe soil erosion. From 2010 to 2023, zones with high erosion risk in the upper basin shrank and erosion intensity tended to decrease, while low-erosion zones expanded around the downstream areas of the reservoir (Table 3).

3.3. Trade-Offs and Synergies Among Ecosystem Services

3.3.1. Results of Correlation Analysis

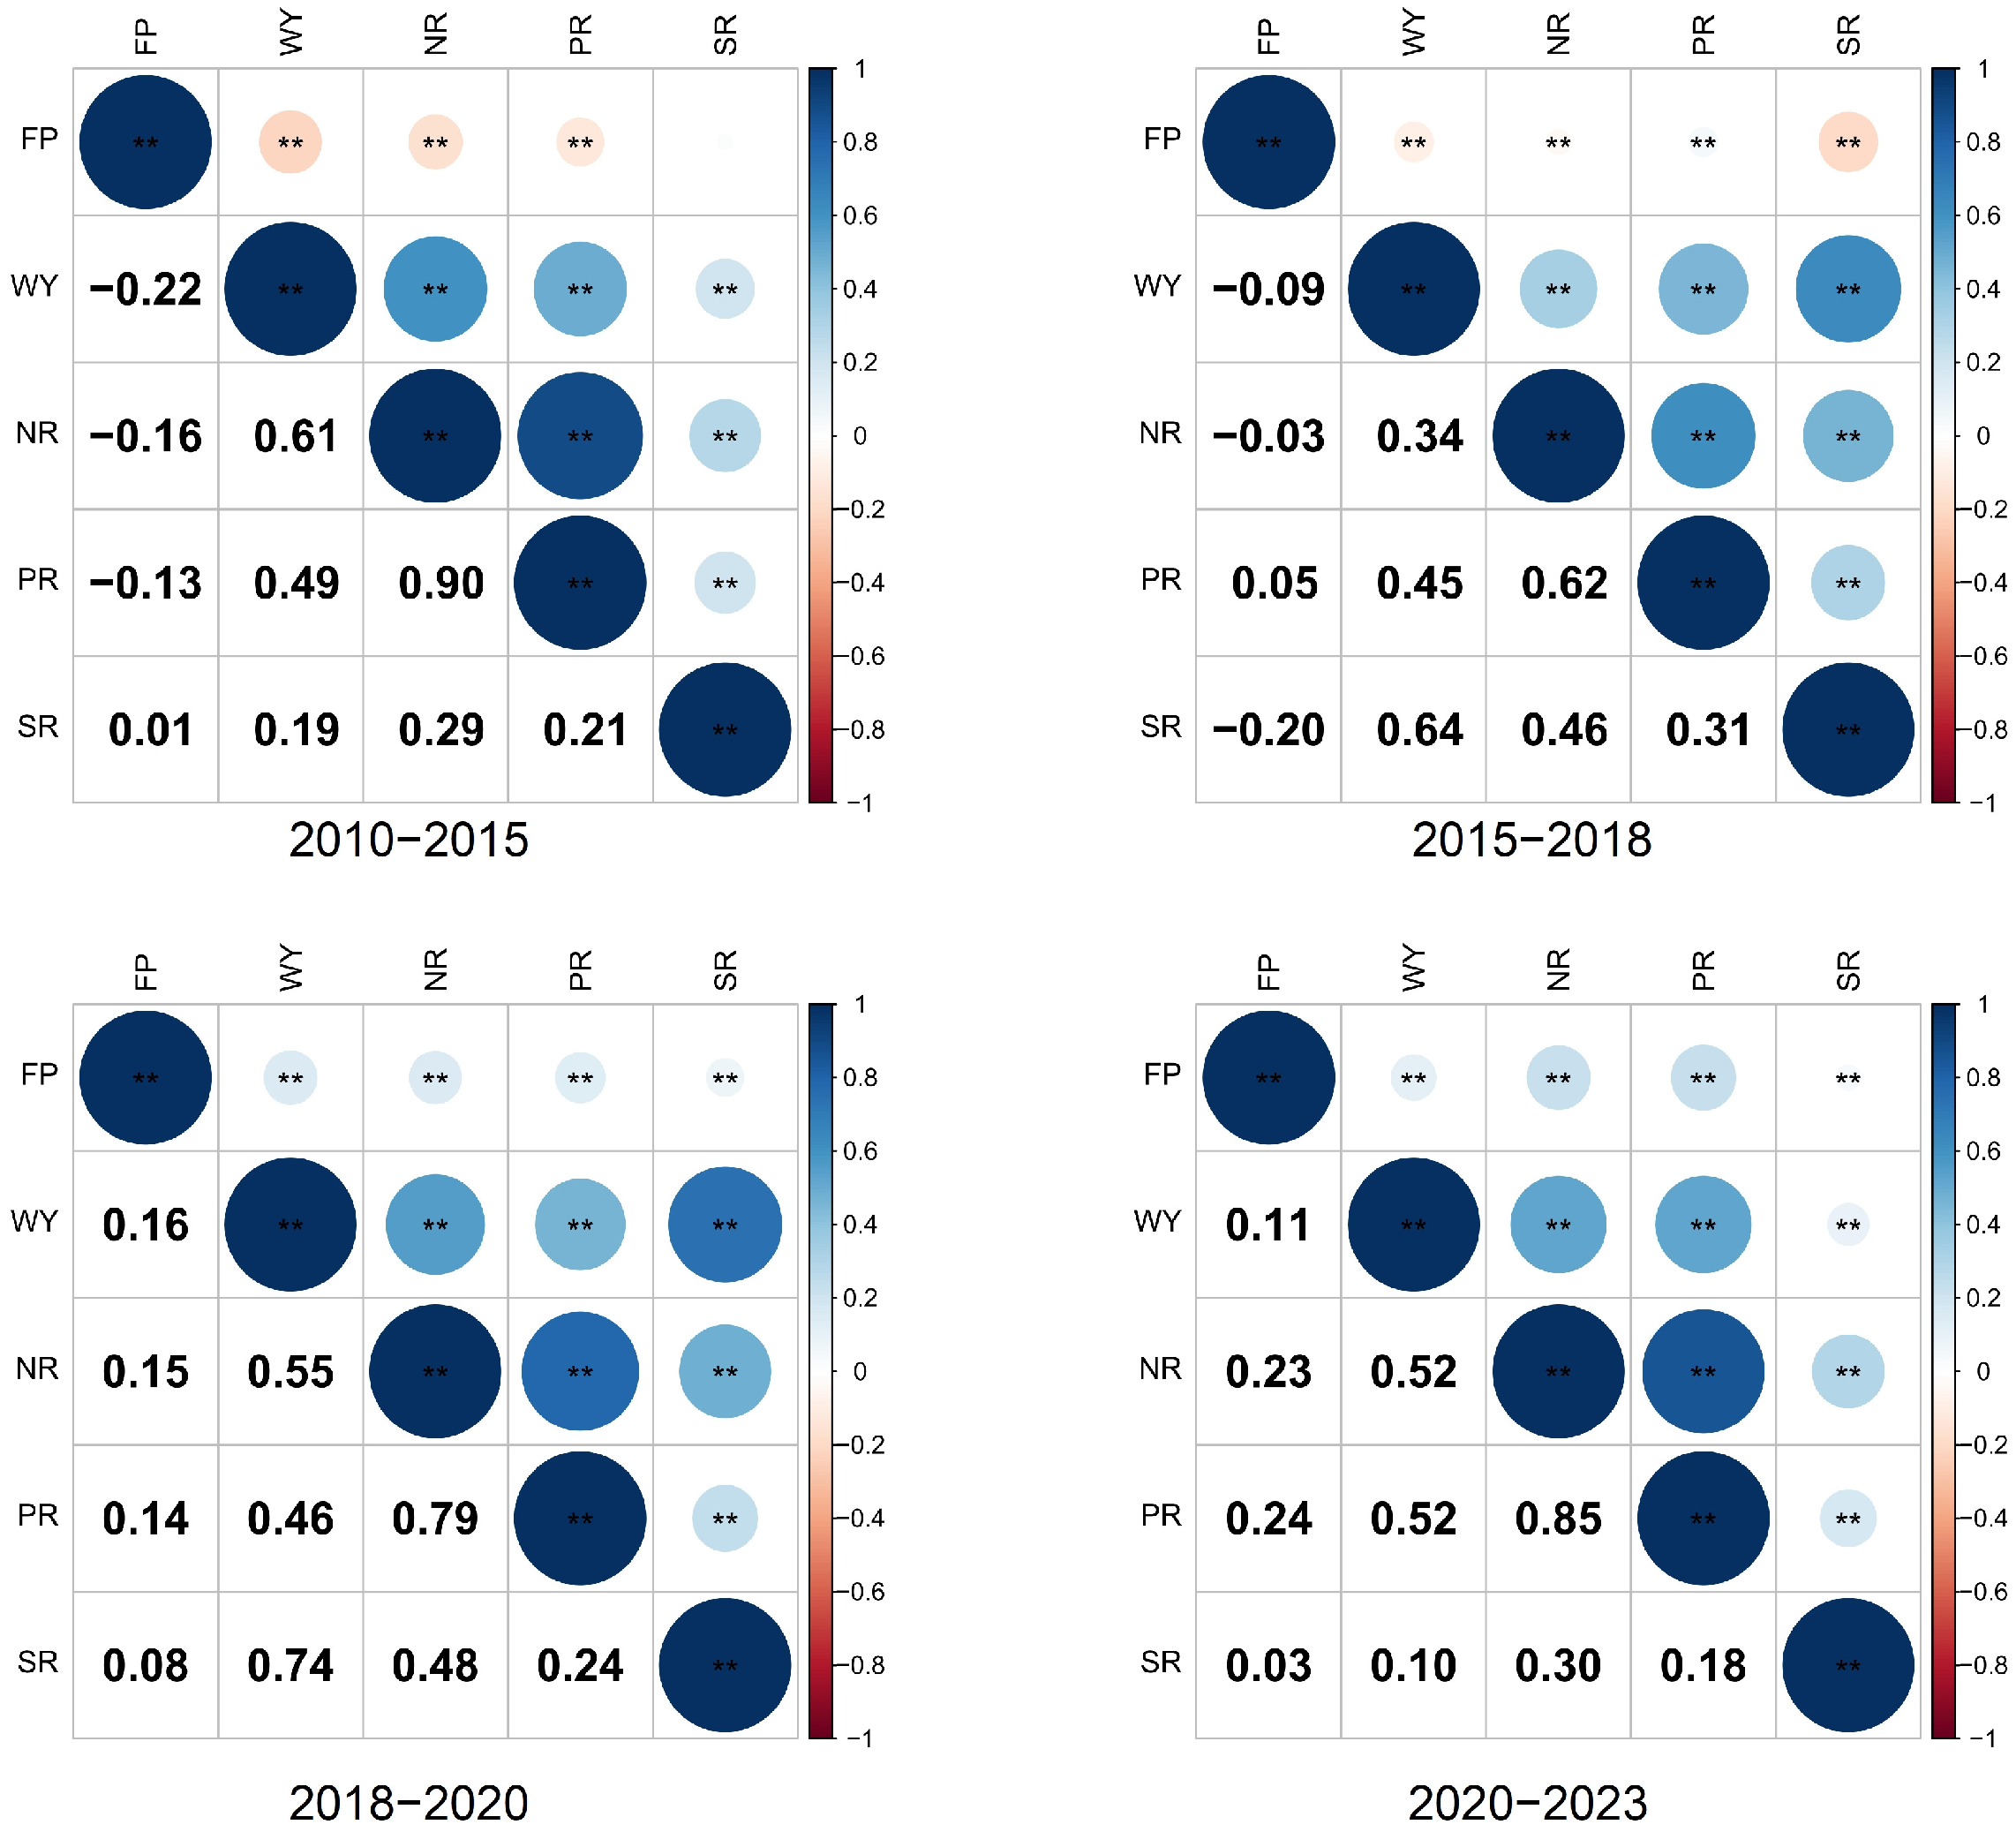
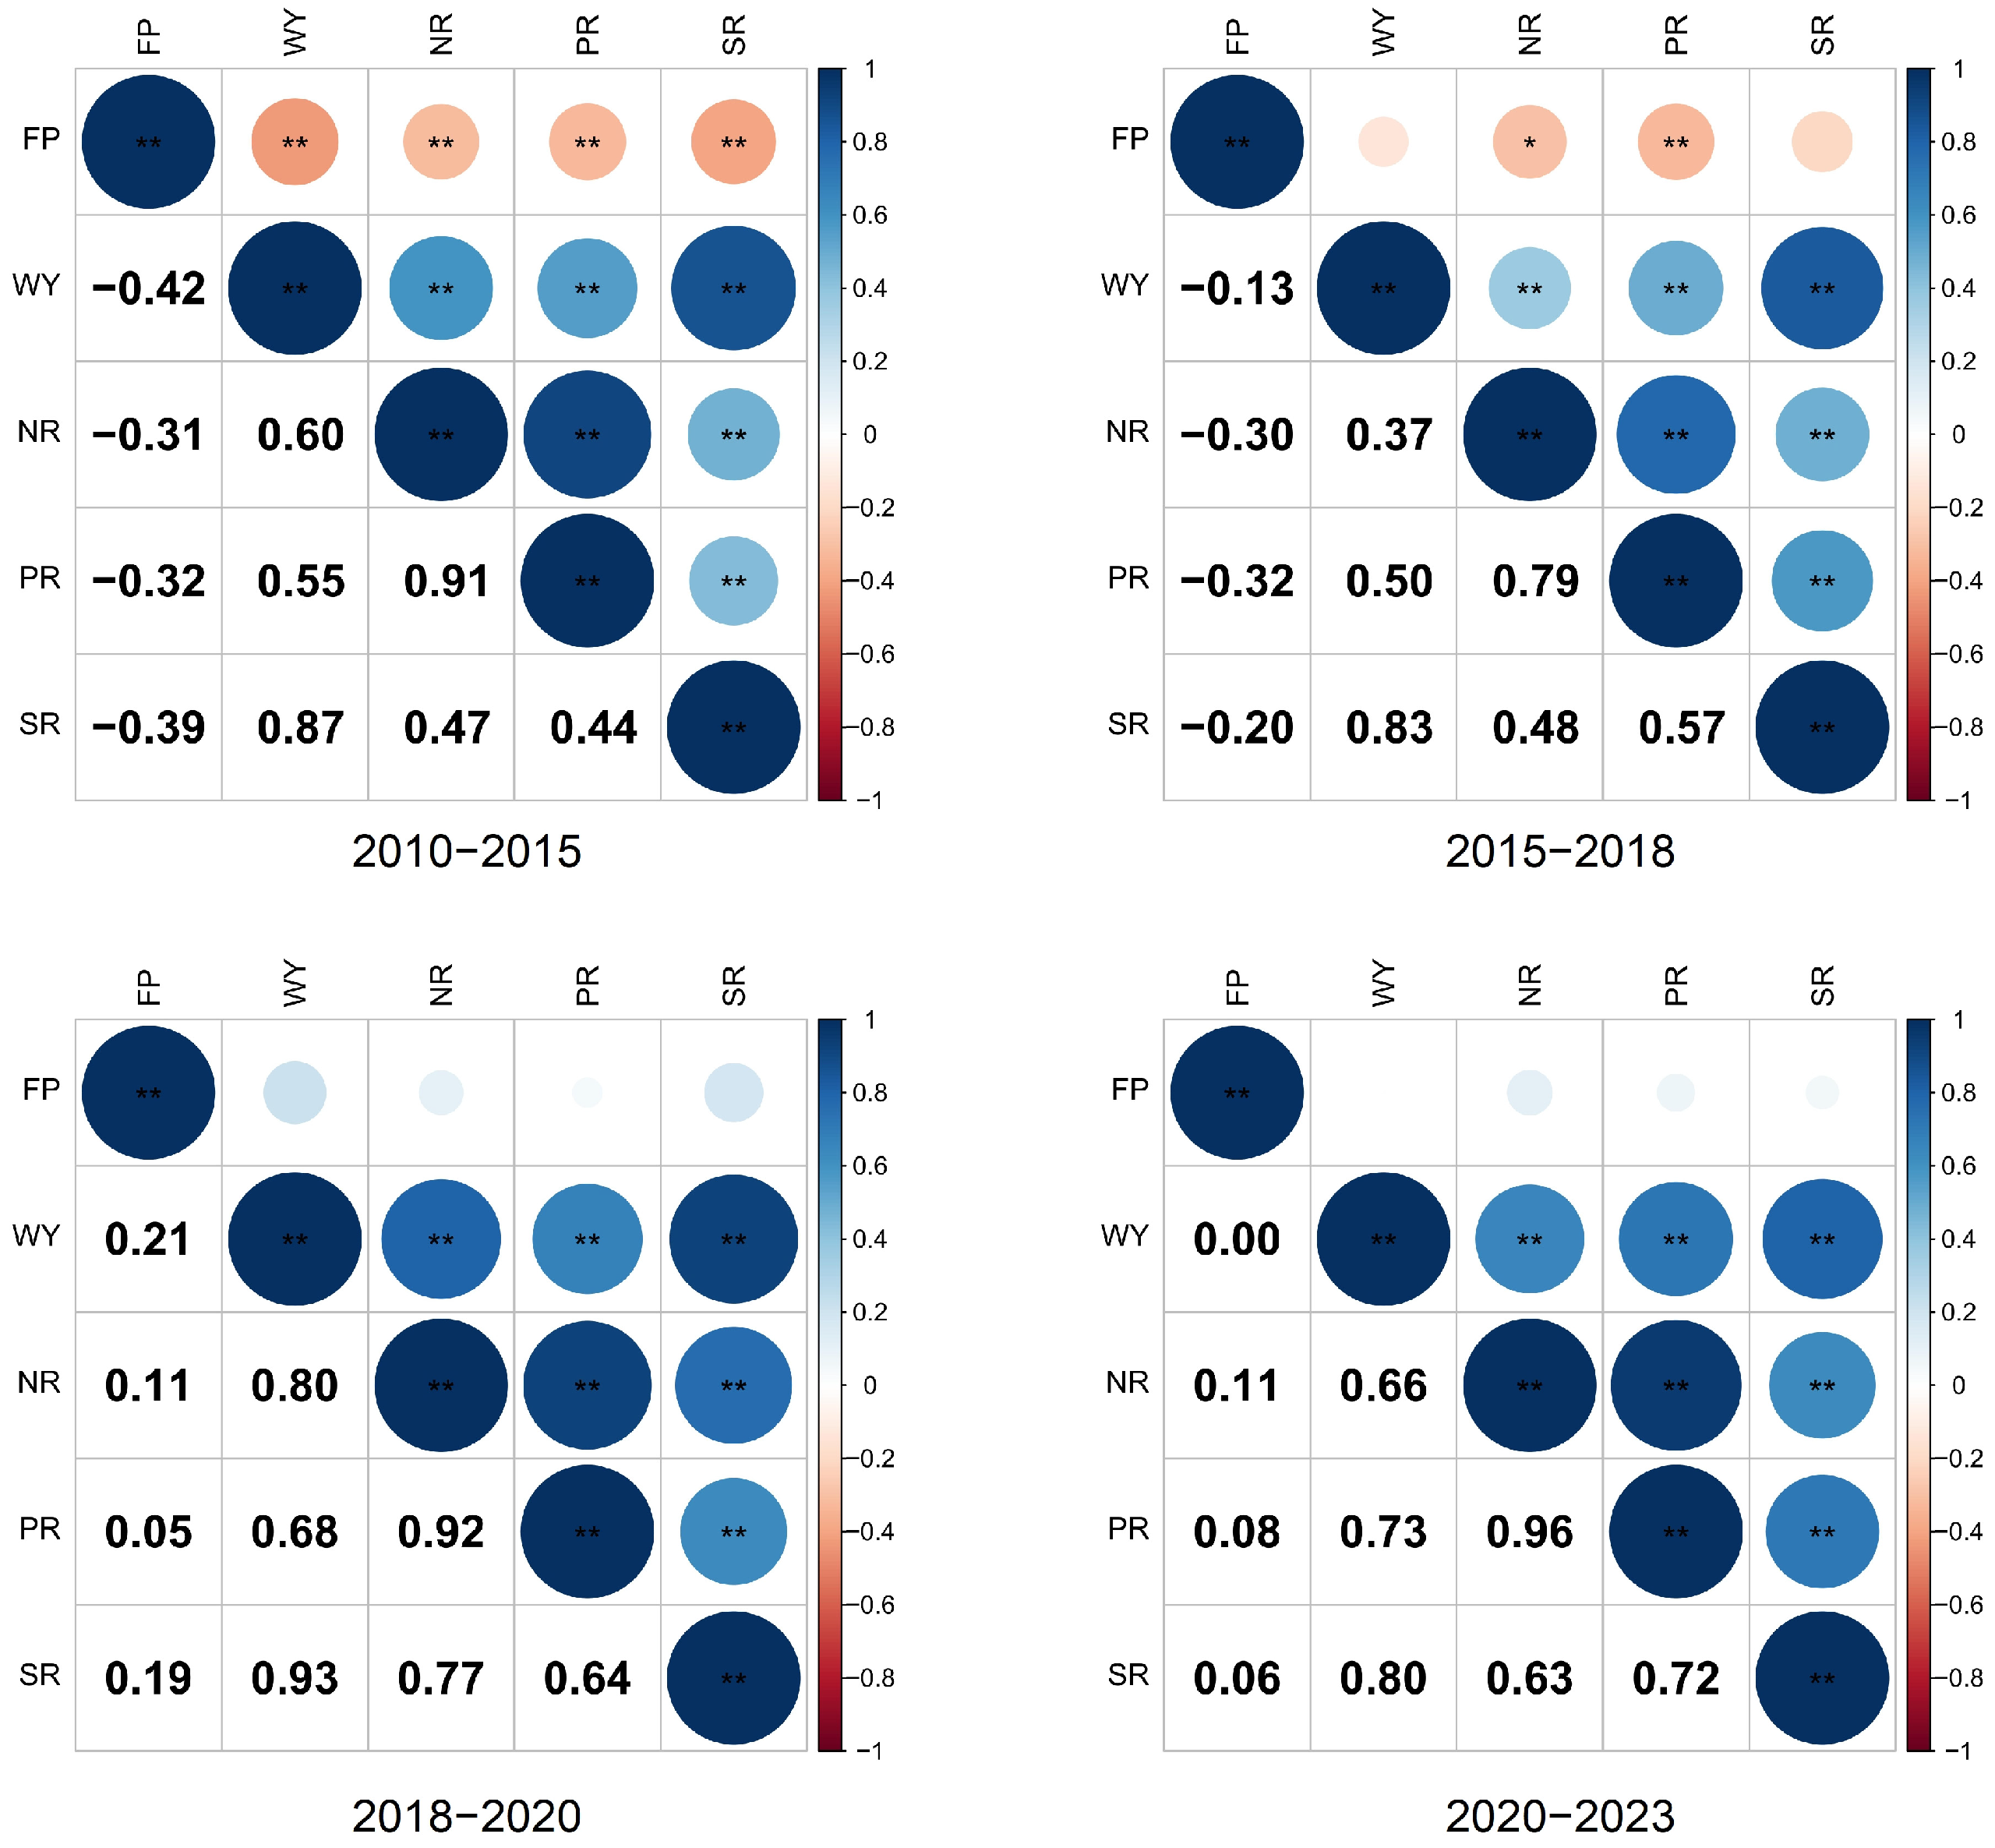
Spearman rank correlation heatmaps are presented for three spatial scales: 1 km (Figure 4), 3 km (Figure 5), and township (Figure 6). In all panels, ** and * denote significance at p < 0.01 and p < 0.05, respectively. The correlation analysis at 1 km grid scale (Figure 4) identified nine pairs of trade-off and synergy (TOS) relationships among the five ES indicators in the Miyun Reservoir Basin between 2010 and 2015, all of which were significant at the p < 0.01 level. During this period, FP showed clear trade-off relationships with WY, NR, and PR, indicating that agricultural intensification negatively affected water regulation and water purification services. In contrast, significant synergies were observed among WY, NR, PR, and SR, especially between NR and PR, which exhibited a strong synergy, suggesting consistent spatial regulation capacity for nutrient retention.
Between 2015 and 2018, the trade-off relationship between FP and SR became significant (p < 0.01), implying that soil erosion risks increased in areas with intensified agricultural use. Meanwhile, trade-offs between FP and the other three ES indicators weakened. Notably, the FP–PR relationship shifted from a trade-off to a weak synergy, reflecting the initial ecological effects of land-use regulation and agricultural control policies associated with ecological compensation. The synergy between WY and NR slightly weakened, whereas the synergy between WY and SR was strengthened, shifting from weak to strong synergy.
After 2018, the relationships among all ES indicators transitioned from trade-offs to synergies, coinciding with the implementation of stricter ecological compensation and watershed management policies. From 2018 to 2020, FP developed weak synergistic relationships with WY, NR, PR, and SR, indicating that agricultural production and ecological restoration began to coexist. Except for a slight decline in the synergy between PR and SR, synergies among WY, NR, PR, and SR were further enhanced.
During 2020–2023, ES synergies generally remained stable, maintaining the structures observed in the previous period. The most notable change was that the synergy between WY and SR weakened slightly, shifting from strong synergy to weak synergy, possibly due to fluctuations in precipitation and increased spatial heterogeneity of soil conservation effectiveness.
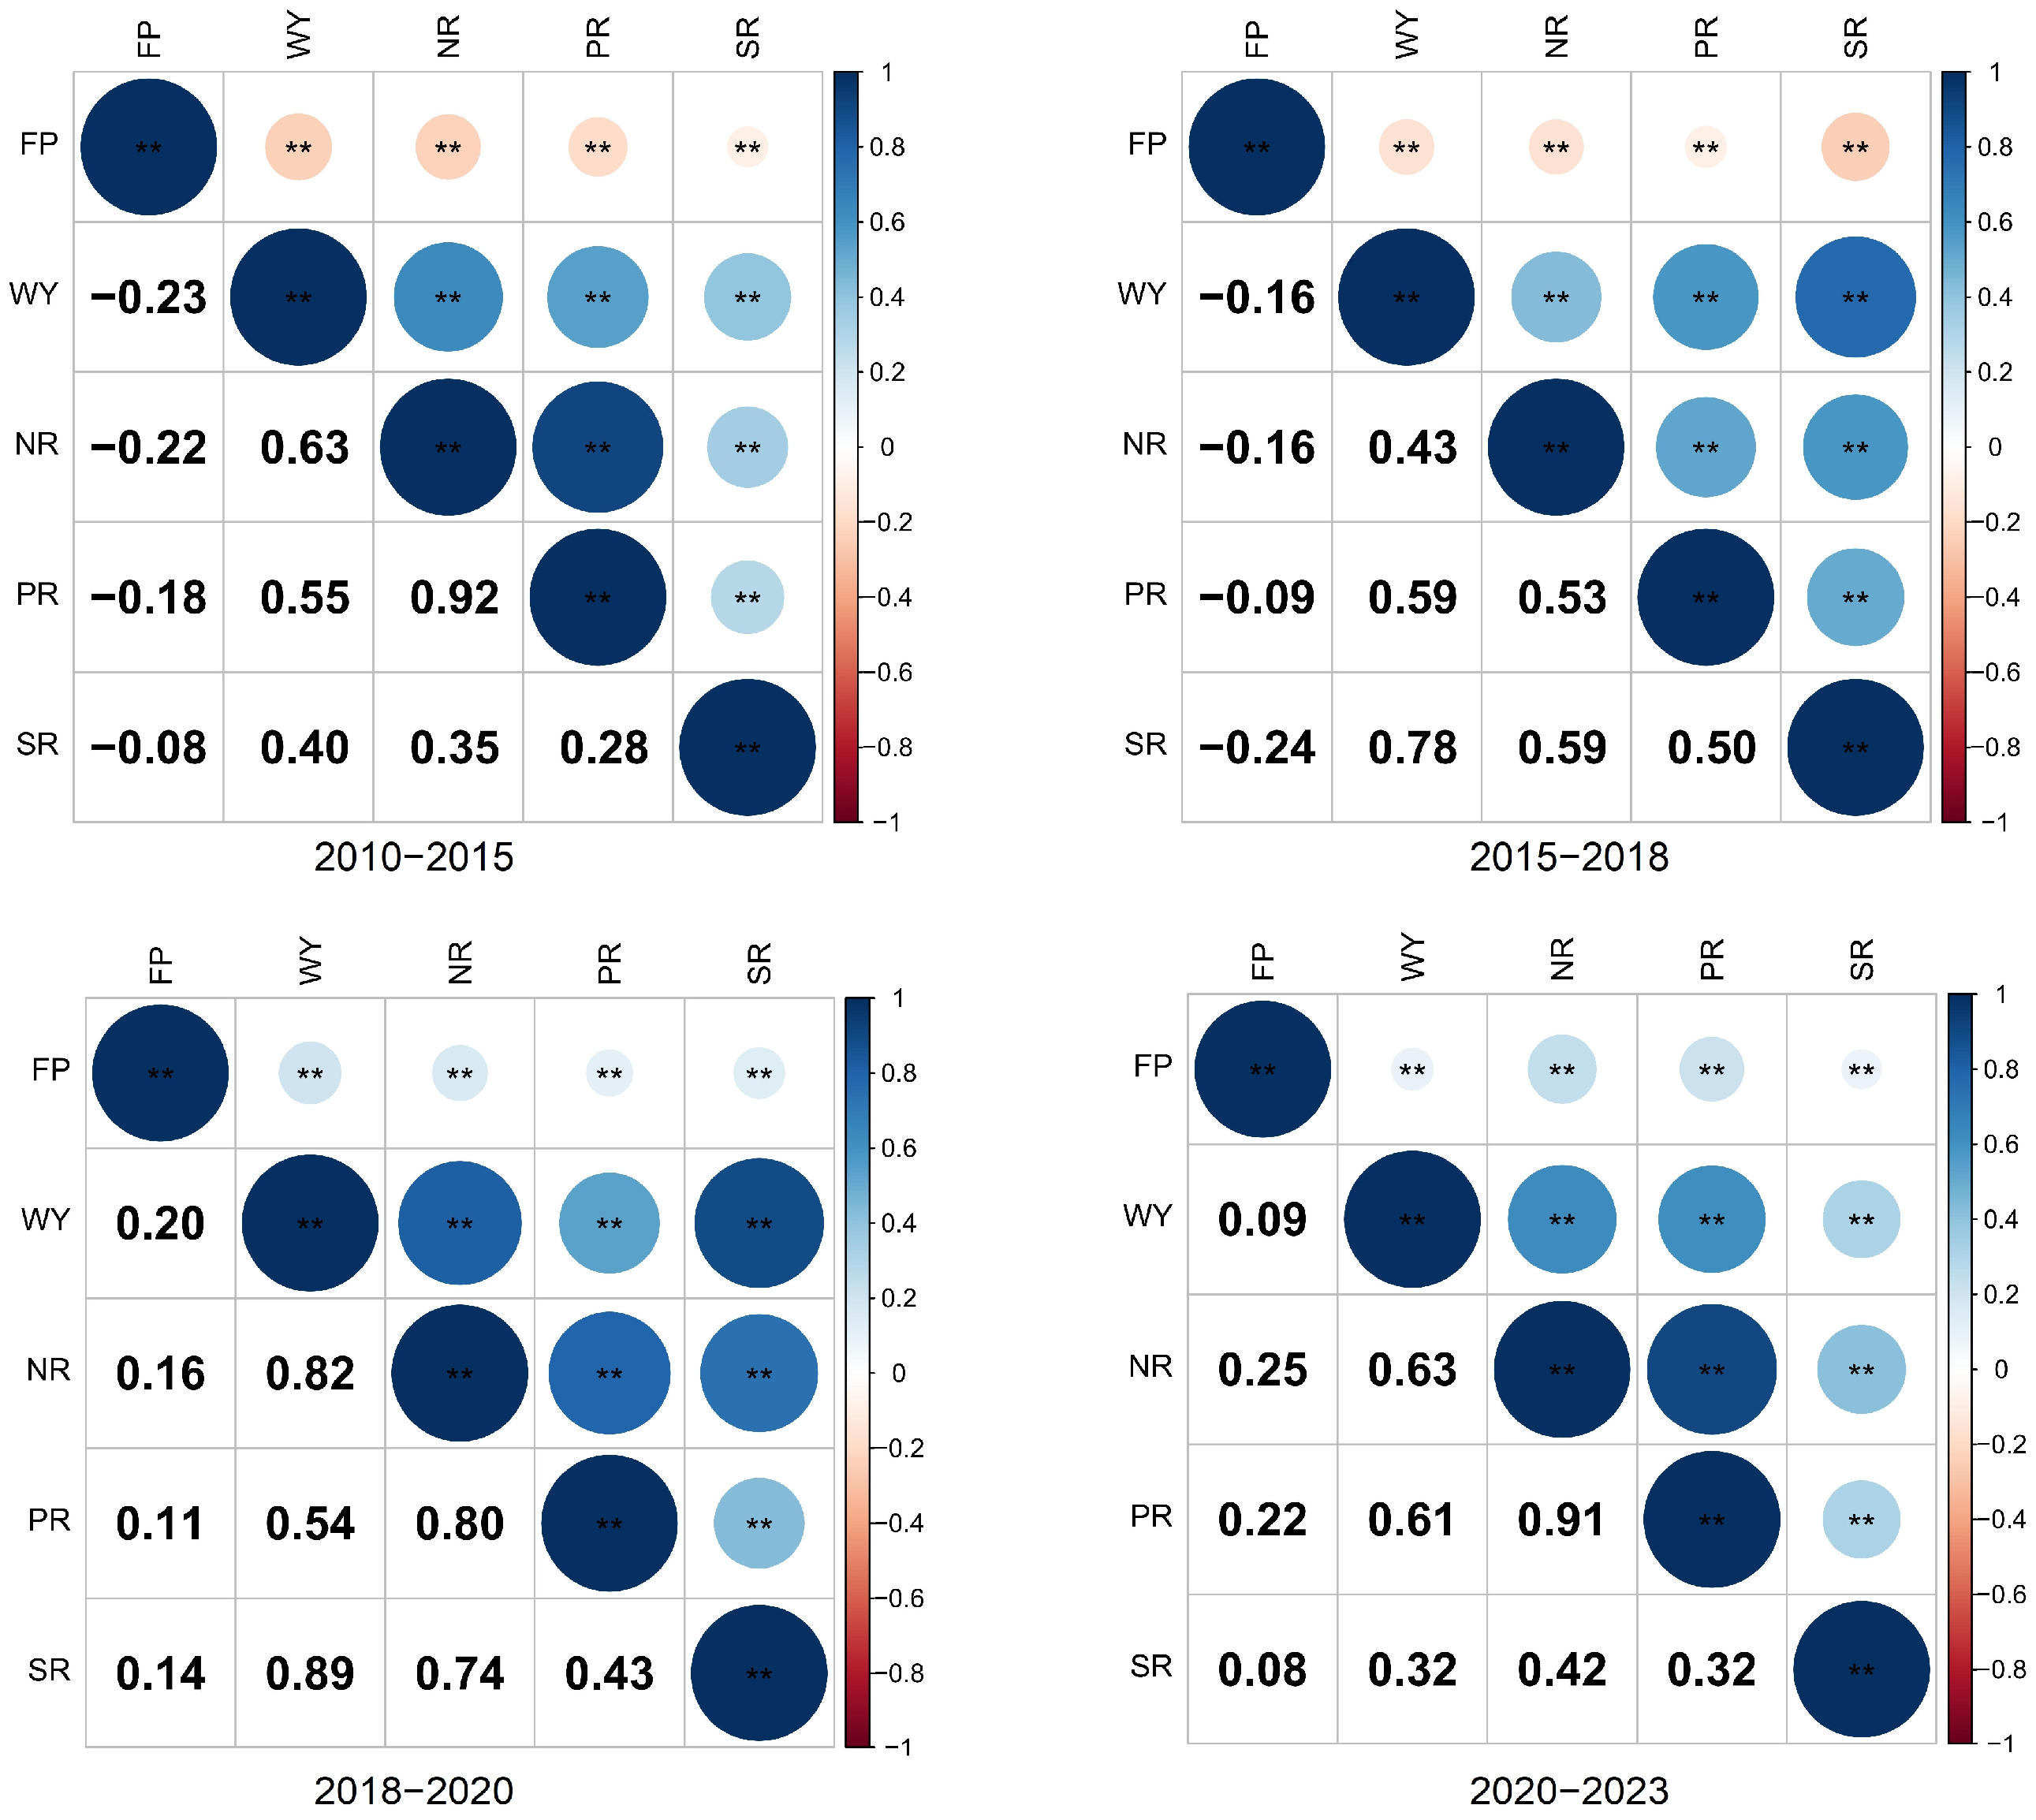
At the 3 km grid scale (Figure 5), statistically significant trade-offs and synergies (TOS) were detected among the five ES indicators at the p < 0.1 level. The year 2018 served as an important turning point in the temporal evolution of TOS. Before 2018, FP exhibited trade-off relationships with the other ES indicators; however, these trade-offs gradually weakened over time. After 2018, all relationships between FP and the other ESs shifted from trade-offs to synergies, consistent with the pattern observed at the 1 km grid scale.
The relationships among WY, NR, PR, and SR remained relatively stable and synergistic across all study periods, although the strength of these synergies varied over time. The two indicators of water purification services (NR and PR) consistently showed a strong and stable synergy. SR exhibited strong synergistic relationships with WY, NR, and PR, which continuously strengthened before 2020. However, from 2020 to 2023, these strong synergies weakened and transformed into weak synergies. This suggests that TOS among ESs may exhibit substantial interannual fluctuations in response to external disturbances, such as anomalous precipitation events. Therefore, examining TOS dynamics across multiple time periods is essential to avoid biased conclusions caused by short-term abnormal fluctuations and to better understand long-term TOS trends.
Given that ecological compensation and other ecological protection and restoration policies are often implemented at administrative scales, this study also examined the trade-offs and synergies (TOS) among ecosystem services (ESs) at the township level within the Miyun Reservoir Basin. At the township level (Figure 6), during 2010–2015, all five ES indicators showed statistically significant (p < 0.01) TOS relationships. The results were highly consistent with those at the 1 km and 3 km grid scales: FP exhibited trade-off relationships with the other four ES indicators, while the remaining four indicators showed synergistic relationships with one another.
After 2015, the significance of some TOS relationships weakened and even became statistically insignificant in certain cases. During 2015–2018, FP still demonstrated trade-offs with other ESs; however, its trade-offs with WY and SR were no longer statistically significant, while significant trade-offs remained with NR and PR at the p < 0.05 and p < 0.01 levels, respectively. The other four ES indicators (WY, NR, PR, and SR) continued to show significant (p < 0.01) synergistic relationships.
After 2018, the trade-off and synergy relationships between FP and the other ESs became statistically insignificant. In contrast, the synergistic relationships among WY, NR, PR, and SR remained significant at the p < 0.01 level. Furthermore, ES pairs that previously exhibited weak synergies transformed into strong synergies during this period.
After 2018, the trade-off relationships between FP and other ESs underwent notable changes. Prior to the implementation of ecological compensation policies, FP exhibited varying degrees of trade-offs with other ESs. However, following policy implementation, these trade-offs weakened and transitioned into weak synergies. This shift is consistent with a transition toward more sustainable agricultural practices. Instead, agricultural practices have transitioned toward a greener and more sustainable model through measures such as crop structure adjustment, reduced use of chemical fertilizers and pesticides, adoption of water-saving irrigation technologies, and development of environmentally sustainable agricultural practices.
The three ES categories and four associated indicators closely related to the ecological compensation targets for water quality and water quantity inherently demonstrated synergistic relationships. After 2018, these synergies were further strengthened, reflecting the effectiveness of integrated ES management under the ecological compensation policy in the Miyun Reservoir Basin. The decline in the synergy between WY and SR observed in 2023 was largely influenced by anomalous climatic conditions, particularly variations in precipitation.

3.3.2. Spatially Heterogeneous Trade-Offs and Synergies Among Ecosystem Services

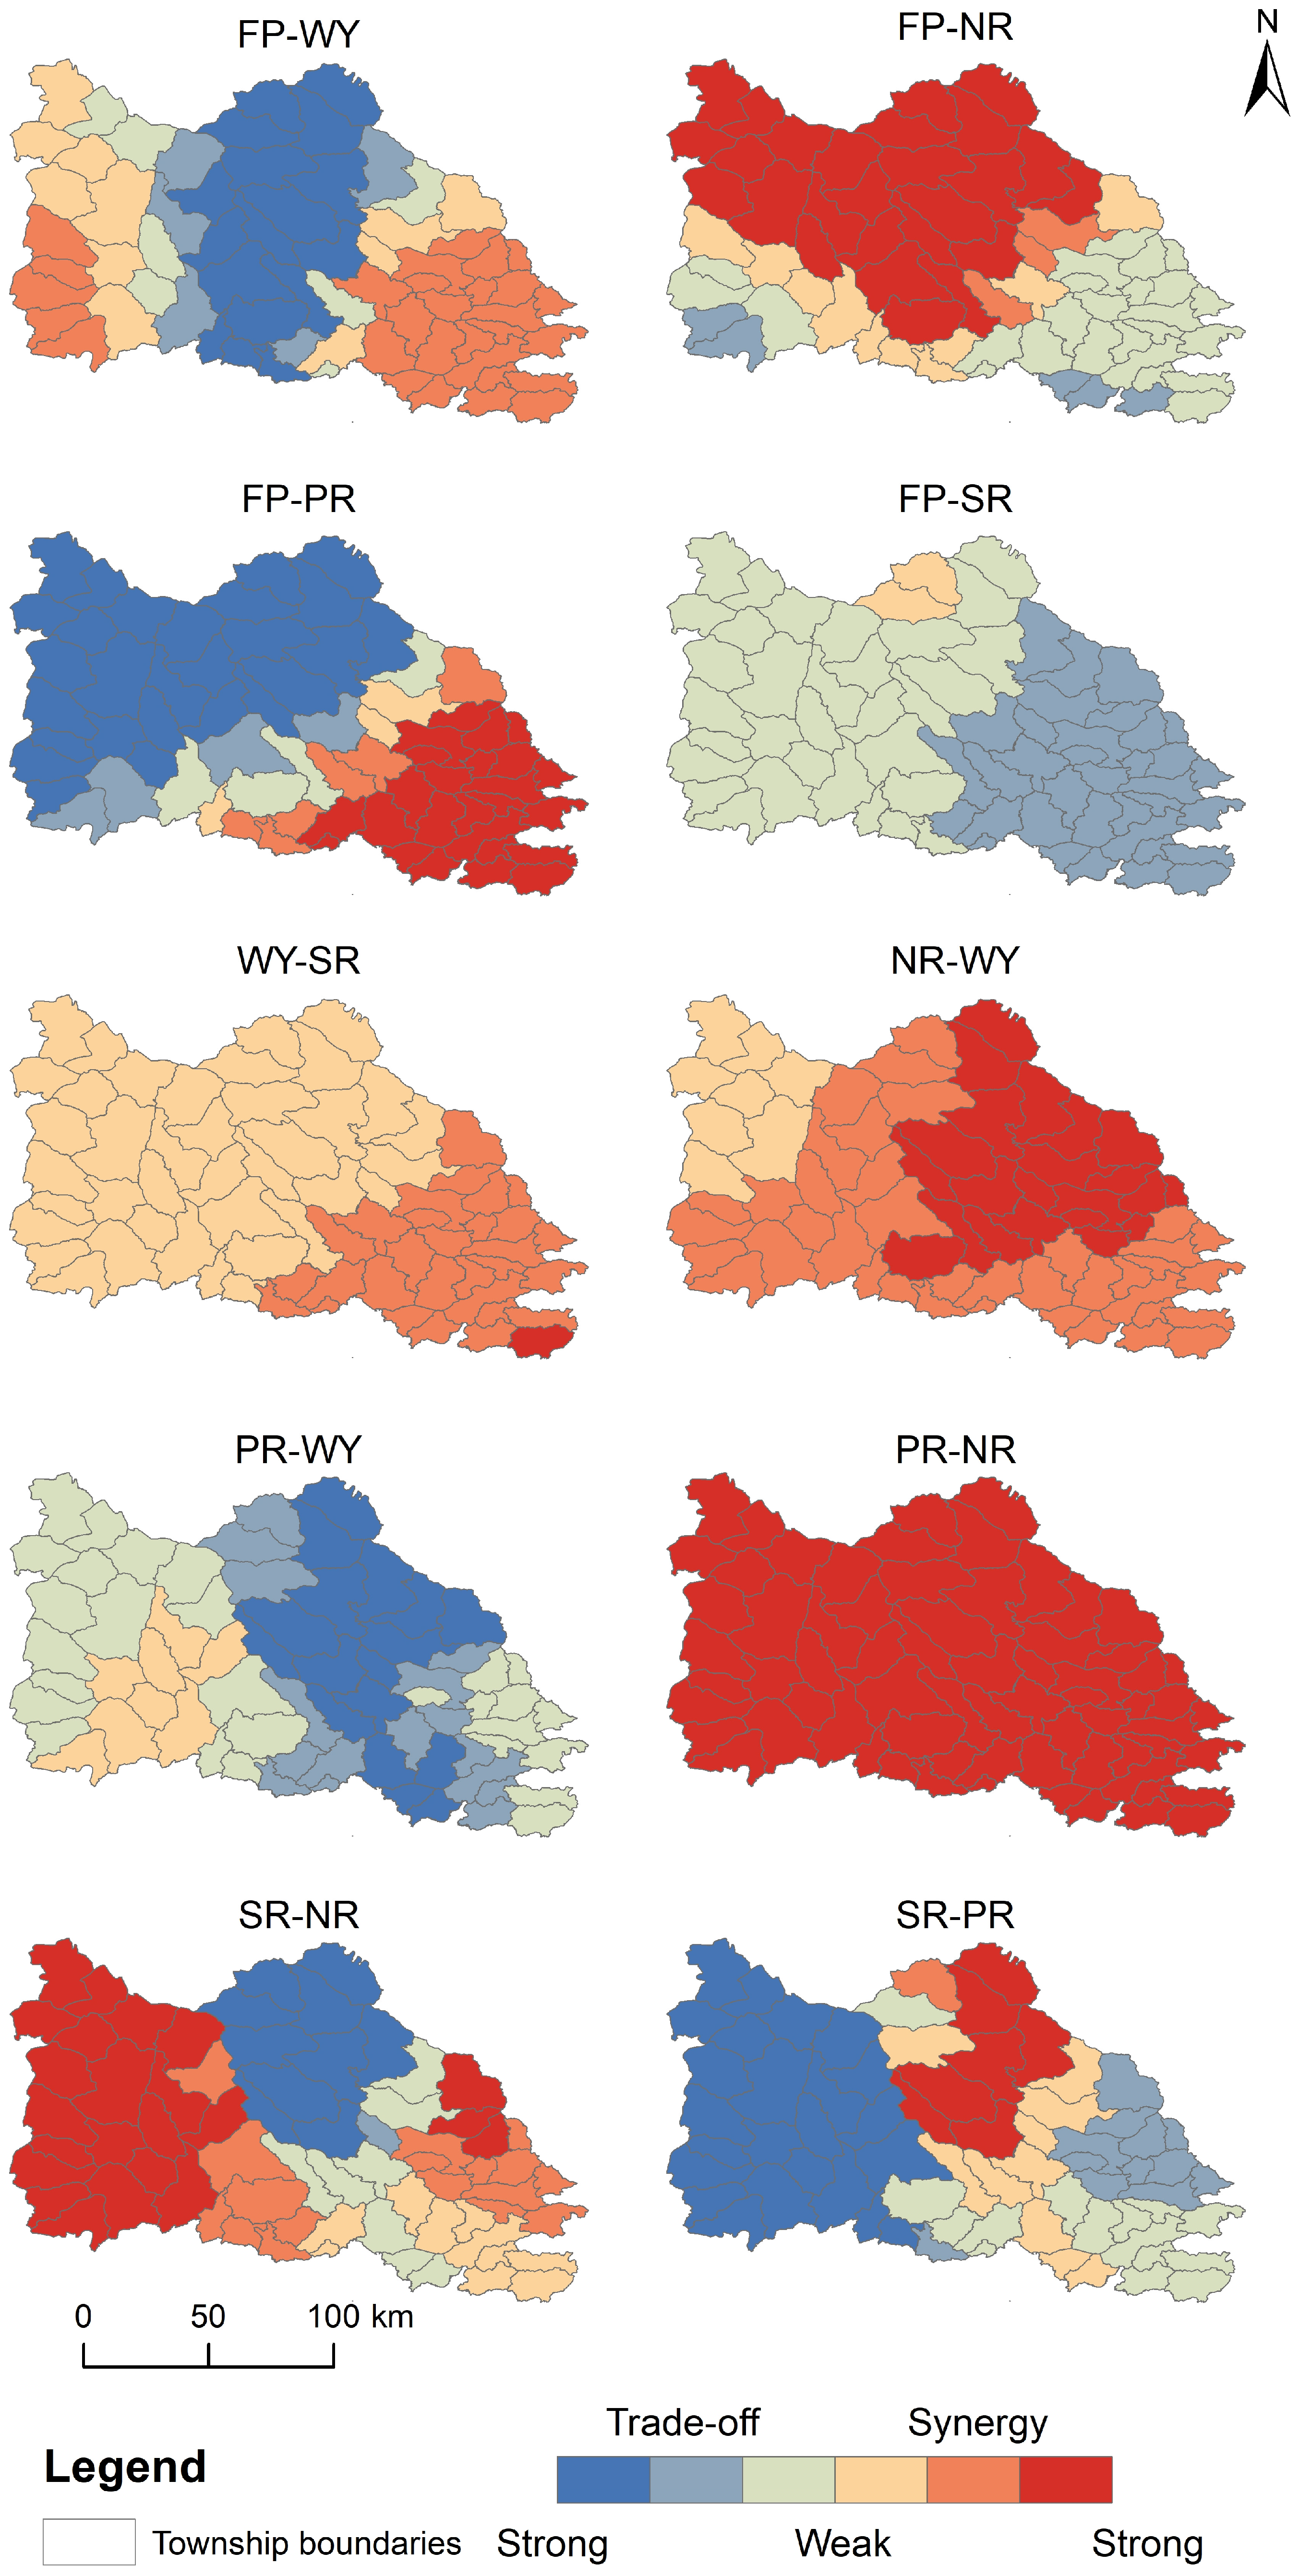
The GWR analysis (Figure 7) revealed pronounced spatial heterogeneity in the trade-offs and synergies among the five ecosystem service indicators across the Miyun Reservoir Basin between 2010 and 2023. The GWR coefficients for the FP-WY relationship were significantly negative (trade-off) in the central basin but positive (synergy) in the east and west. FP and NR showed strong synergies in most areas of the basin, with only weak trade-offs detected in townships surrounding the downstream Miyun Reservoir. Strong trade-offs between FP and PR dominated the upper reaches of the Chaohe and Baihe rivers in the northwest, while strong synergies occurred in the southeastern areas adjacent to the reservoir. In contrast, FP and SR displayed generally weak trade-offs across much of the basin. WY and SR were predominantly synergistic throughout the basin, with the strength of this positive relationship increasing gradually from the northwest toward the southeast. Similarly, WY and NR exhibited an overall synergistic pattern, particularly strong in the upper Chaohe River region in the northeast. PR and WY were mostly in trade-off, especially in the upper Chaohe watershed where the negative relationship was most intense. In contrast, PR and NR demonstrated strong synergies across the entire basin. SR and NR were largely synergistic, with notably strong interactions in the upper Baihe River area in the west; localized trade-offs were confined primarily to the northern upper Chaohe region. Finally, synergies between SR and PR prevailed in the central basin, strong trade-offs occurred in the west, and weaker trade-offs were observed in the east. These results highlight that the nature and intensity of interactions among ecosystem services are highly context-dependent, varying significantly across sub-regions of the Miyun Reservoir Basin.

4. Discussion

4.1. Policy-Driven Mechanisms of Land Use Change and ES Dynamics

Land use change is widely recognized as a fundamental driver reshaping ecosystem structure and function, thereby influencing the spatial and temporal variations in ecosystem services [52,53]. In the Miyun Reservoir Basin, the conversion from cropland and grassland to forest and built-up areas between 2010 and 2023 exhibits a policy-driven trajectory toward ecological restoration. This transformation reflects the combined effects of national ecological rehabilitation initiatives—such as the Grain for Green Program—and intensified environmental regulations aimed at safeguarding Beijing’s drinking water security [54]. These land use transitions also demonstrate how ecological compensation policies financially incentivize local households to adjust land use behavior in favor of ecosystem conservation [55].
Despite the continuous reduction in cropland area, regional food production increased by 26.35% from 2010 to 2020, revealing a transition from an extensive “land expansion” model to an “efficiency enhancement” agricultural system. This paradoxical trend—less cropland but higher yield—may be attributed to improved agricultural productivity through the adoption of high-yield crop varieties, optimized crop structure, and technological innovation such as water-saving irrigation and precision fertilization. However, the decline in food production in 2023 suggests potential vulnerability to climatic variability or reduced agricultural investment, which warrants further investigation.
Meanwhile, the significant expansion of water bodies may be jointly influenced by increased upstream inflows, precipitation fluctuations, and water transfer via the South-to-North Water Diversion Project, which alleviated the reservoir’s supply pressure. The persistent increase in urban and rural construction land reflects accelerated regional urbanization and growing socio-economic activities in downstream areas, exerting long-term pressure on ecosystem integrity and posing challenges for land-use balancing between development and protection.
Overall, land use in the Miyun Basin has shifted from production-dominated patterns to landscape configurations emphasizing ecological security. This is consistent with national-scale ecological restoration outcomes observed in northern China. However, land use change alone cannot fully explain the dynamics of ES; climatic variability and institutional interventions must also be considered. The improvement in hydrological regulation, water purification, and soil conservation functions coincided with the implementation of ecological compensation policies, suggesting a potential contribution of these interventions. For instance, water yield fluctuated in response to precipitation variability, while reductions in nitrogen and phosphorus loads indicate successful control of agricultural non-point source pollution. Enhanced soil retention, especially in upstream erosion-prone areas, is consistent with the expected outcomes of vegetation restoration efforts under ecological compensation schemes. Together, these changes suggest that ecological compensation has strengthened ecological security functions, contributing to the long-term sustainability of Beijing’s water supply system.

4.2. Trade-Offs and Synergies Among Ecosystem Services at Multiple Scales

Examining ES interactions across spatial scales is essential for understanding ecological processes and informing ecosystem management strategies [6]. In the Miyun Reservoir Basin, the relationships among FP, WY, NR, PR, and SR evolved significantly over time, demonstrating a clear shift from trade-offs to synergies. This transition reflects improvements in resource use efficiency and ecosystem management under ecological compensation policies.
At the 1 km and 3 km grid scales, FP exhibited strong trade-offs with other ESs before 2018, indicating agricultural production was achieved largely at the expense of hydrological regulation and water quality. The alleviation of these trade-offs occurred alongside policy interventions such as promoted reductions in fertilizer use and eco-friendly farming practices, indicating a potential role of these measures in decoupling production from degradation. This shift suggests a decoupling of agricultural production from environmental degradation, enabling simultaneous improvements in crop yield and ecological sustainability. The stable and strong synergy observed between NR and PR across all time periods highlights the inherent linkage between nitrogen and phosphorus transport processes governed by runoff and soil erosion dynamics.
WY, NR, PR, and SR showed persistent and increasing synergies before 2020, reflecting mutually reinforcing hydrological and soil conservation processes driven by vegetation restoration. However, the synergy between WY and SR weakened after 2020, particularly during 2020–2023. This shift may be attributed to extreme precipitation fluctuations increasing surface runoff and reducing soil retention efficiency. Such year-specific anomalies confirm that ES interactions are sensitive to climatic variability, reinforcing the necessity of multi-period assessments to avoid biased conclusions based on anomalous years.
At the township scale, FP maintained significant trade-offs with other ESs during 2010–2015, aligning with patterns observed at finer spatial resolutions. However, after 2015, several ES relationships lost statistical significance, especially those involving FP. This suggests that socio-economic factors, land management heterogeneity, and policy implementation intensity vary across administrative units, diluting ES relationships at coarser scales. After 2018, the weakening or disappearance of trade-offs at the township level implies that agricultural and ecological objectives became more compatible, likely due to targeted ecological compensation and sustainable land management initiatives. Meanwhile, strong synergies among WY, NR, PR, and SR persisted after 2018, reflecting enhanced ecological co-benefits from watershed-level restoration.
Overall, ES interactions exhibit scale dependency. Grid-based analyses capture spatial heterogeneity and biophysical gradients, while administrative-unit analyses reflect policy effects and socio-economic drivers. The shift from trade-offs to synergies—particularly after ecological compensation implementation—demonstrates significant potential for policy-driven optimization of ES bundles. However, climate-induced volatility in TOS behaviors highlights the need for integrating ecological compensation with climate adaptation strategies to enhance long-term ecosystem resilience.
While multiple drivers—including climate variability, the Grain for Green Program, and urbanization—have shaped ES dynamics in the study area, the synchronous shift in TOS patterns across all spatial scales after 2018 aligns closely with the rollout of the Beijing-Hebei horizontal ecological compensation mechanism. Notably, the policy explicitly targets reductions in agricultural non-point source pollution and expansion of forest cover—processes directly linked to the observed weakening of FP-regulating service trade-offs. Although our design does not isolate the policy effect via counterfactual modeling (e.g., DID), the temporal coincidence, spatial alignment with upstream compensated areas, and consistency with policy objectives support a plausible association between ecological compensation and the reconfiguration of ES interactions.

4.3. Implications for Ecosystem Management and Policy Optimization

The observed evolution of ES interactions in the Miyun Reservoir Basin provides meaningful insights for improving ecological compensation strategies and watershed management. First, the shift from trade-offs to synergies after 2018 suggests that ecological compensation, when coupled with land-use regulation and ecological restoration, can play a positive role in enhancing cross-service compatibility. However, the remaining localized trade-offs—particularly involving food production—imply that long-term sustainability will depend on reconciling ecological goals with socioeconomic resilience [56].
A key implication is that ecological compensation policies should move beyond uniform payment standards and incorporate differentiated compensation schemes based on ecosystem service zoning. Upstream forested areas with high hydrological regulation values should continue to receive compensation to maintain soil retention and water purification, while agricultural transition zones could adopt “eco-friendly agriculture incentives” to mitigate pollution and preserve food production concurrently. This aligns with the growing emphasis on multi-functional landscape management in China’s ecological protection strategy [57].
Second, the analysis across scales illustrates that policy implementation must address spatial mismatches between ecological processes and administrative governance. Ecological processes operate continuously across natural terrain, while decision-making is fragmented by administrative boundaries. Therefore, cross-regional watershed governance mechanisms—such as joint river basin committees, ecological compensation transfer payments, and land-use supervision alliances—are essential for aligning ecological function and policy coordination.
Third, strengthening scientific monitoring is crucial for adaptive policy optimization. The fluctuation of regulating service synergies after 2020 demonstrates the sensitivity of ES relationships to climate variability and extreme weather events. Incorporating real-time hydrological and land-use monitoring into ecological compensation evaluation would help shift from “static compensation” to dynamic performance-based compensation systems. This approach ensures that compensation aligns more closely with ecological outcomes rather than land area alone.
Finally, the persistence of trade-offs at local scales implies that ecological compensation must integrate rural development goals to avoid policy fatigue among local stakeholders. Aligning compensation with diverse approaches of ecological value realization, such as eco-tourism, forest-based economy, or biodiversity-friendly farming, can help improve policy acceptance and long-term effectiveness.

4.4. Limitations and Future Research Directions

Although this study provides empirical insights into the spatiotemporal dynamics of ecosystem services (ESs) and their trade-offs and synergies (TOSs) under ecological compensation policy, several limitations should be acknowledged.
First, the assessment primarily focused on biophysical indicators of ESs, represented by food production, water yield, nutrient retention, and soil retention, while excluding other important regulating services such as flood control. Flood regulation is closely linked to watershed sustainability and is highly relevant to the water quantity and quality management objectives of the horizontal ecological compensation policy. Future research could incorporate a more comprehensive set of ESs, including cultural and supporting services, to better reflect the multi-dimensional ecological and socio-economic values of the watershed.
Second, although land-use change, precipitation, and ecological protection policies were identified as key drivers of ES interactions, this study did not conduct a systematic quantitative attribution analysis. The relative contributions of natural, socioeconomic, and policy factors to ES variations remain unclear. Future studies could apply integrated attribution frameworks such as GeoDetector, Bayesian networks, or structural equation modeling to disentangle the complex driving mechanisms behind ES dynamics.
Third, the effects of ecological compensation policies were inferred indirectly from temporal trends and spatial ES responses. However, causal relationships between policy implementation and ES changes were not rigorously tested using counterfactual evaluation approaches. Incorporating quasi-experimental methods—such as difference-in-differences models, synthetic control methods, or policy intervention simulations—would enhance causal inference and improve the credibility of policy effectiveness evaluation.
Finally, the quantification of ESs in this study relied on process-based ecosystem models (e.g., InVEST), and the accuracy of these results is constrained by parameter localization and data resolution. Future studies should improve parameter calibration using long-term observation datasets, high-resolution spatial data, and field validation to reduce model uncertainty and improve estimation reliability.
Despite these limitations, this study contributes to advancing the understanding of how ecological compensation policies can reshape ES relationships in key water source regions, offering useful insights for watershed-scale ecological management and policy design.

5. Conclusions

This study examined the spatiotemporal dynamics of ecosystem services (ESs) and the evolution of trade-offs and synergies (TOSs) in the Miyun Reservoir Basin from 2010 to 2023 under the influence of ecological compensation policies. By integrating multi-source datasets, InVEST model simulations, and multi-scale correlation analysis, the study demonstrated that ecological compensation appears to have contributed significantly to reshaping land-use patterns and fostering more synergistic ES interactions, although challenges remain for coordinated regional development. The main conclusions are as follows:
Ecological compensation reshaped land-use transitions and improved ecological functions. Cropland conversion in ecologically sensitive upstream areas accelerated following policy implementation, likely driven by a combination of ecological restoration programs and compensation incentives. These transitions increased landscape heterogeneity, enhanced carbon sequestration and soil retention capacity, and reduced the risk of agricultural non-point source pollution, reflecting a shift from production-oriented to ecological security-oriented land use.
Ecosystem services exhibited spatial heterogeneity and staged temporal changes. Food production showed a slight decline in cultivated zones, while regulating services—such as water yield and nutrient retention—increased steadily, especially after 2018. These trends correspond to strengthened ecological control measures, the expansion of compensation coverage areas, and the optimization of land-use structure driven by ecological restoration efforts.
Trade-offs between food production and regulating services weakened over time, while synergies among regulating services strengthened. The year 2018 marked a critical turning point in ES interactions. Prior to 2018, food production exhibited significant trade-offs with other services, including water yield, water purification, and soil retention. However, following the intensified implementation of the Beijing-Hebei horizontal ecological compensation policy in 2018, these trade-offs were substantially weakened and transitioned toward synergistic relationships, a shift temporally associated with the intensified implementation of the Beijing-Hebei compensation policy. At the same time, synergies among regulating services themselves further strengthened. This transformation was consistently observed across the 1 km and 3 km grid scales as well as at the township scale, indicating that ecological compensation policies may have facilitated coordination between ecological protection and agricultural production.
Patterns of trade-offs and synergies are scale-dependent. More pronounced local trade-offs were detected at the grid scale, revealing spatial heterogeneity that could be masked by aggregation. In contrast, township-scale analysis smoothed local variability and emphasized the policy intervention effects. These findings highlight the need for multi-scale assessment and governance frameworks when designing ecological management strategies.
Ecological compensation promoted ES synergies and facilitated a transition toward green development, but long-term sustainability requires policy optimization. The Beijing-Hebei ecological compensation policy has effectively guided land-use optimization and agricultural transformation by combining economic incentives with ecological constraints. Under compensation incentives, farmers increasingly adopted environmentally friendly agricultural practices—such as reducing fertilizer and pesticide inputs, promoting water-saving irrigation, and developing eco-agriculture—thereby maintaining food production while reducing environmental pressure on soil and water systems.
In summary, the horizontal ecological compensation policy between Beijing and Hebei has become a key policy instrument for enhancing ES synergies in the Miyun Reservoir Basin. Looking forward, improving the precision and sustainability of compensation mechanisms, strengthening multi-scale ecological monitoring and evaluation, and accounting for the impacts of climate variability will be essential to optimize watershed governance. A shift toward performance-based ecological compensation differentiated by ES functional zones is crucial to ensure long-term ecological security while sustaining agricultural livelihoods.

Author Contributions

Conceptualization, H.Z. and L.Z.; methodology, L.Z.; software, L.Z.; validation, H.Z. and J.B.; formal analysis, L.Z.; investigation, H.Z. and L.Z.; resources, J.B.; data curation, X.Z.; writing—original draft preparation, L.Z.; writing—review and editing, H.Z., J.B. and X.Z.; visualization, L.Z.; supervision, H.Z.; project administration, H.Z.; funding acquisition, H.Z. and J.B. All authors have read and agreed to the published version of the manuscript.

Funding

This work was supported by the National Natural Science Foundation of China (Grant No. 42371320); the Central Public-interest Scientific Institution Basal Research Fund (Grant No. JBYW-AII-2025-08); the Central Public-interest Scientific Institution Basal Research Fund (Grant No. Y2025YC91).

Data Availability Statement

Data will be made available on request.

Acknowledgments

The authors would like to thank the editors and anonymous reviewers for their insightful comments and suggestions.

Conflicts of Interest

The authors declare no conflicts of interest. The funders had no role in the design of the study; in the collection, analyses, or interpretation of data; in the writing of the manuscript; or in the decision to publish the results.

Abbreviations

The following abbreviations are used in this manuscript:
ESEcosystem Service
TOSTrade-off and Synergy
FPFood Production
WYWater Yield
NRNitrogen Retention
PRPhosphorus Retention
SRSoil Retention
LULCLand Use/Land Cover
GWRGeographically Weighted Regression
ECEcological Compensation
PESPayment for Ecosystem Services
PETPrecipitation and potential Evapotranspiration
NDRNutrient Delivery Ratio
TNTotal Nitrogen
TPTotal Phosphorus
RUSLERevised Universal Soil Loss Equation

References

  1. Li, F.; Yin, X.; Shao, M. Natural and Anthropogenic Factors on China’s Ecosystem Services: Comparison and Spillover Effect Perspective. J. Environ. Manag. 2022, 324, 116375. [Google Scholar] [CrossRef] [PubMed]
  2. Costanza, R.; de Groot, R.; Braat, L.; Kubiszewski, I.; Fioramonti, L.; Sutton, P.; Farber, S.; Grasso, M. Twenty Years of Ecosystem Services: How Far Have We Come and How Far Do We Still Need to Go? Ecosyst. Serv. 2017, 28 Pt A, 1–16. [Google Scholar] [CrossRef]
  3. Costanza, R.; d’Arge, R.; de Groot, R.; Farber, S.; Grasso, M.; Hannon, B.; Limburg, K.; Naeem, S.; O’Neill, R.V.; Paruelo, J.; et al. The value of the world’s ecosystem services and natural capital. Nature 1997, 387, 253–260. [Google Scholar] [CrossRef]
  4. Daily, G.C. Nature’s Services: Societal Dependence on Natural Ecosystems; Island Press: Washington, DC, USA, 1997. [Google Scholar]
  5. Petroni, M.L.; Siqueira-Gay, J.; Gallardo, A.L.C.F. Understanding Land Use Change Impacts on Ecosystem Services within Urban Protected Areas. Landsc. Urban Plan. 2022, 223, 104404. [Google Scholar] [CrossRef]
  6. Bennett, E.M.; Peterson, G.D.; Gordon, L.J. Understanding relationships among multiple ecosystem services. Ecol. Lett. 2009, 12, 1394–1404. [Google Scholar] [CrossRef] [PubMed]
  7. Raudsepp-Hearne, C.; Peterson, G.D.; Bennett, E.M. Ecosystem Service Bundles for Analyzing Tradeoffs in Diverse Landscapes. Proc. Natl. Acad. Sci. USA 2010, 107, 5242–5247. [Google Scholar] [CrossRef]
  8. Jopke, C.; Kreyling, J.; Maes, J.; Koellner, T. Interactions among Ecosystem Services across Europe: Bagplots and Cumulative Correlation Coefficients Reveal Synergies, Trade-Offs, and Regional Patterns. Ecol. Indic. 2015, 49, 46–52. [Google Scholar] [CrossRef]
  9. Chen, C.; Chen, X.; Qian, J.; Hu, Z.; Liu, J.; Xing, X.; Yimamaidi, D.; Zhakan, Z.; Sun, J.; Wei, S. Spatiotemporal Changes, Trade-Offs, and Synergistic Relationships in Ecosystem Services Provided by the Aral Sea Basin. PeerJ 2021, 9, e12623. [Google Scholar] [CrossRef]
  10. Wang, J.; Wu, W.; Yang, M.; Gao, Y.; Shao, J.; Yang, W.; Ma, G.; Yu, F.; Yao, N.; Jiang, H. Exploring the Complex Trade-Offs and Synergies of Global Ecosystem Services. Environ. Sci. Ecotechnol. 2024, 21, 100391. [Google Scholar] [CrossRef]
  11. Dade, M.C.; Mitchell, M.G.E.; McAlpine, C.A.; Rhodes, J.R. Assessing Ecosystem Service Trade-Offs and Synergies: The Need for a More Mechanistic Approach. Ambio 2019, 48, 1116–1128. [Google Scholar] [CrossRef]
  12. Wu, L.; Sun, C.; Fan, F. Multi-Criteria Framework for Identifying the Trade-Offs and Synergies Relationship of Ecosystem Services Based on Ecosystem Services Bundles. Ecol. Indic. 2022, 144, 109453. [Google Scholar] [CrossRef]
  13. Le, T.-A.T.; Vodden, K.; Wu, J.; Atiwesh, G. Trade-Offs and Synergies in Ecosystem Services for Sustainability. Front. Sustain. Resour. Manag. 2023, 2, 1129396. [Google Scholar] [CrossRef]
  14. Martinez-Harms, M.J.; Larraín-Barrios, B.; Arregoitia, L.D.V.; Palma-Duque, J.; Gelcich, S. Navigating Ecosystem Services Trade-Offs: A Global Comprehensive Review. Ambio 2025, 54, 1109–1127. [Google Scholar] [CrossRef]
  15. Salvatori, E.; Pallante, G. Forests as Nature-Based Solutions: Ecosystem Services, Multiple Benefits and Trade-Offs. Forests 2021, 12, 800. [Google Scholar] [CrossRef]
  16. Kassun, B.W.; Kallio, M.; Trømborg, E.; Rannestad, M.M. Land Use and Land Cover Change, Trade-Offs, and Synergies between Ecosystem Services in a Dry Afromontane Forest. J. Nat. Conserv. 2025, 85, 126874. [Google Scholar] [CrossRef]
  17. Saarikoski, H.; Mustajoki, J.; Hjerppe, T.; Aapala, K. Participatory Multi-Criteria Decision Analysis in Valuing Peatland Ecosystem Services—Trade-Offs Related to Peat Extraction vs. Pristine Peatlands in Southern Finland. Ecol. Econ. 2019, 162, 17–28. [Google Scholar] [CrossRef]
  18. Li, B.; Yang, G.; Wan, R.; Hamilton, D.P.; Wang, X. Unravelling the Spatiotemporal Trade-Offs and Synergies among Hydrological Ecosystem Services in a Large Floodplain Lake. Ecol. Indic. 2025, 172, 113255. [Google Scholar] [CrossRef]
  19. Zhang, J.; Zhang, Z.; Liu, L.; Cao, Y.; Zhang, M.; Yuan, Z.; Ma, R.; Liu, X.; Liu, Y. Scaling Effects of Ecosystem Service Trade-Off and Synergy in Arid Inland River Basins: A Case Study of the Manas River Basin of Xinjiang, China. Ecol. Indic. 2025, 173, 113358. [Google Scholar] [CrossRef]
  20. Chang, B.; Chen, B.; Chen, W.; Xu, S.; He, X.; Yao, J.; Huang, Y. Analysis of Trade-Off and Synergy of Ecosystem Services and Driving Forces in Urban Agglomerations in Northern China. Ecol. Indic. 2024, 165, 112210. [Google Scholar] [CrossRef]
  21. Zeng, S.; Jiang, C.; Bai, Y.; Wang, H.; Liu, E.; Guo, L.; Chen, S.; Zhang, J. Understanding Scale Effects and Differentiation Mechanisms of Ecosystem Services Tradeoffs and Synergies Relationship: A Case Study of the Lishui River Basin, China. Ecol. Indic. 2024, 167, 112648. [Google Scholar] [CrossRef]
  22. Chang, Y.; Wang, Y.; Yuan, L.; Yao, X.; Zhang, R.; Liu, X.; Fan, Z.; Guo, J. Spatial Scale Effects on the Trade-Offs and Synergies of Ecosystem Services in China’s Huaihe River Basin. Sci. Rep. 2025, 15, 22301. [Google Scholar] [CrossRef]
  23. Zhao, X.; Sun, W.; Zhang, S.; Yang, Y.; Yang, Y.; Lan, H.; Yu, T.; Li, X.; Xie, Y. How Can Ecosystem Services Trade-Offs/Synergies Help Select the Optimal Cultivated Land Restoration Pattern? A Study Based on Multi-Scenario Simulations. Appl. Geogr. 2025, 177, 103563. [Google Scholar] [CrossRef]
  24. Cademus, R.; Escobedo, F.J.; McLaughlin, D.; Abd-Elrahman, A. Analyzing Trade-Offs, Synergies, and Drivers among Timber Production, Carbon Sequestration, and Water Yield in Pinus elliotii Forests in Southeastern USA. Forests 2014, 5, 1409–1431. [Google Scholar] [CrossRef]
  25. Aryal, K.; Maraseni, T.; Apan, A. How Much Do We Know about Trade-Offs in Ecosystem Services? A Systematic Review of Empirical Research Observations. Sci. Total Environ. 2022, 806, 151229. [Google Scholar] [CrossRef] [PubMed]
  26. He, C.; Xiong, K.; Rong, L. Trade-Offs and Synergies of Ecosystem Services and Their Drivers in the Forests of the South China Karst. npj Herit. Sci. 2025, 13, 298. [Google Scholar] [CrossRef]
  27. Li, Y.; Gao, F.; He, B.; Li, H.; Wang, L. Trade-Offs and Synergies of Ecosystem Services and Their Driving Factors in the Aksu River Basin. Res. Cold Arid Reg. 2025, 33, 100098. [Google Scholar] [CrossRef]
  28. Yao, S.; Li, Y.; Quan, X.; Huang, G.; Xu, J. Exploring the Trade-Offs and Synergies among Ecosystem Services to Support Ecological Management in the Yangtze River Delta Urban Agglomeration. J. Environ. Manag. 2025, 393, 127028. [Google Scholar] [CrossRef]
  29. Zhang, L.; Lei, J.; Chen, Z.; Zhou, P.; Wu, T.; Chen, X.; Li, Y.; Pan, X. Spatiotemporal Differentiation and Trade-Offs and Synergies of Ecosystem Services in Tropical Island Basins: A Case Study of Three Major Basins of Hainan Island. J. Clean. Prod. 2025, 490, 144798. [Google Scholar] [CrossRef]
  30. Lyu, R.; Li, S.; Yuan, M.; Fu, X.; Qu, L.; Tang, M.; Zhu, Y.; Wu, G. Trade-Offs and Synergies between Ecosystem Services under the Mountain-River Project: A Case Study from Changbai Mountain. Ecol. Front. 2025. [Google Scholar] [CrossRef]
  31. Chen, J.; Kasimu, A.; Tang, L.; Han, F.; Jumai, M. Ecosystem service trade-offs and synergies based on the mechanical equilibrium model: A case study of the urban agglomeration on the northern slope of the Tianshan Mountains. Ecol. Indic. 2025, 177, 113795. [Google Scholar] [CrossRef]
  32. Dang, L.; Zhao, F.; Teng, Y.; Teng, J.; Zhan, J.; Zhang, F.; Liu, W.; Wang, L. Scale Dependency of Trade-Offs/Synergies Analysis of Ecosystem Services Based on Bayesian Belief Networks: A Case of the Yellow River Basin. J. Environ. Manag. 2025, 375, 124410. [Google Scholar] [CrossRef] [PubMed]
  33. Zhou, J.; Yang, J.; Tang, Z.; Xue, L.; Zhang, W.; Zhang, J. Driving Mechanisms of Ecosystem Services and Their Trade-Offs and Synergies in the Transition Zone between the Qinghai–Tibet Plateau and the Loess Plateau. Ecol. Indic. 2025, 171, 113148. [Google Scholar] [CrossRef]
  34. Tomscha, S.A.; Gergel, S.E. Ecosystem service trade-offs and synergies misunderstood without landscape history. Ecol. Soc. 2016, 21, 43. [Google Scholar] [CrossRef]
  35. Feng, Q.; Zhao, W.W.; Hu, X.P.; Liu, Y.; Daryanto, S.; Cherubini, F. Trading-Off Ecosystem Services for Better Ecological Restoration: A Case Study in the Loess Plateau of China. J. Clean. Prod. 2020, 257, 120469. [Google Scholar] [CrossRef]
  36. Castro, A.J.; Verburg, P.H.; Martín-López, B.; García-Llorente, M.; Cabello, J.; Vaughn, C.C.; López, E. Ecosystem Service Trade-Offs from Supply to Social Demand: A Landscape-Scale Spatial Analysis. Landsc. Urban Plan. 2014, 132, 102–110. [Google Scholar] [CrossRef]
  37. Guo, X.; Zhang, Y.; Guo, D.; Lu, W.; Xu, H. How Does Ecological Protection Redline Policy Affect Regional Land Use and Ecosystem Services? Environ. Impact Assess. Rev. 2023, 100, 107062. [Google Scholar] [CrossRef]
  38. Wunder, S. Revisiting the Concept of Payments for Environmental Services. Ecol. Econ. 2015, 117, 234–243. [Google Scholar] [CrossRef]
  39. Guan, D.; Chen, S.; Zhang, Y.; Liu, Z.; Peng, G.; Zhou, L. Influencing Factors and the Establishment of a Basin Ecological Compensation Mechanism from the Perspective of Water Conservation: A Case Study of the Upper Yangtze River in China. J. Clean. Prod. 2024, 456, 142332. [Google Scholar] [CrossRef]
  40. Wang, M.; Sun, L. Basin Ecological Compensation and Urban Green Total Factor Productivity: Evidence from Typical Trans-Provincial River Basins in China. Environ. Dev. Sustain. 2025. [Google Scholar] [CrossRef]
  41. Wang, F.; Zheng, H.; Zhang, W.; Wang, H.; Peng, W. Regional differences and driving mechanisms of the relationship between farmer livelihoods and ecosystem services: A case study of the upstream Miyun Reservoir watershed. Chin. J. Appl. Ecol. 2021, 32, 3872–3882. [Google Scholar] [CrossRef]
  42. Peng, S.Z.; Ding, Y.X.; Wen, Z.M.; Chen, Y.M.; Cao, Y.; Ren, J.Y. Spatiotemporal change and trend analysis of potential evapotranspiration over the Loess Plateau of China during 2011–2100. Agric. For. Meteorol. 2017, 233, 183–194. [Google Scholar] [CrossRef]
  43. Peng, S.Z.; Ding, Y.X.; Liu, W.Z.; Li, Z. 1 km Monthly Temperature and Precipitation Dataset for China from 1901 to 2017. Earth Syst. Sci. Data 2019, 11, 1931–1946. [Google Scholar] [CrossRef]
  44. Peng, S. 1-km Monthly Precipitation Dataset for China (1901–2024); National Tibetan Plateau/Third Pole Environment Data Center: Beijing, China, 2020. [Google Scholar] [CrossRef]
  45. Ding, Y.X.; Peng, S.Z. Spatiotemporal trends and attribution of drought across China from 1901–2100. Sustainability 2020, 12, 477. [Google Scholar] [CrossRef]
  46. Peng, S. 1-km Monthly Potential Evapotranspiration Dataset for China (1901–2022); National Tibetan Plateau Data Center: Beijing, China, 2022. [Google Scholar] [CrossRef]
  47. Whitcraft, A.K.; Becker-Reshef, I.; Justice, C.O.; Vermote, E.F. Cloud cover throughout the agricultural growing season: Impacts on passive optical Earth observations. Remote Sens. Environ. 2015, 156, 438–447. [Google Scholar] [CrossRef]
  48. Zhao, Y.; Wang, C.; Li, J. A study on estimating winter wheat yield based on NDVI from MODIS. Trans. Chin. Soc. Agric. Eng. 2012, 28, 160–165. (In Chinese) [Google Scholar]
  49. Su, D.; Cao, Y.; Dong, X.; Wu, Q.; Fang, X.; Cao, Y. Evaluation of Ecosystem Services Budget Based on Ecosystem Services Flow: A Case Study of Hangzhou Bay Area. Appl. Geogr. 2024, 162, 103150. [Google Scholar] [CrossRef]
  50. Wang, Z.Y.; Ren, Y.F.; Jiang, Q.O.; Zhen, Z.Y.; Xie, C. Integrated assessment of ecosystem service functions in Yunnan Province based on the InVEST model. J. Beijing For. Univ. 2024, 46, 103–112. (In Chinese) [Google Scholar]
  51. An, C.; Fang, H.Y.; Wang, F.Z. Runoff and sediment yield characteristics and rainfall response in the upper basin of the Miyun Reservoir: A case study of the Shixia small watershed. Sci. Soil Water Conserv. 2020, 18, 43–51. (In Chinese) [Google Scholar]
  52. Foley, J.A.; DeFries, R.; Asner, G.P.; Barford, C.; Bonan, G.; Carpenter, S.R.; Chapin, F.S.; Coe, M.T.; Daily, G.C.; Gibbs, H.K.; et al. Global consequences of land use. Science 2005, 309, 570–574. [Google Scholar] [CrossRef] [PubMed]
  53. Lambin, E.F.; Meyfroidt, P. Global land use change, economic globalization, and the looming land scarcity. Proc. Natl. Acad. Sci. USA 2011, 108, 3465–3472. [Google Scholar] [CrossRef]
  54. Liu, J.; Li, S.; Ouyang, Z.; Tam, C.; Chen, X. Ecological and socioeconomic effects of China’s policies for ecosystem services. Proc. Natl. Acad. Sci. USA 2008, 105, 9477–9482. [Google Scholar] [CrossRef]
  55. Liu, Y.; Zhang, Y.; Guo, L. Towards realistic assessments of ecological restoration programs: A case study of the Grain for Green Program in China. J. Environ. Manag. 2018, 223, 132–140. [Google Scholar] [CrossRef]
  56. Howe, C.; Suich, H.; Vira, B.; Mace, G.M. Creating win-wins from trade-offs? Ecosystem services for human well-being: A meta-analysis of ecosystem service trade-offs and synergies. Environ. Sci. Policy 2014, 28, 47–57. [Google Scholar] [CrossRef]
  57. Ouyang, Z.; Zheng, H.; Xiao, Y.; Polasky, S.; Liu, J.; Xu, W.; Wang, Q.; Zhang, L.; Xiao, Y.; Rao, E.; et al. Improvements in ecosystem services from investments in natural capital. Science 2016, 352, 1455–1459. [Google Scholar] [CrossRef] [PubMed]
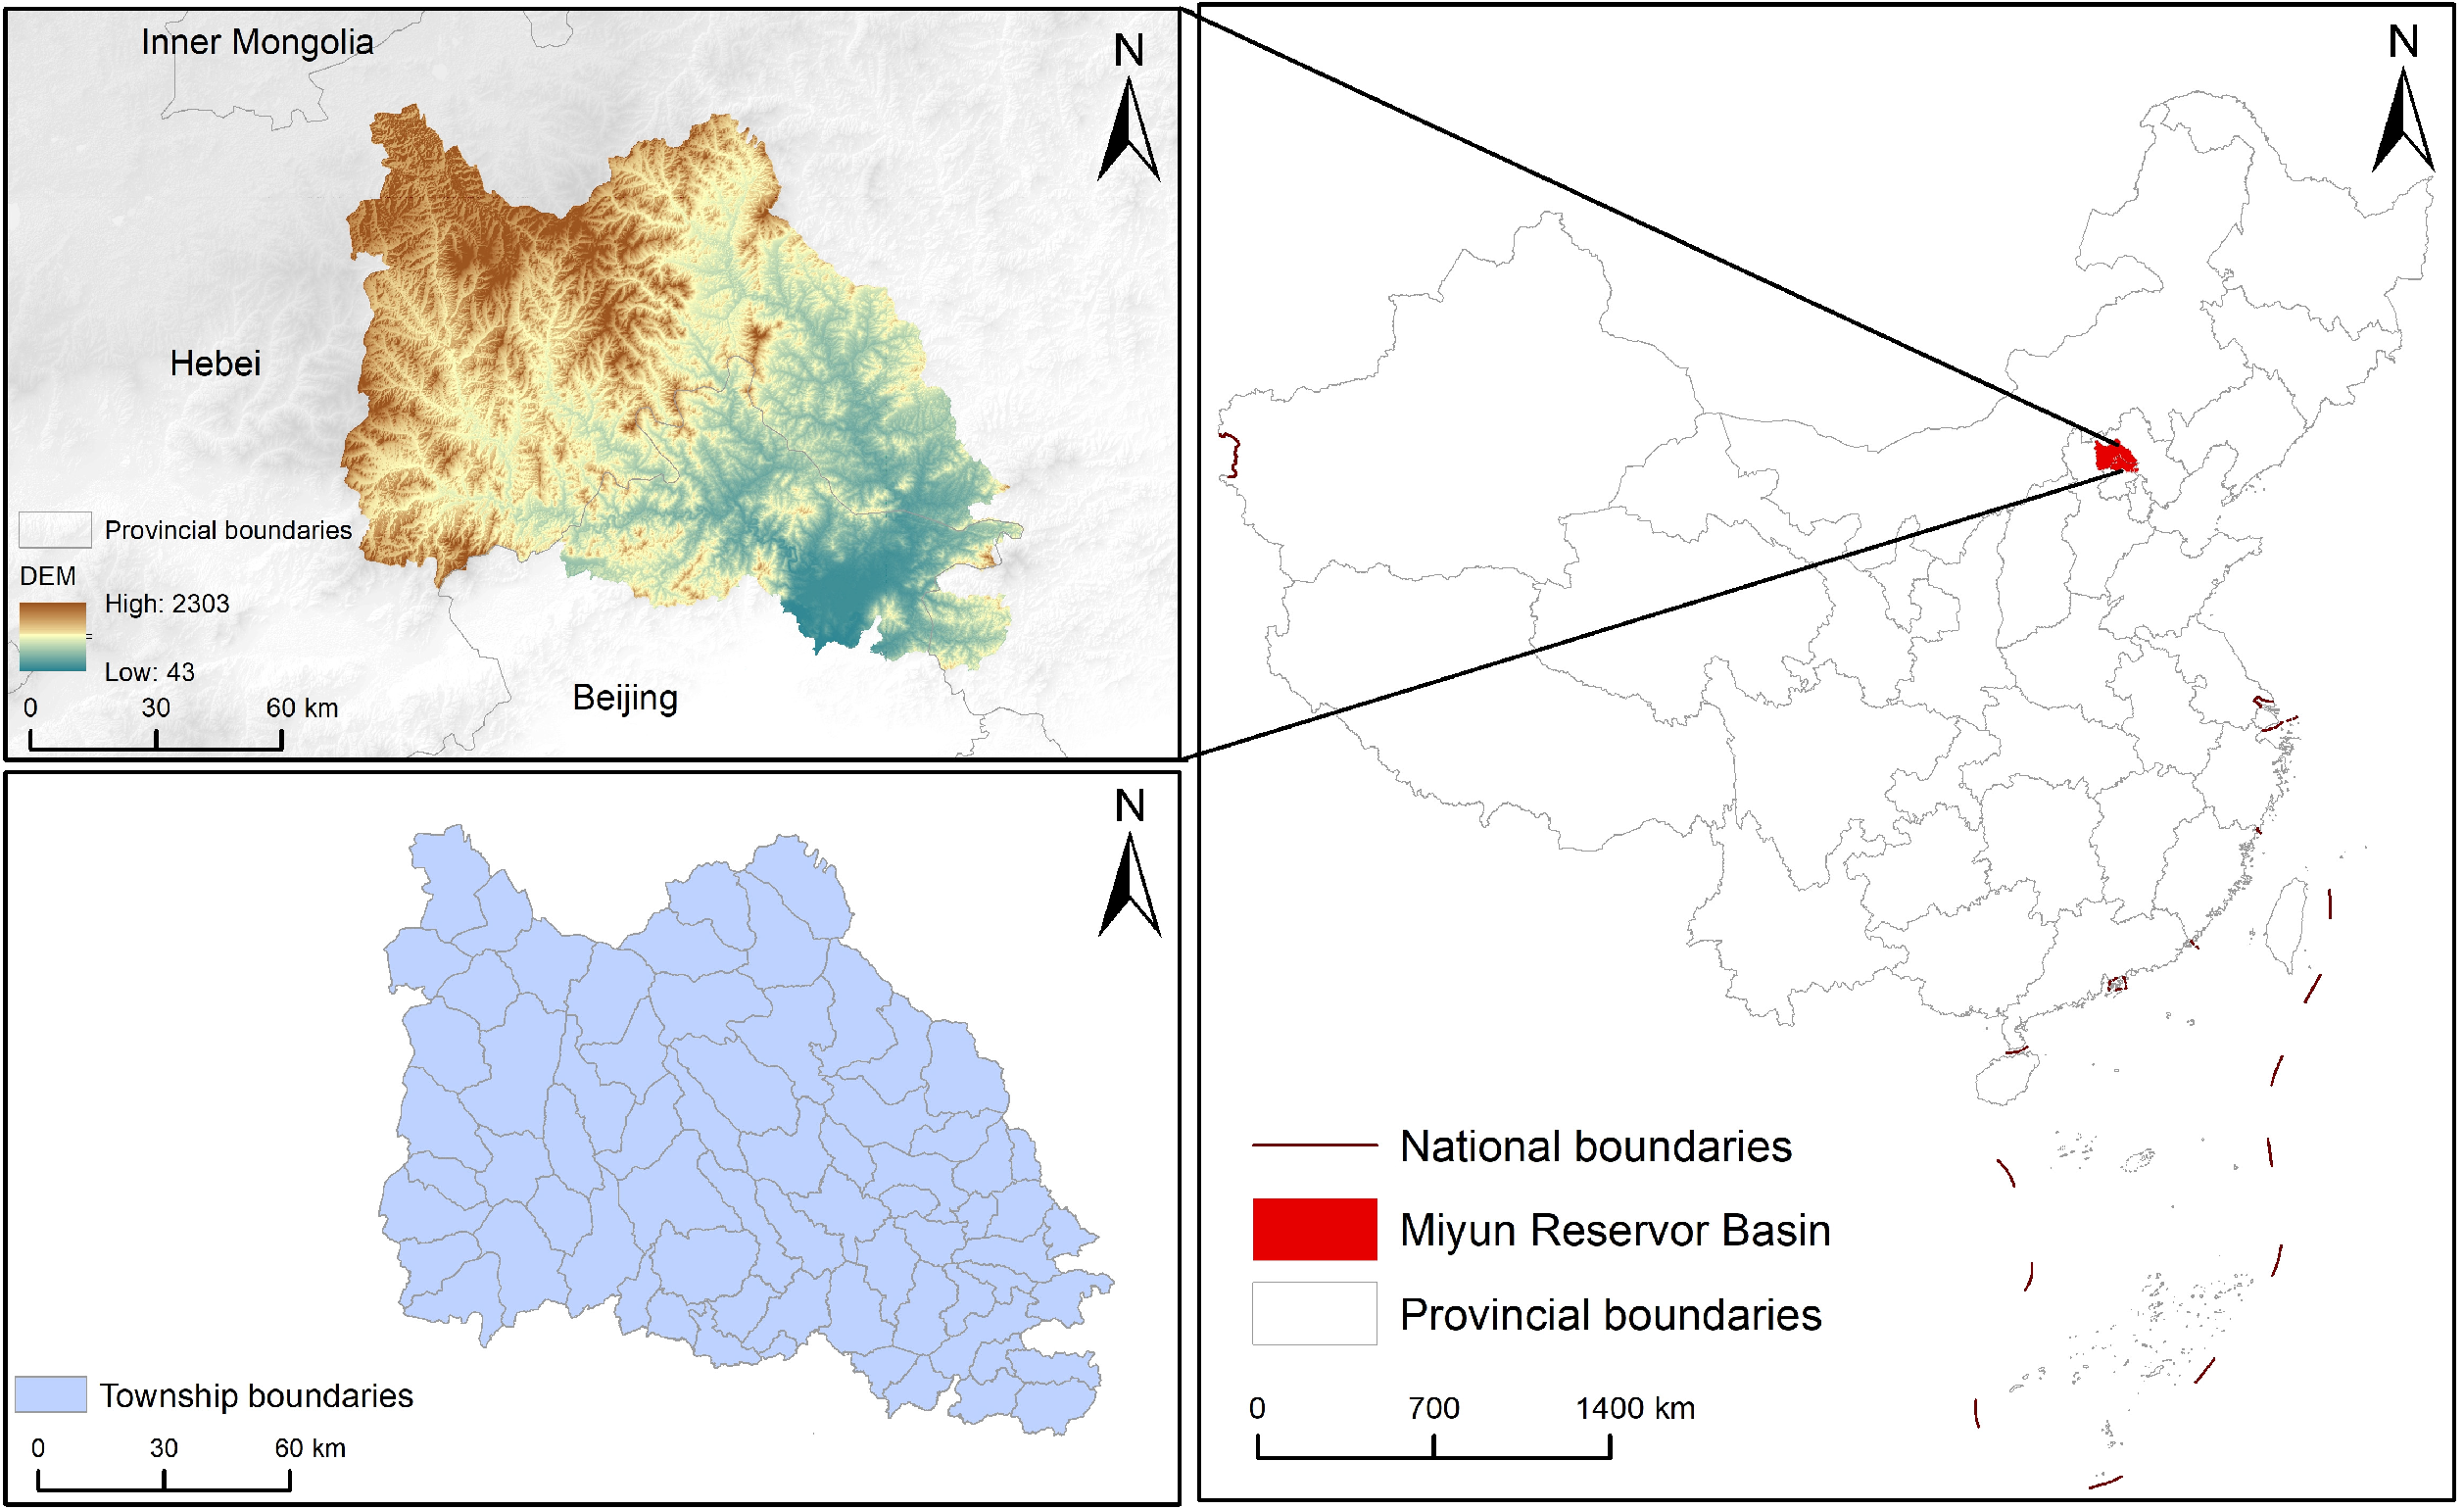
Figure 1. Schematic diagram of the Miyun Reservoir Basin.
Land 14 02305 g001
Figure 2. Land Use Changes in the Miyun Reservoir Basin from 2010 to 2023.
Land 14 02305 g002
Figure 3. ES Changes in the Miyun Reservoir Basin from 2010 to 2023. Note: Ecosystem service abbreviations used in this study: FP = food production; WY = water yield; NR = nitrogen retention; PR = phosphorus retention; SR = soil retention. These abbreviations are used consistently in all subsequent tables and figures.
Land 14 02305 g003
Figure 4. Heatmap of Spearman rank correlation coefficients among ecosystem service indicators at the 1 km grid scale. Notes: ** denotes statistical significance at p < 0.01. Color scale ranges from strong negative (trade-off) to strong positive (synergy).
Land 14 02305 g004
Figure 5. Heatmap of Spearman rank correlation coefficients among ecosystem service indicators at the 3 km grid scale. Notes: ** denotes statistical significance at p < 0.01. Color scale ranges from strong negative (trade-off) to strong positive (synergy).
Land 14 02305 g005
Figure 6. Heatmap of Spearman rank correlation coefficients among ecosystem service indicators at the township level. Notes: ** and * denote statistical significance at p < 0.01 and p < 0.05, respectively. Color scale ranges from strong negative (trade-off) to strong positive (synergy).
Land 14 02305 g006
Figure 7. Spatial patterns of ES trade-offs and synergies from 2010 to 2023. Note: Ecosystem service abbreviations used in this study: FP = food production; WY = water yield; NR = nitrogen retention; PR = phosphorus retention; SR = soil retention. Color scale ranges from strong trade-off to strong synergy.
Land 14 02305 g007
Table 1. Data and resources.
Data NameFormatYearResolutionData Sources
Land Use and Land Covertiff2010, 2015, 2018, 2020, 202330 mResource and Environmental Science and Data Center, Chinese Academy of Sciences (https://www.resdc.cn/, accessed on 21 October 2025)
Precipitation and potential evapotranspiration (PET) dataCN2010, 2015, 2018, 2020, 2023——National Qinghai–Tibet Plateau Scientific Data Center (http://data.tpdc.ac.cn, accessed on 21 October 2025)
Soil depth to bedrocktiff——1 kmDerived from published literature
HWSD China Soil datatiff——1 kmGeographic Data Platform of the College of Urban and Environmental Sciences, Peking University (http://geodata.pku.edu.cn, accessed on 21 October 2025)
Administrative boundary vectorshp————Extracted from Baidu Maps
NDVItiff2010, 2015, 2018, 2020, 2023250 mNational Qinghai–Tibet Plateau Scientific Data Center (http://data.tpdc.ac.cn, accessed on 21 October 2025)
Crop production data 2010, 2015, 2018, 2020, 2023——Statistical Yearbooks of Cities and Districts/Counties
Digital Elevation Model (DEM)tiff——30 mDerived from published literature
Biophysical table ————Obtained from Invest model handbook and the literature
Note: “——” indicates data not available or not applicable.
Table 2. Land use/land cover composition in the Miyun Reservoir Basin (2010–2023), expressed as percentage of total area (%).
LULC Class20102015201820202023
Cropland22.41%22.39%22.07%22.01%20.72%
Forest48.02%47.97%48.27%48.15%50.18%
Grassland26.17%26.08%25.80%25.80%24.27%
Water1.41%1.42%1.59%1.75%2.10%
Built-up Land1.67%1.83%1.97%1.99%2.41%
Unused0.32%0.31%0.30%0.30%0.32%
Table 3. ES changes in the Miyun Reservoir Basin (2010–2023).
20102015201820202023
Grain Production (t)287,448288,831330,406404,932363,188
Water Yield (×109 m3)22.6316.6120.4622.8612.61
Nitrogen Retention (t)4420.54379.84024.33991.33904.6
Phosphorus Retention (t)723.5711.6700.5696.9665.5
Soil Retention (×106 t)117.4598.22112.96123.3885.73
Disclaimer/Publisher’s Note: The statements, opinions and data contained in all publications are solely those of the individual author(s) and contributor(s) and not of MDPI and/or the editor(s). MDPI and/or the editor(s) disclaim responsibility for any injury to people or property resulting from any ideas, methods, instructions or products referred to in the content.