Article

Exploring the Relationship Between Rural Development and Marginalization: An Empirical Study from Linhai City, Zhejiang Province, China

1
School of Architecture and Urban Planning, Beijing University of Technology, Beijing 100124, China
2
Beijing Academy of Social Sciences, Beijing 100101, China
*
Author to whom correspondence should be addressed.
Land 2025, 14(11), 2285; https://doi.org/10.3390/land14112285
Submission received: 20 September 2025 / Revised: 7 November 2025 / Accepted: 11 November 2025 / Published: 19 November 2025

Abstract

The study focuses on the multidimensional attributes of rural marginalization and their differentiated impact on rural development levels. Based on a systematic review and summary of research findings, this study elucidates the conceptual implications of rural development levels and rural marginalization and deconstructs rural marginalization into five dimensions. Considering Linhai City in Zhejiang Province, China, as the research object, a measurement model for rural development levels was constructed comprising basic and enhancement factors. An influencing factor set was established based on the perspective of marginalization. Spatial autocorrelation and multiscale geographically weighted regression models were comprehensively employed to measure and analyze rural development levels and their influencing factors. The main findings are as follows: (1) the concept of rural marginalization is defined from five dimensions: spatial, technological, policy, social, and infrastructural, and a quantitative evaluation system is established; (2) through quantitative analysis using Linhai City as an example, it is found that the influence of marginalization across different dimensions on rural development exhibits significant spatial variability, meaning that the impact of marginalization on rural development levels is influenced by multiple factors. These findings suggest that, while formulating rural development policies, we should fully consider the actual and external circumstances of different villages, adopt tailored strategies based on local conditions, and avoid implementing one-size-fits-all policies.

1. Introduction

Against the backdrop of rapid urbanization and industrialization worldwide, there has been a one-way flow of production factors such as labor and land from rural areas to cities, and the population decline in rural areas has become increasingly apparent [1]. According to World Bank statistics, the global rural population has declined from 66% in 1960 to 43% in 2023, with rural populations demonstrating negative growth since 2021. Since China’s reform and opening-up in 1978, the dual drivers of urbanization and industrialization have led to a significant reduction in the rural population. According to the National Bureau of Statistics, China’s urbanization rate has surged from 17.92% in 1978 to 67% in 2024, whereas many developed countries, such as the UK and the US took more than twice as long to achieve the same level of urbanization. Additionally, the outflow of rural populations in many Chinese regions between 2010 and 2020 was more pronounced than during the 2000–2010 period [1,2]. According to data from the sixth and seventh national population censuses, the rural permanent resident population decreased sharply from 674.2 million to 509.8 million between 2010 and 2020, a net decrease of 164.4 million over the decade; the proportion of the rural population fell sharply from 50.32% to 36.11%. To enhance rural development capabilities and standards, the Chinese government launched the “Rural Revitalization Strategy” in 2017, with the overarching requirements of “thriving industries, ecologically pleasant living environments, civilized rural customs, effective governance, and prosperous livelihoods” to comprehensively advance rural revitalization. In 2022, the report of the 20th National Congress of the Communist Party of China reemphasized the need to comprehensively advance rural revitalization, adhere to the priority development of agriculture and rural areas, uphold integrated urban–rural development, and facilitate the flow of urban–rural resources. The implementation of the Rural Revitalization Strategy has significantly improved the comprehensive development of rural areas, increased farmers’ incomes, and addressed infrastructure shortcomings. However, this has not altered the ongoing decline in the rural population or the significant gap in development between urban and rural areas [3]. Some rural areas have experienced population outflows, leading to land abandonment, vacant houses, and economic decline. Rural areas remain marginalized [1].
Population loss and economic decline have led to a form of spatial inequality known as “marginalization” [4]. “Marginalization” is the opposite of “centralization” and refers to the gradual shifting away from the center. Rural marginalization refers to the gradual shifting away from their mainstream status in the regional development process, with cities as the reference point [5]. This concept manifests itself in the relative weakening of the socioeconomic status of rural areas [6,7]. Moreover, it manifests itself in the abandonment and replacement of local history and culture, which essentially reflects the uneven flow of development factors in urban–rural interactions [8]. It is noteworthy that as villagers are the mainstay of rural areas, rural marginalization includes the marginalization of rural areas, as well as villagers in terms of resource allocation, access to decision-making power, and other aspects [9].
As an interdisciplinary research topic, marginalization has long been the focus of scholarly attention in fields such as sociology, geography, political science, and developmental studies. International scholars generally understand “marginalization” as the process by which individuals, groups, and regions are gradually excluded or deprived of their rights, resources, and influence on social, economic, political, and cultural systems. It is both a state and process [6,10,11,12,13,14]. In the context of globalization and urbanization, rural areas often face structural disadvantages. Consequently, the concept of marginalization has gradually been extended to rural areas and has become a focus of attention in the international academic community. Currently, international scholars have primarily conducted research on the conceptual connotations, impact mechanisms, and intervention measures for rural marginalization. However, there is no unified concept abroad in terms of the conceptual content. Previous studies typically considered marginalization as a geographical phenomenon primarily associated with geographical remoteness, physical isolation, and inadequate infrastructure. However, with the advancement of studies, many international scholars have not only viewed rural marginalization as the result of spatial “marginalization”, but have also emphasized it as a multidimensional, dynamic process encompassing complex mechanisms such as economic decline, social exclusion, digital exclusion, institutional neglect, and ecosystem collapse [6,15,16,17,18,19].
In extant studies, marginalized rural areas generally exhibit the following characteristics: declining population and aging, weakened public service provision capacity, limited employment opportunities, difficulties in education policy and practice, and a continuing decline in social capital and community cohesion [20,21,22,23,24]. It is particularly noteworthy that rural marginalization is not limited to geographically remote areas, but rather manifests itself as “relational marginalization” [25], which refers to disconnection from mainstream social, economic, and political networks. Rural areas that are not geographically remote may also be marginalized because of insufficient institutional and resource connections [26]. Although scholars have highlighted its multidimensional characteristics of rural marginalization, which generally involve spatial, economic, social, digital, ecological, and institutional marginalization [25,27], few international studies have explicitly proposed a multidimensional measurement model for rural marginalization.
In comparison, studies on rural marginalization in China are relatively scarce. Domestic scholars have primarily employed terms such as “rural hollowing-out”, “rural decline”, and “rural shrinkage” to describe and analyze this phenomenon. From the perspective of conceptual scope, “marginalization” can be considered as a comprehensive manifestation of phenomena such as rural hollowing-out, decline, and shrinkage. Therefore, examining studies on rural hollowing-out, decline, and shrinkage is necessary to indirectly reveal the formation pathways and current challenges of rural marginalization. Domestic scholars argue that “rural hollowing-out” is a widespread structural issue in China’s rural development, primarily manifested as the shrinking and weakening of the population, land, economy, and culture, serving as a key mechanism and form of expression driving rural marginalization [28,29,30,31]. The hollowing out of rural areas is not only the result of population migration but also the result of the long-term effects of the urban–rural dual structure, industrialization, regional development imbalances, and policy bias [32,33]. Simultaneously, rural decline exhibits structural disadvantages, such as population loss and aging, declining cohesion, lack of construction planning, and governance crises [34]. Similarly, rural shrinkage refers to a systemic decline in rural areas, such as population decline, economic recession, deterioration of service functions, and spatial contraction, against the backdrop of urbanization and industrialization. Domestic research on rural shrinkage primarily focuses on four aspects: the identification and measurement of shrinkage, driving mechanisms, classification of types, and response strategies [35,36,37,38].
From the differences and connections among the three concepts mentioned above, the concept of rural hollowing-out primarily centers on the trend of rural population outflow and the consequent phenomena of vacant rural houses and homesteads, along with abandoned farmland. In comparison, the concept of rural decline depicts the overall deterioration of the rural system, encompassing not only the outflow of rural population but also a general decline in rural economic and social development, as well as landscape degradation. Distinct from the aforementioned two concepts, the concept of rural shrinkage mainly focuses on population and land aspects. Specifically, when there is a persistent outflow of rural population and a notable reduction in rural land area, rural shrinkage is deemed to have occurred. It is important to note that rural shrinkage does not inevitably lead to rural decline. Only when rural shrinkage coincides with a continuous decline in rural economic development does rural decline become evident. Although these three concepts are different, they are closely related and constitute an important theoretical basis for international research on rural marginalization.
Overall, extant studies have provided theoretical and technical support for defining and evaluating the concept of rural marginalization. However, the definition of rural marginalization remains somewhat vague. Additionally, current studies on rural marginalization primarily focus on specific rural cases or single aspects of marginalization, with limited research on the spatial differentiation patterns of multidimensional rural marginalization within a given region from a geographical perspective, as well as the patterns of differentiation in the impact of rural marginalization on rural development levels. This gap is particularly evident in the context of regional practices. Considering Linhai City in Zhejiang Province as an example, the development gap between the western mountainous areas and the eastern coastal rural areas of the city remains significant, despite its location at the forefront of China’s reform and opening-up and as a demonstration zone for common prosperity, and despite having improved the overall development level of rural areas and living environment through policies such as the “Thousand Village Demonstration, Ten Thousand Village Improvement” initiative. Is this spatial differentiation closely related to the multidimensional characteristics of marginalization? Do all dimensions of rural marginalization influence rural development levels? How can deconstructing the mechanisms of marginalization provide pathways for rural revitalization?
To address the shortcomings of existing research and provide accurate answers to the above questions, this study defines the concept of rural marginalization and conducts an empirical study on the causal mechanisms between rural marginalization and rural development levels using 574 rural areas in Linhai City as a case study. This study proposes a quantitative method for measuring rural development levels based on basic and enhancing elements of rural development. Further, it assesses the degree of marginalization across five dimensions based on the conceptual framework of rural marginalization. Finally, it employs a multiscale geographic weighted regression method to clarify how rural marginalization influences rural development levels. The remainder of this paper is organized as follows: The second section constructs the theoretical framework; the third section introduces the study area, data sources, and research methods, including the evaluation indicator system; the fourth section summarizes the results of the analysis of the mechanism by which rural marginalization in different dimensions affects rural development levels; the fifth section discusses the relationship between rural development levels and marginalization in different dimensions, policy responses, and research limitations; the final section summarizes the chief findings of this study.

2. Theoretical Framework

Rural development is a multidimensional and comprehensive concept comprising basic and enhancement elements [39]. The basic elements form the foundational platform and primary driving force of rural development, determining the foundation and potential scope of rural development. Enhanced elements determine the degree of shared development outcomes, the quality of development, and its sustainability, serving as the key support for rural areas to transition from a “survival-oriented” to a “development-oriented” and “livable” model. High-quality rural development inevitably requires the balanced, coordinated, and mutually reinforcing advancement of both types of elements. Among these, the academic community generally agrees that the core basic elements of rural development are population, land, and industry [40]; population is the mainstay and core driving force of rural development; land is the core resource of rural geographical space; and industry is the economic foundation that provides employment and supports development. Any change in one factor affects the development direction of other factors [41]. The core objective of rural revitalization is to systematically construct a coordinated framework for various development factors such as population, land, and industry [42]. Based on these basic elements, the key factors for improving the quality and sustainability of rural development primarily include public service facilities and the environment. The former provides rural residents with basic livelihood security and development opportunities, whereas the latter is an ecological foundation and a source of attractiveness for sustainable rural development. The degree of improvement in these two factors directly affects the quality of life of residents, the accumulation of human capital, and the livability of rural areas.
Rural marginalization is a concentrated manifestation of the multidimensional vulnerabilities faced by rural areas during the processes of globalization and urbanization. At its core, this reflects an imbalance in the distribution of resources, power, and development opportunities. Therefore, this study attempts to define rural marginalization from a state perspective. Drawing on the multidimensional implications of “marginalization” and combining them with the actual development situation of rural areas in Linhai City, this study deconstructs marginalization into five dimensions: spatial, technological, policy, social, and infrastructural. This systematically elucidates the mechanisms by which these dimensions influence the spatial differentiation of rural development levels (Figure 1). It should be pointed out that, generally speaking, the definition of rural marginalization typically encompasses an economic dimension. In this paper, given that rural development levels are primarily determined by economic development indicators, to more effectively differentiate between marginalization and development levels, and to more clearly evaluate the influence of marginalization on rural development, the economic dimension is excluded from the definition of rural marginalization.
Spatial marginalization primarily manifests itself in geographical isolation and constraints on resource accessibility. Geographical space is a fundamental factor in the disparities in rural development. Such marginalization is often associated with geographical remoteness and natural constraints [22,43], such as high altitudes and steep terrain, which exacerbate transportation costs and difficulties in accessing resources [23]. Geographical isolation not only directly limits agricultural intensification and industrial layout, but also indirectly weakens rural development potential by reducing the accessibility of public services [19]. Technological marginalization primarily manifests as a digital divide and lack of information empowerment. Digital technology is a key tool for contemporary rural development. Uneven technology diffusion leads to “digital exclusion” [44], exacerbating the disadvantage of marginalized groups in accessing services. Villages without high-speed network support struggle to access e-commerce, distance education, and smart agriculture [45], and insufficient information empowerment further limits their ability to participate in regional economic cycles [46], creating a negative “technology-economic” feedback loop. Policy marginalization primarily manifests as imbalances in institutional preferences and resource allocation, with policy support serving as a crucial exogenous driver of rural development. This study uses “One Village, Ten Thousand Trees” demonstration villages and beautiful rural areas as indicators to reflect the differentiated logic of policy resource allocation. Demonstration villages typically receive preferential funding and brand premiums [23], whereas villages not included in policy priority zones face insufficient infrastructure investment and lost development opportunities [19]. This “policy Matthew effect” exacerbates development disparities between regions [21]. Social marginalization primarily manifests as weakened organizational structures and declining community cohesion, with social capital serving as the core of endogenous rural development. Marginalized communities face developmental challenges because of “broken social networks” and “lack of participation mechanisms”. Frequent village consultations and improved cultural facilities (such as village history museums) can enhance collective identity [45], while weak grassroots party organizations weaken resource integration capabilities [19], leading to ineffective social mobilization and insufficient endogenous motivation. Infrastructure marginalization is primarily manifested through transportation bottlenecks and lagging public services, with transportation networks serving as the “skeletal system” of rural development. Poor transportation accessibility is a key indicator of marginalization. This study uses bus accessibility time, distance from major transportation arteries, and road network density as indicators to reveal the “lock-in effect” of infrastructure lag on rural spatial development. Inconvenient transportation hinders the flow of production factors, prolongs commuting time, and reduces residents’ quality of life [23], thereby exacerbating population outflow and economic hollowing-out [25], forming a vicious cycle of mutual deterioration between infrastructure and population.
The aforementioned five dimensions of marginalization do not exist in isolation but are intertwined through the synergistic effects of “spatial constraints—technological exclusion—policy neglect—social weakening—infrastructure lag”, collectively constituting rural marginalization. This constitutes the underlying logic of spatial disparities at the rural development level. Geographical isolation triggers initial marginalization by increasing economic costs, technological gaps, and policy preferences, further dividing development opportunities among villages. The loss of social capital and lagging infrastructure solidify the marginalized state. To break this cycle, efforts must target “spatial equity, technological inclusivity, policy precision, social empowerment, and infrastructure balance” to reconstruct the multidimensional resilience of rural development and thereby enhance rural development levels.

3. Materials and Methods

3.1. Study Area

Linhai City (Taizhou, Zhejiang, China, 28°40′ N–29°04′ N, 120°49′ E~121°41′ E) is a county-level city in Zhejiang Province, China, administered by Taizhou City. It is the secondary central city of Taizhou and is located on the eastern coast of the Zhejiang Province (Figure 2). Linhai City has implemented a series of innovative measures in areas such as rural revitalization and industrial transformation, including the “Common Prosperity Workshop.” Owing to its unique geographical location and natural environment, it is a typical region for studying spatial disparities in China’s rural development levels. Owing to limited access to village-level data, the sample for this study comprises 574 administrative villages, accounting for 91.40% of the total number of administrative villages in Linhai.
Linhai City has complex terrain and abundant resources. By the end of 2022, the city administered five subdistricts, 14 towns, 628 administrative villages, and 33 communities (residents’ committees), with a registered population of 1.196 million, of which approximately 62% were rural residents. The city’s land area is 2251 square kilometers, and its maritime area is 1590 square kilometers. It is surrounded by mountains on three sides and borders the sea on one side, forming a “seven mountains, one water, two fields” topography. Linhai City has a distinct subtropical monsoon climate, with an annual average temperature of 17.3 °C and an annual precipitation of 1638 mm, fostering specialty agricultural belts such as citrus and tea. Different rural settlement styles have emerged based on the terrain of mountainous hills, water-rich plains, and coastal areas, resulting in diverse and distinctive rural types.
In 2003, Zhejiang Province launched the “Thousand Village Demonstration, Ten Thousand Village Improvement” initiative. Linhai City actively participated and implemented the program in response to this initiative. After more than two decades of practical exploration, the city has achieved significant results overall: significantly improving the living environment in rural areas, enhancing rural infrastructure, and effectively protecting the ecological environment and cultural resources of rural areas. In 2022, Linhai City achieved a gross domestic product (GDP) of 87.852 billion yuan, an increase of 75.446 billion yuan compared with the 12.406 billion yuan GDP in 2003, representing a year-on-year increase of 608.14%.
Although the overall development of rural areas in Linhai City has made significant progress, disparities remain in the development between rural areas. These disparities not only hinder regional coordinated development, but also pose challenges to the implementation of rural revitalization strategies. Most rural areas continue to face challenges, such as weakening villagers’ sense of ownership and self-organization capabilities, population aging and hollowing-out, coupled with lagging governance levels, decline in agricultural production space, outflow of rural resources and elements, weakening of rural culture, and erosion of traditional rural landscapes [46].

3.2. Data Source

Linhai City comprises 628 administrative villages. Some villages were excluded from the assessment due to unavailable data. This study covers 574 villages, accounting for 91.40% of the total, and thus provides a representative picture of rural development in Linhai City.
This study utilized natural environment data, geospatial data, and socioeconomic statistical data. Detailed information regarding data sources is provided in Table 1. The data primarily originated from three channels: First, the research team conducted field investigations in Linhai City in 2023 in collaboration with the Rural Planning Institute of the China Academy of Urban Planning and Design. Through distributing questionnaires on future rural development, data including whether villages had 5G mobile network coverage was collected. Second, data such as administrative boundaries, coordinates of administrative village centers, and population aging rates were obtained through coordination with relevant government departments in Linhai City. Third, some data were analyzed and processed using ArcGIS 10.5 based on online big data, including farmland area, elevation, slope, and transportation networks. Additionally, due to the difficulty in obtaining village-level data, the timeframes for various datasets could not be fully unified. Population data originated from the “2020 Linhai City Population and Demographic Change Statistical Report” provided by the Linhai Municipal Public Security Bureau, with a timeframe of 2020. Other data sets were sourced from 2023 and 2024. Detailed information regarding data sources is provided in Table 1.
Using DEM data, the average slope and elevation of each village were calculated using the zoning statistics function in ArcGIS 10.5. The distance from each village to the nearest town and coastal city center was calculated using neighborhood analysis, and the distance from each village to the nearest transportation artery was determined using nearest-neighbor analysis. Subsequently, the length of the transportation arteries in each village was calculated using intersection analysis, and the ratio of the transportation artery mileage within each village to the village area was used as the road network density. Land-cover data were used as the input raster, and the output represented the farmland area in each village. The ratio of each village’s farmland area to its total area was used to indicate the farmland resource status of each village. Additionally, the population mobility rate was calculated as (rural permanent residents—rural household registered population)/rural household registered population, and the aging rate was calculated as the number of people aged 60 years and above/total permanent residents.

3.3. Research Methods

3.3.1. Rural Development Level Measurement Model

(1)
Construction of the indicator system
Evaluating rural development level is a complex, systematic study involving many aspects. This study constructed a rural development level evaluation indicator system (Table 2) based on the relevant discussion in the “Guiding Opinions on Carrying out Future Village Construction” issued by the General Office of the Zhejiang Provincial People’s Government as the theoretical basis; following the principles of systematicness, representativeness, scientificity, and data availability; and drawing on existing relevant research [39,41]. Additionally, this variable classification system was developed based on in-depth research conducted by a team of experts into the actual conditions of Linhai City, and was jointly established in consultation with relevant local authorities.
(2)
Calculating rural development levels
According to existing studies on the evaluation of rural development levels, the use of a comprehensive evaluation approach based on an indicator system helps ensure the systematic and accurate nature of the evaluation. Common multiattribute evaluation methods include the Analytic Hierarchy Process (AHP), factor analysis, and entropy value method. These methods can be categorized as subjective, objective, and comprehensive weighting based on the process of determining the weight data. This study employs a combined weighting method that integrates subjective and objective approaches to determine weights, leverage expert experience, and incorporate data-driven adjustments to avoid the biases associated with single-method approaches. Specifically, a hierarchical weighting method was employed. Weights at the criterion level were determined using expert scoring; within each criterion level, the entropy method was used to calculate the weights of the subordinate secondary indicators. The weights of the primary criterion level were multiplied by the entropy weights of the secondary indicators to obtain the final combined weights. The expert scoring method involved five specialists in rural development and planning design, including university scholars and seasoned planners. Each expert carried equal weight (1/5 each), and through iterative discussions, a consensus was ultimately reached on the weighting of key indicators. The specific operations and steps are as follows:
① Data standardization processing
Standardize the original data X i j k (i-th village, j-th primary criterion level, and k-th secondary indicator):
Positive indicators:
Z i j k = X i j k min X j k max X j k min X j k
Negative indicators:
Z i j k = m a x X j k X i j k max X j k min X j k
② Calculation of weights for the first-level criteria layer
Invite m experts to score the importance of n Level 1 criterion layers to obtain weight matrix W j ( 1 ) :
W j 1 = 1 m e = 1 m W j e
where W j e is the weight score provided by expert e for criterion layer j, satisfying
j = 1 n W j ( 1 ) = 1
③ Calculation of secondary indicator weights (entropy method)
For each first-level criterion layer j, the weight of its subordinate second-level indicator k is calculated as follows:
Calculate the indicator weight:
P i j k = Z i j k i = 1 574 Z i j k
Calculate entropy value:
E j k = 1 l n 574 i = 1 574 P i j k l n P i j k
Calculate the coefficient of variation:
d j k = 1 E j k
Calculate the weights of secondary indicators:
W j k 2 = d j k k = 1 K d j k
Satisfy
k = 1 K W j k 2 = 1
④ Comprehensive weight calculation
Multiply the weight of the first-level criteria layer by the entropy value weight of the second-level indicators:
W j c o m p r e h e n s i v e = W j 1 W j k 2
⑤ For each village i, calculate the weighted score:
S i = j = 1 n k = 1 K ( Z i j k W j C o m p r e h e n s i v e )

3.3.2. Methods for Studying Spatial Distribution Characteristics

This study employs both global and local spatial autocorrelation analysis methods from spatial autocorrelation analysis. Global spatial autocorrelation is primarily used to determine whether rural correlation indices exhibit spatial clustering phenomena, as characterized by Moran’s I. This index ranges from −1 to 1, with values greater than 0 indicating a positive spatial correlation, 0 indicating no spatial autocorrelation, and values less than 0 indicating a negative spatial correlation; the larger the absolute value, the stronger the correlation, that is, the higher the degree of clustering. The global Moran’s I index is used to determine whether geographical elements exhibit clustering across an entire region; however, it cannot indicate the autocorrelation of specific spatial units. Therefore, the local autocorrelation analysis method, Anselin Local Moran’s I is employed to calculate the degree of spatial association between each region and its adjacent regions, exploring the spatial heterogeneity of elements within local spatial units. The local autocorrelation formula is as follows:
I i = ( x i x ¯ ) m 0 j = 1 n W i j x j x ¯
In the equation: I i is the local Moran index of observation unit i; x i is the rural development level of observation unit i; x ¯ is the average rural development level of all observation units; W i j is the spatial weight matrix between observation units i and j. The local autocorrelation index can be used to identify different clustering patterns in spatial distribution: a positive value of I i indicates that the attributes of rural development levels in this area exhibit similar high or low value clusters; a negative value of I i indicates that the attributes of rural development levels in this area exhibit opposite high/low value clusters.

3.3.3. Modeling Spatial Relationships from a Marginalized Perspective

(1)
Establishing an impact factor system based on a marginalized perspective
Based on existing research, a multidimensional framework for measuring rural marginalization was developed (Table 3). Spatial marginalization hinders access to resources while increasing development costs; technological marginalization exacerbates inequalities in accessing information-driven economic opportunities; and policy marginalization reflects biases in institutional priorities and resource allocation. Social marginalization can be assessed through community cohesion and participatory governance capacity, which are crucial for sustaining endogenous development. Selecting social indicators such as the establishment of village history museums to represent cultural cohesion and community participation enhances the effectiveness of measuring marginalization dimensions. Infrastructure marginalization reflects systemic barriers that hinder mobility and service provision, thereby exacerbating spatial exclusion. These factors collectively reveal how marginalization leads to spatial disparities in rural development levels through different mechanisms.
(2)
Elimination of multicollinearity
A prerequisite for constructing a regression model is the independence of all explanatory variables. A strong linear correlation between two or more specific variables may lead to unstable parameter estimates in the regression model, thereby causing bias in interpreting the meaning and impact of other variables; this is known as the multicollinearity problem. To address this issue, two metrics—tolerance (TOL) and variance inflation factor (VIF)—will be used to assess potential multicollinearity. If TOL < 0.2 and VIF > 5, this indicates multicollinearity among the explanatory variables. A VIF > 10 indicates a relatively severe multicollinearity issue and the variable should be considered for removal from the model. The formulas for calculating TOL and VIF are as follows:
T O L = 1 R j 2
V I F = 1 T O L
(3)
Spatial autocorrelation test
Before modeling spatial data, a global spatial autocorrelation test is conducted to prove that there is a significant correlation between the influencing factors of rural development, thereby demonstrating the applicability and feasibility of using a geographically weighted regression model for analysis in this region [47,48]. The most commonly used spatial variability test is the Moran’s I test, which reflects the global spatial autocorrelation trend of the explanatory variable. The formula is as follows:
I = n i = 1 n j = 1 n w i j i = 1 n j = 1 n w i j y i y ¯ y j y ¯ i = 1 n y i y ¯ 2
Among them, n is the total number of spatial units; y i and y j represent the attribute values of the i-th and j-th spatial units, respectively; y ¯ is the mean value of all spatial unit attribute values; w i j is the spatial weight value. I is the Moran index, with a value range of [−1, 1]; the larger the absolute value, the stronger the correlation.
(4)
Multiscale geographically weighted regression
The Geographically Weighted Regression (GWR) model was proposed by Brunsdon et al. in 1996. It is a quantitative statistical method that assigns spatial weights to regression coefficients based on spatial relationships, thereby objectively describing local spatial non-stationarity. Compared with the global statistical assumptions of traditional regression models, the GWR model is more suitable for capturing local differences in variable effects, making it widely applied. However, the GWR model can only analyze regression coefficients at the same spatial scale, which is not conducive to the precise identification of influencing factors at different spatial scales, thereby resulting in bias. To address this, Fotheringham et al. proposed an improved multiscale geographic weighted regression model (MGWR) in 2017, which uses the optimal bandwidth for each variable, thereby making the estimation results more reliable [49]. The regression formula is as follows:
Y i = β b w 0 u i , v i + j = 1 k β b w j u i , v i X i j + E i
Among these, ( u i , v i ) represents the position of the i-th spatial unit; Y i and X i j are the observed values of rural development level Y and influence factor X j at ( u i , v i ) respectively; β b w j is the regression coefficient of the j-th influence factor under the optimal bandwidth; β b w 0 is the intercept at ( u i , v i ); bwj and bw0 are the optimal bandwidths used for the j-th influencing factor and the intercept, respectively; E i is the independently distributed random residual for the i-th spatial unit.

4. Results

4.1. Analysis of Rural Development Level Evaluation Results

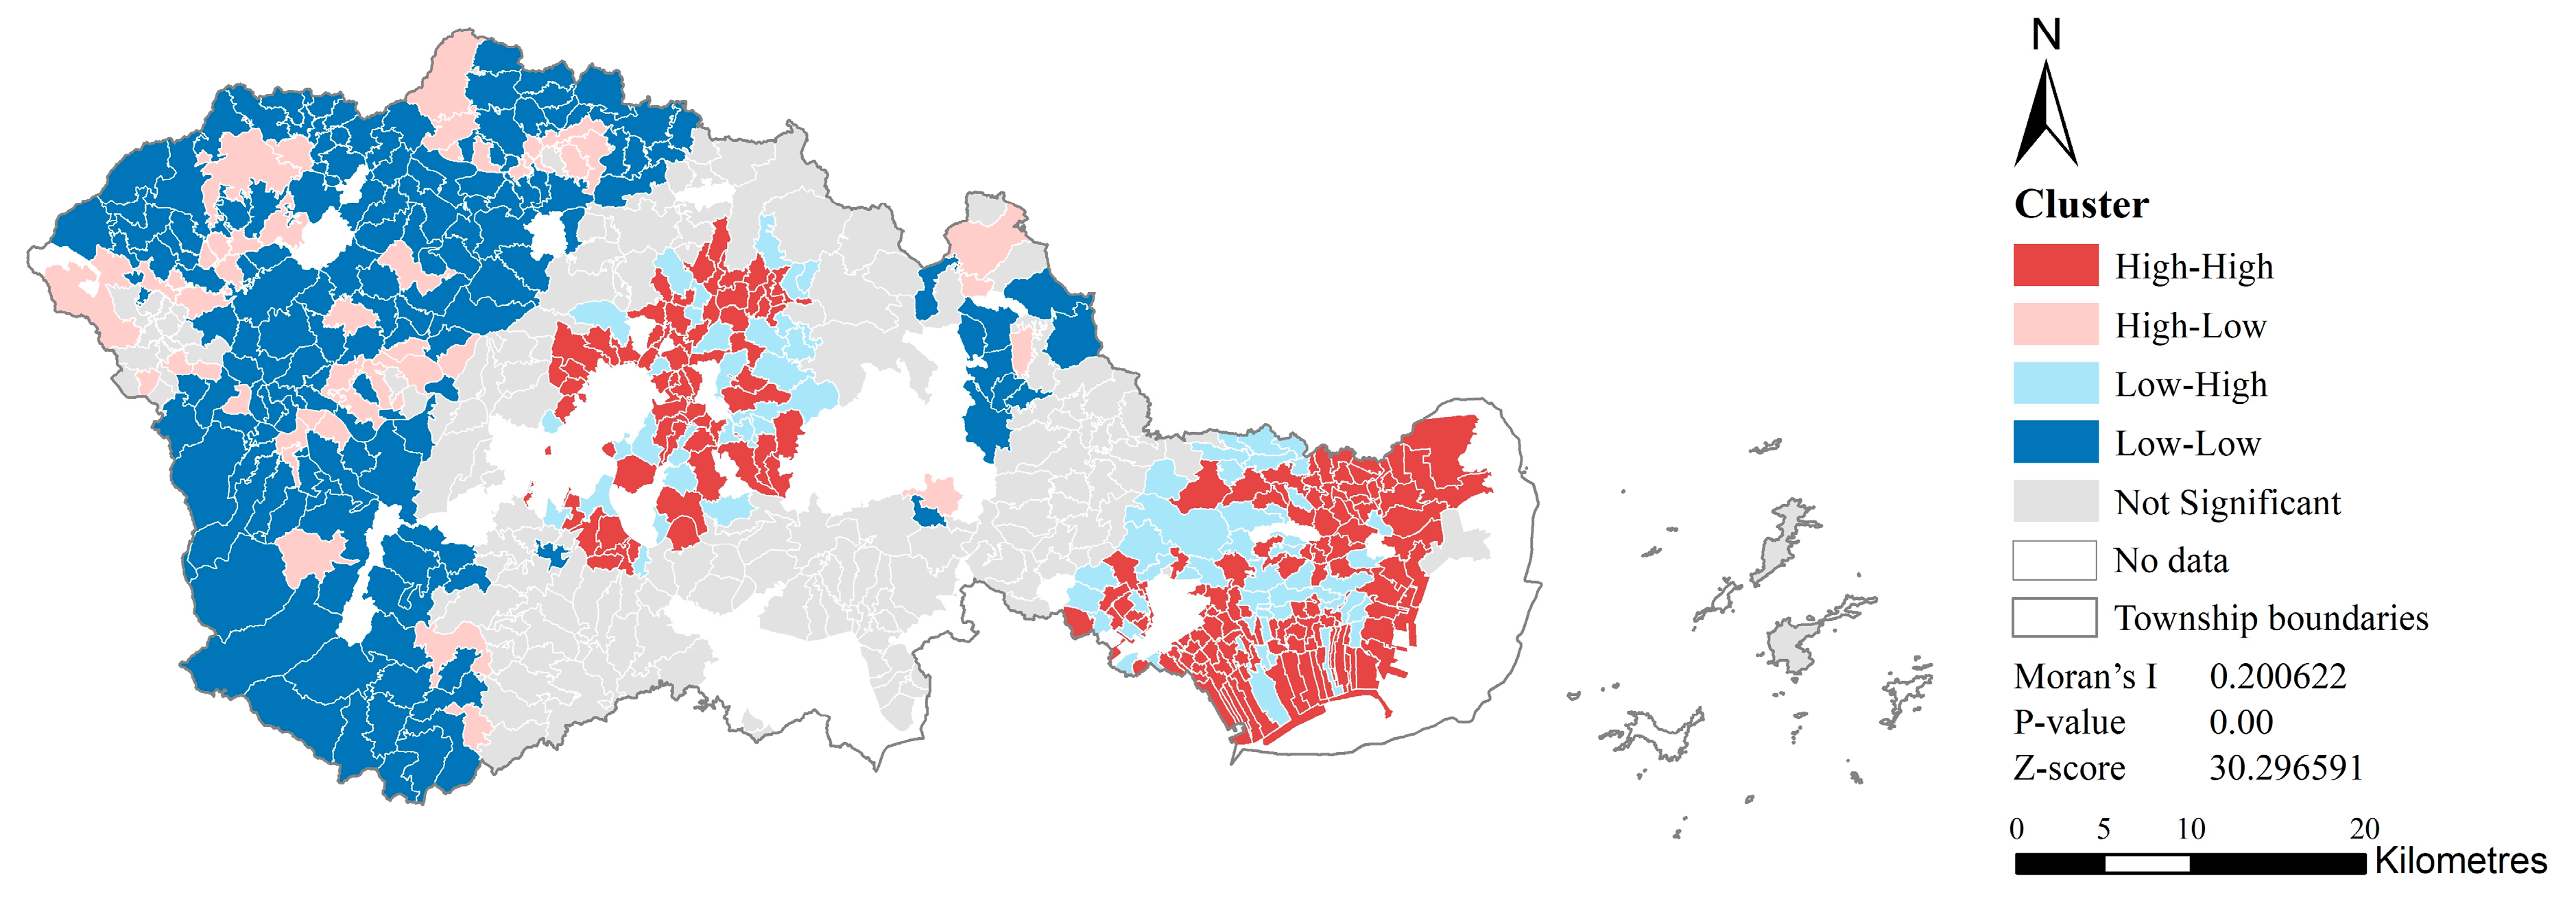
Based on the rural development level measurement model, the rural development levels of 574 administrative villages in Linhai City, Zhejiang Province were calculated for 2023 (Figure 3). To clarify the spatial differentiation characteristics of rural development levels in Linhai City, this study conducted a spatial autocorrelation analysis based on the 2023 rural development level measurement values for Linhai City. From the results of the global spatial autocorrelation analysis (Figure 4), the Moran’s I index of Linhai City’s rural development level was 0.2006, the Z score was 30.2966, and the p value was 0. The above calculation results indicate that the research object passed the significance test, and the spatial elements indicated a positive correlation; that is, Linhai City’s rural development level in 2023 demonstrated a spatially aggregated distribution pattern.
To further reveal the spatial clustering patterns of rural development levels based on global spatial autocorrelation, the Anselin Local Moran’s I index, which reflects the degree of local spatial autocorrelation, was used to classify the data into four clustering patterns. The results reveal that in 2023, the High-High Cluster, characterized by high rural development levels, is primarily located around the central urban area of Linhai City and along the southeastern coastal regions; the Low-Low Cluster is primarily located in the western part of Linhai City, where elevations are generally higher. Regarding outliers, the Low-High Cluster is primarily distributed near high-value aggregation areas, relatively distant from the town centers of their respective towns. These rural areas do not stand out in terms of relative advantages within the region, and the surrounding advantageous villages exert a shielding effect on their development, making them transitional zones in regional development with relatively lower overall development levels; the High-Low Cluster is primarily distributed near the Low-Value Cluster, often in western areas with lower elevations or higher transportation network density. These areas have more advantageous location conditions than surrounding villages.

4.2. Impact Factor Screening

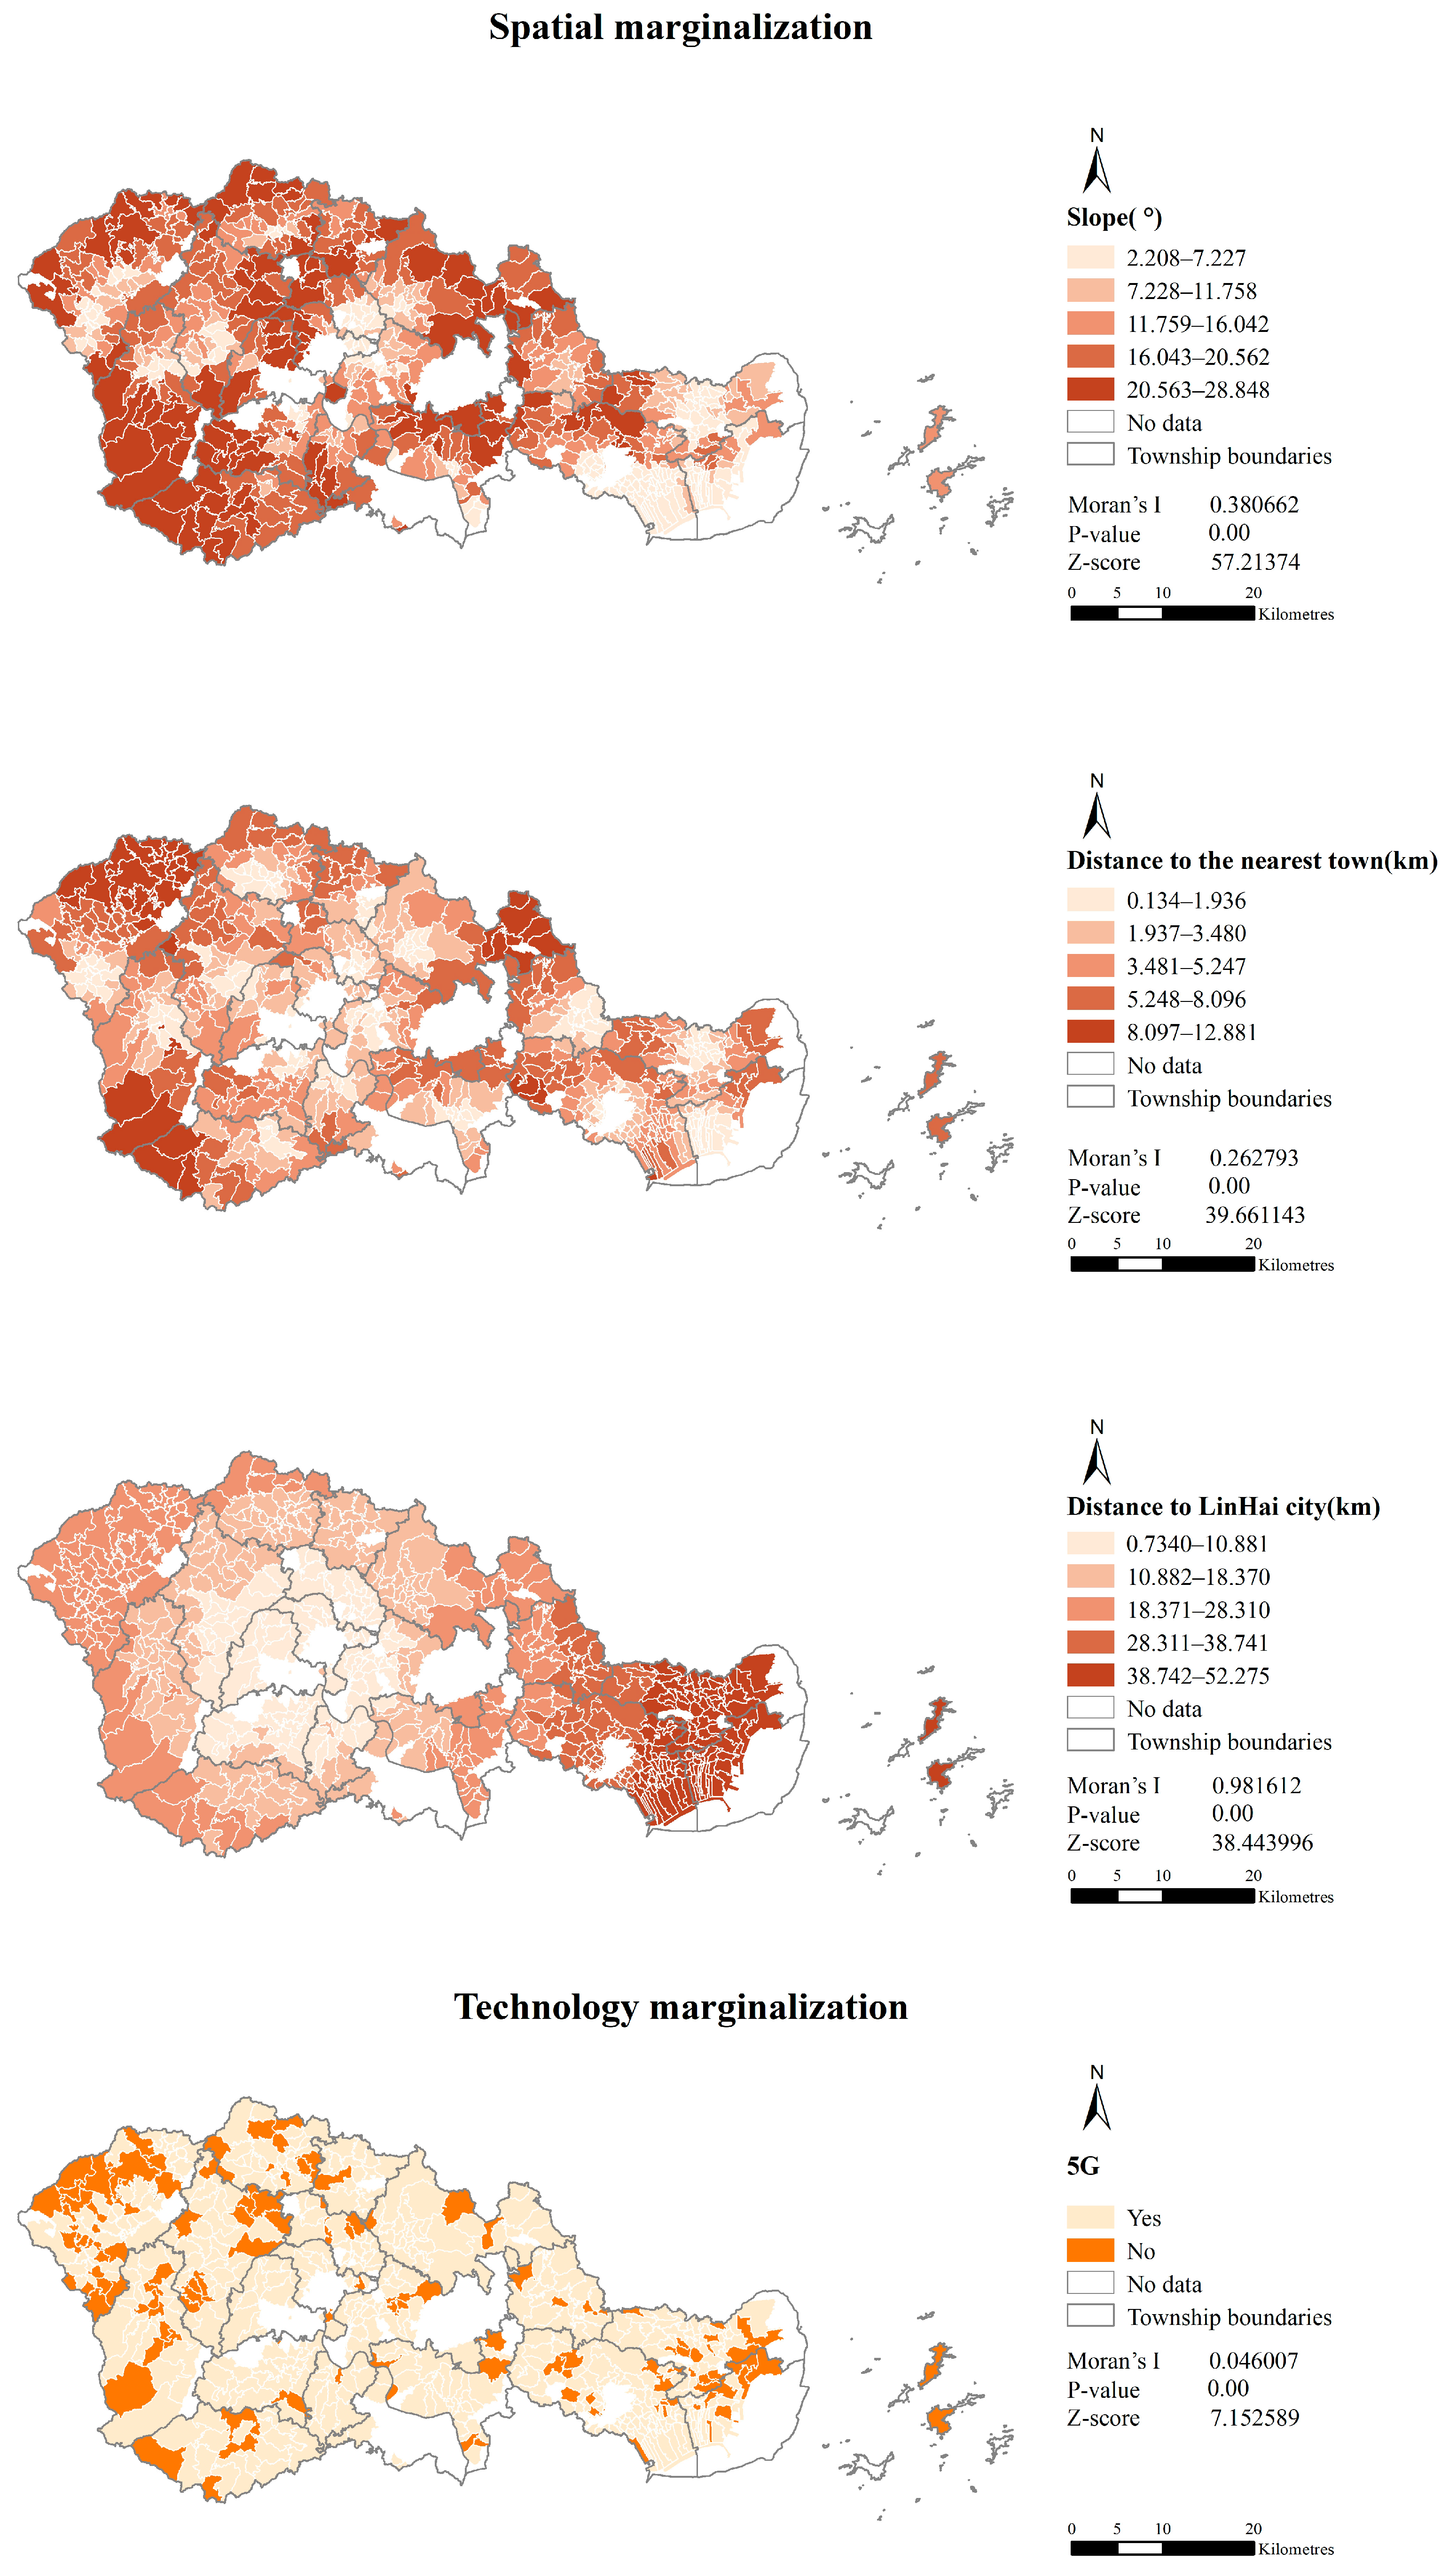
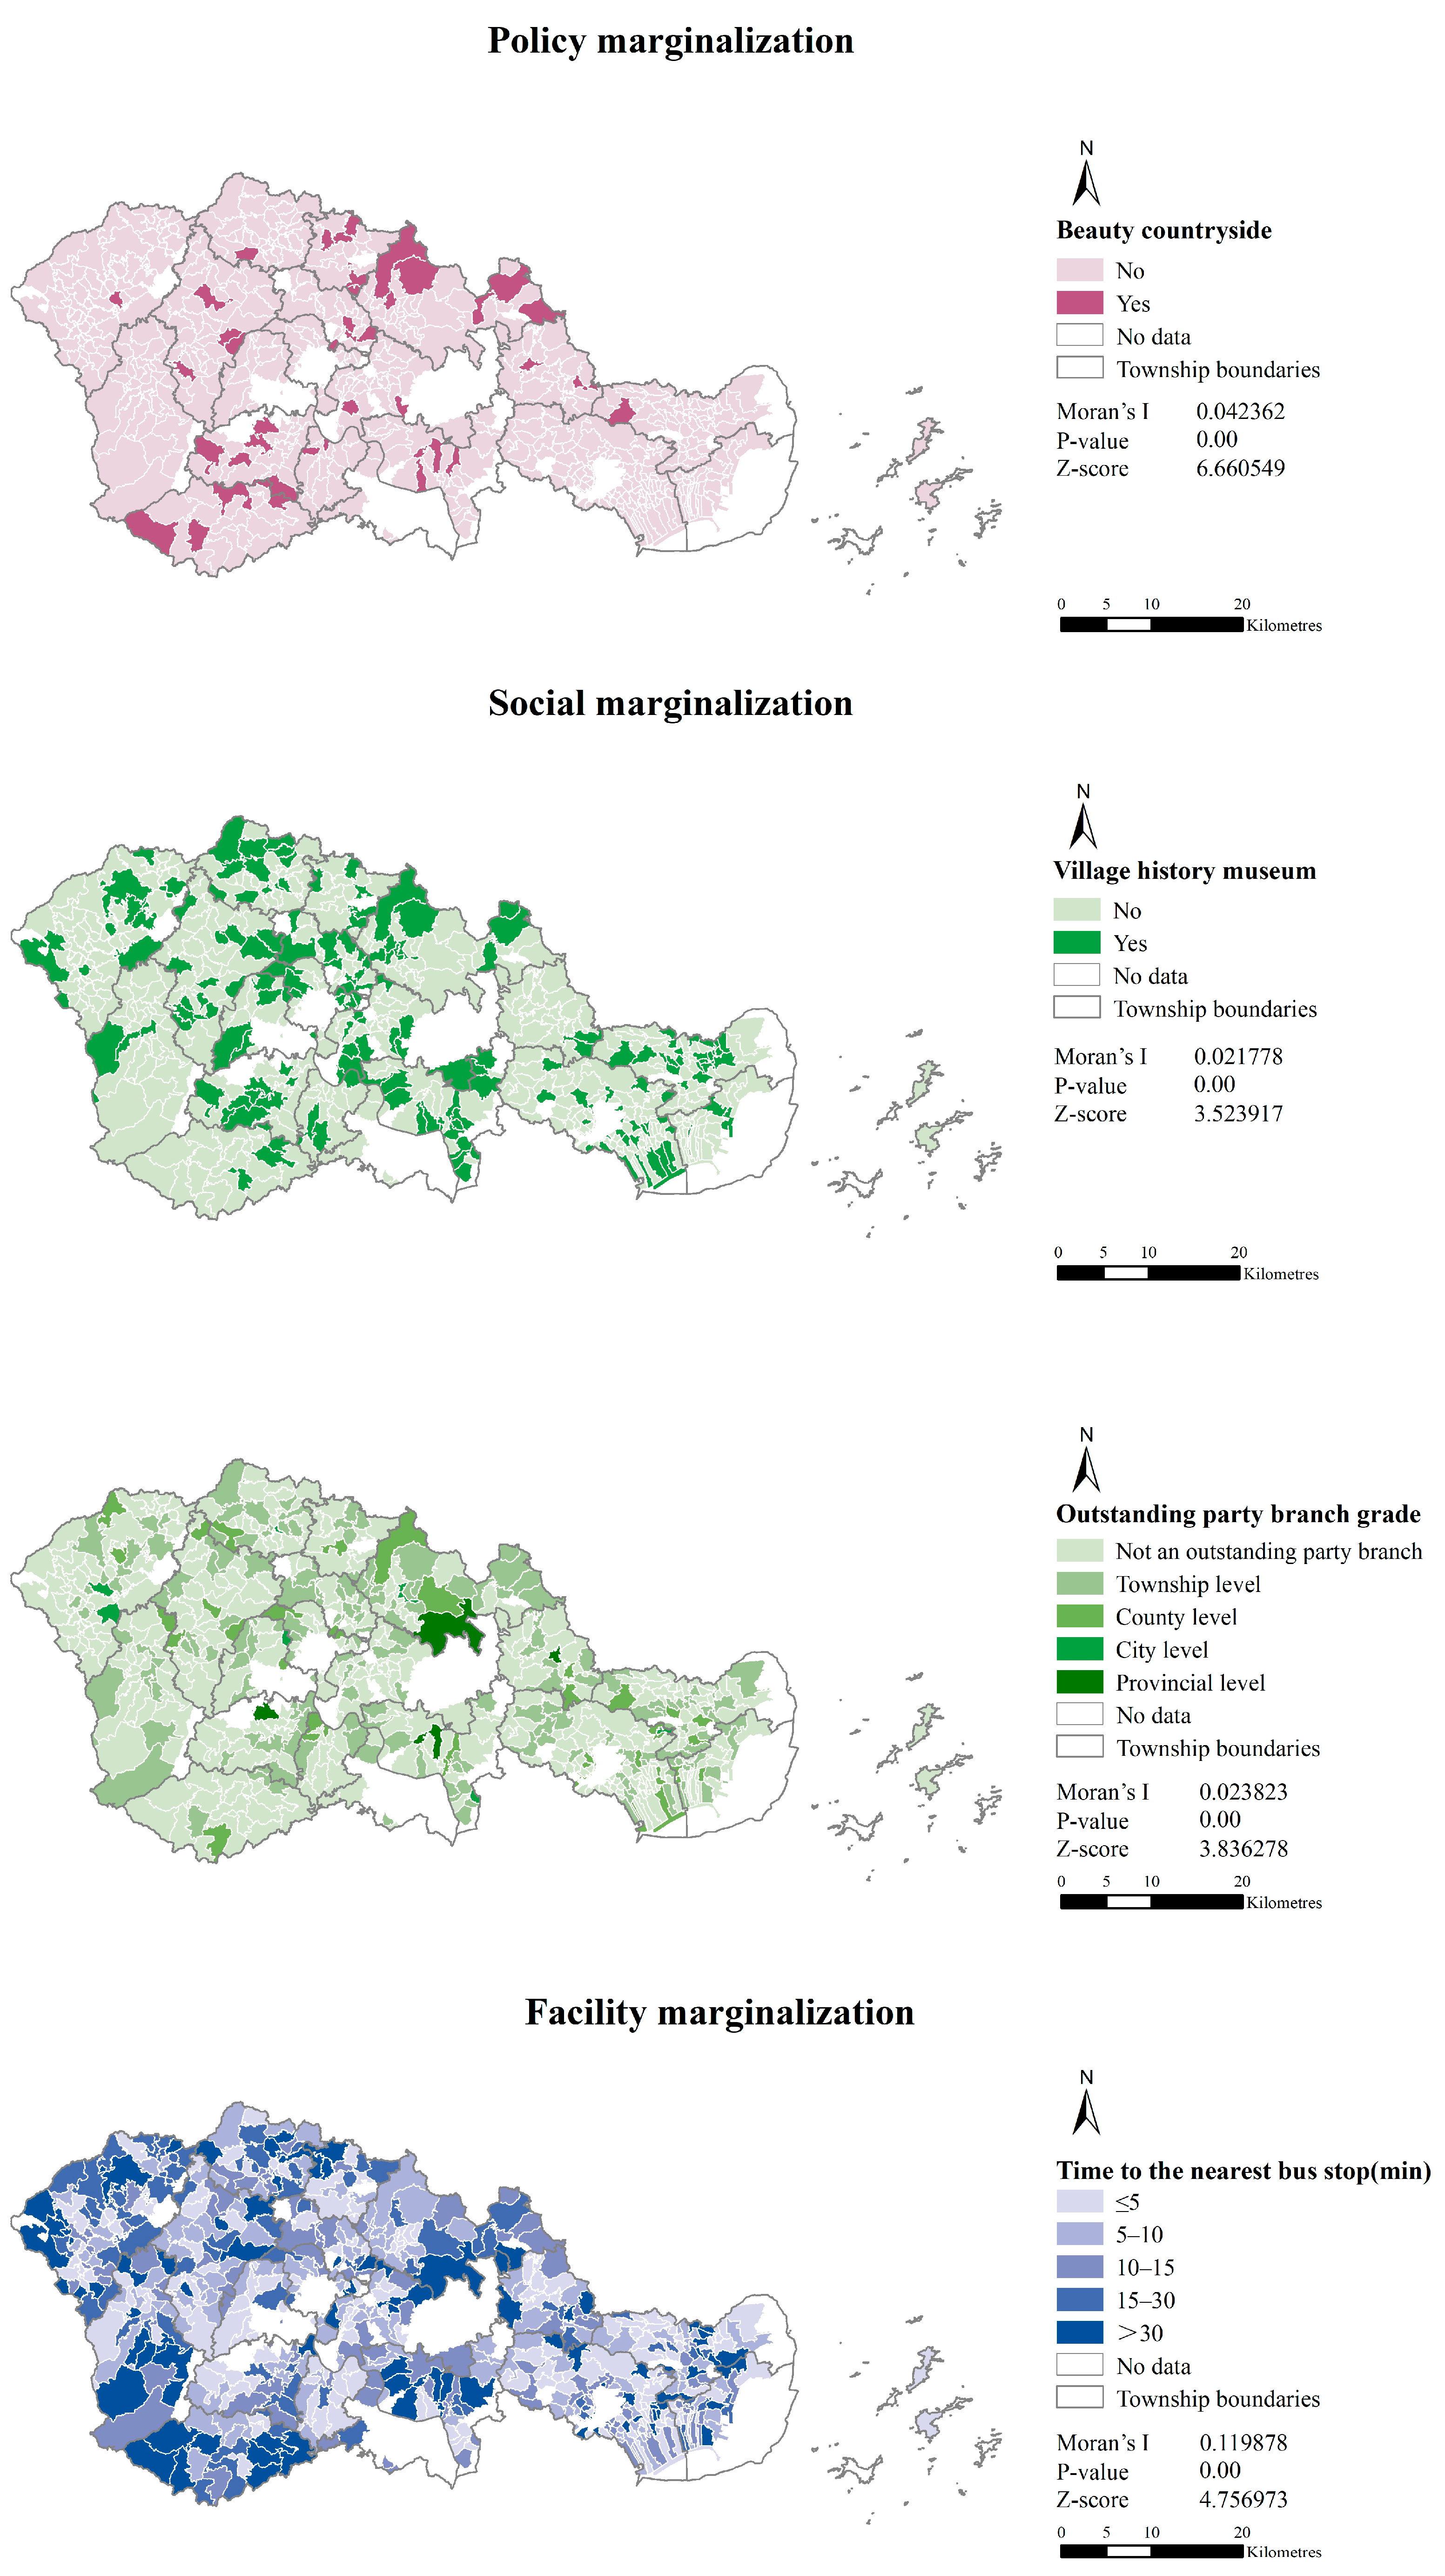
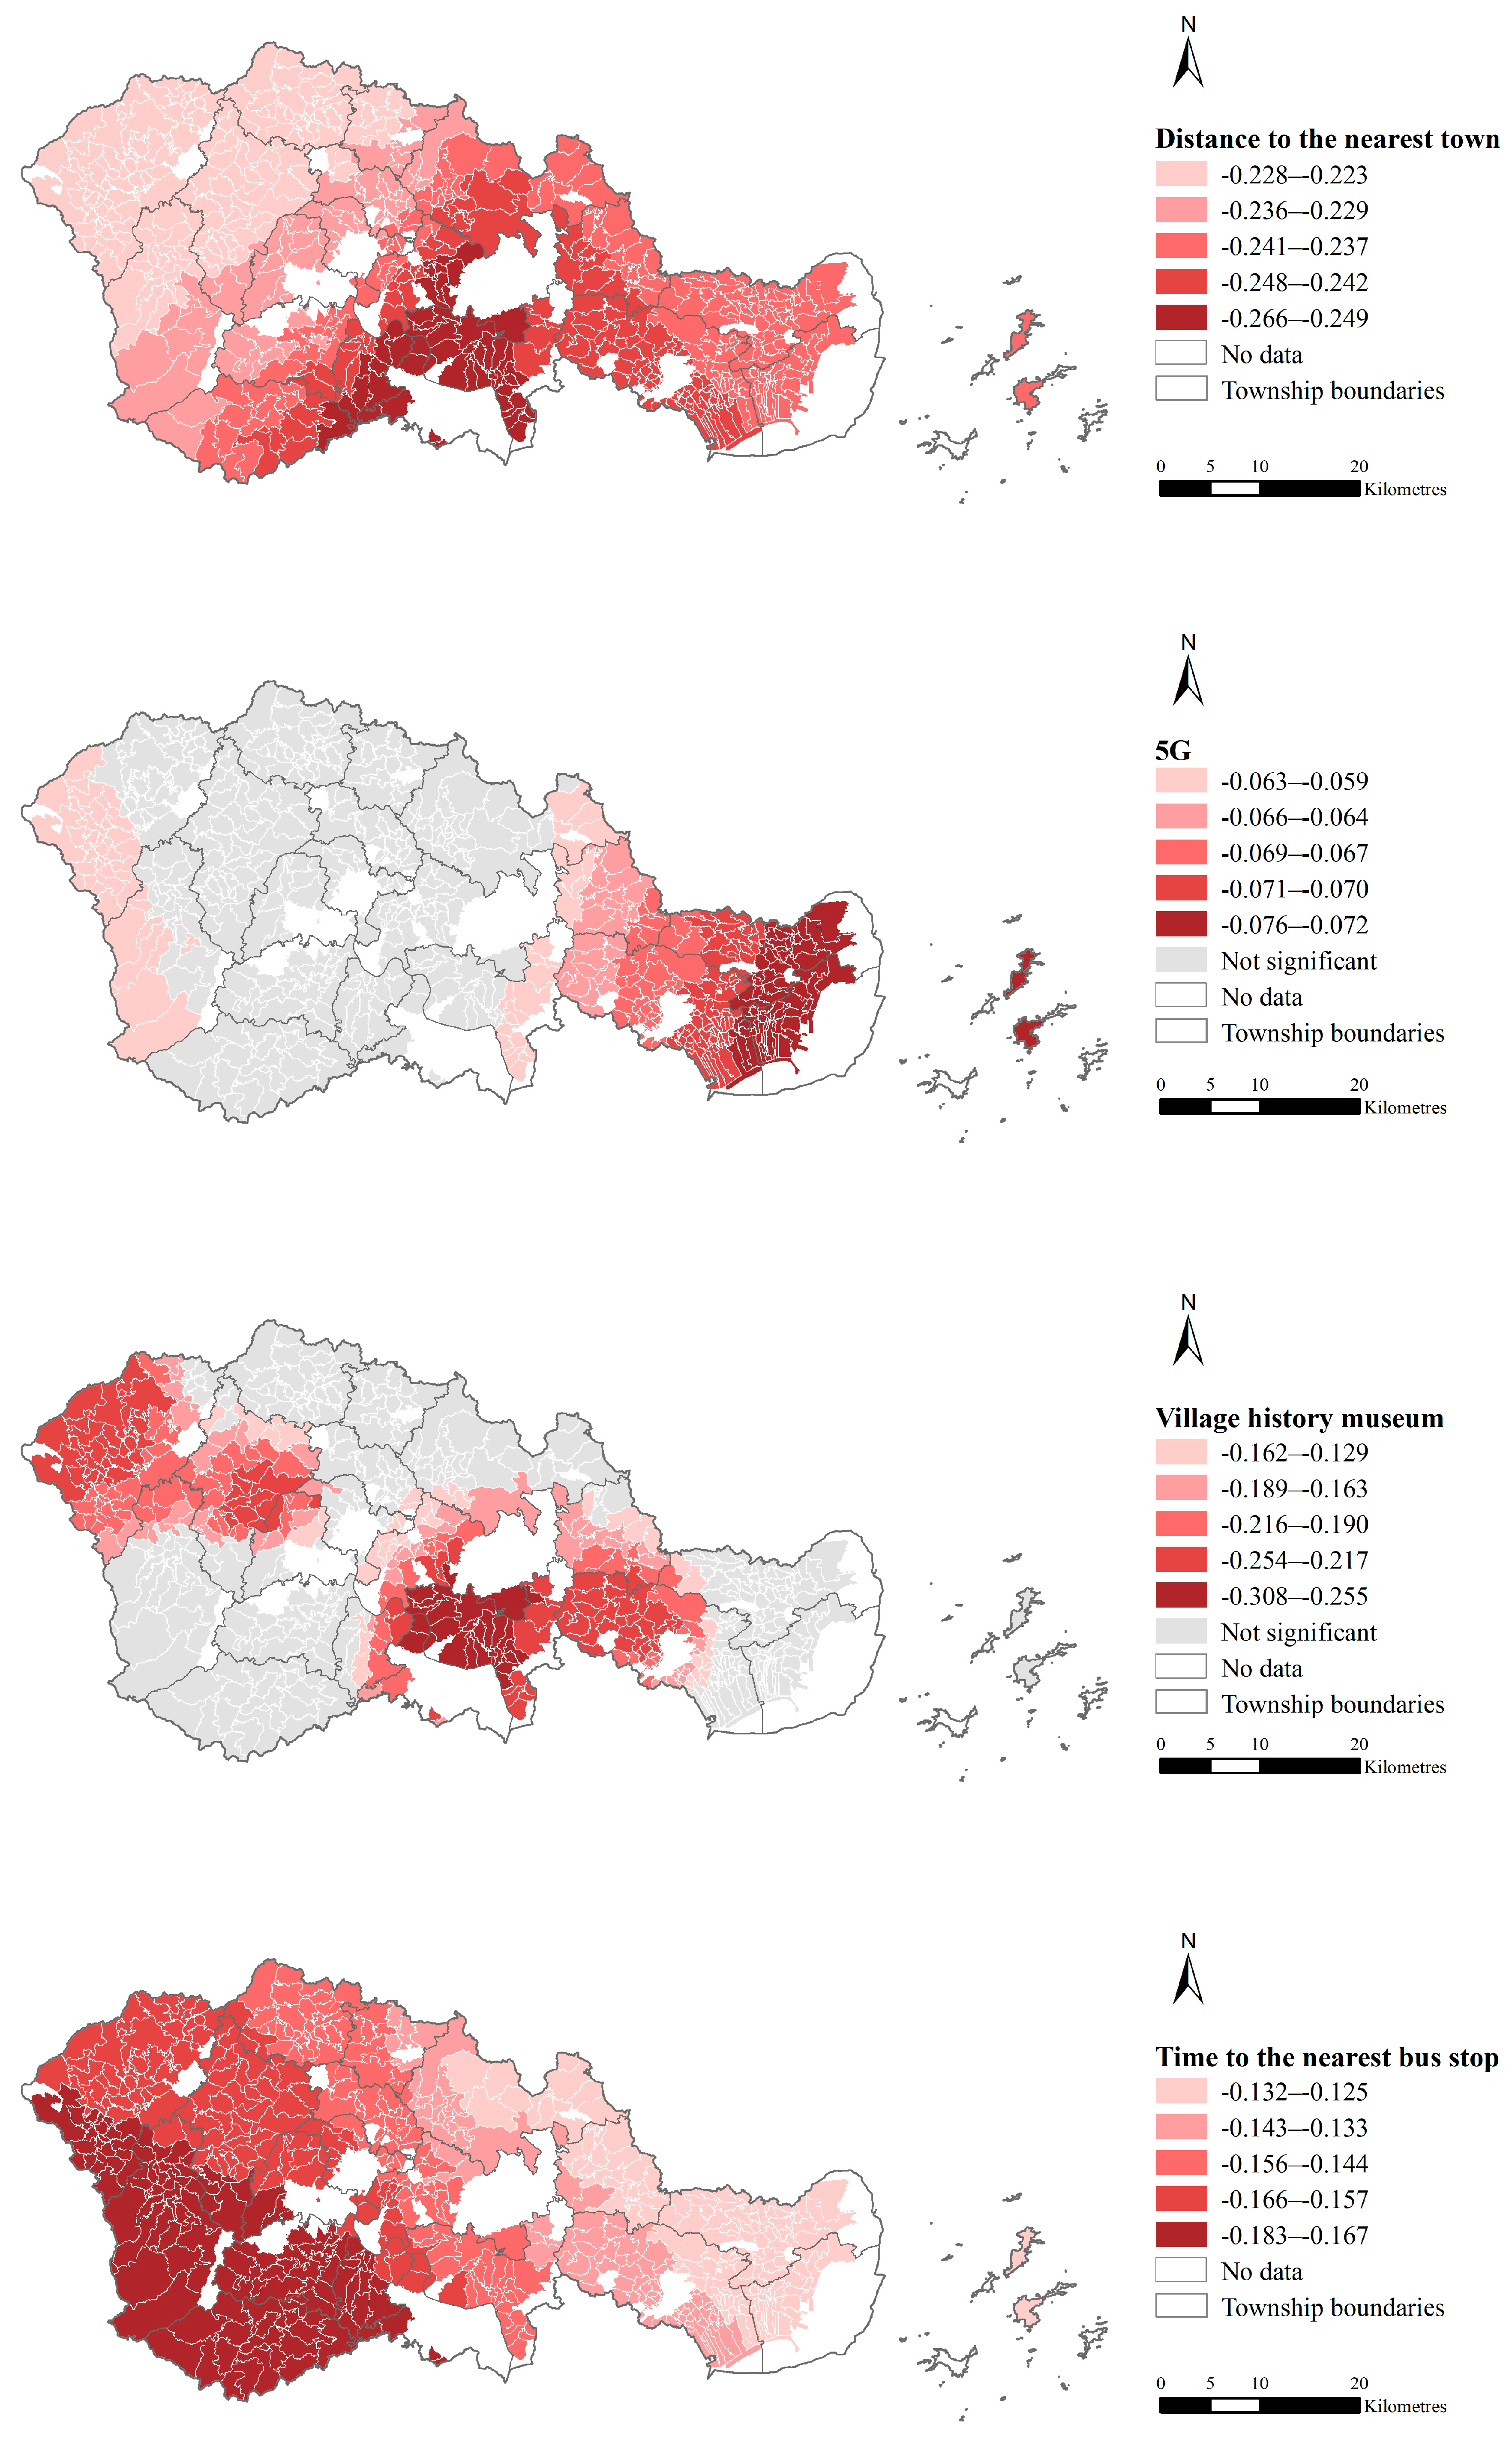
To mitigate global multicollinearity among the factors and reduce the risk of model overfitting, we first employed ordinary least squares (OLS) regression analysis for each factor and calculated the variance inflation factor (VIF) for each coefficient. The VIF values for all coefficients were below 4, indicating only minor multicollinearity that did not affect the model-fitting performance. However, the probability p-values for altitude, the number of natural villages with fiber-optic connectivity, whether the village is a “One Village, Ten Thousand Trees” demonstration village, the number of annual village representative meetings held within the village, the distance from the village to the nearest major transportation artery, and road network density did not pass the significance test. After removing redundant variables, eight influencing factor indicators were selected, including slope (Table 4). Among these, the spatial marginalization dimension includes slope, distance to the nearest town center, and distance to the coastal city; the technological marginalization dimension is represented by whether the village is covered by 5G signals; the policy marginalization dimension is reflected by whether the village is a provincial or municipal-level “Beautiful Rural Village”; the social marginalization dimension includes the village history museum and the level of the outstanding Party branch; and the infrastructure marginalization dimension is measured by the time it takes for most villagers to walk to the nearest bus station (Figure 5).
The spatial autocorrelation of geospatial elements reflects the changes in their spatial distributions. When the independent variable exhibits spatial heterogeneity, applying a global OLS regression model may lead to bias. Additionally, the spatial heterogeneity of the explanatory factor attribute values is the foundation for understanding spatial variations in the relationship between these factors and rural development levels. Therefore, spatial autocorrelation tests must be conducted to demonstrate that the explanatory factors exhibit clustering characteristics (Figure 5), thereby indicating the applicability and feasibility of using a GWR model for analysis in this region.

4.3. Model Comparison and Optimization

The screened impact factors were analyzed sequentially in the MGWR and classical GWR models to obtain diagnostic results (Table 5). The spatial kernel function for the model is selected as Adaptive Bisquare. A comparative analysis of the indicators indicates that the MGWR model exhibits significant applicability and robustness. In terms of the coefficient of determination R2 and adjusted R2, compared with the explanatory power of 0.452 for the OLS model, the MGWR model improved by 0.057 to achieve a fitting level of 0.509. Additionally, the AICc index of the MGWR model is 1270.03, which is 26.383 and 27.68 lower than those of the OLS and classic GWR models, respectively. Compared with the OLS model’s residual sum of squares exceeding 300, the MGWR model reduces it to 261.258. The MGWR model addresses the limitations of global regression and classical GWR by considering the optimal bandwidths across different spatial scales in the regression analysis, thereby yielding model results with smaller local errors and greater robustness. Specifically, it is important to allow different explanatory variables to have different bandwidths, as the relationship between explanatory and dependent variables may play a role at different spatial scales. Matching the bandwidth of each explanatory variable with its spatial scale enables MGWR to more accurately estimate the coefficients of the local regression model.
Compared to the classic GWR model (where all variables use a uniform fixed bandwidth of 573), the MGWR model allows each variable to have its optimal bandwidth, ranging from [158, 573] (Table 6). This result indicates that by introducing variable-specific bandwidths, the MGWR model effectively reveals significant spatial non-stationarity and scale differences in the effects of various influencing factors on rural development levels. Bandwidth size reflects the spatial scope of a variable’s influence: a larger bandwidth indicates a more global effect, while a smaller bandwidth signifies a more localized impact, meaning its influence varies more dramatically with geographic location. For example, the “village history museum” variable exhibits the smallest bandwidth (158), indicating that this factor exerts a strongly spatially heterogeneous influence on rural development levels. The multiscale effect analysis results further confirm that the influencing mechanism of rural development levels in Linhai City is not a single homogeneous process, but rather a complex system composed of factors operating at different scales.

4.4. Regression Coefficient Spatial Pattern Analysis

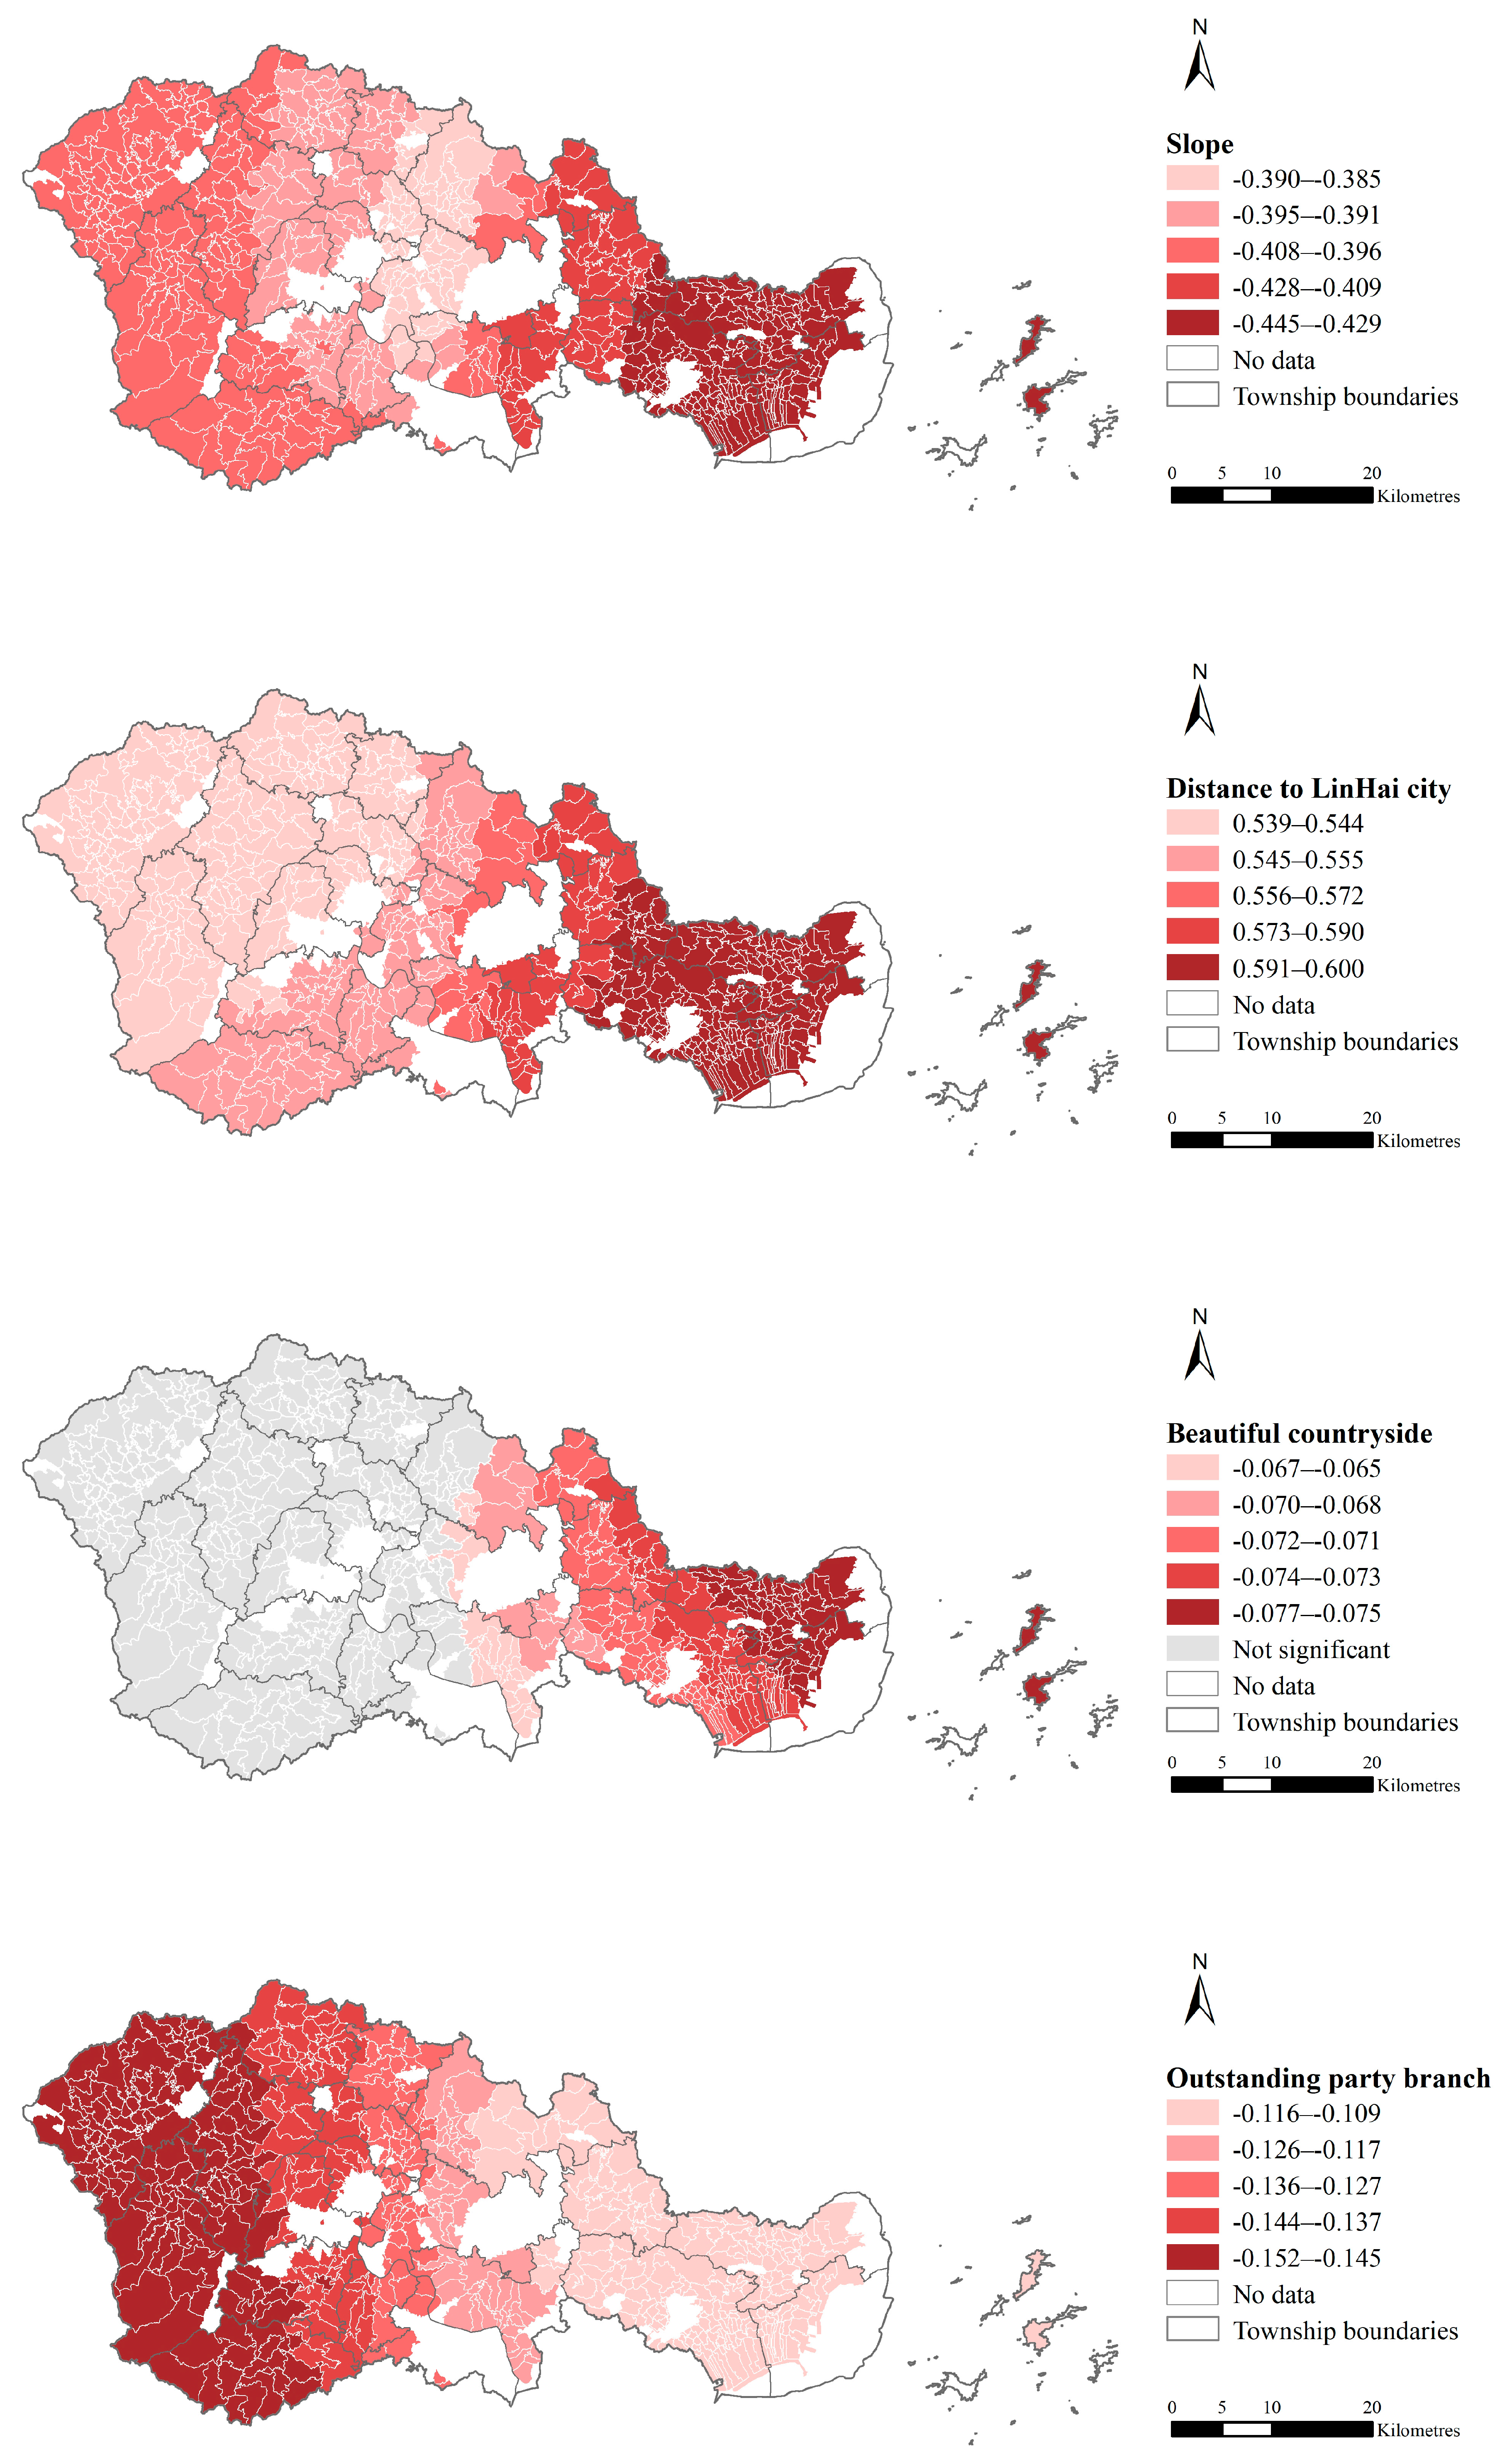
This study summarizes and statistically analyzes the coefficients of influencing factors in the MGWR regression model and visualizes their spatial distribution (Figure 6), intuitively reflecting the spatial heterogeneity of the degree of influence of each marginalization factor on the spatial differentiation of rural development levels. The following is a detailed analysis of the five types of factors influencing marginalization.

4.4.1. The Impact of Spatial Marginalization on Rural Development Levels

The impact of spatial marginalization on rural development levels primarily considers three factors: slope, distance from the nearest town center, and distance from Linhai City. The slope has a negative effect on rural development levels across the entire region, meaning that the higher the average slope within a village, the lower the rural development level. Observation of the spatial variation in the absolute values of the regression coefficients revealed that they increase gradually from the central urban area of Linhai City to the east and west, indicating that the influence of the slope on the central urban area, western regions, and eastern coastal regions increases in that order. The primary reasons for this are as follows. First, the terrain around the central urban area is relatively flat; therefore, rural development is less affected by slope. Second, while the eastern coastal region generally has a lower overall slope, the local microtopography exhibits slope variation, leading to enhanced slope sensitivity. In contrast, the western region generally has a higher slope, and most rural development has long been constrained by the terrain, resulting in diminishing marginal effects.
In terms of distance from the nearest town center, the regression coefficients within the study area were all negative, indicating that the development level of all rural areas in the study area decreases as the distance from the town center increases. From the perspective of spatial differentiation patterns, the negative impact of distance from the town center is smallest in the northwest, followed by the east, and has the greatest impact on the central southern region. Based on field research, this is attributed to the higher elevation and complex terrain in the northwest, resulting in lower overall development levels of villages; weaker service, market, and technology diffusion capabilities of township centers; and reduced importance of distance factors. In contrast, the eastern region has flat terrain, well-developed transportation networks, and a broader radiation range for township centers. Additionally, villages can access resources through convenient transportation, thereby mitigating the negative effects of distance. The central region is in a transitional terrain zone with poor transportation conditions. The radiation range of the township center is fragmented by the terrain, leading to a higher distance sensitivity.
In terms of distance from Linhai City, its impact on the level of rural development also exhibits significant spatial heterogeneity, with all regression coefficients being positive, indicating that villages farther from the city center have higher levels of development. The spatial variation in the absolute values of the regression coefficients increases gradually from west to east, indicating that the influence of distance on the study area increases progressively from west to east. The positive correlation of the overall regression coefficient may be related to the “siphon effect” of the city center on rural areas. According to the “push-pull” theory, population migration is triggered by the pulling force of inflow areas and the pushing force of outflow areas: the rural population of Linhai is attracted by the relatively higher income level and better living conditions of the urban area, with the flow of population from rural to urban areas, the development of central urban areas has been promoted while rural areas have experienced accelerated decline. The possible reason why the regression coefficient gradually increases from west to east is that the “siphon effect” will be influenced by factors such as terrain, topography, and transportation accessibility. The western region of Linhai City is mostly mountainous with undulating terrain and relatively inconvenient transportation. In addition, it is close to Ningbo City in a straight line, and the trend of population migration to Ningbo City is more significant. Therefore, the “siphon effect” of the central urban area has a relatively weak impact on the western region and a relatively small impact on the level of rural development. Compared to other regions, the eastern part of Linhai City has a relatively flat terrain and high accessibility to transportation, making it more susceptible to the “siphon effect” of the central urban area. Besides, the easternmost areas are close to the coastal economic belt and benefit from the dividends of an outward-oriented economy. Therefore, the closer they are to the ocean (away from the central urban area), the higher their levels of development. In summary, the analysis indicates that the development of village-level administrative units is primarily influenced by their direct superior township governments, whereas the macro-regulatory effects at the municipal level are relatively limited.

4.4.2. The Impact of Technological Marginalization on Rural Development Levels

The impact of technological marginalization on rural development levels primarily considers the coverage of 5G mobile network signals. From a global perspective, 46.34% of rural areas passed the significance test, and the regression coefficients were all negative, indicating that rural areas with 5G signal coverage have higher development levels. Specifically, rural development disparities in the central regions are almost unaffected by 5G signal coverage, whereas western rural areas are less affected than the eastern regions. Analyzing the causes of this phenomenon considering the actual conditions in Linhai City, rural areas surrounding the city center generally have higher development levels, with relatively well-developed infrastructure and digital services, making 5G a supplementary technology with low marginal benefits, which resulted in the rural areas in the central part of Linhai city failing to pass the significance test. In western regions, the complex terrain makes 5G base station construction challenging, resulting in fewer rural areas with 5G signal coverage compared with other regions, making it difficult to support high-value-added applications. Additionally, rural development in the western regions relies primarily on the primary sector, and 5G application scenarios remain in the exploratory phase, which explains why the regression coefficients of 5G signal in western regions were relatively low. The eastern regions have flat terrain and highly scaled industries, enabling 5G technology to rapidly enhance production efficiency. However, eastern regions have lower population outflow rates and higher retention rates for young and middle-aged populations, providing a human capital foundation for digital technology applications and better leveraging the advantages of 5G technology.

4.4.3. The Impact of Policy Marginalization on Rural Development Levels

The impact of policy marginalization on rural development levels is primarily reflected through provincial- and municipal-level “Beautiful Rural Village” model village indicators. The results reveal that significant samples are primarily concentrated in central and eastern regions, with all regression coefficients being negative, which indicates that rural areas selected as provincial- and municipal-level “Beautiful Rural Villages” have significantly higher development levels than non-selected rural areas, demonstrating a clear positive correlation between policy labels and rural development. The absolute values of the regression coefficients for significant sample points increase gradually from west to east, indicating that the policy benefits of the “Beautiful Rural Villages” initiative have a weaker effect in central regions but a more pronounced promotional effect on eastern coastal regions. This may be because the central region, being close to urban areas, experiences a severe outflow of young and middle-aged labor, with the remaining population having low participation in new industries, such as rural tourism and homestays, making it difficult for the brand effect of beautiful villages to be converted into actual benefits. In contrast, the eastern region has a stronger economic foundation, and policy support can promote the development of tourism routes and other infrastructure, fostering the extension of industrial chains and forming a virtuous cycle of “supporting facilities-industry-population”, with a prominent positive feedback mechanism.

4.4.4. The Impact of Social Marginalization on Rural Development Levels

The impact of social marginalization on rural development levels is primarily reflected in two indicators: the status of village history museum construction, and the rating of outstanding Party branches. The results reveal that the bandwidth of the village history museum indicator is 158, with significant spatial heterogeneity. The significant samples are primarily distributed in the northwestern and central-southern regions, with all regression coefficients being negative. This indicates that rural areas with village history museums have higher overall development levels and that the construction of village history museums is significantly positively correlated with rural development. Samples from the “southwest-eastern coastal-northern” regions did not pass the significance test, indicating that the promotional effect of village history museums on development in these areas is relatively weak. Rural development in the eastern regions relies more on locational advantages and industrial foundations, and village history museums, as cultural facilities, have a relatively weak direct stimulatory effect on the economy. The southwestern and northern regions have higher elevations that are constrained by terrain, poor transportation, and population outflow, making it difficult to develop cultural resources effectively. The promotional effect of village history museums on development is “diluted” by natural conditions.
In the analysis, the rating criteria for outstanding Party branches were categorized from “1” to “4”, representing “provincial-level”, “municipal-level”, “county-level”, and “township-level” outstanding Party branches, respectively. The regression coefficients were all negative across the entire study area, indicating that the higher the level of excellence of the Party branch, the higher the level of rural development. From a spatial perspective, the absolute values of the regression coefficients increase from east to west, indicating that the impact of outstanding Party branch ratings on the western region is greater than that on the eastern region. This may be because the western regions are constrained by terrain and transportation accessibility, making Party branches play a key role in resource integration. The higher governance capabilities of Party branches help to enhance villagers’ cohesion, thereby promoting rural development. In contrast, the eastern regions have stronger population mobility and contractual social relationships, with development being more reliant on market mechanisms.

4.4.5. The Impact of Infrastructure Marginalization on Rural Development Levels

The impact of infrastructure marginalization on rural development is primarily reflected by the average walking time for most villagers to reach the nearest bus station. The results reveal that the regression coefficients are all negative across the study area, indicating that the poorer the accessibility of bus stations, the lower the level of rural development. From the perspective of spatial differentiation patterns, the absolute values of the regression coefficients decrease gradually from southwest to northeast. This indicates that the marginal improvement effect of bus-stop accessibility on rural development levels is strongest in the southwest region and weakens progressively toward the northeast. This may be owing to the high degree of terrain fragmentation in the southwest region, where improving bus stop accessibility can break through geographical isolation, trigger a “shortboard filling” effect, and significantly enhance villagers’ ability to access public services such as education and healthcare. In contrast, the northeastern region has a relatively well-developed transportation infrastructure, and the diversification of transportation modes has weakened the critical role of walking accessibility, resulting in limited marginal benefits from further optimization.

5. Discussion

5.1. Multidimensional Marginalization Effects and Recommendations Based on Empirical Evidence from Linhai City

This study innovatively analyzes the connotations of rural marginalization, deconstructing it into five dimensions: spatial, technological, policy, social, and infrastructure. Based on this, a quantifiable system of influencing factors was constructed and the MGWR model was used to reveal the mechanisms by which each dimension affects the level of rural development. An empirical analysis of Linhai City demonstrates that the impact of marginalization in each dimension exhibits significant spatial heterogeneity. The impact of different dimensions of marginalization on rural development level presents a differentiated “core-periphery” structure.
In the spatial marginalization dimension, the negative effects of slope and distance from the town center on the overall rural development level of the study area indicate the universality of geographical constraints. In contrast, the positive effects of distance from the Linhai City indicator suggest that rural development relies more on proximity to town centers than on distant urban centers. In the technological marginalization dimension, 5G signal coverage had a significant positive impact on only 46.34% of rural areas, particularly in the eastern coastal regions, indicating that technological empowerment must align with industrial foundations and human capital. In the policy marginalization dimension, the beautiful rural area indicator only exhibits a positive effect in the eastern regions, which may be owing to population outflow in the central and western regions, leading to reduced effectiveness of policy support, revealing potential institutional waste caused by population loss. In the social marginalization dimension, the village history museum indicator is effective in the northwestern and central-southern regions, while the grassroots party organization effectiveness indicator is significantly effective across all regions and has a greater impact in the western mountainous areas, reflecting that high-level governance capabilities can effectively compensate for geographical disadvantages. In the infrastructure marginalization dimension, the strong negative effect of public transportation accessibility on high-altitude regions in the southwestern region reveals the amplifying effect of facility shortages in regions with natural resource disadvantages.
Through an analysis of the effects of marginalization across various dimensions on rural development levels, this study proposes the following recommendations for enhancing the sustainable development capacity of rural areas in Linhai City: (1) Spatial equity: Considering the high altitude and fragmented terrain characteristics of western Linhai, efforts should be made to strengthen transportation infrastructure construction to overcome the “lock-in effect” of geographical isolation. The extension of dual-lane highways and the densification of public transportation stops should be prioritized, guiding scattered villages to cluster around transportation nodes to enhance the connectivity between remote rural areas and town centers. (2) Technological Inclusion: In eastern coastal areas, the application of “5G + AI” technology should be promoted to empower agricultural production, such as the use of drones for irrigation in broccoli bases. Low-cost digital solutions should be explored in the western mountainous regions to narrow the digital divide and ensure emergency communication and telemedicine services. (3) Policy Precision: The selection mechanism for model villages should be optimized in the Beautiful Rural Areas initiative to avoid the “Matthew effect” of policy implementation. Implementing differentiated support for western regions should be considered, such as guiding industrial transfer through the “flying land economy” to reduce population outflow trends, thereby better leveraging the positive effects of policy support and avoiding further exacerbations of regional disparities. (4) Social Empowerment: Strengthening grassroots Party organization construction and establishing a villager point system linking public affairs participation to collective profit sharing should be considered. Community identity should be enhanced through cultural facilities such as village history museums to activate endogenous development momentum. Promoting the integrated model of “village history museums + intangible cultural heritage workshops” in northwestern and central-southern regions should be considered to enhance the endogenous driving force of social capital. (5) Facility Balance: The improvement of public transportation and education/medical facilities in southwestern regions should be promoted, the density of public transportation and medical service points should be appropriately increased, and development potential should be released through “addressing shortcomings”; in northeastern regions, promoting diversified transportation modes and developing a diversified transportation network combining “customized shuttle buses + shared electric vehicles” should be considered.

5.2. Reflections on the Relationship Between Marginalization and Rural Development and Its Policy Implications

Based on the empirical analysis presented above, it can be concluded that the interactive relationship between the degree of rural marginalization and the level of rural development is influenced by a combination of factors, including marginalization evaluation criteria, geographical location, resource endowments, and stage of development. Thus, the relationship between marginalization and rural development is not a simple linear relationship. To some extent, this improves and refines the viewpoints of existing studies that rural marginalization inevitably leads to a systemic decline in rural areas. Rural areas in different geographical locations may exhibit entirely different development paths when faced with the same infrastructure marginalization issues, and technological marginalization or bottlenecks will also have significantly different impacts or inhibitory effects on rural areas at different stages of development.
This suggests that in the process of formulating rural development policies and advancing rural revitalization strategies, regions should develop in a manner tailored to their own resource endowments and external conditions, avoiding a one-size-fits-all approach. Economically developed regions should focus on enhancing the application of advanced science and technology in rural areas. However, less developed regions should prioritize overcoming spatial and infrastructure bottlenecks to lay the groundwork for future technological dissemination. Furthermore, policymakers must conduct comprehensive cost-benefit analyses during policy implementation to prevent excessive resource waste. Specifically, for different types of villages, rural areas near urban suburbs should prioritize addressing social marginalization issues, strengthen villagers’ participation mechanisms [50,51], explore leveraging their locational and resource advantages to develop a “weekend economy”, and capitalize on the development dividends from the two-way flow of urban–rural elements. Rural areas in remote mountainous regions generally face issues of geographical isolation and population loss. Therefore, it is necessary to prioritize addressing spatial and infrastructure marginalization. Infrastructure construction can be used as a policy lever to cultivate mountainous specialty industries, develop forest-based economies, and explore ecological compensation transfer payments [52]. Rural areas in plains with abundant arable land resources and a solid agricultural foundation should prioritize addressing the issues of technological marginalization by promoting smart agriculture technologies and developing value-added agricultural product processing industries to enhance rural development levels. Rural areas rich in traditional cultural resources should focus on addressing issues of policy and social marginalization, exploring the development of cultural IP based on various tangible or intangible cultural heritage assets, seeking protective development policies at the government level, and establishing a relatively stable tourism development model.

5.3. Limitations and Future Prospects

The following shortcomings remain: (1) Data timeliness: Cross-sectional data cannot capture the dynamic evolution of marginalization, and continuous time-series data need to be supplemented for future analysis. (2) Limited dimensional coverage: Potential dimensions, such as ecological and institutional marginalization, were not included in the model, which may affect the comprehensiveness of the mechanism explanation. (3) Regional specificity: The applicability of these conclusions to underdeveloped regions or different cultural contexts requires further verification.
Future research could be expanded in the following areas: (1) Incorporating multitemporal data, combining remote sensing with village-level panel data, to simulate the cumulative effects of marginalization. (2) Expanding the dimensional framework: introducing new dimensions such as “digital participation” and “villagers’ subjective perception of marginalization” to construct a more refined and comprehensive measurement system for marginalization. (3) Cross-regional comparative studies: conducting comparative analyses of marginalization mechanisms across regions with different levels of economic development to identify universal patterns.

6. Conclusions

This study innovatively defined the concept of rural marginalization and constructed an evaluation system for rural marginalization from five dimensions: space, technology, policy, society, and infrastructure. In addition, we also constructed an evaluation index for rural development level from two dimensions: basic and enhancing elements of rural development. This study used 574 rural villages in Linhai City, Zhejiang Province as empirical subjects. It carefully analyzed the spatial differentiation pattern of rural development levels in the region from two aspects: basic and enhancing elements of rural development. The MGWR model revealed the spatial heterogeneity and underlying mechanisms of the factors influencing rural development levels in the study area from five marginalization dimensions.
The following conclusions were drawn. The rural development levels in Linhai City exhibit significant global spatial autocorrelation, with a pronounced clustering pattern. “High-high” clustering is primarily concentrated in the central urban area and southeastern coastal regions of Linhai City, while “low-low” clustering is primarily found in the western regions. This indicates that rural development levels are relatively high in the areas surrounding the central urban area and southeastern coastal regions of Linhai City, whereas rural development levels in the western regions are generally lower. In terms of model fit, the MGWR model accounts for the optimal bandwidth at different spatial scales, thus addressing the limitations of the OLS and classical GWR models. It measures the extent of the influence and spatial variability of variables on rural development levels, demonstrating stronger explanatory power for Linhai City’s rural development levels. From the perspective of the effects of marginalization dimensions, the differentiation in rural development levels in Linhai City is the result of the interactive effects of multiple dimensions, including “spatial-technological-policy-social-infrastructure.” In spatial marginalization, slope and distance from the nearest town center have a negative impact on rural development levels, whereas distance from Linhai City has a positive impact. Regarding technological marginalization, 5G signal coverage has a positive impact only on most western rural areas and eastern regions. In terms of policy marginalization, the “Beautiful Rural Areas” indicator has a positive impact only on the eastern region. In terms of social marginalization, the “Village History Museum” indicator has a positive impact only on the northwestern and central-southern regions, whereas the “Excellent Party Branch” rating has a positive impact on all rural areas in the study region. In terms of infrastructure marginalization, the time it takes for most villagers to walk to a bus stop has a negative impact, which is particularly evident in southwestern high-altitude regions. The above conclusions provide important decision-making basis for formulating rural development policies, and inspire us to develop differentiated rural revitalization strategies based on the internal and external conditions such as geographical location, resource endowment, and economic and social foundation of different rural areas.

Author Contributions

Conceptualization, Z.H. and C.K.; Methodology, Z.H.; Formal analysis, Z.H.; Investigation, Z.H. and Z.Z.; Data curation, Z.H., X.F., C.K. and Y.L.; Writing—original draft, Z.H., X.F. and C.K.; Writing—review & editing, Z.H., X.F., J.W., Z.Z. and Y.L.; Visualization, Y.L.; Supervision, J.W. and Z.Z.; Project administration, J.W. and Z.Z. All authors have read and agreed to the published version of the manuscript.

Funding

This research was funded by the National Natural Science Foundation of China (Grant No. 42201233).

Data Availability Statement

The data used in this study is provided by other institutions, and not publicly available due to privacy and security restrictions. We can only share data with the consent of the data provider.

Conflicts of Interest

The authors declare no conflict of interest.

References

  1. Zhuo, R.; Xu, X.; Zhou, Y.; Guo, X. Spatiotemporal Evolution Patterns and Influencing Factors of Rural Shrinkage Under Rapid Urbanization: A Case Study of Zhejiang Province, China. Land 2024, 13, 2137. [Google Scholar] [CrossRef]
  2. Li, D.; Wen, Q.; Qi, Y.; Zhang, P. Trade-off and Synergy of Rural Functions Under County Depopulation in the Typical Black Soil Region of Northeast China. Chin. Geogr. Sci. 2023, 33, 616–633. [Google Scholar] [CrossRef]
  3. Hu, Z.; Li, Y.; Long, H.; Kang, C. The evolution of China’s rural depopulation pattern and its influencing factors from 2000 to 2020. Appl. Geogr. 2023, 159, 103089. [Google Scholar] [CrossRef]
  4. Wirth, P.; Elis, V.; Müller, B.; Yamamoto, K. Peripheralisation of small towns in Germany and Japan—Dealing with economic decline and population loss. J. Rural Stud. 2016, 47, 62–75. [Google Scholar] [CrossRef]
  5. Li, T.; Chen, P.; Kong, X.; Sánchez-Aguilera, D. Multiple marginalizations: Understanding rural restructuring around metropolitan development zone—A case study from Pengdu Village, Shanghai. J. Rural Stud. 2025, 117, 103645. [Google Scholar] [CrossRef]
  6. Cloke, P.; Goodwin, M.; Milbourne, P.; Thomas, C. Deprivation, poverty and marginalization in rural lifestyles in England and Wales. J. Rural Stud. 1995, 11, 351–365. [Google Scholar] [CrossRef]
  7. Mammen, S.; Sano, Y. Gaining Access to Economically Marginalized Rural Populations: Lessons Learned from Nonprobability Sampling. Rural Sociol. 2012, 77, 462–482. [Google Scholar] [CrossRef]
  8. Lichter, D.T.; Brown, D.L.; Parisi, D. The rural–urban interface: Rural and small town growth at the metropolitan fringe. Popul. Space Place 2021, 27, e2415. [Google Scholar] [CrossRef]
  9. Keung Wong, D.F.; Li, C.Y.; Song, H.X. Rural migrant workers in urban China: Living a marginalised life. Int. J. Soc. Welf. 2007, 16, 32–40. [Google Scholar] [CrossRef]
  10. Kuitenbrouwer, J. On the Concept and Process of Marginalization; Erasmus University Rotterdam: Rotterdam, The Netherlands, 1973; Article 37.1. [Google Scholar]
  11. Pelc, S. Drivers of Marginalization from Different Perspectives. In Nature, Tourism and Ethnicity as Drivers of (De)Marginalization: Insights to Marginality from Perspective of Sustainability and Development; Pelc, S., Koderman, M., Eds.; Springer International Publishing: Cham, Switzerland, 2018; pp. 3–27. [Google Scholar]
  12. Šiljeg, S.; Šiljeg, A.; Glamuzina, N. Quantitative Analysis of Marginalization Indicators—Example of the Peljesac Peninsula, Croatia. Acta Geogr. Slov. 2016, 56, 235–245. [Google Scholar] [CrossRef]
  13. Dwivedi, O.P.; Khator, R.; Nef, J. (Eds.) Marginalization and Exclusion. In Managing Development in a Global Context; Palgrave Macmillan: London, UK, 2007; pp. 62–79. [Google Scholar]
  14. Pelc, S. Marginality and Marginalization. In Societies, Social Inequalities and Marginalization: Marginal Regions in the 21st Century; Chand, R., Nel, E., Pelc, S., Eds.; Springer International Publishing: Cham, Switzerland, 2017; pp. 13–28. [Google Scholar]
  15. Dragan, A.; Crețan, R.; Lungu, M.A. Neglected and Peripheral Spaces: Challenges of Socioeconomic Marginalization in a South Carpathian Area. Land 2024, 13, 1086. [Google Scholar] [CrossRef]
  16. Kousis, M. Ecological Marginalization in Rural Areas: Actors, Impacts, Responses. Sociol. Rural. 1998, 38, 86–108. [Google Scholar] [CrossRef]
  17. Salemink, K. Digital Margins: How Spatially and Socially Marginalized Communities Deal with Digital Exclusion; Rijksuniversiteit Groningen: Groningen, The Netherlands, 2016. [Google Scholar]
  18. Hu, X.; Li, H.; Zhang, X.; Chen, X.; Yuan, Y. Multi-dimensionality and the totality of rural spatial restructuring from the perspective of the rural space system: A case study of traditional villages in the ancient Huizhou region, China. Habitat Int. 2019, 94, 102062. [Google Scholar] [CrossRef]
  19. Loubere, N. Development on Loan: Microcredit and Marginalisation in Rural China; Amsterdam University Press: Amsterdam, The Netherlands, 2019. [Google Scholar]
  20. Kudo, S.; Yarime, M. Divergence of the sustaining and marginalizing communities in the process of rural aging: A case study of Yurihonjo-shi, Akita, Japan. Sustain. Sci. 2013, 8, 491–513. [Google Scholar] [CrossRef]
  21. Eikeland, S.; Riabova, L. Transition in a Cold Climate: Management Regimes and Rural Marginalisation in Northwest Russia. Sociol. Rural. 2002, 42, 250–266. [Google Scholar] [CrossRef]
  22. Lombardi, M.; Lopolito, A.; Andriano, A.M.; Prosperi, M.; Stasi, A.; Iannuzzi, E. Network Impact of Social Innovation Initiatives in Marginalised Rural Communities. Soc. Netw. 2020, 63, 11–20. [Google Scholar] [CrossRef]
  23. Ye, C.; Ma, X.; Chen, R.; Cai, Y. Marginalised countryside in a globalised city: Production of rural space of Wujing Township in Shanghai, China. Int. Dev. Plan. Rev. 2019, 41, 311–328. [Google Scholar] [CrossRef]
  24. Reid, J.-A. Rural education practice and policy in marginalised communities: Teaching and learning on the edge. Aust. Int. J. Rural Educ. 2020, 27, 88–103. [Google Scholar] [CrossRef]
  25. Bock, B.B. Rural Marginalisation and the Role of Social Innovation; A Turn Towards Nexogenous Development and Rural Reconnection. Sociol. Rural. 2016, 56, 552–573. [Google Scholar] [CrossRef]
  26. Salemink, K.; Strijker, D.; Bosworth, G. Rural development in the digital age: A systematic literature review on unequal ICT availability, adoption, and use in rural areas. J. Rural. Stud. 2017, 54, 360–371. [Google Scholar] [CrossRef]
  27. Stull, V.; Bell, M.M.; Ncwadi, M. Environmental apartheid: Eco-health and rural marginalization in South Africa. J. Rural Stud. 2016, 47, 369–380. [Google Scholar] [CrossRef]
  28. Liu, Y.; Liu, Y.; Zhai, R. Geographical research and optimizing practice of rural hollowing in China. Acta Geogr. Sin. 2009, 64, 1193–1202. [Google Scholar]
  29. Yang, R.; Liu, Y.; Chen, Y. Comprehensive measure and partition of rural hollowing in China. Geogr. Res. 2012, 31, 1697–1706. [Google Scholar]
  30. Li, W. Realistic representation, multiple hidden dangers and governance path of rural hollowing. Agric. Econ. 2025, 2, 54–57. [Google Scholar]
  31. Yang, S.; Qi, P. Rural population hollowing: Multi-dimensional connotation, potential risks and governance strategies. Dong Yue Trib. 2025, 46, 139–148. [Google Scholar]
  32. Li, T.; Long, H.; Wang, Y. Analysis of idleness of rural residential land and its causes in China. China Land Sci. 2019, 33, 64–71. [Google Scholar]
  33. Zheng, D.; Wen, Q.; Wang, Y.; Mi, H. Differentiation mechanism and reconstruction strategy of rural population hollowing in China. Econ. Geogr. 2019, 39, 161–168. [Google Scholar]
  34. Deng, S. Analysis of rural decline under the background of urbanization: Based on the reflection of Q natural village. Soc. Sci. Rev. 2020, 35, 41–43. [Google Scholar]
  35. He, Q.; Zha, Y. Patch-scale measurement based spatial identification and driving mechanism of population shrinkage in rural areas within counties in China. J. Huazhong Agric. Univ. 2024, 43, 39–52. [Google Scholar]
  36. She, L.; Qiu, Y. The spatiotemporal pattern and influencing factors of Shandong province county rural shrinkage. Chin. J. Agric. Resour. Reg. Plan. 2024, 45, 207–220. [Google Scholar]
  37. Liu, H.; Zhang, M.; Wang, Y.; Xu, Y.; Dai, D. Types of shrinking villages and flexible planning strategies in the Jianghan Plain region: Based on an investigation of 606 villages in Xiantao City. Resour. Sci. 2024, 46, 407–420. [Google Scholar]
  38. Jiao, L.; Zhang, M. Vacant mechanism and smart shrinkage strategies for shrinking village: Based on field studies in rural areas of eastern Henan. Econ. Geogr. 2021, 41, 221–232. [Google Scholar]
  39. Zhang, Q.; Cao, Z.; Liu, Y. Assessing rural revitalization potential through rural transformation degree and sustainability: A quantitative study of 460 case villages in Lingbao, China. Habitat Int. 2024, 153, 10. [Google Scholar] [CrossRef]
  40. Long, H.; Tu, S. Rural restructuring: Theory, approach and research prospect. Acta Geogr. Sin. 2017, 72, 563–576. [Google Scholar]
  41. Li, T.; Long, H. Analysis of rural transformation development from the viewpoint of “population-land-industry”: The case of Shandong province. Econ. Geogr. 2015, 35, 149–155. [Google Scholar]
  42. Long, H.; Zhang, Y.; Tu, S. Land consolidation and rural vitalization. Acta Geogr. Sin. 2018, 73, 1837–1849. [Google Scholar]
  43. Markuszewska, I. Rural area marginalisation: Searching for tendencies. Case study: The Western fringes of Poland. Bull. Geogr. Socio-Econ. Ser. 2015, 29, 75–91. [Google Scholar] [CrossRef]
  44. Haenssgen, M.J. The struggle for digital inclusion: Phones, healthcare, and marginalisation in rural India. World Dev. 2018, 104, 358–374. [Google Scholar] [CrossRef]
  45. Slee, B.; Lukesch, R.; Ravazzoli, E. Social Innovation: The Promise and the Reality in Marginalised Rural Areas in Europe. World 2022, 3, 237–259. [Google Scholar] [CrossRef]
  46. Hu, Z.; Fang, B.; Jiang, M.; Kang, C.; Zhao, Q. Study on evaluation and classification optimization strategy of future rural construction in Zhejiang province: A case study of Linhai City. Dev. Small Cities Towns 2024, 42, 58–67. [Google Scholar]
  47. Li, J.; Sun, C.; Zhang, C.; Hu, X. Spatial heterogeneity of influential factors of urban housing prices based on multiscale geographically weighted regression models: A case study of the main urban area of Guilin city. J. Zhejiang Univ. (Sci. Ed.) 2024, 51, 623–635. [Google Scholar]
  48. Niu, Y.; Wang, Y. Spatial differentiation patterns of traditional villages in Taihang Mountain area and influencing mechanisms: A MGWR model based analysis. J. Arid Land Resour. Environ. 2024, 38, 87–96. [Google Scholar]
  49. Fotheringham, A.; Yang, W.; Kang, W. Multiscale geographically weighted regression (MGWR). Ann. Assoc. Am. Geogr. 2017, 107, 1247–1265. [Google Scholar] [CrossRef]
  50. Li, Y.; Chen, N.; Sullivan, A.; Chen, S.; Qin, X. Changing collaborative networks and transitions in rural sustainable development: Qualitative lessons from three villages in China. Ecol. Soc. 2023, 28, 2. [Google Scholar] [CrossRef]
  51. Li, Y.; Qin, X.; Sullivan, A.; Chi, G.; Lu, Z.; Pan, W.; Liu, Y. Collective action improves elite-driven governance in rural development within China. Humanit. Soc. Sci. Commun. 2023, 10, 600. [Google Scholar] [CrossRef]
  52. Feng, D.; Jiang, Y.; Long, H.; Huang, Y. Spatio-temporal patterns and correlation effects of regional rurality and poverty governance change: A case study of the rocky desertification area of Yunnan-Guangxi-Guizhou, China. Habitat Int. 2024, 146, 103044. [Google Scholar] [CrossRef]
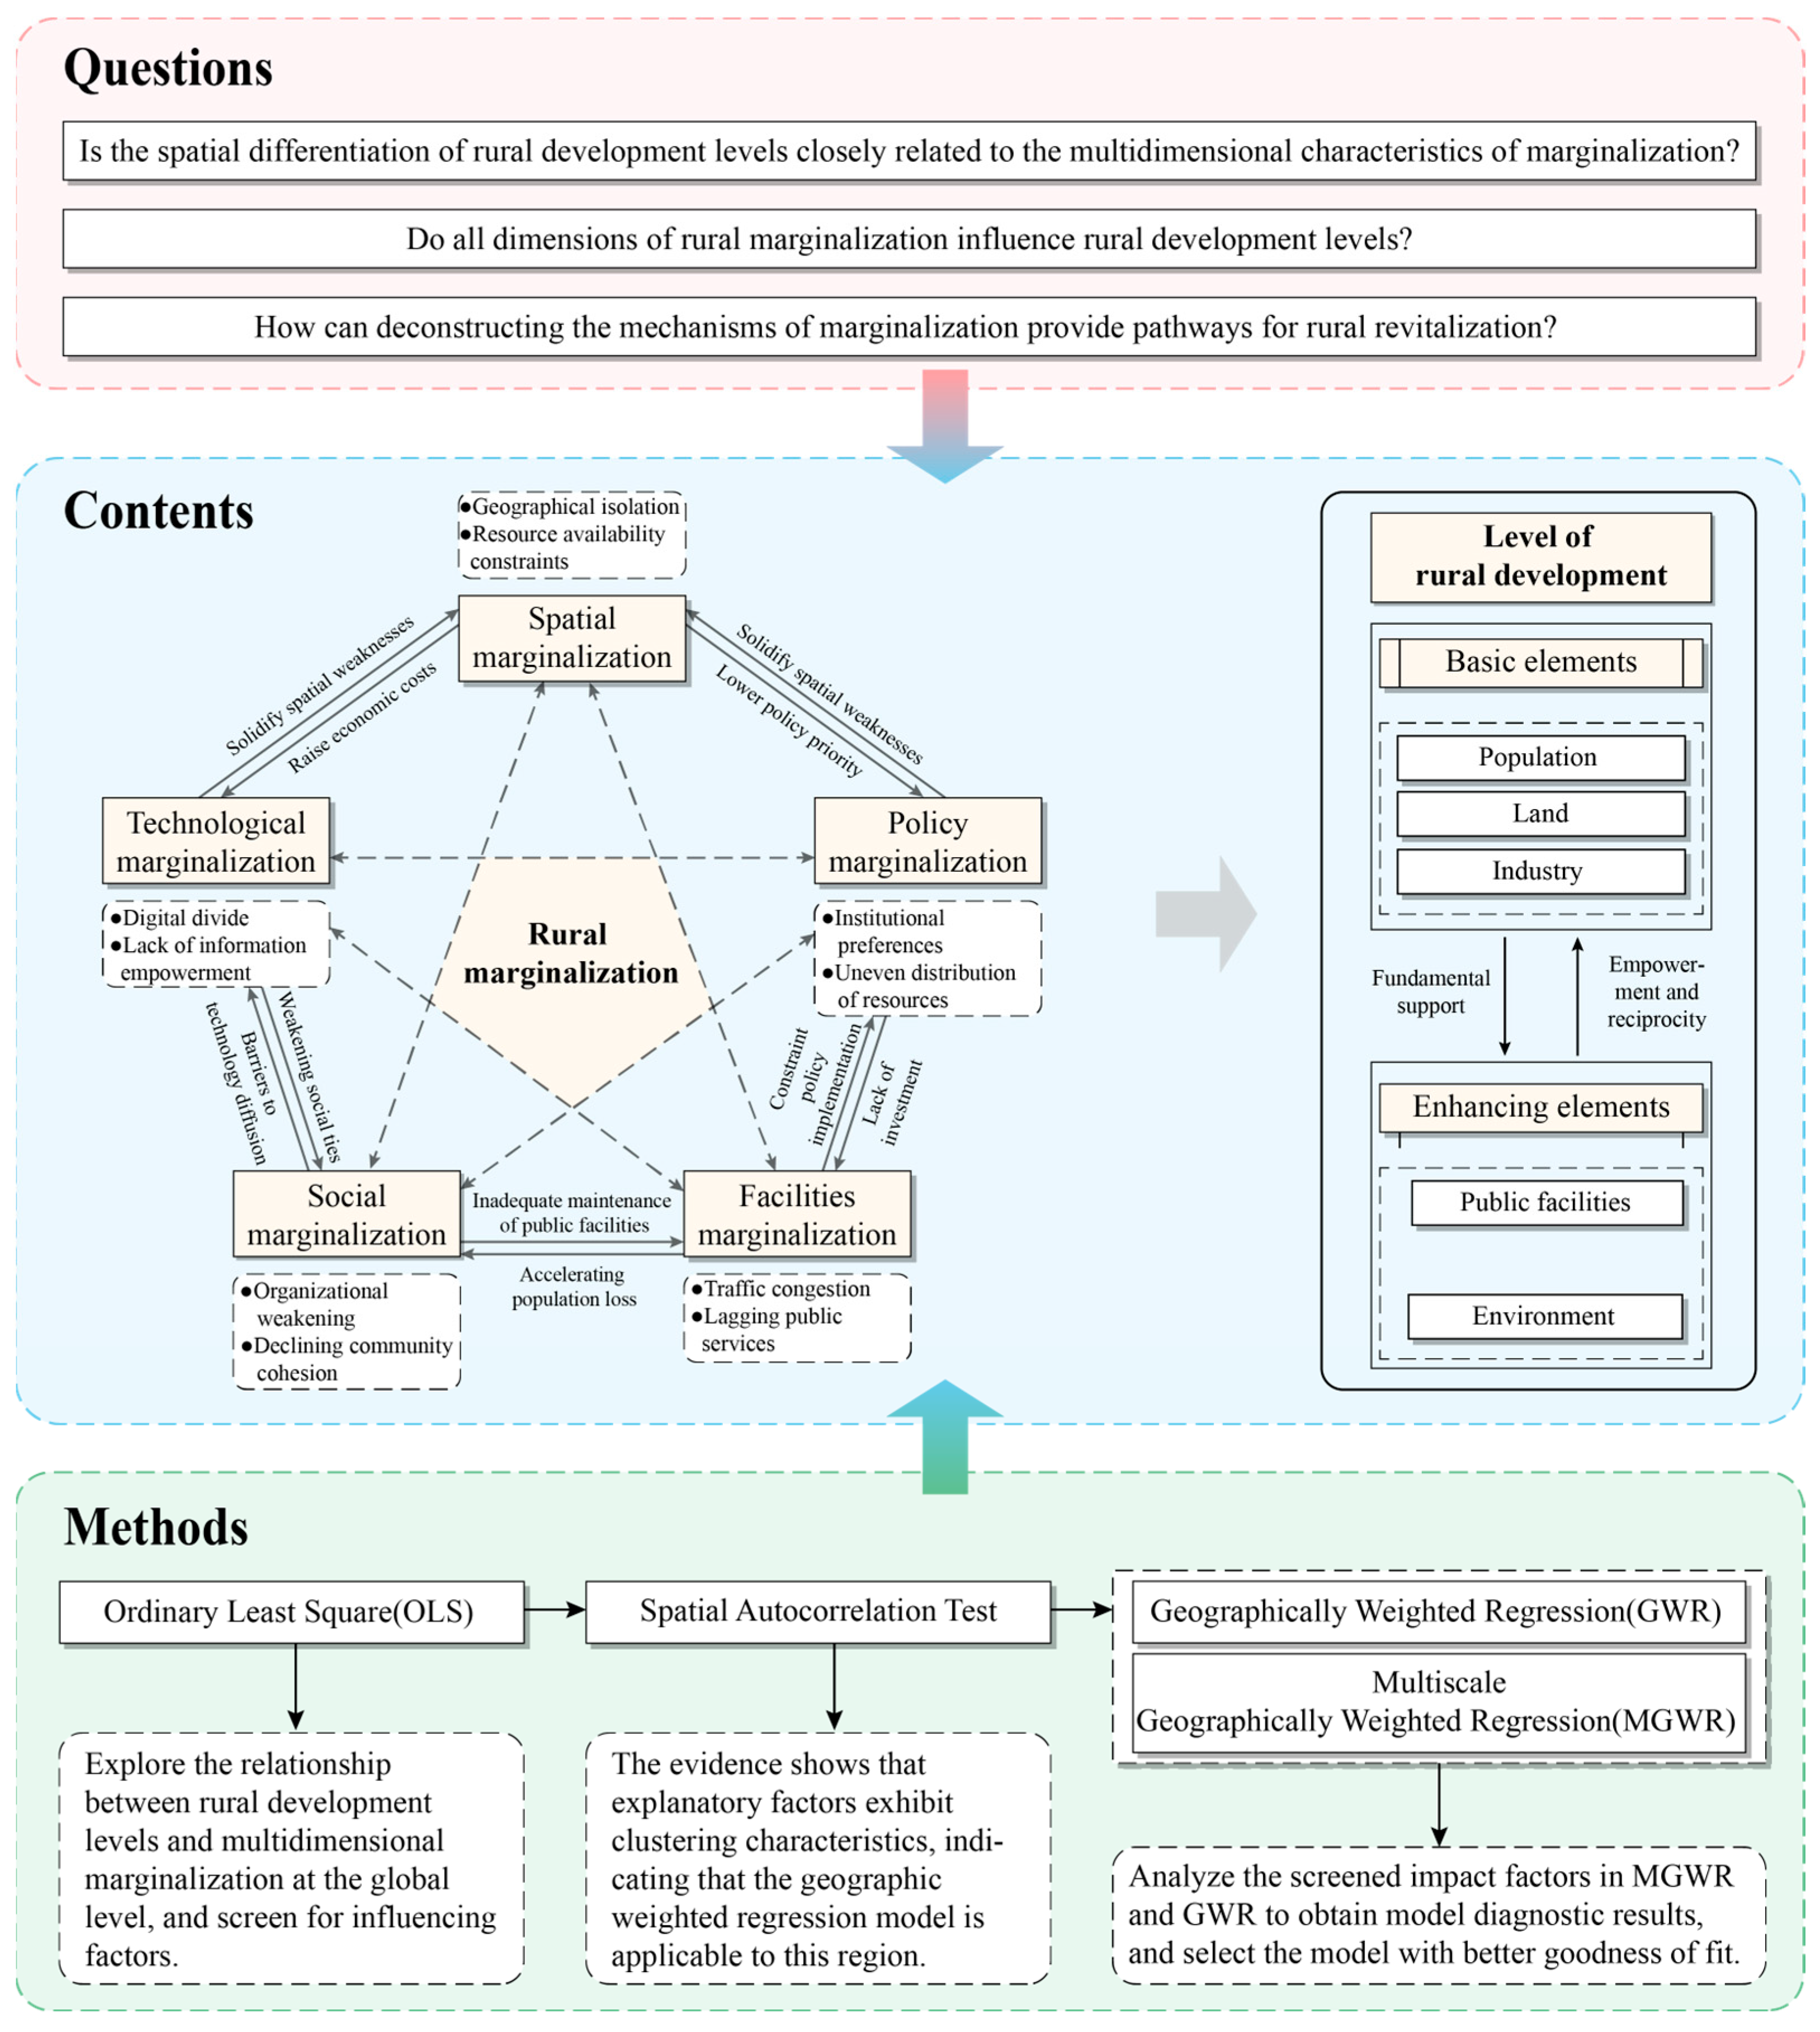
Figure 1. Conceptual Framework Diagram of Rural Marginalization and Rural Development Levels.
Land 14 02285 g001
Figure 2. Location of the study area.
Land 14 02285 g002
Figure 3. Spatial distribution of rural development levels in Linhai City.
Land 14 02285 g003
Figure 4. LISA map of rural development levels and outliers in Linhai City.
Land 14 02285 g004
Figure 5. Independent variable distribution chart: spatial, technological, policy, social, and infrastructure marginalization.
Land 14 02285 g005aLand 14 02285 g005b
Figure 6. Spatial distribution of MGWR model regression coefficients.
Land 14 02285 g006aLand 14 02285 g006b
Table 1. Data sources.
DataFormatSource
Elevation (DEM)Raster (30 m)Geospatial Data Cloud
(https://www.gscloud.cn/)
SlopeRaster (30 m)Geospatial Data Cloud
(https://www.gscloud.cn/)
Township, Linhai City Point DataVectorBy liaising with relevant government departments in Linhai City
Village Point DataVectorBy liaising with relevant government departments in Linhai City
Administrative BoundariesVectorBy liaising with relevant government departments in Linhai City
Number of Natural Villages with Fiber Optic AccessStatistical DataQuestionnaire issued by Linhai City Housing and Urban-Rural Development Bureau (LHHUDB)
Whether 5G Mobile Network Signal Covers the VillageStatistical DataQuestionnaire issued by LHHUDB
Whether the Village is a Provincial/Municipal Level “Beautiful Village”Statistical DataQuestionnaire issued by LHHUDB
Whether the Village is a “One Village, Ten Thousand Trees” Demo VillageStatistical DataQuestionnaire issued by LHHUDB
Number of Villager Representative Meetings Held AnnuallyStatistical DataQuestionnaire issued by LHHUDB
Whether the Village has a Village History MuseumStatistical DataQuestionnaire issued by LHHUDB
Whether the Village Party Branch is an Outstanding Grassroots BranchStatistical DataQuestionnaire issued by LHHUDB
Time for Most Villagers to Walk to Nearest Bus/Bus StopStatistical DataQuestionnaire issued by LHHUDB
Transportation Road NetworkVectorOpen Street Map (https://www.openstreetmap.org/)
Population Mobility RateStatistical DataBy liaising with relevant government departments in Linhai City
Aging RateStatistical DataQuestionnaire issued by LHHUDB
Farmland AreaRaster (30 m)China Annual Land Cover Dataset (https://zenodo.org/records/12779975, accessed on 25 November 2024)
Whether Village has Well-developed Agribusiness Leaders, Co-ops, Family Farms, Agri-entrepreneursStatistical DataQuestionnaire issued by LHHUDB
Village Collective IncomeStatistical DataQuestionnaire issued by LHHUDB
Per Capita Villager IncomeStatistical DataQuestionnaire issued by LHHUDB
Time for Most Villagers to Walk to Nearest Express Delivery PointStatistical DataQuestionnaire issued by LHHUDB
Whether Village has Access to Dual-Lane RoadsStatistical DataQuestionnaire issued by LHHUDB
Whether Village has New Energy Vehicle Charging FacilitiesStatistical DataQuestionnaire issued by LHHUDB
Time for Most Villagers to Walk to Nearest KindergartenStatistical DataQuestionnaire issued by LHHUDB
Time for Most Villagers to Walk to Nearest Primary SchoolStatistical DataQuestionnaire issued by LHHUDB
Time for Most Villagers to Walk to Village ClinicStatistical DataQuestionnaire issued by LHHUDB
Whether Village Elderly Care Facilities Meet Local NeedsStatistical DataQuestionnaire issued by LHHUDB
Village Greening AreaStatistical DataQuestionnaire issued by LHHUDB
Number of Public Open Spaces in the VillageStatistical DataQuestionnaire issued by LHHUDB
Whether Village Promotes Use of Solar, Natural Gas, Wind Energy, etc.Statistical DataQuestionnaire issued by LHHUDB
Table 2. Rural development level evaluation index system.
Element LayerCriterion LayerIndicator LayerIndicator Interpretation/Conversion MethodIndicator Attributes
Basic ElementsPopulationPopulation Mobility Rate(Rural Resident Population—Rural Registered Population)/Rural Registered Population+
Aging RateNumber of people aged 60+/Registered Population
LandFarmland ConditionFarmland Area/Village Area; Using 30 × 30 m land cover data, an intersect analysis was performed in ArcGIS to determine the farmland area within each village.+
IndustryBusiness entityNumber of well-developed agribusiness leaders, farmer cooperatives, family farms, agri-entrepreneurs, etc.+
Village Collective Income1: 0–500,000 yuan; 2: 500,000–1,000,000 yuan; 3: 1,000,000–5,000,000 yuan; 4: 5,000,000–10,000,000 yuan; 5: Over 10,000,000 yuan+
Per Capita Villager Income1: 0–20,000 yuan; 2: 20,000–30,000 yuan; 3: 30,000–50,000 yuan; 4: 50,000–80,000 yuan; 5: Over 80,000 yuan+
Enhancement ElementsPublic Service FacilitiesTime to Walk to Nearest Express Delivery Point1: ≤5 min; 2: 5–10 min; 3: 10–15 min; 4: 15–30 min; 5: >30 min
Access to Dual-Lane Roads1: Yes; 2: No
Presence of NEV Charging Facilities1: Yes; 2: No
Time to Walk to Nearest Kindergarten1: ≤5 min; 2: 5–10 min; 3: 10–15 min; 4: 15–30 min; 5: >30 min
Time to Walk to Nearest Primary School1: ≤5 min; 2: 5–10 min; 3: 10–15 min; 4: 15–30 min; 5: >30 min
Time to Walk to Village Clinic1: ≤5 min; 2: 5–10 min; 3: 10–15 min; 4: 15–30 min; 5: >30 min
Elderly Care Facilities Meet Local Needs1: Meet; 2: Do Not Meet+
EnvironmentVillage Greening AreaMu (Chinese acre)+
Number of Public Open SpacesCount+
Promotion of Renewable Energy Use (Solar, Gas, Wind, etc.)1: Yes; 2: No
Note: “+” in the “Indicator Attributes” column indicates that the indicator exerts a positive contribution to rural development level, correspondingly, “−” indicates a negative contribution.
Table 3. A system of factors influencing spatial differentiation in rural development levels based on a marginalized perspective.
Marginalization TypeInfluencing FactorVariable DescriptionVariable Property
Spatial MarginalizationElevationAbsolute difference between village average elevation and elevation of Linhai City government seat(m); Extracting zoned statistics using a 30 × 30 m Linhaishan City DEM in ArcGIS+
SlopeVillage average slope (°); Utilize slope analysis in ArcGIS 10.5 and extract data using zone statistics.+
Distance to Nearest Town Centerkm+
Distance to Linhai City Centerkm+
Technological MarginalizationNumber of Natural Villages with Fiber OpticCount
Whether 5G Signal Covers the Village1: Yes; 2: No+
Policy MarginalizationWhether Provincial/Municipal “Beautiful Village”1: Yes; 2: No+
Whether “One Village, Ten Thousand Trees” Demo Village1: Yes; 2: No+
Social MarginalizationNumber of Villager Representative Meetings Held AnnuallyCount
Whether Village has Village History Museum1: Yes; 2: No+
Level of Outstanding Grassroots Party Branch1: Provincial Outstanding; 2: Municipal (Taizhou) Outstanding; 3: County (Linhai) Outstanding; 4: Township Outstanding; 5: No+
Infrastructural MarginalizationTime to Walk to Nearest Bus/Bus Stop1: ≤5 min; 2: 5–10 min; 3: 10–15 min; 4: 15–30 min; 5: >30 min+
Distance to Nearest Major Transportation Arterykm+
Village Road Network DensityTotal road length within village/Village area (km/km2); Using OSM road network data, perform an intersection analysis in ArcGIS to obtain the mileage of primary, secondary, and branch roads within each village area.
Note: “+” in the “Variable Property” column indicates that the factor exerts a positive contribution to rural marginalization, correspondingly, “−” indicates a negative contribution.
Table 4. Test results for indicators of factors influencing spatial differentiation in rural development levels.
Independent VariableCoefficientStd. Err.t-Valuep-ValueVIFScreening
Elevation−0.00005020.000041−1.220.2223.36Not Pass
Slope−0.00520020.000839−6.190.0003.55Pass
Distance to Nearest Town Center−0.00000720.000002−4.640.0001.59Pass
Distance to Linhai City Center0.00000070.0000002.720.0071.32Pass
Number of Natural Villages with Fiber Optic0.00105220.0013940.760.4491.05Not Pass
Whether 5G Signal Covers the Village−0.01982770.007775−2.550.0111.07Pass
Whether Provincial/Municipal “Beautiful Village”−0.02525990.012674−1.990.0471.1Pass
Whether “One Village, Ten Thousand Trees” Demo Village−0.01731020.013069−1.320.1861.06Not Pass
Number of Villager Representative Meetings Held Annually−0.00029650.000870−0.340.7331.03Not Pass
Whether Village History Museum−0.02527380.006157−4.100.0001.04Pass
Level of Outstanding Grassroots Party Branch−0.01894270.004241−4.470.0001.06Pass
Time to Walk to Nearest Bus Stop−0.00783820.002081−3.770.0001.09Pass
Distance to Nearest Major Transportation Artery−0.00000500.000008−0.630.5301.21Not Pass
Village Road Network Density0.00281790.0024031.170.2411.55Not Pass
Table 5. Comparison of indicators for spatial differentiation models of rural development levels: OLS, GWR, and MGWR.
ModelR2Adjusted R2AICcResidual Sum of Squares
OLS0.4590.4521296.413310.377
GWR0.470.4561297.71304.143
MGWR0.5450.5091270.03261.258
Table 6. Regression results for the OLS, GWR, and MGWR models.
Independent VariableOLSMGWRGWR
p-Value|t|Average
Regression
Coefficient
Minimum
Regression
Coefficient
Maximum
Regression
Coefficient
BandwidthBandwidth
Slope0.000−11.117−0.41−0.445−0.385567573
Distance from town center0.000−5.725−0.237−0.266−0.223571573
Distance from the city center0.0062.7460.5640.5390.6573573
5G signal0.006−2.769−0.061−0.076−0.046573573
Beauty village0.038−2.076−0.061−0.077−0.044570573
Village History Museum0.000−4.34−0.139−0.3080.033158573
Party Branch0.000−4.714−0.129−0.152−0.109571573
Time to the bus stop0.000−4.191−0.149−0.183−0.125571573
Disclaimer/Publisher’s Note: The statements, opinions and data contained in all publications are solely those of the individual author(s) and contributor(s) and not of MDPI and/or the editor(s). MDPI and/or the editor(s) disclaim responsibility for any injury to people or property resulting from any ideas, methods, instructions or products referred to in the content.