Multi-Scale Resilience Assessment and Zonal Strategies for Storm Surge Adaptation in China’s Coastal Cities
Abstract
1. Introduction
- (1)
- How can a multi-scale, operational resilience assessment system for coastal cities be constructed?
- (2)
- What are the spatial patterns and dominant influencing factors of coastal city resilience, and how do they vary across scales?
- (3)
- What actionable, zoned, and implementable improvement strategies can be proposed for risk governance and planning practices?
2. Theoretical Background
2.1. Resilience Concepts and Measurement Methods in Coastal Storm Surge Contexts
2.2. Resilience Assessment Method Based on the “Exposure-Sensitivity-Adaptation” Framework
3. Research Framework and Study Area
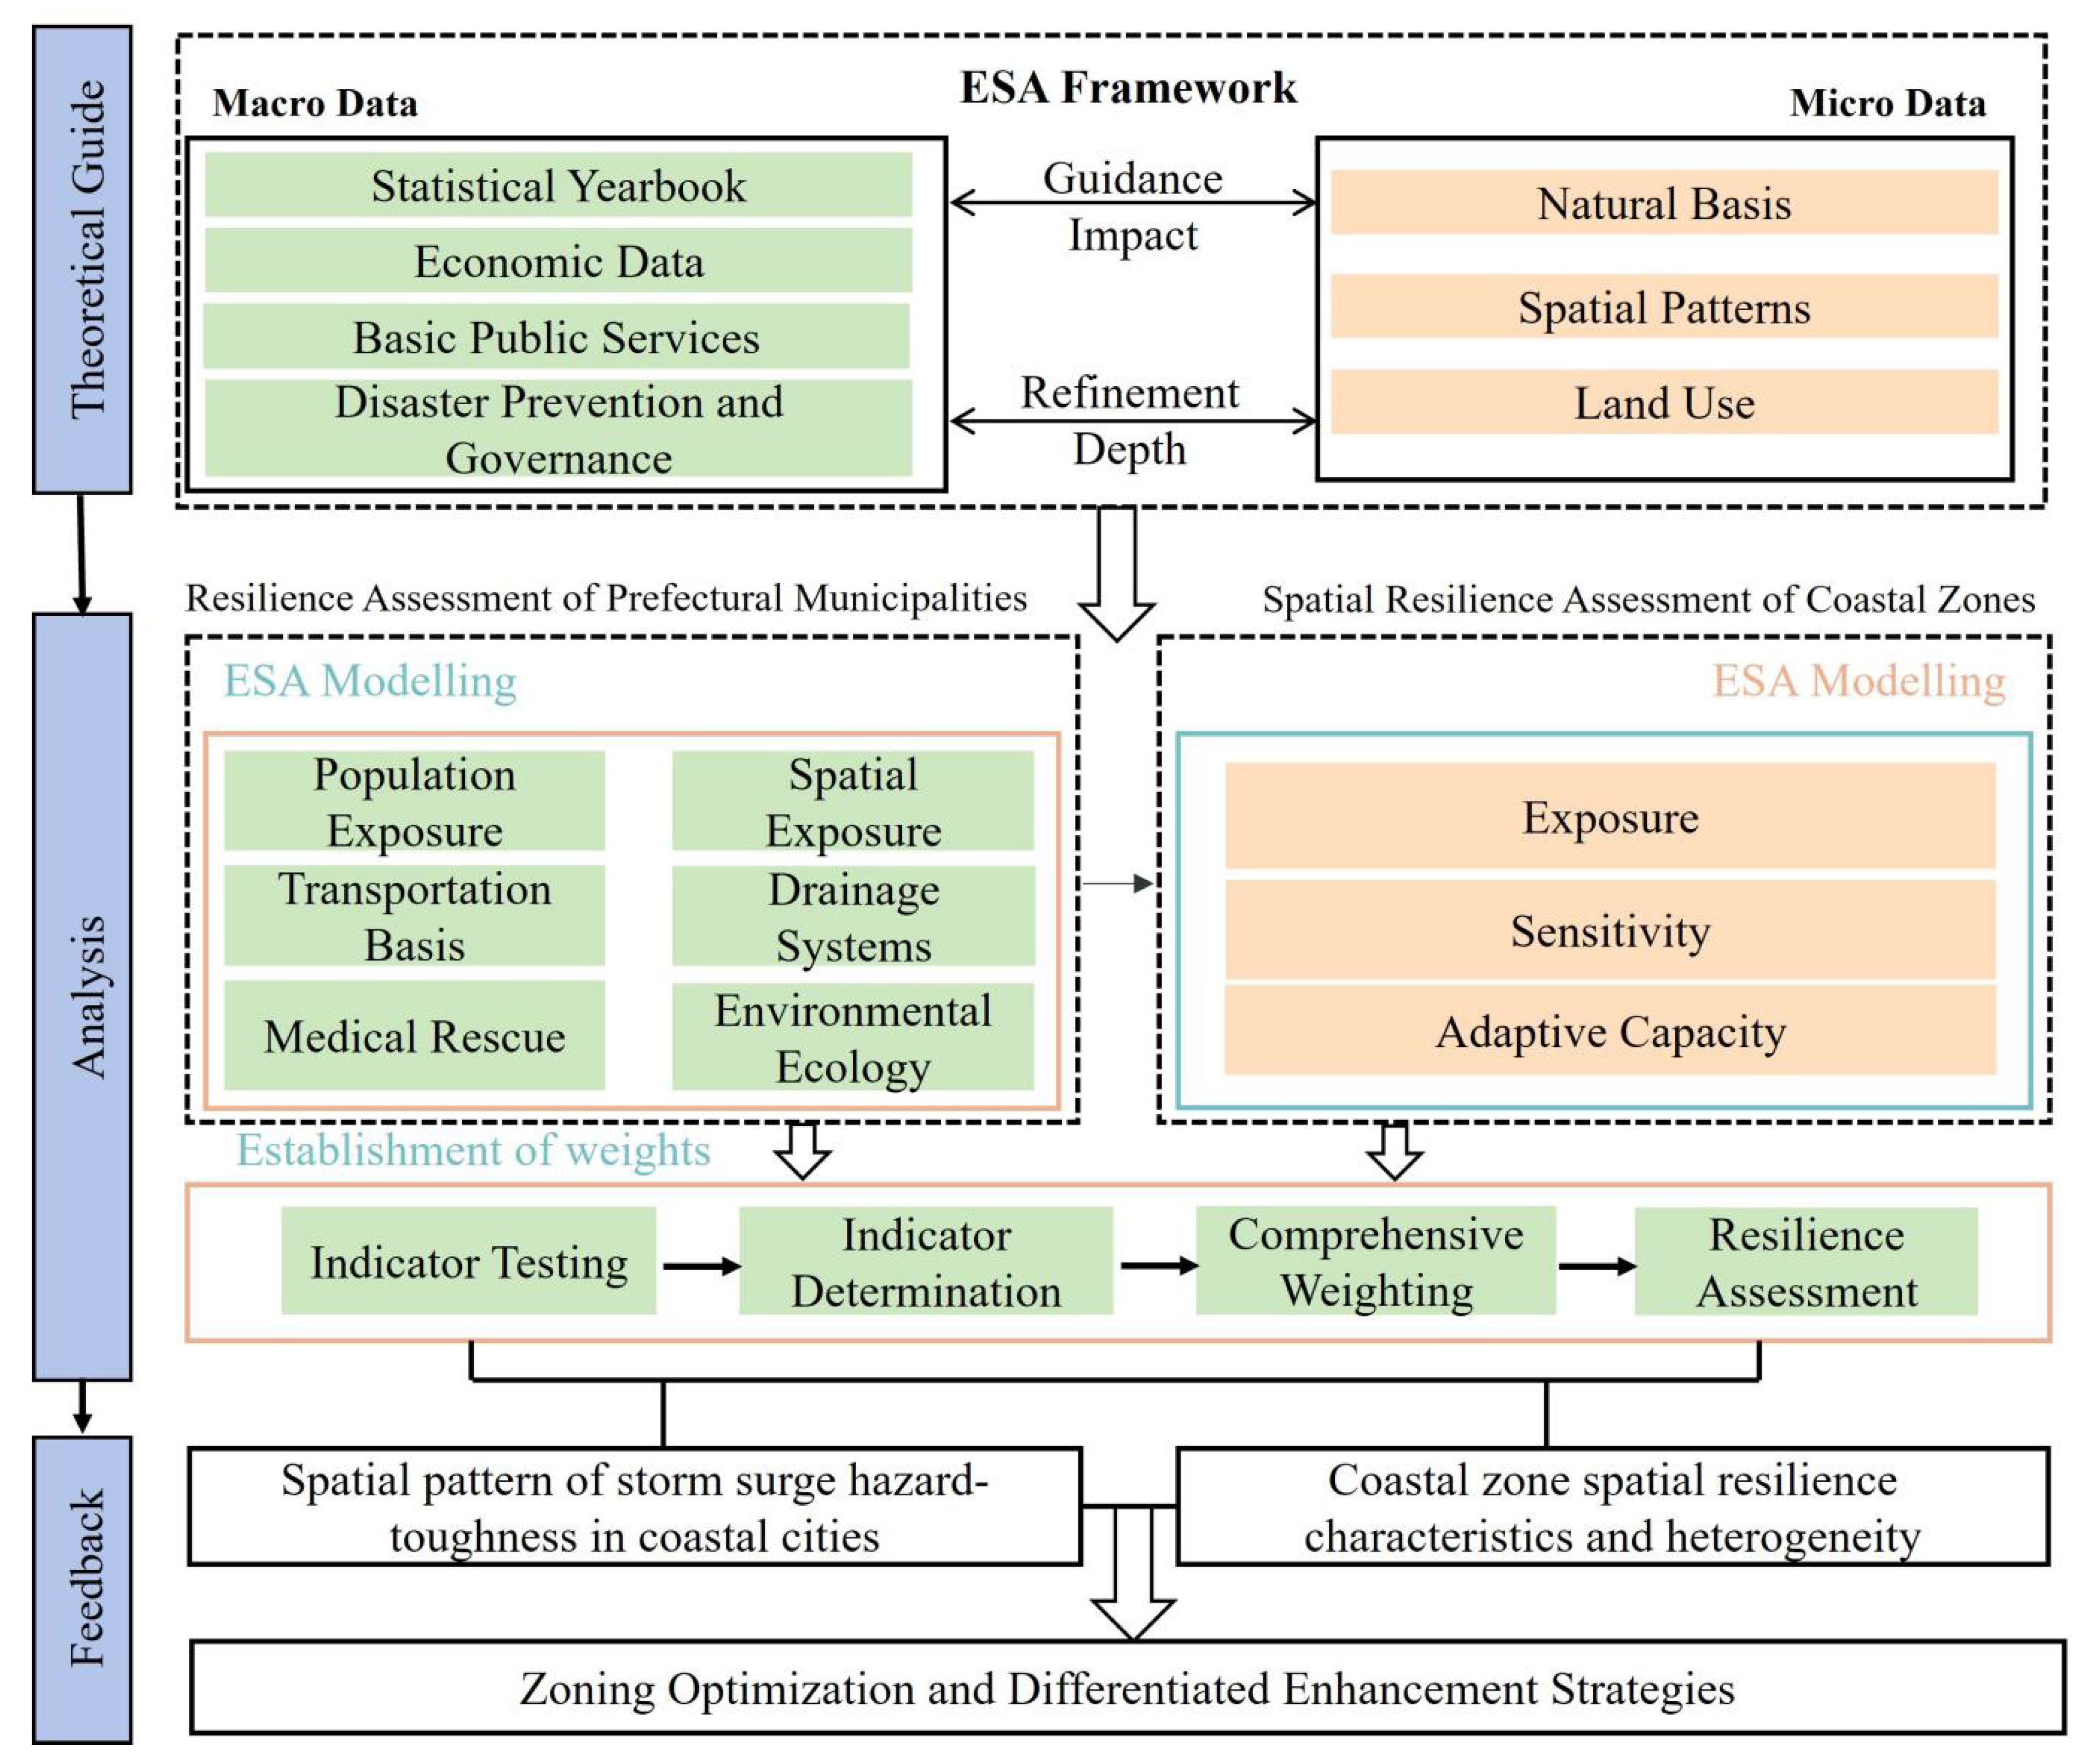
3.1. Research Framework
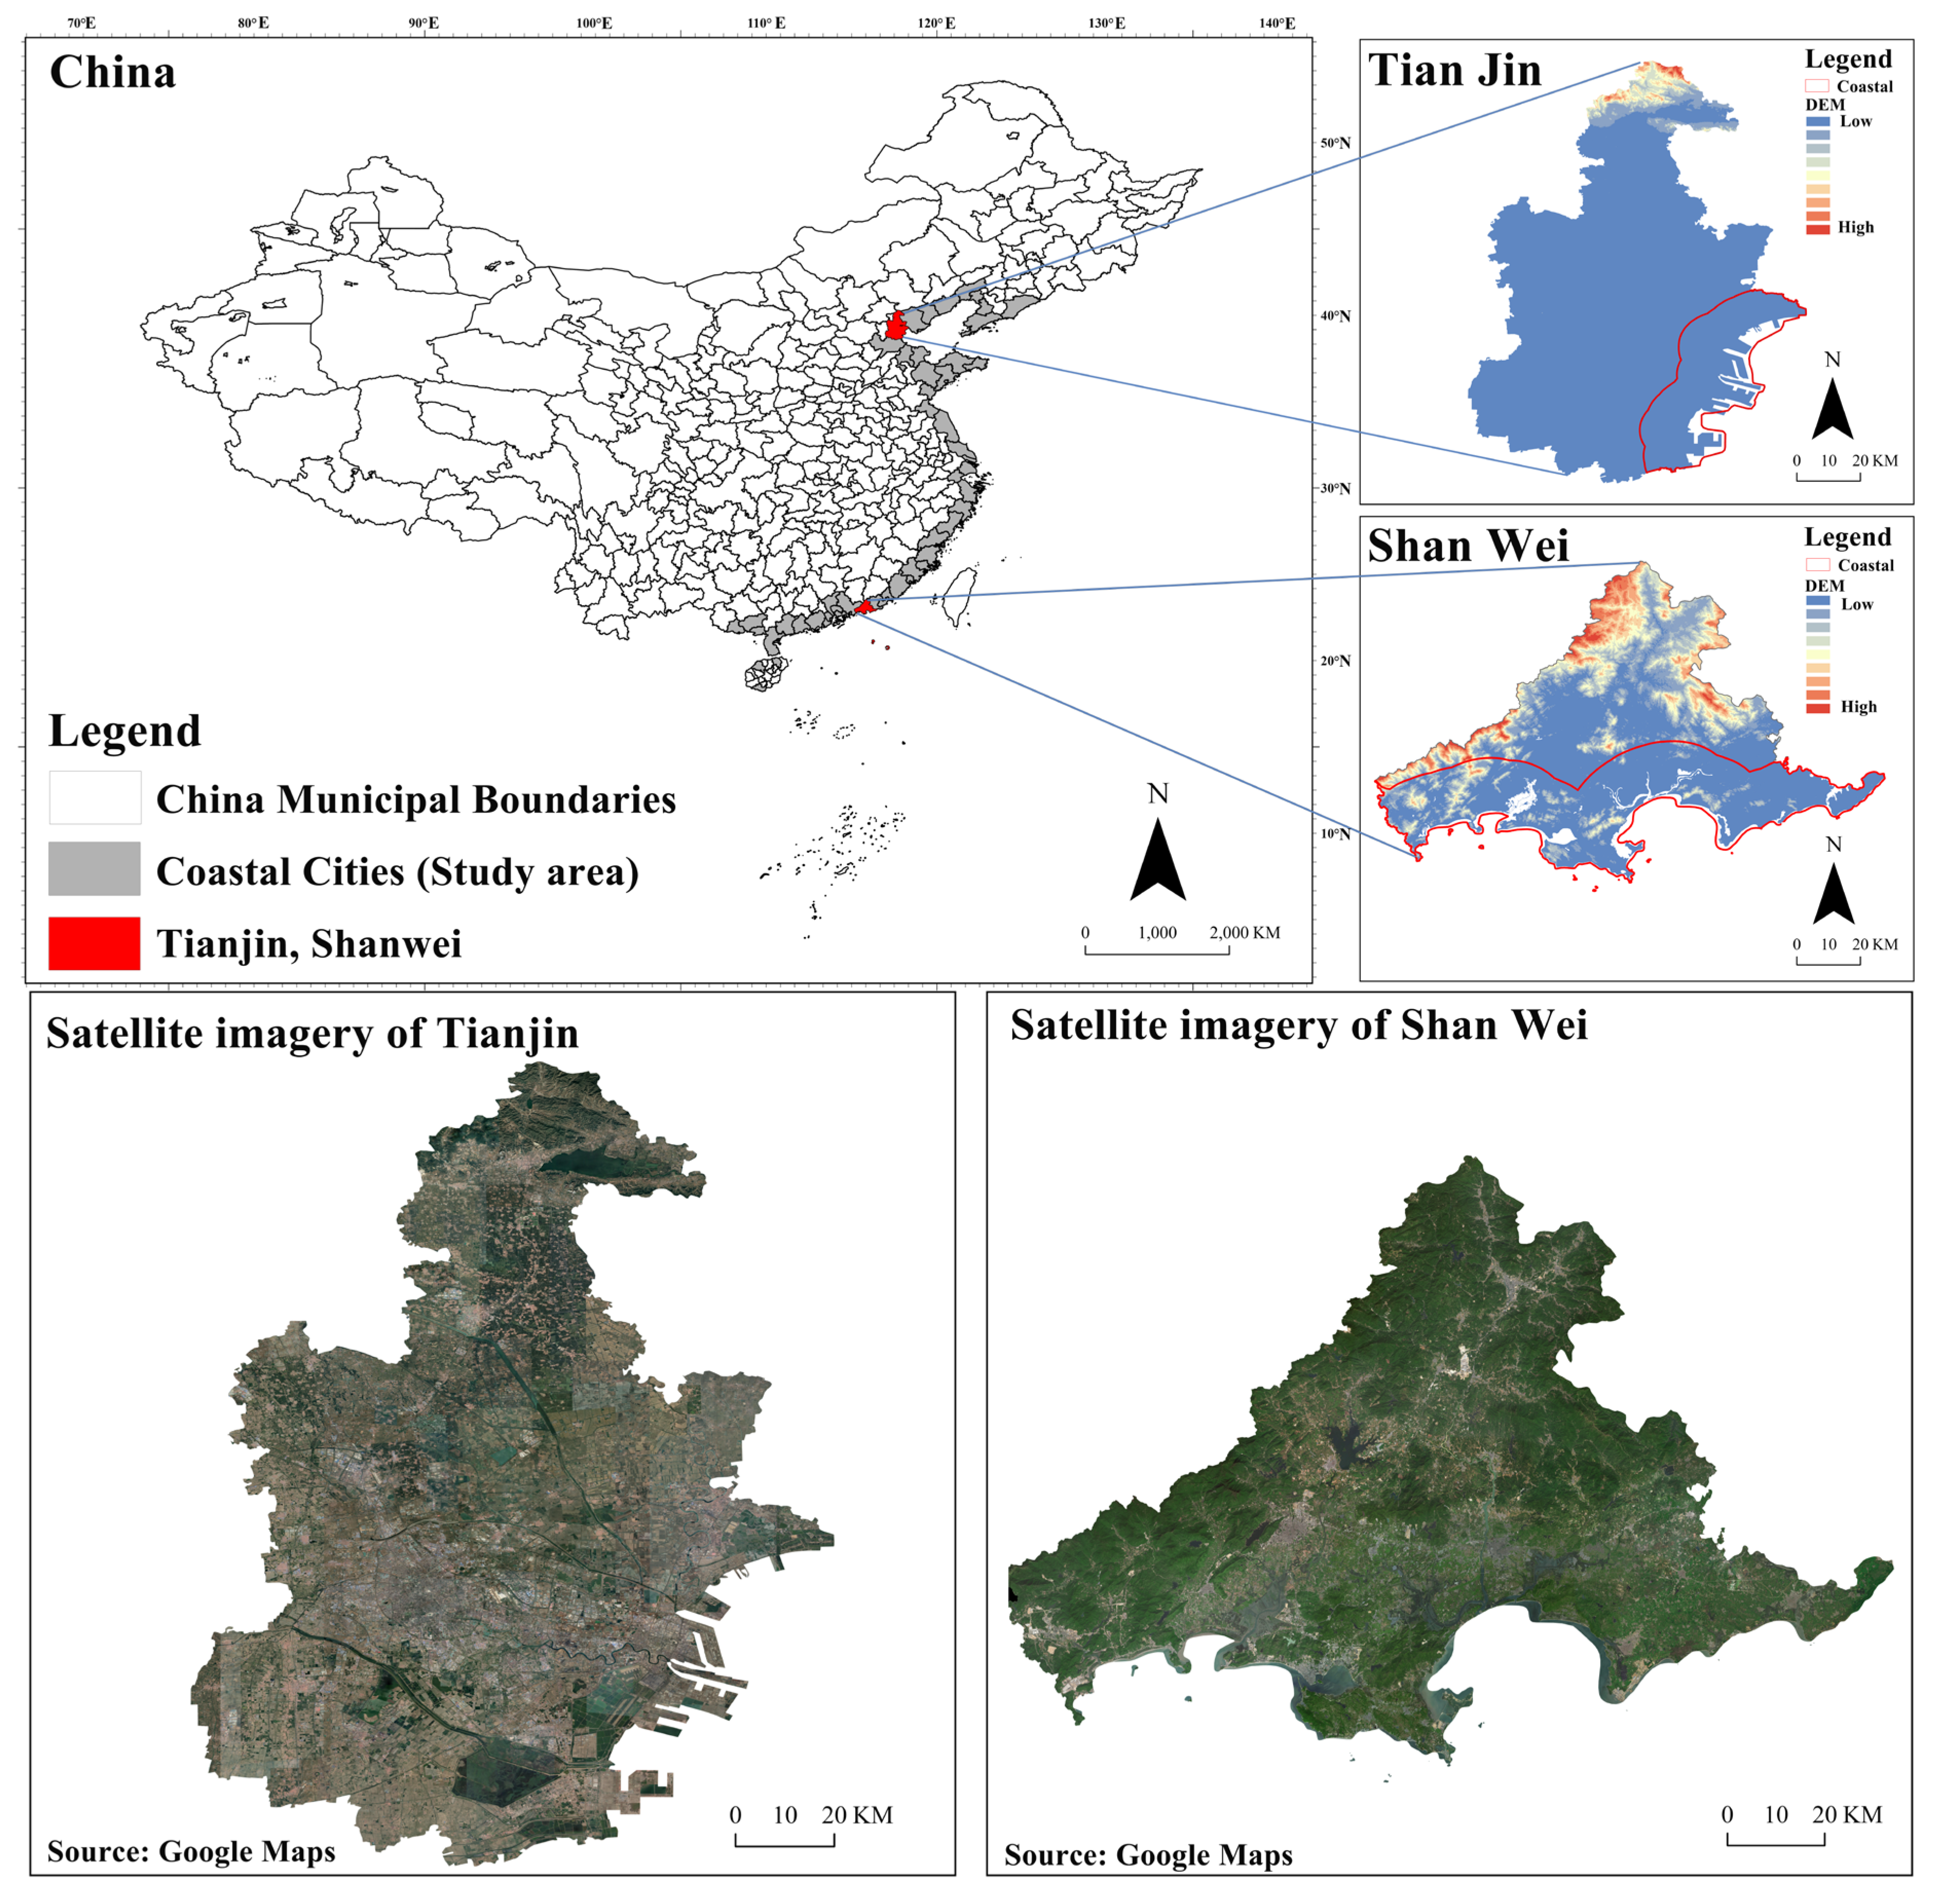
3.2. Study Area
4. Methods and Data Sources
4.1. Research Methods
4.1.1. Macro Resilience Comprehensive Indicator System
4.1.2. Micro Resilience Comprehensive Indicator System
- (1)
- Spatial Morphology: Indicators such as “degree of mixed land use” and “road network density” reflect the urban spatial structure’s resilience and accessibility, which are essential for emergency response.
- (2)
- Adaptive Capacity: “Emergency shelter density” and “medical facility density” evaluate the city’s capacity to evacuate and provide medical assistance during emergencies.
- (3)
- Natural Background: Indicators such as elevation and annual precipitation are used to assess the city’s exposure and environmental carrying capacity. While annual precipitation may not directly correlate with storm surges, it can indicate potential flooding risks and contribute to understanding the city’s overall vulnerability to extreme weather events. Precipitation levels, when considered alongside other factors such as coastal proximity and infrastructure resilience, can provide additional insight into the region’s susceptibility to flooding and environmental stressors.
- (4)
- Landscape Pattern: Ecological connectivity is assessed using indicators like the “aggregation index” and “patch cohesion index,” which measure the stability and redundancy of the ecological system under extreme conditions. To ensure the indicator system’s adaptability across both cities, all indicators are normalized based on a unified calculation logic and standardized spatial scale (1 km × 1 km grid). The indicators are identified using a standardized nomenclature format, “T/S + serial number,” where “T” and “S” represent Tianjin and Shanwei, respectively. This standardized system facilitates cross-city comparisons within a shared framework, ensuring consistency in analysis and evaluation. A detailed list of indicators is shown in Table A2 in Appendix A.
4.1.3. Indicator Selection and Multicollinearity Testing
4.1.4. Weight Determination
4.1.5. Comprehensive Score
4.1.6. Hotspot Analysis
4.2. Data Sources
- (1)
- Remote Sensing Data: High-resolution Landsat imagery (Landsat 8 OLI/TIRS) was used to map land use, land cover changes, and coastal distribution patterns. These images are essential for analyzing urban spatial structures and the impacts of storm surges. The Landsat images provide a spatial resolution of 30 m for most bands, which is suitable for identifying large-scale changes in land cover and infrastructure. The imagery was obtained from the Earth Explorer platform (https://earthexplorer.usgs.gov), accessed on 6 March 2025. Previous studies have validated the use of remote sensing data in assessing storm surge impacts and urban resilience, confirming the reliability of Landsat imagery in coastal impact analyses [55]. The advantages of Landsat imagery include its high spatial accuracy, consistent temporal resolution (available for multiple years), and its proven utility in environmental monitoring. However, limitations exist, including the lower spatial resolution compared to commercial satellite imagery (e.g., 10-m resolution from World View), which may affect the detection of finer details in urban environments. Additionally, cloud cover and atmospheric conditions can sometimes limit the clarity of images. Despite these limitations, Landsat imagery remains a reliable and widely used resource in coastal and urban resilience studies due to its long temporal history and global coverage.
- (2)
- Statistical Yearbooks and Government Public Data: Data from the National Bureau of Statistics and local statistical yearbooks provided socio-economic indicators such as population density, economic activity, industrial structure, and public facilities. These datasets are crucial for assessing urban carrying capacity and adaptive capacity. In addition, government-released information on disaster risk reduction investments, emergency management policies, and funding sources was collected to support the adaptability dimension (https://data.stats.gov.cn), accessed on 6 March 2025. These socio-economic datasets have been widely used in disaster vulnerability assessments, and their application in this study aligns with the standard practices in storm surge resilience research [56].
- (3)
- Meteorological and Hydrological Data: Historical data on storm surge events, tide monitoring, wind speed, and precipitation were obtained from the China Meteorological Administration and water resources departments (http://www.hydroinfo.gov.cn), accessed on 6 March 2025. These datasets are essential for understanding the frequency, intensity, and impacts of storm surges. As shown in Wang et al., such data has been extensively validated and utilized in storm surge impact studies, supporting its role in our framework for analyzing storm surge risks [57].
- (4)
- Points of Interest and Basic Spatial Data: Data on the spatial distribution of critical emergency facilities, such as medical services, shelters, and fire stations, were collected from open platforms like Gaode Maps (https://lbs.amap.com), accessed on 12 February 2025. This information indicates the city’s emergency response capabilities and social service infrastructure. Previous research has demonstrated the use of similar spatial data to assess the relationship between emergency infrastructure and disaster response efficiency, ensuring the robustness of this dataset in the current study [58].
- (5)
- Ecological Environment Data: Information on ecosystem services, vegetation cover, and wetland protection areas was integrated to assess the baseline ecological resilience of urban areas (https://www.nenv.org.cn), accessed on 12 February 2025. Chen and Zhang have shown that such ecological data is critical for assessing urban resilience to storm surges, particularly in coastal regions, and has been validated in similar storm surge assessments [59].
- (6)
- Survey and Field Data: Field surveys were conducted in key study areas to gather subjective indicators, including residents’ perceptions of storm surges, preparedness for emergencies, and satisfaction with government responses. These data complement the micro-level evaluation of social adaptive capacity. Previous studies have used similar survey data to assess social resilience and preparedness, ensuring the validity of these subjective indicators in our analysis [60].
5. Results
5.1. Macro-Scale Evaluation Results of 52 Coastal Cities
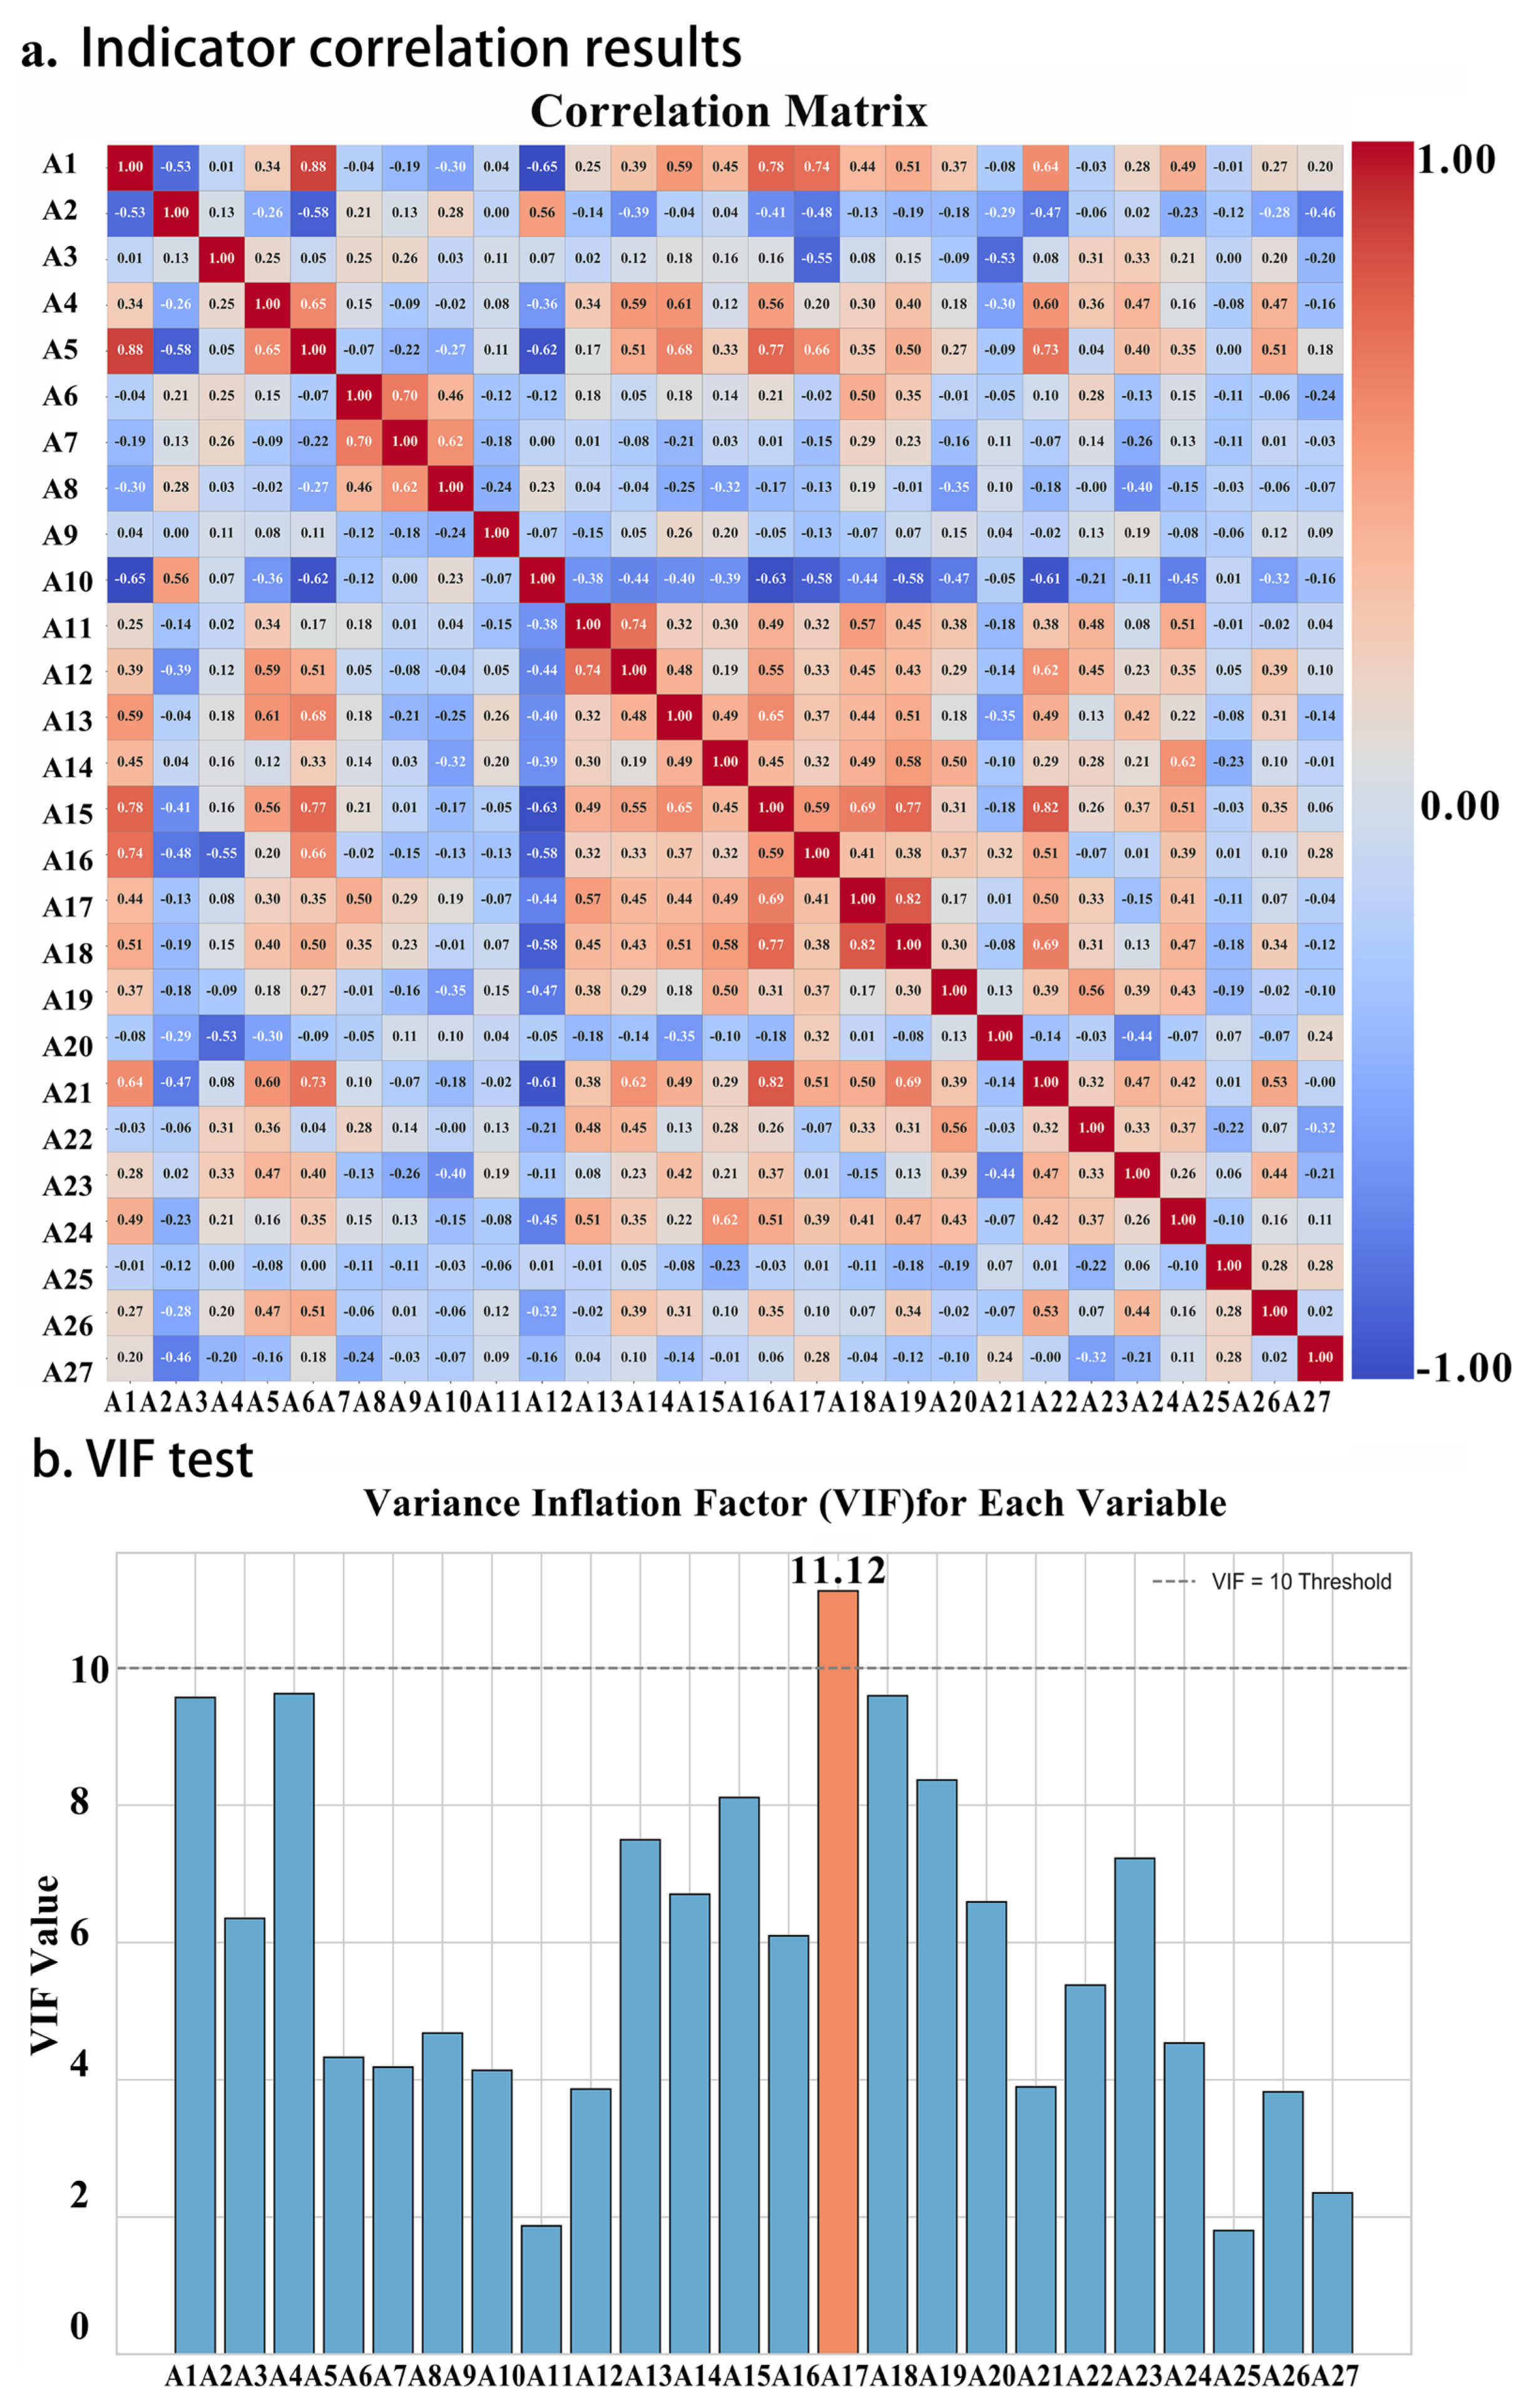
5.1.1. Correlation and VIF Analysis
5.1.2. Weight Comparison
5.1.3. Coastal City Resilience Scores and Spatial Patterns
5.2. Micro-Scale: Coastal Line Resilience Assessment at the Grid Level
5.2.1. Tianjin Coastal Line Resilience Assessment
- (1)
- Correlation and VIF of Tianjin’s Coastal Resilience Indicators
- (2)
- Tianjin Coastal Resilience Indicator Weighting System
- (3)
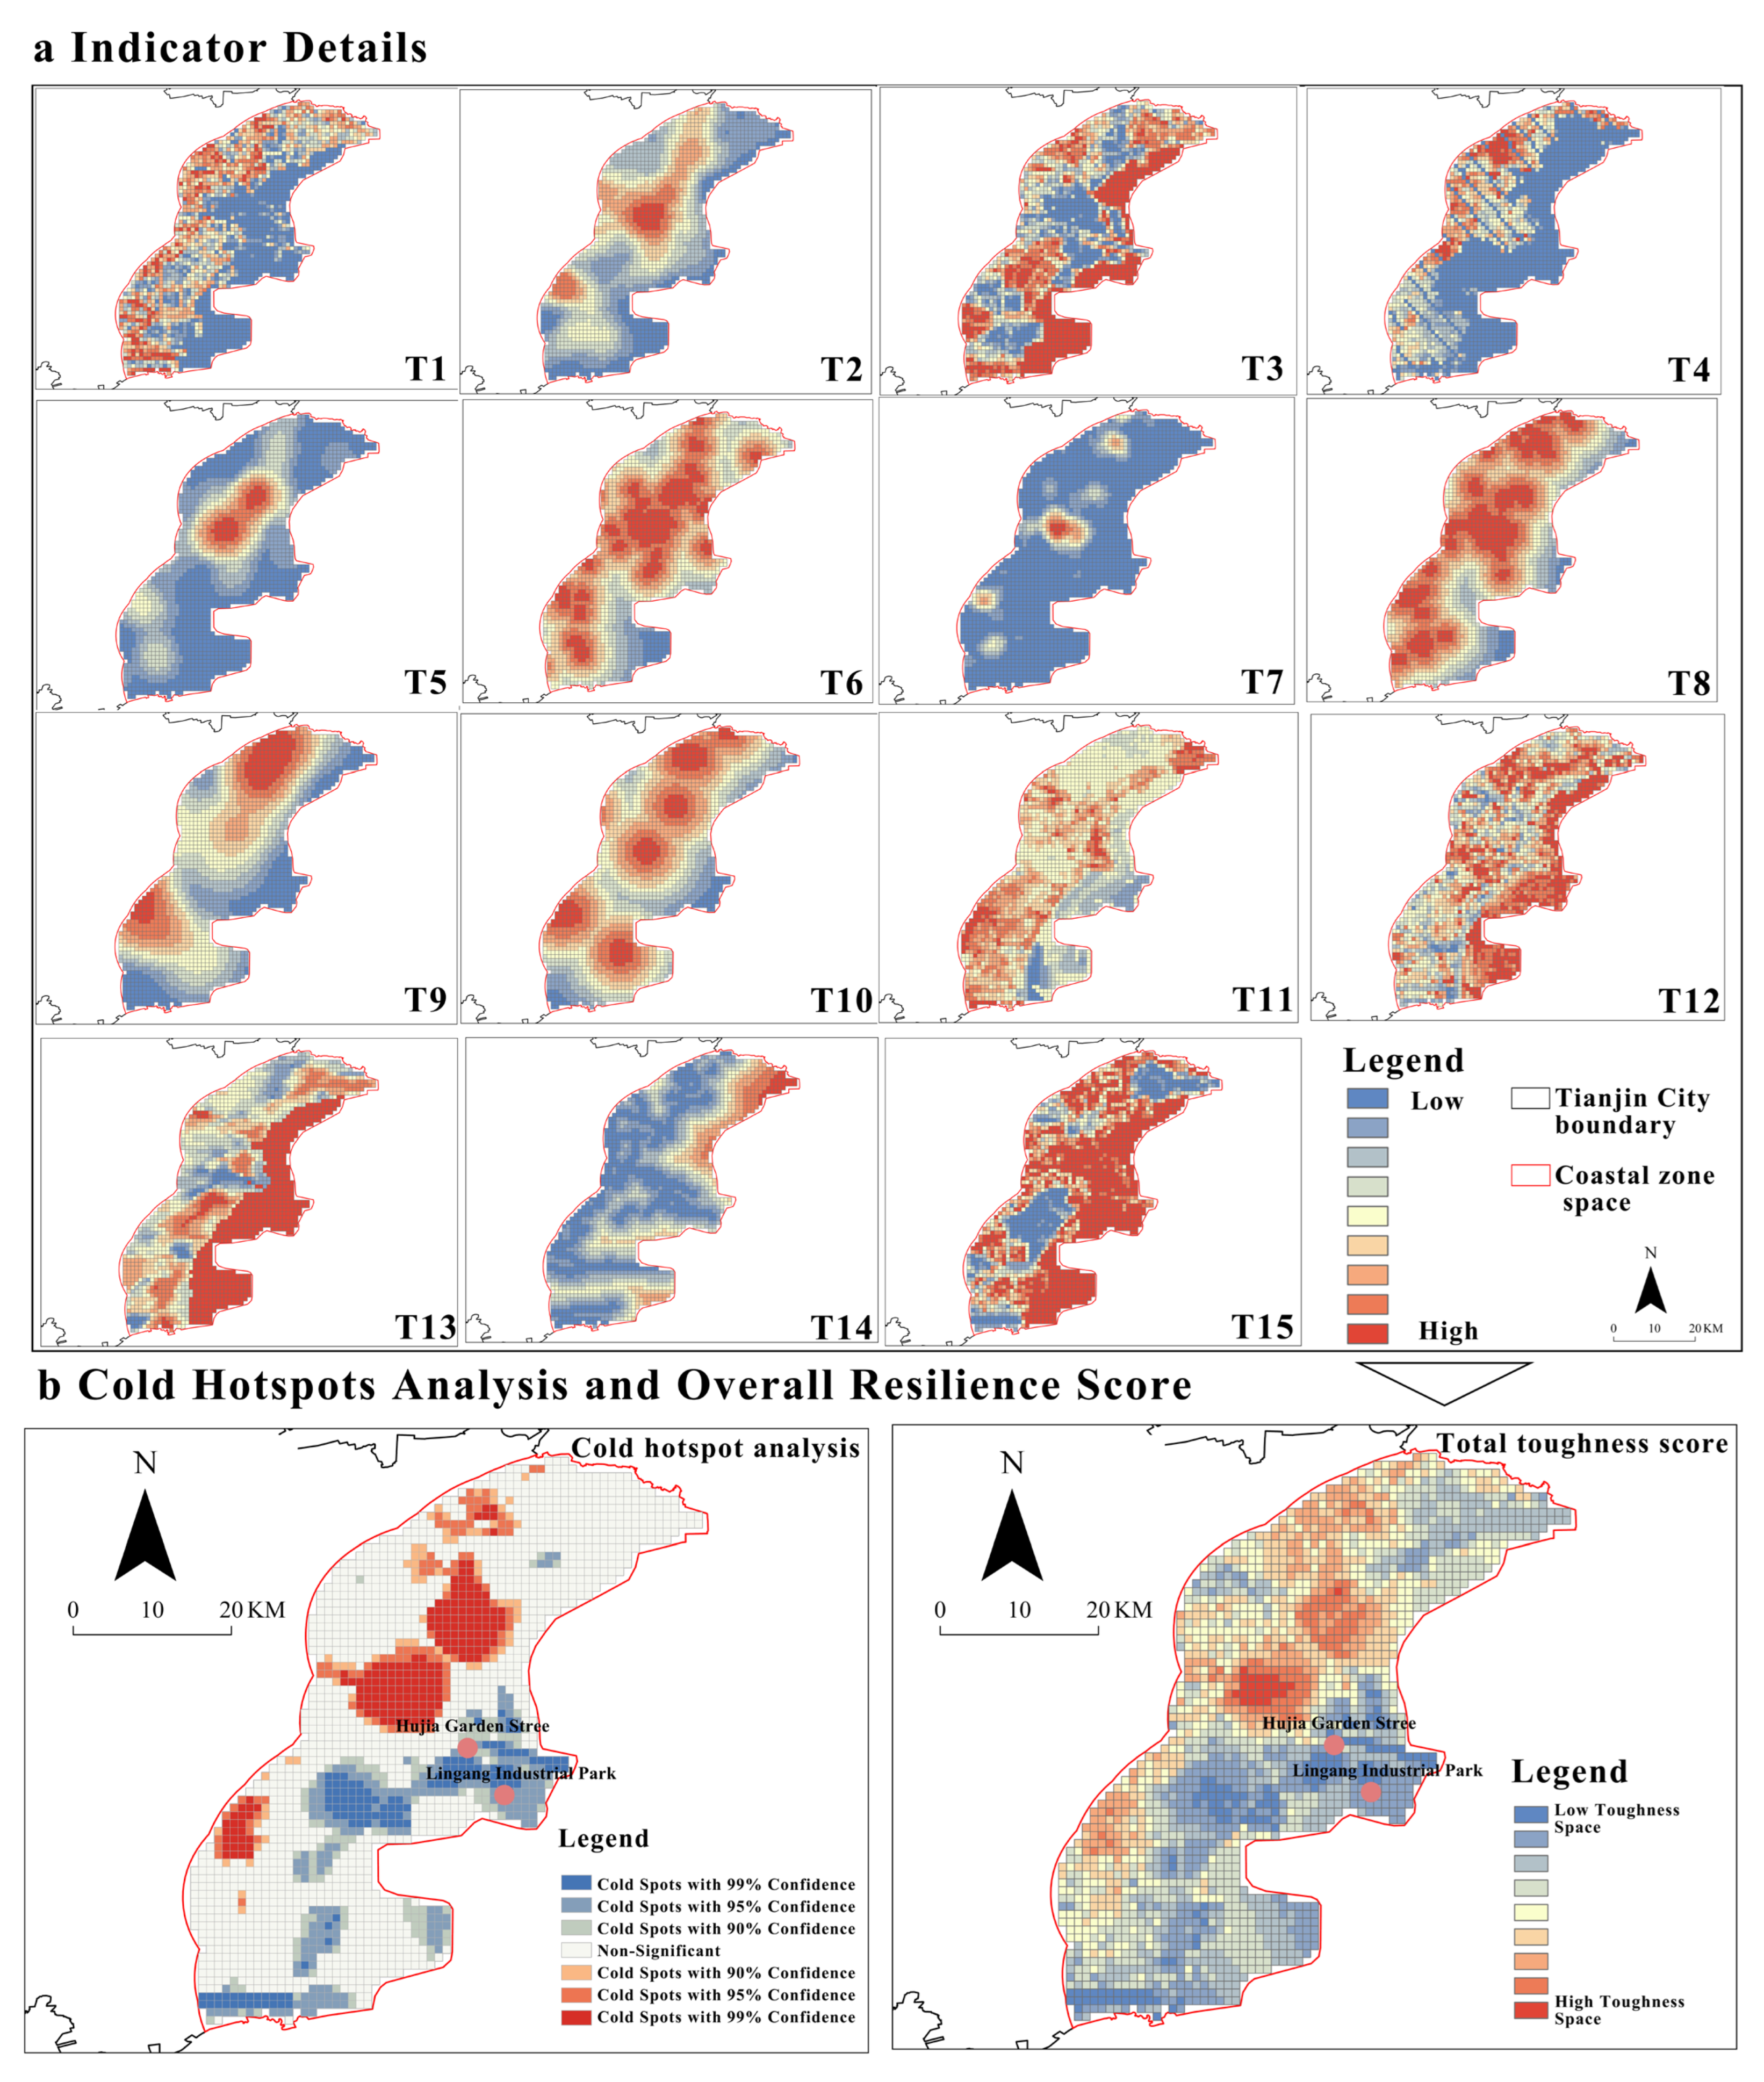
- Tianjin Coastal Resilience Spatial Distribution Characteristics and Hotspot Analysis
5.2.2. Shanwei City Coastal Resilience Evaluation
- (1)
- Shanwei City Coastal Resilience Indicator System Correlation and VIF
- (2)
- Shanwei City Coastal Resilience Indicator System Weighting
- (3)
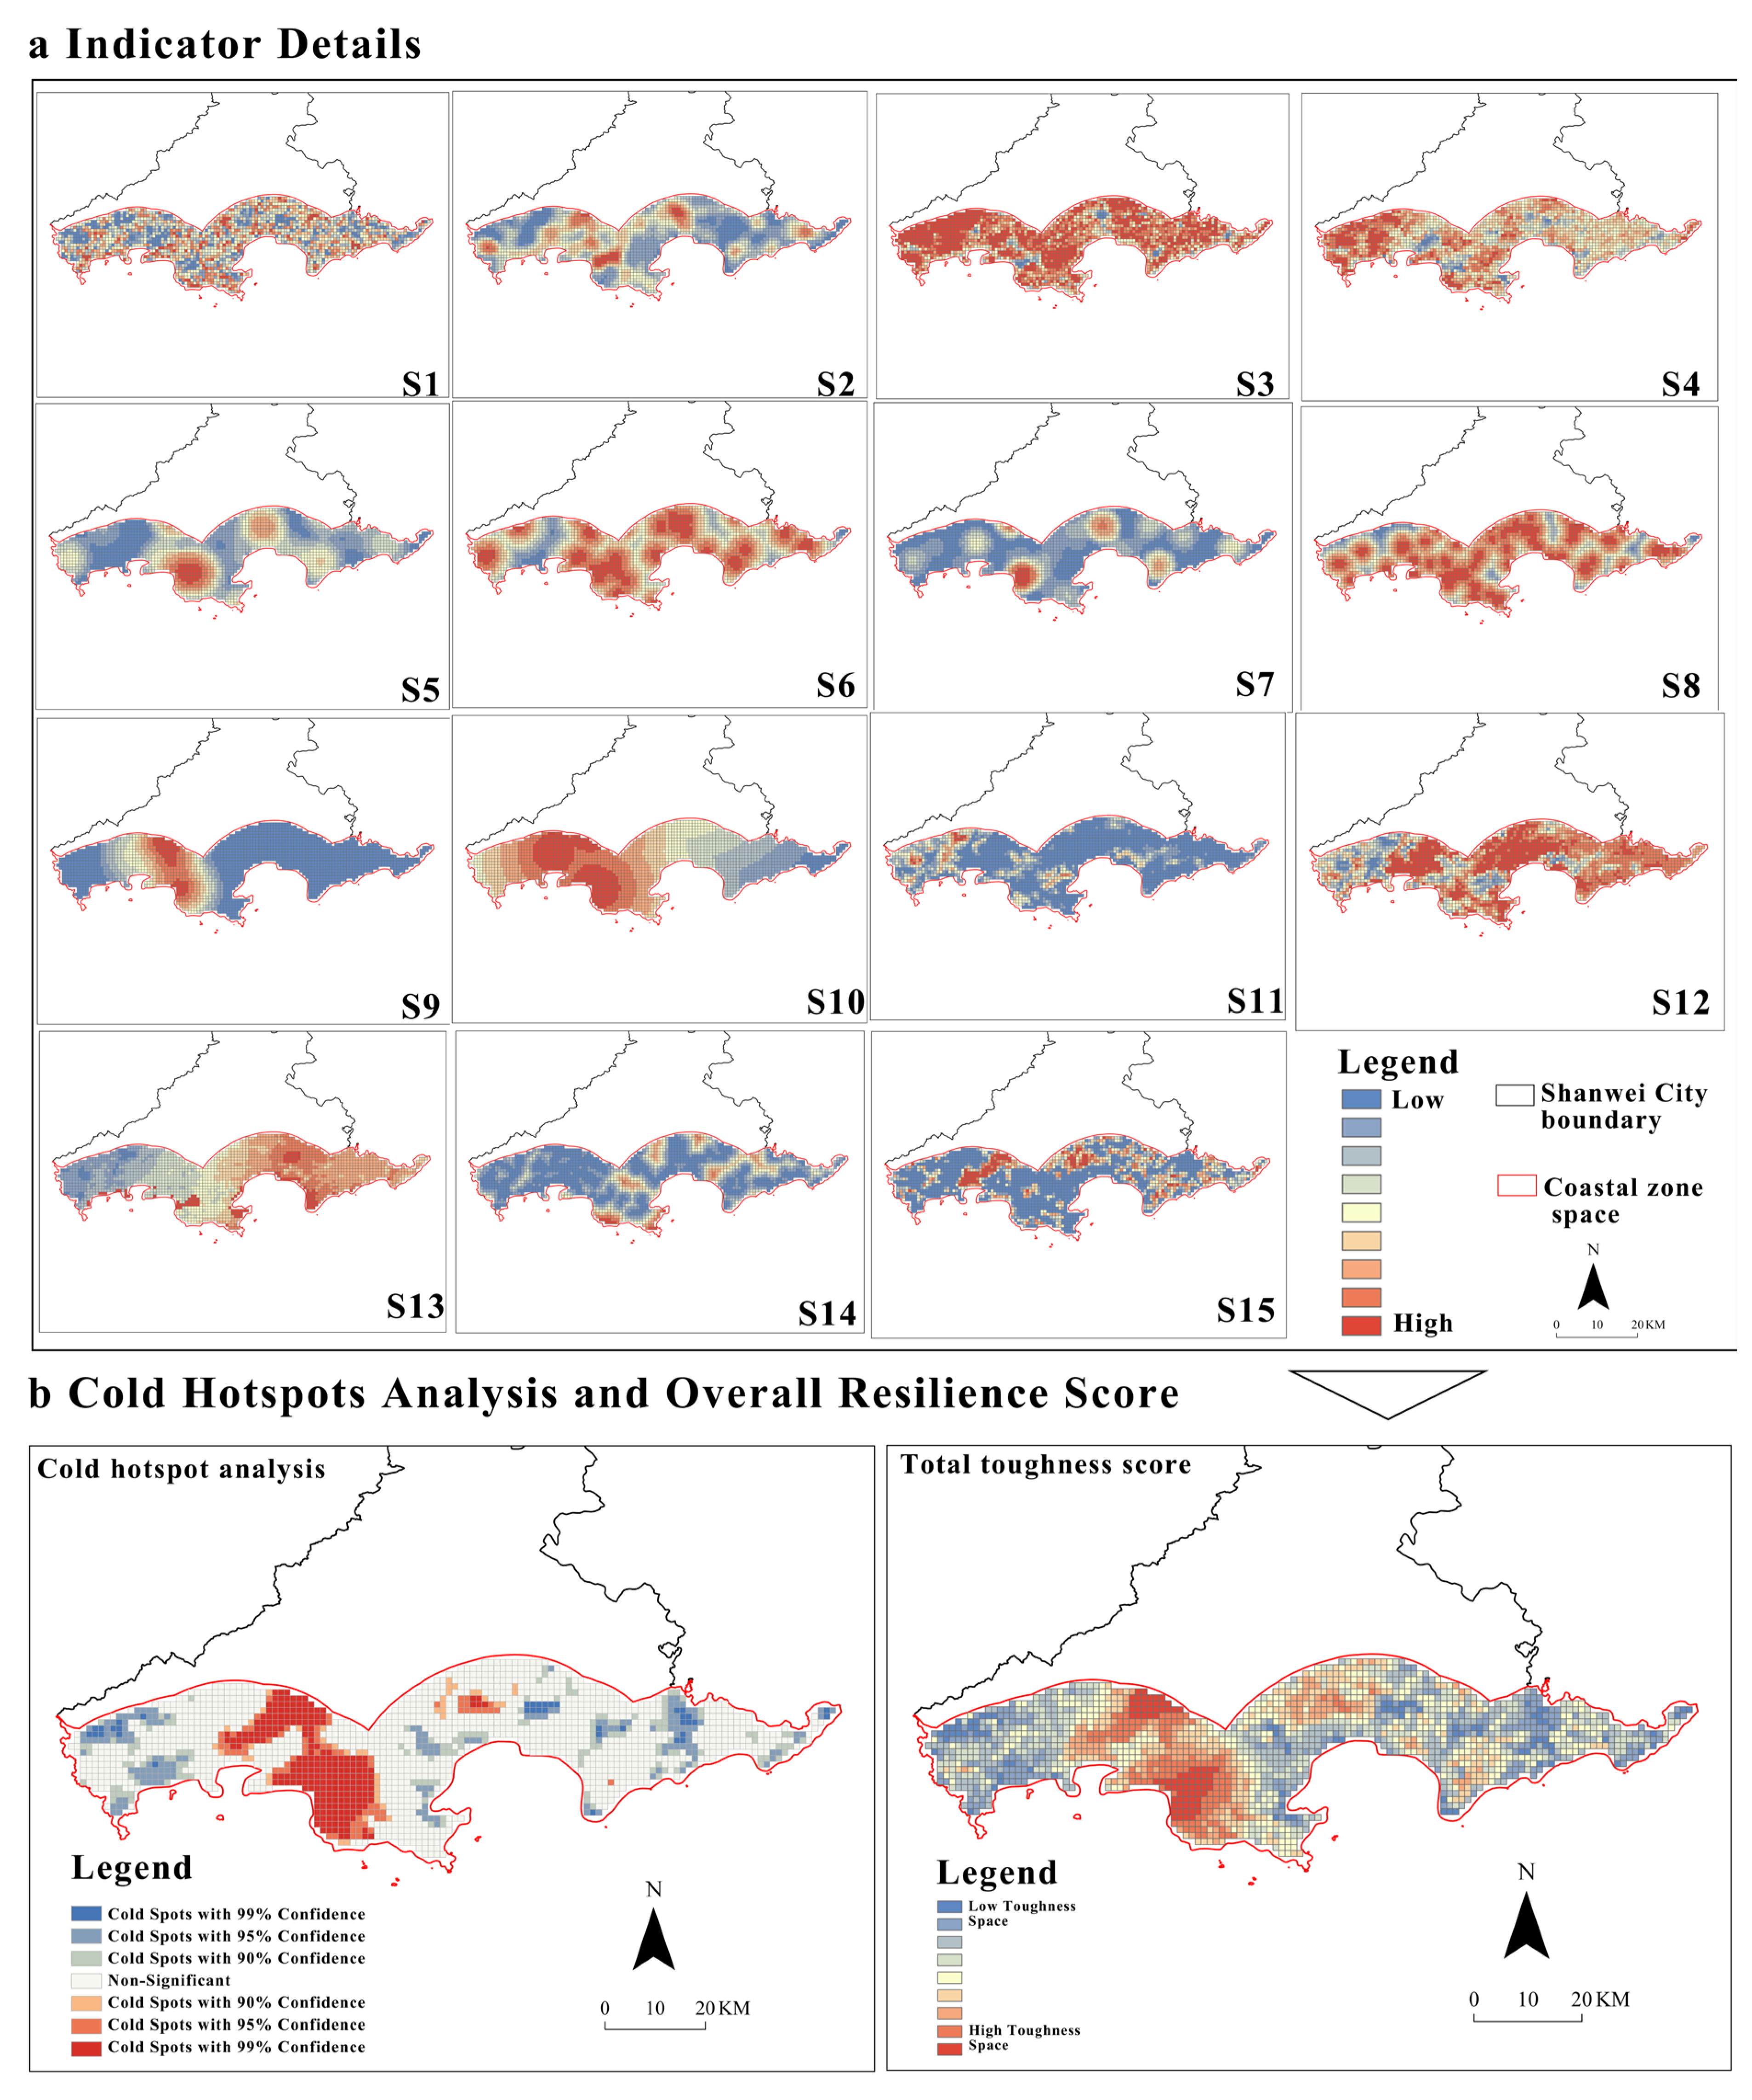
- Shanwei City Coastal Resilience Spatial Distribution and Hotspot Analysis
5.3. Impact Mechanisms
6. Discussion
6.1. Application of a Macro-Micro Resilience Evaluation Framework for Storm Surge Response
6.2. Coastal Resilience Spatial Characteristics and Differences
- (1)
- Analysis of Coastal Resilience Spatial Characteristics in Tianjin and Shanwei
- (2)
- Differences in Coastal Resilience Space between Tianjin and Shanwei
6.3. Resilience Enhancement Strategies
- (1)
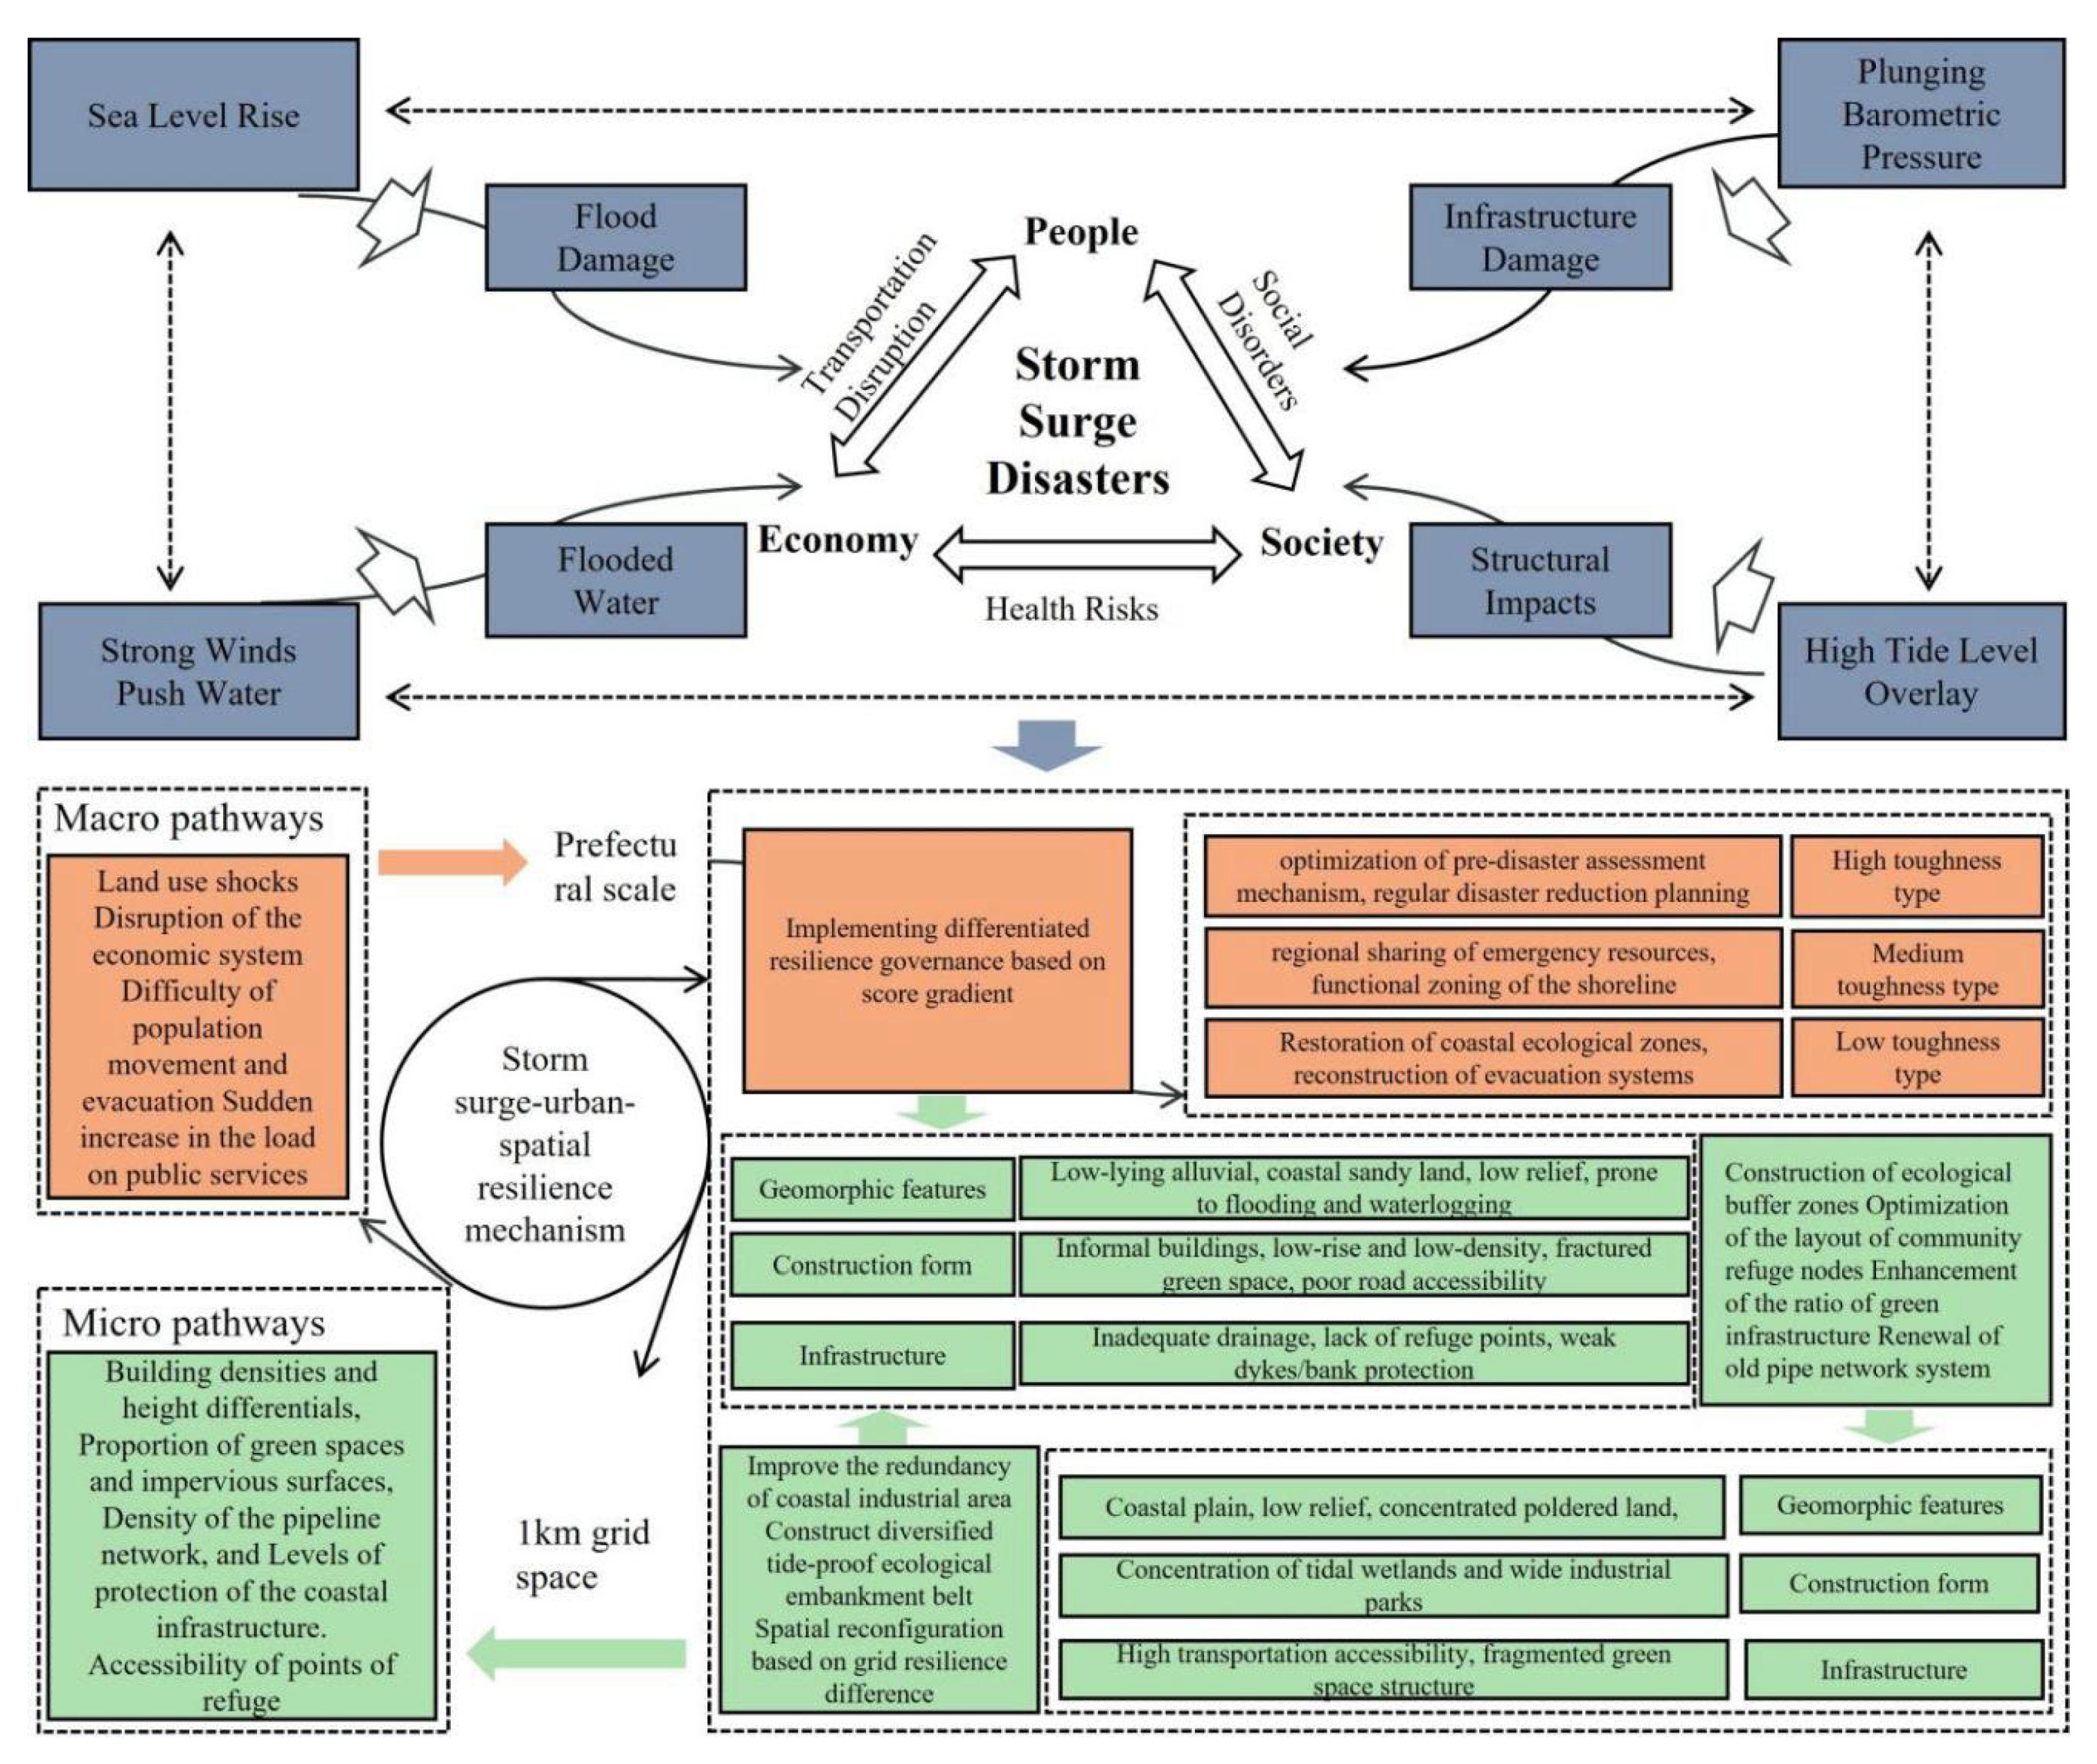
- “Macro-Micro” Systemic Enhancement Strategies
- (2)
- Differentiated Resilience Governance Strategies for Coastal Spaces
- (3)
- Precise Governance Strategies for Coastal Cities with Different Characteristics
- (4)
- Zone-based Strategies for “0–5 km, 5–10 km, and 10–15 km” Spatial Impact Zones
6.4. Limitations and Uncertainties
7. Conclusions
- (1)
- Key Findings
- (2)
- Drivers of Resilience
- (3)
- Governance Strategies
Author Contributions
Funding
Institutional Review Board Statement
Informed Consent Statement
Data Availability Statement
Conflicts of Interest
Appendix A
| Primary Dimension | Secondary Dimension | Indicator Name | Positive/Negative | ID | Indicator Explanation | Data Source |
|---|---|---|---|---|---|---|
| Exposure | Population Exposure | Population Density | - | A1 | Proportion of urban population to land area | National Bureau of Statistics, local statistical yearbooks |
| Aging Level | - | A2 | Urban population aging rate | |||
| Permanent Population Growth Rate | + | A3 | Expansion of exposed areas due to urban expansion | |||
| Spatial Exposure | Average Population Area in Built-up Zone | - | A4 | Proxy for urban spatial development level | Landsat imagery, Earth Explorer platform | |
| Proportion of Built-up Land | - | A5 | Proportion of built-up land to total urban land | |||
| Length of Ports and Dikes | + | A6 | Extent of coastal construction in the city | Coastal infrastructure data, GIS analysis | ||
| Coastline Length | - | A7 | Can be used for normalizing indicators like dikes | |||
| Proportion of Fishery Output | - | A8 | Represents coastal industry exposure | National Bureau of Statistics, local statistical yearbooks | ||
| Sensitivity | Traffic Infrastructure | Road Density | + | A9 | More densely packed roads lead to slower recovery after a disaster. | |
| Per Capita Road Area | + | A10 | Proportion of per capita road area, emergency response capacity | |||
| Drainage System | Drainage Pipe Network Density | + | A11 | Reflects urban drainage capacity | Local municipal data, water infrastructure | |
| Sewage Pipeline Density | + | A12 | Ground impermeability, reflecting flood risks | |||
| Runoff Coefficient | - | A13 | Reflects urban surface permeability | Water runoff data, China Meteorological Administration, local hydrology data | ||
| Medical Assistance | Medical and Health Beds per 10,000 People (Merged) | + | A14 | Disaster medical treatment capacity | National Bureau of Statistics, local statistical yearbooks | |
| Proportion of Unemployment Insurance Coverage | + | A15 | Disaster medical treatment capacity | Social insurance data, local labor department | ||
| Environmental Ecology | Vegetation Coverage Rate | + | A16 | Reflects natural water retention and buffering capacity | NDVI from Landsat imagery, Earth Explorer platform | |
| Economic Capacity | Per Capita GDP | + | A17 | Foundation for resource mobilization post-disaster | National Bureau of Statistics, local statistical yearbooks | |
| Per Capita Disposable Income | + | A18 | Household disaster resistance and recovery capacity | |||
| Proportion of Tertiary Industry in GDP | + | A19 | Higher resilience of light asset-based structures | |||
| Economic Growth Rate | + | A20 | Economic vitality indicator | |||
| Adaptation Capacity | Social Resources | Proportion of Young and Middle-aged Labor Force | + | A21 | Human recovery resources | |
| Proportion of Educated Population | + | A22 | Reflects knowledge acquisition and emergency response | |||
| Depth of Comprehensive Insurance | + | A23 | Total insurance expenditure/GDP | Insurance data, local finance department | ||
| Mobile Phone Users per 10,000 People | + | A24 | Information access and emergency communication capacity | Telecom data, mobile service providers | ||
| Policy and Governance | Disaster Reduction and Prevention Investment | + | A25 | Local financial emergency capacity | National Bureau of Statistics, local public financial data, disaster investment reports | |
| Proportion of Public Safety Expenditure | + | A26 | Investment in law enforcement and rescue systems | |||
| Proportion of Grain and Oil Reserves Expenditure | + | A27 | Disaster recovery material guarantees |
| Primary Dimension | Indicator Name | Positive/Negative | ID | Indicator Explanation | Data Source |
|---|---|---|---|---|---|
| Spatial Functional Structure | Mixed Land Use Diversity Index | + | T/S1 | The land use mix level reflects spatial resilience | Remote Sensing Data |
| Road Network Density | + | T/S2 | Reflects regional development intensity and traffic accessibility | Statistical Yearbooks and Government Public Data | |
| Surface Permeability Ratio | - | T/S3 | Higher surface permeability helps alleviate waterlogging. | Remote Sensing Data | |
| NDVI Green Space Ratio | + | T/S4 | An important component of ecological buffer zones can be extracted via remote sensing | ||
| Spatial Adaptation Capacity | Emergency Shelter Density (POI) | + | T/S5 | Core element of evacuation and resettlement capacity | Points of Interest and Basic Spatial Data |
| Emergency Shelter Distance | - | T/S6 | Shorter distance to shelters improves response efficiency. | ||
| Medical Facility Density | + | T/S7 | Reflects the supply capacity of medical resources during a disaster | ||
| Hospital Distance | - | T/S8 | Shorter distance to hospitals enables faster rescue response. | ||
| Firefighting Facility Density | + | T/S9 | Reflects the density of emergency rescue facilities | ||
| Firefighting Facility Distance | - | T/S10 | Shorter distance improves emergency response efficiency. | ||
| Natural Environment | Elevation | + | T/S11 | Higher elevation provides more safety, which can be obtained via remote sensing. | Remote Sensing Data |
| Terrain Roughness | - | T/S12 | More complex terrain makes drainage and construction more difficult. | ||
| Annual Precipitation | - | T/S13 | Higher precipitation increases waterlogging and secondary disaster risks. | Meteorological and Hydrological Data | |
| Distance to River | + | T/S14 | Areas closer to rivers are more vulnerable to storm surge impact. | Remote Sensing Data | |
| Landscape Pattern | LSI Landscape Index | - | T/S15 | More complex boundaries make the system less stable. | Remote Sensing Data |
| Patch Density (PD) | - | T/S16 | More scattered patches indicate higher ecological fragmentation. | ||
| AI Aggregation Index | + | T/S17 | Higher aggregation indicates better ecological connectivity. | ||
| Patch Cohesion Index (COHESION) | + | T/S18 | Tighter connections between patches enhance overall resilience. |
References
- Deng, C.; Tu, S.; Gao, G.; Xu, J. Effects of Tropical Cyclone Intensity on Spatial Footprints of Storm Surges: An Idealized Numerical Experiment. Environ. Res. Lett. 2024, 19, 094002. [Google Scholar] [CrossRef]
- Xie, L.; Zhang, Z.K. Study on the Relationship Between Intensity, Spatial-Temporal Distribution of Storm Surges and Disaster Losses Along the Coast of China in Past 20 Years. Mar. Sci. Bull. 2010, 29, 690–696. [Google Scholar]
- Shi, X.; Zhang, Y.; Liu, S.; Yang, L.; Yu, L.; Zhang, Y.; Tian, Z. Mapping Storm Surge Risk at County Level in Coastal Areas of China. J. Mar. Sci. Eng. 2025, 13, 427. [Google Scholar] [CrossRef]
- Wang, G.; Zhang, K. Turning Peril into Opportunity: Construction and Validation of a Resilience Assessment System for China’s Coastal Megacities. Sustain. Cities Soc. 2024, 112, 105606. [Google Scholar] [CrossRef]
- Ying, C.; Liu, Y.; Li, J.; Zhong, J.; Chen, Y.; Ai, S.; Gong, H. Evolution and Influencing Factors of Coastal Resilience in the East China Sea. Sci. Total Environ. 2024, 944, 173841. [Google Scholar] [CrossRef]
- Chen, F.; Xu, H.; Dai, S.; Rao, Y. The Resilience of Coastal Urban Destinations to Typhoons: Insights from a System–Agent–Institution Framework. J. Sustain. Tour. 2024, 1–22. [Google Scholar] [CrossRef]
- Jayakody, R.C.; Amaratunga, D. Guiding Factors for Planning Public Open Spaces to Enhance Coastal Cities’ Disaster Resilience to Tsunamis. Int. J. Disaster Resil. Built Environ. 2021, 12, 471–483. [Google Scholar] [CrossRef]
- Ying, C.; Li, J.; Liu, Y.; Tian, P.; Zhang, H.; Gong, H. The Spatiotemporal Evolution and Influencing Factors of Resilience of County-Level Cities in The East China Sea Coastal Zone Based on “Background-Operation-Efficiency”. Acta Geogr. Sin. 2024, 79, 462–483. [Google Scholar]
- Herrmann-Lunecke, M.G.; Villagra, P. Community Resilience and Urban Planning in Tsunami-Prone Settlements in Chile. Disasters 2020, 44, 103–124. [Google Scholar] [CrossRef]
- Tian, S.; Zhang, K.; Chi, Y.; Lian, Y. Assessing Storm Surge Compound Disasters Risk:A Case Study of the Coastal Area of Qingdao. Ocean Coast. Manag. 2025, 262, 107593. [Google Scholar] [CrossRef]
- Tang, D.; Li, J.; Zhao, Z.; Boamah, V.; Lansana, D.D. The Influence of Industrial Structure Transformation on Urban Resilience Based on 110 Prefecture-Level Cities in the Yangtze River. Sustain. Cities Soc. 2023, 96, 104621. [Google Scholar] [CrossRef]
- Zhao, R.; Fang, C.; Liu, J.; Zhang, L. The Evaluation and Obstacle Analysis of Urban Resilience from The Multidimensional Perspective in Chinese Cities. Sustain. Cities Soc. 2022, 86, 104160. [Google Scholar] [CrossRef]
- Sippel, L.M.; Pietrzak, R.H.; Charney, D.S.; Mayes, L.C.; Southwick, S.M. How Does Social Support Enhance Resilience in the Trauma-Exposed Individual? Ecol. Soc. 2015, 20. [Google Scholar] [CrossRef]
- Cutter, S.L.; Burton, C.G.; Emrich, C.T. Disaster Resilience Indicators for Benchmarking Baseline Conditions. J. Homel. Secur. Emerg. Manag. 2008, 7. [Google Scholar] [CrossRef]
- Meerow, S.; Newell, J.P.; Stults, M. Urban Resilience for Whom, What, When, Where, and Why? Urban Geogr. 2019, 40, 309–329. [Google Scholar] [CrossRef]
- Intergovernmental Panel on Climate Change (IPCC). Climate change 2022: Impacts, adaptation and vulnerability. In Working Group II contribution to the Sixth Assessment Report of the Intergovernmental Panel on Climate Change (Annex II: Glossary); Cambridge University Press: Cambridge, UK, 2022. [Google Scholar] [CrossRef]
- Li, R.; Xu, C.; Li, Y.; Hu, H. Research Progress on Coastal Resilience Abroad and its Implications for China. Resour. Sci. 2022, 44, 232–246. [Google Scholar]
- Han, S.; Wang, B.; Ao, Y.; Bahmani, H.; Chai, B. The Coupling and Coordination Degree of Urban Resilience Systand A Case Study of the Chengdu–Chongqing Urban Agglomeration. Environ. Impact Assess. Rev. 2023, 101, 107145. [Google Scholar] [CrossRef]
- Wang, S.; Cui, Z.; Lin, J.; Xie, J.; Su, K. The Coupling Relationship Between Urbanization and Ecological Resilience in the Pearl River Delta. J. Geogr. Sci. 2022, 32, 44–64. [Google Scholar] [CrossRef]
- Quinlan, A.E.; Berbés-Blázquez, M.; Haider, L.J.; Peterson, G.D. Measuring and Assessing Resilience: Broadening Understanding Through Multiple Disciplinary Perspectives. J. Appl. Ecol. 2016, 53, 677–687. [Google Scholar] [CrossRef]
- Jiao, L.; Wang, L.; Lu, H.; Yi, F.; Zhang, Y.; Wu, Y. An assessment model for urban resilience based on the pressure-state-response framework and BP-GA neural network. Urban Clim. 2023, 49, 101543. [Google Scholar] [CrossRef]
- Ingrisch, J.; Bahn, M. Towards a Comparable Quantification of Resilience. Trends Ecol. Evol. 2018, 33, 251–259. [Google Scholar] [CrossRef] [PubMed]
- Zhao, M.Y.; Yang, Y.C.; Wang, B. Evaluation and Spatio-Temporal Analysis of Urban Resilience in Guangdong Province. J. Lanzhou Univ. Nat. Sci. 2022, 58, 412–419. [Google Scholar]
- Sun, H.; Li, M.; Jiang, H.; Ruan, X.; Shou, W. Inundation Resilience Analysis of Metro-Network from a Complex System Perspective Using the Grid Hydrodynamic Model and Fbwm Approach: A Case Study of Wuhan. Remote Sens. 2022, 14, 3451. [Google Scholar] [CrossRef]
- Zhang, J.; Zhang, M.; Li, G. Multi-Stage Composition of Urban Resilience and the Influence of Pre-Disaster Urban Functionality on Urban Resilience. Nat. Hazards 2021, 107, 447–473. [Google Scholar] [CrossRef]
- Liu, L.; Lei, Y. Study on Resilience Changes and Influencing Factors in China’s Provincial Capital Cities. Sci. Technol. Econ. 2022, 35, 1–5. [Google Scholar] [CrossRef]
- United Nations Office for Disaster Risk Reduction. (25 August 2021). Disaster Resilience Scorecard for Cities. Making Cities Resilient 2030(Mcr2030). Available online: https://mcr2030.undrr.org/disaster-resilience-scorecard-cities (accessed on 22 May 2025).
- United Nations Office for Disaster Risk Reduction. Sendai Framework for Disaster Risk Reduction 2015–2030. Undrr. 2015. Available online: https://www.Undrr.Org/Publication/Sendai-Framework-Disaster-Risk-Reduction-2015–2030 (accessed on 22 May 2025).
- Fu, X.; Hou, J.; Liu, Q.; Li, M.; Liang, S. Evaluation of Surge Hazard Based on a Storm Surge Hazard Indicator Along the Mainland Coast of China. Nat. Hazards 2023, 116, 3481–3493. [Google Scholar] [CrossRef]
- Long, M.; Zhou, S.; Wei, L.; Liu, B.; Zhang, X.N. A Refined Storm Surge Forecasting Model for the Guangdong–Hong Kong–Macao Greater Bay Area Based on the Adcirc Model. Water Power Energy Sci. 2022, 40, 91–94. [Google Scholar] [CrossRef]
- Shi, X.W.; Gao, T.; Tan, J.; Guo, Z.X. Research on occurrence frequency of storm surge disaster distribution in the coastal areas of China. J. Catastrophol. 2018, 33, 49–55. [Google Scholar]
- Peek, K.M.; Young, R.S. Understanding the Controls on Storm Surge Through the Building of a National Storm Surge Database. J. Coast. Res. 2013, 29, 17–24. [Google Scholar] [CrossRef]
- Meng, D.; Liu, Y.; Wang, Z.; Yang, X.; Liu, X.; Zhang, J.; Gao, K. Decreasing Vulnerability of Storm Surge Disasters in Coastal Cities of China over the Past 30 Years. J. Mar. Sci. Eng. 2023, 11, 128. [Google Scholar] [CrossRef]
- Nagargoje, S.V.; Patil, S.G. Overview of Urban Vulnerability and Resilience Frameworks. In International Conference on Sustainable Built Environment; Springer Nature: Singapore, 2023; pp. 315–333. [Google Scholar]
- Bulkeley, H.; Tuts, R. Understanding Urban Vulnerability, Adaptation and Resilience in the Context of Climate Change. Local Environ. 2013, 18, 646–662. [Google Scholar] [CrossRef]
- Lu, S.; Wang, B.; Xin, M.; Wang, J.; Gu, X.; Lian, M.; He, M. Insights into the Spatiotemporal Occurrence and Mixture Risk Assessment of Household and Personal Care Products in the Waters from Rivers to Laizhou Bay, Southern Bohai Sea. Sci. Total Environ. 2022, 810, 152290. [Google Scholar] [CrossRef] [PubMed]
- Wang, Y.; Shu, J.; Yuan, Y. Navigating Urban Risks for Sustainability: A Comprehensive Evaluation of Urban Vulnerability Based on a Pressure–Sensitivity–Resilience Framework. Sustain. Cities Soc. 2024, 117, 105961. [Google Scholar] [CrossRef]
- Liu, Y.; Gao, Y.; Fu, Y.; Xu, Z.; Li, Q.; Wang, H. A Framework of Ecological Sensitivity Assessment for the Groundwater System in the Mi River Basin, Eastern China. Environ. Earth Sci. 2023, 82, 334. [Google Scholar] [CrossRef]
- Mercado, V.T.; Malvárez, G.; Alburquerque, F.; Navas, F. Impact of the changing economic models in the development of societal and environmental structures of coastal natural parks. J. Coast. Res. 2009, 1247–1251. [Google Scholar]
- Segnon, A.C.; Magassa, M.; Obossou, E.A.R.; Partey, S.T.; Houessionon, P.; Zougmoré, R.B. Gender Vulnerability Assessment to Inform Gender-Sensitive Adaptation Action: A Case Study in Semi-Arid Areas of Mali. Front. Clim. 2024, 6, 1418015. [Google Scholar] [CrossRef]
- Lu, Y.; Zhai, G.; Zhou, S.; Shi, Y. Risk Reduction Through Urban Spatial Resilience: A Theoretical Framework. Hum. Ecol. Risk Assess. Int. J. 2021, 27, 921–937. [Google Scholar] [CrossRef]
- Chen, X.; Quan, R. A Spatiotemporal Analysis of Urban Resilience to the COVID-19 Pandemic in the Yangtze River Delta. Nat. Hazards 2021, 106, 829–854. [Google Scholar] [CrossRef] [PubMed]
- Meng, P.; Song, X.; Li, L.; Fu, C.; Wang, L.; Wei, W. Risk Assessment of Flood Disasters in the Loess Plateau Using the Hazard-Sensitivity-Vulnerability-Recoverability Framework. Int. J. Disaster Risk Reduct. 2025, 120, 105379. [Google Scholar] [CrossRef]
- Sorge, S.; Mann, C.; Schleyer, C.; Loft, L.; Spacek, M.; Hernández-Morcillo, M.; Kluvankova, T. Understanding Dynamics of Forest Ecosystem Services Governance:A Socio-Ecological-Technical-Analytical Framework. Ecosyst. Serv. 2022, 55, 101427. [Google Scholar] [CrossRef]
- Cutter, S.L.; Emrich, C.T.; Webb, J.J.; Morath, D. Social Vulnerability to Climate Variability Hazards: A Review of the Literature. Final. Rep. Oxfam Am. 2009, 5, 1–44. [Google Scholar]
- Chen, B.; He, J.; He, Z.; Li, L.; Chen, Q.; Li, F.; Yang, X. Potential Impacts of Storm Surge-Induced Flooding Based on Refined Exposure Estimation: A Case Study in Zhoushan Island, China. Geomat. Nat. Hazards Risk 2023, 14, 2232080. [Google Scholar] [CrossRef]
- Yu, H.; Shen, Y.; Kelly, R.M.; Qi, X.; Wu, K.; Li, S.; Bao, X. Trends in Social Vulnerability to Storm Surges in Shenzhen, China. Nat. Hazards Earth Syst. Sci. 2020, 20, 2447–2462. [Google Scholar] [CrossRef]
- Li, K.; Li, G.S. Vulnerability Assessment of Storm Surges in the Coastal Area of Guangdong Province. Nat. Hazards Earth Syst. Sci. 2011, 11, 2003–2010. [Google Scholar] [CrossRef]
- Abdrabo, K.I.; Kantoush, S.A.; Esmaiel, A.; Saber, M.; Sumi, T.; Almamari, M.; Ghoniem, S. An integrated indicator-based approach for constructing an urban flood vulnerability index as an urban decision-making tool using the PCA and AHP techniques: A case study of Alexandria, Egypt. Urban. Clim. 2023, 48, 101426. [Google Scholar] [CrossRef]
- Liu, X.; Liu, Y.; Wang, Z.; Yang, X.; Zeng, X.; Meng, D. Comprehensive assessment of vulnerability to storm surges in coastal China: Towards a prefecture-level cities perspective. Remote Sens. 2023, 15, 4828. [Google Scholar] [CrossRef]
- Bathi, J.R.; Das, H.S. Vulnerability of coastal communities from storm surge and flood disasters. Int. J. Environ. Res. Public Health 2016, 13, 239. [Google Scholar] [CrossRef]
- Kärrholm, M.; Nylund, K.; De La Fuente, P.P. Spatial Resilience and Urban Planning: Addressing the Interdependence of Urban Retail Areas. Cities 2014, 36, 121–130. [Google Scholar] [CrossRef]
- Lu, Y.; Zhai, G.; Zhai, W. Quantifying Urban Spatial Resilience Using Multi-Criteria Decision Analysis(Mcda)And Back Propagation Neural Network(Bpnn). Int. J. Disaster Risk Reduct. 2024, 111, 104694. [Google Scholar] [CrossRef]
- Sllen, C.R.; Angeler, D.G.; Cumming, G.S.; Folke, C.; Twidwell, D.; Uden, D.R. Quantifying Spatial Resilience. J. Appl. Ecol. 2016, 53, 625–635. [Google Scholar] [CrossRef]
- Zhang, H.; Li, B.; Lu, X. Remote Sensing-Based Urban Resilience Assessment in Coastal Areas Affected by Storm Surges. J. Coast. Res. 2020, 36, 1121–1132. [Google Scholar]
- Yang, W.; Xu, F. Socio-Economic Vulnerability of Coastal Cities to Storm Surges: A Case Study of Tianjin, China. Environ. Hazards 2021, 20, 101–114. [Google Scholar]
- Wang, S.; Li, Q.; Li, Y. Impact of Storm Surge Events on Coastal Cities in China: A Study Based on Meteorological and Hydrological Data. Sci. Total Environ. 2019, 692, 1353–1365. [Google Scholar]
- Liu, P.; Chen, Y.; Chen, L. Urban Disaster Resilience: A Case Study of Storm Surge Impacts in Xiamen, China. Nat. Hazards Rev. 2018, 19, 04018028. [Google Scholar]
- Chen, X.; Zhang, L. Ecological Resilience in Coastal Cities: Assessing Ecosystem Services and Wetland Protection in the Context of Storm Surges. Environ. Sci. Policy 2020, 109, 95–107. [Google Scholar]
- Liu, J.; Chen, Z. Residents’ Preparedness for Storm Surges in Coastal Cities: A Case Study Based on Field Surveys. J. Environ. Manag. 2021, 287, 112253. [Google Scholar]
- Fokkens, B. The Dutch strategy for safety and river flood prevention. In Extreme Hydrological Events: New Concepts for Security; Springer: Dordrecht, The Netherlands, 2007; pp. 337–352. [Google Scholar]
- Rosenzweig, C.; Solecki, W.D. Climate Change and the Future of New York City: Resilience Strategies in the Face of Extreme Weather. Environ. Sci. Policy 2018, 88, 215–222. [Google Scholar]
- City of New York, Mayor’s Office of Recovery and Resiliency. A Stronger, More Resilient New York: A Report by the Mayor’s Office of Recovery and Resiliency; City of New York, Mayor’s Office of Recovery and Resiliency: New York, NY, USA, 2013; Available online: https://www.nyc.gov/site/sirr/report/report.page (accessed on 11 June 2013).
- Purnomo, A.H.; Kurniawan, T.; Farandy, A.R.; Apriliani, T.; Imron, M.; Sajise, A.J. Revisiting the climate change adaptation strategy of Jakarta’s coastal communities. Ocean. Coast. Manag. 2024, 253, 107112. [Google Scholar] [CrossRef]
- Porio, E.; See, J. Manila: Aspiring to be an inclusive, resilient, and sustainable city amidst climate and disaster risk. In Routledge Handbook of Asian Cities; Routledge: London, UK, 2023; pp. 392–404. [Google Scholar]




| Sorting | City | Resilience Score | Sorting | City | Resilience Score | Sorting | City | Resilience Score |
|---|---|---|---|---|---|---|---|---|
| 1 | Guangzhou | 0.60 | 19 | Rizhao | 0.31 | 37 | Tangshan | 0.27 |
| 2 | Shenzhen | 0.49 | 20 | Sanya | 0.31 | 38 | Qinhuangdao | 0.26 |
| 3 | Shanghai | 0.48 | 21 | Zhongshan | 0.31 | 39 | Jiaxing | 0.26 |
| 4 | Zhuhai | 0.46 | 22 | Jiangmen | 0.31 | 40 | Yancheng | 0.26 |
| 5 | Dongguan | 0.40 | 23 | Quanzhou | 0.31 | 41 | Shantou | 0.26 |
| 6 | Danzhou | 0.39 | 24 | Wenzhou | 0.30 | 42 | Jieyang | 0.26 |
| 7 | Dalian | 0.38 | 25 | Shantou | 0.30 | 43 | Beihai | 0.26 |
| 8 | Haikou | 0.37 | 26 | Putian | 0.30 | 44 | Maoming | 0.25 |
| 9 | Tianjin | 0.36 | 27 | Yangjiang | 0.29 | 45 | Dandong | 0.25 |
| 10 | Qingdao | 0.35 | 28 | Lianyungang | 0.29 | 46 | Cangzhou | 0.25 |
| 11 | Xiamen | 0.35 | 29 | Fangchenggang | 0.29 | 47 | Panjin | 0.25 |
| 12 | Ningbo | 0.34 | 30 | Nantong | 0.28 | 48 | Huludao | 0.25 |
| 13 | Chaozhou | 0.34 | 31 | Zhangzhou | 0.28 | 49 | Jinzhou | 0.25 |
| 14 | Yantai | 0.34 | 32 | Weihai | 0.28 | 50 | Ningde | 0.24 |
| 15 | Zhoushan | 0.33 | 33 | Binzhou | 0.28 | 51 | Yingkou | 0.24 |
| 16 | Fuzhou | 0.32 | 34 | Taizhou | 0.27 | 52 | Qinzhou | 0.23 |
| 17 | Huizhou | 0.32 | 35 | Weifang | 0.27 | |||
| 18 | Dongying | 0.31 | 36 | Zhanjiang | 0.27 |
Disclaimer/Publisher’s Note: The statements, opinions and data contained in all publications are solely those of the individual author(s) and contributor(s) and not of MDPI and/or the editor(s). MDPI and/or the editor(s) disclaim responsibility for any injury to people or property resulting from any ideas, methods, instructions or products referred to in the content. |
© 2025 by the authors. Licensee MDPI, Basel, Switzerland. This article is an open access article distributed under the terms and conditions of the Creative Commons Attribution (CC BY) license (https://creativecommons.org/licenses/by/4.0/).
Share and Cite
Cui, S.; Zhu, L.; Wang, J.; Defilla, S. Multi-Scale Resilience Assessment and Zonal Strategies for Storm Surge Adaptation in China’s Coastal Cities. Land 2025, 14, 2178. https://doi.org/10.3390/land14112178
Cui S, Zhu L, Wang J, Defilla S. Multi-Scale Resilience Assessment and Zonal Strategies for Storm Surge Adaptation in China’s Coastal Cities. Land. 2025; 14(11):2178. https://doi.org/10.3390/land14112178
Chicago/Turabian StyleCui, Shibai, Li Zhu, Jiaxiang Wang, and Steivan Defilla. 2025. "Multi-Scale Resilience Assessment and Zonal Strategies for Storm Surge Adaptation in China’s Coastal Cities" Land 14, no. 11: 2178. https://doi.org/10.3390/land14112178
APA StyleCui, S., Zhu, L., Wang, J., & Defilla, S. (2025). Multi-Scale Resilience Assessment and Zonal Strategies for Storm Surge Adaptation in China’s Coastal Cities. Land, 14(11), 2178. https://doi.org/10.3390/land14112178


