Article

From “Policy-Driven” to “Park Clustering”: Evolution and Attribution of Location Selection for Pollution-Intensive Industries in the Beijing–Tianjin–Hebei Urban Agglomeration

School of Natural Resources, Faculty of Geographical Science, Beijing Normal University, Beijing 100875, China
*
Author to whom correspondence should be addressed.
Land 2025, 14(11), 2103; https://doi.org/10.3390/land14112103
Submission received: 12 September 2025 / Revised: 20 October 2025 / Accepted: 21 October 2025 / Published: 22 October 2025

Abstract

Pollution-intensive industries (PIIs) generate substantial economic benefits while posing serious environmental challenges, making the optimization of their spatial distribution a critical issue for sustainable development. Understanding the spatiotemporal dynamics behind PII location patterns is essential for effective land-use planning and industrial policy. This study investigates the location patterns of newly established PIIs in the Beijing–Tianjin–Hebei urban agglomeration of China between 2007 and 2019. By integrating principal component analysis with a geographically and temporally weighted regression model, the research explores how key drivers influence PII distribution across both spatial and temporal dimensions. The results indicate that government intervention has historically been the most significant factor shaping PII distribution, although its influence has gradually declined due to increasing marketization and technological progress. PIIs are more likely to cluster in areas with moderate levels of economic development, as both very high and very low development levels tend to discourage agglomeration. Over time, improvements in infrastructure, transportation and market conditions have enabled PIIs to overcome geographical constraints. Moreover, industrial parks have emerged as a critical factor by offering cost-efficiency and resource optimization, thereby attracting new PII investment. These findings underscore the importance of accounting for spatiotemporal heterogeneity when analyzing industrial distribution. The study provides policy-relevant insights into industrial land-use planning, highlighting the need for differentiated land supply strategies and the strategic development of industrial parks. It also offers useful references for other developing countries facing similar challenges amid the ongoing restructuring of global manufacturing.

1. Introduction

Pollution-intensive industries (PIIs) have long played a key role in industrialization and economic growth by creating employment opportunities and generating substantial economic benefits [1]. However, the spatial agglomeration of PIIs also results in severe environmental consequences, including resource depletion and pollutant emissions [2,3,4]. As global manufacturing patterns undergo significant transformation, balancing environmental sustainability with continued economic development has become a central policy challenge. Addressing this dual objective requires a more comprehensive understanding of the factors and mechanisms that shape the spatial distribution of PIIs.
A growing body of literature has explored the determinants of PII distribution from multiple perspectives. Early studies primarily focused on the roles of economic development, transportation infrastructure, and geographical characteristics in shaping industrial location [5,6,7]. These works align with classical industrial location theories and new economic geography, emphasizing cost minimization, accessibility, and agglomeration economies. As environmental challenges intensified, scholars increasingly examined how environmental regulation affects industrial geography through frameworks such as the pollution hypothesis and the Porter hypothesis [8,9,10]. More recent studies have shifted toward understanding how institutional arrangements, land-use policies, and marketization interact with environmental regulation, emphasizing the spatial role of industrial parks as key policy instruments that shape both agglomeration and relocation dynamics [11,12]. This reflects a conceptual transition from cost-oriented location analysis to a more comprehensive framework linking economic, environmental, and policy factors.
Nevertheless, the current literature still has two notable limitations. First, many studies rely on static or cross-sectional analyses, which fail to capture the evolving influence of regulatory, economic, and infrastructural factors over time [13]. Second, limited attention has been paid to spatial heterogeneity across different local contexts, potentially obscuring important intra-regional variations [14]. These gaps are especially salient in rapidly transforming economies like China, where environmental regulation, market forces, and industrial park policies have undergone profound changes in the past two decades.
To address these gaps, this study investigates how the spatial distribution of PIIs in the Beijing–Tianjin–Hebei region has evolved over time and space, and how key determinants have changed in their relative influence. Unlike previous studies that mainly focused on static determinants, we explicitly incorporate spatiotemporal heterogeneity by employing a geographically and temporally weighted regression (GTWR) model [15], enabling a more nuanced understanding of how environmental regulation, economic conditions, infrastructure, and industrial park policies interact in shaping PII location dynamics.
China provides a particularly relevant setting for this research. As a major recipient of international industrial relocation [16], it has experienced both rapid economic growth and growing environmental pressure [17,18]. In response, national and regional governments have implemented joint pollution prevention policies aimed at coordinating environmental protection and economic development [19]. The Beijing–Tianjin–Hebei (BTH) urban agglomeration—one of China’s most economically vital yet environmentally stressed regions—offers a compelling case for examining the spatial dynamics of PIIs. Although PIIs in urban agglomerations exhibit some consistency over time [20], significant intra-regional differences persist [21], reflecting diverse local development trajectories and governance strategies. Insights from this case may also inform spatial planning and sustainable industrial development strategies in other developing countries undergoing similar industrial transitions.
This study aims to address the following questions: (1) What are the major factors influencing the spatial distribution of PIIs and how have they changed over time in the BTH? (2) How do these factors vary spatially and temporally across different cities within the BTH? To address these questions, the remainder of this paper is structured as follows: Section 2 presents the study area, data sources, and methodology; Section 3 provides the empirical results; Section 4 discusses the findings; and Section 5 concludes with policy implications.
This study makes three contributions to literature. First, it enriches the theoretical understanding of spatial industrial dynamics by linking classical location theory with environmental regulation and agglomeration frameworks in a spatiotemporal perspective. Second, it applies the GTWR model to empirically capture the evolving influence of key determinants across both space and time, filling a critical gap in previous static analyses. Third, it provides differentiated policy insights for industrial land-use strategies and the strategic development of industrial parks in rapidly industrializing regions.

2. Materials and Methods

2.1. Study Area

The BTH urban agglomeration is the largest and most dynamic economic region in northern China, as well as a world-class urban agglomeration, encompassing Beijing, Tianjin, and 11 prefecture-level cities in Hebei Province (Figure 1). However, significant disparities exist in economic development, resource availability, and industrial structure within the BTH. Geographically, the region features high terrain in the northwest and low terrain in the southeast. The varying geography also influences the industrial distribution pattern, with resource-rich areas in the region tending to host heavy industries. In terms of industrial structure, Beijing and Tianjin are primarily dominated by the tertiary sector, while cities in Hebei Province are heavily reliant on the secondary sector [17]. Additionally, economic development within the BTH is highly imbalanced, with the per capita GDP of Beijing and Tianjin being three times higher than that of Hebei Province [22].
The BTH is also the largest comprehensive industrial base in North China, with a strong foundation in heavy industry, making it a key area for the concentration of PIIs [11,23]. Since the release of the Outline of Coordinated Development of the Beijing–Tianjin–Hebei Region in 2014, disparities in economic development and resource availability have driven active relocation of PIIs within this region. Investigating the factors influencing PII distribution in the BTH urban agglomerations is thus critical for guiding industries relocation, promoting the restructuring and coordinated development of urban agglomerations, and alleviating regional resource and environmental constraints.

2.2. Data Sources and Definitions

The definition of PIIs varies across academic studies. In this research, PIIs are defined based on the scale of pollutant emissions, focusing on industries whose combined emissions of liquid waste, air pollutants, and solid waste exceed 80% of the total emissions from all industries during the study period [24]. Based on this criterion, 26 sectors are classified as PIIs, including Paper and Paper Products, Textile, Agricultural and Sideline Food Processing, Wine, Beverage and Refined Tea Manufacturing, Food Manufacturing, Pharmaceutical Manufacturing, Chemical Fiber Manufacturing, Non-metallic Mineral Products, Non-ferrous Metal Smelting and Rolling, Oil, Coal and Other Fuel Processing, Ferrous Metal Mining and Dressing, Non-Ferrous Metal Mining and Dressing, Coal Mining and Washing, Electricity and Heat Production and Supply, Ferrous Metal Smelting and Rolling, and Chemical Raw Materials and manufacturing.
Three main types of data are used in this study: geographic information data, new industrial land data, and socioeconomic data. Geographic information data provide the spatial context for the study and include the vector boundary data of the study area, digital elevation model (DEM) data, river data, and the distribution of industrial parks. Boundary, DEM, and river data were obtained from the Resource and Environment Science Data Center of the Chinese Academy of Sciences [25]. The distribution of industrial parks in BTH is derived through visual interpretation and vectorization of remote sensing images. The source directory is obtained from the China Development Zone Audit and Announcement Catalog [26], jointly issued by the National Development and Reform Commission and five other departments. Remote sensing image data are obtained from the U.S. Geological Survey, with a resolution of 30 m. New industrial land data are used to identify the location and characteristics of newly established PIIs facilities between 2007 and 2019. This dataset includes information on location, area, transaction time, and price of industrial land, obtained from the China Land Market Network [27]. Socioeconomic variables used to analyze factors influencing PII distribution were sourced from the statistical yearbooks of the National Bureau of Statistics and publicly available reports and bulletins.

2.3. Methods

2.3.1. Theoretical Framework for Determinants of PII Location

The locational choice of pollution intensive industries is shaped by a combination of long-standing location theory, factor endowment logic, agglomeration dynamics, regulatory incentives and firm level heterogeneity.
Classical location theory centers on cost minimization and highlights how natural endowments such as terrain and water resources, together with transport costs and factor prices, impose fundamental constraints on industrial location [28]. The factor endowment perspective refines this account by arguing that interregional differences in relative factor abundance determine comparative advantage [29]. Regions that are relatively rich in capital and technology tend to specialize in capital intensive production, while resource abundant regions are more likely to attract resource intensive activities [30].
The New Economic Geography internalizes location choice by distinguishing first nature, namely immutable natural endowments, from second nature, namely agglomeration forces that arise from market size, interindustry linkages and investment [31]. First nature factors set entry thresholds and shape baseline costs, while second nature forces amplify initial locational advantages through scale economies and knowledge and input output spillovers, thus promoting spatial concentration. Improvements in globalization and transport networks have increased the relevance of port accessibility and international input markets, which can alter the balance between locating near domestic resource bases and locating near coastal gateways to global supply chains [32].
Environmental regulation constitutes another critical dimension shaping the spatial pattern of PIIs, and its effects are inherently bidirectional [33]. The pollution-haven hypothesis posits that regions with laxer standards or weaker enforcement may temporarily attract pollution-intensive activities [34], whereas the Porter hypothesis suggests that stringent, well-designed regulation can spur technological innovation and efficiency improvements that offset compliance costs and enable firms to remain and upgrade [35]. In the Chinese context, fiscal decentralization and local governments’ use of land supply, tax incentives, or subsidies to attract industry further condition regulatory effects [36], so that industrial relocation is driven not only by market and factor conditions but also by local fiscal incentives and cross-regional governance capacity [37].
At the micro level, firm heterogeneity determines how individual firms respond to institutional and environmental change. Firm size and capital intensity influence both the ability and the incentive to invest in abatement and technological upgrading [38]. Consequently, large, capital rich firms are more likely to adapt and remain under stringent regulation, while small and medium sized firms, facing higher relative compliance costs and constrained access to finance and technology, are more prone to relocate or exit [39]. Location within industrial parks constitutes an additional important dimension of firm heterogeneity. Industrial parks commonly provide shared infrastructure, centralized pollution control facilities and coordinated services that reduce individual firms’ compliance burden and lower the cost of adopting cleaner technologies [40]. These features alter firms’ location incentives and change the distributional impact of regulatory policies.
This theoretical synthesis motivates our empirical strategy. We classify determinants into four dimensions, natural geography, socioeconomic conditions, governmental and institutional factors, and firm attributes. The firm attributes dimension explicitly includes firm size, capital intensity and industrial park location, and we test the proposed mechanisms and their interactions using corresponding observable indicators in the empirical analysis.

2.3.2. Model of Influence Factors

Building on prior research and considering the specific characteristics of the BTH region, we construct a model of influencing factors based on four dimensions: natural geographical factors, socioeconomic factors, governmental institutional factors, and firm attribute factors. Representative indicators for each dimension are selected to capture their impact on the distribution of PIIs.
Two key nature geographical factors are terrain and proximity to water. PIIs often require large tracts of land, making flat terrain a critical advantage for industrial agglomeration [11]. Additionally, water is a vital resource for PIIs production and significantly influences production costs, particularly in the water-scarce areas of the BTH region [41].
Socioeconomic influences include labor costs, technological capabilities, investment levels, regional economic development, and market size. Labor, technology, and investment are fundamental inputs for industrial production [42]. Regional economic development reflects the broader economic environment that supports or limits industrial growth [43]. Market size, often proxied by population size [8], influences demand and fosters industrial concentration.
Government policies play a crucial role in shaping the distribution of PIIs through environmental regulation, land price, and fiscal decentralization [44]. Many countries, including China, have adopted environmental regulations to limit the emission of pollutants, creating comparative advantage for regions that can balance regulation with industrial growth [45,46]. In China’s land market, local governments act as monopolistic sellers, often offering industrial land at subsidized price to attract investment and boost economic growth [47,48]. Additionally, the fiscal decentralization system incentivizes local governments to attract new industries, including PIIs, by fostering economic incentives such as tax benefits and employment growth [37,49].
Firm attribute factors such as size and location within industrial parks also play a significant role. Larger enterprises, due to their greater scale and higher absolute emissions, are more likely to exceed regulatory thresholds, making them priority targets for permitting, monitoring, and inspections compared to small firms [50]. Regulatory agencies often allocate enforcement resources toward these high-impact sources, and large firms also face greater public and media scrutiny, increasing compliance pressure despite their bargaining power [51]. Meanwhile, industrial parks, equipped with shared infrastructure and pollution control systems, enable firms to reduce production costs and access advanced technologies, making them attractive options for PII operations [52].
By integrating these dimensions, the factors influencing the spatial distribution of PIIs are summarized in Table 1.
Quantifying environmental regulation poses significant challenges due to its complex and multifaceted nature. To address this, we measure the regional environmental regulation level by inversely deriving it from actual pollutant emission levels, following the logic of Wang et al. [17], and considering data availability. Given the primary pollutants associated with PIIs, such as steel, chemicals, and power generation, which are dominant in the BTH region, sulfur dioxide (SO2) emissions and chemical oxygen demand (COD) emissions from wastewater are selected as key indicators. This selection aligns with China’s environmental management priorities, as SO2 and COD are designated as “key controlled pollutants” under the Twelfth Five-Year Plan for National Environmental Protection (2011–2015) and are widely used in regional environmental regulation studies.
To account for the balance between pollution emissions and economic development, we first calculate the pollutant emission intensity ( Q i , j ) using the formula:
Q i , j = E S O 2 , i , j + E C O D , i , j P i , j
where E S O 2 , i , j is the sulfur dioxide emissions in region i in year j, E C O D , i , j is the total chemical oxygen demand emissions in region i in year j, and P i , j is the GDP in region i in year j. Q i , j represents pollutant emissions per unit of GDP, where a higher Q i , j implies a greater “pollution cost” of economic growth and weaker environmental regulation.
To derive the environmental regulation index ( E R i , j ), the reciprocal of Q i , j is taken to convert the “pollution intensity indicator” into a “regulation intensity indicator”, where a higher reciprocal value signifies more GDP generated per unit of pollutant, reflecting stricter regulation. This value is then normalized using min-max scaling to ensure comparability across regions and time periods:
E R i , j = 1 Q i , j min 1 Q i , j max 1 Q i , j min 1 Q i , j
where E R i , j is the environmental regulation intensity index for region i in year j, scaled to the range [0, 1]. This approach provides an empirically grounded measure of environmental regulation, reflecting the balance between pollutant emissions and economic output.

2.3.3. Spatial Correlation Analysis and Principal Component Analysis (PCA)

To characterize the spatial distribution of PIIs, we used the kernel density index of newly established PIIs. This index, calculated by the Kernel Density tool in ArcGIS 10.2, indicates the concentration of PIIs within their surrounding areas. To further analyze the spatial correlation of PII distribution, we applied Moran’s I index, also in ArcGIS10.2. The Moran’s I value was 0.49, statistically significant at the 0.01 level, suggesting a positive spatial correlation in the clustering of PIIs. This indicates that PIIs tend to be located near each other, supporting the phenomenon of industrial agglomeration.
Following this, PCA was conducted using SPSS 26.0 to reduce multicollinearity and redundancy among the 11 influencing factors, excluding the categorical variables IP (industrial park). The PCA was deemed appropriate based on the Kaiser–Meyer–Olkin index of 0.771 (greater than 0.70) and a Bartlett’s test of sphericity p-value below 0.01. These results confirm that the data meet the assumption of adequacy and sphericity for PCA. Four principal components were extracted, cumulatively explaining 74.739% of the total variance. This suggests that the PCA effectively captured the underlying structure of data and provided a comprehensive extraction of factor information. Therefore, the model used in this study is both reasonable and applicable.
According to the component matrix of PCA (Table 2), the four principals differ in terms of their dominant factors, which can be summarized as follows: Y1: Dominated by PGDP (per capita GDP), LC (labor cost), MS (market size), TL (Technology), and CI (capital investment), representing factors related to economic development. Y2: Dominated by LP (Land price) and FS (firm size), highlighting the role of firm scale factors. Y3: Dominated by ERI (environmental regulation index) and FD (fiscal decentralization), reflecting government intervention. Y4: Dominated by AL (Terrain) and DFR (distance from rivers), emphasizing geographical and location factors.

2.3.4. GTWR

In this study, the GTWR model was employed to investigate the factors influencing the distribution of PIIs. The GTWR is an extension of the geographically weighted regression (GWR) model, incorporating temporal attributes as an additional explanatory variable. This temporal component allows GTWR to address both spatial and temporal non-stationarity, providing a more comprehensive analysis of how factors influencing PII distribution vary across both space and time [53].
The GTWR model is represented by the following equation:
y i = β 0 u i , v i , t i + k = 1 m β k u i , v i , t i x i k + ε i
where ui and vi are the longitude and latitude coordinates of the i-th sample, respectively; (ui, vi, ti) are the spatiotemporal coordinates of the i-th sample; β0 (ui, vi, ti) is the regression constant term of point i; βk (ui, vi, ti) is the k-th regression coefficient for the i-th sample; a positive coefficient indicates a positive correlation, and vice versa for a negative correlation; the magnitude of the coefficient reflects the strength of this correlation; xik is the value of the independent variable xk at point i; and εi is the residual term of the model.
The GTWR plug-in in ArcGIS 10.2 [53] was used for model implementation. The bandwidth for the GTWR was determined using the Akaike information criterion (AIC), with a final bandwidth value of 0.114996. Model performance was assessed using the goodness-of-fit measure R2, which was found to be 0.735. This indicates that the four principal components identified through PCA explain 73.5% of the variance in the distribution of PIIs. To verify the applicability and accuracy of the GTWR model, we also compared its performance with ordinary least squares (OLS) and GWR. As shown in Table 3, both the R2 and AICc values showed that the GTWR model demonstrated a better goodness-of-fit compared to the OLS and GWR model. These results highlight that the incorporating spatiotemporal factors significantly enhance the model’s ability to explain PII distribution. Therefore, the GTWR model is confirmed to be the most appropriate approach for this research.

3. Results

3.1. Analysis of Temporal Heterogeneity of Influencing Factors

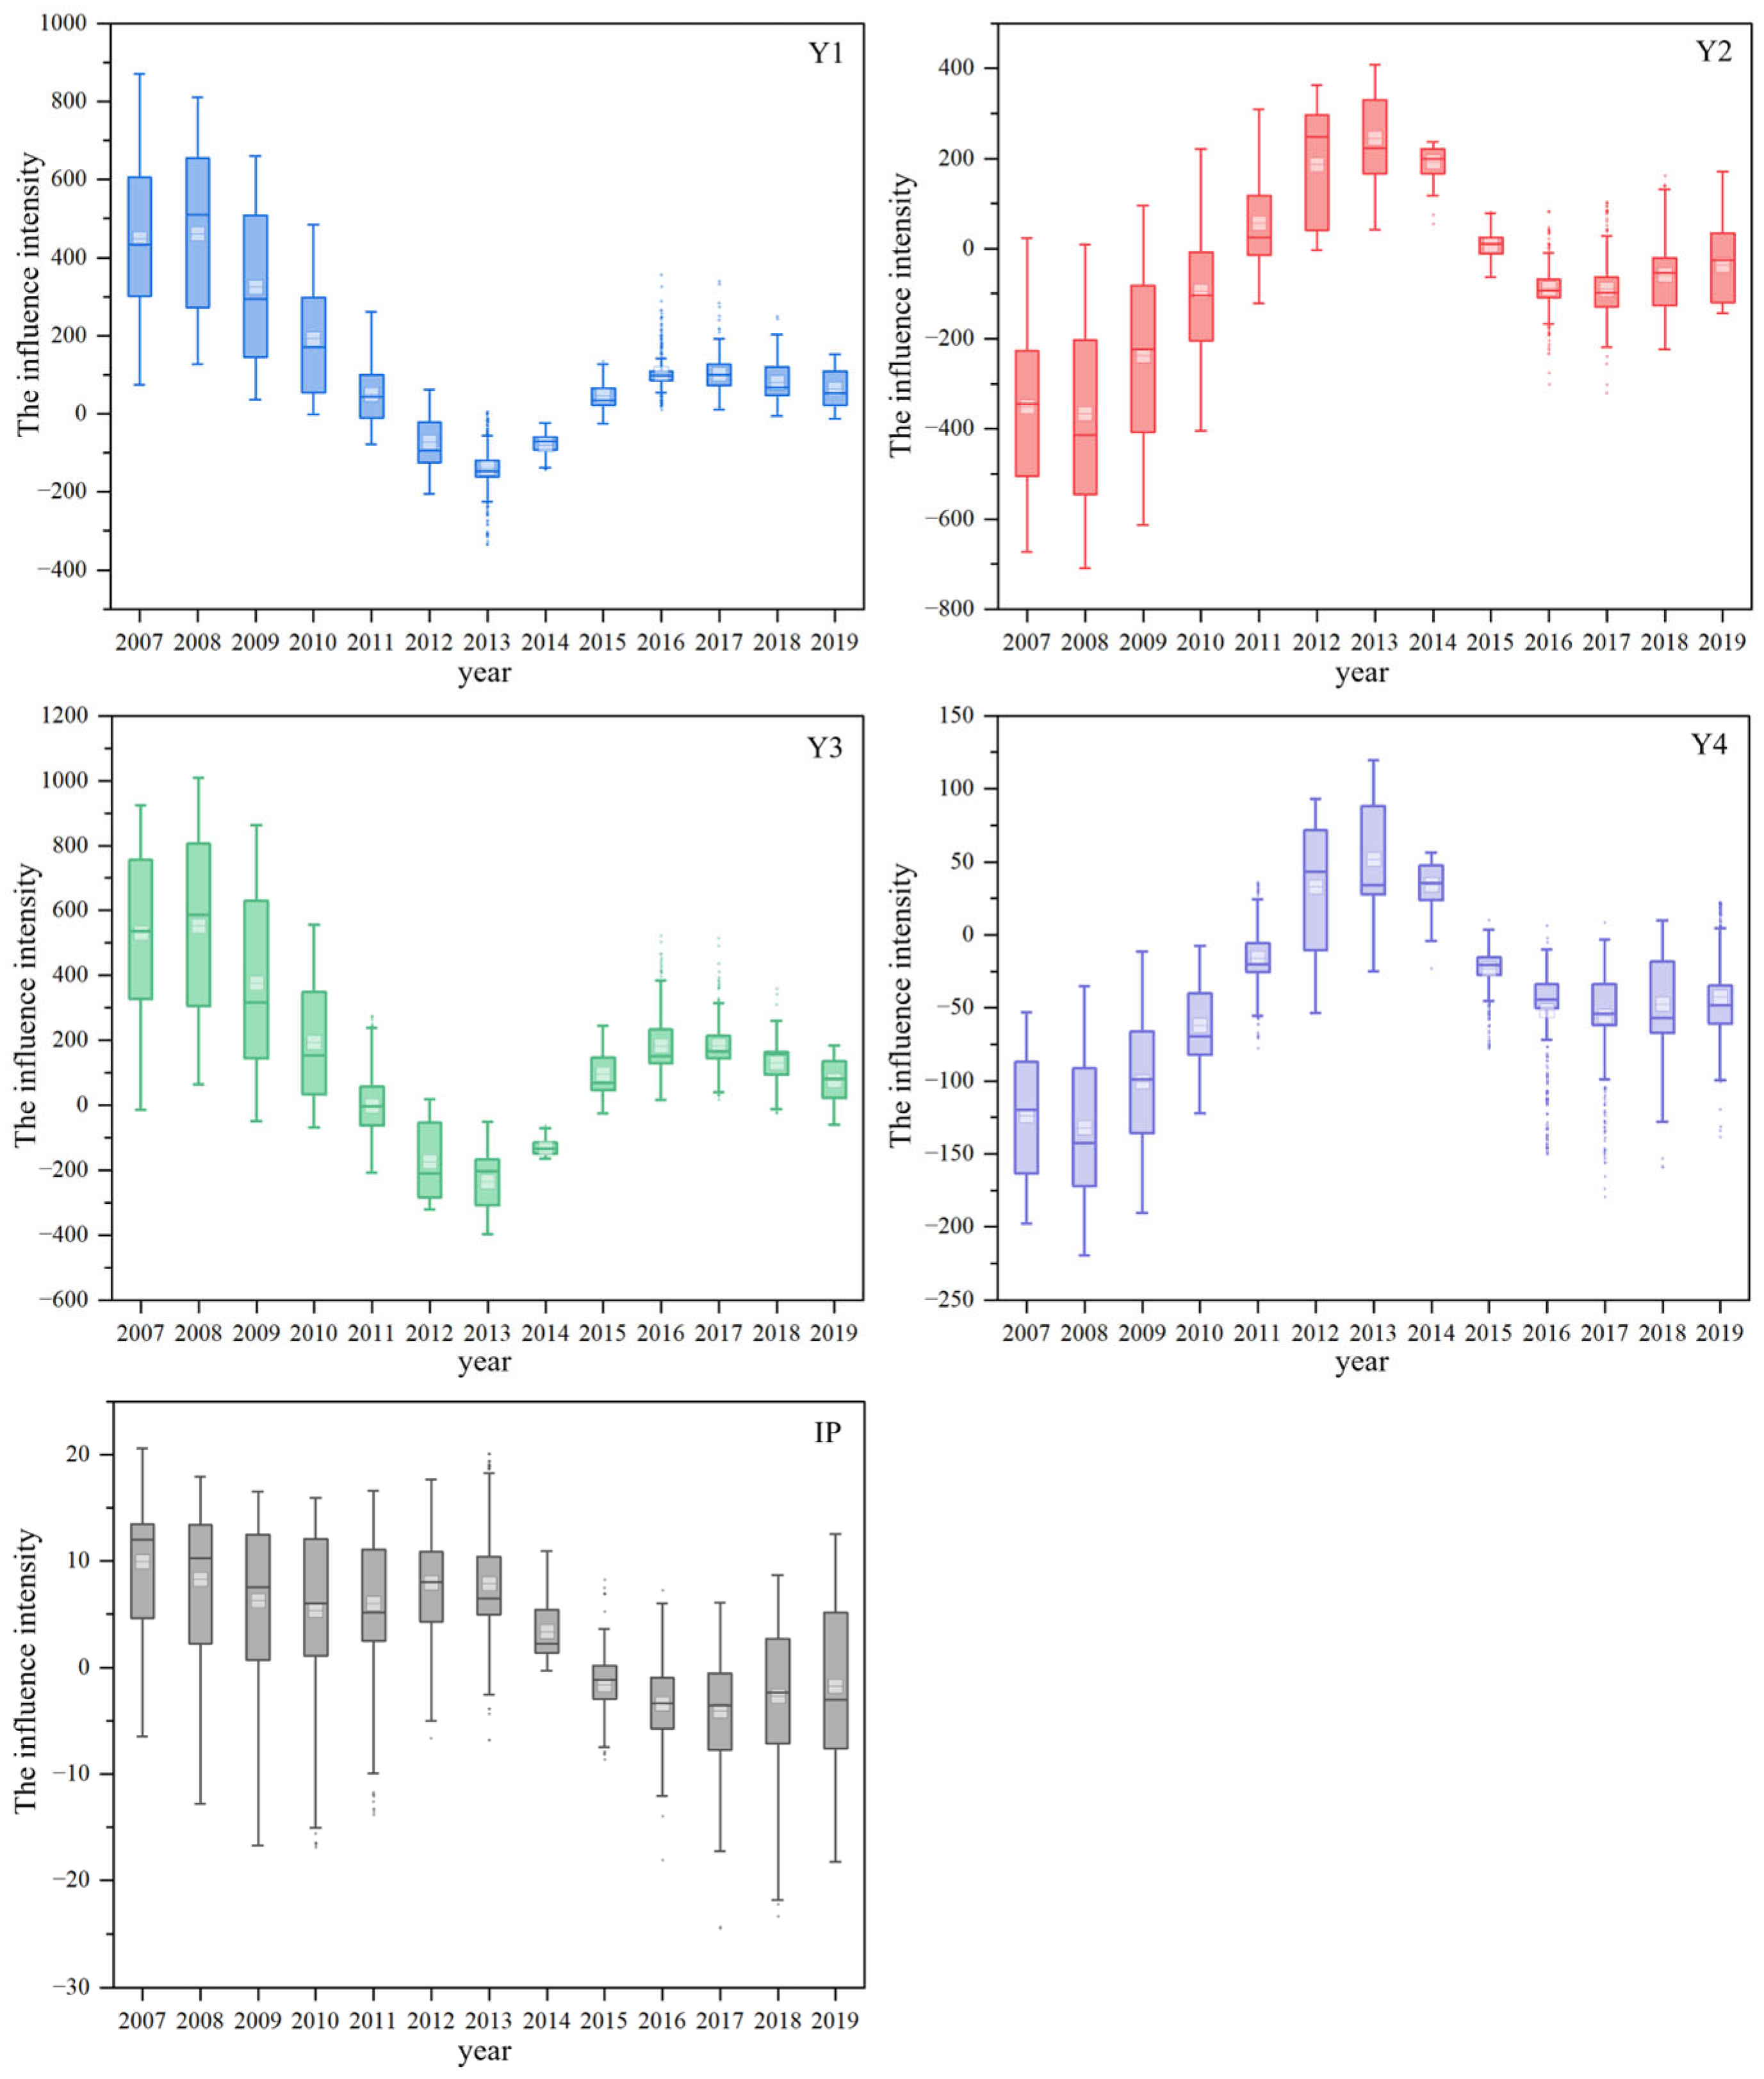
The influence intensity of various factors on PII distribution exhibited notable temporal variation over the study period (Figure 2). Based on the regression coefficient, the factors were ranked by their effect intensity as follows: Y3 > Y1 > Y2 > Y4 > IP. Among them, Y3 (environmental regulation) exhibited the greatest effect, highlighting its primary role in influencing PII distribution. This aligns with the core logic of both the pollution haven hypothesis and Porter hypothesis, as environmental regulation directly shapes PIIs’ location choices by altering compliance costs. Y1 (regional economic development) followed closely, emphasizing the significance of economic factors which echoes the resource endowment hypothesis. Economic conditions determine the availability of capital, labor and infrastructure needed for PII operation. In comparison, the effects of Y2 (firm scale) and Y4 (geographical factors) had weaker effects, while IP (industrial park presence) showed the smallest but consistent impact.
A significant temporal heterogeneity was observed across these factors. Over the period from 2007 to 2019, except for IP whose effect remained relatively stable, the intensity and direction of the other factors fluctuated. Overall, the effect intensity gradually weakened over time, with the most notable declines occurring between 2007 and 2012, particularly for Y3 which saw the steepest declines. This overall weakening trend is not a simple “disappearance of effects”; rather it likely reflects the evolution of industry, policy and institutional environments. For example, a shift from strong intervention to routine regulation and the diffusion of firms’ technological and governance capabilities both reduce the marginal impact. This diminishing influence of environmental regulation, despite its continued significance, is noteworthy as it reflects the dynamic nature of policy effects. Stringent regulation initially drives obvious relocation, but as firms adapt through innovation consistent with the Porter hypothesis, the relocation pressure eases.
In terms of the direction of effects, all factors (Y1, Y2, Y3, and Y4) shifted multiple times during the study period, particularly around 2011 and 2015. In 2011, the effects of Y1 and Y3 changed from positive to negative, while Y2 and Y4 shifted from negative to positive. In 2015, the trends reversed, with Y1 and Y3 becoming positive again and Y2 and Y4 reverting to negative. Throughout the study period, the effect of IP consistently remained positive, indicating a persistent tendency for PIIs to cluster within industrial parks. This aligns with the practical logic that industrial parks provide shared infrastructure and centralized governance, helping PIIs reduce environmental costs while maintaining production efficiency. From a theoretical perspective, these repeated directional shifts accord with expectations from new economic geography and the stage-specific effects of policy. Early growth or strengthened regulation may push firms to concentrate in areas with infrastructural and compliance advantages (manifested as positive effects for Y1 and Y3), whereas during industry maturation or adjustment phases, resource reallocation and cost pressures can induce dispersion or structural relocation (producing negative effects or reversals). Therefore, regression coefficients estimated at a single point in time can easily obscure the underlying dynamic mechanisms.
The regression coefficients of the influencing factors exhibited three distinct patterns of change over time. Y1 (economic factors) and Y3 (environmental regulation) showed a similar trend: initially positive from 2007 to 2011, followed by a shift to negative between 2012 and 2014 with their absolute values increasing before gradually decreasing. From 2015 to 2019, both factors turned positive again though the intensity weakened. This pattern reflects the dynamic interaction between economic pull and policy push. Early on, economic development attracts PIIs while strict regulation filters out low-efficiency ones; later, as core cities (Beijing, Tianjin) upgrade industries, PIIs relocate to moderate-economic areas, making Y1 and Y3′s effects fluctuate. In contrast, Y2 (firm scale) and Y4 (geographical factors) demonstrated opposite patterns. Their effects were negative from 2007 to 2010 with a gradual decline in intensity. From 2011 to 2014, their effects turned positive, peaking before decreasing in strength, and then reverted back to negative from 2015 to 2019. This reversal indicates that geographical constraints (Y4) and firm size effects (Y2) weaken as transportation improves and market integrates, which supports the view that geographical factors’ influence diminishes with economic development. The effect of IP (industrial parks) remained consistently positive throughout the study period, indicating that PIIs continued to cluster in industrial parks though this effect was not as significantly influenced by temporal changes.
Collectively, these distinct patterns indicate that: (i) the positive impacts of economic development and environmental regulation on PIIs demonstrate phase-dependent and moderating effects over time, which aligns with the evolving nature of resource endowment and pollution haven hypotheses; (ii) firm size and geographic factors tend to exhibit counter-cyclical responses to short-term economic or policy shocks, reflecting their secondary role in PII location choices; and (iii) the persistent positive influence of industrial parks underscores the enduring attractiveness of physical infrastructure and institutional frameworks as long-term drivers of investment.

3.2. Analysis of Spatial Heterogeneity of Influencing Factors

There was significant spatial heterogeneity in the effects of different factors on the distribution of PIIs (Figure 3). While the effect of each factor was generally consistent across neighboring areas, forming regions where the effect was either concentrated in facilitation or inhibition, the intensity and the direction of these effects varied across different regions. For example, between 2007 and 2010, the positive impact of Y1 (regional economic development) on the agglomeration of PIIs was notably stronger in the eastern part of the BTH (e.g., Tianjin, Tangshan) compared to other regions. This spatial difference is not accidental. It reflects the core logic of the Resource Endowment Hypothesis: eastern BTH had more developed capital markets, more complete industrial supporting facilities, and higher labor quality at that time, making it inherently more attractive to capital-intensive PIIs (e.g., steel, petrochemicals). In contrast, from 2015 to 2019, Y4 (geographical factors) facilitated PII agglomeration in parts of Tianjin, as well as central and eastern Hebei, while inhibiting it in northern Hebei. This split effect of Y4 reveals the regional boundary of “first nature” constraints in New Economic Geography. Central/eastern Hebei has flat terrain and accessible water resources, which reduce construction and water supply costs for PIIs. Northern Hebei (e.g., Zhangjiakou) is dominated by mountains and ecological protection zones, making large-scale PII construction unfeasible. This means geographical factors do not have a uniform “good/bad” effect. Their role depends on local natural conditions. This spatial variability in the effects of different factors highlights the importance of considering regional differences, as ignoring spatial heterogeneity could lead to biased or inaccurate conclusions (e.g., incorrectly claiming “geographical factors promote PIIs” without distinguishing northern Hebei’s constraints).
Moreover, the effect of the same factor on a specific region may change over time. For instance, the influence of Y2 (firm scale) on PII agglomeration in Tianjin was inhibitory from 2007 to 2010, but by 2011–2014, this effect reversed, becoming facilitative. This reversal implies a critical shift in Tianjin’s industrial policy logic. Early on, it restricted large traditional PIIs (e.g., small steel plants) to control pollution. After 2011, it began encouraging large-scale, high-tech PIIs (e.g., green petrochemicals) that meet strict environmental standards. This aligns with the Porter Hypothesis, which argues that well-designed regulation can drive industrial upgrading rather than just restrict growth. Similarly, the concentration of PIIs in Tianjin and eastern Hebei was strongly promoted by Y1 and Y3 between 2007 and 2010, but the strength of this promotion weakened from 2011 to 2019. This weakening signals that core regions (Tianjin, eastern Hebei) entered an industrial optimization phase. As their economies matured, they shifted from “attracting PIIs for GDP growth” to “retaining high-quality PIIs for sustainable development,” while stricter environmental regulation (Y3) pushed low-efficiency PIIs to relocate to central Hebei. This is consistent with the Pollution Haven Hypothesis’ prediction of “regulation-driven industrial transfer.” These findings indicate that the impact mechanisms driving PII distribution are dynamic over time. Failing to account for temporal changes could result in an incomplete understanding of the underlying forces (e.g., misinterpreting Tianjin’s PII policy as “permanently restrictive”).
Despite the differences in the effects of factors, some spatial trends were consistent across multiple factors. Both Y1 and Y3 exhibited strong facilitative effects on the agglomeration of PIIs in Tianjin and eastern Hebei from 2007 to 2010. This consistency reflects the synergistic effect of economic pull and policy guidance. Eastern BTH’s economic advantages (Y1) provided the foundation for PII agglomeration, while its moderate environmental regulation (Y3) balanced pollution control and industrial growth. This avoids both the “low-regulation pollution trap” and the “over-regulation growth stagnation.” Similarly, Y2 and Y4 shared a pattern of inhibiting agglomeration in Tianjin and central-southern Hebei during 2007–2010, but by 2011–2014, they began promoting agglomeration across most of the BTH region. Between 2015 and 2019, the effects of these factors showed considerable spatial variation, yet all factors contributed to promoting agglomeration in central Hebei. This unified promotion of central Hebei is not a coincidence. It indicates that the Beijing–Tianjin–Hebei Coordinated Development Strategy (launched in 2014) has become a key underlying force. The strategy reshaped PII distribution by optimizing infrastructure and unifying environmental standards in central Hebei, verifying New Economic Geography’s view that “policy intervention can redirect industrial spatial patterns.” These parallel temporal and spatial changes suggest a strong correlation in the mechanisms driving these factors or that these factors could be influenced by similar underlying forces.
The role of industrial parks (IP) in promoting PII agglomeration expanded over time. From 2007 to 2010, the influence of IP was limited to parts of Beijing, Tianjin, and eastern and northern Hebei. However, from 2011 to 2019, the influence of IP gradually spread to most of the BTH region, with the only significant inhibitory effect observed in parts of southern Hebei. This expansion demonstrates the effectiveness of industrial parks as a “policy tool for balanced governance.” Parks provide shared wastewater treatment and centralized monitoring, which reduce PIIs’ compliance costs. This directly supports the Porter Hypothesis’ emphasis on “institutional infrastructure enabling green production.” The inhibitory effect in southern Hebei, meanwhile, may stem from inadequate park facilities (e.g., incomplete transportation networks). This indicates that infrastructure completeness is a prerequisite for IP’s role. Although the intensity of the IP effect was weaker compared to other factors and showed relatively insignificant temporal changes, the gradual expansion of its impact indicates the increasing importance of industrial parks in attracting PIIs. The growing role of industrial parks suggests that their advantages in terms of infrastructure, economies of scale, and logistical efficiency have become more apparent, helping to drive industrial clustering in the region. More critically, this trend implies a shift in BTH’s PII governance model from “dispersed control” to “centralized management.” This is a key step toward reconciling industrial development with environmental protection.

4. Discussion

4.1. The Impact of Geographical Location on the Distribution of PIIs Gradually Weakens

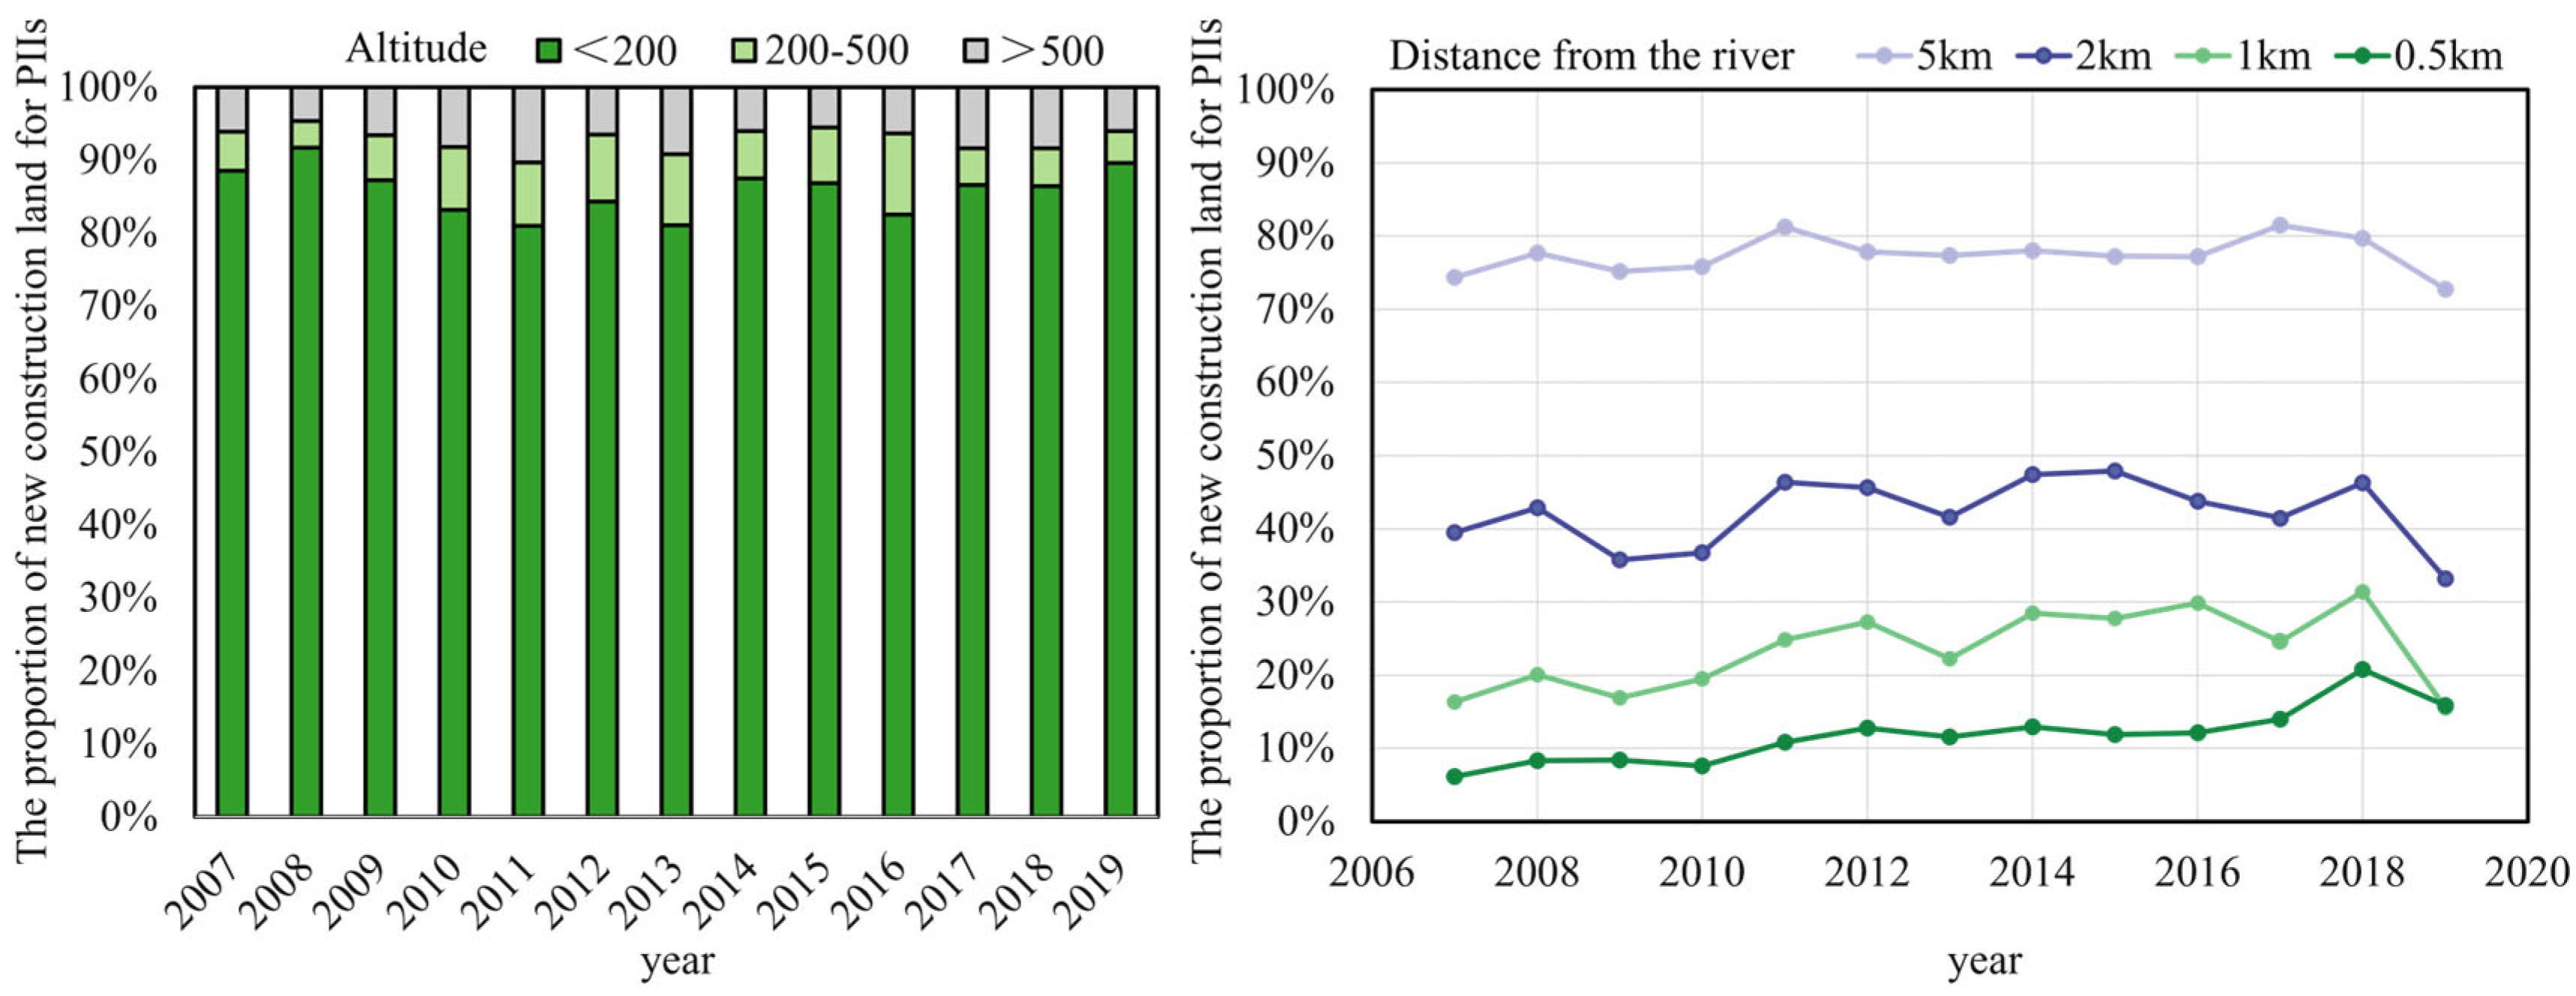
The distribution of PIIs exhibits significant spatial heterogeneity, which is closely tied to regional natural resource endowment and geographical conditions. Areas with low altitudes and proximity to water have traditionally been preferred locations for PIIs. Low-lying terrain facilitates industrial agglomeration and urban development, creating favorable socioeconomic conditions for industry growth. Additionally, many PIIs rely on substantial water resources during production, making proximity to rivers a critical determinant of their location. However, this dependence on geographical location is not static. As indicated in Section 3.1, the influence of geographical factor on PII distribution has weakened over time. As shown in Figure 4, the proportion of new established PIIs in areas with altitudes below 200 m has exhibited a fluctuating downward trend between 2008 and 2016. Similarly, the attractiveness of locations near rivers has diminished in recent years.
This shift can primarily be attributed to advancements in urban economies, transportation networks, and environmental regulations. Enhanced transportation systems and market integration have reduced the reliance of PIIs on resource availability, which is consistent with findings from previous studies [7]. By contrast, in resource-dependent regions such as Shanxi Province and Inner Mongolia Autonomous Region, the spatial distribution of PIIs remains strongly constrained by terrain and water resource conditions, reflecting the persistent influence of geographical location [54]. This comparison indicates that the weakening of geographical constraints in the BTH region is not a universal pattern but a result of its advanced economic transformation and infrastructure development. Furthermore, stricter environmental regulations now limit the spatial allocation of PIIs, particularly in regions near water bodies. Industries that discharge large amounts of wastewater are increasingly being restricted to areas further from rivers to minimize environmental harm. Despite these changes, geographical location remains a key factor in PII distribution. From 2007 to 2019, most new PIIs in BTH region were established in the relatively flat southeastern areas, with more than 70% located within 5 km of rivers. While the overall influence of geographical factors has diminished due to economic and regulatory shifts, their spatial heterogeneity continues to play an important role in shaping PII layouts.

4.2. PIIs Gradually Shifted Toward Areas with Moderate Economic Levels

Economic factors significantly influence the spatiotemporal heterogeneity of PII distribution. While economically developed cities offer abundant capital, labor, and other resources, they also impose higher ecological requirements, which often drive the relocation of PIIs. In contrast, areas with moderate economic development offer a balanced environment: they attract industries with lower operating costs while providing sufficient infrastructure and investment opportunities to support industrial growth. This dynamic creates an inverted U-shaped relationship between the scale of PIIs and regional economic development levels, as corroborated by previous studies [55]. Figure 5 illustrates this trend, showing that between 2007 and 2014, PIIs in the BTH region were concentrated in areas with higher per capita GDP. However, from 2015 to 2019, this trend shifted, with PIIs increasingly relocating to regions with moderate per capita GDP (20,000 to 60,000 CNY). These regions attract high-output industries, contributing to urban economic growth but also exerting ecological pressure on the urban environment.
This relocation pattern differs from that observed in some highly developed urban agglomerations, such as the Yangtze River Delta and Pearl River Delta, where industrial upgrading and technological innovation have allowed a large share of PIIs to remain concentrated in economically advanced areas rather than moving outward [56]. In these regions, cleaner production and green transformation have reduced the environmental burden, enabling the coexistence of economic growth and industrial agglomeration. An excessively high or low level of economic development can hinder the agglomeration of PIIs. For instance, Beijing and Tianjin experienced significant clustering of PII during the early study period. However, as their economies developed and environmental regulations tightened, many industries relocated to avoid rising compliance costs. Conversely, cities in Hebei Province, with weaker economic development, continued to rely heavily on secondary industries for growth. Local governments in these areas often introduced PIIs to stimulate fiscal revenue and improve economic performance, incentivizing industrial clustering through favorable land-use policies. To mitigate the ecological pressures caused by PII clusters in moderately developed regions, it is crucial to raise the entry threshold for new industries. Strategies should balance economic benefits with sustainable urban development to ensure long-term viability and minimize environmental impact.

4.3. Government Intervention: Dominant but Gradually Weakening

Government intervention has historically been the strongest factor influencing the distribution of PIIs. Despite the expansion of China’s market economy, government policies continue to shape industrial spatial distribution, especially in urban core areas and key development zones, where governmental influence often outweighs market dynamics [57]. Differences in local government environmental regulations significantly impact PII locations by altering pollution abatement costs [58]. This results in varying levels of attractiveness for PIIs, supporting both Pollution Haven and Porter hypotheses. Some studies suggest that strict environmental regulations drive PIIs to regions with looser regulations, while others argue that such regulations stimulate technological innovation, enhancing productivity and competitiveness [59,60].
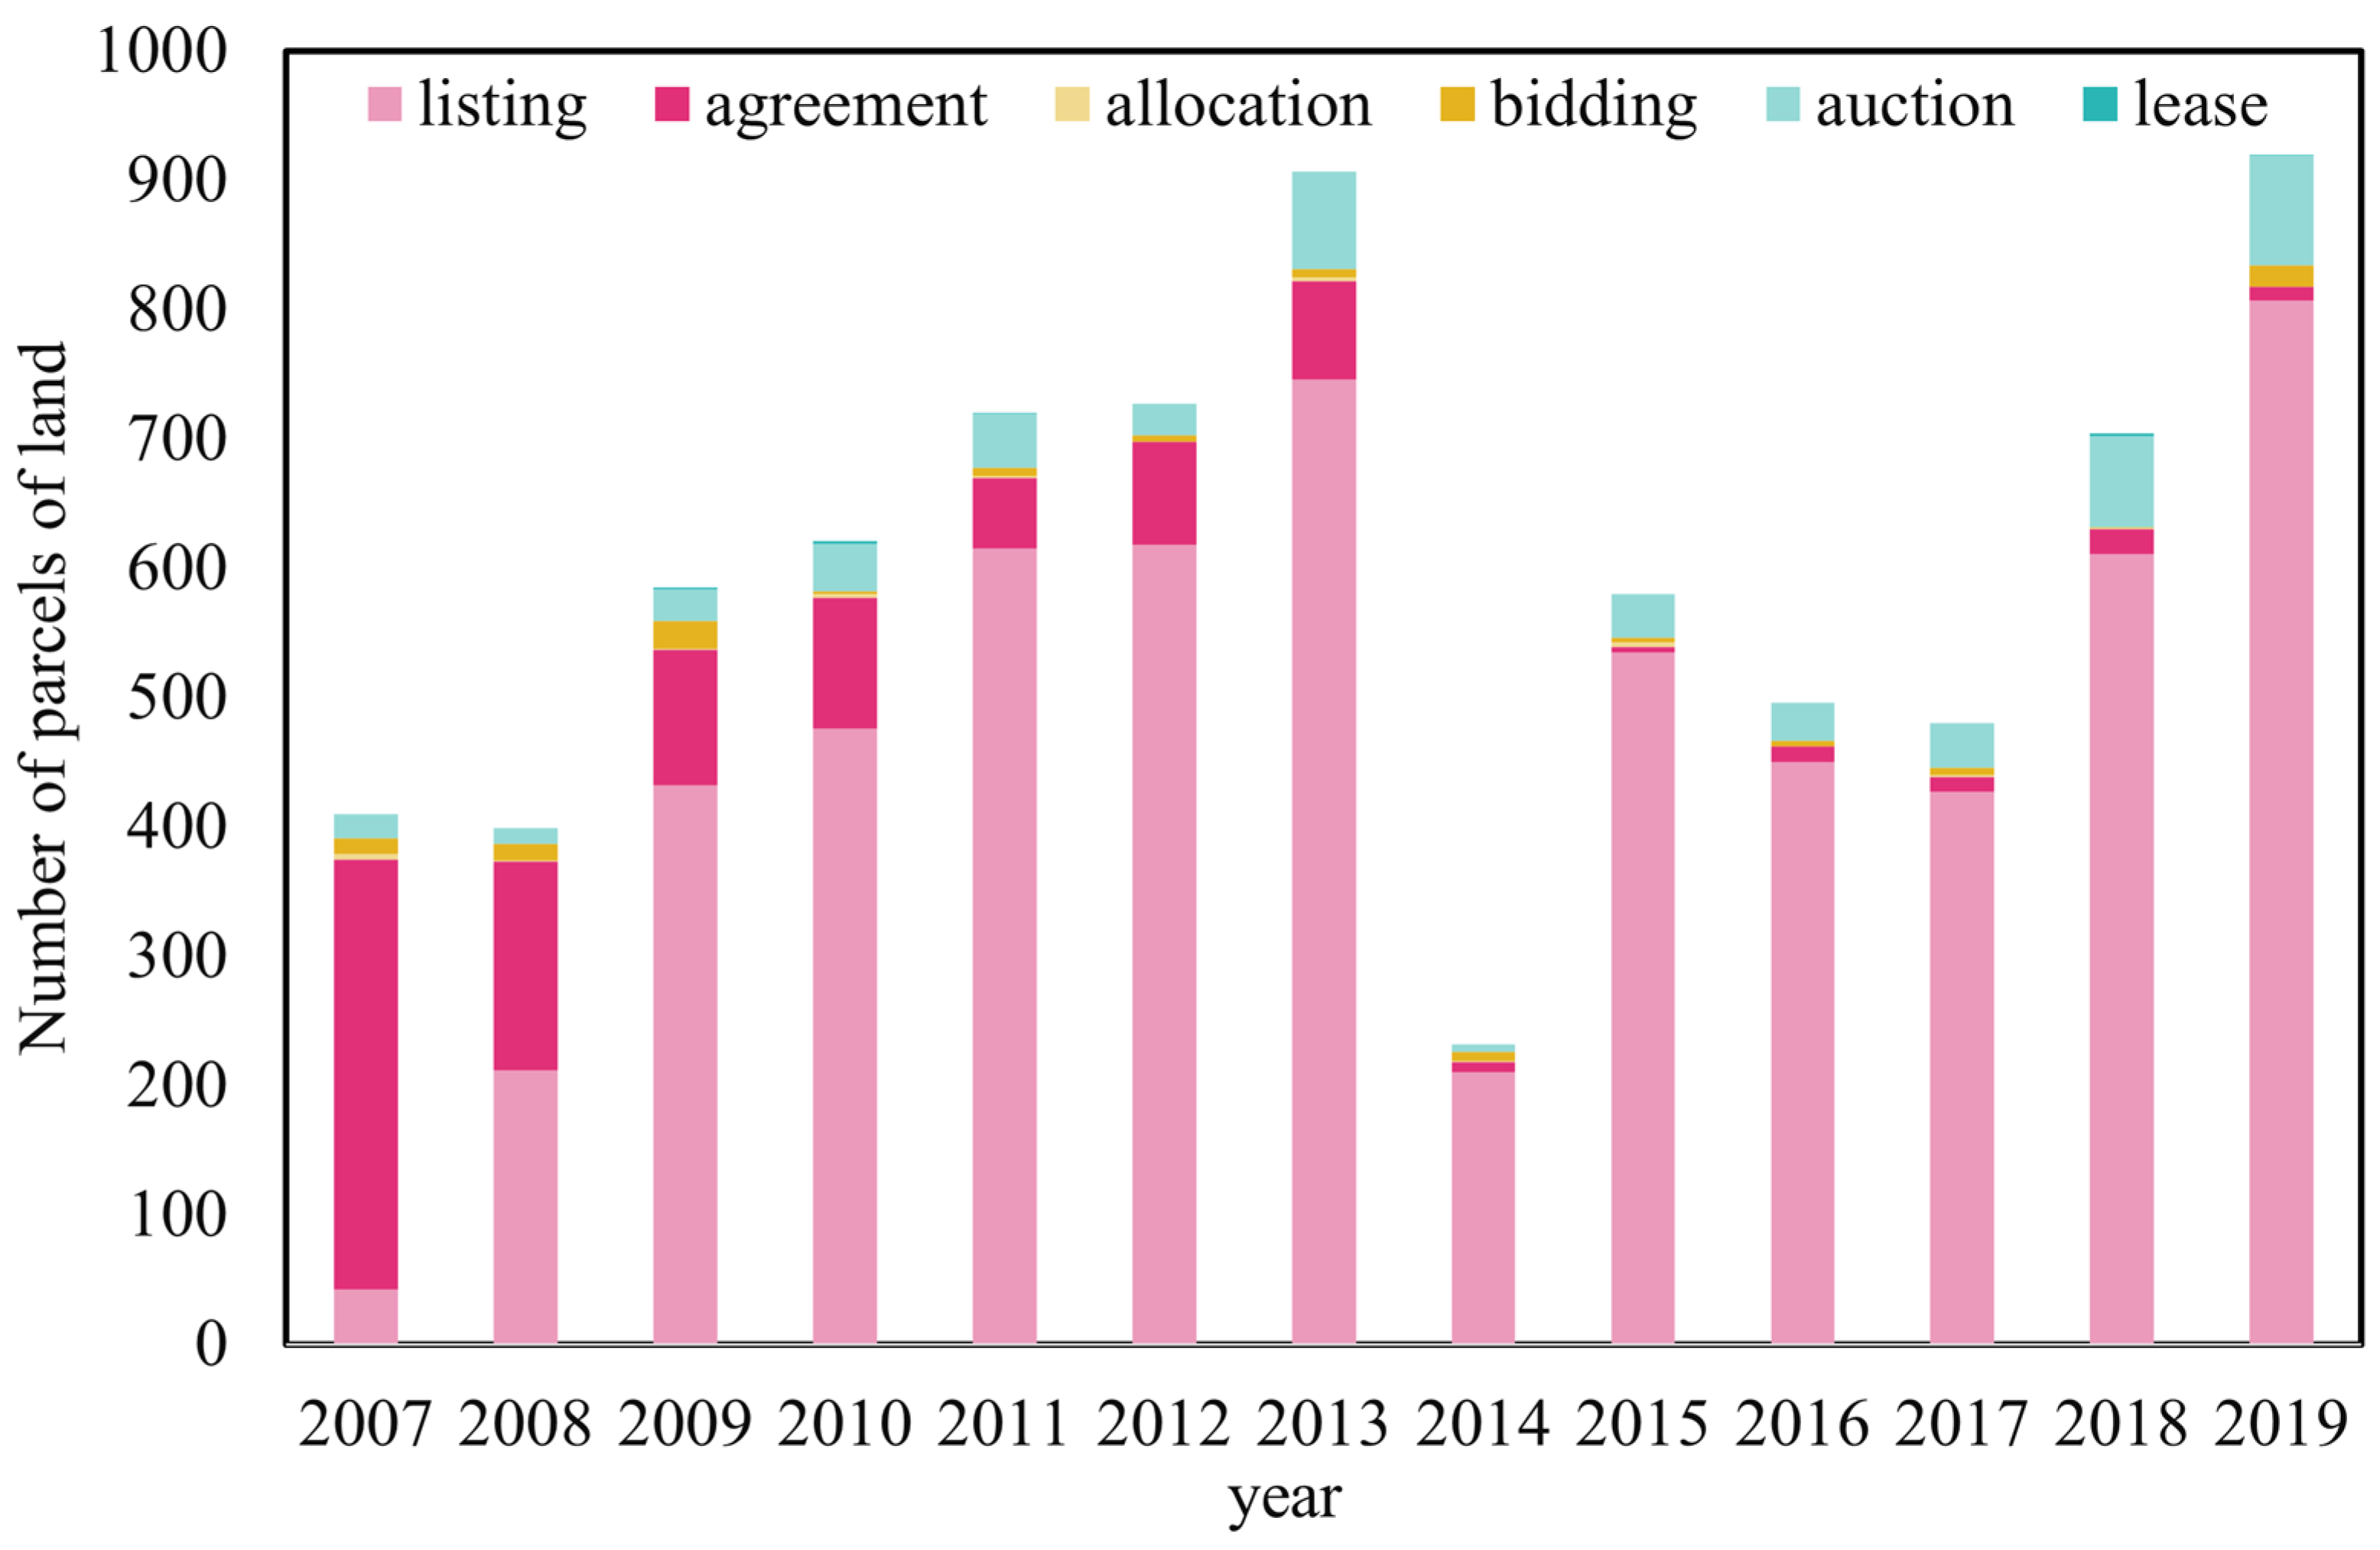
The findings in Section 3.1 indicate that government intervention remains the most significant factor influencing PII distribution, but its influence has gradually weakened. This decline is closely tied to changes in land transfer policies. Different land transfer methods—such as allocation, bidding, auction, listing, and agreement—reflect varying levels of government involvement. Among these, agreement transfers involve the most direct government control, while auctions involve the least [61]. Figure 6 illustrates this shift: the proportion of land transfer for PIIs based on agreement has steadily declined, while listing-based transfers have become dominant, reflecting a reduction in direct government intervention.
However, this trend is not observed everywhere. In many western provinces of China, government intervention remains the dominant force in PII allocation, with land transfers still primarily conducted through administrative agreements. This contrast demonstrates that the BTH region is experiencing a more market-oriented transformation, while other regions continue to rely on strong state control, resulting in different trajectories of industrial spatial distribution. Nevertheless, the clustering of PIIs in some areas persists, even in regions with stringent environmental regulations. This is particularly evident in industrial parks in Beijing and Tianjin, where enterprises benefit from optimized resource allocation, lower environmental protection costs, and increased economic efficiency. These advantages reduce the restrictive impact of environmental regulations on PIIs clustering, allowing firms to continue operating in more developed areas. To balance regional economic environment with environmental sustainability, governments can further guide PIIs toward industrial parks by adjusting land supply strategies. This approach can maximize the advantages of regional economic environments while promoting efficient and sustainable industrial layouts.

4.4. Limitations and Future Research Directions

This study has several limitations. First, it focuses on the BTH region and does not include comparative quantitative analysis across other regions, which may limit the generalizability of the conclusions. Second, the classification of PIIs was based on available statistical categories, which may not fully capture differences between high-pollution, low-pollution, and emerging industries. Future research could address these limitations in several ways. First, a multi-region comparative study covering the Yangtze River Delta and the Pearl River Delta could help test the robustness and transferability of the findings. Second, future work should differentiate more clearly between industry types, considering their pollution intensity, technology level, and dependence on geographical factors.

5. Conclusions

This study develops an analytical framework and constructs a model to examine the driving factors and evolution mechanisms of newly established PIIs in the BTH region from 2007 to 2019 by integrating PCA with a GTWR model. By doing so, it contributes to the existing literature in three important ways. First, at the theoretical level, it reveals the evolutionary mechanism of PIIs from “policy-driven” to “park clustering,” bridging institutional and market perspectives within the framework of industrial geography. Second, at the methodological level, it applies a GTWR-based spatiotemporal analysis to capture the dynamic heterogeneity of industrial location determinants. Third, at the empirical level, it provides new evidence from the BTH region, enriching the understanding of PII evolution in developing countries.
In response to question 1, this study finds that government intervention is the dominant factor, though its influence weakens with technological progress, marketization, and reduced administrative control. Moderate economic development fosters agglomeration, while excessively high or low levels tend to inhibit clustering. Geographic location remains a key determinant, but its constraint gradually declines as transport networks, technological capacity, and market accessibility improve. Enterprise scale, innovation capability, and the presence of industrial parks have become increasingly important drivers of clustering, reflecting a shift from policy-led to market- and innovation-oriented agglomeration. In response to question 2, the results further show that these drivers display pronounced spatiotemporal heterogeneity, with two major shifts around 2011 and 2015, highlighting that the same driver may exert opposite effects across regions or periods. Moreover, interactions among factors, such as economic level shaping the intensity of government intervention, generate coupled spatiotemporal effects that jointly shape industrial distribution patterns.
Given the complexity of PII distribution mechanisms, it is essential to analyze them within the context of specific temporal, spatial, and industrial characteristics. Specifically, it is recommended that local governments raise the entry threshold for PIIs in regions with moderate economic development, such as Hebei Province in this study area, which has absorbed industrial transfers from more developed regions. Furthermore, efforts should be directed toward enhancing the infrastructure of industrial parks and encouraging the clustering of PIIs in these parks through centralized land supply, thereby promoting efficient and environmentally sustainable production models. Finally, differentiated land supply policies should be formulated based on regional development needs, natural geographic features, and industrial characteristics to enhance regional suitability. Considering the ongoing global restructuring of manufacturing, this study may serve as a reference for other developing countries facing similar challenges.

Author Contributions

Conceptualization, D.Z.; Methodology, Z.T. and Y.L.; Validation, Y.L.; Formal analysis, Z.T.; Data curation, Y.L.; writing—original draft preparation, H.Z. and Z.T.; writing—review and editing, H.Z., D.Z. and G.J.; Visualization, H.Z.; Supervision, D.Z. and G.J.; funding acquisition, D.Z. All authors have read and agreed to the published version of the manuscript.

Funding

This research was funded by National Natural Science Foundation of China (Grant Nos. 41401197, 42071249 and 41671519) and National Social Science Fund of China (Grant No. 20&ZD090).

Data Availability Statement

The datasets generated during and/or analysed during the current study are available from the corresponding author on reasonable request.

Conflicts of Interest

The authors declare no conflict of interest.

References

  1. Li, H.; Lu, J.; Li, B. Does pollution-intensive industrial agglomeration increase residents’ health expenditure? Sustain. Cities Soc. 2020, 56, 102092. [Google Scholar] [CrossRef]
  2. Chen, W.; Shen, Y.; Wang, Y.; Wu, Q. How do industrial land price variations affect industrial diffusion? Evidence from a spatial analysis of China. Land Use Policy 2018, 71, 384–394. [Google Scholar] [CrossRef]
  3. Du, G.; Liu, S.; Lei, N.; Huang, Y. A test of environmental Kuznets curve for haze pollution in China: Evidence from the panel data of 27 capital cities. J. Clean. Prod. 2018, 205, 821–827. [Google Scholar] [CrossRef]
  4. Wang, Y.; Duan, X.; Wang, L.; Zou, H. Spatial temporal patterns and driving factors of industrial pollution and structures in the Yangtze River Economic Belt. Chemosphere 2022, 303, 134996. [Google Scholar] [CrossRef]
  5. Badri, M. Dimensions of industrial location factors: Review and exploration. J. Bus. Public Aff. 2007, 1, 1–26. [Google Scholar]
  6. Wu, H.; Guo, H.; Zhang, B.; Bu, M. Westward movement of new polluting firms in China: Pollution reduction mandates and location choice. J. Comp. Econ. 2017, 45, 119–138. [Google Scholar] [CrossRef]
  7. Wang, Q.; Wang, Y.; Chen, W.; Zhou, X.; Zhao, M.; Zhang, B. Do land price variation and environmental regulation improve chemical industrial agglomeration? A regional analysis in China. Land Use Policy 2020, 94, 104568. [Google Scholar] [CrossRef]
  8. Dean, J.M.; Lovely, M.E.; Wang, H. Are foreign investors attracted to weak environmental regulations? Evaluating the evidence from China. J. Dev. Econ. 2009, 90, 1–13. [Google Scholar] [CrossRef]
  9. Shen, J.; Wei, Y.D.; Yang, Z. The impact of environmental regulations on the location of pollution-intensive industries in China. J. Clean. Prod. 2017, 148, 785–794. [Google Scholar] [CrossRef]
  10. Ahmad, M.; Jabeen, G.; Wu, Y. Heterogeneity of pollution haven/halo hypothesis and Environmental Kuznets Curve hypothesis across development levels of Chinese provinces. J. Clean. Prod. 2021, 285, 124898. [Google Scholar] [CrossRef]
  11. Hu, J.; Liang, J.; Fang, J.; He, H.; Chen, F. How do industrial land price and environmental regulations affect spatiotemporal variations of pollution-intensive industries? Regional analysis in China. J. Clean. Prod. 2022, 333, 130035. [Google Scholar] [CrossRef]
  12. Liu, W.; Shen, J.; Wei, Y.D. Spatial restructuring of pollution-intensive enterprises in Foshan China: Effects of the changing role of environmental regulation. J. Environ. Manag. 2023, 325, 116501. [Google Scholar] [CrossRef] [PubMed]
  13. Ma, S.; Wang, L.; Wang, H.; Zhang, X.; Jiang, J. Spatial heterogeneity of ecosystem services in response to landscape patterns under the Grain for Green Program: A case-study in Kaihua County, China. Land Degrad. Dev. 2022, 33, 1901–1916. [Google Scholar] [CrossRef]
  14. Bu, Y.; Wang, E.; Jiang, Z. Evaluating spatial characteristics and influential factors of industrial wastewater discharge in China: A spatial econometric approach. Ecol. Indic. 2021, 121, 107219. [Google Scholar] [CrossRef]
  15. Tu, W.; Rao, C.; Xiao, X.; Hu, F.; Goh, M. Interactive geographical and temporal weighted regression to explore spatio-temporal characteristics and drivers of carbon emissions. Environ. Technol. Innov. 2024, 36, 103836. [Google Scholar] [CrossRef]
  16. Liu, J.; Diamond, J. China’s environment in a globalizing world. Nature 2005, 435, 1179–1186. [Google Scholar] [CrossRef]
  17. Li, R.; Ramanathan, R. Exploring the relationships between different types of environmental regulations and environmental performance: Evidence from China. J. Clean. Prod. 2018, 196, 1329–1340. [Google Scholar] [CrossRef]
  18. Kong, W.; Shen, W.C.; Yu, C.Y.; Niu, L.; Zhou, H.X.; Zhang, Z.F.; Guo, S. The neglected cost: Ecosystem services loss due to urban expansion in China from a triple-coupling perspective. Environ. Impact Assess. Rev. 2025, 112, 107827. [Google Scholar] [CrossRef]
  19. Zhang, G.; Liu, W.; Duan, H. Environmental regulation policies, local government enforcement and pollution-intensive industry transfer in China. Comput. Ind. Eng. 2020, 148, 106748. [Google Scholar] [CrossRef]
  20. Hu, J.; Liu, Y.; Fang, J.; Jing, Y.; Liu, Y.; Liu, Y. Characterizing pollution-intensive industry transfers in China from 2007 to 2016 using land use data. J. Clean. Prod. 2019, 223, 424–435. [Google Scholar] [CrossRef]
  21. Chen, L.; Xu, L.; Yang, Z. Accounting carbon emission changes under regional industrial transfer in an urban agglomeration in China’s Pearl River Delta. J. Clean. Prod. 2017, 167, 110–119. [Google Scholar] [CrossRef]
  22. Wang, H.; Dong, C.; Liu, Y. Beijing direct investment to its neighbors: A pollution haven or pollution halo effect? J. Clean. Prod. 2019, 239, 118062. [Google Scholar] [CrossRef]
  23. Fu, S.; Ma, Z.; Ni, B.; Peng, J.; Zhang, L.; Fu, Q. Research on the spatial differences of pollution-intensive industry transfer under the environmental regulation in China. Ecol. Indic. 2021, 129, 107921. [Google Scholar] [CrossRef]
  24. Luo, Y.; Zhou, D.; Tian, Y.; Jiang, G. Spatial and temporal characteristics of different types of pollution-intensive industries in the Beijing-Tianjin-Hebei region in China by using land use data. J. Clean. Prod. 2021, 329, 129601. [Google Scholar] [CrossRef]
  25. Chinese Academy of Sciences. Resource and Environment Science Data Center. Available online: http://www.resdc.cn/ (accessed on 4 June 2022).
  26. National Development and Reform Commission; Ministry of Science and Technology; Ministry of Natural Resources; Ministry of Housing and Urban-Rural Development; Ministry of Commerce; General Administration of Customs of the People’s Republic of China. China Development Zone Audit and Announcement Catalog (2018 Edition). 2018. Available online: https://www.gov.cn/zhengce/zhengceku/2018-12/31/content_5434045.htm (accessed on 4 June 2022).
  27. China Land Market Network. Available online: https://www.landchina.com/#/ (accessed on 4 June 2022).
  28. Bingham, R.D.; Mier, R. Theories of Local Economic Development: Perspectives from Across the Disciplines; SAGE: Newcastle upon Tyne, UK, 1993. [Google Scholar]
  29. Harkness, J. Factor Abundance and Comparative Advantage. Am. Econ. Rev. 1978, 68, 784–800. [Google Scholar]
  30. Zheng, F.; Niu, Y. Environmental Decentralization, Resource Endowment and Urban Industrial Transformation and Upgrading: A Comparison of Resource-Based and Non-Resource-Based Cities in China. Sustainability 2023, 15, 10475. [Google Scholar] [CrossRef]
  31. Arvanitopoulos, T.; Monastiriotis, V.; Panagiotidis, T. Drivers of convergence: The role of first- and second-nature geography. Urban Stud. 2021, 58, 2880–2900. [Google Scholar] [CrossRef]
  32. Wu, Z.; Woo, S.-H.; Lai, P.-L.; Chen, X. The economic impact of inland ports on regional development: Evidence from the Yangtze River region. Transp. Policy 2022, 127, 80–91. [Google Scholar] [CrossRef]
  33. Lu, C.; Ouyang, Q. Environmental regulation and urban position in the inter-urban pollution transfer network: A perspective on network analysis of pollution-intensive enterprises’ relocation. J. Clean. Prod. 2024, 435, 140418. [Google Scholar] [CrossRef]
  34. Zhang, C.; Tao, R.; Yue, Z.; Su, F. Regional competition, rural pollution haven and environmental injustice in China. Ecol. Econ. 2023, 204, 107669. [Google Scholar] [CrossRef]
  35. Su, L. Environmental regulation and corporate green innovation: Evidence from the implementation of the total energy consumption target in China. J. Bus. Econ. 2025, 95, 499–526. [Google Scholar] [CrossRef]
  36. Bai, Y.; Hua, C.; Jiao, J.; Yang, M.; Li, F. Green efficiency and environmental subsidy: Evidence from thermal power firms in China. J. Clean. Prod. 2018, 188, 49–61. [Google Scholar] [CrossRef]
  37. He, C.; Wei, Y.D.; Xie, X. Globalization, Institutional Change, and Industrial Location: Economic Transition and Industrial Concentration in China. Reg. Stud. 2008, 42, 923–945. [Google Scholar] [CrossRef]
  38. Yin, K.; Miao, Y.; Huang, C. Environmental regulation, technological innovation, and industrial structure upgrading. Energy Environ. 2024, 35, 207–227. [Google Scholar] [CrossRef]
  39. Choi, G. Determinants of target location selection for acquirers in the manufacturing sector: Pollution intensity, policy enforcement, and civic environmentalism. J. Bus. Res. 2022, 146, 308–324. [Google Scholar] [CrossRef]
  40. Guo, Y.; Tian, J.; Chen, L. Managing energy infrastructure to decarbonize industrial parks in China. Nat. Commun. 2020, 11, 981. [Google Scholar] [CrossRef]
  41. Liu, M.; Zhou, X.; Huang, G.; Li, Y. The increasing water stress projected for China could shift the agriculture and manufacturing industry geographically. Commun. Earth Environ. 2024, 5, 396. [Google Scholar] [CrossRef]
  42. Ding, L.; Fang, X. Spatial–temporal distribution of air-pollution-intensive industries and its social-economic driving mechanism in Zhejiang Province, China: A framework of spatial econometric analysis. Environ. Dev. Sustain. 2022, 24, 1681–1712. [Google Scholar] [CrossRef]
  43. Song, G.; Feng, W. Analysis of the spatial layout and influencing factors of pollution-intensive industries based on enterprise dynamics. Ecol. Indic. 2023, 152, 110378. [Google Scholar] [CrossRef]
  44. Xue, X.; Luo, J.; Wang, Z.; Ding, H. Impact of Green Credit Policy on the sustainable growth of pollution-intensive industries: Evidence from China. Comput. Ind. Eng. 2023, 182, 109371. [Google Scholar] [CrossRef]
  45. Dou, J.; Han, X. How does the industry mobility affect pollution industry transfer in China: Empirical test on Pollution Haven Hypothesis and Porter Hypothesis. J. Clean. Prod. 2019, 217, 105–115. [Google Scholar] [CrossRef]
  46. Jiang, Z.; Lyu, P. Stimulate or inhibit? Multiple environmental regulations and pollution-intensive Industries’ Transfer in China. J. Clean. Prod. 2021, 328, 129528. [Google Scholar] [CrossRef]
  47. Song, M.; Xie, Q.; Chen, J. Effects of government competition on land prices under opening up conditions: A case study of the Huaihe River ecological economic belt. Land Use Policy 2022, 113, 105875. [Google Scholar] [CrossRef]
  48. Kong, W.; Huang, J.; Niu, L.; Chen, S.C.; Zhou, J.H.; Zhang, Z.F.; Guo, S. Innovative framework for identification and spatiotemporal dynamics analysis of industrial land at parcel scale with multidimensional attributes. Cities 2025, 162, 105958. [Google Scholar] [CrossRef]
  49. Hu, W.-Q.; Fang, J. Green credit and firms’ emission reduction performance: Evidence from China. World Dev. 2025, 194, 107075. [Google Scholar] [CrossRef]
  50. Wang, Q.; Sun, T.; Li, R. Does larger scale enhance carbon efficiency? Assessing the impact of corporate size on manufacturing carbon emission efficiency. Humanit. Soc. Sci. Commun. 2024, 11, 993. [Google Scholar] [CrossRef]
  51. Zhao, X.; Qi, Y. Why Do Firms Obey?: The State of Regulatory Compliance Research in China. J. Chin. Polit. Sci. 2020, 25, 339–352. [Google Scholar] [CrossRef]
  52. Hu, W.; Guo, Y.; Tian, J.; Chen, L. Energy and water saving potentials in industrial parks by an infrastructure-integrated symbiotic model. Resour. Conserv. Recycl. 2020, 161, 104992. [Google Scholar] [CrossRef]
  53. Huang, B.; Wu, B.; Barry, M. Geographically and temporally weighted regression for modeling spatio-temporal variation in house prices. Int. J. Geogr. Inf. Sci. 2010, 24, 383–401. [Google Scholar] [CrossRef]
  54. Huang, X.; Shen, J.; Sun, F.; Wang, L.; Zhang, P.; Wan, Y. Study on the Spatial and Temporal Distribution of the High–Quality Development of Urbanization and Water Resource Coupling in the Yellow River Basin. Sustainability 2023, 15, 12270. [Google Scholar] [CrossRef]
  55. He, C.; Huang, Z.; Ye, X. Spatial heterogeneity of economic development and industrial pollution in urban China. Stoch. Environ. Res. Risk Assess. 2014, 28, 767–781. [Google Scholar] [CrossRef]
  56. Liu, C.; Zhou, H.; Li, Z.; Zhou, D.; Tian, Y.; Jiang, G. Location Preferences and Changes in Pollution-Intensive Firms from the Yangtze River Economic Belt, China. Land 2024, 13, 1883. [Google Scholar] [CrossRef]
  57. Li, Y.; Dai, F.; Li, B.; Pang, J. Influence of Policy Factors on Relocation of Resource-Based Enterprises. China Popul. Environ. 2015, 25, 135–141. [Google Scholar]
  58. Pasurka, C. Perspectives on pollution abatement and competitiveness: Theory, data, and analyses. Rev. Environ. Econ. Policy 2008, 22, 194–218. [Google Scholar] [CrossRef]
  59. Ben Kheder, S.; Zugravu, N. Environmental regulation and French firms location abroad: An economic geography model in an international comparative study. Ecol. Econ. 2012, 77, 48–61. [Google Scholar] [CrossRef]
  60. Zhou, Y.; Zhu, S.; He, C. How do environmental regulations affect industrial dynamics? Evidence from China’s pollution-intensive industries. Habitat Int. 2017, 60, 10–18. [Google Scholar] [CrossRef]
  61. Tu, F.; Ge, J.; Liu, D.; Zhong, Q. Determinants of Industrial Land Price in the Process of Land Marketization Reform in China. China Land Sci. 2017, 31, 33–41. [Google Scholar] [CrossRef]
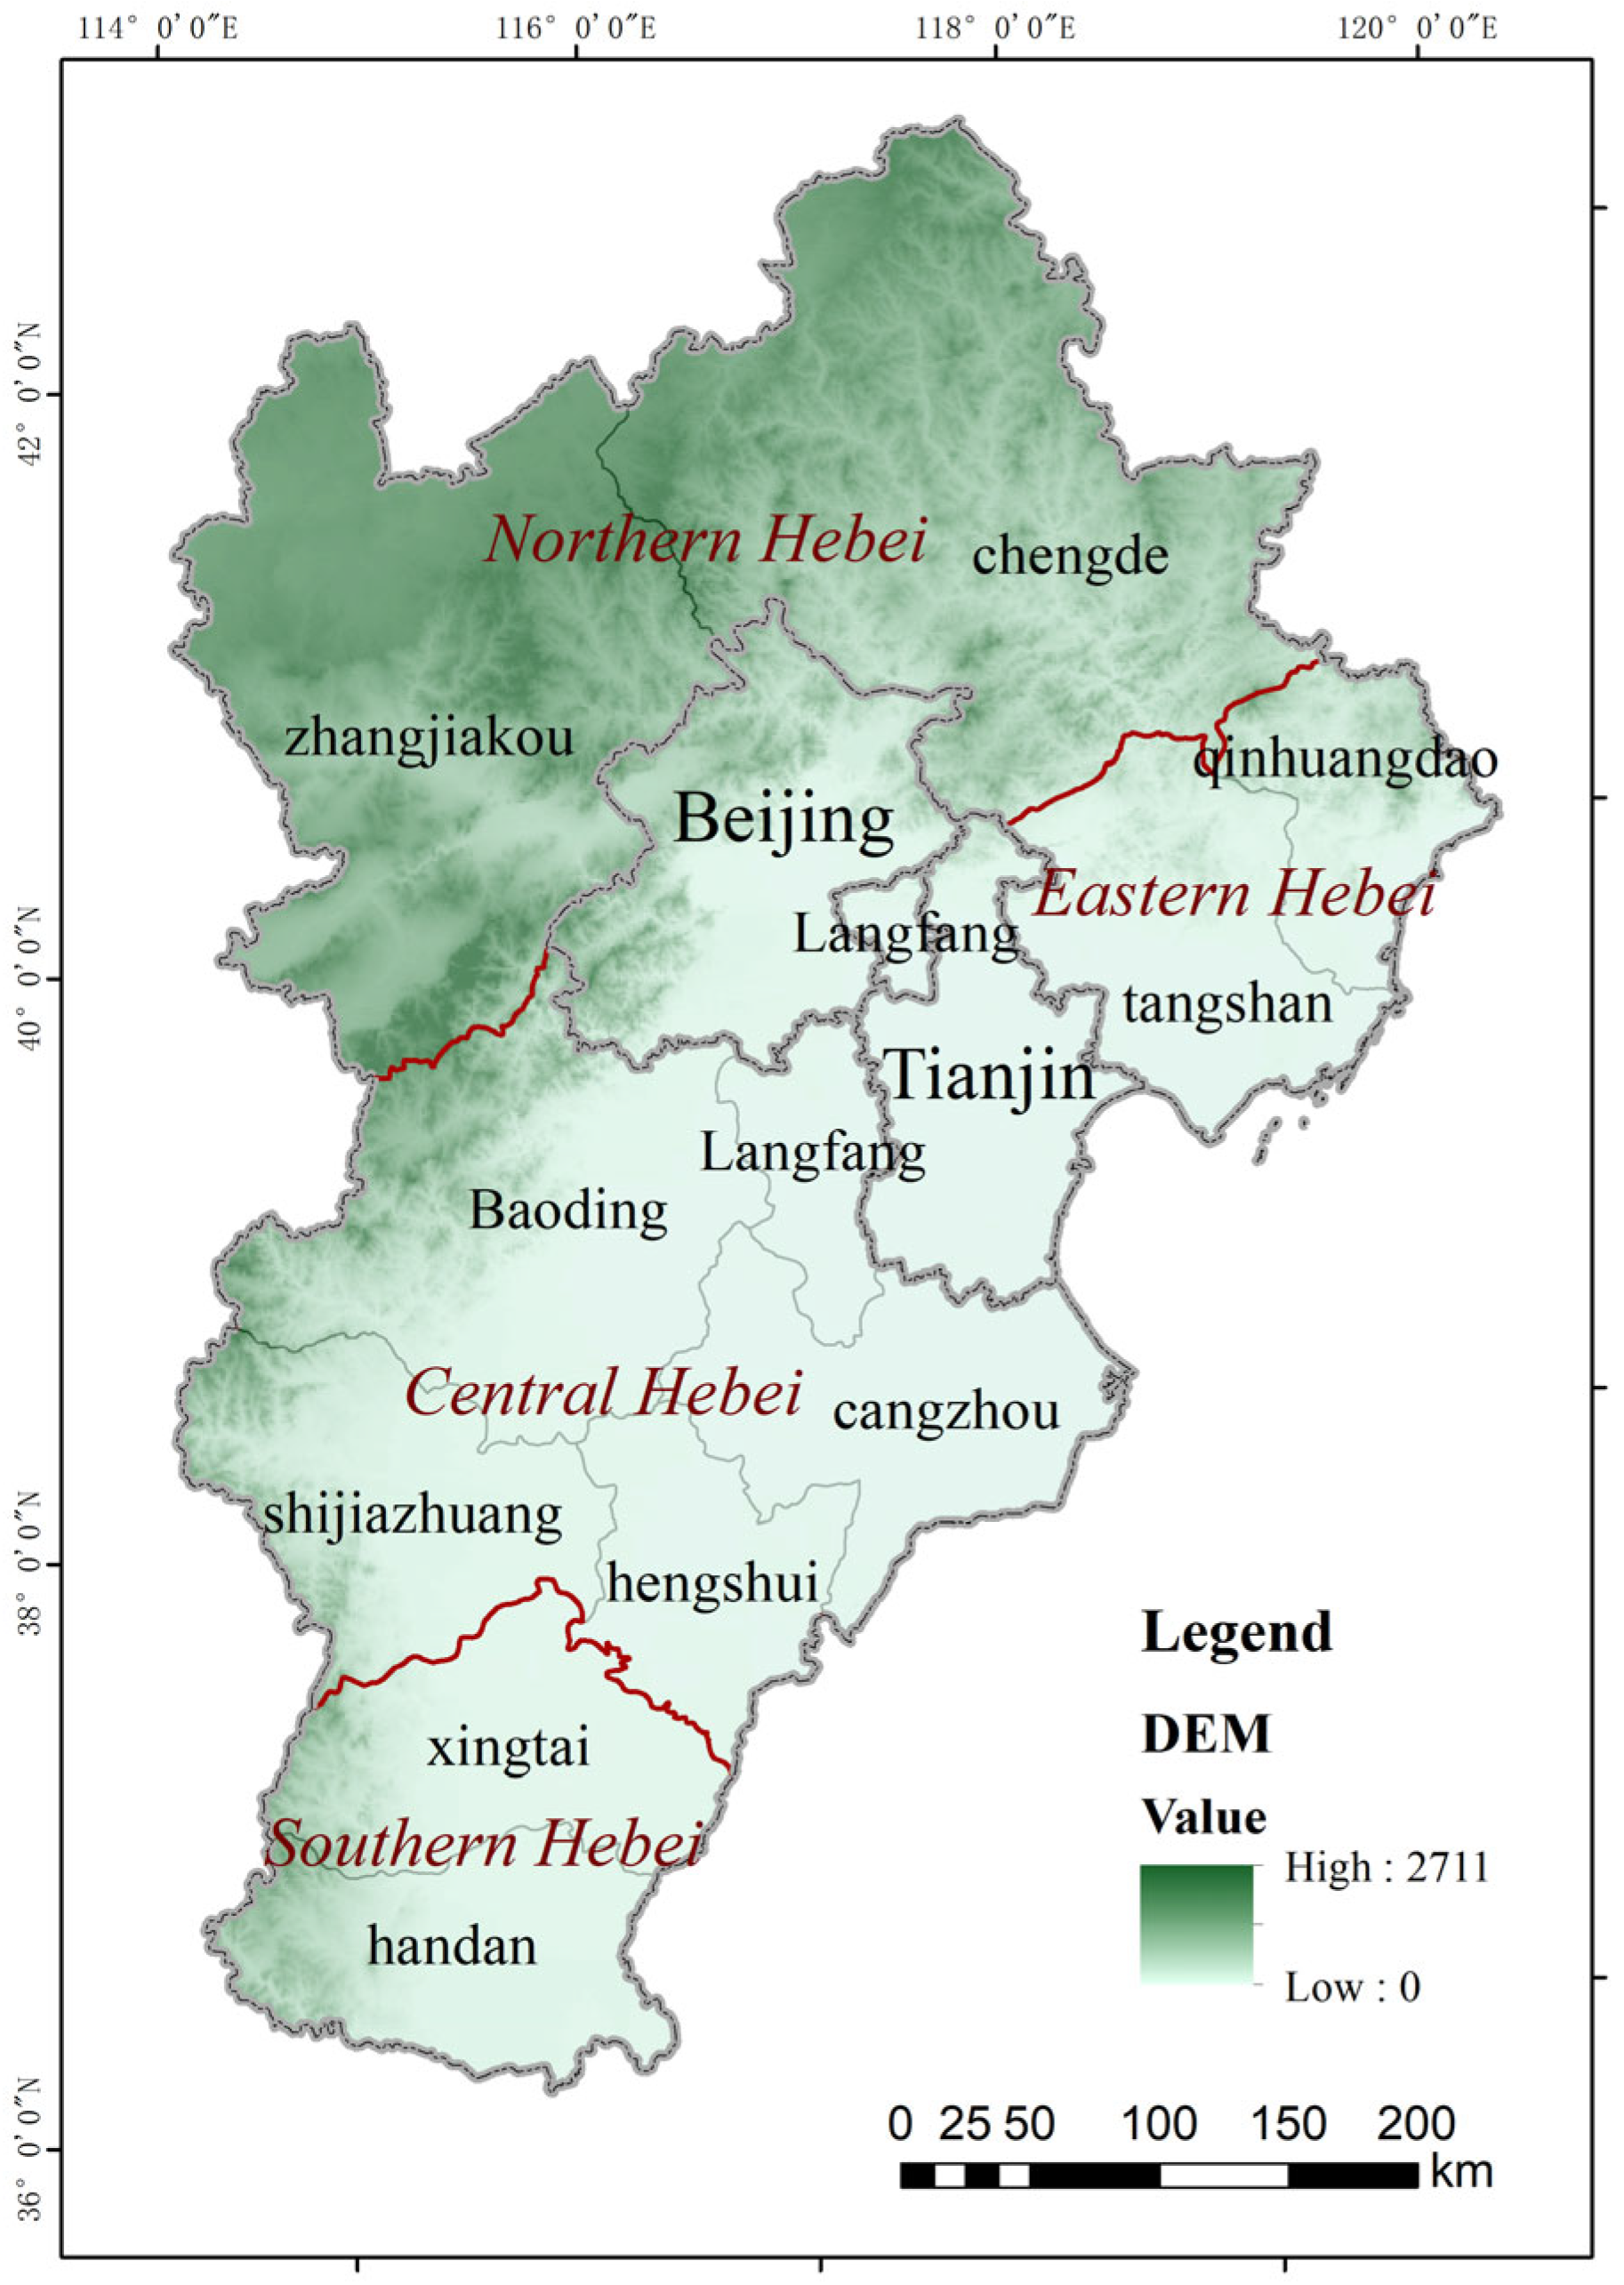
Figure 1. Study area.
Land 14 02103 g001
Figure 2. The change trends over time of the GTWR regression coefficients from 2007 to 2019.
Land 14 02103 g002
Figure 3. Distribution of regression coefficients of factors influencing the distribution of PIIs from 2007 to 2019.
Land 14 02103 g003
Figure 4. Statistics regarding the proportion of new established PIIs from 2007 to 2019 ((left): by altitude; (right): by distance from the river).
Land 14 02103 g004
Figure 5. Statistics regarding the proportion of new PIIs according to the per capita GDP classification.
Land 14 02103 g005
Figure 6. Changes in land transfer methods for PIIs in the BTH during the period of 2007 to 2019.
Land 14 02103 g006
Table 1. Model of the influencing factors underlying the distribution of PIIs.
DimensionsCodeIndicatorsExplanation of Indicators
Natural geographical factorsALTerrainAltitude (m)
DFRDistance from waterDistance from the nearest river (m)
Socioeconomic factorsPGDPRegional economic development levelPer capita GDP (yuan)
LCLabor costAverage salary of employees (yuan)
MSMarket sizeRegional population density (10,000 people/square kilometer)
TLTechnologyNumber of patent authorizations
CIInvestmentInvestment in fixed assets (10,000 yuan)
Government institutional factorsLPLand priceActual transaction price of industrial land (yuan)
ERIEnvironmental regulationEnvironmental regulation intensity index
FDFiscal decentralizationFiscal revenue in the municipal government budget/total fiscal expenditure in the budget (%)
Firm attribute factorsFSFirm sizeArea of new construction land for PIIs (hectares)
IPIndustrial parkWhether located in an industrial park
Table 2. The PCA component matrix. The main contributors to each PC are highlighted in bold.
IndicatorsY1
Economic Development Direction
Y2
Firm
Scale
Direction
Y3
Government Intervention Direction
Y4
Geographical Location Direction
AL−0.213−0.3070.1210.609
DFR−0.0310.196−0.023−0.785
PGDP0.8040.058−0.2800.092
LC0.702−0.3010.437−0.107
MS0.8130.150−0.3180.053
TL0.892−0.1470.163−0.015
CI0.901−0.027−0.0440.025
LP0.2570.6410.4320.098
ERI0.642−0.3320.537−0.115
FD0.7230.227−0.5150.131
FS0.0340.7150.3890.228
Table 3. Comparison of the goodness of fit of the OLS, GWR, and GTWR models.
ModelR2AICc
OLS0.16287,176.4
GWR0.50783,335.8
GTWR0.73578,502.7
Disclaimer/Publisher’s Note: The statements, opinions and data contained in all publications are solely those of the individual author(s) and contributor(s) and not of MDPI and/or the editor(s). MDPI and/or the editor(s) disclaim responsibility for any injury to people or property resulting from any ideas, methods, instructions or products referred to in the content.