Article

Population–Land–Industry–Facility System Coupling Coordination and Influencing Factors in Hebei Province

1
College of Land and Resources, Hebei Agricultural University, Baoding 071000, China
2
Research Center of Local Culture and Rural Governance, Hebei Agricultural University, Baoding 071000, China
3
Key Laboratory for Farmland Eco-Environment of Hebei Province, Baoding 071000, China
4
College of Resources and Environmental Sciences, Hebei Agricultural University, Baoding 071000, China
*
Author to whom correspondence should be addressed.
Land 2025, 14(10), 2043; https://doi.org/10.3390/land14102043
Submission received: 2 September 2025 / Revised: 2 October 2025 / Accepted: 8 October 2025 / Published: 13 October 2025

Abstract

Exploring the interactions and coupling effects in the Population–Land–Industry–Facility (PLIF) system can help maximize resource allocation and promote the synergistic development of systems. This study constructs an index system for the PLIF system in Hebei Province, employing coupling coordination degree and spatial autocorrelation methods to investigate the spatio-temporal evolution of the system’s coordination. Furthermore, grey relational analysis is employed to examine the key factors influencing the coordination degree of the system. The results show the following: (1) The development levels of each subsystem and the overall development level of the PLIF system in Hebei Province have generally increased, but the overall level remains relatively low. (2) The PLIF system in Hebei Province exhibits a pattern of “low in the north and high in the south, high in the east and low in the west”, with most counties in a barely coordinated state and a generally high degree of coupling. (3) The main factors affecting the coordinated development of the PLIF system include population density, the proportion of the tertiary industry, and the degree of non-agriculturalization of rural labor force. The research results of this paper provide a reference for promoting the coordinated development of population, land, industry, and facilities in Hebei Province and facilitating the sustainable development of the region.

1. Introduction

Against the backdrop of rapid urbanization and industrialization, a series of challenges have emerged, including acute conflicts between human and land resources [1], uncoordinated industrial structure [2], insufficient public facilities [3], aggravated environmental pollution [4], and excessive resource consumption [5]. These issues have led to increasingly severe inefficiencies in the allocation and functioning of resources related to population, land, industry, and infrastructure, which not only reduce resource utilization efficiency and undermine territorial competitiveness, but also pose significant obstacles to long-term development [6,7]. Moreover, in the context of globalization, countries have generally recognized the importance of coordinated regional development. Through measures such as policy coordination, industrial upgrading, and facility improvement, they aim to narrow regional disparities, enhance overall competitiveness, and promote balanced regional development, ultimately leading to shared prosperity [8]. Given the rising ecological stress and significant spatial mismatches in resource distribution, it is essential to clarify the interaction among population concentration, land development intensity, industrial upgrading, and public resource allocation in the rapid advancement stage of urbanization. This involves uncovering the spatial differentiation patterns of these elements and their underlying mechanisms, as well as proposing optimization strategies for multi-element synergy. Such efforts are essential for laying a scientific foundation to advance regional sustainable development and new urbanization pathways [9].
Human society functions as an intricate framework comprising natural, social, economic, and governance subsystems. Population, land, and industry serve as vital components, each corresponding to the social, natural, and economic spheres, and are essential for fostering balanced regional growth [10,11]. Currently, research around these elements has produced relatively rich results, but most of it focuses on the relationship between two sub-systems [12], such as the land–population [13,14], industry–population [15,16], and industry–land [17,18] binary analysis frameworks. With the deepening of systems thinking, some studies have begun to attempt to construct a “population–land–industry” ternary system, using methods such as the index system approach [19], coupling coordination degree model [20], and system dynamics model [21] to explore the co-evolutionary laws among the three. In terms of driving factor analysis, studies often employ tools like the Geodetector model [22], spatial econometric model [23], and Geographically Weighted Regression [24], systematically analyzing the influence mechanisms from different spatial scales such as municipal [25], county [26], and village [27] levels. In recent years, some scholars have attempted to incorporate key natural elements such as water resources into the population–land–industry system analysis to expand the understanding of regional sustainable development paths [28] or construct a comprehensive framework of “people–land–industry–money” to explore the role of financial elements in system coordination [29,30].
Despite the significant progress made in existing research, there are still some limitations. On the one hand, most studies focus on the relationships between two or three elements, lacking a systematic perspective that integrates population, land, industry, and infrastructure into a unified analytical framework. On the other hand, infrastructure is often regarded as an external condition or result variable, and its intrinsic mechanism as a key link connecting population distribution, land function, and industrial activities has not been fully explored. In fact, infrastructure plays a central mediating role in the collaborative system, serving as a key driver for promoting coupled development and providing sustained support for high-quality regional development [31,32]. Specifically, public service facilities influence population migration and regional attractiveness through the distribution of resources such as education and healthcare [33,34]; transportation facilities guide population concentration and industrial spatial reorganization by enhancing land accessibility [35,36]; information facilities promote cross-regional factor allocation through data flow [37,38]; and ecological environment facilities affect the conditions for human settlement and industrial access through the optimization of carrying capacity [39,40]. Ignoring the integration role of infrastructure will make it difficult to fully reveal the deep logic of synergy and conflict within the system, leading to inefficient resource allocation and development imbalance.
As a key component of the Beijing-Tianjin-Hebei region, Hebei Province is not only a major population center and agricultural province but also serves as an industrial hub and ecological barrier. However, during the process of urbanization, it has exposed problems such as excessive population concentration, extensive land use, an industrial structure biased towards heavy industry, and significant urban–rural disparities in infrastructure. In response to growing resource and environmental pressures and the need for transformational development, this study constructs a four-dimensional “population–land–industry–facility” (PLIF) analytical framework. This framework enables a systemic examination of regional coordination mechanisms and helps address the current research fragmentation in this field. The theoretical innovation of this paper lies in breaking through the traditional binary or ternary analysis paradigm and incorporating infrastructure as an endogenous variable into the PLIF system to deeply explain its intermediary role among population, land, and industry, enhancing the explanatory power of the PLIF system’s coordination mechanism. Methodologically, it comprehensively employs the coupling coordination degree model, spatial autocorrelation analysis, and grey relational degree model to enhance the ability to analyze the evolution pattern and driving forces of the PLIF system. This study takes the county level of Hebei Province as the unit and focuses on the following issues: (1) constructing a comprehensive evaluation index system for the PLIF system to reveal the spatio-temporal evolution characteristics of the system’s development level from 2007 to 2022; (2) the spatial differentiation pattern of the PLIF system’s collaborative relationship is identified by using the coupling coordination degree and spatial autocorrelation methods; and (3) the key factors influencing the PLIF system’s coordination degree are identified through grey relational analysis. The theoretical framework and methodological approach developed in this study hold value that extends beyond the case study of Hebei Province, offering significant planning implications and theoretical relevance for other regions facing similar developmental challenges. This research provides a systemic perspective that helps integrate population, land, industry, and infrastructure objectives into regional planning, promotes integrated planning, and offers practical guidance for formulating targeted development strategies and optimizing the allocation of public resources—thereby enhancing the synergy and implementability of regional plans. Furthermore, the framework establishes a common basis for comparative studies across regions, helping to identify both generic and context-specific factors influencing systemic coordination. This will contribute to the development of more universally applicable regional development models and support the adaptation and scaling of related policies across diverse contexts, strengthening the theoretical underpinning of academic research for regional governance practice.

2. Materials and Methods

2.1. Research Framework

The research design is shown in Figure 1 and is divided into two stages overall. The first stage: Analysis of the development level of the PLIF system. Firstly, based on existing research, a comprehensive evaluation index system for the PLIF system in Hebei Province is constructed, and corresponding data are collected. Then, the development levels of each subsystem and the PLIF system as a whole are calculated respectively using the comprehensive evaluation model, and their spatio-temporal evolution characteristics are analyzed. The second stage: Coupling and coordination analysis of the PLIF system. Firstly, the spatio-temporal variation laws of the internal coupling degree and coupling coordination degree of the PLIF system are revealed by means of the coupling coordination degree model. Then, the spatial agglomeration characteristics of the system’s coupling coordination degree are identified using the global and local Moran’s index. On this basis, the key factors affecting the coordinated development of the system are analyzed through the grey relational degree model. Finally, combined with the quantitative analysis results, policy suggestions for promoting the coordinated optimization of the PLIF system in Hebei Province are proposed.

2.2. Population, Land, Industry, and Facilities Interactions

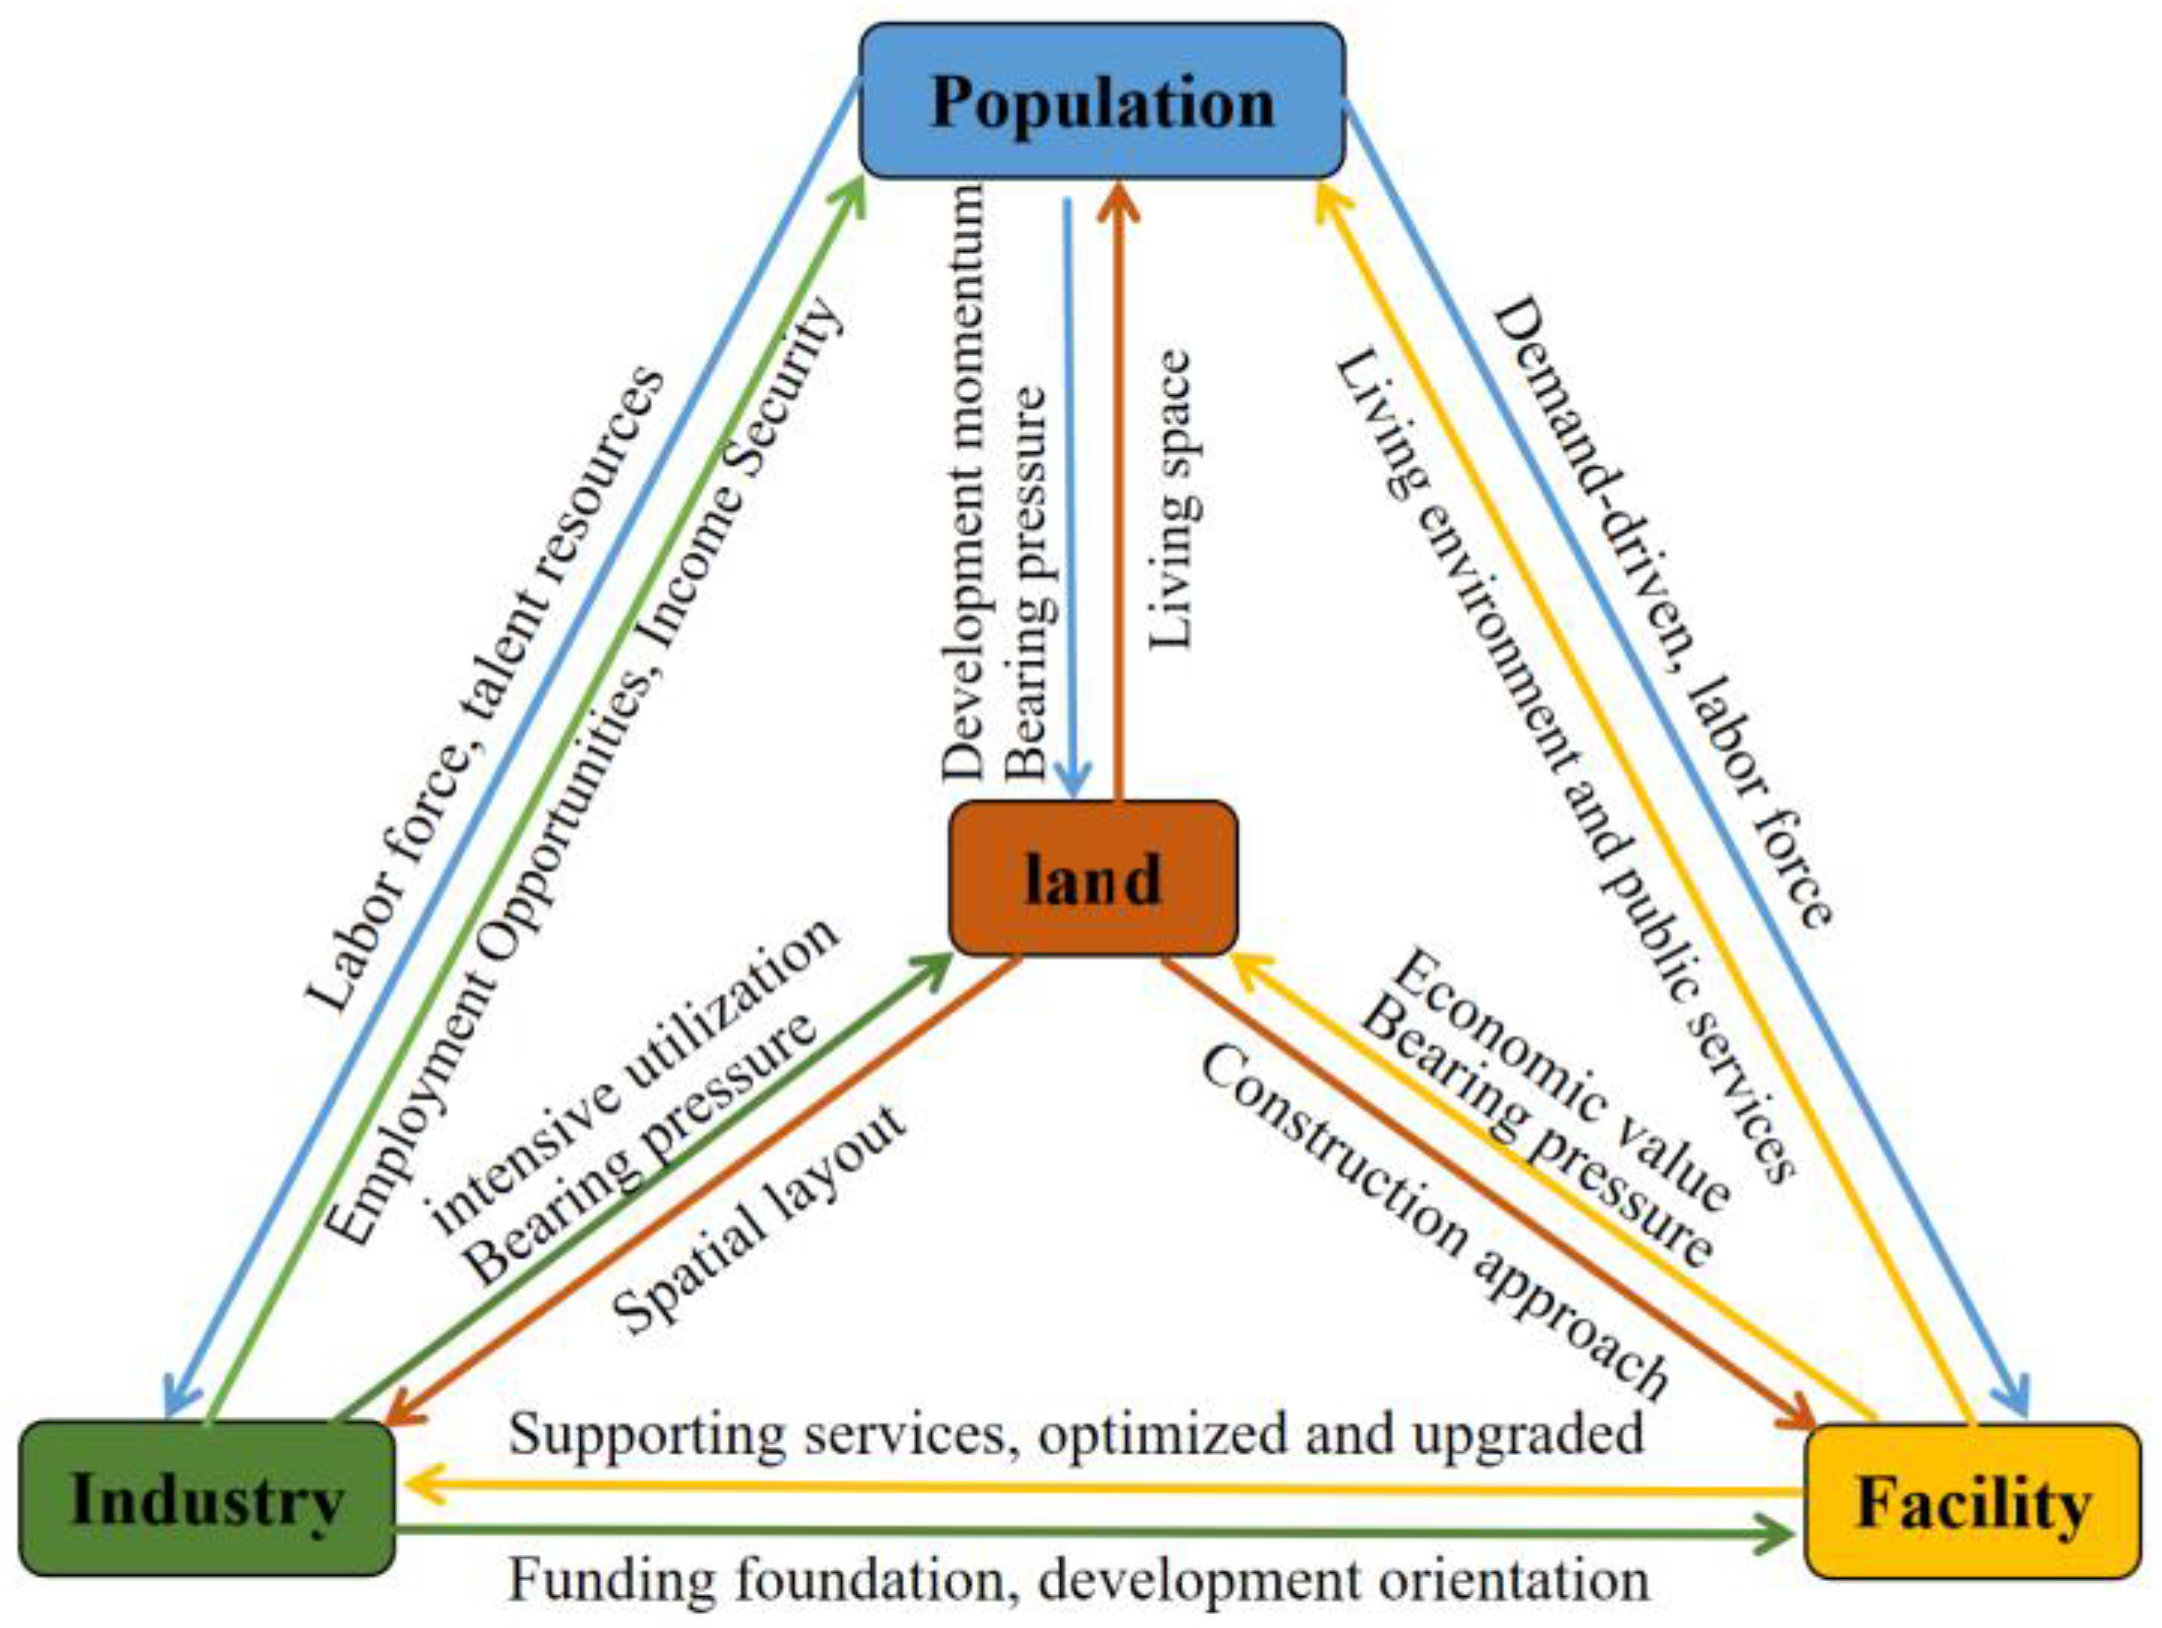
The essential components of regional growth are population, land, industry, and facilities, and their dynamic changes and degree of coordination and integration directly affect the ability of sustainable development. The four elements interact with each other and form an inseparable whole (Figure 2).
Population mobility has altered the ratio between population and land, thereby driving changes in land use patterns. As population density increases, the pace of land development and utilization accelerates. People continuously gather in towns and cities in pursuit of better job opportunities, higher incomes, and more comprehensive public services. The continuous inflow of labor supports industrial modernization, while modernization development places higher demands on the quality of workers. The improvement of population quality promotes the transformation of the industrial structure towards high value-added sectors, accelerates the rapid development of the tertiary industry, and provides more skilled job opportunities, further attracting high-quality population inflows. At the same time, it also promotes the continuous improvement of urban infrastructure and public service systems, enhancing the ability to meet the living needs of the population [41]. Land, as an important spatial foundation for regional development, provides living space for the population, carries the development of industries and infrastructure, and determines their layout and construction methods. Industries, based on their types, development stages, and spatial characteristics, scientifically plan, rationally develop, and efficiently allocate land to maximize economic benefits and achieve intensive land use. The improvement of infrastructure enhances the accessibility and development potential of land, increases utilization efficiency, and drives up land prices. The economic benefits brought by industrial upgrading provide financial support for facility construction, and the increased demand for facility scale further promotes the optimization and upgrading of the industrial structure towards high value-added sectors. Facility construction includes living service facilities such as housing, education, healthcare, and culture, providing a good living environment and public service guarantees for the population; production facilities are the foundation of industrial development, influencing production efficiency and product quality, and providing necessary supporting services for industries. High-quality facility construction not only expands the functions of land but also enhances its economic value, serving as a key support for achieving coordinated regional development. Therefore, only by achieving coordinated development among population, land, industry, and facilities can resource allocation be optimized, development quality be improved, and regional balanced and sustainable development be promoted.
However, various real-world challenges often hinder coordinated development among the four systems. First, the limited carrying capacity of land resources—determined by their natural endowment—restricts their ability to support excessive population, industry, and infrastructure. The rapid advancement of population activities, industrial development, and facility construction has put double pressure on land resources. Specifically, population increase and accelerated urbanization have intensified the demographic load on land, raising demands for housing, transportation, and public services, which complicates land allocation and utilization. Simultaneously, industrial expansion and infrastructure construction have heightened resource and environmental stress, with large-scale industrial zones, commercial projects, and public works occupying vast land areas and causing issues such as soil erosion, ecological degradation, and pollution. These pressures threaten the sustainable utilization of land and ecological balance, posing long-term challenges to regional development. Additionally, the location of land is fixed, in contrast to population, industry, and facilities, which are more flexible and able to move between regions according to the laws of the market. These differences exacerbate the difficulty of coordination among systems [42].

2.3. Study Area

Hebei Province is located in North China, between 36°05′ N–42°40′ N and 113°27′ E–119°50′ E, with a total area of about 188,800 km2, and under the jurisdiction of 11 prefecture-level cities (Figure 3). It features a complex and diverse topography, being the only province in China with the Bashang Plateau, mountainous and hilly areas, basins and plains, and lakes and seas. Hebei Province is a major province in terms of population, with a permanent resident population of 73.93 million in 2023, and an urbanization rate of 62.77%. The province is also abundant in arable land resources, with a total arable land area of 6.088393 million hectares in 2023, ranking fifth in China. However, the per capita arable land area remains at only a moderate level. The structure of the three industries in Hebei Province is relatively stable, with the secondary and tertiary industries accounting for about 90% of the total, contributing to economic growth to a greater extent. Key industries include iron and steel, coal, chemicals, building materials, equipment manufacturing, and electric power, forming the backbone of Hebei’s economy. Due to its rapid economic and social development, Hebei Province is currently facing problems such as population growth, land resource constraints, imbalance in industrial structure, and poor overall quality of urban development. Therefore, in-depth research on the interactions among population, land, industry, and infrastructure is of great significance for Hebei Province to alleviate excessive population concentration, optimize land resource allocation, promote industrial upgrading and transformation, enhance urban development quality, and drive sustainable social and economic development.

2.4. Data Sources

Land use data of Hebei Province for four periods in 2007, 2012, 2017, and 2022 were obtained from Yang et al. [43]. DEM data were obtained from the RiSpace Data Cloud Platform with a resolution of 30 m. Data on population, land, industry, and facilities in Hebei Province were collected from Hebei Rural Statistical Yearbook, Hebei Statistical Yearbook, and Statistical Yearbook for each county in Hebei. Missing data were supplemented using linear interpolation.

2.5. Research Methods

2.5.1. Construction of the PLIF Evaluation Index System

Based on the interrelationships among population, land, industry and facilities, and referring to existing research results [44,45,46,47], this paper follows the principles of scientificity, representativeness and data availability, and combines the characteristics of each subsystem to construct an evaluation index system for the coordinated development of the PLIF system in Hebei Province. The population resource subsystem indicators include population size, population structure and population living conditions [45]; the land resource subsystem covers three dimensions: land scale structure, economic benefits and input level [45,46]; the industrial resource subsystem is measured from aspects such as industrial structure, per capita regional GDP and per capita industrial output value [46,47]; the facility resource subsystem selects one representative indicator from each of the five aspects: transportation, water conservancy, energy, disaster prevention and mitigation, and cultural education [44]. Ultimately, a total of 20 evaluation indicators were identified, with five indicators per subsystem, all of which were positive indicators. The entropy weight method is adopted to comprehensively calculate the weights of the PLIF system in Hebei Province.
Before the calculation process, to eliminate the influence of the dimension of the indicators, this paper adopts the extreme value method to standardize the indicators according to their positive characteristics:
Positive   indicators :   Y ij = x ij m i n x i m a x x i min x j
where xij and Yij are the initial and standardized values of the ith indicator in year j, respectively, and max(xi) and min(xi) denote the maximum and minimum values of an indicator system, respectively.
The degree of dispersion of each indicator was assessed by calculating the entropy value. Firstly, calculate the entropy value of each indicator ej:
e j = 1 ln n j = 1 n x ij j = 1 n x ij ln x ij j = 1 n x ij
Calculate the weights of the indicators Wj:
W j = 1 e j j = 1 n 1 e j
The weights of the comprehensive evaluation indicators of the PLIF system were calculated according to the above formula (Table 1).

2.5.2. Integrated Evaluation Index

The level of the regional PLIF system was measured using an integrated evaluation model. The formulae are as follows:
P ( x ) = j = 1 5 X ij W p j
L ( x ) = j = 1 5 X ij W lj
I ( x ) = j = 1 5 X ij W ij
F ( x ) = j = 1 5 X ij W fj
T = α P ( x ) + β L ( x ) + γ I ( x ) + δ F ( x )
where P(x), L(x), I(x), F(x) are composite indices for the population, land, industry, and facilities subsystems, respectively, T serves as the integrated evaluation index of a multi-dimensional system. X ij is defined as the standardized value assigned to indicator i in year j, Wj is the value of the weight of the indicator i, and n is the number of indicators. α, β, γ, δ are the coefficients, considering that each system is of equal importance for social development, α = β = γ = δ = 1/4.

2.5.3. Coupling Coordination Degree Model

The degree of coupling is a measure of the degree of interaction between elements [48]. In this study, it specifically refers to the degree of coupling among population, land, industry, and facilities. Based on the comprehensive evaluation indices calculated for each system, a coupling degree model is established as follows:
C =   W x F x C x L x W x + F x + C x + L x 4 4 1 4
where C is the coupling degree, with a range of values between [0, 1], and a higher value indicating a stronger interactive relationship between systems.
Although the coupling degree model can describe the degree of coordinated development between systems, it is difficult to determine whether the systems are mutually promoting at a high level or closely connected at a low level. In contrast, the coupling coordination degree model can not only reflect the degree of interaction between systems but also indicate the level of coordinated development [49]. Therefore, to better capture the coupling coordination level of multi-dimensional systems, a comprehensive evaluation index of the systems is introduced into the coupling degree model to construct the coupling coordination degree model, with the formula as follows:
D   =   C × T
where D is the degree of coupling coordination, with a range of values between [0, 1]. A higher value indicates a higher level of coupling coordination. Relying on the relevant research [29,50], in conjunction with the current situation described in this paper, the coupling degree and coordination level of the PLIF system are classified as shown in Table 2 and Table 3.

2.5.4. Spatial Autocorrelation

Spatial autocorrelation analysis is used to measure whether spatial variables exhibit clustering patterns. While global spatial autocorrelation captures the overall spatial correlation and heterogeneity across a region, it often fails to accurately characterize localized spatial clusters and outliers [51]. Therefore, the spatial aggregation features of the PLIF system coupling coordination in Hebei Province were determined by combining the global and local spatial autocorrelation analysis methods. The formula is the following:
I =   n i = 1 n j = 1 n W ij x i x ¯ x j x ¯ i = 1 n j = 1 n W ij i = 1 n x i x ¯
I i = n x i x ¯ j = 1 n W ij x j x ¯ i = 1 n x i x ¯ 2
where I and Ii are global and local Moran’s indices, respectively, n is the number of spatial units; xi and xj are the observed values of the coupling coordination degree of counties i and j, respectively;  x ¯ denotes the mean value of the coupling coordination degree in the study area; and Wij is the spatial weight matrix of counties i and j.

2.5.5. Grey Correlation Degree Analysis

Grey relational analysis is a statistical analysis method that comprehensively considers multiple factors. It determines the degree of association between two factors within a system by calculating the consistency in their changing trends, thereby revealing the intrinsic connections and patterns within the system [52]. In order to study the key factors driving the coupling and coordination of the PLIF system in Hebei Province, the grey correlation model is used to rank the influence indicators. The relevant formulas are as follows:
δ i ( k ) = min i min k | X 0 k X i k |   +   p max i max k | X 0 k X i k | | X 0 k X i k |   +   p max i max k | X 0 k X i k |
Y i = 1 n k = 1 n δ k
where X 0 k is the reference series, X i k is the comparison series, δ i(k) is the correlation coefficient, p is the discrimination coefficient, generally taken as 0.5, Y i is the grey correlation, the larger the correlation, indicating that the similarity between the two sequences is higher, the stronger the correlation.

3. Results

3.1. Analysis of Development Characteristics of the PLIF System

3.1.1. Spatial–Temporal Evolution Characteristics of Development Levels Across Subsystems

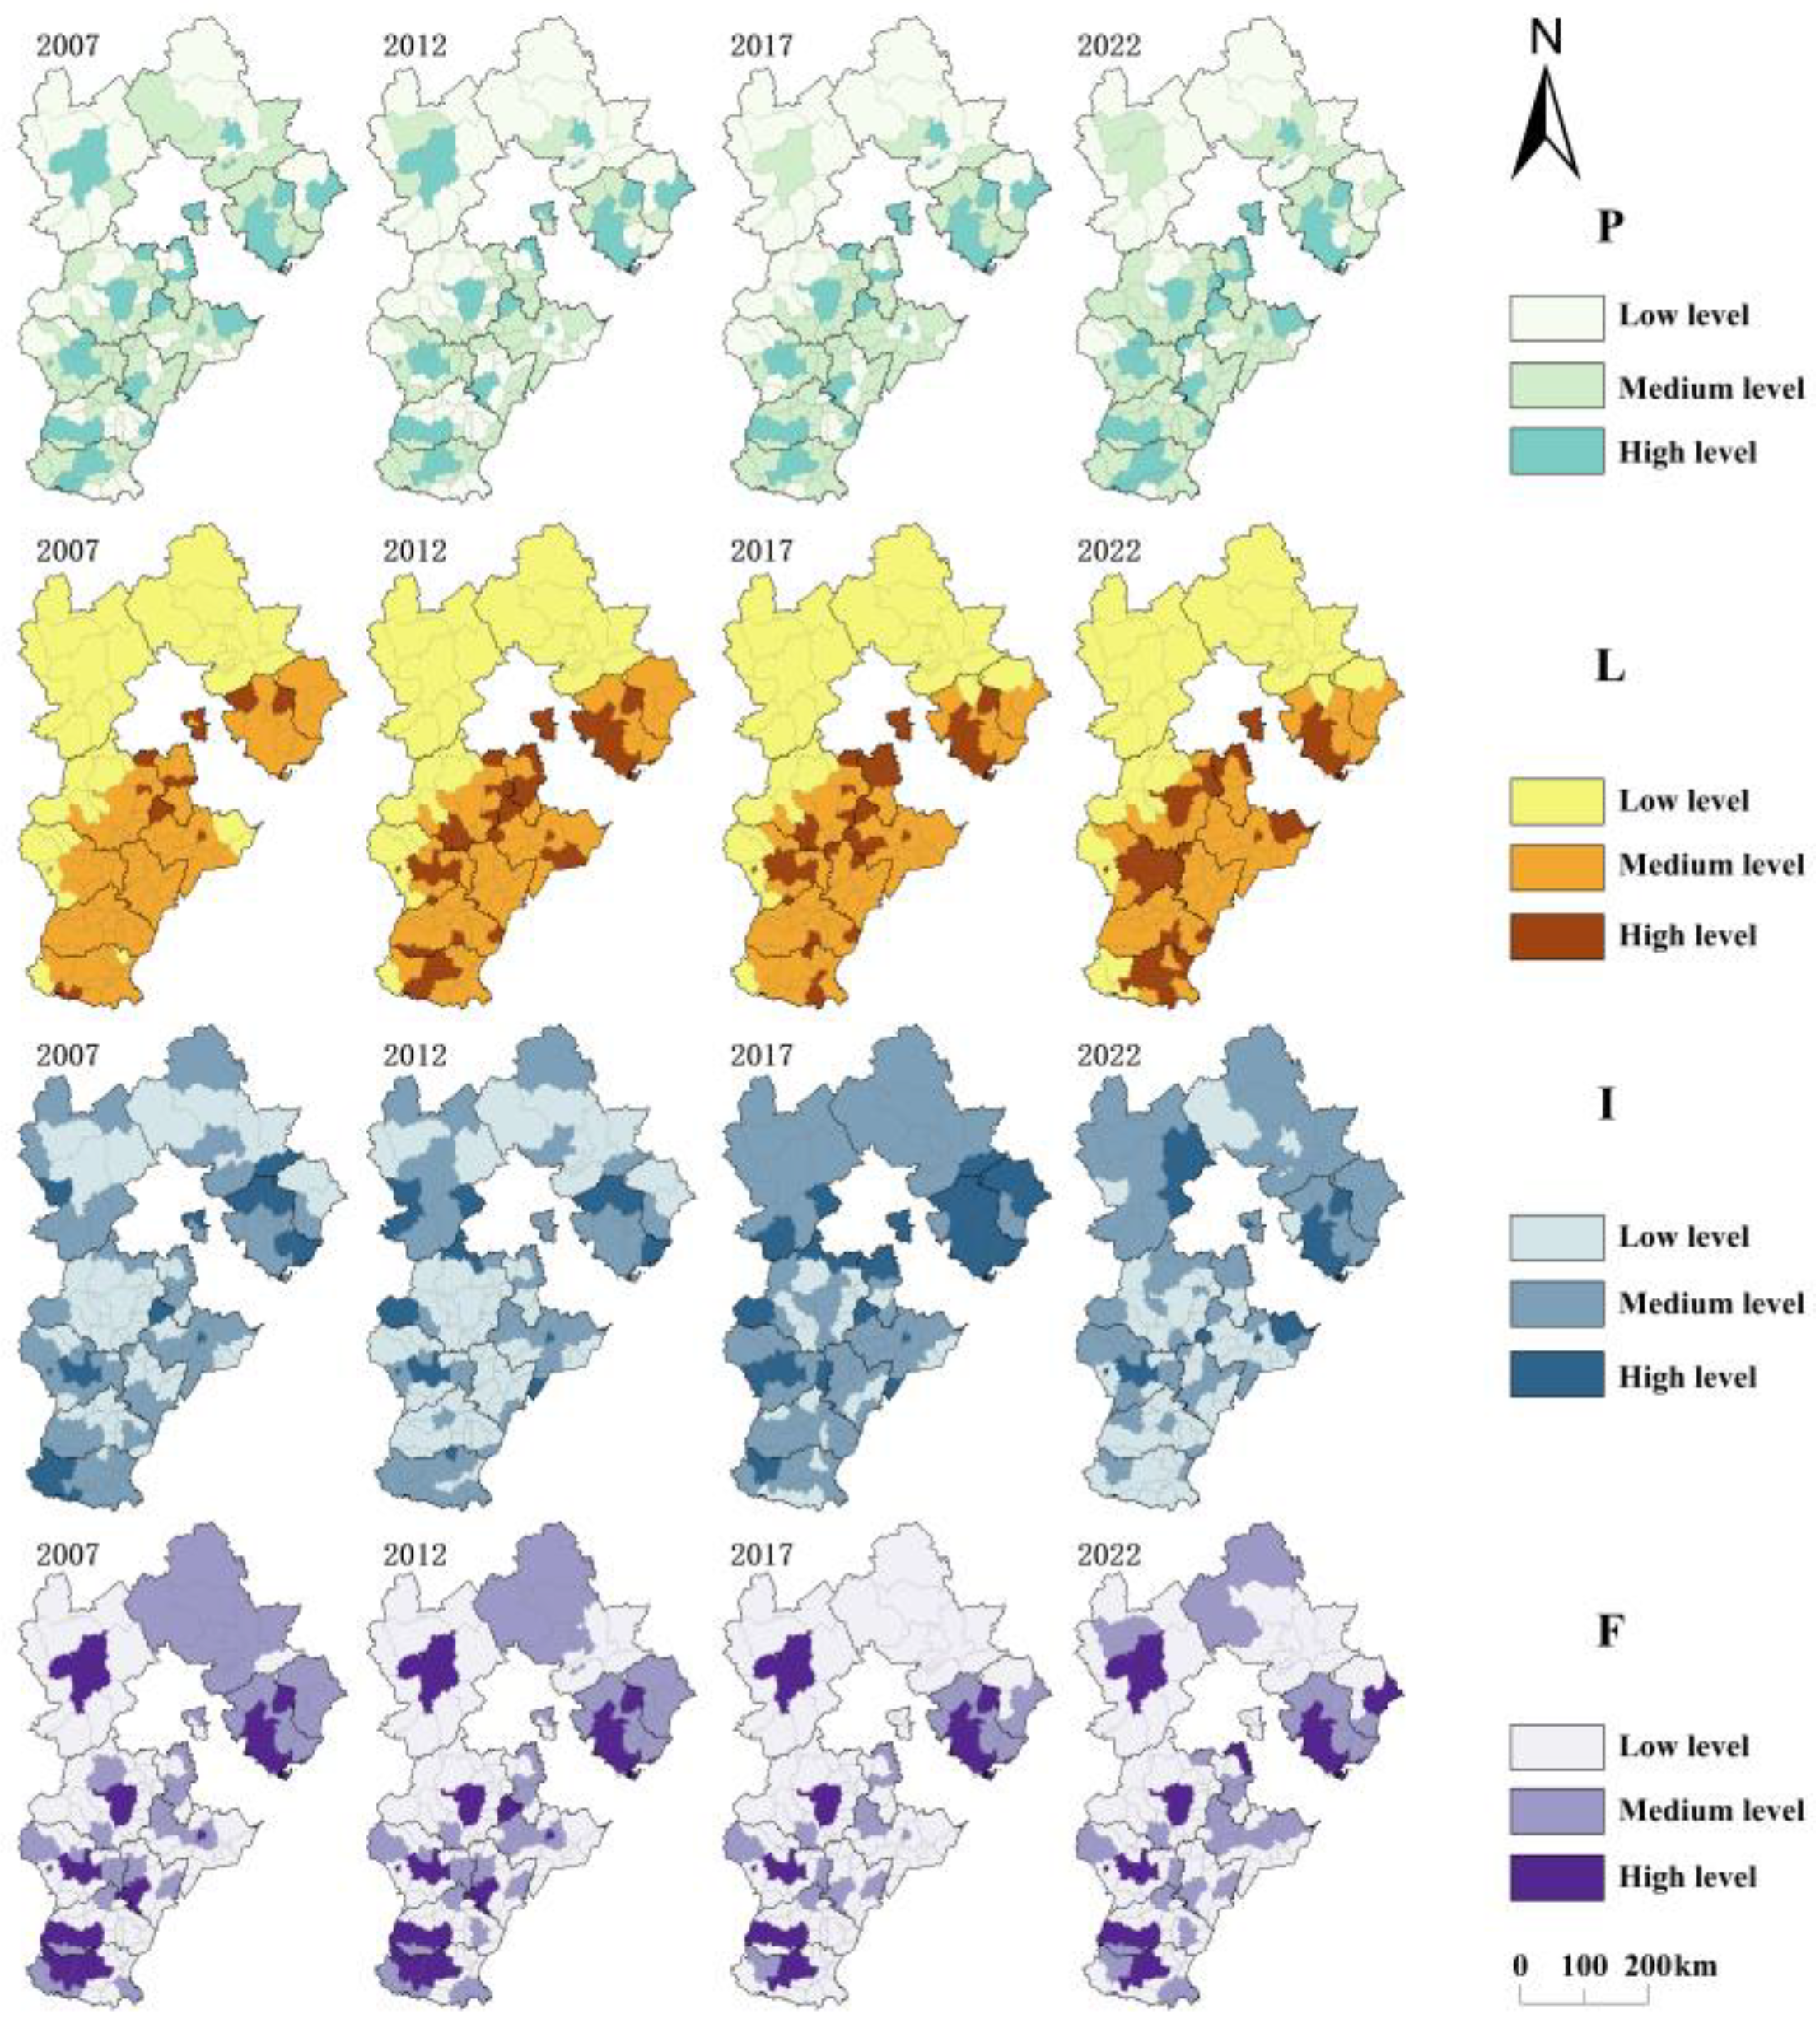
Based on a comprehensive evaluation model, development indices for the population, land, industry, and facilities subsystems in Hebei Province from 2007 to 2022 were calculated. Spatial visualization analysis was conducted using ArcGIS 10.8 (Figure 4). The classification standards for each system’s development level are as follows: Population System: Low Level (<0.18), Medium Level (0.18–0.32), High Level (>0.32); Land System: Low Level (<0.28), Medium Level (0.28–0.44), High Level (>0.44); Industrial System: Low level (<0.2), Medium level (0.2–0.33), High level (>0.33); Infrastructure System: Low level (<0.17), Medium level (0.17–0.32), High level (>0.32).
From 2007 to 2022, the average population subsystem index in Hebei Province ranged between 0.211 and 0.245. Approximately 47% of the counties were at a low level, 36% at a medium level, and about 17% at a high level. High-level counties were primarily concentrated in municipal central areas. Medium-level counties were mostly distributed on the periphery of central urban areas, while low-value areas were mainly located in the Bashang Plateau of northern Hebei and the counties of the Yanshan-Taihang Mountain region.
From 2007 to 2022, the average land subsystem index in Hebei Province ranged between 0.318 and 0.372, with about 85% of counties at low or medium levels. Overall, the land system index exhibited a clear polarized pattern of “high in the east, low in the west.” Low-level counties were mainly concentrated in the Yanshan-Taihang Mountain area and the western part of Shijiazhuang, while high-level counties were predominantly distributed in the eastern municipal central regions.
From 2007 to 2022, the average industry subsystem index in Hebei Province ranged between 0.217 and 0.27, with significant variations among counties. Between 2007 and 2012, the low-value areas in central and southern Hebei gradually expanded. From 2012 to 2017, the spatial pattern changed significantly: medium-level counties showed contiguous distribution in the Yanshan-Taihang Mountain region, northeastern Hebei was dominated by high-value areas, central and southern Hebei were primarily at a medium level, while the areas surrounding Beijing and Tianjin and the central municipal areas of Shijiazhuang were mostly high-value zones. From 2017 to 2022, northern Hebei was mainly at a medium level, and different types of zones in central and southern Hebei exhibited an interwoven distribution pattern.
From 2007 to 2022, the average facility subsystem index in Hebei Province ranged between 0.148 and 0.17. In 2017 and 2022, the proportions of low-level and medium-level counties changed considerably, while the proportion of high-level counties remained relatively stable at around 13%. Spatially, from 2007 to 2012, northern Hebei was predominantly at a medium level, counties along the Yanshan-Taihang Mountain range were generally low-value areas, and high-value spots were scattered in the municipal centers of various cities. By 2017, low-level counties showed a clear trend of contiguous distribution. By 2022, low-value counties exhibited a fragmented and contracting trend, while medium-level counties expanded in central Hebei.

3.1.2. Analysis of the Comprehensive Development Level of the PLIF System

An integrated evaluation model was employed to obtain the PLIF system’s development index in Hebei Province from 2007 to 2022. The index for 2007, 2012, 2017, and 2022 was spatially visualized using ArcGIS 10.8. According to the calculation results, the integrated development level was classified into three grades: low level (<0.22), medium level (0.22–0.3), and high level (>0.3), and the spatial distribution pattern is shown in Figure 5.
From a temporal perspective, the integrated development index of the Hebei provincial PLIF system from 2007 to 2022 showed a relatively low overall development level (ranging from 0.115 to 0.677), but it exhibited an upward trend. The proportion of low-development counties declined from 60.77% to 51.74%, while medium-development counties rose notably from 18.06% to 33.60%. Conversely, the proportion of high development counties decreased from 21.17% to 14.66%. In terms of changes in the mean, the integrated development level of the counties fluctuated between 0.241 and 0.253, showing a tendency to rise and then fall: it was 0.241 in 2007, reached the peak of 0.253 in 2017, and dropped to 0.247 in 2022.
From a spatial pattern perspective, the integrated development index of the PLIF system in Hebei Province generally presented a feature of “high in the northeast and low in the northwest”. In 2007, the level of system integration showed significant North–South differences: among the counties in the Yan Shan-Tai Hang Mountain area, only Zhangjiakou, Chengde, Baoding, and Zhuozhou formed high-value development areas; in the northeastern part of Hebei, the counties of Tangshan and Qinhuangdao generally showed a high-value aggregation trend. The eastern part of southern Hebei was a low-value area, while the northern part was mainly high-value and medium-value areas; in central Hebei, the counties of Langfang, Cangzhou and Shijiazhuang were mainly at the medium level, with the county centers of the cities reaching a high level, and a few counties at a low level, and the overall distribution was relatively scattered. In 2012, medium-value clusters had begun expanding modestly across central Hebei, and most eastern southern low-value areas transitioned into high-value zones. By 2017, medium-value zones further extended, forming near-continuous swathes in northern central Hebei, with only scattered low-value outliers. By 2022, moderate contraction occurred in central Hebei’s medium-value clusters, whereas the Yan–Taihang Mountain and northeastern regions maintained strong developmental continuity.
In summary, the integrated development of the PLIF system in the Yan–Taihang Mountain region (Zhangjiakou, Chengde, and Baoding) remained at a low level, constrained primarily by natural conditions and industrial structure. Complex terrain, fragile ecosystems, and restricted land development limit growth potential, while a reliance on traditional industries results in weak economic dynamism and innovation capacity. Poor transport connectivity and limited resource aggregation further hinder overall development. In contrast, Langfang and Tangshan maintained high levels of development. Langfang benefits from proximity to Beijing and Tianjin, sound transportation links, and deep integration into the Beijing–Tianjin–Hebei industrial chain, facilitating industrial transfer, resource sharing, and talent attraction. Tangshan leverages its coastal port economy, mineral resources, developed transport network, and port-industrial clustering to drive regional growth. Both places have complete infrastructure and significant industrial synergy effects, jointly promoting high-quality regional development, forming a sharp contrast with the Yan Shan-Tai Hang Mountain area.

3.2. Coupled Coordination Analysis of the PLIF System

3.2.1. Spatiotemporal Evolution Characteristics of Coupling Coordination

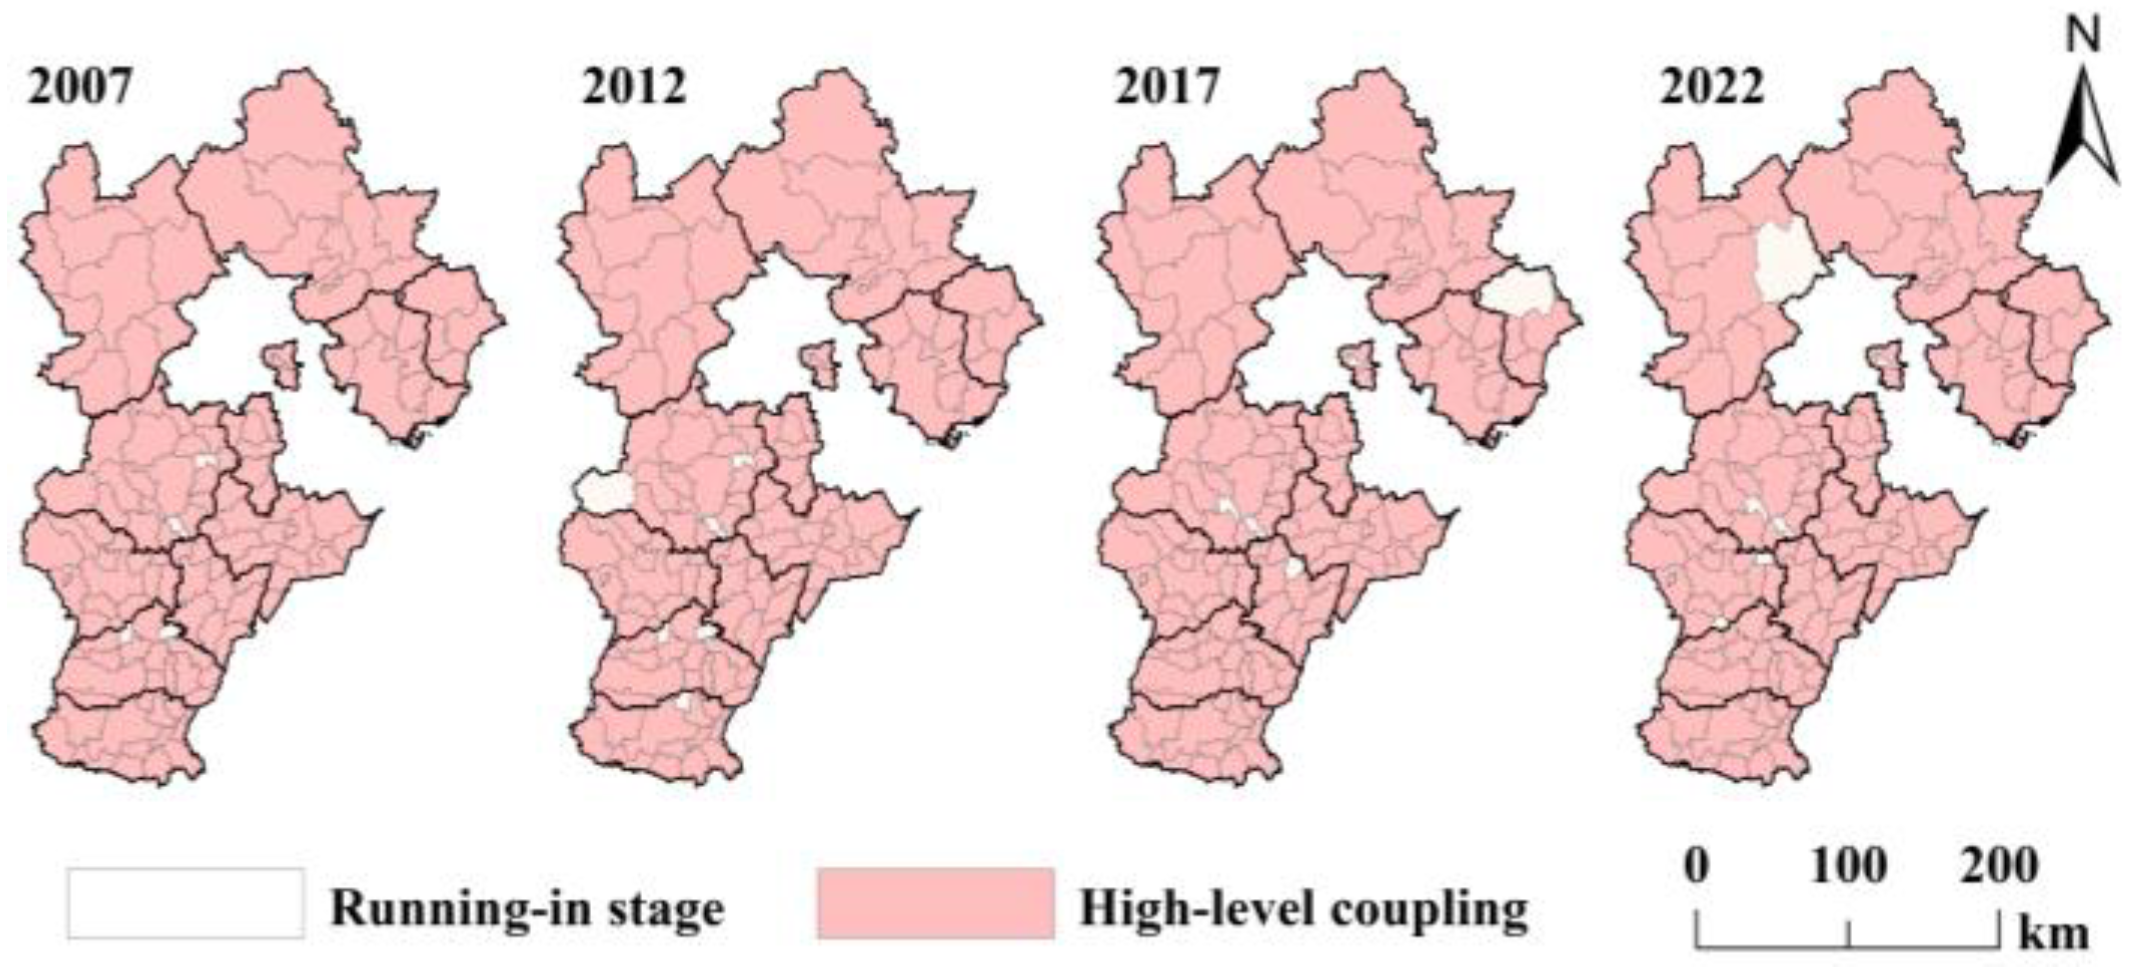
From 2007 to 2022, the WFCL systems in Hebei Province generally exhibited a high level of coupling. The coupling degree of the PLIF system in the study area was primarily in the high-level coupling stage, with only a very few areas in the grinding-in stage (Figure 6).
During the study period, counties in the grinding-in stage were sporadically distributed. These areas were in a phase of mutual adaptation, coordination, and collaboration among the PLIF systems, accounting for less than 4% of the total. A total of 116 counties remained in the high-level coupling stage throughout, where the PLIF systems showed a highly coordinated coupled state. Counties in Tangshan, Chengde, and Zhangjiakou consistently maintained this stage. Compared to the initial period, the coupling degree increased in approximately 30.71% of the counties, with significant improvements noted in Qinhuangdao, Anxin County, Zhangjiakou, Guyuan County, Yanshan County, Yongqing County, Wuqiang County, etc. The coupling degree slightly decreased in the remaining counties, with relatively larger declines in Anping County, Zhengding County, Xingtang County, Lingshou County, Zanhuang County.

3.2.2. Spatiotemporal Evolution Characteristics of Coupling Coordination Degree

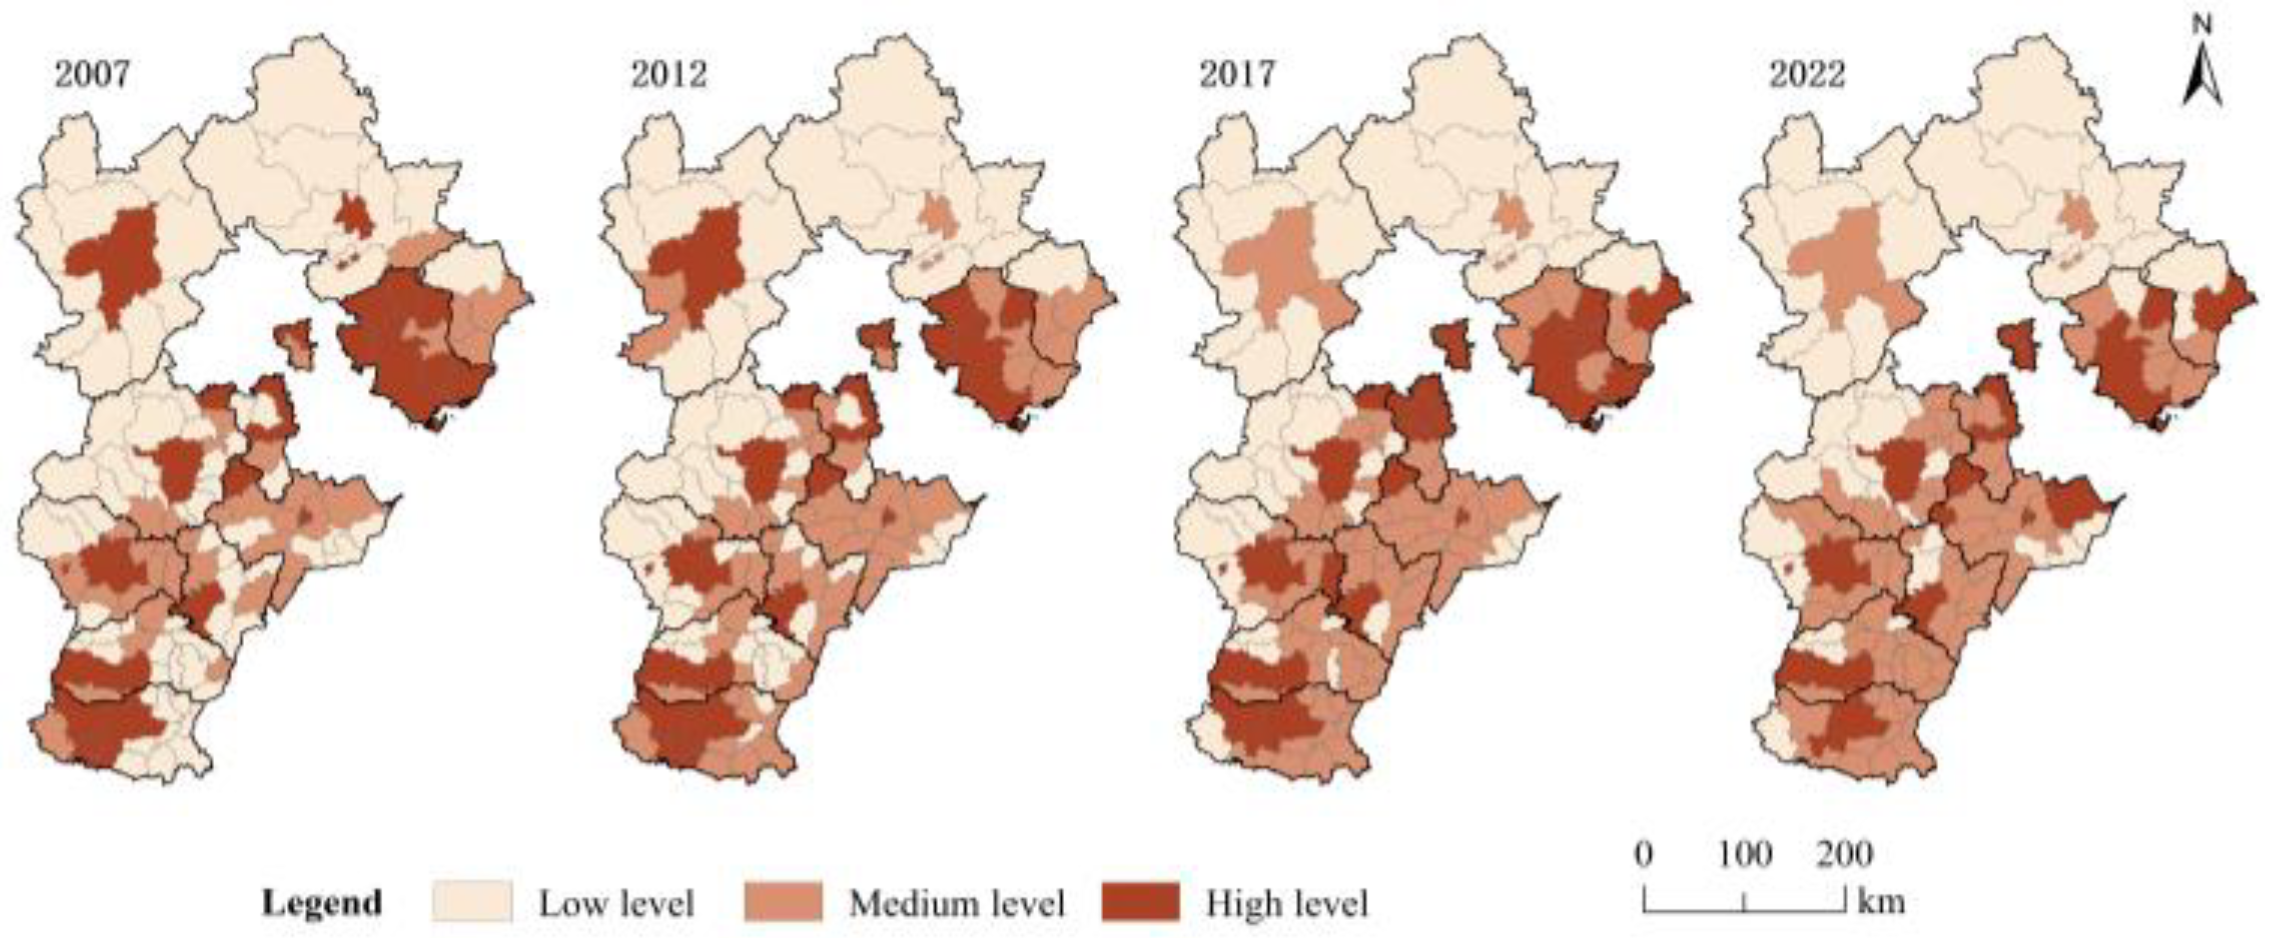
From 2007 to 2022, the interaction relationship between the PLIF systems in Hebei Province was mainly benign promotion and influence, and the coupling coordination degree generally presented “low in the north and high in the south, and high in the east and low in the west”, and this feature also had a strong stability. The coupling coordination degree includes six types: serious imbalance, mild imbalance, on the brink of imbalance, barely coordination, primary coordination, moderate coordination (Figure 7).
In 2007–2022, the high-level coordinated regions were primarily concentrated in the Tangshan, Qinhuangdao, and Langfang regions, maintaining a relatively high coupling coordination level with a concentrated spatial distribution. In terms of type changes, the number of moderately coordinated counties decreased slightly, from 9 in 2007 to 8 in 2022. Only one county was in an excellently coordinated state in 2007, and none reached this level thereafter. The number and proportion of counties in a primary coordinated state showed a trend of first expansion and then contraction. In terms of quantity, it gradually expanded from 22 in 2007 to 23 in 2012, and then continued to expand to 29 in 2017, but then shrank again to 23 in 2022. In terms of proportion, it increased from 17.63% in 2007 to 19.73% in 2012, and then further increased to 20.25% in 2017, but then shrank to 12.28%. From 2007 to 2022, an increasing trend in the number of counties exhibiting inadequate coordination, followed by a subsequent decrease and renewed increase. It gradually increased from 77 in 2007 to 80 in 2012, then decreased to 78 in 2017, and then increased again to 79 in 2022. The proportion of counties that were in a barely coordinated state for a long time from 2007 to 2022 was 43.46%, with a wide distribution that showed a primary concentration in the northeastern and southwestern urban agglomeration areas of Hebei Province.
The low-level coordinated areas were primarily concentrated in Zhangjiakou, with scattered distribution in western and central Hebei. With regard to alterations in typology, the number of counties on the brink of imbalance showed a trend of first shrinking and then expanding from 2007 to 2022. It gradually decreased from 20 in 2007 to 19 in 2012, and then continued to shrink to 14 in 2017, but then expanded again to 15 in 2022. The number of counties in a mild imbalance state showed an expanding trend. It was 0 in 2007 and 2012, and then increased to 1 in 2017, accounting for 1.39%, and then expanded to 4 in 2022, accounting for 6.97%.

3.2.3. Spatial Agglomeration Features of the Coupling Coordination Degree

Through spatial autocorrelation analysis, the global Moran’s I of the coupling coordination degree of the PLIF system was measured from 2007 to 2022, which were 0.291, 0.258, 0.292, and 0.270, respectively (Table 4). The Moran’s I of coupling coordination was all positive with p < 0.05 and Z > 1.96, indicating that the degree of coupling coordination was spatially strongly correlated and exhibited clustering characteristics. Specifically, the global Moran’s I started to decrease, then increased, and finally decreased again. However, throughout the entire research period, there was little variation in global Moran’s I, and it generally demonstrated a relatively stable spatial correlation.
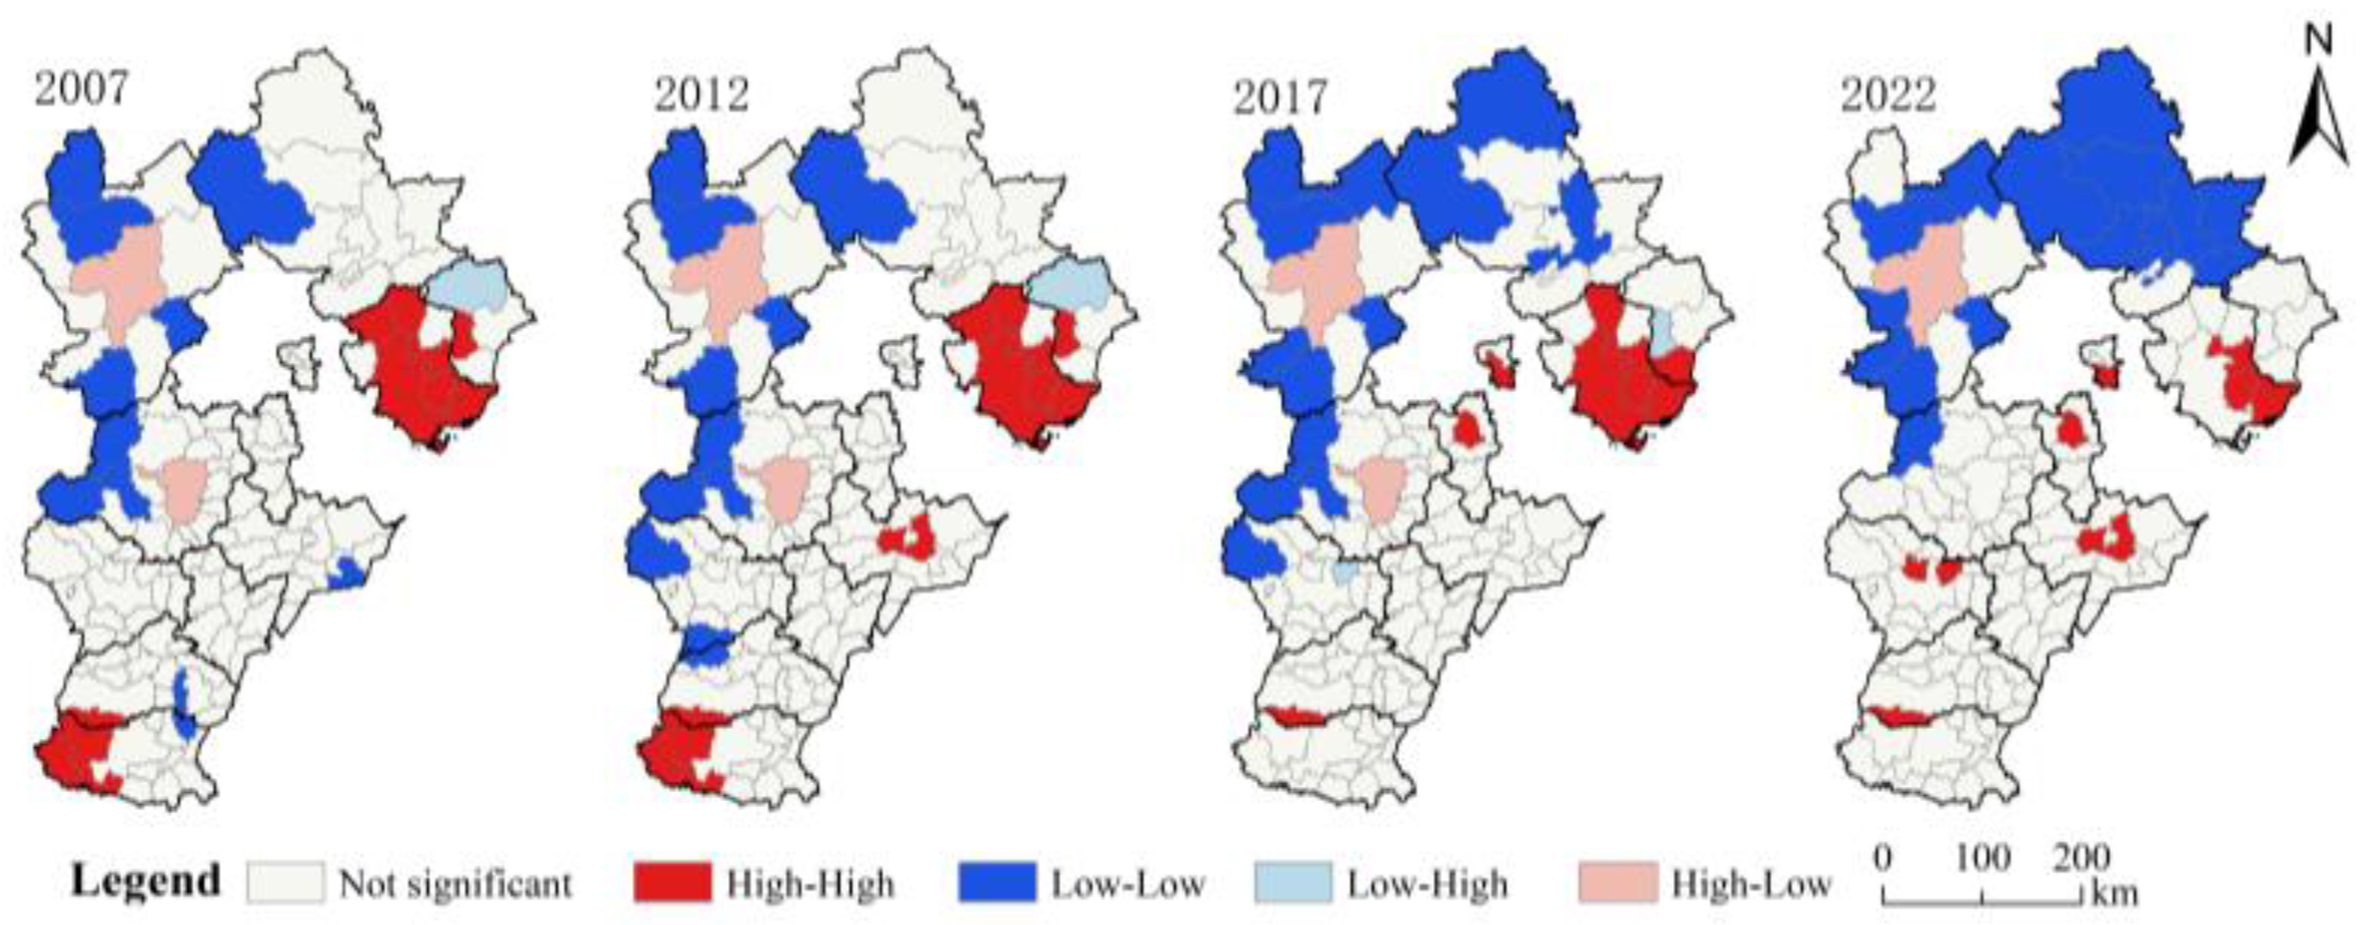
To further analyze the degree of association of the coupling coordination of different county units, this paper measured the local Moran’s I for the four study periods of 2007, 2012, 2017 and 2022, and accordingly generated the LISA clustering map (Figure 8) to show the different county units in relation to each other in terms of interconversion. As shown in the figure, four types of spatial agglomeration were observed during the study period: High-High (H-H), Low-Low (L-L), Low-High (L-H), and High-Low (H-L). From 2007 to 2022, H-H agglomeration were mostly distributed in the northeast, with scattered locations in the southwestern and central parts. Some areas in Tangshan and Qinhuangdao remained in the H-H agglomeration type for a long time. The number of aggregated cities tended to increase and then decrease, from 11 in 2007 to 12 in 2012, and then dropped to 10 in 2017. L-L agglomerations were mostly located in the northwestern part of Hebei Province, with scattered distributions in the southwestern part. Some areas in Zhangjiakou, Chengde, and Baoding remained in the L-L agglomeration type for a long time. The number of aggregated cities was continuously increasing, from 11 in 2007 to 15 in 2022. The H-L type of county was distributed less frequently. Zhangjiakou City remained in the High-Low agglomeration type throughout the research period, while Baoding City only showed a High-Low agglomeration state in 2007, 2012, and 2017. The L-H type of county was the least distributed among the four types. L-H counties exhibited the least distribution of the four types, with only Qinglong Manchu Autonomous County in 2007 and 2012 and Lyulong County in 2017 belonging to the L-H agglomeration type. However, Lyulong County belonged to the L-L agglomeration in both the 2007 and 2012 periods.

3.3. Analysis of Grey Relational Results for Factors Influencing the Degree of Coupling Coordination of the PLIF System

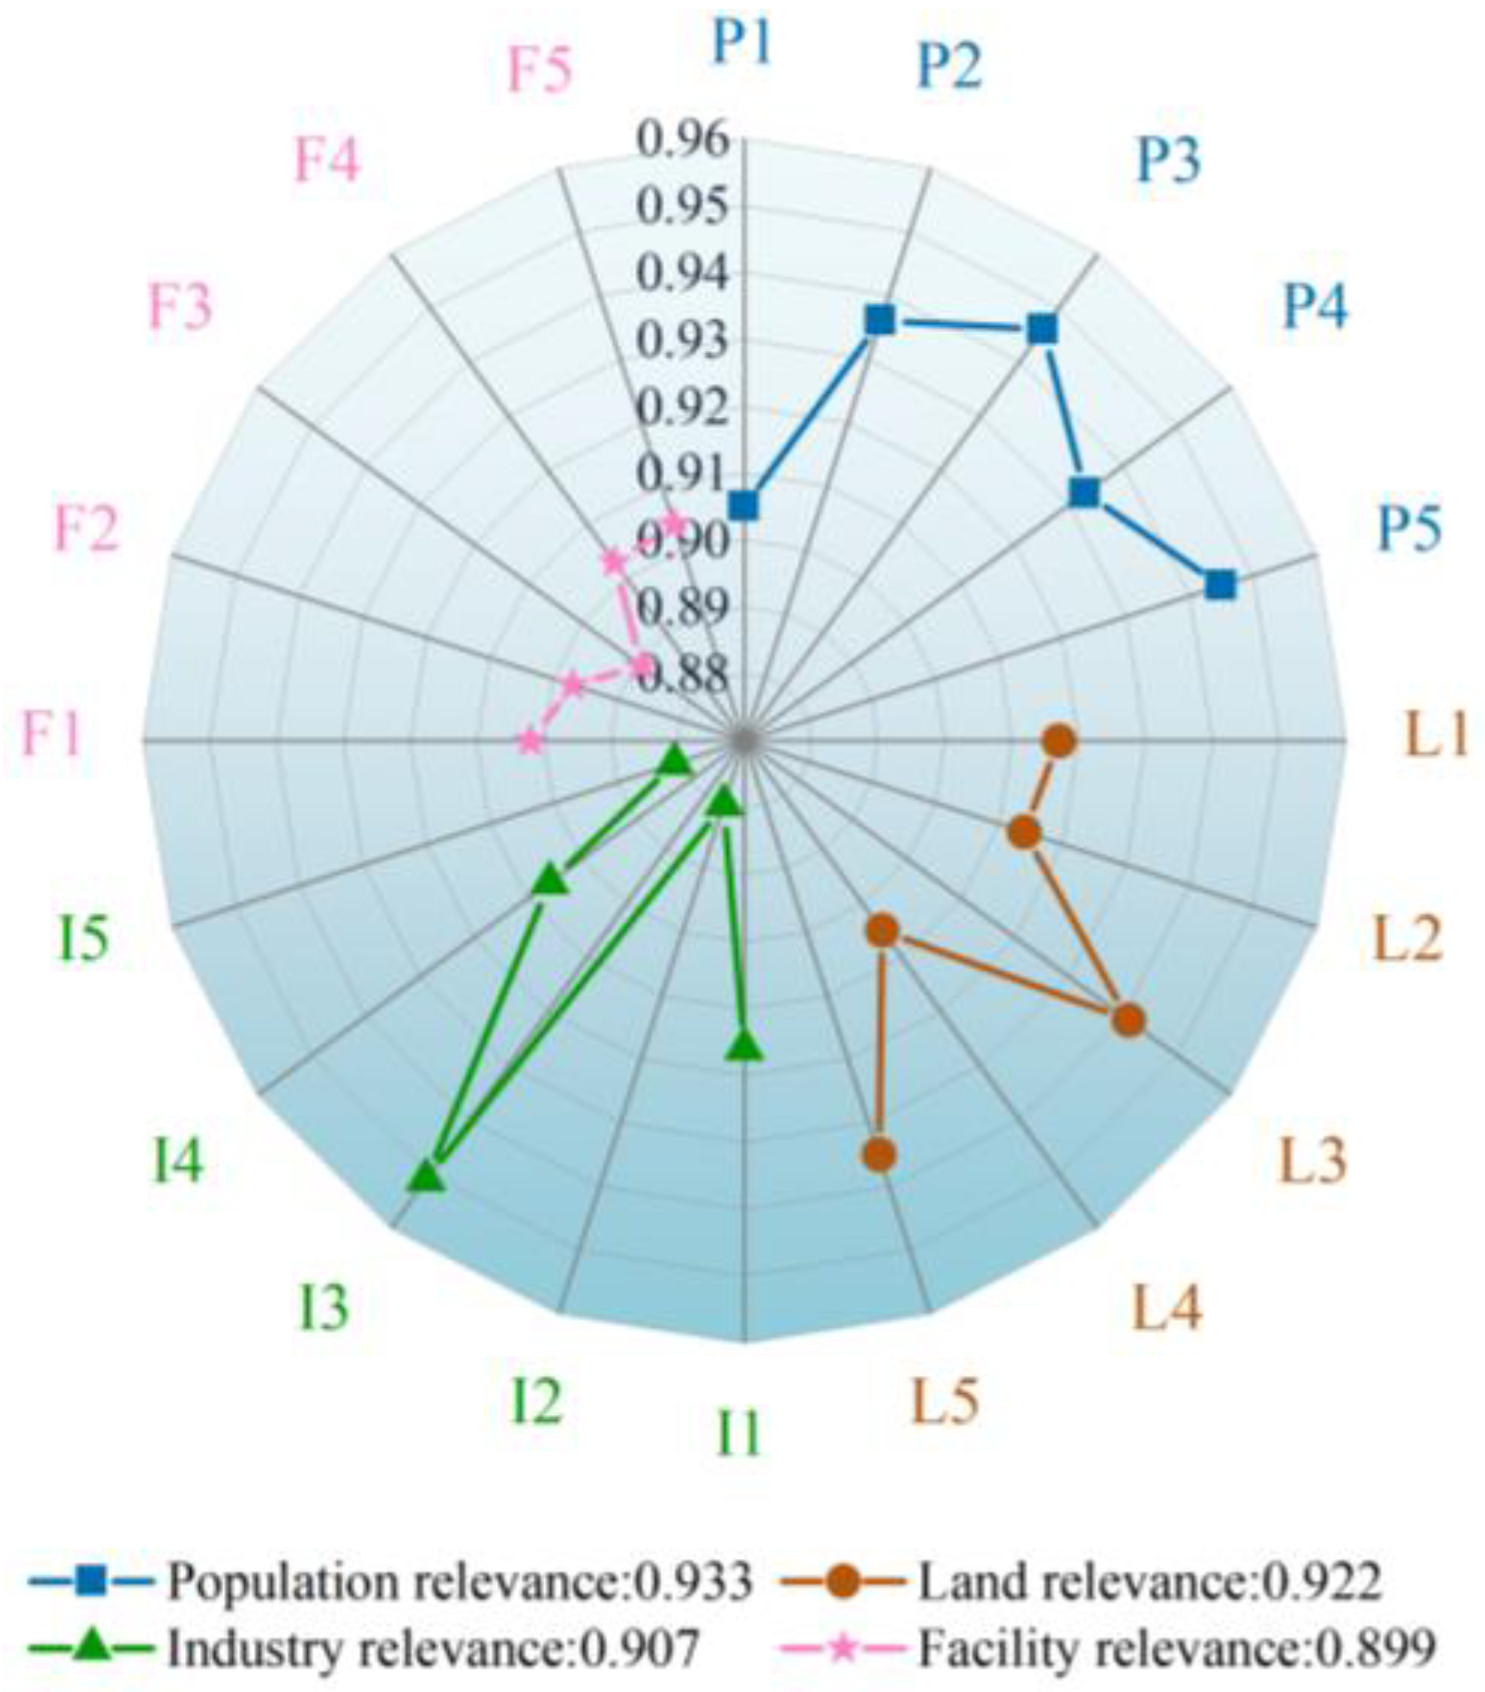
Grey relational analysis was applied, with the degree of coupling coordination of the PLIF system as the reference sequence and the internal indicators of the system as the comparative sequences. The grey relation degrees between each indicator and the coupling coordination degree were calculated, with the output presented in Figure 9. The development levels of the four subsystems were highly correlated with the coupling coordination development of the system, with grey relational degree values all above 0.89. Specifically, the population subsystem showed the strongest association (0.933), followed by the land subsystem (0.922), the industry subsystem (0.907), and lastly the facility subsystem (0.899).
In the population resource subsystem, the three entities that exhibited the strongest correlation degree were de-agrarianization of rural labor, the number of regular secondary school teachers per 10,000 people, and the urbanization rate. The shift of rural labor into non-agricultural sectors helps upgrade the rural industrial structure and improve infrastructure. The number of full-time teachers in secondary schools directly affects the quality of education, which in turn improves population quality, promotes industrial upgrading, enhances land revenue, and improves educational facilities. The urbanization rate further reinforces this process by concentrating populations in cities, which stimulates land consolidation, facilitates industrial transfer and upgrading, and boosts the development of public infrastructure.
In the land resource subsystem, the grey relational degree ranking is: average public financial revenue per land area > average social investment in fixed assets > proportion of cultivated land area > proportion of construction land area > average public financial expenditure per land area. Average public financial revenue per land area and capita fixed asset investment in the whole society provide financial support for regional development, which is used to improve infrastructure, enhance public service levels, and promote industrial upgrading. This attracts population aggregation and optimizes land use efficiency. The cultivated land area directly relates to food security and ecological balance, while the construction land area determines the space for the flourishing of industrial and facilities. A rational allocation between the two helps balance agricultural and urban demands, optimizes land use structure, promotes industrial diversification, and enhances systemic coordination.
In the industrial resource subsystem, the top three indicators in terms of grey relational degree are: the share of tertiary industry, per capita regional GDP, and industrial sophistication level. The rise in the share of the tertiary sector and the level of industrial sophistication implies an increase in the dominance of the tertiary sector. This, in turn, enhances industrial value-added, attracts the aggregation of high-end talent, drives infrastructure upgrades, and improves the overall competitiveness of the region. The region’s economic strength is reflected in its per capita GDP. A high per capita regional GDP enhances population quality, improves land use efficiency, promotes industrial upgrading, and facilitates the improvement of infrastructure.
In the facility resource subsystem, the top three indicators in terms of grey relational degree are: the number of secondary schools, the number of hospitals and health centers, and the mileage of highways. The number of secondary schools reflects the capacity of the educational resource supply and lays the foundation for cultivating high-quality talent. The number of hospitals and health centers relates directly to public health standards, with adequate medical resources ensuring the physical well-being of the labor force. Together, improvements in education and health provide fundamental momentum for regional development. The mileage of highways directly relates to the convenience of regional transportation. Good transportation promotes regional integration, strengthens exchanges and cooperation between urban and rural areas, drives the prosperity of industries along transportation routes, and improves the travel conditions and living standards of residents.

4. Discussion

4.1. Research Findings and Rationality Analysis

The study shows that from 2007 to 2022, the overall PLIF system coupling coordination in Hebei Province is barely coordinated at the development level, which is in line with the results reported by Li et al. [53]. In terms of spatial distribution, the degree of coupling coordination is characterized by “low in the north and high in the south, high in the east and low in the west”, corroborating the results of Fang [45]. Areas with lower coupling coordination degrees are primarily concentrated in the northern plateau and the southern section of the Yanshan-Taihang Mountains. Characterized by mountainous and hilly terrain, these areas exhibit low population density, constrained land use, weak industrial drivers, and underdeveloped infrastructure, contributing to their relatively low socioeconomic development levels [54,55]. Counties with barely coordinated development levels are mostly located in the areas surrounding the cities of Handan, Xingtai, Shijiazhuang, Hengshui, Cangzhou, and Baoding, forming contiguous distribution areas. Tangshan, leveraging its geographical advantage as the central hub of the Bohai Bay region and benefiting from policy support, has developed into a high-value aggregation zone. Qinhuangdao, adjacent to Tangshan, has been influenced by its radiation and driving effect, and some counties have also shown a High-High value aggregation trend during the research period [56].
Additionally, other populous provinces in China, such as Henan Province, also face the issue of their PLIF system coupling coordination lingering at the barely coordinated stage. Due to a large population base, heavy resource carrying pressure, relatively lagging industrial development with an irrational structure, and insufficient provision of infrastructure and public services, it is difficult to effectively support the efficient synergy between population and economic activities. At the same time, imbalanced development within the region, significant disparities between urban and rural areas and among different sub-regions, along with an overall low level of coordination, have resulted in a long-term state of barely coordinated development [9]. These issues require increased attention from the government.
Based on the grey relational analysis model, among the influencing factors of the coupling coordination of the PLIF system in Hebei Province from 2007 to 2022, the population subsystem has the highest relational degree, followed by the land subsystem, the industry subsystem ranks third, and the facility subsystem has the lowest relational degree. This conclusion differs from the research by Liu Zihua [57], whose study of rural regions identified industry as the most influential subsystem for high-quality development, followed by land, with population having a comparatively weaker effect. In Liu Zihua’s research, the industry subsystem had the greatest influence on high-quality development, followed by the land subsystem, while the population subsystem had a relatively weaker influence. The discrepancy likely stems from differences in research focus and scope. Liu’s analysis emphasized the role of subsystems in shaping integrated development levels within rural settings, where industry acts as the primary engine of economic growth, land serves as an essential—though indirect—foundation for production, and demographic factors exert a more lagged influence. By contrast, this study evaluates subsystem impacts on the coupling coordination among internal system elements. Here, population—as the core driver of socioeconomic activity—directly shapes land allocation, industrial distribution, and facility demand, thus showing the strongest association. Land, as the spatial basis for development, indirectly supports industrial and facility optimization, ranking second. Industry, though vital for growth, remains constrained by population needs and land supply, while facilities, being service-oriented and slower to develop, exhibit the weakest direct influence on coordination.
In addition, the influencing factors that are strongly associated with the system’s coupling coordination degree mainly include the urbanization rate, the de-agrarianization of rural labor, the number of secondary school teachers per 10,000 people, average public financial revenue per land area, and the share of tertiary industry, which is similar to the research results of Huang Liejia and Yang Peng [58]. Their research not only examined these factors but also further explored the impact of natural geographical location and policy decision-making behaviors on the coordinated development of population–land–industry non-agriculturalization in the Yangtze River Economic Belt, analyzing the driving mechanisms of coordinated development from multiple perspectives. In contrast, this study primarily focuses on internal system factors, emphasizing economic development and industrial structure aspects, without addressing external factors. Future research should explore the influence mechanisms of both internal and external factors on the system’s coupling coordination degree to achieve a more comprehensive understanding.

4.2. Suggestions for Improving Coupling Coordination and Development of Regional PLIF Systems

To promote the healthy interaction and overall efficiency improvement of the PLIF system in Hebei Province, efforts should be made to strengthen the macro-level overall planning by the provincial government and the collaborative implementation by local governments at the regional level, focusing on key factors influencing the system’s coordination such as population density, the proportion of the tertiary industry, the level of public services, per-unit area public fiscal revenue, and the rate of urbanization. Differentiated regulation should be implemented based on the differences in the coordination types, development foundations, and functional positioning of each county.
Based on the spatial differentiation characteristics of the PLIF system’s coordination types, provincial governments should guide various regions to achieve functional complementarity and coordinated improvement through differentiated fiscal, land and policy tools. For high-coordination areas such as Tangshan, Qinhuangdao and Langfang, local governments should, under the guidance of provincial industrial policies, focus on increasing the proportion of the tertiary industry and the quality of population aggregation, strengthening innovation capabilities and industrial chain coordination, and enhancing regional radiation and driving capabilities. For the widely distributed barely coordinated areas, provincial governments can set up special improvement funds to support local governments in precisely addressing key shortcomings, including optimizing the layout of public service facilities, improving the efficiency of per-unit land public fiscal revenue utilization, and promoting the non-agricultural transformation of rural labor forces, to facilitate their leap to the medium-high coordination stage. In low-level coordinated and ecologically sensitive areas such as Zhangjiakou, provincial governments should take the lead in establishing ecological compensation and fiscal transfer payment mechanisms, encouraging local governments to moderately promote the development of characteristic industries such as clean energy and eco-tourism under the premise of strictly adhering to ecological bottom lines, and enhancing population carrying capacity and internal driving forces.
During the policy implementation process, governments at all levels should work together to strengthen the systematic integration of key elements. Provincial governments need to optimize the allocation of fiscal resources, increase the per-unit area public fiscal revenue level and its utilization efficiency, support local governments in promoting a new type of urbanization centered on people, improve the supporting facilities of public services such as transportation, education and medical care, and promote the efficient spatial matching of population, land, industry and facilities. Meanwhile, the Hebei provincial government should proactively connect with the coordinated development strategy of the Beijing-Tianjin-Hebei region, take the lead in building a cross-regional coordination mechanism, clarify the rights and responsibilities of governments at all levels in areas such as ecological compensation, industrial collaboration and facility co-construction, promote the establishment of a horizontal interest sharing mechanism between Zhangjiakou and Chengde regions and Beijing-Tianjin, promote the equalization of public services and the interconnection of infrastructure, and provide institutional guarantees for the overall coordination level improvement of the provincial PLIF system.
In this study, an evaluation indicator system for the PLIF system was initially constructed. However, the quantity and quality of the indicators influence the results. Firstly, all selected indicators in the system are positive, which helps reflect the development level of each subsystem. Yet, the absence of negative indicators—such as aging rates or unemployment rates—may somewhat overestimate the system’s coupling coordination status and insufficiently capture internal constraints. Secondly, the facility subsystem indicators primarily emphasize traditional infrastructure like transportation, water conservancy, and energy, potentially underrepresenting the impact of people-oriented facilities such as postal telecommunications and community services. Additionally, linear interpolation was used to estimate some missing data, which introduces certain limitations and uncertainties, thereby affecting the accuracy of this study.

5. Conclusions

This study takes the PLIF system in Hebei Province as the research object, analyzing its development level and coupling coordination characteristics, and employs the grey correlational degree model to explore the factors influencing the system’s coupling coordination degree. The main conclusions are as follows:
(1)
The overall development level of the PLIF system is relatively low, with significant spatial variation. Although the development levels of each subsystem and the comprehensive development level show an upward trend, they remain at a low stage. Spatially, it exhibits an “east-high, west-low” and “core-periphery” structure. The eastern and central regions, leveraging their locational advantages and economic foundation, have relatively higher development levels. In contrast, areas such as Zhangjiakou, Chengde, and western Baoding, constrained by natural conditions and industrial structure, lag behind in development, reflecting the prominent regional development imbalance in Hebei Province.
(2)
The coupling coordination degree of the PLIF system shows a fluctuating upward trend, but the quality of coordination still needs improvement. Although most counties are in the high-level coupling stage, the coordination degree generally displays a “low in the north, high in the south; low in the west, high in the east” pattern. Highly coordinated areas are concentrated in coastal regions like Tangshan and Qinhuangdao, while mildly disordered areas are consistently distributed in the ecologically sensitive northwestern region. The slight decline in coordination degree in the later stage indicates that the system’s coordinated state is not yet stable and is susceptible to policy adjustments and changes in the external environment, demonstrating a certain degree of vulnerability.
(3)
The coupling coordination degree of the PLIF system shows significant spatial aggregation characteristics. High-High (H-H) aggregation areas are mainly distributed in the coastal areas of northeastern Hebei, while Low-Low (L-L) aggregation areas are concentrated in the northwestern mountainous region, reflecting the “low-level lock-in” spatial dilemma faced by disadvantaged areas. The number of High-Low (H-L) and Low-High (L-H) type areas is small and their distribution is unstable. For instance, high-low types only sporadically appear in Zhangjiakou City, and Low-High (L-H) types only occur in certain years in individual counties like Qinglong and Lulong. This indicates that the radiating influence between regions is relatively weak, lacking effective transition and transmission mechanisms.
(4)
Population and land factors are key influences on the coupling coordination degree of the PLIF system. Results from the grey relational analysis show that the population subsystem has the highest relational degree, followed by the land subsystem, while the industry and facility subsystems have relatively weaker influences. At the specific indicator level, population density, the proportion of the tertiary industry, the degree of non-agriculturalization of the rural labor force, the number of full-time teachers in regular secondary schools per 10,000 people, and public fiscal revenue per unit of land area are closely related to the coordination degree. This indicates that population structure and land use play a dominant role in system coordination, while the supportive effect of facility construction has not yet been fully realized.

Author Contributions

Conceptualization, formal analysis, data curation, visualization and methodology, Y.N.; Supervision, funding acquisition, writing—review and editing, L.Z.; writing—original draft preparation, Y.N., J.X., H.Z., J.Z. and C.Z. All authors have read and agreed to the published version of the manuscript.

Funding

This research was funded by the Social Science Foundation of Hebei Province, China (Grant No. HB23GL014).

Data Availability Statement

The original contributions presented in this study are included in the article. Further inquiries can be directed to the corresponding author.

Acknowledgments

The authors would like to thank their reviewers for their constructive comments that improved this research.

Conflicts of Interest

The authors declare no conflicts of interest.

References

  1. Herrmann, S.M.; Brandt, M.; Rasmussen, K.; Fensholt, R. Accelerating land cover change in West Africa over four decades as population pressure increased. Commun. Earth Environ. 2020, 1, 53. [Google Scholar] [CrossRef]
  2. Gryshova, I.; Kyzym, M.; Khaustova, V.; Korneev, V.; Kramarev, H. Assessment of the industrial structure and its influence on sustainable economic development and quality of life of the population of different world countries. Sustainability 2020, 12, 2072. [Google Scholar] [CrossRef]
  3. Pandey, B.; Brelsford, C.; Seto, K.C. Rising infrastructure inequalities accompany urbanization and economic development. Nat. Commun. 2025, 16, 1193. [Google Scholar] [CrossRef] [PubMed]
  4. Almulhim, A.I.; Cobbinah, P.B. Urbanization-environment conundrum: An invitation to sustainable development in Saudi Arabian cities. Int. J. Sustain. Dev. World Ecol. 2023, 30, 359–373. [Google Scholar] [CrossRef]
  5. Atefeh, M.; Parvaneh, S.; Romina, S. Assessment of the ecological footprint associated with consumption resources and urbanization development in Sistan and Baluchestan province, Iran. Results Eng. 2022, 16, 100673. [Google Scholar] [CrossRef]
  6. Khan, S.U.; Cui, Y. Identifying the impact factors of sustainable development efficiency: Integrating environmental degradation, population density, industrial structure, GDP per capita, urbanization, and technology. Environ. Sci. Pollut. Res. 2022, 29, 56098–56113. [Google Scholar] [CrossRef] [PubMed]
  7. Tian, Y.Y.; Jiang, G.H.; Ma, W.Q.; Wu, S.D.; Tian, Y.Y.; Zhou, T. Understanding the relationship between population–land–industry element inputs and function outputs of rural settlement: An efficiency-based perspective. Habitat Int. 2025, 159, 103370. [Google Scholar] [CrossRef]
  8. Marhasova, V.; Tulchynska, S.; Popelo, O.; Garafonova, O.; Yaroshenko, I.; Semykhulyna, I. Modeling the harmony of economic development of regions in the context of sustainable development. Int. J. Sustain. Dev. Plann. 2022, 17, 441–448. [Google Scholar] [CrossRef]
  9. Liu, Z.Y.; Wang, X.Z.; Qian, H.; Xue, H.Y.; Li, H. Territorial spatial characteristics, issues, and planning responses of agricultural plains from the rerspective of population-land-industry coordination: The case of Huang-Huai-Hai plain. Urban. Plan. Forum. 2024, 32–41. [Google Scholar] [CrossRef]
  10. Cheng, M.Y.; Liu, Y.S.; Jiang, N. Study on the spatial pattern and mechanism of rural population-land-industry coordinating development in Huang-Huai-Hai Area. Acta Geogr. Sin. 2019, 74, 1576–1589. [Google Scholar] [CrossRef]
  11. Ma, L.B.; Chen, M.M.; Che, X.L.; Fang, F. Research on population-land-industry relationship pattern in underdeveloped regions: Gansu province of western China as an example. Sustainability 2019, 11, 2434. [Google Scholar] [CrossRef]
  12. Zhou, F.L.; Liao, H.P.; Zhang, Q.Q. Coupling and coordination of rural “People, land and Industry” transformation from the perspective of economic gradient—A case study of two towns in Yubei district of Chongqing. J. Southwest Univ. Nat. Sci. Ed. 2021, 43, 129–141. [Google Scholar] [CrossRef]
  13. Sarayrah, H.; Hayek, W.; Thneibat, A.; Ibrahim, M. Mapping of population growth influence on land use transformation from 1994 to 2015 in Madaba Governorate, Jordan. Environ. Monit. Assess. 2024, 196, 250. [Google Scholar] [CrossRef]
  14. Tendaupenyu, P.; Dennis, M.C.H.; Murwira, A. Changes in landuse/landcover patterns and human population growth in the Lake Chivero catchment, Zimbabwe. Geocarto Int. 2017, 32, 797–811. [Google Scholar] [CrossRef]
  15. Bawazir, A.A.A.; Aslam, M.; Osman, A.F.B. Demographic change and economic growth: Empirical evidence from the Middle East. Econ. Change Restruct. 2020, 53, 429–450. [Google Scholar] [CrossRef]
  16. Gleria, I.; DaSilva, S.; Brenig, L.; Rocha, T.M.; Figueiredo, A. Modified Verhulst-Solow model for long-term population and economic growth. J. Stat. Mech-Theory E 2024, 2024, 023406. [Google Scholar] [CrossRef]
  17. Huang, C.K.; Lin, F.Y.; Chu, D.P.; Wang, L.L.; Liao, J.W.; Wu, J.Q. Coupling relationship and interactive response between intensive land Use and tourism industry development in China’s major tourist cities. Land 2021, 10, 697. [Google Scholar] [CrossRef]
  18. Qian, Y.F. Research on the coupling relationship between industrial structure and land use structure under urban transformation and the optimization scheme of land use structure. J. Southwest Univ. Nat. Sci. Ed. 2024, 46, 86–94. [Google Scholar] [CrossRef]
  19. Liu, C.; Zeng, Y.; Cai, X.Q.; Zhao, K.W. Rural population-land-industry in Dongting lake eco-economic zone: Spatial-temporal differentiation of the coupling coordination degree. J. Agric. 2022, 12, 77–84. [Google Scholar] [CrossRef]
  20. Chen, X.L.; Zhu, S.Y.; Kong, X.S.; Chen, C.F. Dynamic and static characteristics of spatio-temporal population, land, and industry in Hubei province. Chin. J. Agric. Resour. Reg. Plan. 2021, 42, 31–38. [Google Scholar]
  21. Cui, S.Q.; Zhou, G.H.; Li, X.Q.; Wu, G.H. Simulation of urban-rural integration development of Changsha-Zhuzhou-Xiangtan urban agglomeration from the perspective of “human-land-industry” coordination. Prog. Geogr. 2024, 43, 1337–1354. [Google Scholar] [CrossRef]
  22. Huang, J.; Xue, D.Q.; Ma, B.B.; Song, Y.Y. Spatio and temporal evolution pattern and driving mechanism of coordinated level of human-land-industry system in rural areas of the Loess Plateau. Hum. Geogr. 2021, 36, 117–128. [Google Scholar] [CrossRef]
  23. Huang, L.J.; Yang, P.; Zhang, B.Q.; Hu, W.Y. Spatio-temporal coupling characteristics and the driving mechanism of population-land-industry urbanization in the Yangtze river economic belt. Land 2021, 10, 400. [Google Scholar] [CrossRef]
  24. Liu, Y.J.; Zhou, G.L.; Liu, D.G.; Yu, H.S.; Zhu, L.Y.; Zhang, J. The Interaction of population, industry and land in process of urbanization in China: A case study in Jilin province. Chin. Geogr. Sci. 2018, 28, 529–542. [Google Scholar] [CrossRef]
  25. Li, T.; Liao, H.P.; Wang, W.; Zhuang, W.; Shi, J. Urbanization quality over time and space as well as coupling coordination of land, population and industrialization in Chongqing. Econ. Geogr. 2015, 35, 65–71. [Google Scholar] [CrossRef]
  26. Zhang, Y.J.; Su, Z.G.; Li, G.; Zhuo, Y.F.; Xu, Z.G. Spatial-temporal evolution of sustainable urbanization development: A perspective of the coupling coordination development based on population, industry, and built-up land spatial agglomeration. Sustainability 2018, 10, 1766. [Google Scholar] [CrossRef]
  27. Zhan, Y.J.; Ji, Y.X.; Huang, J.J.; Ma, C.Y.; Ma, C.Q. Land-population-industry based village evolution and its influencing factors in the upper Tuojiang River. J. Mt. Sci. 2024, 21, 2790–2809. [Google Scholar] [CrossRef]
  28. Xu, J.; Liu, H. Spatiotemporal evolution and driving factors of the coupling coordination of the population-land-water-industry system in the lower Yellow River. Sci. Rep. 2024, 14, 23067. [Google Scholar] [CrossRef]
  29. Ji, Z.J.; Zhang, J.Y.; Wang, J.P.; Du, X.B. Study on the pattern and mechanism of the coupling and coordinated development of rural population-land-industry-finance system: Taking typical counties in the three Gorges reservoir area of Chongqing as an example. J. Chongqing Norm. Univ. Nat. Sci. 2023, 40, 48–60. [Google Scholar]
  30. Lyu, X.; Wang, Y.N.; Zhao, Y.T.; Niu, S.D. Spatio-temporal pattern and mechanism of coordinated development of “population–land–industry–money” in rural areas of three provinces in Northeast China. Growth Change 2022, 53, 1333–1361. [Google Scholar] [CrossRef]
  31. Bernard, A.C. Analysis of the two-way causal nexus between macroeconomic factors and infrastructure development: The experience of selected African countries. J. Econ. Adm. Sci. 2023, 39, 322–339. [Google Scholar] [CrossRef]
  32. Heshmati, A.; Rashidghalam, M. Measurement and analysis of urban infrastructure and its effects on urbanization in China. J. Infrastruct. Syst. 2020, 26, 04019030. [Google Scholar] [CrossRef]
  33. Abdelhalim, B. GIS-based multi-criteria decision analysis for the optimal location of public facility in Batna city, Algeria. J. Indian Soc. Remote Sens. 2024, 52, 1073–1084. [Google Scholar] [CrossRef]
  34. Wang, S.; Cheng, H.F. Research on the coupling between public service facilities and residential space based on POI date—A case of Guandu district in Kunming. Urban Archit. 2021, 18, 102–106. [Google Scholar] [CrossRef]
  35. Huang, J.R.; Song, C.; Zhang, K. Assessment of the coordination between urban spatial structure and transportation system or-ganization: A case study of Guangzhou. Urban Transp. China 2024, 22, 77–84. [Google Scholar]
  36. Tokunova, G. Assessment of the transport infrastructure influence on urban agglomerations development. Transp. Res. Procedia 2018, 36, 745–758. [Google Scholar] [CrossRef]
  37. Cui, Y.; Wang, S. Evaluation on the coupling and coordinated development between information infrastructure and upgrading of industrial structure in Beijing-Tianjin-Hebei. J. Tianjin Univ. Commer. 2021, 41, 12–19. [Google Scholar] [CrossRef]
  38. Lu, A.M.; Zhang, S.P. Impact of new infrastructure on the coupling and coordination of the digital economy and the high-quality development of the manufacturing industry. Mod. Ind. Econ. Inf. 2024, 14, 9–12. [Google Scholar] [CrossRef]
  39. Ren, Q.R.; Yu, E.Y. Coupling analysis on coordinated development of ecological environment and social economic system in Gansu province. Acta Ecol. Sin. 2021, 41, 2944–2953. [Google Scholar] [CrossRef]
  40. Ye, Y.A.; Li, Y.Y.; Yang, Q.Q.; Jiao, L.J.; Xu, T.; Sun, Z.H. Research on the coupling and coordination of ecological environment infrastructure, environmental quality, and social economy in Jiangsu province. Environ. Ecol. 2025, 7, 35–41. [Google Scholar]
  41. Pan, Q.C. Research on the Coupling of “Human-Land-Industry” Factors at Different Scales in Rural Regional Systems. Master’s Thesis, Zhejiang Gongshang University, Hangzhou, China, January 2023. [Google Scholar]
  42. Zhang, H.Z.; Yang, Q.Y. Characteristics of “population-land-industry” coordinated development of resource-based shrinking cities in China. World Reg. Stud. 2024, 33, 163–177. [Google Scholar] [CrossRef]
  43. Yang, J.; Huang, X. The 30 m annual land cover dataset and its dynamics in China from 1990 to 2019. Earth Syst. Sci. Data 2021, 13, 3907–3925. [Google Scholar] [CrossRef]
  44. Chen, Y.E.; Sun, Q. A study on calculation of development of China’s infrastructure and its influencing factors—The empirical research based on provincial Panel data. Econ. Geogr. 2016, 36, 23–30. [Google Scholar] [CrossRef]
  45. Fang, F. Evaluation and spatial distinction of the coupling of population-land-industry elements in the counties of Beijing-Tianjin-Hebei Region. World Reg. Stud. 2018, 27, 51–59. [Google Scholar] [CrossRef]
  46. Liu, Q. Optimization Study on the Coupled and Coordinated Development of “People-Land-Industry” in the Border Counties of Inner Mongolia. Master’s Thesis, Inner Mongolia Normal University, Hohhot, China, June 2024. [Google Scholar]
  47. Song, S.Y.; Jiang, D.M.; Li, X.S.; Hang, J.T. Study on the coupled and coordinated development of “population-land-industry” in coal resource-exhausted cities. China Min. Mag. 2021, 30, 57–65. [Google Scholar] [CrossRef]
  48. Cong, X.N. Expression and mathematical property of coupling model and its misuse in geographical science. Econ. Geogr. 2019, 39, 18–25. [Google Scholar] [CrossRef]
  49. Zhu, J.L.; Li, Z.L. Coupling coordination development of industry-population-space in city cluster of Yangtze River delta region. China Popul. Resour. Environ. 2015, 25, 75–82. [Google Scholar] [CrossRef]
  50. Wang, C.; Tang, N. Spatio-temporal characteristics and evolution of rural production-living-ecological space function coupling coordination in Chongqing Municipality. Geogr. Res. 2018, 37, 1100–1114. [Google Scholar]
  51. Wang, Y.; Shen, Y. Spatial autocorrelation methods and their main applications. Chin. J. Health Stat. 2008, 443–445. [Google Scholar]
  52. Zhou, W.H.; Zeng, B. A research review of grey relational degree model. Stat. Decis. 2020, 36, 29–34. [Google Scholar] [CrossRef]
  53. Li, X.H.; Liu, Y.S.; Guo, Y.Z. The spatial pattern of population-land-industry coupling coordinated development and its influencing factor detection in rural China. J. Geogr. Sci. 2023, 33, 2257–2277. [Google Scholar] [CrossRef]
  54. Xu, L.; Zhang, P.P.; Zhang, G.J.; Yang, J.Y.; Hu, F.; Ma, L.J. Resilience and coordination characteristics of rural territorial system of counties in Hebei province based on structure and function. Geogr. Geo-Inf. Sci. 2023, 39, 98–106+130. [Google Scholar] [CrossRef]
  55. Zhang, Y.; Wu, K.N.; Li, X.L.; Kang, L.; Meng, J.L. Study on spatial-temporal differentiation and coupling coordination degree of multi-functionality of county land use in Hebei province. Chin. J. Agric. Resour. Reg. Plan. 2024, 45, 150–161. [Google Scholar]
  56. Shi, W.H.; Tian, J.; Namaiti, A.; Xing, X.X. Spatial-temporal evolution and driving factors of the coupling coordination between urbanization and urban resilience: A case study of the 167 Counties in Hebei province. Int. J. Environ. Res. Public Health 2022, 19, 13128. [Google Scholar] [CrossRef]
  57. Liu, Z.H.; Guan, X.J.; Wu, W.H.; Yang, Y.Y.; Shi, R.G. Research on the pattern and driving mechanism of coordinated development of rural people-land-industry in Ningxia, China. J. Agric. Resour. Environ. 2024, 42, 1105. [Google Scholar] [CrossRef]
  58. Huang, L.J.; Yang, P. Spatio-Temporal coordination characteristics and driving factors of population-land-industry non-agriculturalization the Yangtze river economic belt. Chin. J. Agric. Resour. Reg. Plan. 2021, 42, 182–192. [Google Scholar]
Figure 1. Research framework.
Land 14 02043 g001
Figure 2. Population, land, industry, and facilities interactions.
Land 14 02043 g002
Figure 3. Location of Hebei Province. (a) The entire territory of China, (b) Hebei Province.
Land 14 02043 g003
Figure 4. Spatio-Temporal Evolution of Development Levels Across Subsystems in Hebei Province, 2007–2022.
Land 14 02043 g004
Figure 5. Spatio-Temporal Evolution of the Comprehensive Development Level of the PLIF System in Hebei Province, 2007–2022.
Land 14 02043 g005
Figure 6. Spatio-temporal Pattern Evolution of Coupling Degree of PLIF System in Hebei Province, 2007–2022.
Land 14 02043 g006
Figure 7. Spatio-temporal pattern evolution of PLIF system coupling coordination degree in Hebei Province, 2007–2022.
Land 14 02043 g007
Figure 8. LISA clustering diagram of coupled PLIF system coordination in Hebei Province, 2007–2022.
Land 14 02043 g008
Figure 9. Degree of coordination of the coupled PLIF system and the correlation between the indicators of each subsystem.
Land 14 02043 g009
Table 1. Integrated evaluation indicator system of the PLIF system.
Target LayerIndex LayerNumberUnitWeight
PopulationDensity of populationP1persons/km20.238
Population urbanization rateP2 0.215
Rural labor force non-agriculturalizationP3%0.127
Number of medical and health technicians per 10,000 peopleP4persons0.301
Number of regular secondary school teachers per 10,000 peopleP5persons0.12
LandProportion of cultivated land areaL1%0.151
Proportion of construction land areaL2%0.22
Average public financial revenue per land areaL3ten thousand yuan/km20.15
Average public financial expenditure per land areaL4ten thousand yuan/km20.357
Average social investment in fixed assetsL5ten thousand yuan/km20.123
IndustryPer capita regional GDPI1ten thousand yuan/person0.238
Share of the primary industryI2%0.132
Share of the tertiary industryI3%0.124
Industrial sophistication levelI4%0.213
Per capita industrial output valueI5ten thousand yuan/person0.293
FacilityHighway mileageF1km0.119
Effective irrigation areaF2hm20.147
Per capita electricity consumption in the whole societyF3kWh/person0.258
Number of hospitals and health centersF4unit0.249
Number of ordinary high schoolsF5unit0.227
Table 2. The PLIF system coupling degree classification.
Range of CouplingType of CouplingCharacteristics of Coupling
0 < C ≤ 0.3Low-level couplingThe correlation among each subsystem is relatively weak.
0.3 < C ≤ 0.5Antagonistic stageThe correlation among each subsystem is constantly improving and shows a trend from weak to strong.
0.5 < C ≤ 0.8Running-in stageThe degree of correlation among each subsystem is continuously increasing, and the system is developing in an orderly manner.
0.8 < C ≤ 1High-level couplingEach subsystem is tending towards a period of benign resonance coupling.
Table 3. The PLIF system coupling coordination degree classification.
Coupling Coordination DegreeCoupling Coordinate TypeCoupling Coordination Stage
0 < D ≤ 0.2Serious imbalanceImbalance development stage
0.2 < D ≤ 0.35Mild imbalance
0.35 < D ≤ 0.4On the brink of imbalanceTransition stage
0.4 < D ≤ 0.5Barely coordination
0.5 < D ≤ 0.6Primary coordinationCoordinated development stage
0.6 < D ≤ 0.8Moderate coordination
0.8 < D < 1Excellent coordination
Table 4. Global Moran’s I of the PLIF system coupling coordination degree in Hebei Province, 2007–2022.
Global Moran’s IYear
2007201220172022
I0.2910.2580.2920.27
p-value0.0010.0010.0010.001
Z-value5.06774.47384.90744.4547
Disclaimer/Publisher’s Note: The statements, opinions and data contained in all publications are solely those of the individual author(s) and contributor(s) and not of MDPI and/or the editor(s). MDPI and/or the editor(s) disclaim responsibility for any injury to people or property resulting from any ideas, methods, instructions or products referred to in the content.