Article

Quantifying Mining-Induced Phenological Disturbance and Soil Moisture Regulation in Semi-Arid Grasslands Using HLS Time Series

College of Geoscience and Surveying Engineering, China University of Mining and Technology (Beijing), Beijing 100083, China
*
Author to whom correspondence should be addressed.
Land 2025, 14(10), 2011; https://doi.org/10.3390/land14102011
Submission received: 26 August 2025 / Revised: 1 October 2025 / Accepted: 4 October 2025 / Published: 7 October 2025
(This article belongs to the Section Land, Soil and Water)

Abstract

Coal mining disturbances in semi-arid grasslands affect land surface phenology (LSP), impacting ecosystem functions, restoration target setting, and carbon sequestration; however, the magnitude and spatial extent of these disturbances and their detectability across vegetation indices (VIs), remain insufficiently constrained. We developed and applied a streamlined quantitative framework to delineate the extent and intensity of mining-induced phenological disturbance and to compare the sensitivity and stability of commonly used VIs. Using Harmonized Landsat Sentinel (HLS) surface reflectance data over the Yimin mine, we reconstructed multitemporal VI trajectories and derived phenological metrics; directional phenology gradients were used to delineate disturbance, and VI responsiveness was evaluated via mean difference (MD) and standard deviation (SD) between affected and control areas. Research findings indicate that the impact of mining extends to an area approximately four times the size of the mining site, with the start of season (SOS) in affected areas occurring about 10 days later than in unaffected areas. Responses varied markedly among VIs, with the Modified Soil-Adjusted Vegetation Index (MSAVI) exhibiting the highest spectral stability under disturbance. This framework yields an information-rich quantification of phenological impacts attributable to mining and provides operational guidance for index selection and the prioritization of restoration and environmental management in semi-arid mining landscapes.

1. Introduction

Against a backdrop of accelerating global industrialization, urbanization, and modernization, global resource consumption has risen rapidly [1]. Although mineral resource extraction contributes significantly to meeting economic demand, it often occurs at the expense of ecosystems, resulting in irreversible ecological damage and the loss of substantial resources [2]. Especially in some developing countries, the impetus of the mining economy often prioritizes economic gains while overlooking the profound impacts of mining activities on ecosystems [3].
In 2020, coal accounted for 56.8% of China’s total energy consumption, representing a 0.6% increase over the previous year [4]. Driven by energy demand, China’s coal production has continued to rise in recent years. Although intensive coal mining supports economic growth, it has also generated numerous ecological and environmental problems. Long-term, large-scale mining operations adversely affect surface landscapes, further leading to widespread soil erosion [5], environmental pollution [6], groundwater depletion [7], and biodiversity loss [8]. Although minerals and heavy metals occur naturally in soils, mining activities often increase their concentrations to levels harmful to plant growth [9], thereby degrading the growth environment for vegetation within and around mining areas, leading to habitat degradation [10]. The inherent fragility of the geological environment renders local ecosystems especially sensitive to external disturbances [11]. Therefore, clarifying the impacts of mining activities on the surrounding environment and implementing targeted ecological restoration and optimized landscape configurations are crucial. Current research on the effects of mining on vegetation primarily focuses on analyzing changes in vegetation cover using different VIs. For instance, Song et al. quantified vegetation-cover changes within mining areas to assess the extent of mining damage and progress in land reclamation [12]. Ren et al. used machine-learning techniques and multisource UAV data fusion to evaluate vegetation recovery following coal-waste dumping [13]. Although these studies provide valuable insights into mining impacts, they do not adequately address the effects of mining activities on surrounding vegetation phenology. Phenological changes are critical for estimating carbon budgets in mining ecosystems [14]. This research gap poses a risk of underestimating the carbon sequestration capacity of rehabilitated areas, which could ultimately undermine ecosystem stability and resilience. Existing studies typically use fixed VI analysis timeframes [15,16,17], which hinder precise quantification of the magnitude and spatial extent of mining impacts. Moreover, NDVI remains the most commonly used VI [18,19,20], and there is limited research on the sensitivity of alternative VIs for assessing mining impacts. Given the complexity and consequences of mining activities in semi-arid regions, this study aims to quantify the relationship between mining operations and vegetation phenology and to evaluate the sensitivity of multiple VIs to mining-induced environmental changes. This research is important for improving under-standing of land-degradation mechanisms within mining areas.
Long-term observation of VIs can effectively distinguish climate-driven from anthropogenic impacts on vegetation [21]. However, traditional RS datasets such as AVHRR and MODIS, owing to their relatively coarse spatial resolution, struggle to meet monitoring requirements at regional scales and for individual case studies [22]. Although Landsat 8’s 30 m resolution meets small-scale monitoring needs, its 16-day revisit cycle limits detection of rapidly changing phenological events [23]. The Sentinel constellation, which has been operational since 2017, offers a 5-day revisit cycle and 10–60 m spatial resolution, thereby significantly advancing vegetation-phenology monitoring; nevertheless, optical-based phenological monitoring remains challenged by frequent cloud cover [24]. Launched in recent years, NASA’s HLS project generates near-daily global surface reflectance data [25], presenting significant opportunities for LSP monitoring. Against this backdrop, this study uses the HLS dataset to assess the impact of mining activities on vegetation phenology in semi-arid regions and to evaluate the sensitivity of different VIs to mining-induced environmental changes. Our contribution innovatively proposed a technical framework that combines directional phenological gradients with curvature-based breakpoint identification, enabling the identification of the extent of mining activities’ impact on vegetation phenology. This study provides critical theoretical underpinnings for understanding land degradation mechanisms in mining areas and offers practical guidance for prioritizing vegetation restoration and environmental management strategies post-ecological remediation.

2. Study Area and Data Sources

2.1. Study Area

The Yimin Coal Mine (119°45′25.3728″ E, 48°35′19.3812″ N) is located in the Ewenki Autonomous Banner of the Hulunbuir Grassland, Inner Mongolia, China (Figure 1). Situated at the junction of the Yimin River floodplain terrace and the plateau, the site constitutes a critical ecological zone, primarily functioning in water conservation and soil retention [26]. The western portion of the mining area comprises low hills, whereas the eastern portion lies within the Yimin River basin. The region experiences a temperate continental climate, which is characterized by long, cold winters and short, cool summers. The mean annual precipitation is approximately 354.73 mm, which classifies the area as a typical semi-arid zone [27]. The area’s geographical setting and ecological characteristics render the mine ecosystem highly sensitive to external disturbances. Primary vegetation in the mining area comprises meadow grasslands and typical grasslands, forming part of one of the world’s notable natural pastures [28].
Since its development in 1956, the Yimin Coal Mine has grown to become the largest coal mine in the People’s Republic of China. By 2020, annual production reached 13 million tonnes, and cumulative production exceeded 105 million tonnes. Mining activities have resulted in the construction of extraction pits, waste-rock piles, transfer stations, and tailings ponds, covering approximately 7 km2. These structures have caused severe degradation of native vegetation and diminished key ecological functions such as soil stability and water conservation, leading to substantial negative effects on the regional ecosystem. Therefore, the Yimin Coal Mine is not only an important energy base in China but also, given its characteristic ecological setting and pronounced disturbance features, a representative region for studying the ecological impacts of mining.

2.2. Data Sources and Preprocessing

The data used in this study include the HLS dataset, soil moisture data, and land cover data. The HLS dataset, developed by NASA by harmonizing Landsat-8 OLI and Sentinel-2 MSI observations, provides seamless 30 m surface-reflectance products after atmospheric correction, cloud masking, and bidirectional reflectance distribution-function (BRDF) normalization, with an effective revisit interval of 2–3 days. A total of 65 HLS scenes were collected over the Yimin coalfield between 1 January and 30 December 2020, comprising 45 Sentinel-2 scenes and 20 Landsat-8 scenes. After mosaicking and clipping, the 30 m surface reflectance data were filtered using the QA band to remove low-quality pixels affected by cirrus clouds and terrain shadows. This study used the Global Land Cover Product with Fine Classification (30 m, 2020), published by the International Research Center for Big Data on Sustainable Development Goals (https://data.casearth.cn/dataset/6523adf6819aec0c3a438252 accessed on 10 August 2024). This dataset provides a detailed global land-cover classification and is suitable for monitoring dynamic land-use change. In addition, daily soil moisture data for t-he year 2020 were obtained from the 1 km China Daily Soil Moisture Raster Dataset (https://data.tpdc.ac.cn/zhhans/data accessed on 18 December 2024). An overview of the datasets used in this study, including their temporal coverage, spatial resolution, data sources, intended uses, and preprocessing steps, is summarized in Table 1.

3. Research Methodology

This study employs a three-step approach. Firstly, an initial VI time series dataset is constructed, comprising five vegetation indices: NDVI, EVI, GNDVI, RECI and MSAVI. Secondly, the effects of Savitzky–Golay (SG) filtering, dual logistic (DL), and asymmetric Gaussian (AG) filtering methods on the VIs are compared, and the most suitable method is s selected for phenological extraction in the study area. Thirdly, a quantitative framework is developed to assess the impact of mining activities on vegetation phenology; the extracted phenological parameters are compared to delineate the disturbance extent caused by mining and to analyze the factors driving phenological differences.

3.1. Construction of Initial Vegetation Index Time Series Dataset

In semi-arid regions, where natural environments are complex and ecosystems fragile, selecting appropriate VIs is crucial for accurately characterizing regional vegetation conditions. VIs are influenced not only by vegetation cover but also by multiple confounding factors, including soil background reflectance, atmospheric scattering, and atmospheric absorption. Accounting for these factors, this study selected five VIs for a comparative analysis of their suitability for the study area. These indices include the NDVI, EVI, GNDVI, RECI, and MSAVI. Each index exhibits distinct characteristics for vegetation monitoring, including its ability to suppress soil background effects, its performance under high vegetation cover, and its sensitivity to vegetation signals in different spectral bands. Table 2 presents the calculation formulas and detailed descriptions of these indices.

3.2. Vegetation Index Time Series Reconstruction

VI time series are frequently affected by two primary issues: noise and missing data [34]. To improve time-series quality and mitigate the effects of noise and data gaps, reconstruction is required prior to analysis. In this study, three high-performance reconstruction algorithms—SG [35], DL [36], and AG [37] were applied to reconstruct the VI time series dataset for the study area. We evaluate the effectiveness of these methods in suppressing noise and preserving vegetation-growth signals.

3.2.1. Savitzky–Golay Filtering

Widely used for data smoothing and denoising, this method employs a combination of piecewise Gaussian components to model the seasonal vegetation growth patterns, with each component representing a vegetation growth-decline cycle [38]. The time series is then reconstructed by smoothing and concatenating the Gaussian fitted curves. The Savitzky–Golay filtering function is given as follows:
f ( t ) s g = 1 H i = w + w x k + i
where f ( t ) s g represents the data obtained after processing with the SG smoothing algorithm; x k denotes the data point in the original data sequence, where k is the index of the data point in the sequence; H represents the normalization coefficient, which is the sum of the coefficients h i ; w is the window half-width, defining the range of original data points selected for calculating the smoothed value; h i is the weighting coefficient, determining the weight of each data point in the smoothing process when calculating the final smoothed value.

3.2.2. Double Logistic Fitting

This method, employed for time series reconstruction, characterizes the seasonal dynamics of VIs using a through a double-logistic function. It is particularly suitable for modeling the ascending and descending phases of vegetation growth, effectively capturing their asymmetric characteristics [39]. The basic form of the Double-Logistic function is given as follows:
f t d l = v m i n + v 1 1 + e x p ( m 1 + m 2 · t ) v 2 1 + e x p ( m 3 + m 4 · t )
where v m i n represents the minimum value of the vegetation index; v 1 and v 2 denote the amplitudes of the first and second logistic growth phases, respectively; m 1 , m 2 , m 3 , m 4 are time-dependent parameters that control the shape and position of the logistic curve.

3.2.3. Asymmetric Gaussian Fitting

The core idea of the AG fitting method is to exploit the Gaussian function’s shape to model the seasonal dynamics of Vis [40]. The Gaussian function is unimodal, making it well-suited to modeling both the ascending and descending phases of vegetation growth. The formula for the Asymmetric Gaussian function is given as follows:
f ( t ) a g = A · exp t μ 2 2 σ 2
where A is the amplitude of the Gaussian function, representing the maximum value of the vegetation index; μ is the center position of the Gaussian function, representing the peak growth time of vegetation; σ is the standard deviation of the Gaussian function, controlling the width of the curve.

3.3. Extraction of Vegetation Phenology Parameters

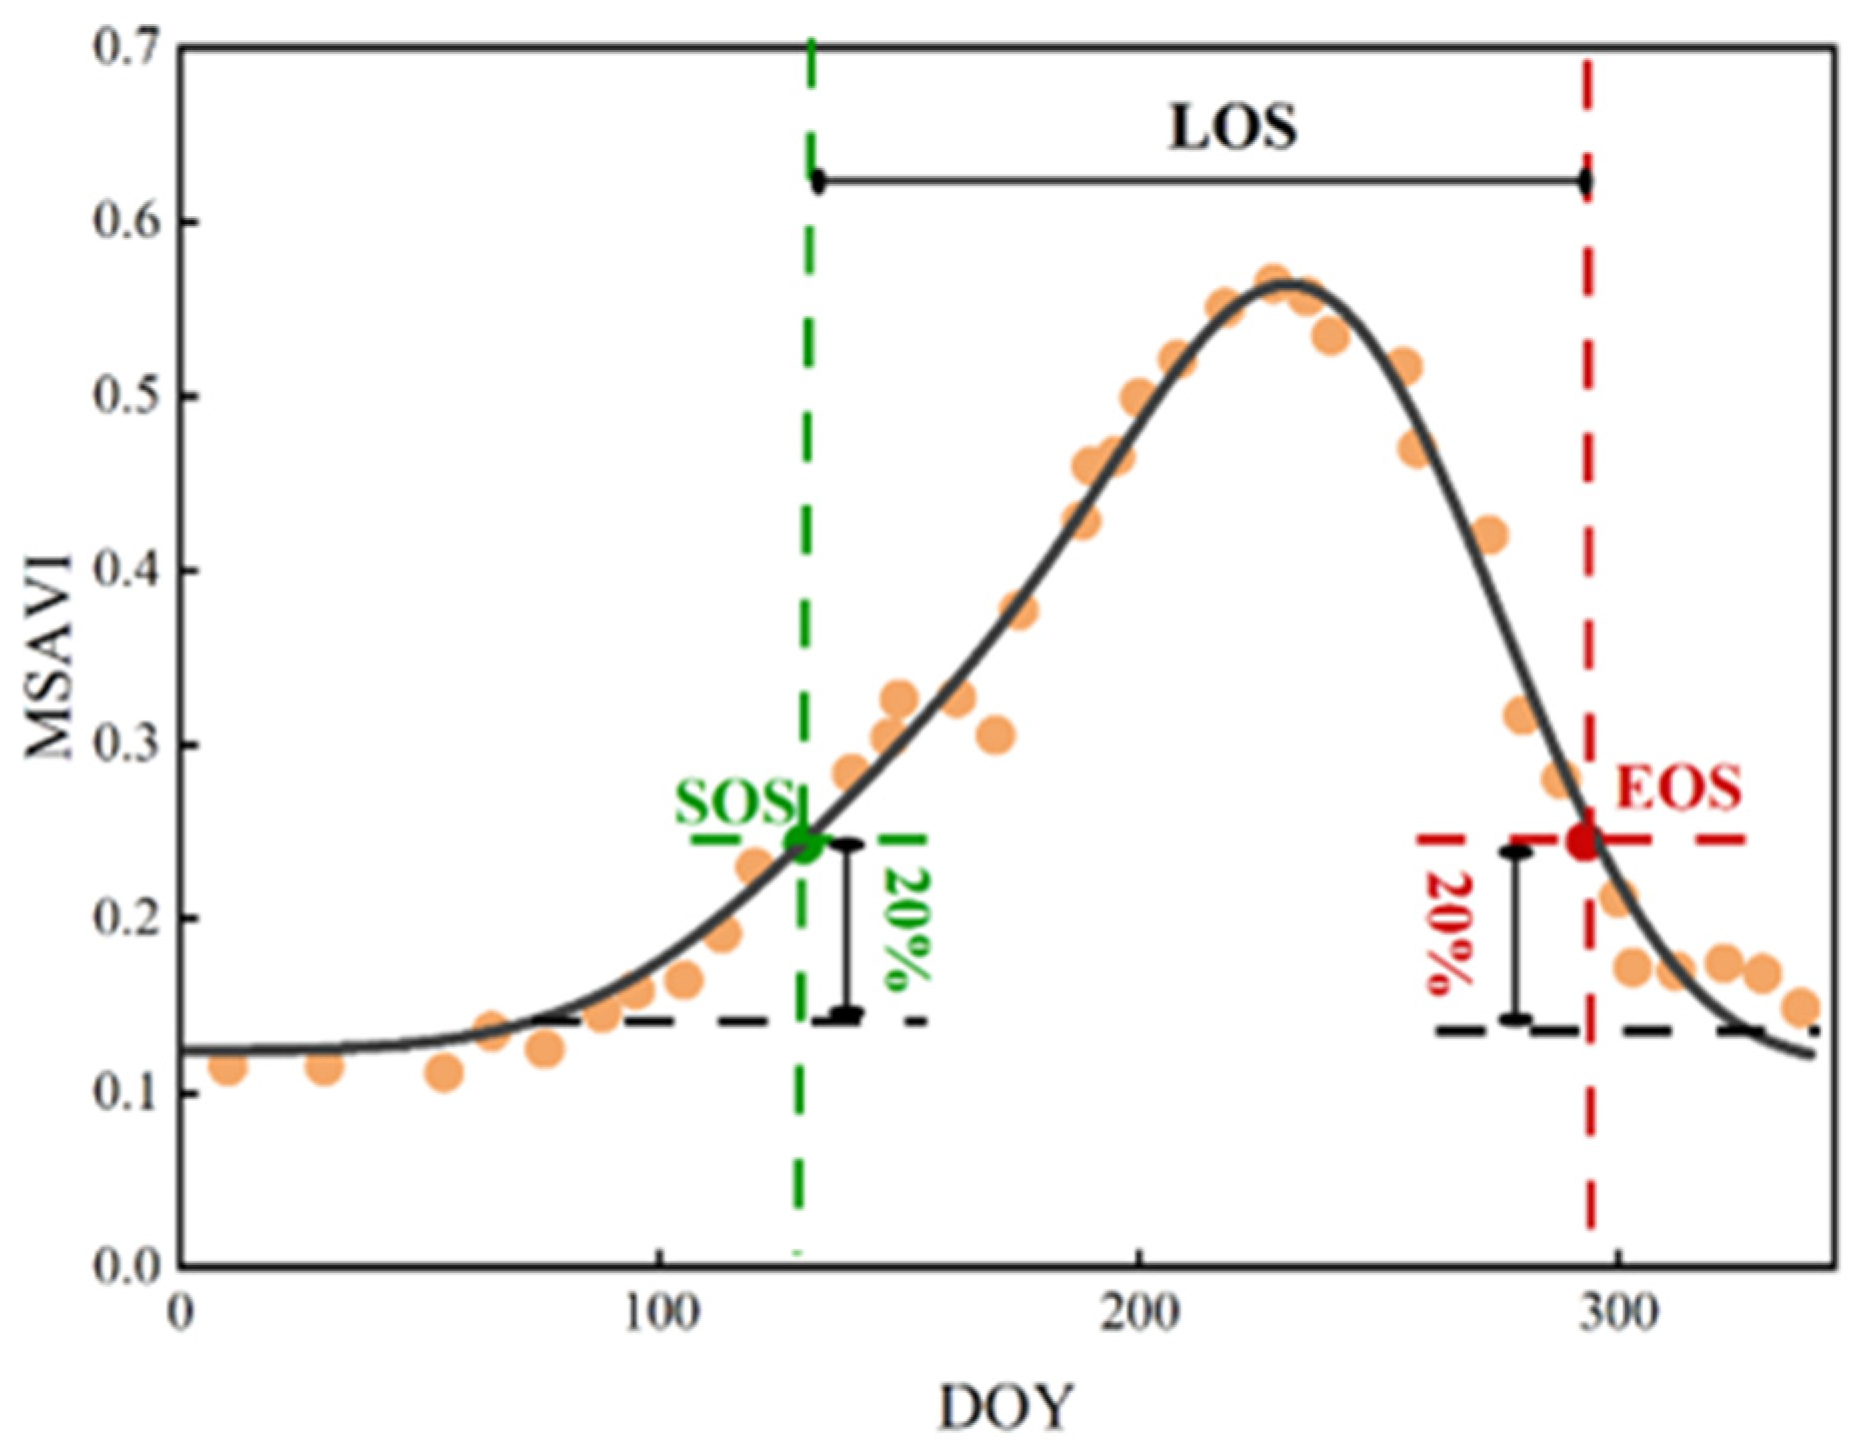
This study employs the dynamic threshold method to extract three vegetation phenology parameters: SOS, length of season (LOS), and end of season (EOS). The threshold approach, which is among the most widely used and straightforward methods, comprises two primary variants: (1) the fixed-threshold method, where a fixed index value is arbitrarily determined as the SOS and EOS [41]; and (2) the dynamic-threshold method, where the threshold is derived from statistics of the smoothed time series, such as the median, mean, or a proportional amplitude [42]. Given that the study area is located in a typical semi-arid region with sparse vegetation and heterogeneous mining disturbances, the fixed-threshold method may inaccurately identify phenological transitions because of low background VI values. Therefore, the dynamic-threshold method was adopted to enhance sensitivity to spatial variations in disturbance intensity. Implementation utilized the TIMESATv3.3 software package to extract phenological parameters. Specifically, following previous studies [43,44], SOS and EOS were identified as the time points corresponding to 20% of the seasonal amplitude measured from their respective local minima on either side of the seasonal growth curve (Figure 2). Although alternative methods, including the moving average method [45] and the maximum rate of change method [46], have achieved high accuracy in some studies, their performance is highly dependent on the temporal continuity and smoothness of the time series. The pixel-level remote sensing data exhibit prevalent observational data gaps and noise, primarily due to factors such as cloud contamination, particularly in certain areas. Consequently, these methods were not applied in this study to ensure the robustness and comparability of the results.

3.4. Quantitative Method for Assessing the Impact of Mining Activities on Vegetation Phenology

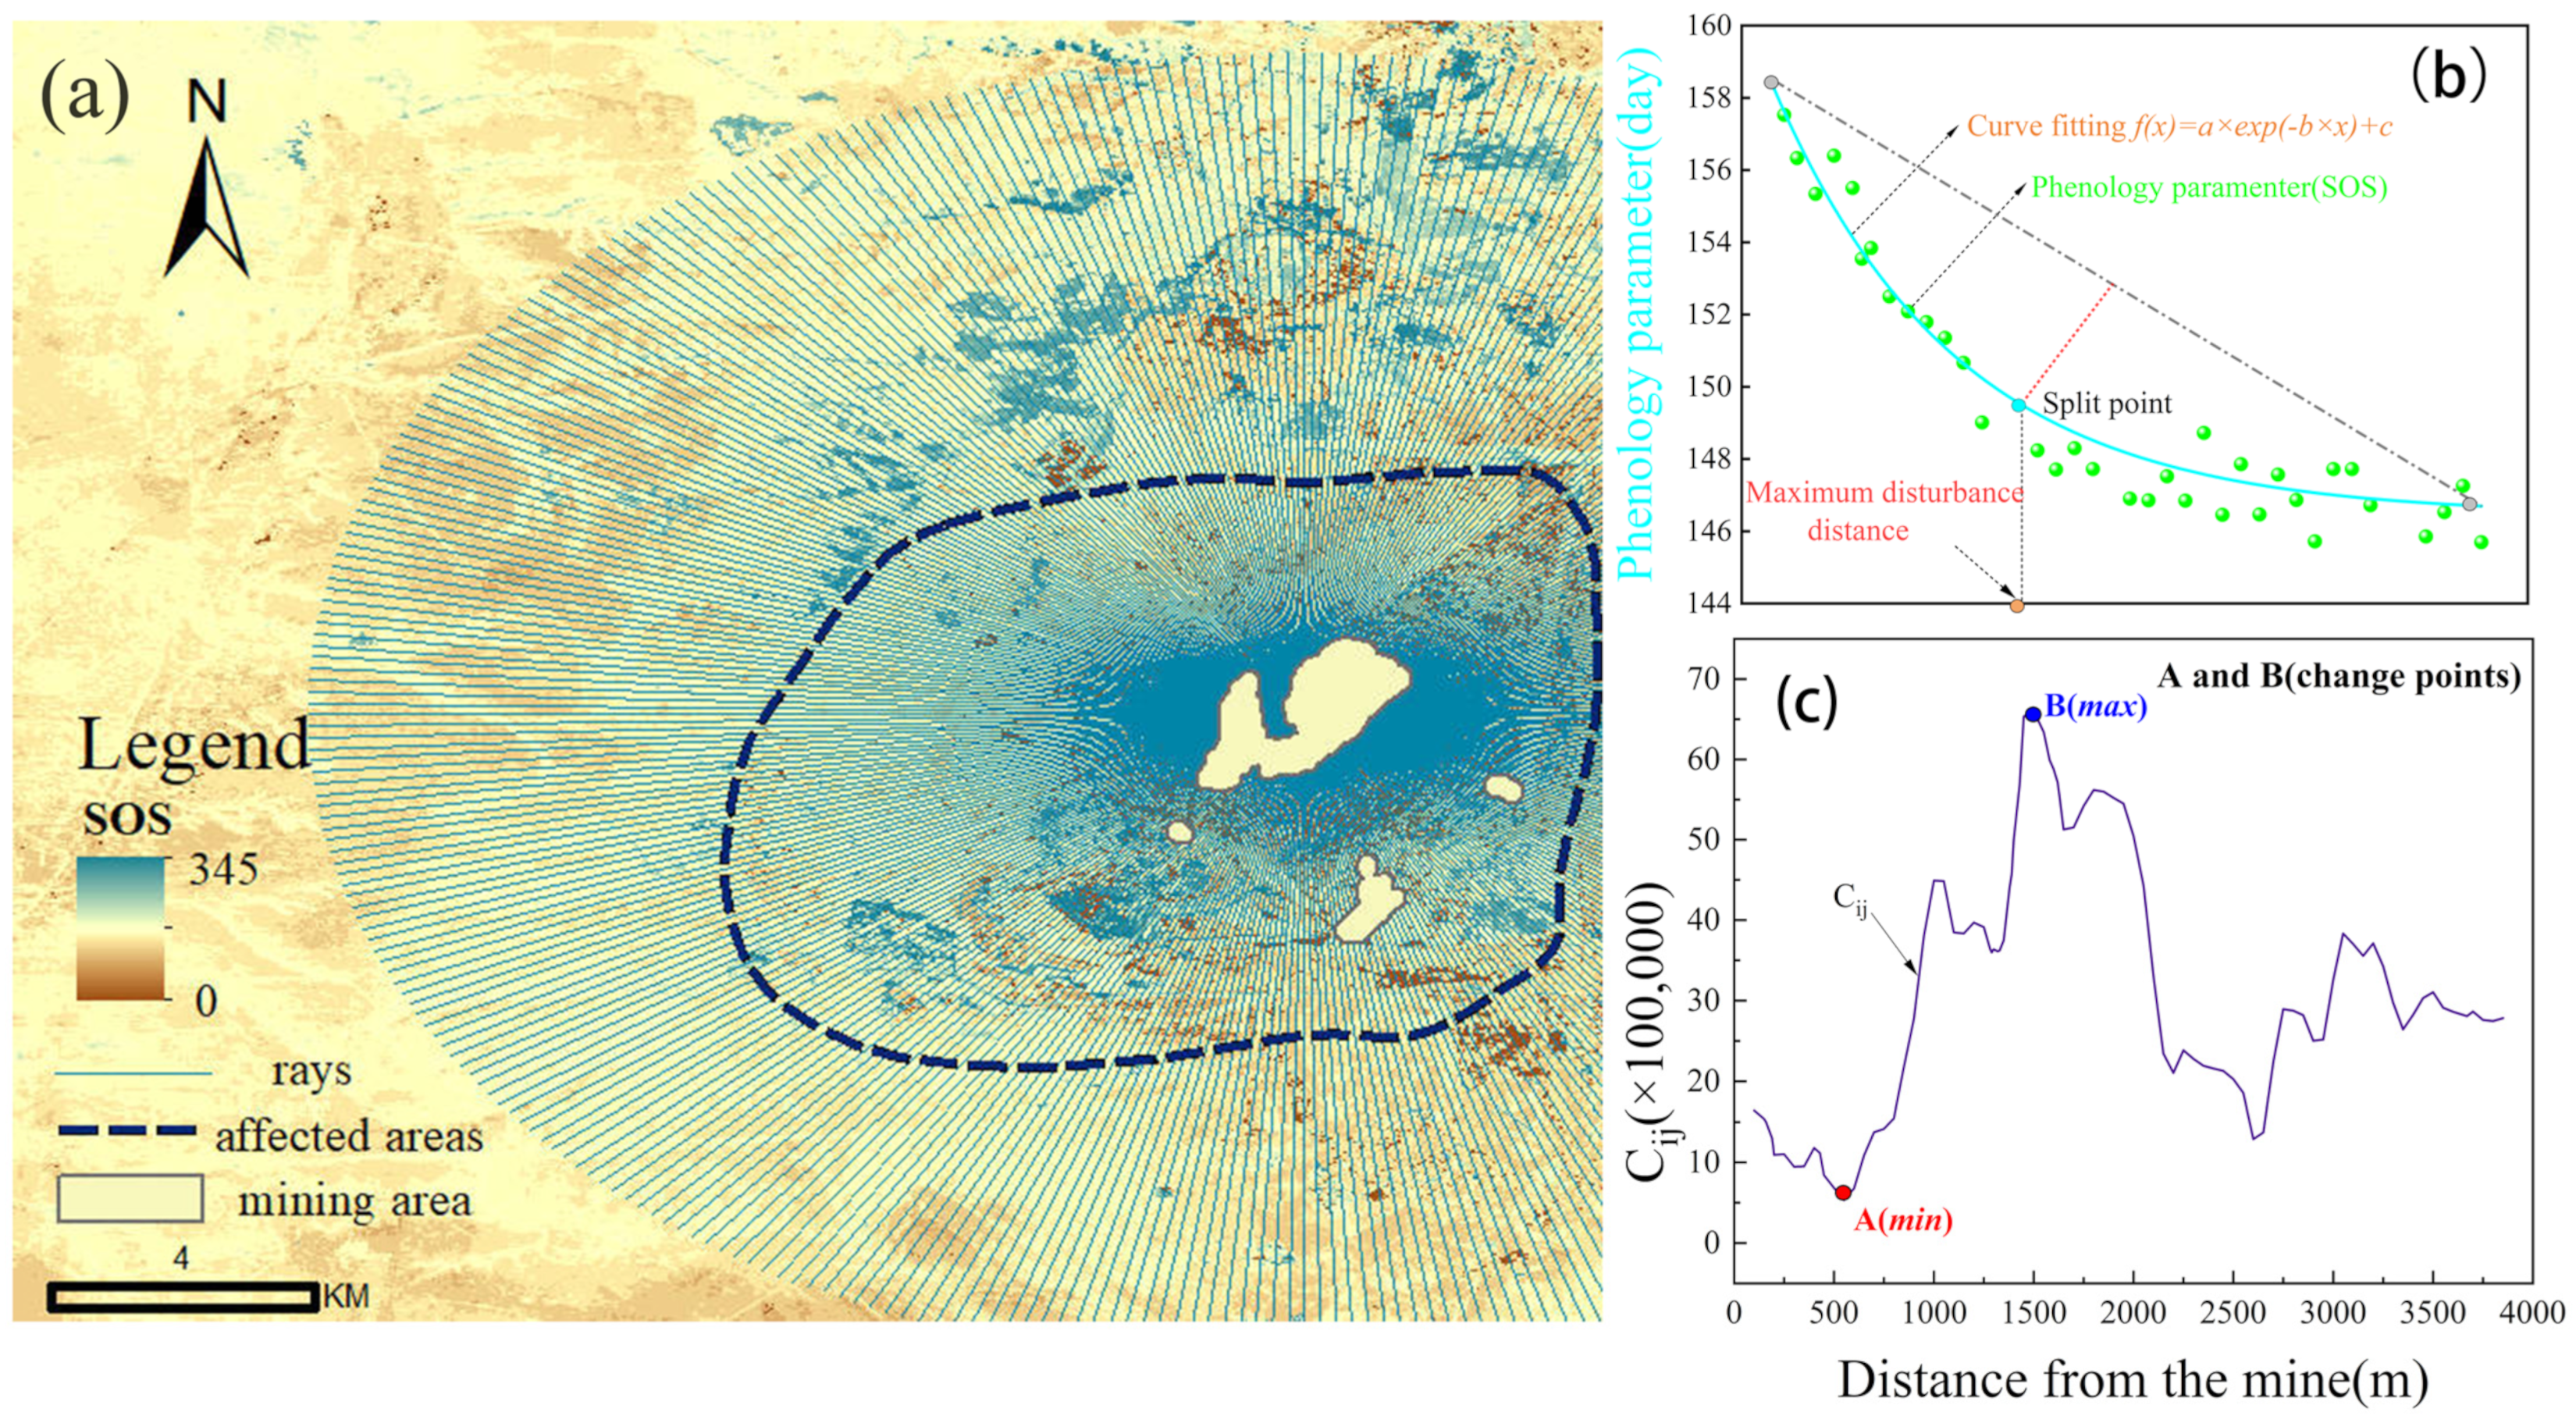
Previous studies indicate that mining-induced disturbances to vegetation phenology typically follow an exponential decay pattern with increasing distance from the mining site, with the most significant delay in SOS occurring near the mine and diminishing rapidly with distance [47]. Building upon this characteristic pattern, the present study proposes a methodological framework (Figure 3) to quantify the spatial intensity and extent of mining-induced disturbances.
Step 1: Using remote sensing data, the boundary of the mining area is delineated through visual interpretation. The centroid of the delineated boundary is designated as the center of the mining zone. From this center, rays are emitted at 1° intervals in all directions. Each radial transect is initialized to 10 km, with control areas defined at 5 km from the mining center along each direction. These rays are overlaid on the phenological parameter maps to examine spatial trends in vegetation phenology along each directional transect surrounding the mining area.
Step 2: Phenological-parameter values are sampled along each ray at fixed intervals of length N. Mathematical fitting is then applied to these samples, indicating that vegetation phenology generally varies with distances from the mining center according to an exponential function. This finding provides a theoretical basis for identifying abrupt changes along each directional transect.
Step 3: A directional phenological sequence analysis method is employed to define basic research units. For each directional transect i, a curvature-derivative analysis is employed to identify the threshold of vegetation response induced by mining disturbances. Specifically, a twice-differentiable differentiable spline function is used to characterize the phenological gradient curve. Let C i j denote the curvature of the j-th sequence in the i-th direction, and C i j + 1 denote the curvature of the subsequent sequence in the same direction. Local maxima and minima of curvature are identified as candidate breakpoints along that direction. Finally, the disturbance extent is delineated by smoothing these breakpoints via spline interpolation.

4. Results and Analysis

4.1. Comparison of Time Series Reconstruction Methods

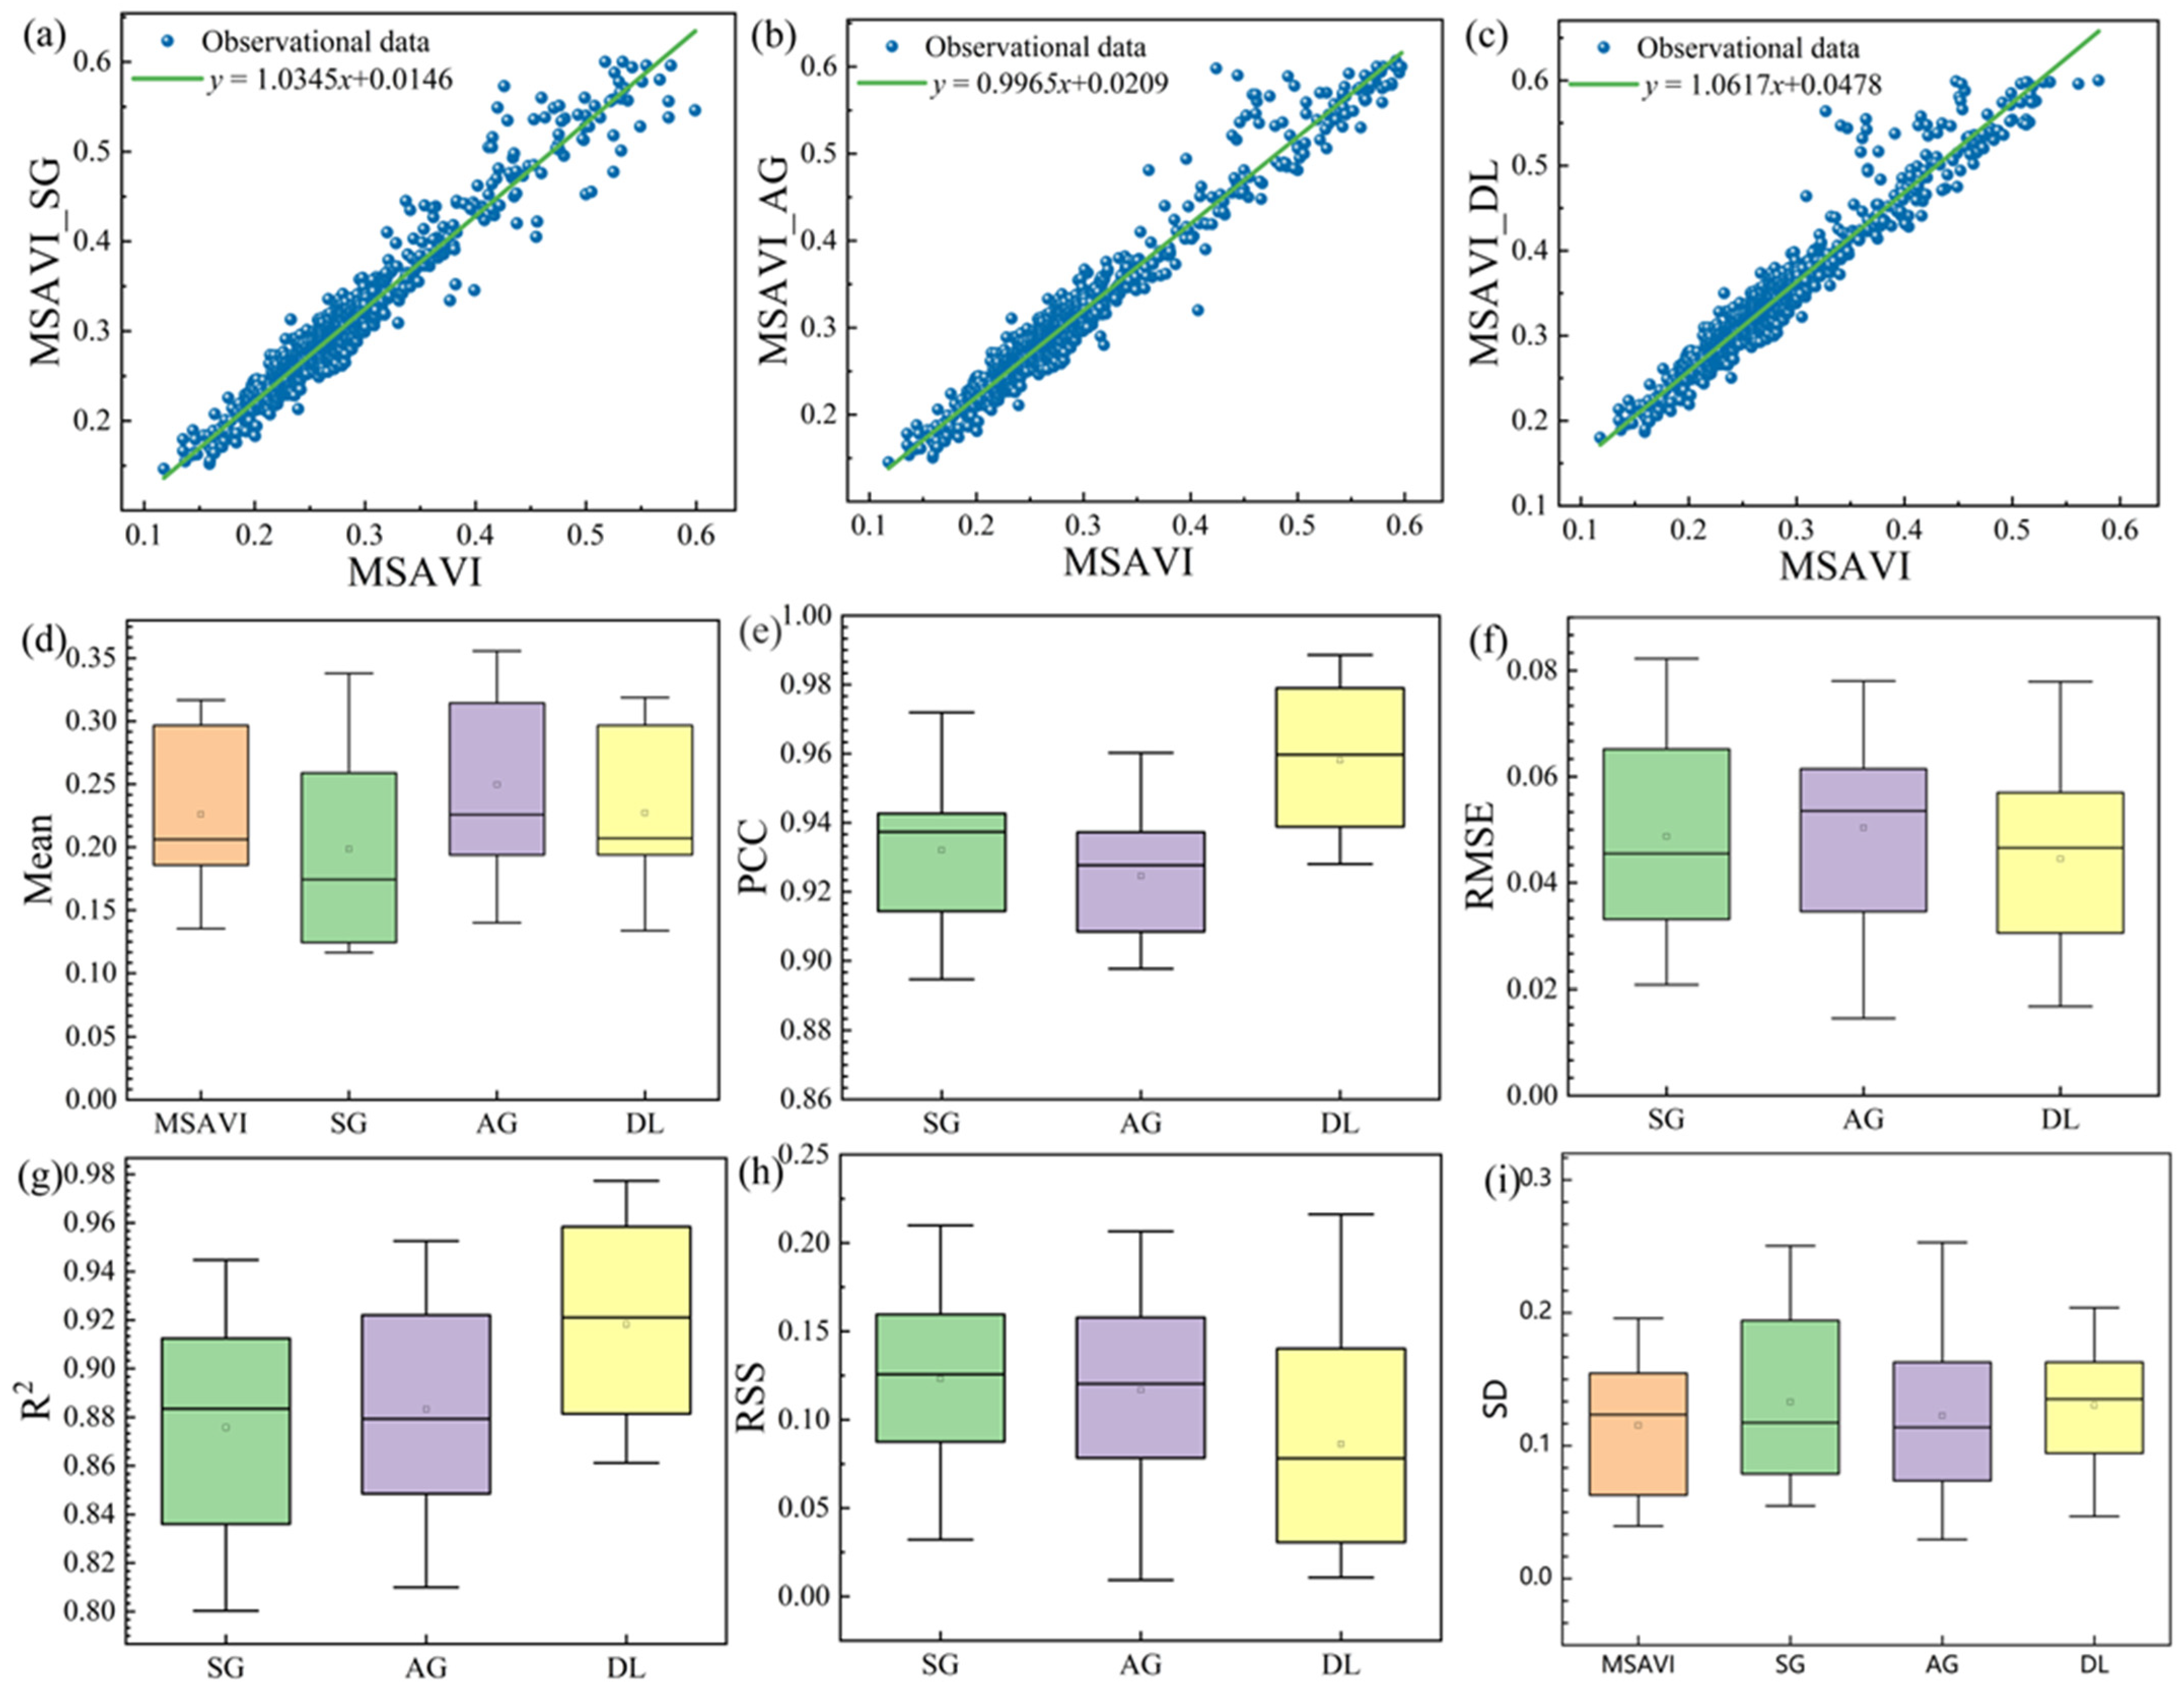
The reconstruction results of MSAVI time series using the SG, DL and AG algorithms are presented in Figure 4 and Figure 5. To comprehensively evaluate the performance of these time series reconstruction methods, six statistical metrics were employed: Pearson correlation coefficient (PCC), coefficient of determination (R2), residual sum of squares (RSS), root mean square error (RMSE), mean and SD. Among these, PCC measures the linear agreement between the reconstructed and original series, whereas R2 indicates the model’s ability to explain data variance. RSS and RMSE assess the total and average fitting error, respectively, with smaller values indicating higher accuracy. The mean reflects the series’ overall level, whereas SD captures temporal variability and thus helps detect systematic bias or over-smoothing in the reconstruction.
Results indicate that the DL algorithm outperformed the other two in four of the six metrics, achieving PCC = 0.956, R2 = 0.918, RSS = 0.102, and RMSE = 0.043. In contrast, the SG and AG methods yielded lower PCC and R2 values, higher RSS and RMSE, and larger SDs, indicating a reduced ability to preserve temporal detail and to suppress noise. Notably, during the vegetation growth phase (e.g., days 120–150) and senescence phase (e.g., days 275–300), the DL algorithm better retained curve characteristics, avoiding over-smoothing or distortion of critical phenological signal. In terms of overall fitting distribution, all three algorithms reduced noise to varying extents. The raw MSAVI data in the study area exhibited low-value noise commonly due to surface moisture, snow/ice cover, cloud contamination, and atmospheric aerosols, whereas abnormally high values were relatively rare. After reconstruction, most pixel values showed an overall increase, suggesting that all methods possessed some denoising capability. However, the DL algorithm demonstrated a superior balance between reconstruction stability and fidelity. Owing to its strong performance in fitting accuracy, noise suppression, and phenological-signal preservation, the DL method was selected as the primary time series reconstruction algorithm for subsequent analyses.

4.2. Delineation of the Impact Range of Mining Activities

Using a step size of 100 m, the mean values and fitted curves of phenological metrics reconstructed by the DL method for five vegetation indices were analyzed and are presented in Figure 6. Phenological parameters for EVI, NDVI, GNDVI, RECI and MSAVI all exhibited an exponential trend with increasing distance from the mining area, following a consistent pattern. Among these metrics, SOS and LOS exhibited the most pronounced changes, whereas variations in EOS were relatively minor.
Compared with the control area located 5 km from mining activities, vegetation in the surrounding region exhibited notable shifts in the timing of the growing season. SOS was generally delayed: the delay for EVI, NDVI, GNDVI, RECI, and MSAVI were 3.7 ± 1.1 days, 6.2 ± 1.9 days, 7.1 ± 2.3 days, 3.2 ± 0.9 days, and 1.3 ± 0.2 days, respectively. Conversely, EOS exhibited a shortening trend, with reductions of 2.4 ± 1.5 days (EVI), 3.8 ± 1.1 days (NDVI), 2.5 ± 1.9 days (GNDVI), 2.2 ± 1.4 days (RECI), and 1.6 ± 0.7 days (MSAVI). Notably, MSAVI exhibited the smallest variation in both SOS delay and EOS advance, with standard deviations of ±0.2 days and ±0.7 days, respectively, indicating that, compared to other indices, MSAVI has greater diagnostic power for capturing mining-induced phenological changes. These findings are consistent with Sun et al. reinforcing the conclusion that SOS is more sensitive to environmental stress than EOS [39]. Moreover, MSAVI, owing to its strong resistance to soil-background noise, demonstrates greater utility for monitoring the impacts of mining on vegetation phenology.
Using SOS extracted from MSAVI as the primary indicator, affected and unaffected areas were further analyzed to evaluate the directional impacts of mining activities on vegetation. The affected zones were distributed around the mining area, with a total impacted vegetation area of 28.43 km2—approximately four times the size of the mining footprint. Regarding phenological shifts, SOS was delayed by approximately 10 days and 9 days in the two identified affected subregions, whereas EOS was postponed by 6 days in both cases. Correspondingly, LOS was shortened by approximately 10 days and 8 days. These results indicate a significant phenological response of vegetation to mining activities.

4.3. Sensitivity Analysis of Vegetation Indices to Mining Activities

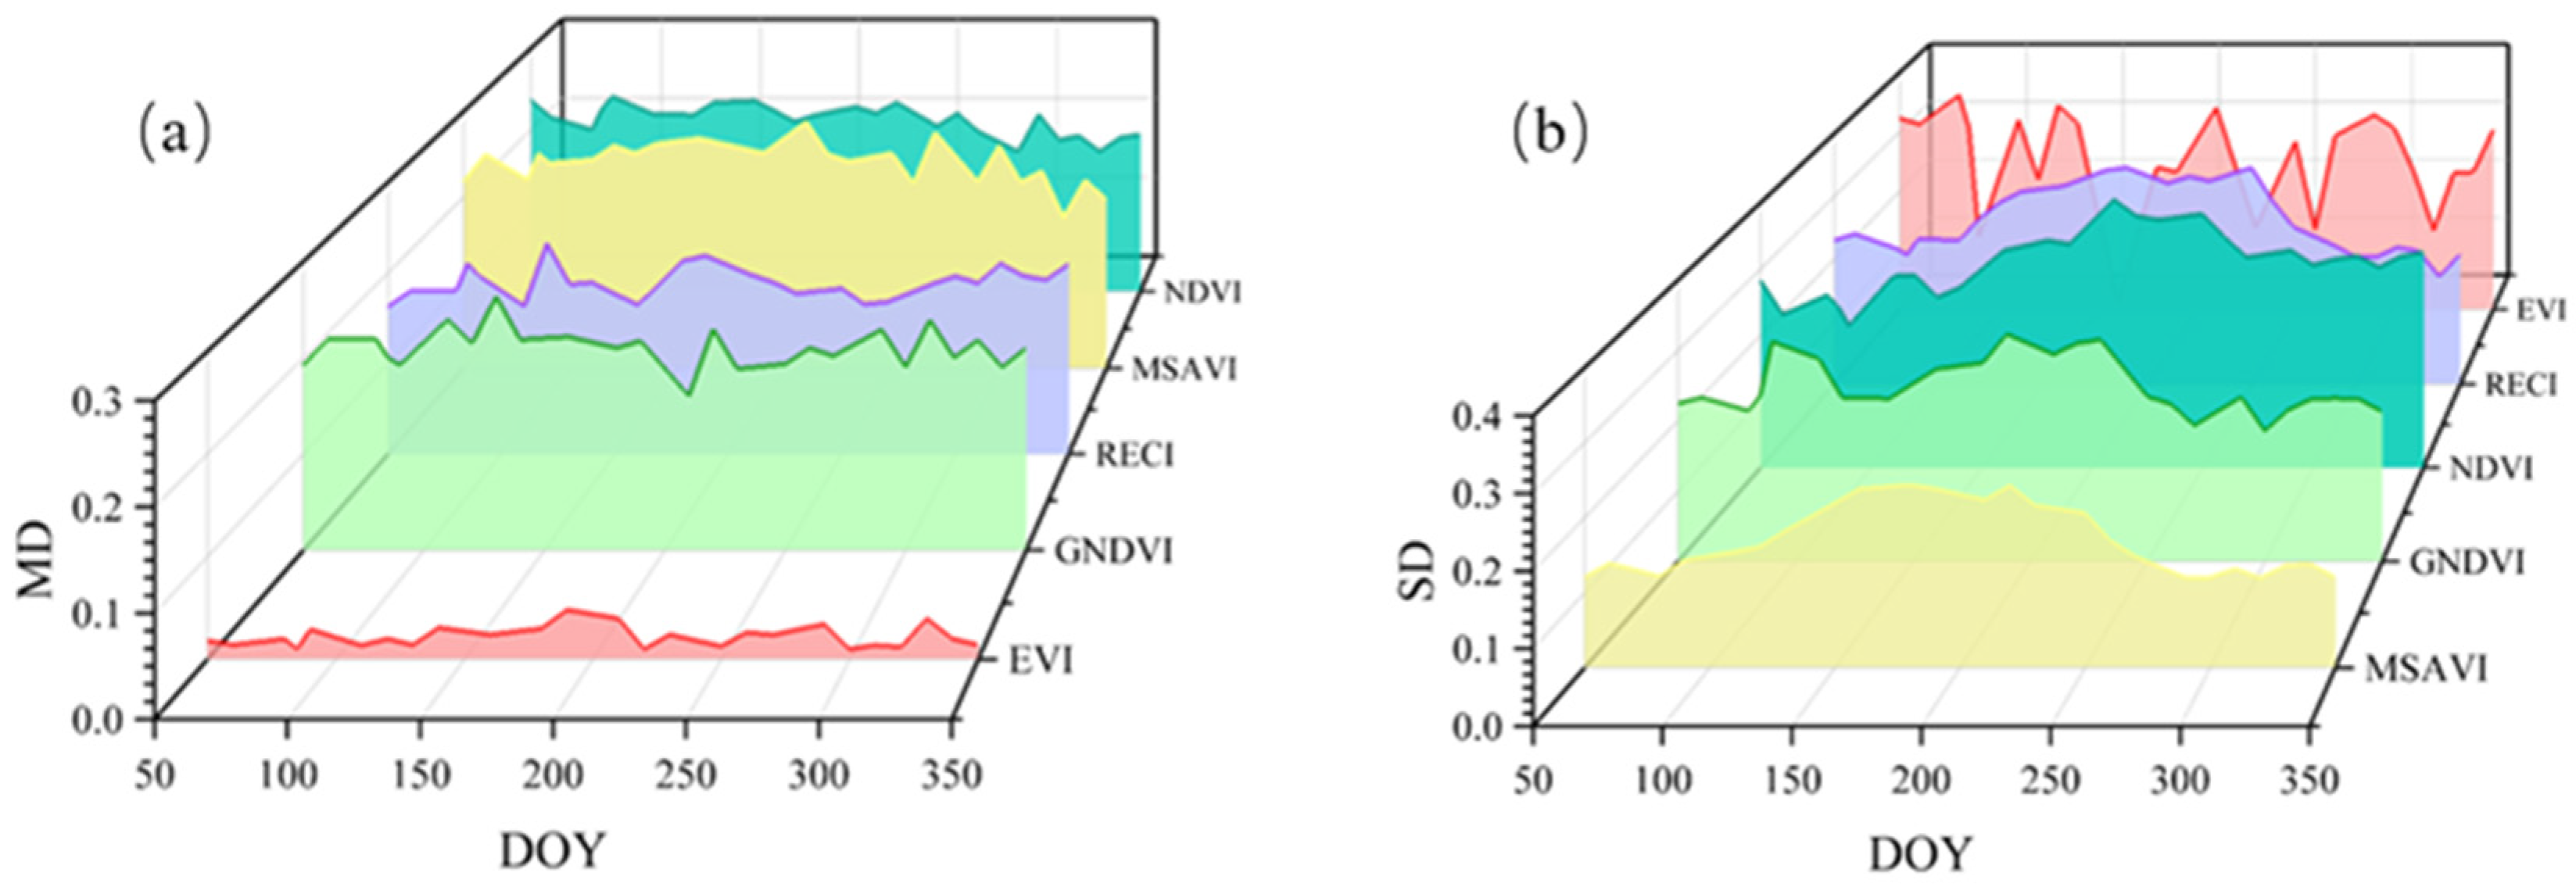
Given the vegetation dynamics in the study area, we evaluated the sensitivity of each VI to mining activities by analyzing their values over the annual cycle. The key evaluation metrics include the Mean Difference (MD) and SD (Figure 7). MD quantifies the difference between affected and unaffected regions and thus reflects each VI’s sensitivity to mining disturbances, whereas SD measures the temporal stability of each VI under mining influence. A higher MD indicates greater sensitivity to mining impacts, whereas a lower SD indicates greater consistency in the VI response. Notably, SD exhibited pronounced seasonal variability, with the most substantial differences between affected and unaffected areas occurring during the summer months.
Based on annual average values of MD, the sensitivity ranking of the VIs is as follows: GNDVI (0.241) > MSAVI (0.236) > NDVI (0.212) > RECI (0.190) > EVI (0.022). This ranking indicates that GNDVI has the highest MD and is therefore the most sensitive index to mining activities among those examined. In terms of stability within the affected regions, MSAVI demonstrated the lowest SD (0.167), indicating a high degree of consistency over time. RECI (0.261) and GNDVI (0.248) also exhibited relatively stable responses. For the remaining indices, SD values ranged from 0.252 to 0.311, with EVI (0.252) and NDVI (0.311) at the lower and upper ends of this range, respectively.

4.4. The Effect of Soil Moisture Content on Vegetation Phenology

In semi-arid regions, delayed ecosystem responses are primarily driven by processes such as water infiltration and retention, hormonal signal transduction and phenological regulation, fine root growth and its feedbacks with water and nutrient uptake, as well as microbial activity and potential changes in community structure [48,49,50]. These processes play a critical role in modulating SWC under water-limited conditions, providing plants with temporal buffers to adapt to fluctuations in water availability [51]. In the study area, mining may indirectly affect phenological development by altering surface conditions and soil structure, thereby influencing soil moisture dynamics. Although direct groundwater measurements and hydrological field investigations are unavailable for this region, previous studies in comparable mining environments report that such operations increase surface runoff and evaporation, leading to reductions in soil moisture and heightened vegetation stress [52,53,54]. We focused on analyzing the relationship between soil moisture and vegetation phenology extracted from the MSAVI and on exploring the potential regulatory role of SWC in phenological dynamics.
Sampling points were established around the mining area to extract both vegetation phenology metrics and corresponding SWC data. A correlation analysis was performed and is presented in Figure 8. The results demonstrate that SWC decreases with proximity to the mining area, indicating that mining activity directly reduces local soil-moisture availability. Furthermore, increases in SWC are associated with earlier SOS, delayed EOS, and a tendency toward shorter LOS. A strong negative correlation was observed between SOS and SWC, indicating that lower soil moisture is associated with a delayed onset of the growing season. In contrast, the correlation between LOS and SWC was not statistically significant. This phenomenon can be attributed to groundwater depletion caused by mining operations, which exacerbates water scarcity in semi-arid ecosystems and subsequently affects vegetation growth, spatial distribution, and successional dynamics.

5. Discussion

5.1. Analysis of Sensitivity Differences in Vegetation Indexes Under Mining Activities

As key indicators of vegetation cover and physiological status, VIs are highly valuable for surface ecological monitoring in disturbed mining areas [55]. Owing to differences in band selection, calculation methods and sensitivity to background noise, the effectiveness of different VIs in identifying mining disturbances can result in considerable variation [56]. Given the high heterogeneity and multiple disturbances in semi-arid mining environments [57], systematically analyzing the response characteristics of different VIs is crucial for understanding disturbance mechanisms and optimizing monitoring strategies. Nevertheless, studies on the sensitivity of VIs to mining activities remain scarce. In this study, the standard deviation of VI values consistently remained higher in affected regions than in unaffected regions. The contrast in VI values between disturbed and undisturbed areas highlights disparities in vegetation nutrition and physiological status within disturbed zones. From October to March, the vegetation indices exhibited no discernible difference between affected and unaffected regions due to vegetation dormancy. The period from June to September is characterized by vigorous vegetation growth and development. SD values were consistently and markedly elevated in affected regions throughout the entire phase. This phenomenon may be attributed to vegetation undergoing vigorous growth often exhibiting a muted response to mild pollution [58]. However, this characteristic response may inadvertently lead to underestimation of the true impact of mining activities on vegetation phenology. Notably, MD values exhibit annual minima between March and May (Figure 7a), indicating this period as a reliable window for identifying affected regions. Compared with mature vegetation, seedlings exhibit heightened metabolic responses, often amplifying the effects of soil contamination [59].
Research findings indicate that GNDVI and MSAVI perform well in distinguishing differences in vegetation growth conditions between affected and unaffected regions within the study region. MSAVI reflects the overall spectral stability of vegetation in impacted zones (SD = 0.213). Notably, Bashir et al. reached similar conclusions in their study evaluating VIs for characterizing oil pollution impacts on vegetation [60]. The transport of salts and heavy metals from mining waste into surrounding soils via runoff or seepage [61] leads to soil salinization or heavy metal contamination, thereby disrupting the physiological processes of vegetation in affected regions [62]. Under drought stress, vegetation biomass also diminishes significantly [63]. It is noteworthy that GNDVI typically exhibits higher sensitivity to chlorophyll content variations compared to others [64]. Moreover, in semi-arid regions, soil becomes the primary factor influencing remote sensing reflectance values. Under such conditions, MSAVI exhibits lower sensitivity to soil background contributions and outperforms other VIs. These factors further support the greater efficacy of GNDVI and MSAVI in delineating affected regions. Contrary to EVI’s established application in monitoring mine-area vegetation, we found EVI to exhibit significant shortcomings with respect to MD and SD. Consequently, EVI struggles to effectively delineate the extent of mining impacts on vegetation in the study area. Although EVI accounts for soil and atmospheric influences, it remains sensitive primarily to medium-to-high vegetation density and is relatively insensitive to low-density vegetation [65]. Furthermore, the incorporation of aerosol impedance coefficients and canopy background adjustment factors reduces EVI’s dynamic range in sparsely vegetated areas, thereby limiting its applicability in such regions [66]. In summary, the tendency towards sparse vegetation in semi-arid regions, combined with mining impacts, results in significant surface vegetation heterogeneity. Therefore, the selection of an appropriate VI is critical for accurately monitoring vegetation dynamics in mining areas using remote sensing technology.

5.2. Analysis of Phenological Variations in Mining Areas and Influencing Factors

Compared with unaffected regions, our study reveals a significant delay in seasonal vegetation development surrounding mining zones. This finding aligns with prior studies in semi-arid regions that likewise report comparable delays in vegetation development [67,68,69,70]. For instance, Luo et al. investigated the impact of soil moisture dynamics on vegetation phenology in the Mongolian Plateau [71]. The study linked higher autumn soil moisture to a delayed EOS, proposing that sufficient moisture suppresses senescence-promoting hormones such as gibberellin, which in turn postpones dormancy onset.
The study focuses on the impact of mining activities on soil moisture dynamics, identifying soil moisture as a key factor explaining phenological changes. Through synchronous analysis of sampling points, we observed decreasing soil moisture content with proximity to mining areas (Figure 8), providing direct evidence of mining’s detrimental effect on regional soil moisture supply. Furthermore, correlation analyses indicate that increased SWC is associated with an earlier onset of SOS and a delayed EOS. SOS exhibits a significant negative correlation with SWC, suggesting that adequate soil water can mitigate spring drought stress and support plant physiological activity [72]. In-depth analysis reveals that mining activities significantly alter regional soil moisture dynamics via combined complex physical and hydrogeological mechanisms. These impacts are primarily manifested in the following aspects:
(1)
Following large-scale coal extraction, the overlying strata undergo displacement, bending and deformation due to loss of support, ultimately forming subsidence basins and tensile fissures at the surface. Surface subsidence and fissures constitute the primary physical pathways for soil moisture loss [73]. Compared to undisturbed areas, subsidence zones exhibit significantly reduced soil bulk density and markedly increased porosity [74]. This alteration in soil physical structure substantially diminishes its water-holding capacity. Furthermore, by providing rapid pathways for surface water and precipitation, the vertical extension of surface fissures reduces surface runoff and effective infiltration, thereby intensifying water evaporation from the increased soil surface area. This physical water loss directly causes a sharp decline in surface soil moisture content, imposing severe water stress on vegetation [75].
(2)
Beyond direct surface impacts, large-scale underground mining has caused fundamental disruption to regional hydrogeological systems. Mining activities have compromised the integrity of aquifer systems, particularly shallow alluvial aquifers, leading to reduced aquifer pressure and hydrogeophysical leakage [76]. These alterations to the hydrogeological structure have altered groundwater flow pathways and may disrupt groundwater recharge sources. The substantial decline in groundwater levels induced by mining constitutes a key factor in vegetation water scarcity within semi-arid regions [77]. As native vegetation in these areas relies heavily on groundwater for survival, falling water tables directly sever deep-water supply sources to vegetation, triggering cascading effects on growth, spatial distribution and community succession processes. Case studies from other regions globally corroborate this perspective. For instance, mining-induced droughts have led to substantial reductions in groundwater reserves surrounding mining areas, resulting in a marked decline in vegetation community indicators [78,79,80].
(3)
In addition to alterations in physical structure and hydrological conditions, mining activities may induce changes in the physicochemical properties of surface soils [81], thereby further exacerbating vegetation stress. Although the physicochemical characteristics of surface soils vary across different subsidence areas, these alterations may indirectly affect vegetation growth by influencing soil nutrient availability and ionic equilibrium [82,83,84]. For instance, salts and heavy metals from mining waste may enter surrounding soils via runoff or seepage, leading to soil salinization or excessive heavy metal concentrations, thereby exerting toxic effects on vegetation physiology [85]. However, systematic research examining the interplay between different coal-mine subsidence patterns and soil physicochemical properties remains scarce and fragmented, highlighting topics that require further investigation in future studies.

5.3. Limitations and Future Work

This study employs a phenological perspective to rigorously analyze the extent and severity of disturbances to surrounding vegetation caused by mining operations in semi-arid regions. However, certain limitations remain: (1) The research unit is broadly defined broadly at the grassland-phenology scale, yet different grassland vegetation types may exhibit inconsistent phenological responses to mining disturbance. This simplification risks obscuring variations in ecological processes arising from community differences. Future work should integrate UAV imagery with field surveys to generate higher-resolution grassland classification products, enabling more detailed characterization of vegetation phenological dynamics. (2) The proposed methodology is primarily designed to identify disturbance ranges within individual mining areas but exhibits limitations in complex environments. When study areas concurrently experience other anthropogenic activities, such as urban development or adjacent mining operations, vegetation phenological indicators are subject to superimposed interference. This induces oscillatory modeling sequences, thereby leading to underestimation of actual disturbance distances. Developing mining disturbance identification models that are adaptable to complex scenarios represents a key direction for future research. (3) This study does not incorporate field validation of the mapped disturbance boundaries nor soil moisture measurements. Future research will address these limitations through targeted ground-truthing campaigns and the installation of soil moisture loggers. These efforts aim to verify impact boundaries and refine uncertainty assessments.

6. Conclusions

We proposed and validated a quantitative framework to characterize the extent and intensity of mining-induced disturbances to LSP in semi-arid environments and tested the sensitivity and stability of commonly used VIs. The application of this framework to the Yimin mining area integrates directional phenological gradients and the identification of curvature breakpoints, creating a transparent and reproducible mining-disturbance mapping process. The study found that the vegetation area affected by mining activities is approximately four times larger than the area covered by the mining site. Seasonal vegetation development in the affected areas is significantly delayed compared to unaffected areas, with the onset of SOS delayed by approximately 10 days. These observations are logically explained by changes in VI responses and SWC. Among VIs, GNDVI is most sensitive to mining disturbances, while MSAVI is most stable under conditions of sparse canopy and soil background. EVI is less effective in delineating the impact boundary of open canopies. Furthermore, the spatial distribution of SWC reveals a clear decreasing trend in water content around the mining area. This trend, along with the coordinated changes in phenological timing, supports an impact pathway centered on water stress, whereby the decline in groundwater levels and surface cracks jointly lead to a reduction in near-surface water storage, thereby delaying the greening and senescence rhythms of vegetation. In summary, our findings provide practical guidance for delineating ecological restoration zones, assessing environmental risks and supporting land management decisions. They also offer insights into identifying the extent and severity of disturbances to surrounding vegetation caused by mining activities.

Author Contributions

Y.Z.: writing—review and editing, funding acquisition, conceptualization. S.R.: conceptualization, methodology, data curation: application of statistical, mathematical, computational, or other formal techniques to analyze or synthesize study data, visualization, writing—original draft preparation. Y.T.: writing—review and editing. All authors have read and agreed to the published version of the manuscript.

Funding

This study was supported by the financial support from the National Natural Science Foundation of China [Grant No. 420701250].

Data Availability Statement

Data will be made available on request.

Conflicts of Interest

The authors declare no conflicts of interest.

References

  1. Florea, S. ‘The Green, Green Grass of Home’; an Eco Linguistic Analysis of the Environmental Responsibility Urban Discourse of Europe’s Most Polluted Cities. J. Environ. Manag. 2025, 392, 126718. [Google Scholar] [CrossRef]
  2. Abuodha, J.O.Z.; Hayombe, P.O. Protracted Environmental Issues on a Proposed Titanium Minerals Development in Kenya’s South Coast. Mar. Georesources Geotechnol. 2006, 24, 63–75. [Google Scholar] [CrossRef]
  3. Mundaca, G. Economic Valuation of Environmental and Health Impacts from Mining: The Case of Peru. Environ. Dev Sustain 2022, 26, 2415–2441. [Google Scholar] [CrossRef]
  4. Statistical Review of World Energy 2022. Available online: https://www.bp.com/en/global/corporate/energy-economics/statistical-review-of-world-energy.html (accessed on 19 September 2025).
  5. Mhaske, S.N.; Pathak, K.; Dash, S.S.; Nayak, D.B. Assessment and Management of Soil Erosion in the Hilltop Mining Dominated Catchment Using GIS Integrated RUSLE Model. J. Environ. Manag. 2021, 294, 112987. [Google Scholar] [CrossRef] [PubMed]
  6. Saedpanah, S.; Amanollahi, J. Environmental Pollution and Geo-Ecological Risk Assessment of the Qhorveh Mining Area in Western Iran. Environ. Pollut. 2019, 253, 811–820. [Google Scholar] [CrossRef] [PubMed]
  7. Shen, Z.; Zhang, Q.; Chen, D.; Singh, V.P. Varying Effects of Mining Development on Ecological Conditions and Groundwater Storage in Dry Region in Inner Mongolia of China. J. Hydrol. 2021, 597, 125759. [Google Scholar] [CrossRef]
  8. Owusu, E.H.; Ofori, B.Y.; Attuquayefio, D.K. The Secondary Impact of Mining on Primates and Other Medium to Large Mammals in Forest Reserves in Southwestern Ghana. Extr. Ind. Soc. 2018, 5, 114–121. [Google Scholar] [CrossRef]
  9. Huang, H.; Zheng, X.; Tao, S.; Ma, S.; Feng, S.; Li, Y.; Liang, K.; Li, G.; Lei, J.; Liu, H.; et al. Adaptive Mechanisms of Moss (Campylopus Schmidii) to Cr(Ⅵ) Stress in Pyrite-Mining Polluted Ecosystems: Integrating Biochemical, Structural, and Molecular Perspectives. Environ. Pollut. 2025, 382, 126708. [Google Scholar] [CrossRef]
  10. Feng, H.; Zhou, J.; Zhou, A.; Su, D.; Han, X.; Xiong, R. Co-Evolution Mechanism of Grassland Degradation and Its Belowground Habitat under the Influence of Coal Mining Activities. Catena 2024, 241, 107997. [Google Scholar] [CrossRef]
  11. Zhao, D.; Wang, Z.; Wu, X.; Qiu, T. Response of Vegetation Dynamics in Environmentally Sensitive and Fragile Areas to Natural and Anthropogenic Factors: A Case Study in Inner Mongolia Autonomous Region, China. Anthropocene 2023, 44, 100414. [Google Scholar] [CrossRef]
  12. Song, D.; Hu, Z.; Zeng, J.; Sun, H. Influence of Mining on Vegetation in Semi-Arid Areas of Western China Based on the Coupling of above Ground and below Ground—A Case Study of Daliuta Coalfield. Ecol. Indic. 2024, 161, 111964. [Google Scholar] [CrossRef]
  13. Ren, H.; Zhao, Y.; Xiao, W.; Zhang, L. Unmanned Aerial Vehicle (UAV)-Based Vegetation Restoration Monitoring in Coal Waste Dumps after Reclamation. Remote Sens. 2024, 16, 881. [Google Scholar] [CrossRef]
  14. Lee, B.R.; Ibáñez, I. Spring Phenological Escape Is Critical for the Survival of Temperate Tree Seedlings. Funct. Ecol. 2021, 35, 1848–1861. [Google Scholar] [CrossRef]
  15. Lu, Q.; Zhao, D.; Wu, S.; Dai, E.; Gao, J. Using the NDVI to Analyze Trends and Stability of Grassland Vegetation Cover in Inner Mongolia. Theor. Appl. Climatol. 2019, 135, 1629–1640. [Google Scholar] [CrossRef]
  16. Zhou, Y.; Liu, F.; Zhang, G.; Wang, J. Response of the Normalized Difference Vegetation Index (NDVI) to Snow Cover Changes on the Qinghai–Tibet Plateau. Remote Sens. 2024, 16, 2140. [Google Scholar] [CrossRef]
  17. Bounouh, O.; Essid, H.; Tarquis, A.M.; Farah, I.R. Phenology as Accuracy Metrics for Vegetation Index Forecasting over Tunisian Forest and Cereal Cover Types. Int. J. Remote Sens. 2021, 42, 4644–4671. [Google Scholar] [CrossRef]
  18. Anees, S.A.; Mehmood, K.; Rehman, A.; Rehman, N.U.; Muhammad, S.; Shahzad, F.; Hussain, K.; Luo, M.; Alarfaj, A.A.; Alharbi, S.A.; et al. Unveiling Fractional Vegetation Cover Dynamics: A Spatiotemporal Analysis Using MODIS NDVI and Machine Learning. Environ. Sustain. Indic. 2024, 24, 100485. [Google Scholar] [CrossRef]
  19. Sidi Almouctar, M.A.; Wu, Y.; Kumar, A.; Zhao, F.; Mambu, K.J.; Sadek, M. Spatiotemporal Analysis of Vegetation Cover Changes around Surface Water Based on NDVI: A Case Study in Korama Basin, Southern Zinder, Niger. Appl. Water Sci. 2021, 11, 4. [Google Scholar] [CrossRef]
  20. Xu, Z.; Li, Y.; Li, B.; Hao, Z.; Lin, L.; Hu, X.; Zhou, X.; Yu, H.; Xiang, S.; Pascal, M.-L.-F.; et al. A Comparative Study on the Applicability and Effectiveness of NSVI and NDVI for Estimating Fractional Vegetation Cover Based on Multi-Source Remote Sensing Image. Geocarto Int. 2023, 38, 2184501. [Google Scholar] [CrossRef]
  21. Zheng, K.; Wei, J.-Z.; Pei, J.-Y.; Cheng, H.; Zhang, X.-L.; Huang, F.-Q.; Li, F.-M.; Ye, J.-S. Impacts of Climate Change and Human Activities on Grassland Vegetation Variation in the Chinese Loess Plateau. Sci. Total Environ. 2019, 660, 236–244. [Google Scholar] [CrossRef]
  22. Senf, C.; Pflugmacher, D.; Heurich, M.; Krueger, T. A Bayesian Hierarchical Model for Estimating Spatial and Temporal Variation in Vegetation Phenology from Landsat Time Series. Remote Sens. Environ. 2017, 194, 155–160. [Google Scholar] [CrossRef]
  23. Gao, F.; Hilker, T.; Zhu, X.; Anderson, M.; Masek, J.; Wang, P.; Yang, Y. Fusing Landsat and MODIS Data for Vegetation Monitoring. IEEE Geosci. Remote Sens. Mag. 2015, 3, 47–60. [Google Scholar] [CrossRef]
  24. Zhao, W.; Qu, Y.; Chen, J.; Yuan, Z. Deeply Synergistic Optical and SAR Time Series for Crop Dynamic Monitoring. Remote Sens. Environ. 2020, 247, 111952. [Google Scholar] [CrossRef]
  25. Ju, J.; Zhou, Q.; Freitag, B.; Roy, D.P.; Zhang, H.K.; Sridhar, M.; Mandel, J.; Arab, S.; Schmidt, G.; Crawford, C.J.; et al. The Harmonized Landsat and Sentinel-2 Version 2.0 Surface Reflectance Dataset. Remote Sens. Environ. 2025, 324, 114723. [Google Scholar] [CrossRef]
  26. Bao, G. Mongolian Pines (Pinus Sylvestris Var. Mongolica) in the Hulun Buir Steppe, China, Respond to Climate in Adjustment to the Local Water Supply. Int. J. Biometeorol. 2015, 59, 1–10. [Google Scholar] [CrossRef] [PubMed]
  27. Wang, S.; Huang, J.; Yu, H.; Ji, C. Recognition of Landscape Key Areas in a Coal Mine Area of a Semi-Arid Steppe in China: A Case Study of Yimin Open-Pit Coal Mine. Sustainability 2020, 12, 2239. [Google Scholar] [CrossRef]
  28. Zhang, C.; Zhang, Y.; Li, J. Grassland Productivity Response to Climate Change in the Hulunbuir Steppes of China. Sustainability 2019, 11, 6760. [Google Scholar] [CrossRef]
  29. Fensholt, R.; Sandholt, I.; Stisen, S. Evaluating MODIS, MERIS, and VEGETATION Vegetation Indices Using in Situ Measurements in a Semiarid Environment. IEEE Trans. Geosci. Remote Sens. 2006, 44, 1774–1786. [Google Scholar] [CrossRef]
  30. Da Silva, P.C.; Ribeiro Junior, W.Q.; Ramos, M.L.G.; Lopes, M.F.; Santana, C.C.; Casari, R.A.D.C.N.; Brasileiro, L.D.O.; Veiga, A.D.; Rocha, O.C.; Malaquias, J.V.; et al. Multispectral Images for Drought Stress Evaluation of Arabica Coffee Genotypes Under Different Irrigation Regimes. Sensors 2024, 24, 7271. [Google Scholar] [CrossRef]
  31. Gitelson, A.A.; Gritz †, Y.; Merzlyak, M.N. Relationships between Leaf Chlorophyll Content and Spectral Reflectance and Algorithms for Non-Destructive Chlorophyll Assessment in Higher Plant Leaves. J. Plant Physiol. 2003, 160, 271–282. [Google Scholar] [CrossRef]
  32. Qi, J.; Chehbouni, A.; Huete, A.R.; Kerr, Y.H.; Sorooshian, S. A Modified Soil Adjusted Vegetation Index. Remote Sens. Environ. 1994, 48, 119–126. [Google Scholar] [CrossRef]
  33. Meneses-Tovar, C.L. NDVI as Indicator of Degradation. Unasylva 2011, 62, 39–46. [Google Scholar]
  34. Chen, J.; Jönsson, P.; Tamura, M.; Gu, Z.; Matsushita, B.; Eklundh, L. A Simple Method for Reconstructing a High-Quality NDVI Time-Series Data Set Based on the Savitzky–Golay Filter. Remote Sens. Environ. 2004, 91, 332–344. [Google Scholar] [CrossRef]
  35. Yang, Y.; Luo, J.; Huang, Q.; Wu, W.; Sun, Y. Weighted Double-Logistic Function Fitting Method for Reconstructing the High-Quality Sentinel-2 NDVI Time Series Data Set. Remote Sens. 2019, 11, 2342. [Google Scholar] [CrossRef]
  36. Hui, C. Remote Sensing Image Denoising Algorithm Based on Asymmetric Gaussian Mixture Model. AAM 2024, 13, 4975–4989. [Google Scholar] [CrossRef]
  37. Miglani, A.; Ray, S.S.; Vashishta, D.P.; Parihar, J.S. Comparison of Two Data Smoothing Techniques for Vegetation Spectra Derived From EO-1 Hyperion. J. Indian Soc. Remote Sens. 2011, 39, 443–453. [Google Scholar] [CrossRef]
  38. Yu, L.; Liu, T.; Bu, K.; Yan, F.; Yang, J.; Chang, L.; Zhang, S. Monitoring the Long Term Vegetation Phenology Change in Northeast China from 1982 to 2015. Sci. Rep. 2017, 7, 14770. [Google Scholar] [CrossRef]
  39. Jonsson, P.; Eklundh, L. Seasonality Extraction by Function Fitting to Time-Series of Satellite Sensor Data. IEEE Trans. Geosci. Remote Sens. 2002, 40, 1824–1832. [Google Scholar] [CrossRef]
  40. Cheng, W.-C.; Chang, J.-C.; Chang, C.-P.; Su, Y.; Tu, T.-M. A Fixed-Threshold Approach to Generate High-Resolution Vegetation Maps for IKONOS Imagery. Sensors 2008, 8, 4308–4317. [Google Scholar] [CrossRef]
  41. White, M.A.; Nemani, R.R. Real-Time Monitoring and Short-Term Forecasting of Land Surface Phenology. Remote Sens. Environ. 2006, 104, 43–49. [Google Scholar] [CrossRef]
  42. Xiong, T.; Du, S.; Zhang, X.; Zhang, H.; Zhao, J. An Increasing Delay in Vegetation Spring Phenology over Northern Snow-Covered Landmass Driven by Temperature and Snowmelt. Agric. For. Meteorol. 2025, 361, 110310. [Google Scholar] [CrossRef]
  43. Hou, X.; Gao, S.; Niu, Z.; Xu, Z. Extracting Grassland Vegetation Phenology in North China Based on Cumulative SPOT-VEGETATION NDVI Data. Int. J. Remote Sens. 2014, 35, 3316–3330. [Google Scholar] [CrossRef]
  44. Ivits, E.; Cherlet, M.; Tóth, G.; Sommer, S.; Mehl, W.; Vogt, J.; Micale, F. Combining Satellite Derived Phenology with Climate Data for Climate Change Impact Assessment. Glob. Planet. Chang. 2012, 88–89, 85–97. [Google Scholar] [CrossRef]
  45. Behrenfeld, M.J. Abandoning Sverdrup’s Critical Depth Hypothesis on Phytoplankton Blooms. Ecology 2010, 91, 977–989. [Google Scholar] [CrossRef] [PubMed]
  46. Sun, X.; Yuan, L.; Liu, M.; Liang, S.; Li, D.; Liu, L. Quantitative Estimation for the Impact of Mining Activities on Vegetation Phenology and Identifying Its Controlling Factors from Sentinel-2 Time Series. Int. J. Appl. Earth Obs. Geoinf. 2022, 111, 102814. [Google Scholar] [CrossRef]
  47. Zhang, B.; Tan, X.; Wang, S.; Chen, M.; Chen, S.; Ren, T.; Xia, J.; Bai, Y.; Huang, J.; Han, X. Asymmetric Sensitivity of Ecosystem Carbon and Water Processes in Response to Precipitation Change in a Semi-arid Steppe. Funct. Ecol. 2017, 31, 1301–1311. [Google Scholar] [CrossRef]
  48. Gross, N.; Robson, T.M.; Lavorel, S.; Albert, C.; Le Bagousse-Pinguet, Y.; Guillemin, R. Plant Response Traits Mediate the Effects of Subalpine Grasslands on Soil Moisture. New Phytol. 2008, 180, 652–662. [Google Scholar] [CrossRef]
  49. D’Odorico, P.; Caylor, K.; Okin, G.S.; Scanlon, T.M. On Soil Moisture–Vegetation Feedbacks and Their Possible Effects on the Dynamics of Dryland Ecosystems. J. Geophys. Res. 2007, 112, 2006JG000379. [Google Scholar] [CrossRef]
  50. Xia, Y.Q.; Shao, M.A. Soil Water Carrying Capacity for Vegetation: A Hydrologic and Biogeochemical Process Model Solution. Ecol. Model. 2008, 214, 112–124. [Google Scholar] [CrossRef]
  51. Ma, T.; Tang, F.; Tang, J.; Wang, F.; Li, P.; Yang, Q.; Wang, S.; Jia, X. Effect of Coal Mining on Soil Moisture in the Semi-Arid Area Based on an Improved Remote Sensing Estimation Approach. Env. Earth Sci. 2023, 82, 545. [Google Scholar] [CrossRef]
  52. Zhang, K.; Yang, K.; Wu, X.; Bai, L.; Zhao, J.; Zheng, X. Effects of Underground Coal Mining on Soil Spatial Water Content Distribution and Plant Growth Type in Northwest China. ACS Omega 2022, 7, 18688–18698. [Google Scholar] [CrossRef] [PubMed]
  53. Zhang, K.; Chen, M.; Feng, S.; Chen, X.; Yan, Z. Effects of Coal Mining Disturbance on Spatial and Temporal Distribution of Soil Water Content in Northwest China-based on 3D EBK Model. Hydrol. Process. 2024, 38, e15277. [Google Scholar] [CrossRef]
  54. Qian, D.; Yan, C.; Xiu, L.; Feng, K. The Impact of Mining Changes on Surrounding Lands and Ecosystem Service Value in the Southern Slope of Qilian Mountains. Ecol. Complex. 2018, 36, 138–148. [Google Scholar] [CrossRef]
  55. Xie, L.; Wu, W.; Huang, X.; Ou, P.; Lin, Z.; Zhiling, W.; Song, Y.; Lang, T.; Huangfu, W.; Zhang, Y.; et al. Mining and Restoration Monitoring of Rare Earth Element (REE) Exploitation by New Remote Sensing Indicators in Southern Jiangxi, China. Remote Sens. 2020, 12, 3558. [Google Scholar] [CrossRef]
  56. Vorovencii, I. Changes Detected in the Extent of Surface Mining and Reclamation Using Multitemporal Landsat Imagery: A Case Study of Jiu Valley, Romania. Environ. Monit. Assess. 2021, 193, 30. [Google Scholar] [CrossRef]
  57. Wang, X.; Xu, Z.; Li, Z.; Pan, D.; Li, H. Integrated Multiple Tracer-Based Tomographic Inversion and Heterogeneity Characterization of Karst Limestone Mining Regions in Southwest China. Int. J. Rock Mech. Min. Sci. 2024, 175, 105670. [Google Scholar] [CrossRef]
  58. Antoniadis, V.; Levizou, E.; Shaheen, S.M.; Ok, Y.S.; Sebastian, A.; Baum, C.; Prasad, M.N.V.; Wenzel, W.W.; Rinklebe, J. Trace Elements in the Soil-Plant Interface: Phytoavailability, Translocation, and Phytoremediation–A Review. Earth-Sci. Rev. 2017, 171, 621–645. [Google Scholar] [CrossRef]
  59. Shtangeeva, I.; Niemelä, M.; Perämäki, P.; Popov, A.; Vesavaara, I.; Suvela, R. Response of Wheat and Barley Seedlings on Soil Contamination with Bromides. Environ. Geochem. Health 2022, 44, 537–550. [Google Scholar] [CrossRef]
  60. Adamu, B.; Tansey, K.; Ogutu, B. An Investigation into the Factors Influencing the Detectability of Oil Spills Using Spectral Indices in an Oil-Polluted Environment. Int. J. Remote Sens. 2016, 37, 2338–2357. [Google Scholar] [CrossRef]
  61. Sun, Z.; Xie, X.; Wang, P.; Hu, Y.; Cheng, H. Heavy Metal Pollution Caused by Small-Scale Metal Ore Mining Activities: A Case Study from a Polymetallic Mine in South China. Sci. Total Environ. 2018, 639, 217–227. [Google Scholar] [CrossRef]
  62. Chintapenta, L.K.; Ommanney, K.I.; Ozbay, G. Presence and Plant Uptake of Heavy Metals in Tidal Marsh Wetland Soils. Front. Public Health 2022, 10, 821892. [Google Scholar] [CrossRef]
  63. Du, N.; Guo, W.; Zhang, X.; Wang, R. Morphological and Physiological Responses of Vitex Negundo L. Var. Heterophylla (Franch.) Rehd. to Drought Stress. Acta Physiol. Plant. 2010, 32, 839–848. [Google Scholar] [CrossRef]
  64. Li, M.; Wang, W.; Li, H.; Yang, Z.; Li, J. Monitoring of Vegetation Chlorophyll Content in Photovoltaic Areas Using UAV-Mounted Multispectral Imaging. Front. Plant Sci. 2025, 16, 1643945. [Google Scholar] [CrossRef]
  65. Qiu, B.; Zeng, C.; Tang, Z.; Chen, C. Characterizing Spatiotemporal Non-Stationarity in Vegetation Dynamics in China Using MODIS EVI Dataset. Environ. Monit. Assess. 2013, 185, 9019–9035. [Google Scholar] [CrossRef] [PubMed]
  66. Laneve, G.; Castronuovo, M.M. Comparison between Vegetation Change Analysis in Kenya Based on AVHRR and SeaWiFS Images. Int. J. Remote Sens. 2005, 26, 2549–2559. [Google Scholar] [CrossRef]
  67. Guo, G.; Wang, J.; Zhao, S.; Zhang, C. Interactions of Cross-Diffusion and Nonlocal Delay Induce Spatial Vegetation Patterning in Semi-Arid Environments. Nonlinear Dyn. 2024, 112, 11615–11636. [Google Scholar] [CrossRef]
  68. Luo, H.; Dai, S.; Li, M.; Liu, E.; Li, Y.; Xie, Z. NDVI-Based Analysis of the Influence of Climate Changes and Human Activities on Vegetation Variation on Hainan Island. J. Indian Soc. Remote Sens. 2021, 49, 1755–1767. [Google Scholar] [CrossRef]
  69. Kang, W.; Wang, T.; Liu, S. The Response of Vegetation Phenology and Productivity to Drought in Semi-Arid Regions of Northern China. Remote Sens. 2018, 10, 727. [Google Scholar] [CrossRef]
  70. Wang, C.; Wang, H.; Yuan, S. Precipitation Governing Vegetation Patterns in an Arid or Semi-Arid Environment. J. Math. Biol. 2023, 87, 22. [Google Scholar] [CrossRef]
  71. Luo, M.; Meng, F.; Sa, C.; Duan, Y.; Bao, Y.; Liu, T.; De Maeyer, P. Response of Vegetation Phenology to Soil Moisture Dynamics in the Mongolian Plateau. Catena 2021, 206, 105505. [Google Scholar] [CrossRef]
  72. Ren, S.; Li, Y.; Peichl, M. Diverse Effects of Climate at Different Times on Grassland Phenology in Mid-Latitude of the Northern Hemisphere. Ecol. Indic. 2020, 113, 106260. [Google Scholar] [CrossRef]
  73. Song, Z.; Zhang, J.; Chi, M.; Guo, N.; Yang, S.; Guo, Y.; He, R.; Gao, Z. The Influence of the Morphological Characteristics of Mining-Induced Ground Fissures on the Spatiotemporal Distribution of Soil Moisture. Water 2024, 16, 2496. [Google Scholar] [CrossRef]
  74. Zhang, Y.; Gong, H.; Gu, Z.; Wang, R.; Li, X.; Zhao, W. Characterization of Land Subsidence Induced by Groundwater Withdrawals in the Plain of Beijing City, China. Hydrogeol. J. 2014, 22, 397–409. [Google Scholar] [CrossRef]
  75. Li, J.; Wu, L.; Huang, Y.; Hu, B.; Wu, X.; Cao, G. Characteristics of Soil Moisture Transport in the Aeration Zone of Subsidence Areas under the Disturbance of Coal Seam Mining. Geomech. Geophys. Geo-Energ. Geo-Resour. 2024, 10, 151. [Google Scholar] [CrossRef]
  76. Wang, C.; Liao, F.; Wang, G.; Qu, S.; Mao, H.; Bai, Y. Hydrogeochemical Evolution Induced by Long-Term Mining Activities in a Multi-Aquifer System in the Mining Area. Sci. Total Environ. 2023, 854, 158806. [Google Scholar] [CrossRef] [PubMed]
  77. Li, C.; Gao, X.; Xiang, X.; Jiang, C.; Duan, Y.; Wang, W.; Zhang, X.; Tan, T.; Wang, Q.; Wang, Y. Intense Human Activities Induce the Dynamic Changes of Interaction Pattern Between Karst Water-Quaternary Groundwater in the Basin-Mountain Coupling Belt Over the Past 60 Years. Water Resour. Res. 2024, 60, e2023WR035211. [Google Scholar] [CrossRef]
  78. Zhou, S.; Zhang, Y. Open-Pit Coal Mining Alters Vegetation Cover, Soil Microbial Metabolic Profile and Nutrient Cycling Potential in an Arid Shrubland. J. Environ. Chem. Eng. 2025, 13, 118804. [Google Scholar] [CrossRef]
  79. Różkowski, J.; Rahmonov, O.; Szymczyk, A. Environmental Transformations in the Area of the Kuźnica Warężyńska Sand Mine, Southern Poland. Land 2020, 9, 116. [Google Scholar] [CrossRef]
  80. Chen, Z.; Zhang, X.; Jiao, Y.; Cheng, Y.; Zhu, Z.; Wang, S.; Zhang, H. Investigating the Spatio-Temporal Pattern Evolution Characteristics of Vegetation Change in Shendong Coal Mining Area Based on kNDVI and Intensity Analysis. Front. Ecol. Evol. 2023, 11, 1344664. [Google Scholar] [CrossRef]
  81. Peng, S.; Bao, N.; Zhao, X.; Meng, D.; Han, Z. How Soil Physicochemical Properties and Microorganisms Change under Mining Activities in Alpine and High-Altitude Regions−A Case Study of a Copper Mine Area in Tibet Plateau. J. Environ. Chem. Eng. 2025, 13, 117202. [Google Scholar] [CrossRef]
  82. Xu, R.; Li, J.; Li, X.; Song, W. Effect of Coal Mining Subsidence on Soil Microbial Communities in Mining Areas with High Groundwater Levels. Environ. Geochem. Health 2025, 47, 245. [Google Scholar] [CrossRef]
  83. Sun, J.; Yang, L.; Wei, J.; Quan, J.; Yang, X. The Responses of Soil Bacterial Communities and Enzyme Activities to the Edaphic Properties of Coal Mining Areas in Central China. PLoS ONE 2020, 15, e0231198. [Google Scholar] [CrossRef]
  84. Huang, L.; Xu, C.; Xu, J.; Zhao, Y. Hydrate Dissociation Evaluation and Stratum Subsidence Response Induced by Depressurization in Hydrate-Bearing Permafrost. Energy Fuels 2022, 36, 11077–11088. [Google Scholar] [CrossRef]
  85. Yang, Q.W.; Shu, W.S.; Qiu, J.W.; Wang, H.B.; Lan, C.Y. Lead in Paddy Soils and Rice Plants and Its Potential Health Risk around Lechang Lead/Zinc Mine, Guangdong, China. Environ. Int. 2004, 30, 883–889. [Google Scholar] [CrossRef]
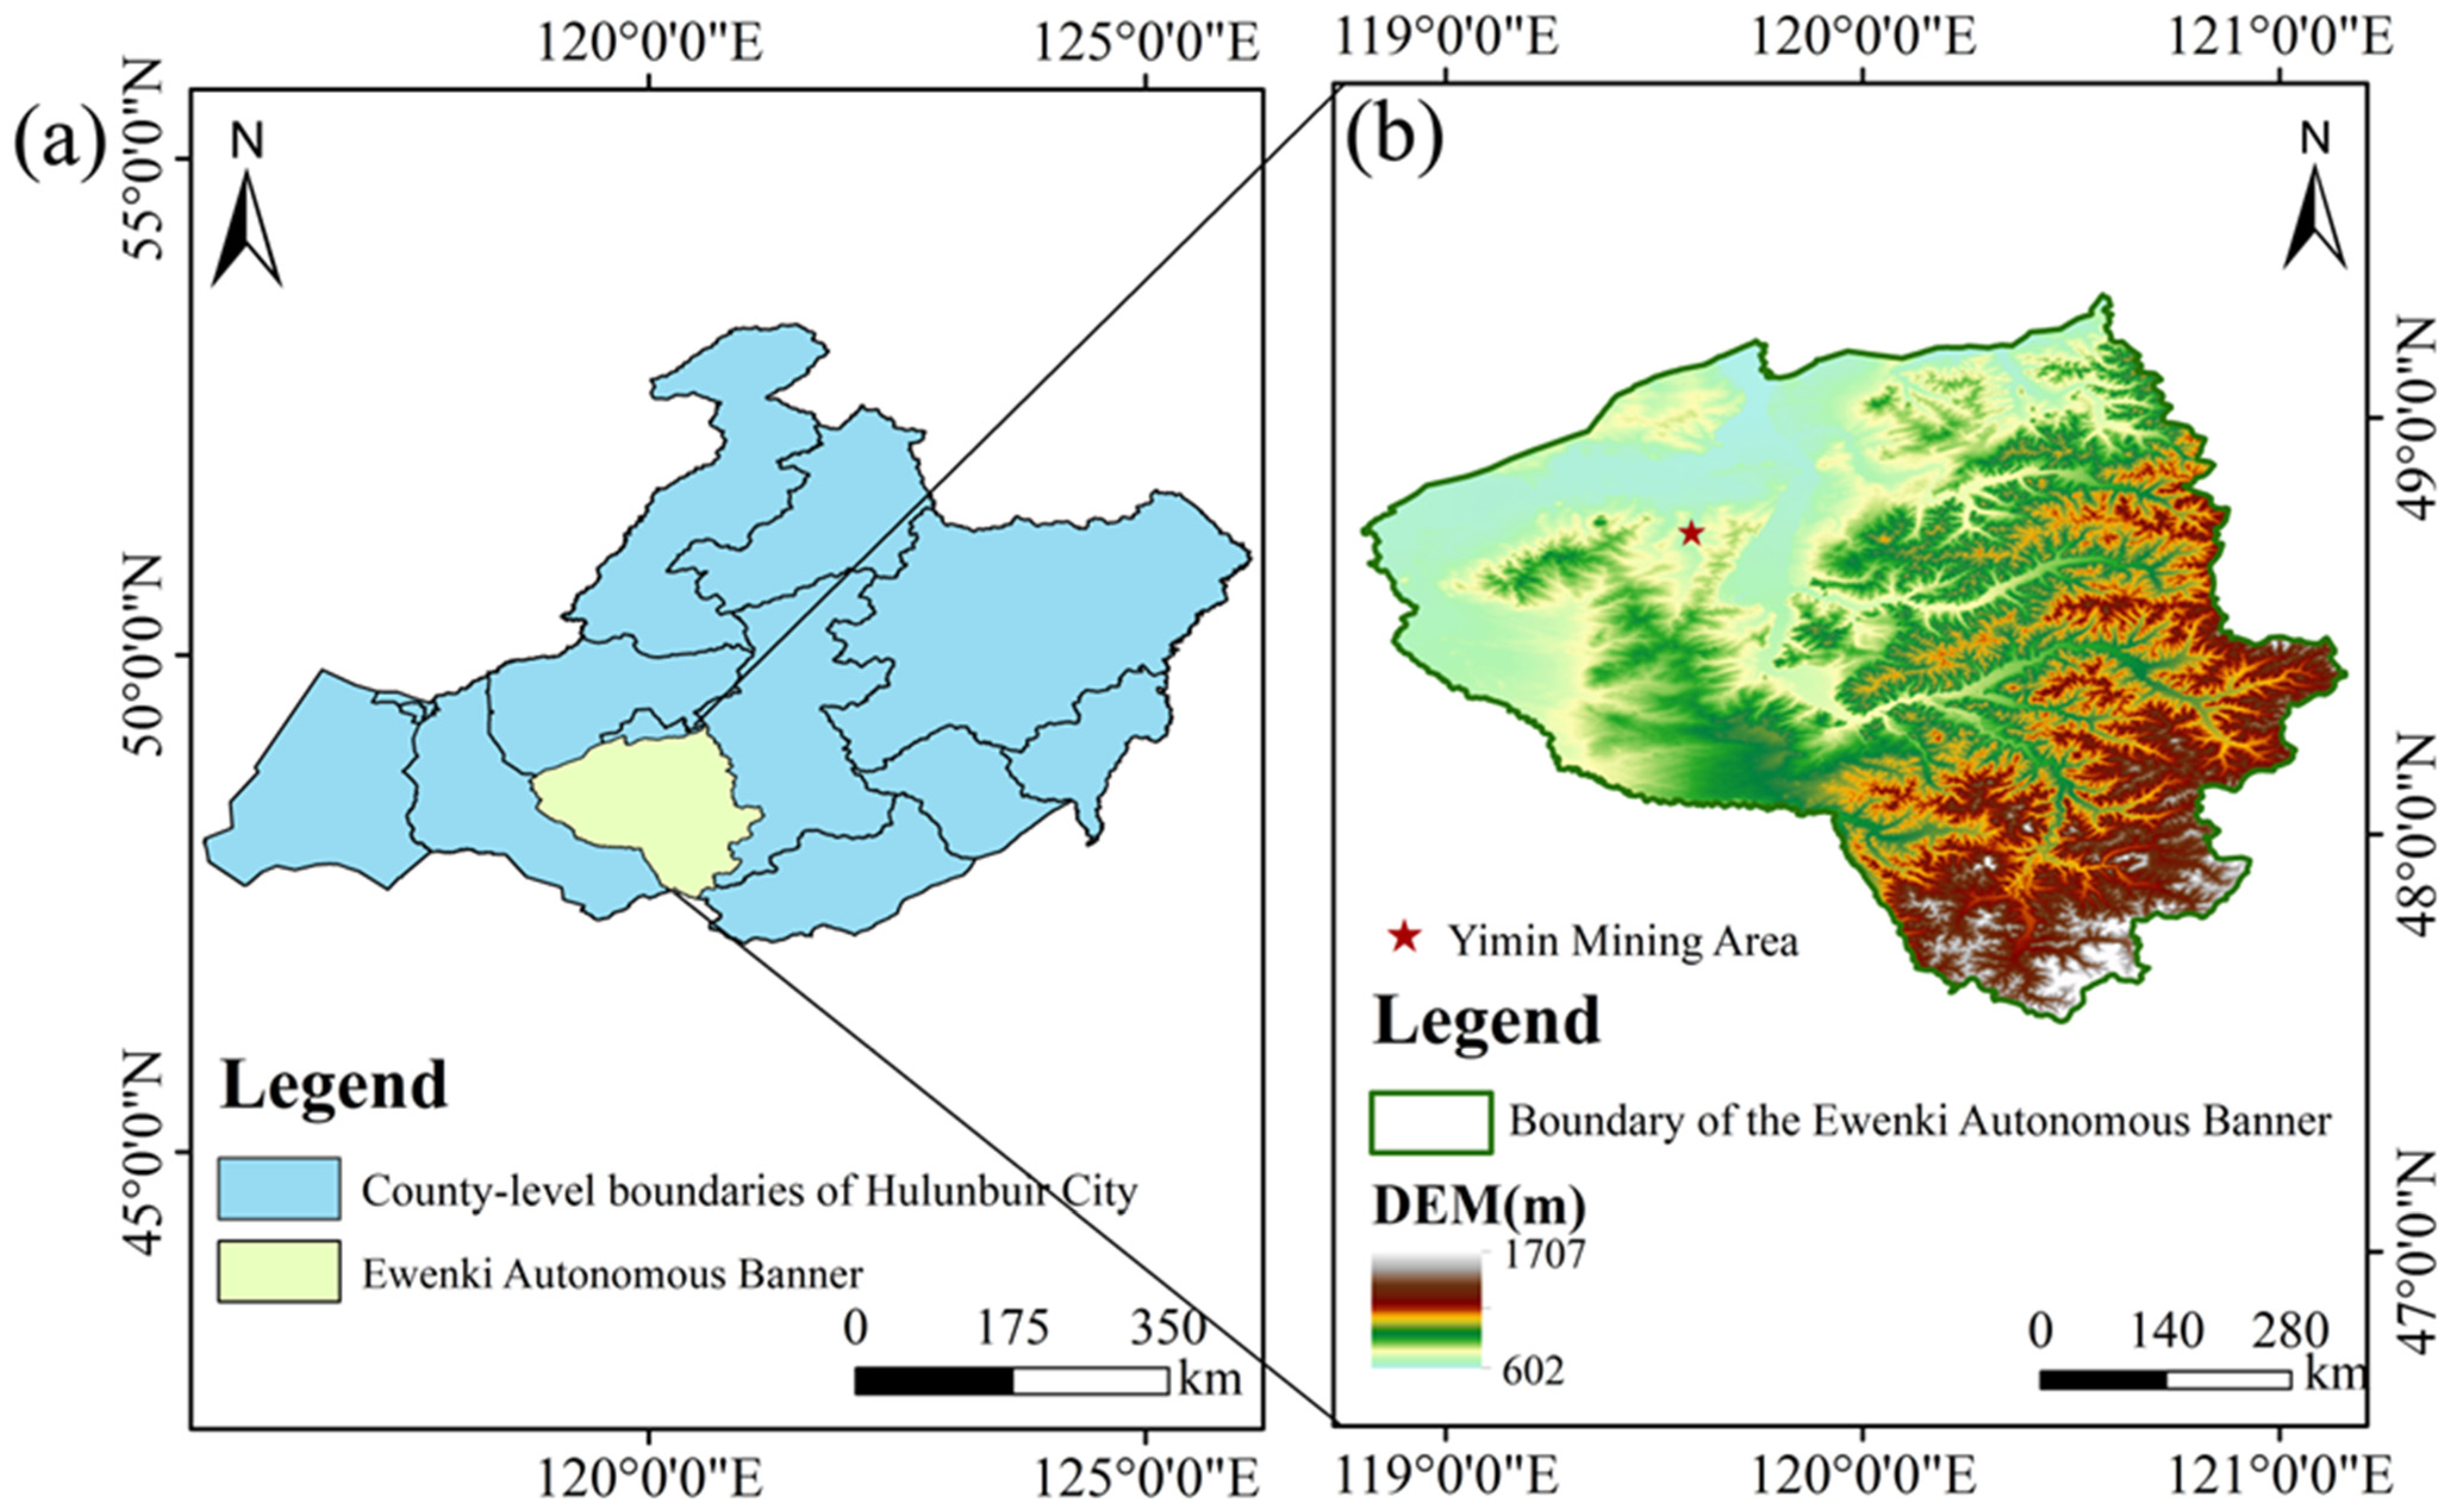
Figure 1. Study area location: (a) Hulunbuir City, China; (b) Yimin Coal Mine site within the Ewenki Autonomous Banner. Note: Image datum: WGS 1984; Coordinate system: GCS_WGS_1984; DEM data source: Geospatial Data Cloud (https://www.gscloud.cn/ accessed on 20 September 2025); County-level boundary source: National Centre for Basic Geographic Information (https://www.ngcc.cn/ accessed on 20 September 2025).
Land 14 02011 g001
Figure 2. Schematic diagram for phenological parameter extraction. The selected pixel is located at 48°22′11″ N, 119°21′05″ E. Note: Orange scatter points represent the values of MSAVI.
Land 14 02011 g002
Figure 3. Conceptual model for quantifying the spatial extent of mining impact. (a) Map of the impact scope of mining activities in all directions; (b,c) Example of mutation point identification in a specific direction.
Land 14 02011 g003
Figure 4. MSAVI time series before and after reconstruction using the three algorithms.
Land 14 02011 g004
Figure 5. Correlation between reconstructed and original MSAVI values. (ac) Linear regression between the reconstructed and original MSAVI values using the Savitzky–Golay, Double Logistic, and Asymmetric Gaussian methods; (di) Comparison of Mean, PCC, R2, RMSE, RSS, and SD values for each reconstruction method.
Land 14 02011 g005
Figure 6. Changes in phenological parameters within the mining disturbance zone (a) NDVI; (b) EVI; (c) GNDVI; (d) RECI; (e) MSAVI. Note: ID refers to interference distance; Areas affected and unaffected by mining activities are shown in red and blue, respectively.
Land 14 02011 g006
Figure 7. Annual changes in key VI indicators between affected and unaffected regions. (a) Mean difference; (b) Standard deviation.
Land 14 02011 g007
Figure 8. Correlation analysis between vegetation phenological parameters extracted by MSAVI and soil moisture content. (a) SOS; (b) LOS; (c) EOS.
Land 14 02011 g008
Table 1. Overview of datasets used in this study.
Data TypeTime CoverageSpatial ResolutionData SourcePurposePreprocessing Steps
HLS 1 January–30 December 202030 mNASA (https://hls.gsfc.nasa.gov/ accessed on 12 September 2024)Time series vegetation monitoringMosaicking, clipping and QA filtering
GLC_FCS30-2020202030 mCASEarth
(https://data.casearth.cn/dataset/6523adf6819aec0c3a438252 accessed on 12 August 2024)
Land cover classificationready-to-use classification product
Soil Water Content1 January–30 December 20201 kmTPDC (https://data.tpdc.ac.cn/zh-hans/data/49b22de9-5d85-44f2-a7d5-a1ccd17086d2 accessed on 28 December 2024)Analysis of hydrological influence on phenologySpatial resampling and temporal alignment
Note: QA = Quality Assurance.
Table 2. Description of Typical Vegetation Indices.
Vegetation Index Calculation FormulaDescription
E V I = N I R R e d N I R + 6 R e d B l u e + 1 EVI accounts for the effects of atmospheric scattering and surface reflectance, enhancing its sensitivity to vegetation cover in areas with high vegetation density as well as in arid and semi-arid regions [29].
G N D V I = N I R G r e e n N I R + G r e e n GNDVI is an indicator of the photosynthetic activity of vegetation and is commonly used to assess the water content and nitrogen concentration in plant leaves based on multispectral data without extreme red channels [30].
R E C I = N I R R e d 1 RECI is an efficient vegetation index that utilizes the spectral characteristics of the red-edge region. It shows a high sensitivity and linear relationship with leaf chlorophyll content, reduces the effects of background and canopy structure, and is less prone to saturation in areas with high biomass [31].
M S A V I =
2 N I R + 1 2 N I R + 1 2 8 N I R R 2
MSAVI is an index proposed to address the issue of soil background interference in vegetated areas. By introducing a soil adjustment factor, it effectively reduces soil noise [32].
N D V I = N I R R e d N I R + R e d NDVI is an important parameter for detecting vegetation growth status and mitigating certain radiometric errors. It reflects the background influences on the plant canopy, such as soil, wet surfaces, snow, dead leaves, and surface roughness [33].
Note: Blue, Green, Red and NIR correspond to the blue band (central wavelength of 490 nm), green band (central wavelength of 560 nm), red band (central wavelength of 665 nm) and near-infrared band (central wavelength of 842 nm) images, respectively.
Disclaimer/Publisher’s Note: The statements, opinions and data contained in all publications are solely those of the individual author(s) and contributor(s) and not of MDPI and/or the editor(s). MDPI and/or the editor(s) disclaim responsibility for any injury to people or property resulting from any ideas, methods, instructions or products referred to in the content.