Article

Response of Depth-Stratified Soil Quality to Land-Use Conversion and Its Limiting Factors in Tropical Ecosystems

1
School of Geomatics, Anhui University of Science and Technology, Huainan 232001, China
2
Institute of Land Surveying and Spatial Geographic Information, Anhui University of Science and Technology, Huainan 232001, China
*
Author to whom correspondence should be addressed.
Land 2025, 14(10), 2010; https://doi.org/10.3390/land14102010
Submission received: 26 August 2025 / Revised: 2 October 2025 / Accepted: 5 October 2025 / Published: 7 October 2025
(This article belongs to the Special Issue Land Resource Use Efficiency and Sustainable Land Use)

Abstract

Land degradation is known to alter soil properties and quality; however, its depth-dependent effects across contrasting land-use types and the key factors limiting soil recovery remain poorly quantified in tropical ecosystems. This study established a forest degradation gradient on Hainan Island, China, encompassing mature forest, secondary forest, rubber plantation, and areca plantation. Soil physical (e.g., bulk density, porosity, water content, field capacity) and chemical (e.g., organic matter, nitrogen, phosphorus, and potassium fractions) properties were measured at three depths (0–20 cm, 20–40 cm, and 40–60 cm). A soil quality index (SQI) was constructed using principal component analysis, and obstacle degree modeling was applied to identify major limiting factors. The results showed that degradation of mature forests significantly reduced topsoil (0–20 cm) quality regardless of subsequent land-use type. In contrast, changes in medium (20–40 cm) and deep (40–60 cm) soil quality were land-use dependent. Conversion to secondary forests and areca plantations resulted in negligible effects, whereas transformation into rubber plantations significantly enhanced soil quality at medium and deep depths. Obstacle degree analysis identified available phosphorus, rather than nitrogen, as the primary limiting factor for soil quality in the region, accounting for 39.7% of all limitations across land-use types. This study demonstrates that the effects of tropical forest degradation on soil quality exhibit dual dependence on both soil depth and land-use type in tropical settings. Furthermore, it highlights the essential role of available phosphorus management in guiding soil restoration and sustainable land-use strategies in these vulnerable ecosystems.

1. Introduction

Global land-use change fundamentally drives alterations in ecosystem structures and functions [1,2,3], particularly in tropical regions where anthropogenic forest conversion induces ecosystem degradation and generates complex soil challenges. Although numerous studies have investigated land-use change impacts on soil quality through various approaches including indicator selection [4,5], assessment methodologies [6,7], and cross-land-use comparisons [8], critical knowledge gaps remain. Specifically, the mechanisms by which vertical stratification of soil properties influences spatial soil quality patterns are not fully understood [9], and the principal limiting factors affecting regional soil quality improvement require further clarification [10]. These knowledge gaps constrain the development of optimized land management strategies and effective soil quality restoration measures.
Previous research has extensively explored the impacts of land-use change on soil quality, revealing three primary characteristics. First, studies demonstrate variability in soil quality indicator selection. While most assessments integrate physical, chemical, and biological metrics [6,11], the specific indicators chosen vary considerably across studies due to ecosystem-specific contexts and research objectives, a scientifically justified divergence. Second, investigations into assessment methodologies have compared established approaches including linear scoring, nonlinear scoring, analytic hierarchy process, and principal component analysis [6,12]. These studies generally report high consistency in results across methods, suggesting methodological choice may not be the primary determinant of soil quality variations [5,13]. Third, research on soil depth effects remains limited. Most studies focus exclusively on surface soils [13,14], while those examining soil profiles primarily document quality differences across land-use types at various depths [15,16]. Crucially, they fail to analyze how interactions between surface and subsurface soil properties influence soil quality trade-offs and synergies, nor do they adequately address depth-dependent variations in soil quality along vertical profiles [16].
Furthermore, contemporary research on land-use change and soil quality encounters a methodological limitation: the predominant focus on ecosystem-scale comparisons between land-use types and their formation mechanisms [15,17], while largely overlooking the crucial identification and analysis of regional-scale soil quality constraints. Conventional approaches typically examine two or more land-use types (e.g., forests, plantations, or croplands) within defined geographical boundaries [18,19]. Although such comparative analyses successfully demonstrate soil quality variations and their associations with anthropogenic activities or vegetation attributes [8,15], thereby providing land cover-specific references for management, they prove insufficient for formulating comprehensive regional soil quality enhancement strategies. The development of such strategies fundamentally requires systematic identification of key limiting factors governing regional soil quality improvement [10,20]. Consequently, transcending traditional land cover comparison paradigms to uncover spatial heterogeneity patterns in soil quality constraints and determine their dominant drivers represents an essential research frontier in soil quality science.
This study focuses on Hainan Island, China, a tropical ecosystems experiencing significant forest transformation characterized by widespread degradation of mature forests and rapid expansion of plantations. The conversion to rubber (Hevea brasiliensis) and areca (Areca catechu) plantations exemplifies regionally distinctive impacts on native ecosystems, offering an ideal model for examining land-use change effects. We compared four forest types—mature forest, secondary forest, rubber plantation, and areca plantation—through comprehensive analysis of physicochemical properties across three soil depths (0–20 cm, 20–40 cm, and 40–60 cm), with particular focus on soil water retention capacity and nutrient status. Our objectives were to elucidate the vertical differentiation patterns of soil quality under forest degradation and to identify key region-specific limiting factors. We hypothesize that forest conversion alters the vertical distribution of soil quality, with subsurface properties playing a regulatory role in overall profile functionality. This study addresses three questions: (i) How does forest degradation affect the vertical stratification of soil physicochemical properties? (ii) How does the impact of forest degradation on soil quality vary with soil depth? (iii) What are the key limiting factors constraining regional soil quality enhancement across land-use types?

2. Materials and Methods

2.1. Study Area

The study was conducted in central Hainan island, China (19°04′ N, 109°31′ E), characterized by a north-tropical monsoon climate and mountainous topography. The region has a mean annual temperature of 20–24 °C and receives 1800–2700 mm of annual precipitation, with 80–94% occurring during the wet season (May to October). The soils are primarily classified as latosols, developed mainly on granitic parent material. The area contains mature forests subject to varying degrees of anthropogenic disturbance. Minimally disturbed mature forests have undergone natural regeneration to secondary forests following selective logging, while heavily disturbed areas have been converted to commercial plantations [21,22], predominantly rubber and areca plantations. These plantations represent important agricultural systems and primary economic resources for local communities. Dominant species in mature forests include Castanopsis fissa, Lasianthus chinensis, Camellia assamica, Dacrydium pectinatum, Ternstroemia gymnanthera, Melastoma sanguineum, and Syzygium chunianum. Secondary forests are characterized by Wrightia pubescens, Psychotria asiatica, Castanopsis jucunda, Aporosa dioica, Glochidion fagifolium, and Lithocarpus corneus [23].
Four distinct land-use types were investigated: (1) mature forest, with stand age greater than 60 years; (2) secondary forest, approximately 12 years old; (3) rubber plantation, over 30 years old; and (4) areca plantation, around 15 years old. For each land-use type, five replicate plots were established, with a minimum inter-plot distance of 200 m maintained to ensure spatial independence.

2.2. Soil Sampling and Analysis

Soil sampling was conducted in October 2017 following standardized protocols. Within each plot, five soil profiles (0.7 m depth × 0.8 m width) were excavated using a five-point sampling design [23]. The sampling depth was limited to 60 cm based on the fact that anthropogenic disturbances—such as those associated with rubber and areca plantations—predominantly affect the uppermost soil strata. To systematically examine vertical differentiation in soil properties, the 0–60 cm soil column was subdivided into three equal segments. Undisturbed soil cores were collected at three depth intervals: 0–20 cm (designated as surface soil), 20–40 cm (intermediate soil), and 40–60 cm (deep soil) using 100-cm3 stainless steel cutting rings. For each depth interval within a plot, subsamples from the five points were thoroughly mixed to form one composite sample for the analysis of soil chemical properties. All samples were stored in airtight plastic bags to preserve their physicochemical integrity.
Laboratory analyses were conducted to assess both physical and chemical soil properties. Physical assessments included bulk density (BD), total porosity (TPor), soil water content (SWC), and field capacity (FC). BD and TPor were determined following the methodology in reference [24], whereas SWC and FC were analyzed according to reference [23]. Chemical analyses encompassed determination of soil organic matter (SOM), total nitrogen (TN), alkali-hydrolyzable nitrogen (AN), nitrate nitrogen (NO3-N), total phosphorus (TP), available phosphorus (AP), total potassium (TK), available potassium (AK), and slowly available potassium (SAK). All chemical analyses were conducted using established procedures as described in references [24,25].

2.3. Soil Quality Assessment

The soil quality index (SQI) was developed using a two-stage principal component analysis (PCA) approach [12,26]. In the first stage, correlation analysis of soil indicators revealed significant correlations (p < 0.05) among multiple variables (Figure S1), and the Kaiser–Meyer–Olkin (KMO) measure confirmed the suitability of the data for PCA [27], with KMO values exceeding 0.65 across all three soil depth intervals (Figure S2). Subsequently, all measured soil indicators were standardized using Z-score normalization and subjected to PCA, with principal components retained based on eigenvalues > 1. Core soil indicators were then selected from those demonstrating factor loadings greater than 0.5. Across three soil depths (0–20 cm, 20–40 cm, 40–60 cm), the selected indicators consistently included BD, TPor, SWC, FC, SOM, TN, AN, NO3-N, TP, AP, AK, and SAK (Figure S3a–c).
These selected indicators underwent secondary standardization according to their relationship with soil quality: positive-effect indicators (where higher values correspond to better soil quality, excluding BD) and negative-effect indicators (where lower values indicate improved soil quality, specifically BD).
S i j = x i j min x j max x j min x j
S i j = max x j x i j max x j min x j
where S i j represents the standardized value of indicator j in sample i, calculated from its original value x i j , with max x j and min x j denoting the maximum and minimum values of indicator jj across all samples.
Subsequently, a secondary PCA was conducted on the standardized core indicators to determine eigenvalues and variance contribution rates for each principal component [12]. The results demonstrated that both the first and second principal components exhibited eigenvalues exceeding 2.0 across all soil depths, indicating their strong explanatory power for characterizing soil quality (Figure S4). The weighting of each indicator was computed through a three-step process: (1) calculating the product of the absolute loading value for each indicator on each principal component and the corresponding principal component’s weighting coefficient (variance contribution rate), (2) summing these products across all principal components, and (3) normalizing the resulting values to derive final indicator weights. This weighting procedure was mathematically expressed as:
w j = k = 1 m L j k · w k j = 1 n k = 1 m L j k · w k
where w j denotes the normalized weight of indicator j, L j k represents the loading of indicator j on principal component k, w k is the weighting coefficient (variance contribution rate) of principal component k, m indicates the number of retained principal components, and n signifies the number of core indicators. Notably, variations in loading values were observed among different soil factors, and these variations were depth-dependent (Figure S5).
The final soil quality index (SQI) was computed as the weighted sum of standardized indicator values:
S Q I i = j = 1 n S i j · w j
where S Q I i represents the soil quality index for sample i. Higher S Q I i values indicate superior soil quality.

2.4. Diagnostic Model for Soil Quality Limiting Factors

To identify key constraints governing regional soil quality across land-use systems, we implemented a diagnostic obstacle degree model quantifying restrictive effects of individual soil properties [10]. This analytical framework evaluates limiting factors by calculating obstacle degrees ( M i j ) for each soil property j within land-use type i, derived from standardized soil quality index (SQI) through the following formulation:
M i j = 1 S i j · W j j = 1 n 1 S i j · W j
where W j represents the PCA-derived weight of indicator j, the term ( 1 S i j ) quantifies the deviation of indicator j from its ideal state, and M i j reflects the limiting effect of indicator j on soil quality in sample i.
M j = 1 N i = 1 N M i j
where N denotes the number of samples sharing identical land-use classification and sampling depth. Limiting factors were classified into three severity levels based on M j values: Severe limiting factors ( M j   ≥ 30%): Require priority remediation; Moderate limiting factors (20% ≤ M j < 30%): Need targeted improvement; Mild limiting factors ( M j < 20%): Suitable for gradual optimization. This classification enables prioritized management interventions according to constraint severity.

2.5. Statistical Analysis

The effects of land-use types (mature forest, secondary forest, rubber plantation, and areca plantation) and soil depths (0–20 cm, 20–40 cm, and 40–60 cm) on soil physicochemical properties were analyzed through a comprehensive statistical approach. All measured soil properties—including physical parameters (BD, TPor, SWC, and FC) and chemical parameters (SOM, TN, AN, NO3-N, TP, AP, TK, AK, and SAK)-underwent rigorous statistical evaluation.
Data distributions were first examined using Shapiro–Wilk normality tests supplemented by Q-Q plot visualizations, while Levene’s test evaluated variance homogeneity [28]. For datasets satisfying both normality and homoscedasticity assumptions, one-way ANOVA with Bonferroni-corrected post hoc comparisons was employed to assess land-use effects within each depth stratum. Non-normal or heteroscedastic datasets were analyzed using Kruskal–Wallis tests with Dunn’s multiple comparisons. A significance level of 0.05 was applied for all statistical tests.
Depth-specific relationships among soil properties were investigated through Pearson correlation matrices constructed separately for each depth interval (0–20 cm, 20–40 cm, and 40–60 cm), incorporating all measured physical and chemical indicators. Correlation significance was established at p < 0.05. All analyses were performed in R version 4.1.3, utilizing the “dplyr” package for data management [29], “rstatix” for statistical testing [30], “Hmisc” for correlation analysis [31], and “ggplot2” [32] with “corrplot” [33] for visualization.

3. Results

3.1. Variations in Soil Properties

In terms of soil physical properties, in the surface layer, mature forests showed insignificant differences in bulk density (BD) compared to other land-use types (p > 0.05; Figure 1a) but exhibited higher total porosity (TPor) and soil water content (SWC) than other land-use types (p < 0.05; Figure 1b,c). Within the middle layer, neither BD nor field capacity (FC) differed significantly between mature forests and other land types (p > 0.05; Figure 1); however, TPor and SWC remained significantly elevated in mature forests relative to areca plantations (p < 0.05; Figure 1b,c). In the deep soil layer, rubber plantations differed significantly from mature forests in both BD and FC, BD was lower, while FC was higher in rubber plantations compared to mature forests (p < 0.05; Figure 1d). Overall, TPor consistently correlated positively with SWC and FC across all depths (p < 0.05; Figure S1).
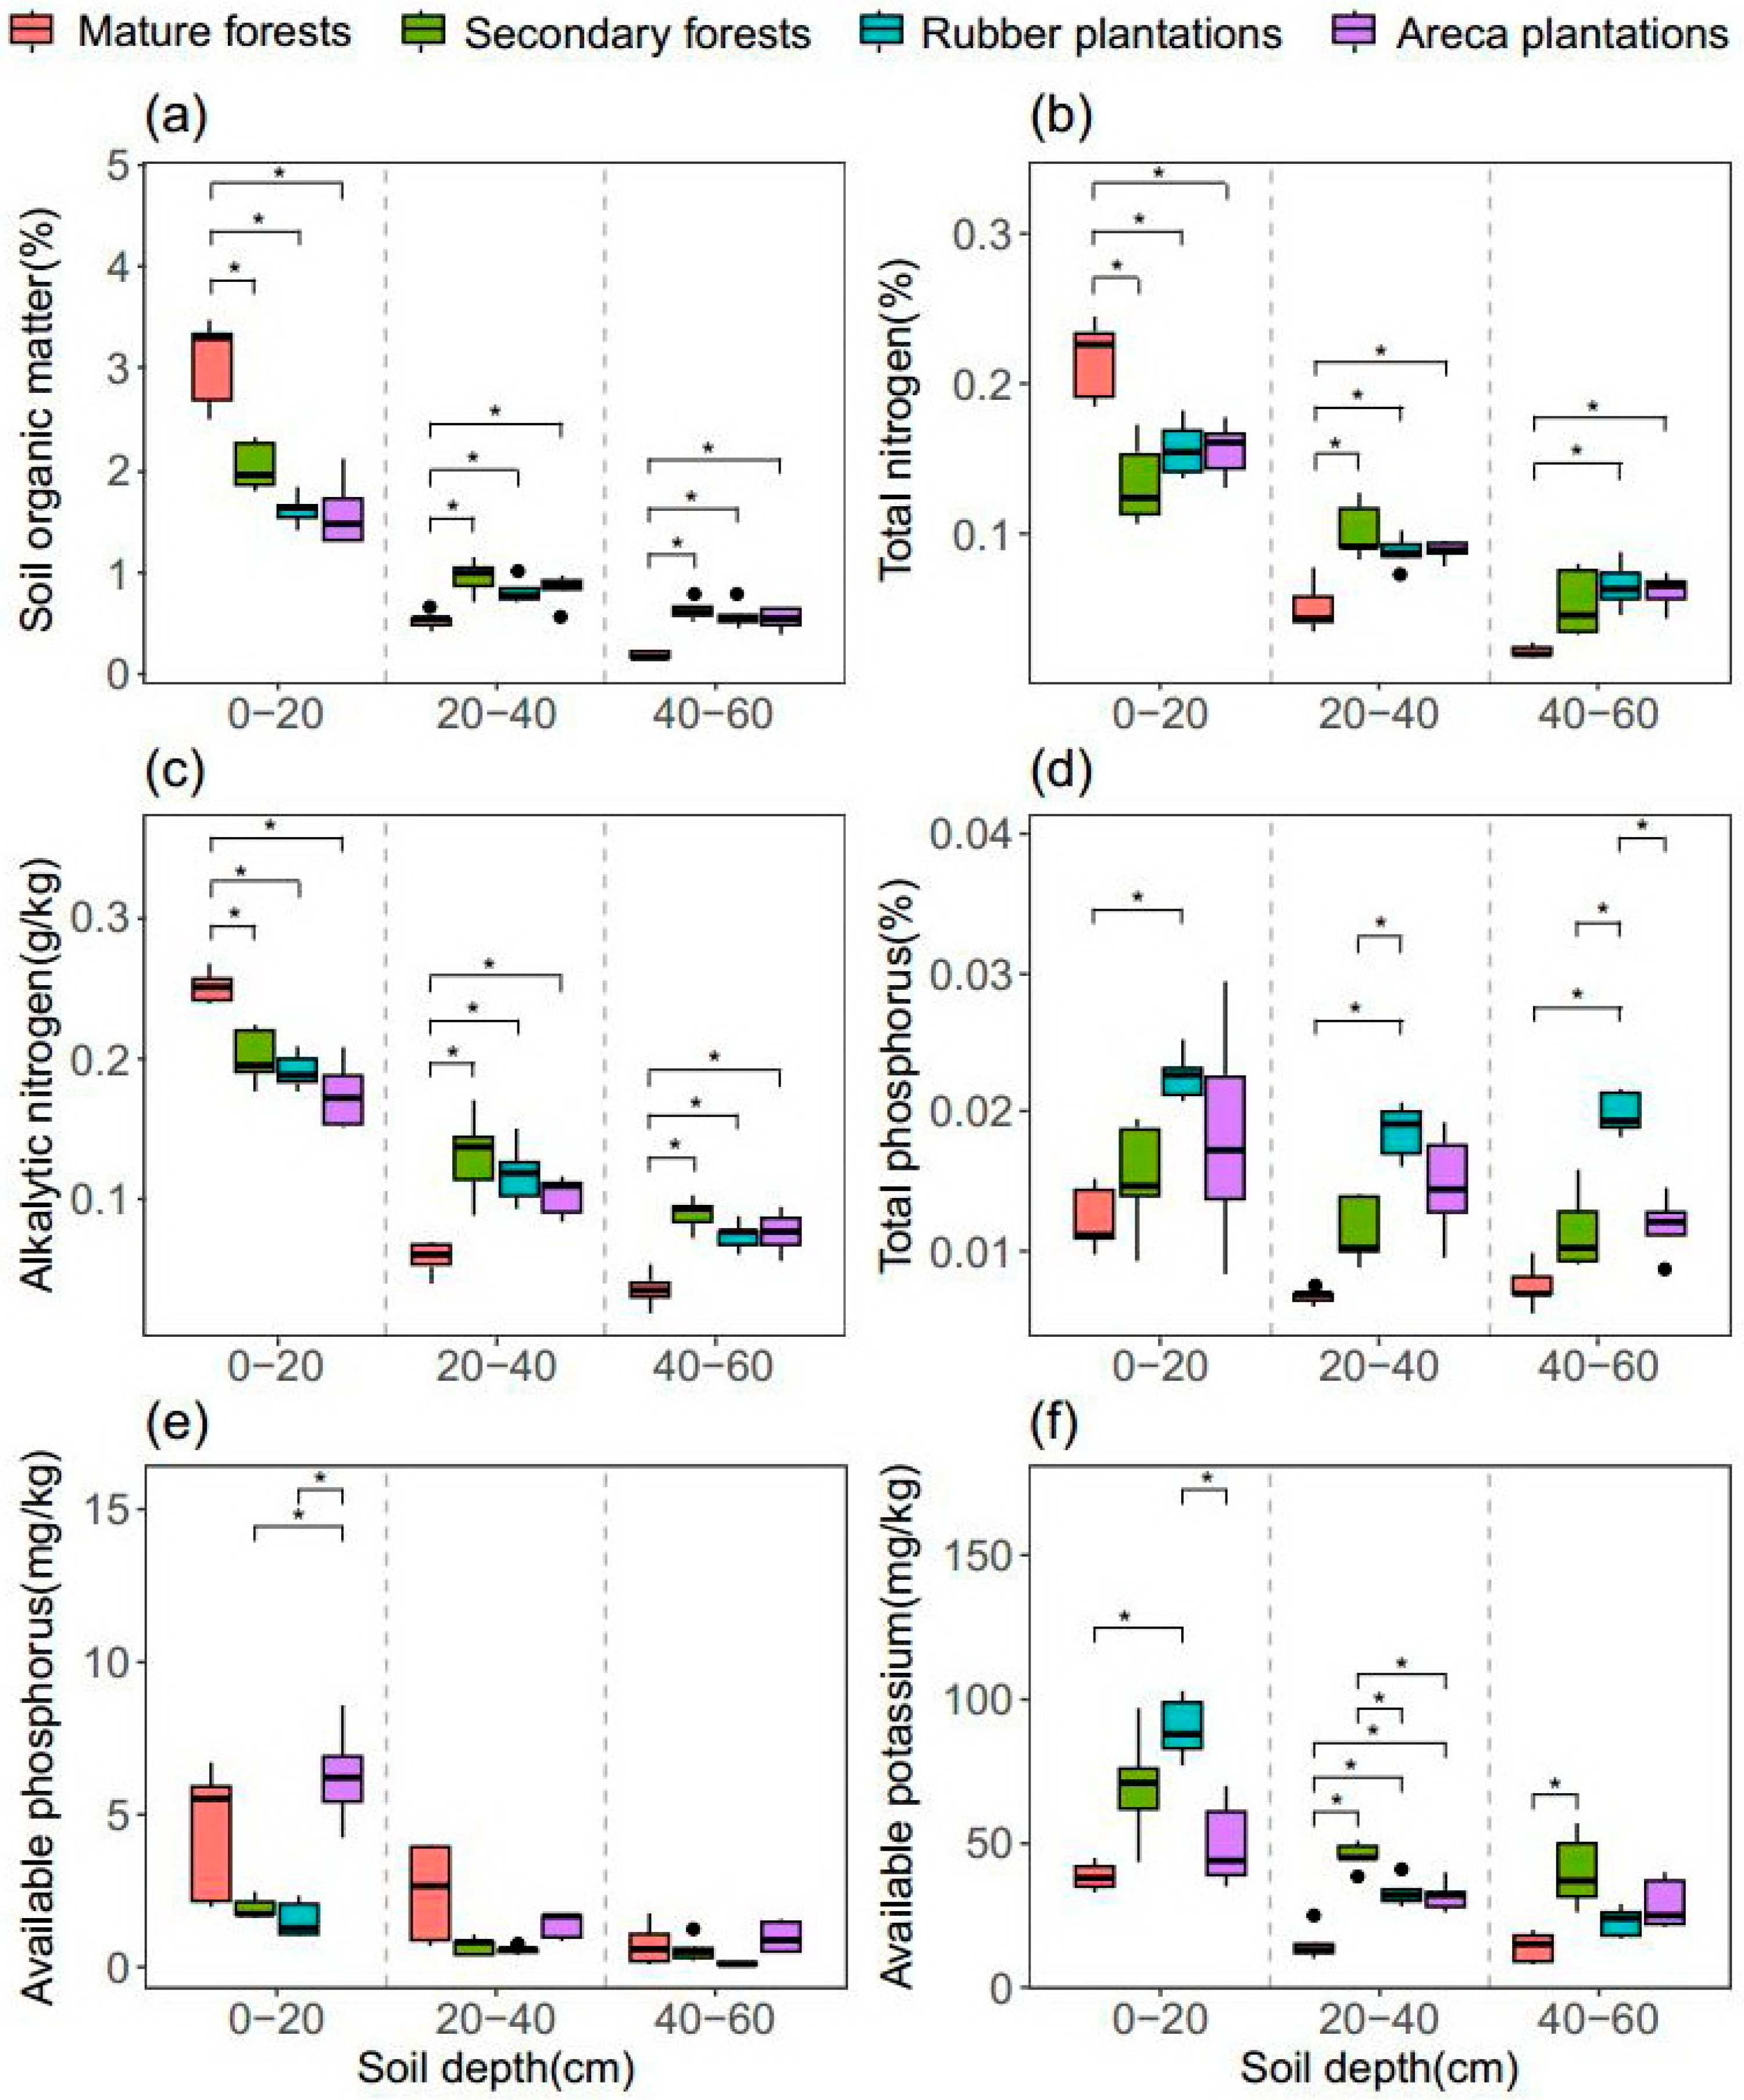
Regarding soil chemical properties, surface layers under mature forests exhibited significantly higher levels of soil organic matter (SOM), total nitrogen (TN), and alkali-hydrolysable nitrogen (AN) compared to other land-use types (p < 0.05; Figure 2a–c). In contrast, mature forests showed lower concentrations of total phosphorus (TP), total potassium (TK), available potassium (AK), and slowly available potassium (SAK) relative to rubber plantations (p < 0.05; Figure 2 and Figure S6). Similarly, nitrate nitrogen (NO3-N) and SAK were significantly reduced in mature forests compared to areca plantations (p < 0.05; Figure 2 and Figure S6). In the intermediate soil layer, TP, TK, AK, and SAK remained lower in mature forests than in both plantation systems (p < 0.05; Figure 2 and Figure S6). Deep soil layers showed a more limited contrast, with only TP and SAK being lower in mature forests than in rubber and areca plantations (p < 0.05; Figure 2 and Figure S6). Across all depths, SOM was consistently and positively correlated with AN (p < 0.05; Figure S1), while TK and TP showed depth-independent positive correlations with AK (p < 0.05; Figure S1).

3.2. Variations in Soil Quality

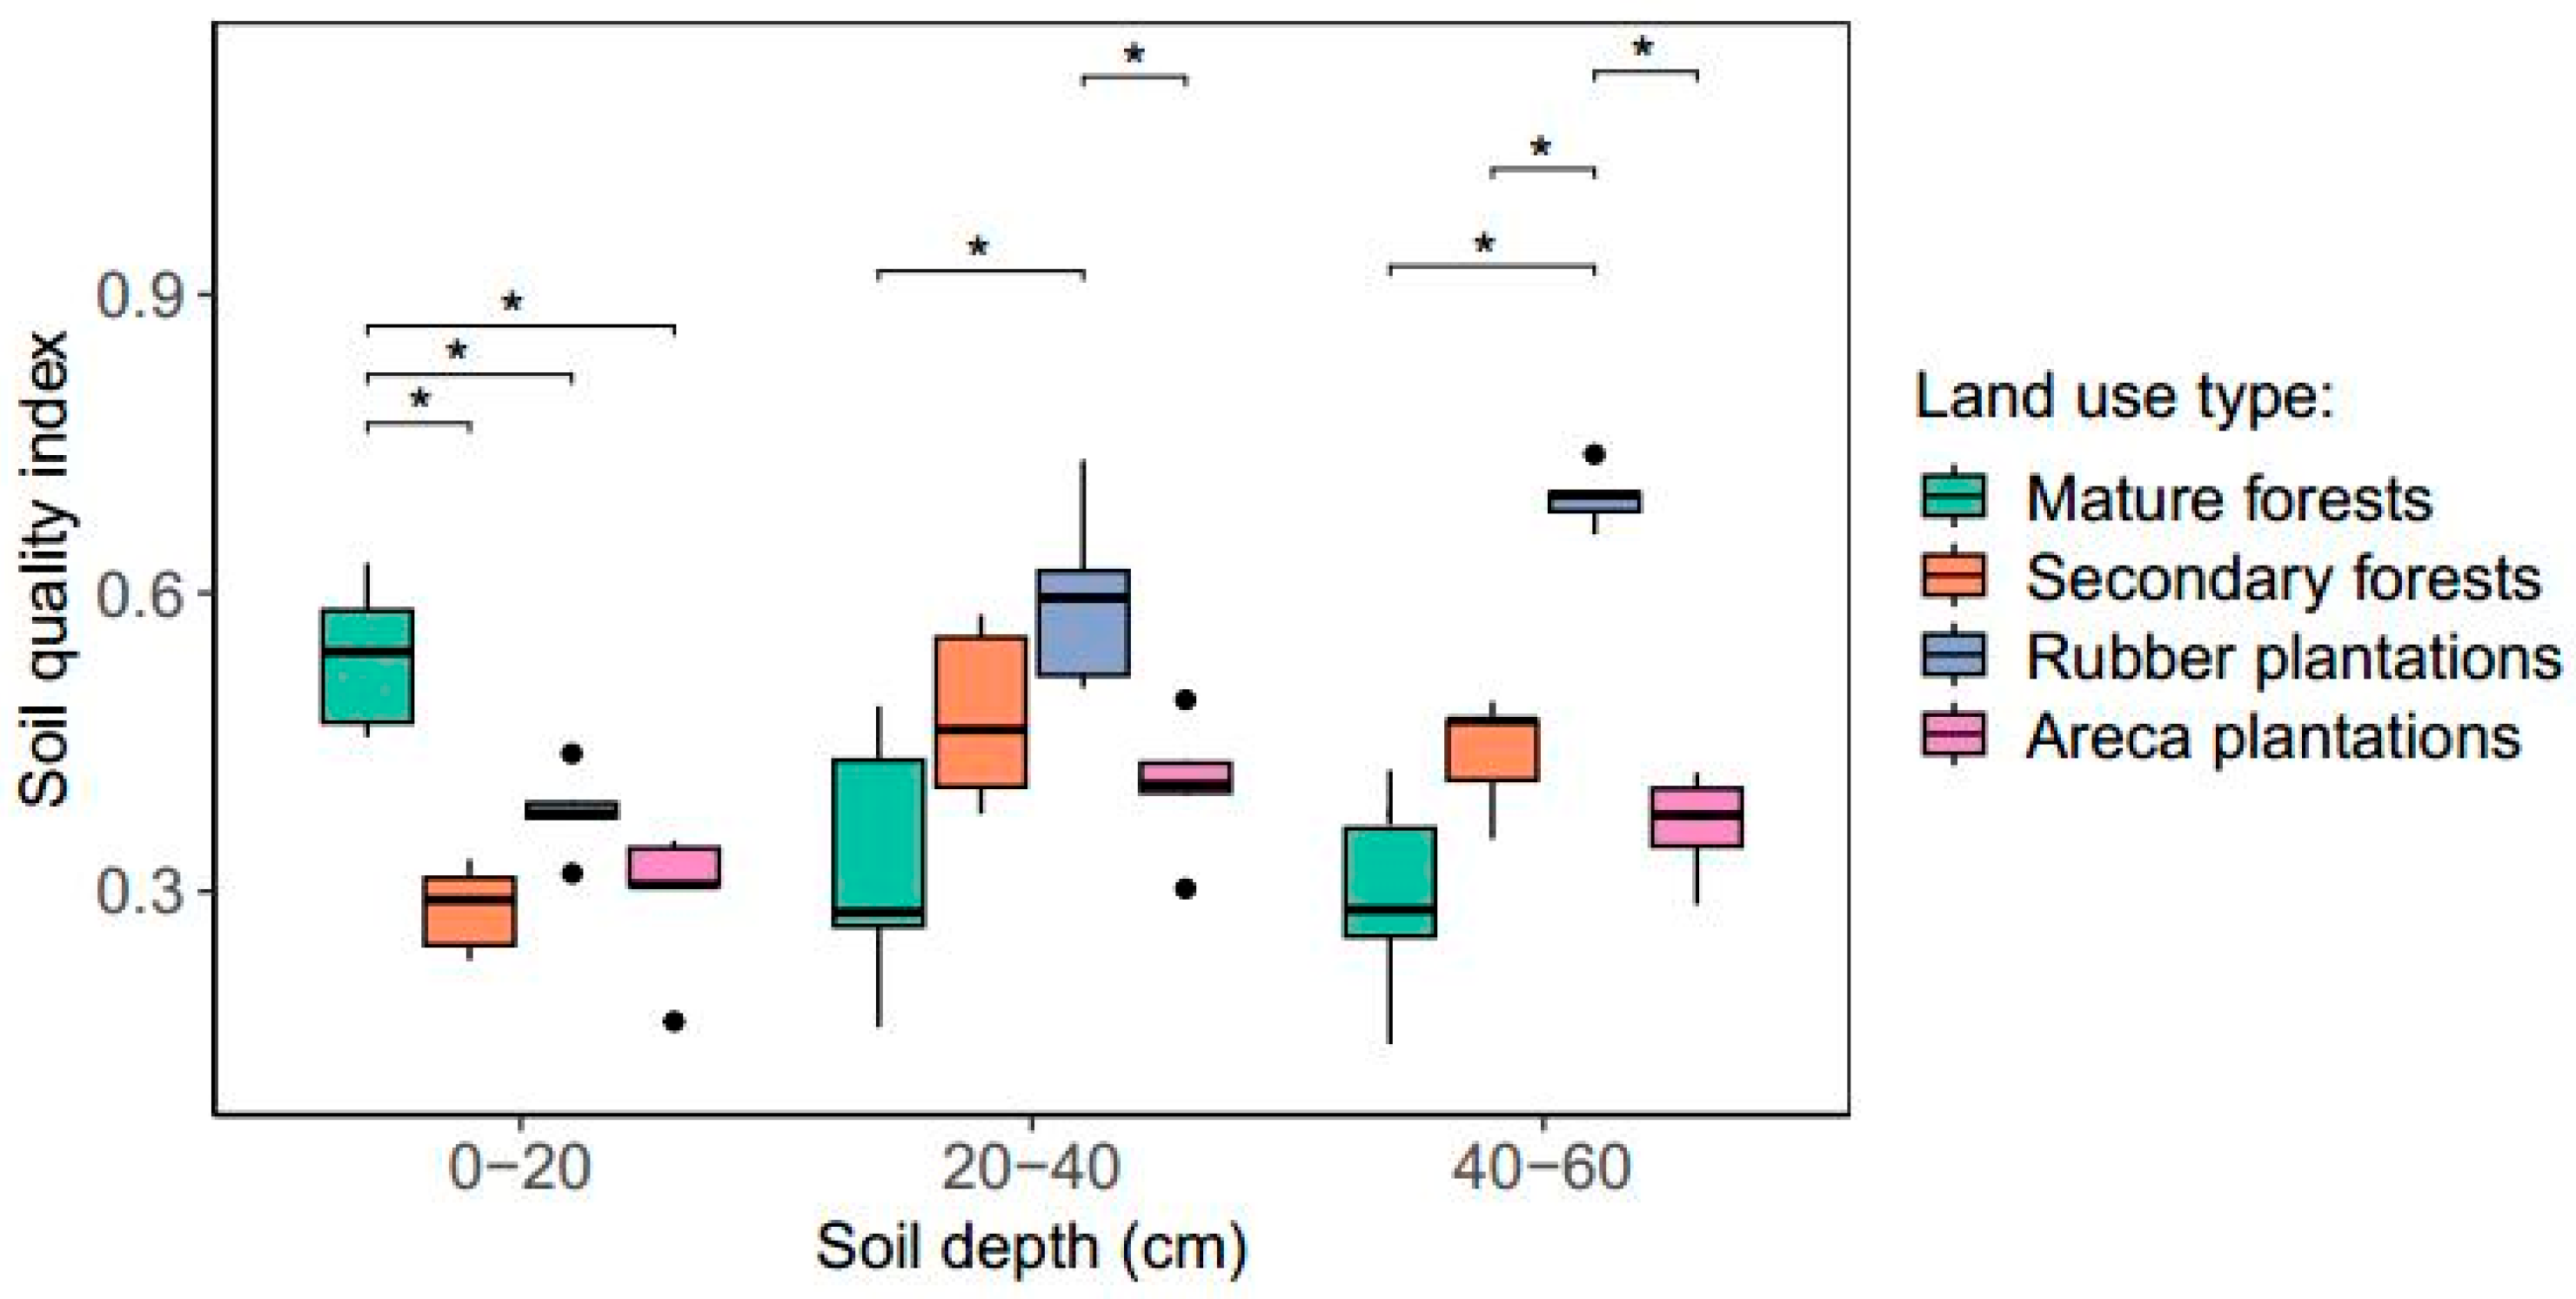
The surface soil quality index (SQI) was higher in mature forests than in secondary forests, rubber plantations, and areca plantations (p < 0.05; Figure 3), while no significant differences were observed among other land-use types. In the intermediate layer, SQI did not differ significantly among mature forests, secondary forests, and areca plantations (p > 0.05; Figure 3), but was significantly lower than that in rubber plantations (p < 0.05; Figure 3). Within the deep soil layer, the SQI of mature forests showed insignificant difference compared to secondary forests and areca plantations but was significantly lower than that of rubber plantations (p < 0.05; Figure 3). Furthermore, the deep soil SQI of rubber plantations was higher than that of both secondary forests and areca plantations (p < 0.05; Figure 3).

3.3. Characteristics of Soil Limiting Factors

Higher obstacle degree values indicate stronger limiting effects on soil quality. Analysis of mean obstacle degrees revealed that TP (36.1%) and SOM (35.3%) were the primary limiting factors for surface soil (0–20 cm) quality (Figure 4a). In subsurface layers (20–40 cm), AP (46.6%), BD (29.8%), and AN (27.5%) were key limiting factors, with AP demonstrating the highest limiting effect (Figure 4a). For deep soil layers (40–60 cm), AP (43.4%), SOM (31.2%), and AN (30.1%) were the dominant limiting factors, with AP again showing the strongest constraint (Figure 4a). Chemical indicators generally imposed greater limitations than physical properties across all depths (Figure 4a), and AP demonstrated the highest overall obstacle degree (39.7%, Table S1).
Analysis of obstacle degrees across different land-use types revealed distinct vertical patterns of soil quality constraints. In mature forests, surface soils (0–20 cm) were predominantly limited by TP (51.9%) and AP (34.1%); intermediate layers (20–40 cm) showed stronger constraints from AP (58.9%) and AK (31.7%); while deep soils (40–60 cm) were mainly restricted by AP (36.5%) and AN (44.4%) (Figure 4b). Secondary forests exhibited a different pattern: surface layers were constrained by AP (30.7%), intermediate layers by AP (30.4%), and deep layers by both AP (38.6%) and SOM (40.7%) (Figure 4b). Rubber plantations demonstrated surface limitations from SOM (51.1%) and TP (42.3%), middle-layer constraints from AP (57.2%) and BD (38.1%), and deep-layer restrictions primarily from SOM (59.4%) with additional constraints from TP (34.8%) and AP (31.9%) (Figure 4b). Areca plantations showed surface soil limitations dominated by BD (46.4%) and SOM (40.2%), intermediate constraints from AP (40.4%) and AN (42.4%), and deep-layer restrictions primarily from AP (66.2%) with secondary limitation from AN (35.7%) (Figure 4b).

4. Discussion

This study reveals the impacts of mature forest degradation on soil physical properties, with divergent responses across vertical soil profiles. Following conversion of mature forests to secondary forests or plantations, surface soil water retention capacity declined [34], evidenced by concurrent reductions in total porosity (TPor), soil water content (SWC), and field capacity (FC). These changes predominantly resulted from anthropogenic disturbances: mechanical operations in managed systems directly compromise soil pore architecture [35], while diminished surface organic matter further reduces water-holding capacity. In intermediate layers (20–40 cm), water retention responses diverged markedly across land-use types. Secondary forests and rubber plantations maintained capacities comparable to mature forests, while areca plantations exhibited declines. This disparity likely stems from vegetation canopy characteristics: sparse coverage in areca plantations enhances water evapotranspiration [36], whereas denser canopies in secondary forests and rubber plantations mitigate soil water loss [34]. Crucially, mature forests maintain superior integrated water retention across the full soil profile due to intact ecosystem functionality, where dense canopy structures minimize evaporation [34,36], abundant litter layers regulate moisture dynamics [35], and stable pore architectures ensure efficient water storage and transport [37].
Forest conversion fundamentally altered the vertical distribution of key chemical properties, including soil organic matter (SOM), total nitrogen (TN), and alkali-hydrolysable nitrogen (AN). Consistent with previous studies [34,37], surface SOM, TN, and AN concentrations were higher in mature forests than converted systems, primarily due to continuous litter input sustaining surface organic matter [38] and intact canopies minimizing nutrient leaching by reducing soil erosion [22,34]. Conversely, intermediate and deep layers exhibited inverse dynamics: plantations accumulated higher TN and AN than mature forests at these depths. In plantations, mid-depth fertilizer application avoided surface losses while directly enriching intermediate layers and facilitating downward nutrient migration [39,40]. These vertical redistribution patterns indicate that despite alterations in spatial nutrient allocation, cross-horizon compensatory mechanisms help sustain nitrogen equilibrium throughout the soil profile. Intermediate-layer accumulation offsets nutrient deficits in surface horizons, thereby likely maintaining the overall stoichiometric stability of nitrogen.
A key finding of this study is that degradation of mature forests leads primarily to a decline in topsoil quality, whereas the middle and deep soil layers remain largely unaffected. This observation is supported by the fact that significant differences among mature forests, secondary forests, and areca plantations were found only in the topsoil layer, which aligns with findings reported in previous studies [8,16]. The superior topsoil quality in mature forests can be attributed to more favorable physical properties (e.g., higher TPor and SWC) and chemical characteristics (e.g., higher SOM and AN) [41,42]. Conversion of mature forests to secondary forests or areca plantations exerted a stronger impact on the topsoil compared to the middle and deep layers. This is likely because the topsoil is more directly exposed to soil erosion, changes in vegetation cover, and root activity [34,43], whereas the middle and deep soil layers in these ecosystems have undergone minimal anthropogenic disturbance. As a result, a pronounced decline in topsoil quality is evident.
Moreover, it is noteworthy that the medium and deep soil layers in mature forests showed significantly lower quality than those in rubber plantations, mainly due to intensified human-induced disturbances in the rubber cultivation systems [23,25]. Fertilization in rubber plantations generally targets medium soil depths, which leads to accumulation of total phosphorus (TP), and total nitrogen (TN) in these layers. These nutrients subsequently leach into the deeper soil zones [44]. In addition, the digging of large planting pits (approximately 60 cm deep) during plantation establishment disturbs the soil profile down to 60 cm [23], directly improving physical properties in deeper layers, such as markedly reducing bulk density relative to mature forests. The synergistic effects of these management practices enhance soil quality in the medium and deep layers of rubber plantations. These findings highlight that the effects of forest degradation on soil quality are both depth-dependent and land-use-specific.
Another key finding of this study is that available phosphorus (AP), rather than nitrogen, constitutes the primary regional constraint on soil quality, exhibiting depth-dependent limiting mechanisms. In surface soils, organic matter remains the dominant controlling factor due to its rapid depletion following land conversion and erosion-induced nutrient loss, a pattern widely reported in previous studies [34,45]. In contrast, AP exerted a stronger limiting effect than all other properties in intermediate and deep soil layers, acting as the principal regulator of soil quality at depth. This finding diverges from previous studies, which identified nitrogen as the dominant limiting factor in forest ecosystems [46,47].
Notably, the AP limitation was consistently observed across mature forests, secondary forests, and plantations. AP scarcity in tropical forests and plantations stems from complex interactions between natural processes and human activities. Many tropical regions, especially islands, exhibit inherently low phosphorus levels in soil parent material and limited initial phosphorus content. Strong weathering and leaching processes continuously deplete these already constrained soil phosphorus pools [48], creating fundamental supply deficiencies. Concurrently, iron/aluminum oxides (with reactivity enhanced at low pH) immobilize soluble P into insoluble compounds through chemisorption [49], directly reducing P bioavailability. Agricultural plantations compound this deficit by removing P via biomass harvest of cash crops (e.g., rubber, areca), thereby disrupting natural nutrient cycling pathways. Collectively, these mechanisms confirm the fundamental constraining role of AP across tropical forest ecosystems across various land-use regime.
These findings yield important insights for land management and restoration strategies in tropical ecosystems. At the ecosystem scale, substantial deterioration of surface soil properties demands urgent ecological attention. Given the irreplaceable roles of mature forests in biodiversity conservation, hydrological regulation, and ecosystem service provision [50], particularly their capacity to sustain natural enemies [28] and stabilize soil-water interactions [34], their preservation delivers superior holistic benefits compared to plantation conversion, necessitating stringent regulation of mature forest clearance. For existing degraded plantations, we propose implementing integrated restoration protocols combining green manure cultivation with organic amendments to elevate surface soil organic matter, and establishing multi-layered vegetation configurations to enhance nutrient cycling efficiency [50,51], collectively improving water retention and biogeochemical functioning. Crucially, addressing the regionally pervasive available phosphorus deficiency requires strategic interventions: targeted application of soluble phosphate fertilizers coupled with cultivation of phosphorus-efficient tree species to mitigate this fundamental constraint. Recognizing that phosphorus fertilization induces cascading effects in soil microbial communities [52], future assessment should integrate microbial diversity metrics to elucidate how phosphorus-microbe interactions constrain soil quality. This approach will enable developing integrated solutions for soil sustainability challenges under intensifying land-use pressures.

5. Conclusions

This study reveals the impacts of land-use conversion on soil quality and its limiting factors in tropical ecosystems. The results show that these impacts depend strongly on both soil depth and land-use type. Specifically, the degradation of mature forests consistently reduces topsoil quality across all converted land-use types. However, its influence on medium and deep soil layers varies with land use; conversion to secondary forests and areca plantations leads to negligible changes, whereas transformation into rubber plantations results in improved soil quality, likely owing to specialized management practices. Therefore, assessing the impacts of tropical forest degradation on soil quality requires careful consideration of post-conversion land-use types. On a regional scale, soil available phosphorus rather than nitrogen is identified as the primary limiting factor for soil quality. These findings offer a scientific basis for designing land-use management and soil restoration strategies in tropical ecosystems. These evidences underscore the critical need to prioritize topsoil conservation. Furthermore, it supports the implementation of wide phosphorus supplementation to mitigate potential nutrient limitations in tropical regions.

Supplementary Materials

The following supporting information can be downloaded at: https://www.mdpi.com/article/10.3390/land14102010/s1, Figure S1: Correlations among soil physicochemical properties at different soil depths title; Figure S2: Results of the Kaiser–Meyer–Olkin (KMO) analysis for soil properties at different depths; Figure S3: Principal component analysis (PCA)-based screening of core soil quality indicators across soil depths: (a) 0–20 cm, (b) 20–40 cm, and (c) 40–60 cm profile. Figure S4: Principal component analysis (PCA) showing eigenvalues and percentage of variance explained by each principal component across different soil depths; Figure S5: Loadings of soil quality indicators on the first two principal components (PC1 and PC2) derived from principal component analysis. Figure S6: Differences in soil chemical properties among land use types at different soil depths; Table S1: Obstacle degree (values shown) of soil factors affecting soil quality at ecosystem and regional scales.

Author Contributions

Y.L. designed the study, analyzed the data, and wrote multiple draft versions of the manuscript. T.Z. assisted with data processing. S.W. offered suggestions for revisions to the draft. Y.L. conducted the experiments and offered suggestions for revisions to various drafts. All authors have read and agreed to the published version of the manuscript.

Funding

This research was supported by the Natural Science Research Project of Anhui Educational Committee (2022AH050820) and the Scientific Research Foundation for High-level Talents of Anhui University of Science and Technology (13200458).

Data Availability Statement

Data will be made available on request.

Acknowledgments

We are grateful to Yongling Wang for helping with the research work.

Conflicts of Interest

The authors declare that they have no known competing financial interests or personal relationships that could have appeared to influence the work reported in this paper.

References

  1. Biedemariam, M.; Birhane, E.; Demissie, B.; Tadesse, T.; Gebresamuel, G.; Habtu, S. Ecosystem Service Values as Related to Land Use and Land Cover Changes in Ethiopia: A Review. Land 2022, 11, 2212. [Google Scholar] [CrossRef]
  2. Fathy, H.; Heydari, M.; Fathizad, H.; Hosseinzadeh, J.; Najafifar, A.; Mousavi, S.R.; Jafarzadeh, A.; Heung, B. From forest to farmland: Tracking time series variations in soil quality in semiarid oak forest. Geoderma Reg. 2025, 42, e974. [Google Scholar] [CrossRef]
  3. Yang, Q.; Jaworski, C.C.; Wen, Z.; Desneux, N.; Ouyang, F.; Dai, X.; Wang, L.; Jia, J.; Zheng, H. Crop heterogeneity may not enhance biological control of rice pests in landscapes rich in semi-natural habitats. Agric. Ecosyst. Environ. 2025, 379, 109354. [Google Scholar] [CrossRef]
  4. Ren, Q.; Qiang, F.; Liu, G.; Liu, C.; Ai, N. Response of soil quality to ecosystems after revegetation in a coal mine reclamation area. Catena 2025, 257, 109038. [Google Scholar] [CrossRef]
  5. Selmy, S.A.H.; Abd Al-Aziz, S.H.A.; Jiménez-Ballesta, R.; Jesús García-Navarro, F.; Fadl, M.E. Soil Quality Assessment Using Multivariate Approaches: A Case Study of the Dakhla Oasis Arid Lands. Land 2021, 10, 1074. [Google Scholar] [CrossRef]
  6. Kahsay, A.; Haile, M.; Gebresamuel, G.; Mohammed, M.; Christopher Okolo, C. Assessing land use type impacts on soil quality: Application of multivariate statistical and expert opinion-followed indicator screening approaches. Catena 2023, 231, 107351. [Google Scholar] [CrossRef]
  7. Shuite, Z.; Demessie, A.; Abebe, T. Land use effect on soil quality and its implication to soil carbon storage in Aleta Chuko, Ethiopia. Geoderma Reg. 2025, 40, e917. [Google Scholar] [CrossRef]
  8. Chanu, L.J.; Purakayastha, T.J.; Bhaduri, D.; Ali, M.F.; Shivay, Y.S.; Saren, S.; Kumar, V.; Alhomrani, M.; Alamri, A.S. Assessment of soil biological quality under long-term rice-wheat cropping system: Effect of continuous vs. residual organic nutrient inputs. Soil. Tillage Res. 2025, 254, 106725. [Google Scholar] [CrossRef]
  9. Ishaq, H.K.; Grilli, E.; D’Ascoli, R.; Mastrocicco, M.; Rutigliano, A.F.; Marzaioli, R.; Strumia, S.; Coppola, E.; Malrieu, I.; Silva, F.; et al. Soil quality under rotational and conventional grazing in Mediterranean areas at desertification risk. J. Environ. Manag. 2025, 373, 123822. [Google Scholar] [CrossRef]
  10. Li, S.; Luo, D.; Wang, J.; Wei, Y.; Yuan, Z. Assessing soil quality in association with frozen ground in the source areas of the Yangtze and Yellow Rivers, Qinghai-Tibet Plateau. Geoderma 2025, 456, 117264. [Google Scholar] [CrossRef]
  11. Negiş, H.; Şeker, C.; Gümüş, O.; Erci, V. Establishment of a minimum dataset and soil quality assessment for multiple reclaimed areas on a wind-eroded region. Catena 2023, 229, 107208. [Google Scholar] [CrossRef]
  12. Tang, Z.; Zhang, W.; Chen, J.; Zhang, Y. Soil quality assessment and its response to water flow connectivity in different vegetation restoration types, eastern China. Catena 2024, 247, 108477. [Google Scholar] [CrossRef]
  13. Gan, F.; Shi, H.; Yan, Y.; Pu, J.; Dai, Q.; Gou, J.; Fan, Y. Soil quality assessment of karst trough valley under different bedrock strata dip and land-use types, based on a minimum data set. Catena 2024, 241, 108048. [Google Scholar] [CrossRef]
  14. Liu, Y.; Wang, P.; Yu, T.; Zang, H.; Zeng, Z.; Yang, Y. Manure replacement of chemical fertilizers can improve soil quality in the wheat-maize system. Appl. Soil Ecol. 2024, 200, 105453. [Google Scholar] [CrossRef]
  15. Peiyao, X.; Yuying, H.; Yaojun, L.; Chuxiong, D.; Wenqing, L.; Guangye, Z.; Taoxi, L.; Yichun, M.; Ming, L.; Yu, L.; et al. Mechanisms of land use change effects on soil quality in ancient terraces based on the minimum data set approach. Catena 2025, 254, 108990. [Google Scholar] [CrossRef]
  16. Feng, W.; Ai, J.; Sánchez-Rodríguez, A.R.; Li, S.; Zhang, W.; Yang, H.; Apostolakis, A.; Muenter, C.; Li, F.; Dippold, M.A.; et al. Depth-dependent patterns in soil organic C, enzymatic stochiometric ratio, and soil quality under conventional tillage and reduced tillage after 55-years. Agric. Ecosyst. Environ. 2025, 385, 109584. [Google Scholar] [CrossRef]
  17. Fasano, M.C.; Bich, G.A.; Castrillo, M.L.; Zapata, P.D. Assessing soil quality, the role of indigenous knowledge and biological indicators in novelle soil quality research. Environ. Sustain. Indic. 2025, 26, 100707. [Google Scholar] [CrossRef]
  18. Allek, A.; Viany Prieto, P.; Korys, K.A.; Rodrigues, A.F.; Latawiec, A.E.; Crouzeilles, R. How does forest restoration affect the recovery of soil quality? A global meta-analysis for tropical and temperate regions. Restor. Ecol. 2023, 31, e13747. [Google Scholar] [CrossRef]
  19. Macheroum, A.; Sayada, N.; Chenchouni, H. Restoration of soil quality and improvement of physicochemical properties through grazing exclusion in arid and semi-arid rangelands. Catena 2025, 249, 108646. [Google Scholar] [CrossRef]
  20. Belay, A.; Assen, M.; Abegaz, A. Soil quality dynamics in response to land-use management types and slope positions in northeastern highlands of Ethiopia. Environ. Sustain. Indic. 2025, 26, 100641. [Google Scholar] [CrossRef]
  21. Zheng, H.; Wang, L.; Peng, W.; Zhang, C.; Li, C.; Robinson, B.E.; Wu, X.; Kong, L.; Li, R.; Xiao, Y.; et al. Realizing the values of natural capital for inclusive, sustainable development: Informing China’s new ecological development strategy. Proc. Natl. Acad. Sci. USA 2019, 116, 8623–8628. [Google Scholar] [CrossRef]
  22. Wen, Z.; Zheng, H.; Zhao, H.; Ouyang, Z. The mediatory roles of species diversity and tree height diversity: Linking the impact of land-use intensity to soil erosion. Land Degrad. Dev. 2021, 32, 1127–1134. [Google Scholar] [CrossRef]
  23. Wen, Z.; Zhao, H.; Liu, L.; Ouyang, Z.Y.; Zheng, H.; Mi, H.X.; Li, Y.M. Effects of land use changes on soil water conservation in Hainan Island, China. J. Appl. Ecol. 2017, 28, 4025–4033. [Google Scholar]
  24. Zheng, H.; Ouyang, Z.Y.; Wang, X.K.; Miao, H.; Zhao, T.Q.; Peng, T.B. How different reforestation approaches affect red soil properties in southern China. Land Degrad. Dev. 2005, 16, 387–396. [Google Scholar] [CrossRef]
  25. Chen, C.; Yang, F.; Zhao, L.; Yao, H.; Wang, J.; Liu, H. Influences of different land use types on soil characteristics and availability in Karst area, Guizhou Province. Acta Agrestia Sin. 2014, 22, 1007–1013. [Google Scholar]
  26. Si, F.; Chen, B.; Wang, B.; Li, W.; Zhu, C.; Fu, J.; Yu, B.; Xu, G. Soil Quality Assessment and Influencing Factors of Different Land Use Types in Red Bed Desertification Regions: A Case Study of Nanxiong, China. Land 2024, 13, 1265. [Google Scholar] [CrossRef]
  27. Abuzaid, A.S.; Mazrou, Y.S.A.; El Baroudy, A.A.; Ding, Z.; Shokr, M.S. Multi-Indicator and Geospatial Based Approaches for Assessing Variation of Land Quality in Arid Agroecosystems. Sustainability 2022, 14, 5840. [Google Scholar] [CrossRef]
  28. Wen, Z.; Zheng, H.; Li, R.; Yang, Y.; Ouyang, Z. Plant functional groups modulate the effects of landscape diversity on natural predators. Agric. Ecosyst. Environ. 2025, 381, 109415. [Google Scholar] [CrossRef]
  29. Wickham, H.; Francois, R. dplyr: A Grammar of Data Manipulation. R Package Version 0.4.3. 2015. Available online: http://CRAN.R-project.org/package=dplyr (accessed on 9 May 2025).
  30. Kassambara, A. rstatix: Pipe-Friendly Framework for Basic Statistical Tests; CRAN: Contributed Packages; Comprehensive R Archive Network: Online, 2019. [Google Scholar]
  31. Harrell, F.E., Jr.; Harrell, M.F.E., Jr. Package ’Hmisc’; CRAN2018; Comprehensive R Archive Network: Online, 2019; pp. 235–236. [Google Scholar]
  32. Wickham, H. ggplot2. Wiley Interdiscip. Rev. Comput. Stat. 2011, 3, 180–185. [Google Scholar] [CrossRef]
  33. Wei, T.; Simko, V.; Levy, M.; Xie, Y.; Jin, Y.; Zemla, J. Package’corrplot’. Statistician 2017, 56, e24. [Google Scholar]
  34. Chen, C.; Liu, W.; Wu, J.; Jiang, X.; Zhu, X. Can intercropping with the cash crop help improve the soil physico-chemical properties of rubber plantations? Geoderma 2019, 335, 149–160. [Google Scholar] [CrossRef]
  35. Zhu, X.; Liu, W.; Jiang, X.J.; Wang, P.; Li, W. Effects of land-use changes on runoff and sediment yield: Implications for soil conservation and forest management in Xishuangbanna, Southwest China. Land. Degrad. Dev. 2018, 29, 2962–2974. [Google Scholar] [CrossRef]
  36. Wen, Z.; Zheng, H.; Smith, J.R.; Ouyang, Z. Plant functional diversity mediates indirect effects of land-use intensity on soil water conservation in the dry season of tropical areas. Forest Ecol. Manag. 2021, 480, 118646. [Google Scholar] [CrossRef]
  37. Liu, W.; Luo, Q.; Lu, H.; Wu, J.; Duan, W. The effect of litter layer on controlling surface runoff and erosion in rubber plantations on tropical mountain slopes, SW China. Catena 2017, 149, 167–175. [Google Scholar] [CrossRef]
  38. Sayer, E.J.; Baxendale, C.; Birkett, A.J.; Bréchet, L.M.; Castro, B.; Kerdraon-Byrne, D.; Lopez-Sangil, L.; Rodtassana, C.; Sveriges, L. Altered litter inputs modify carbon and nitrogen storage in soil organic matter in a lowland tropical forest. Biogeochemistry 2021, 156, 115–130. [Google Scholar] [CrossRef]
  39. Zhu, X.; Chen, C.; Wu, J.; Yang, J.; Zhang, W.; Zou, X.; Liu, W.; Jiang, X. Can intercrops improve soil water infiltrability and preferential flow in rubber-based agroforestry system? Soil. Tillage Res. 2019, 191, 327–339. [Google Scholar] [CrossRef]
  40. Wu, J.; Zeng, H.; Zhao, F.; Chen, C.; Liu, W.; Yang, B.; Zhang, W. Recognizing the role of plant species composition in the modification of soil nutrients and water in rubber agroforestry systems. Sci. Total Environ. 2020, 723, 138042. [Google Scholar] [CrossRef]
  41. Tambone, F.; Masseroli, A.; Beccarelli, P.; Breno, L.; Zuccolo, M.; Borgonovo, G.; Mazzini, S.; Golinelli, A.; Scaglia, B. Characterization of Litter and Topsoil Under Different Vegetation Cover by Using a Chemometric Approach. Forests 2025, 16, 1349. [Google Scholar] [CrossRef]
  42. Jiba, W.; Manyevere, A.; Mashamaite, C.V. The Impact of Ecological Restoration on Soil Quality in Humid Region Forest Habitats: A Systematic Review. Forests 2024, 15, 1941. [Google Scholar] [CrossRef]
  43. Zhu, X.; Liu, W.; Chen, J.; Bruijnzeel, L.A.; Mao, Z.; Yang, X.; Cardinael, R.; Meng, F.; Sidle, R.C.; Seitz, S.; et al. Reductions in water, soil and nutrient losses and pesticide pollution in agroforestry practices: A review of evidence and processes. Plant Soil. 2020, 453, 45–86. [Google Scholar] [CrossRef]
  44. Thorup-Kristensen, K. Effect of deep and shallow root systems on the dynamics of soil inorganic N during 3-year crop rotations. Plant Soil. 2006, 288, 233–248. [Google Scholar] [CrossRef]
  45. Yang, B.; Meng, X.; Singh, A.K.; Wang, P.; Song, L.; Zakari, S.; Liu, W. Intercrops improve surface water availability in rubber-based agroforestry systems. Agric. Ecosyst. Environ. 2020, 298, 106937. [Google Scholar] [CrossRef]
  46. Zheng, X.; Yuan, J.; Zhang, T.; Hao, F.; Jose, S.; Zhang, S. Soil Degradation and the Decline of Available Nitrogen and Phosphorus in Soils of the Main Forest Types in the Qinling Mountains of China. Forests 2017, 8, 460. [Google Scholar] [CrossRef]
  47. Zhang, P.; Lü, X.; Li, M.; Wu, T.; Jin, G. N limitation increases along a temperate forest succession: Evidences from leaf stoichiometry and nutrient resorption. J. Plant Ecol. 2022, 15, 1021–1035. [Google Scholar] [CrossRef]
  48. Valdespino, P.; Romualdo, R.; Cadenazzi, L.; Campo, J. Phosphorus cycling in primary and secondary seasonally dry tropical forests in Mexico. Ann. Forest Sci. 2009, 66, 107. [Google Scholar] [CrossRef]
  49. Hanyabui, E.; Obeng Apori, S.; Agyei Frimpong, K.; Atiah, K.; Abindaw, T.; Ali, M.; Yeboah Asiamah, J.; Byalebeka, J. Phosphorus sorption in tropical soils. AIMS Agric. Food 2020, 5, 599–616. [Google Scholar] [CrossRef]
  50. Wen, Z.; Wu, J.; Yang, Y.; Li, R.; Ouyang, Z.; Zheng, H. Implementing intercropping maintains soil water balance while enhancing multiple ecosystem services. Catena 2022, 217, 106426. [Google Scholar] [CrossRef]
  51. Yang, B.; Meng, X.; Zhu, X.; Zakari, S.; Singh, A.K.; Bibi, F.; Mei, N.; Song, L.; Liu, W. Coffee performs better than amomum as a candidate in the rubber agroforestry system: Insights from water relations. Agr. Water Manag. 2021, 244, 106593. [Google Scholar] [CrossRef]
  52. Mori, T.; Lu, X.; Aoyagi, R.; Mo, J. Reconsidering the phosphorus limitation of soil microbial activity in tropical forests. Funct. Ecol. 2018, 32, 1145–1154. [Google Scholar] [CrossRef]
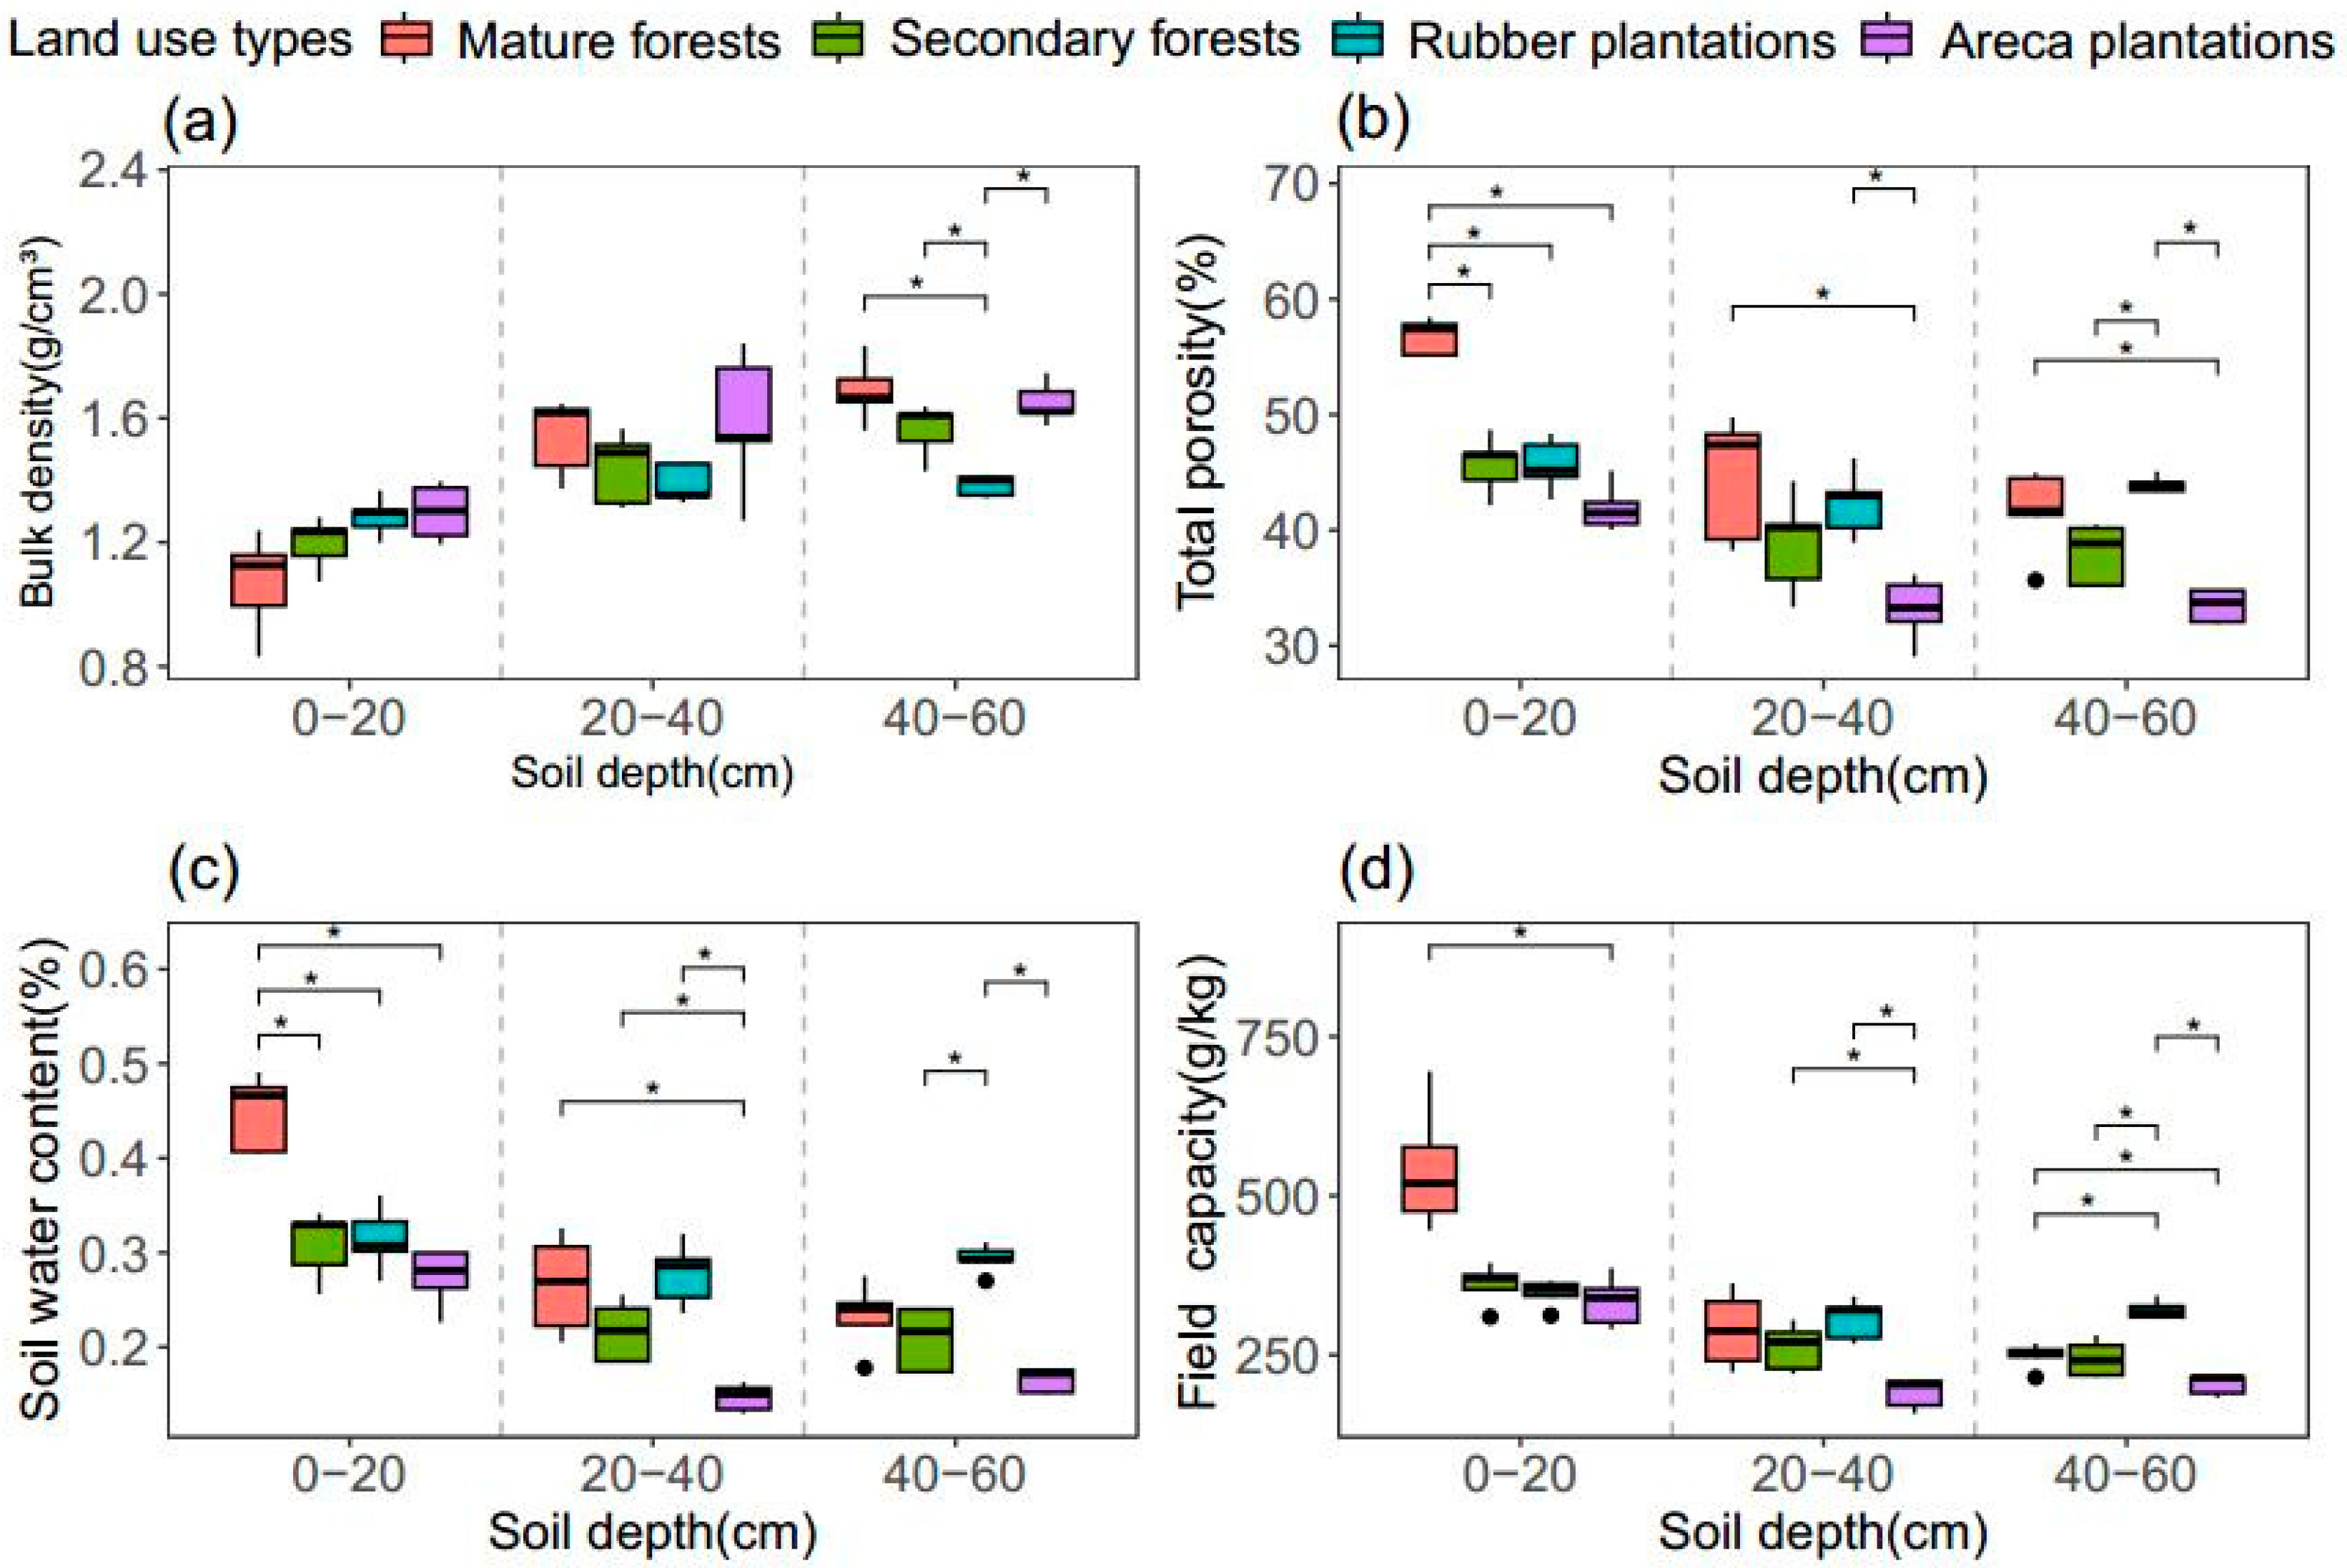
Figure 1. Variations in soil physical properties across land-use types at distinct soil depths. * p < 0.05. (a) Bulk density (BD) across land-use types at distinct soil depths; (b) Total porosity (TPor) across land-use types at distinct soil depths; (c) Soil water content (SWC) across land-use types at distinct soil depths; (d) Field capacity (FC) across land-use types at distinct soil depths.
Land 14 02010 g001
Figure 2. Variations in soil chemical properties across land-use types at distinct soil depths. * p < 0.05. (a) Soil organic matter (SOM) across land-use types at distinct soil depths; (b) Total nitrogen (TN) across land-use types at distinct soil depths; (c) Alkali-hydrolysable nitrogen (AN) across land-use types at distinct soil depths; (d) Total phosphorus (TP) across land-use types at distinct soil depths; (e) Available phosphorus (AP) across land-use types at distinct soil depths; (f) Available potassium (AK) across land-use types at distinct soil depths.
Land 14 02010 g002
Figure 3. Variations in soil quality index (SQI) among different land-use types across soil depths. * p < 0.05.
Land 14 02010 g003
Figure 4. Limiting factors impeding soil quality enhancement (a) across regional ecosystems and the dotted line represents severe limiting factors ( M j ≥ 30%); (b) within specific land-use types. BD, bulk density; TPor, total porosity; SWC, water content; FC, field capacity; SOM, soil organic matter; TN, total nitrogen; AN, alkali-hydrolyzable nitrogen; NO3-N, nitrate nitrogen; TP, total phosphorus; AP, available phosphorus; AK, available potassium; SAK, slowly available potassium. The yellow colors line represents physical properties and the bule line represents chemical properties.
Land 14 02010 g004
Disclaimer/Publisher’s Note: The statements, opinions and data contained in all publications are solely those of the individual author(s) and contributor(s) and not of MDPI and/or the editor(s). MDPI and/or the editor(s) disclaim responsibility for any injury to people or property resulting from any ideas, methods, instructions or products referred to in the content.