1. Introduction
Global warming has become one of the most pressing environmental challenges of the 21st century [
1], primarily driven by the continuous increase in greenhouse gas emissions [
2], which in turn has led to ecosystem degradation, disruption of the carbon cycle, and a series of related environmental issues [
3]. As a key component of the global carbon cycle [
4] terrestrial ecosystems play a critical role in achieving the goals of carbon peaking and carbon neutrality [
5,
6]. Studies have shown that land use/land cover (LULC) change is one of the main drivers of ecosystem function degradation [
4], and it significantly affects the spatial pattern of terrestrial carbon storage. However, the inherent complexity of LULC transitions adds uncertainty to both the magnitude and spatial patterns of carbon storage dynamics [
7].
Although numerous studies have explored the impacts of LULC change on carbon storage across various scales [
8,
9,
10], most have focused on macroscopic spatial patterns, lacking systematic identification and quantitative analysis of how anthropogenic processes shape carbon storage under complex LULC transitions. This gap is particularly evident in high-groundwater-level coal resource-based cities (HGCRBCs), where in addition to conventional urban expansion, coal mining and land reclamation—representing typical human disturbances—exert significant and unique influences on carbon storage dynamics [
11,
12]. However, current research still falls short in evaluating mining disturbances, reclamation responses, and their cumulative carbon effects, underscoring the need for an integrated modeling framework to capture these coupled mechanisms.
In terms of carbon storage assessment, the Integrated Valuation of Ecosystem Services and Tradeoffs (InVEST) model is widely recognized for its simplicity and applicability, and has been applied across global, regional, urban, and mining-area scales [
13,
14]. Simulating future land use patterns enables effective forecasting of the spatiotemporal evolution of terrestrial carbon storage, thus supporting urban planning, resource management, and ecological protection [
15,
16]. To achieve this, various land use change models have been developed, such as CA-Markov [
17], CLUE-S [
18], and FLUS [
19]. While these models perform well in spatial simulation, they remain limited in capturing driving mechanisms and simulating patch-level land use dynamics [
20,
21]. In contrast, the PLUS model enhances simulation accuracy by incorporating a patch-generation mechanism and random forest algorithm, effectively identifying drivers of land expansion [
22,
23]. However, simulations based solely on historical trends often fail to meet the demands of multi-objective land management for the future. Hence, integration with optimization models is necessary to improve the scientific robustness and foresight of simulation outcomes. Multi-Objective Programming (MOP), as an effective optimization tool, helps reconcile ecological conservation and economic development by balancing constraints across different land use types to achieve optimal land allocation [
24].
In HGCRBCs, land use simulation presents even greater complexity [
25]. Compared with other cities, carbon storage variation in these areas is influenced not only by urban expansion, but also by multiple interacting factors such as mining phases, reclamation practices, geological conditions, and policy orientations [
26]. However, most existing studies still rely on a two-model coupling of PLUS + InVEST to assess carbon storage in coal resource–based cities; because PLUS fundamentally simulates evolution via land-transition probabilities, it cannot explicitly represent mining-induced surface disturbances—particularly in HGCRBCs—making it difficult to accurately characterize and predict the future land use impacts of mining [
10,
27]. The Probability Integral Method (PIM), widely used in subsidence prediction for underground coal mining, offers a scientific means of quantitatively predicting rock and surface movement patterns in mining subsidence areas [
28]. Incorporating the PIM model can significantly enhance the accuracy of land use simulations in HGCRBCs.
Building upon these research advances and gaps, this study focuses on three HGCRBCs in Shandong Province—Jining, Zaozhuang, and Heze. It integrates the InVEST, PLUS, MOP, and PIM models to comprehensively assess the impact of LULC change and its driving mechanisms on the spatiotemporal evolution of carbon storage, while simulating future carbon storage trajectories under different development scenarios. Specifically, the study aims to: (1) analyze the LULC changes in HGCRBCs from 2000 to 2020 and their impacts on carbon storage; (2) identify and quantify the key processes driving LULC transitions, revealing how different drivers affect carbon storage; and (3) simulate the impact of mining and reclamation under 2030 scenarios (economic development priority vs. ecological protection priority), providing scientific guidance for carbon management and land use optimization in HGCRBCs.
3. Result
3.1. LULC Dynamics from 2000 to 2020
3.1.1. Spatiotemporal Characteristics of LULC Change
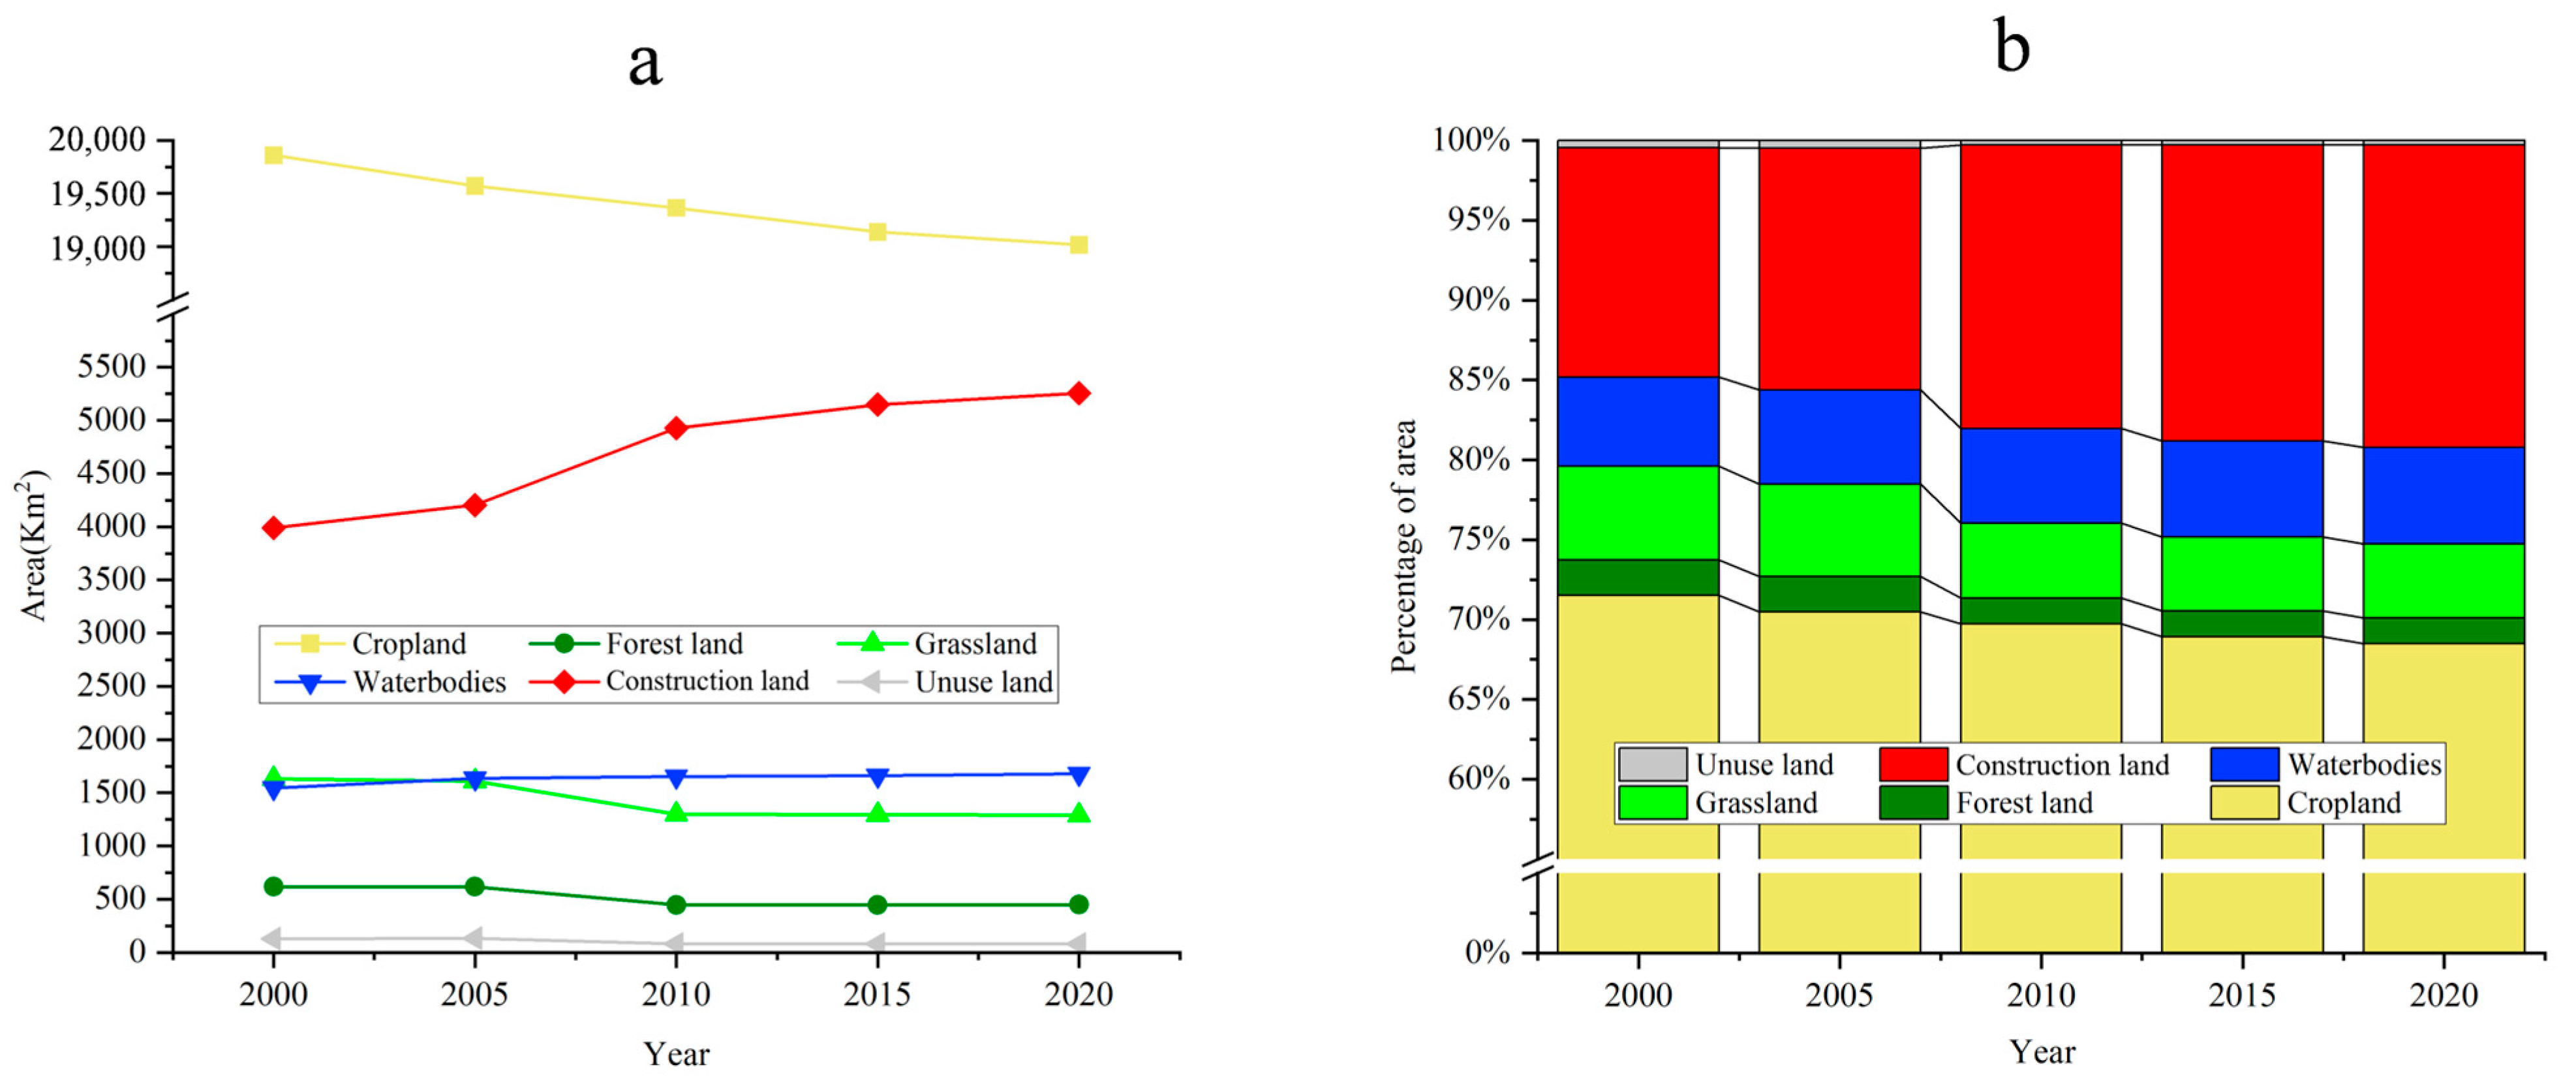
Based on the statistical analysis of land use/land cover (LULC) data for five time points between 2000 and 2020 (
Figure 5,
Table S6), the results show that cropland has consistently been the dominant land type in the study area, accounting for over 65% of the total area. However, it has exhibited a continuous decline, with its area decreasing from 19,858.55 km
2 in 2000 to 19,016.63 km
2 in 2020, and its proportion dropping from 71.51% to 68.48%. In contrast, construction land has continued to expand, increasing from 3988.71 km
2 to 5257.36 km
2 over the same period, with its share rising from 14.36% to 18.93%, although the rate of expansion has gradually slowed.
The most notable changes in forest land and grassland occurred between 2005 and 2010, when forest land decreased from 617.62 km2 to 448.09 km2, and grassland from 1609.49 km2 to 1298.13 km2. Aside from this period, both land types remained relatively stable across the other years.
Waterbodies showed a sustained increase over the 20-year period, expanding from 1545.13 km2 in 2000 to 1678.34 km2 in 2020, representing a net growth of 133.22 km2. Notably, although mining areas account for only 12.08% of the total area, they contributed 29.31% of the total increase in waterbody area.
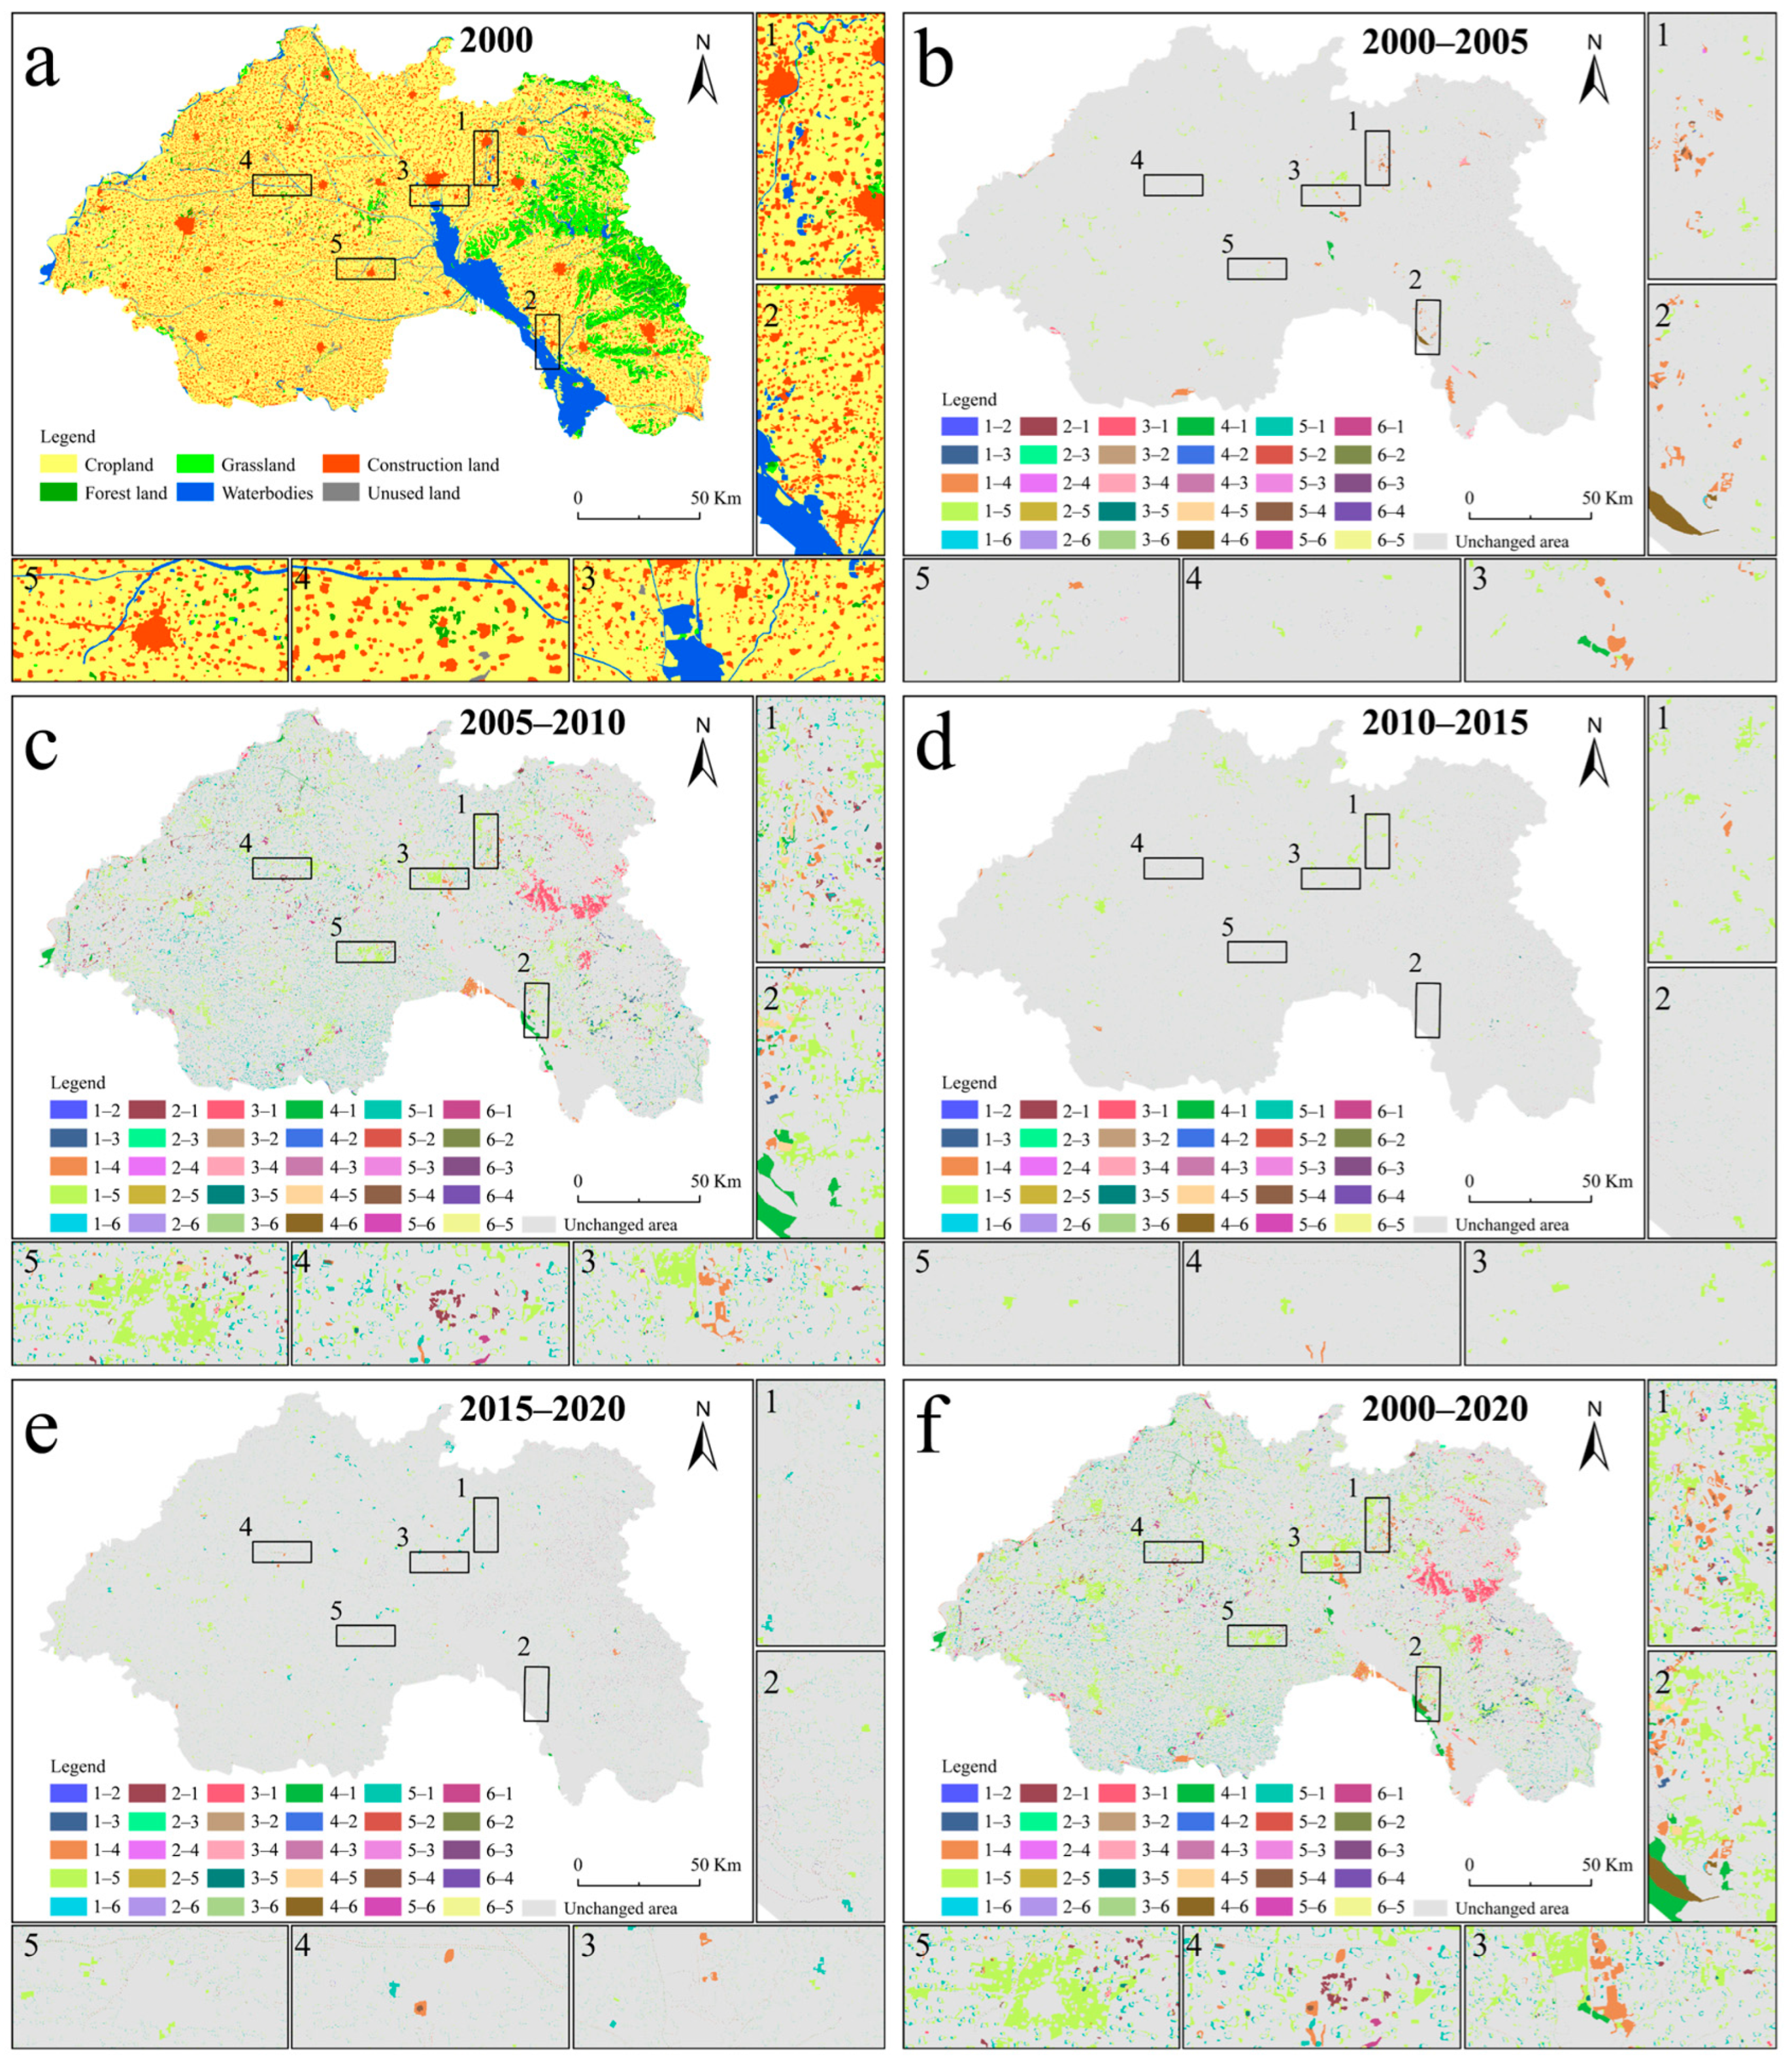
As shown in
Figure 6,
Tables S5 and S7, over the past two decades, urban boundary expansion, ecological restoration, and mining activities have significantly influenced the patterns of land use/land cover (LULC). A total of 4364.33 km
2 of land in the study area underwent transformation, accounting for 15.71% of the total area.
Among these changes, the conversion of cropland to waterbodies and construction land was particularly notable, with 279.12 km2 and 1981.35 km2 of cropland, respectively, transitioning into these categories. These figures represent 12.05% and 85.55% of the total cropland loss. The replenishment of cropland mainly originated from grassland and construction land, contributing 20.16% and 56.99% of the newly added cropland area, respectively.
In addition to cropland, grassland also experienced a degree of transformation, with 25.45 km2 converted to waterbodies, accounting for 6.08% of total grassland loss, and another 78.17 km2 converted to construction land, representing 18.67%. Unused land was mainly transformed into cropland and construction land, which accounted for 21.98% and 47.79% of its total loss area, respectively.
3.1.2. Contributions of Driving Factors to LULC Expansion Based on the PLUS Model
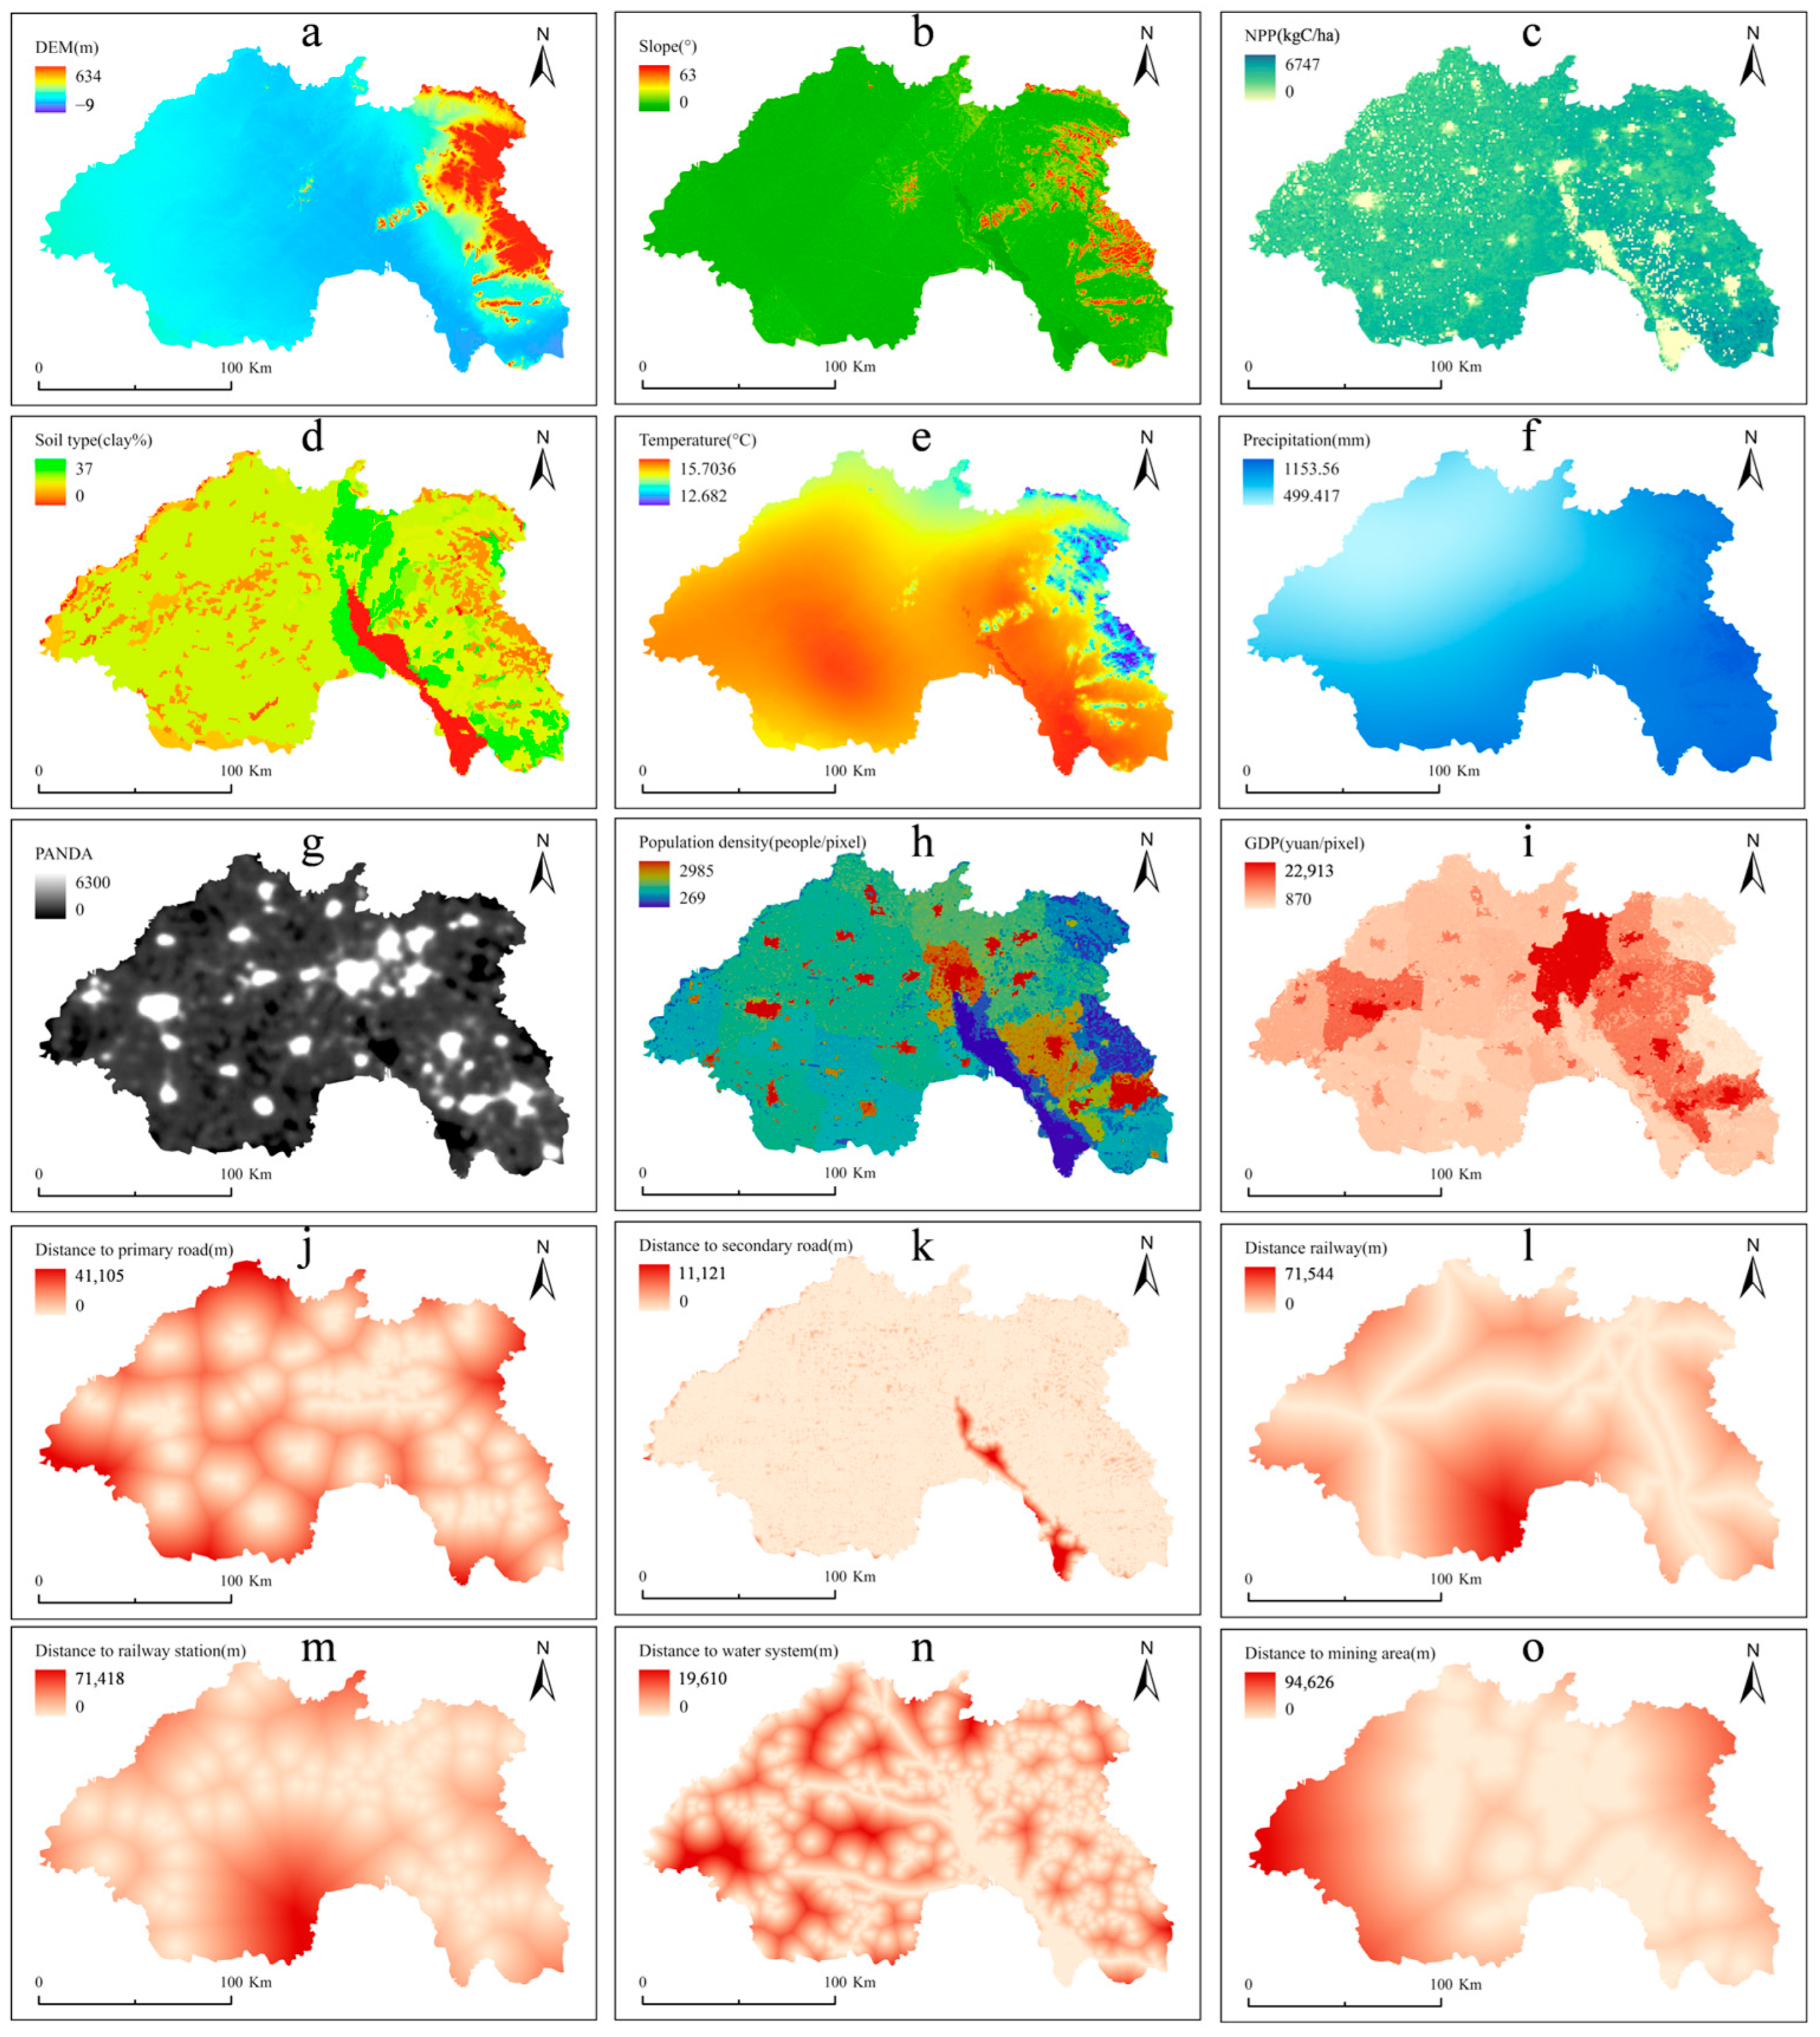
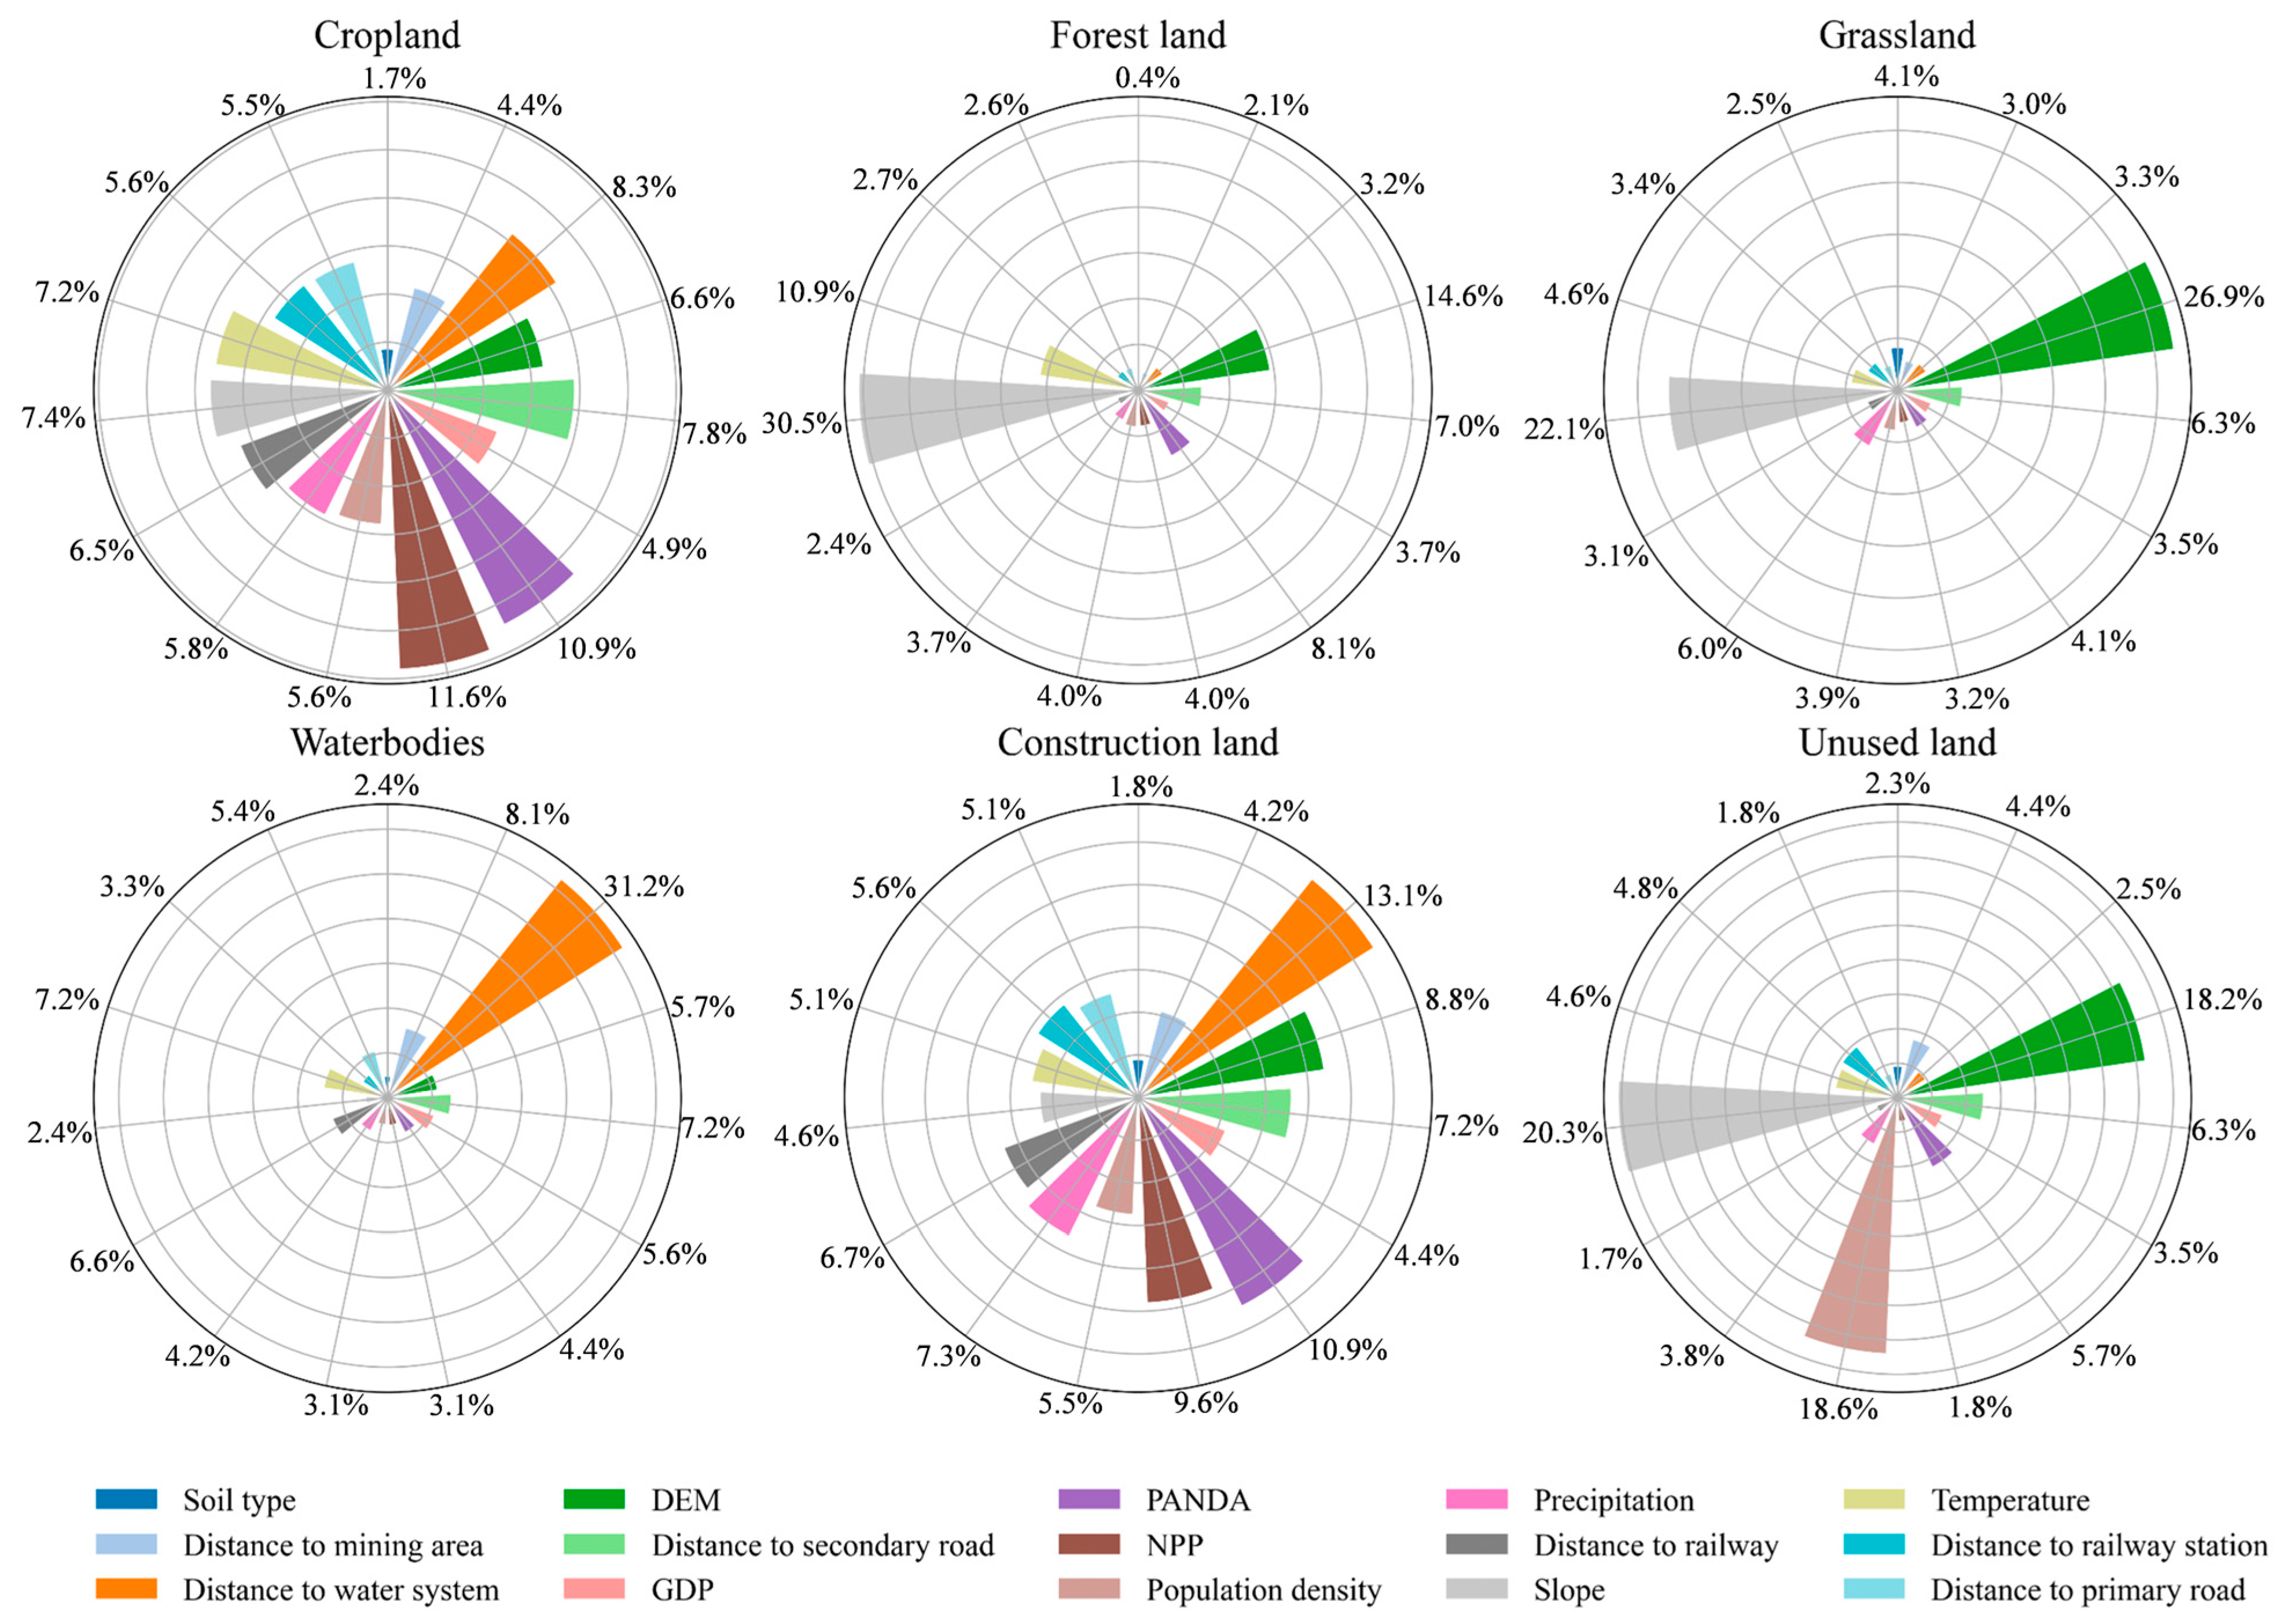
Based on the LEAS module of the PLUS model, this study quantified the relative contributions of various driving factors to the expansion of different land use/land cover (LULC) types from 2000 to 2020 (
Figure 7). The results reveal clear differences in the dominant drivers of each LULC category.
Natural topographic conditions play a critical role in the formation and maintenance of forest lands and grasslands. Specifically, slope contributes the most to forest land change, accounting for 30.54%—the highest among all driving factors—and also contributes 22.08% to grassland change. Additionally, topographic relief (DEM) has a significant impact on grassland (26.91%) and forest land (14.60%) transitions, suggesting that areas with complex terrain are more favorable for the preservation and expansion of natural vegetation, while also serving as a physical barrier to urban sprawl. Changes in water bodies are primarily driven by hydrological and geographical factors, with distance to rivers contributing 31.24%—the most influential factor. Furthermore, distance to mining areas also shows a notable effect, contributing 8.11% to water body changes, ranking second only to distance to rivers. This highlights a strong spatial coupling between mining distribution and waterbody patterns. In high-groundwater mining areas, coal extraction often induces surface subsidence and geological disturbances, leading to groundwater overflow and the formation of surface water bodies.
Regarding changes in construction land, factors associated with human activity intensity contribute more significantly. For instance, the PANDA index (nighttime light intensity) and population density account for 10.91% and 9.63%, respectively, indicating the dominant role of socio-economic factors in driving urban expansion. In addition, proximity to waterbodies (13.13%), railways (7.27%), major roads (5.08%), and railway stations (5.60%) also facilitates the conversion of land into urban areas, highlighting the importance of transportation accessibility and resource proximity in urban land development.
For cropland dynamics, NPP (11.63%) and the PANDA index (10.90%) exhibit high contributions, indicating that cropland change is jointly influenced by natural productivity and socio-economic factors.
Unused land is subject to a combination of multiple driving factors. The main contributors include DEM (18.19%), slope (20.28%), and population density (18.55%), suggesting that unused land is typically distributed in areas with higher elevation, steeper slopes, and lower population density—conditions that collectively constrain development potential due to both natural and social limitations.
3.2. Dynamic Changes in Carbon Storage from 2000 to 2020
3.2.1. Spatiotemporal Variation of Carbon Storage
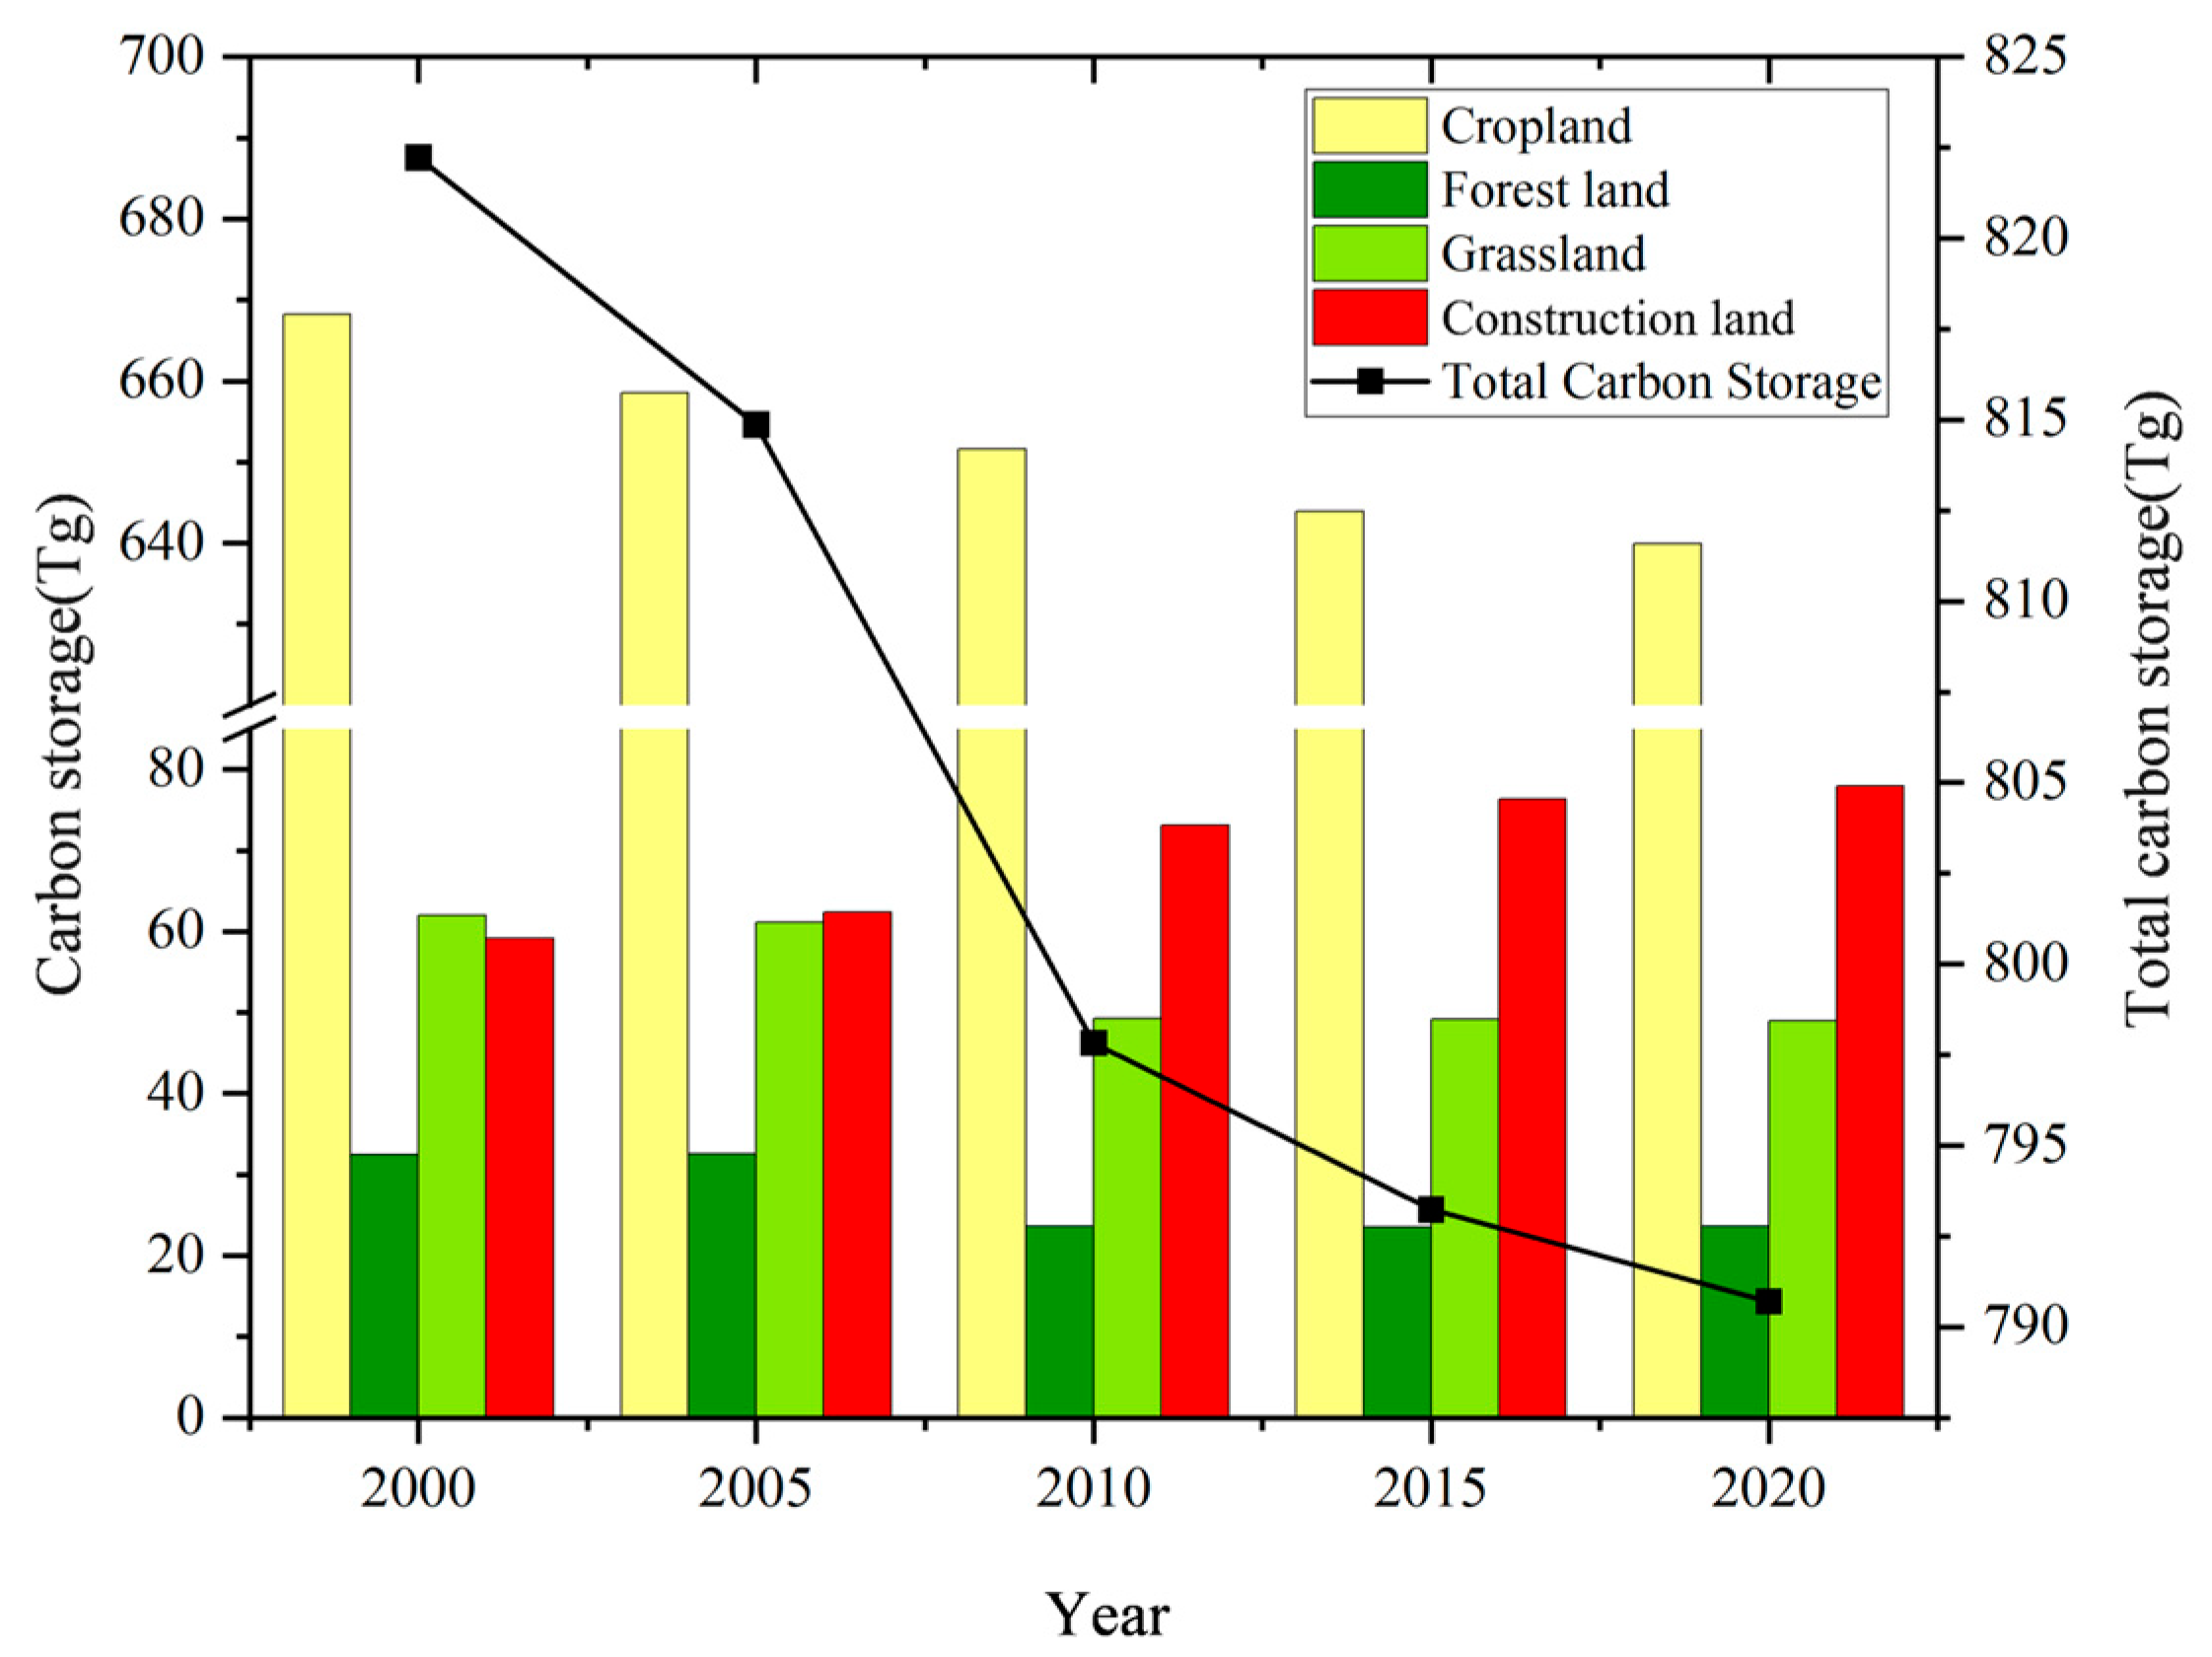
Over the past two decades, the total carbon storage in the study area has shown a declining trend, although the rate of decline has slowed over time (
Figure 8,
Table S8). Overall, the cumulative loss of carbon storage amounted to 31.53 Tg. The period from 2000 to 2010 experienced the most significant reduction, with a loss of 24.40 Tg, accounting for 77.39% of the total carbon loss. Among the different land use types, cropland contributed the most to this decline, with its carbon loss representing 89.86% of the total carbon storage reduction.
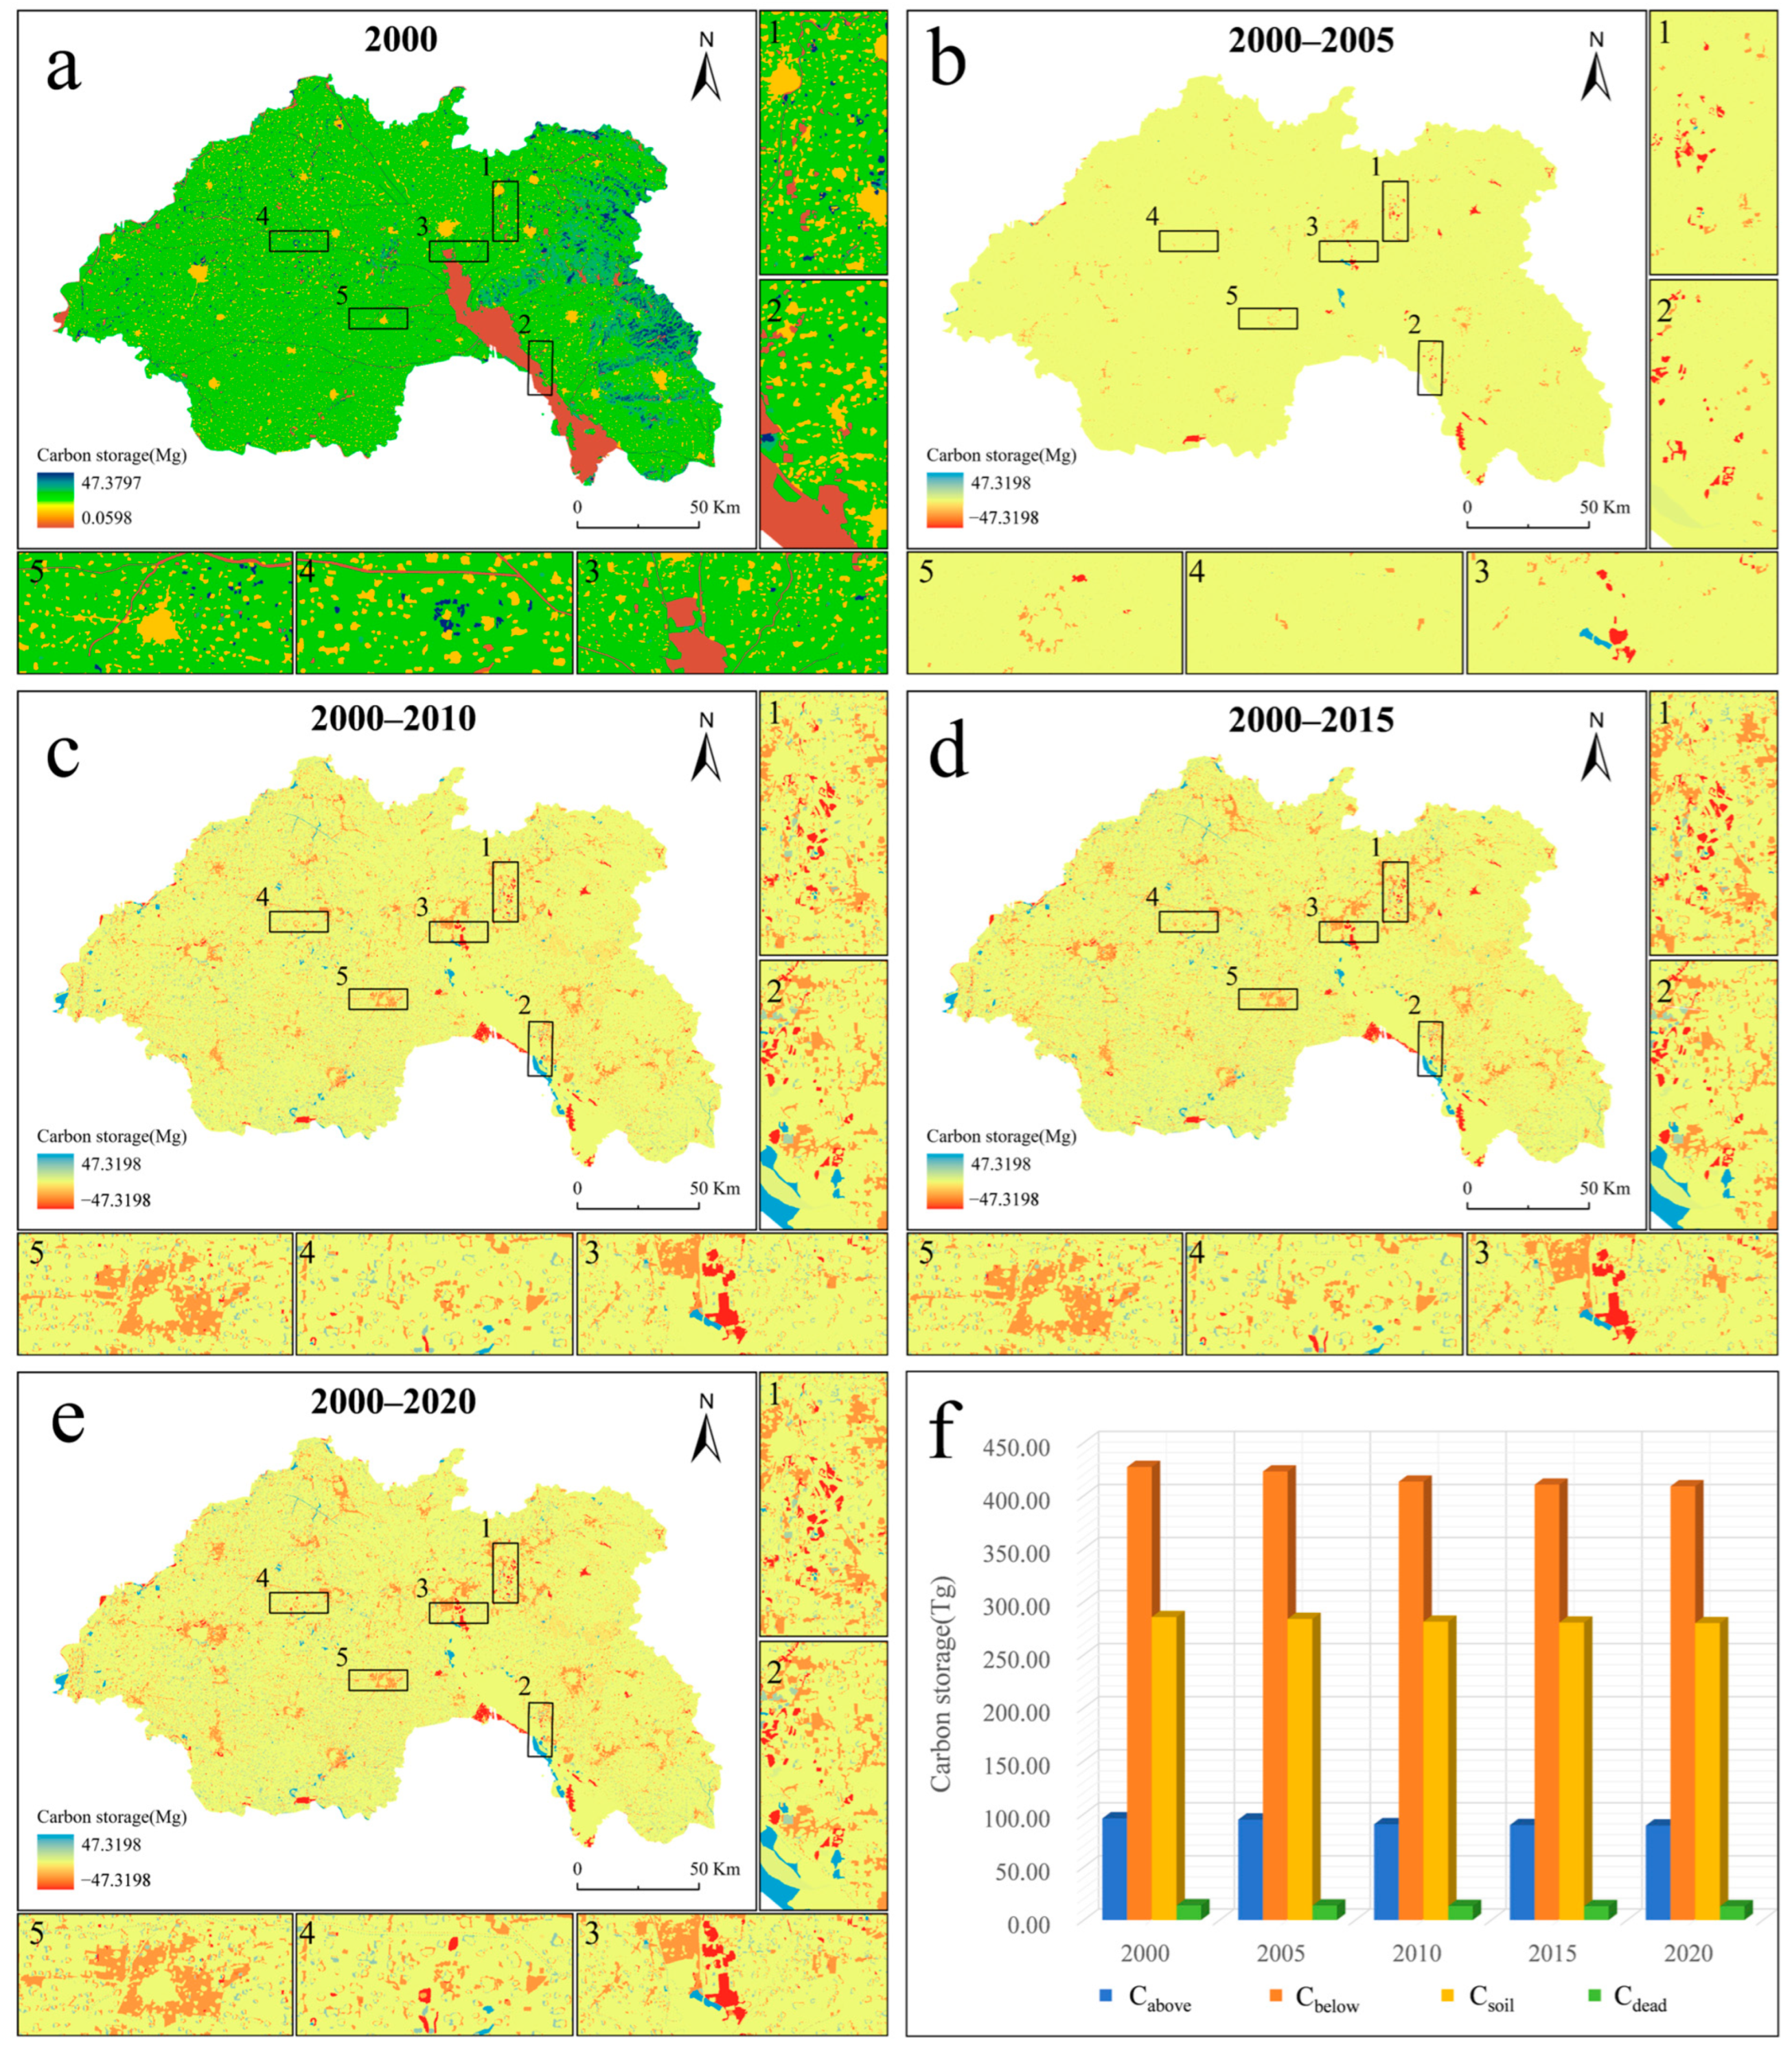
As shown in
Figure 9, areas with high carbon storage in the study region are mainly distributed in the eastern parts, corresponding to regions dominated by forest land and grassland, which aligns closely with the spatial pattern of land use. In contrast, areas with the lowest carbon storage are primarily concentrated in the southern part of the region. Among the four carbon pools, the most significant decreases occurred in the aboveground biomass and belowground biomass pools, accounting for 21.40% and 57.86% of the total carbon loss, respectively. This change is mainly attributed to the reduction in cropland area across the study area.
3.2.2. Response of Carbon Storage Change to LULC Transitions
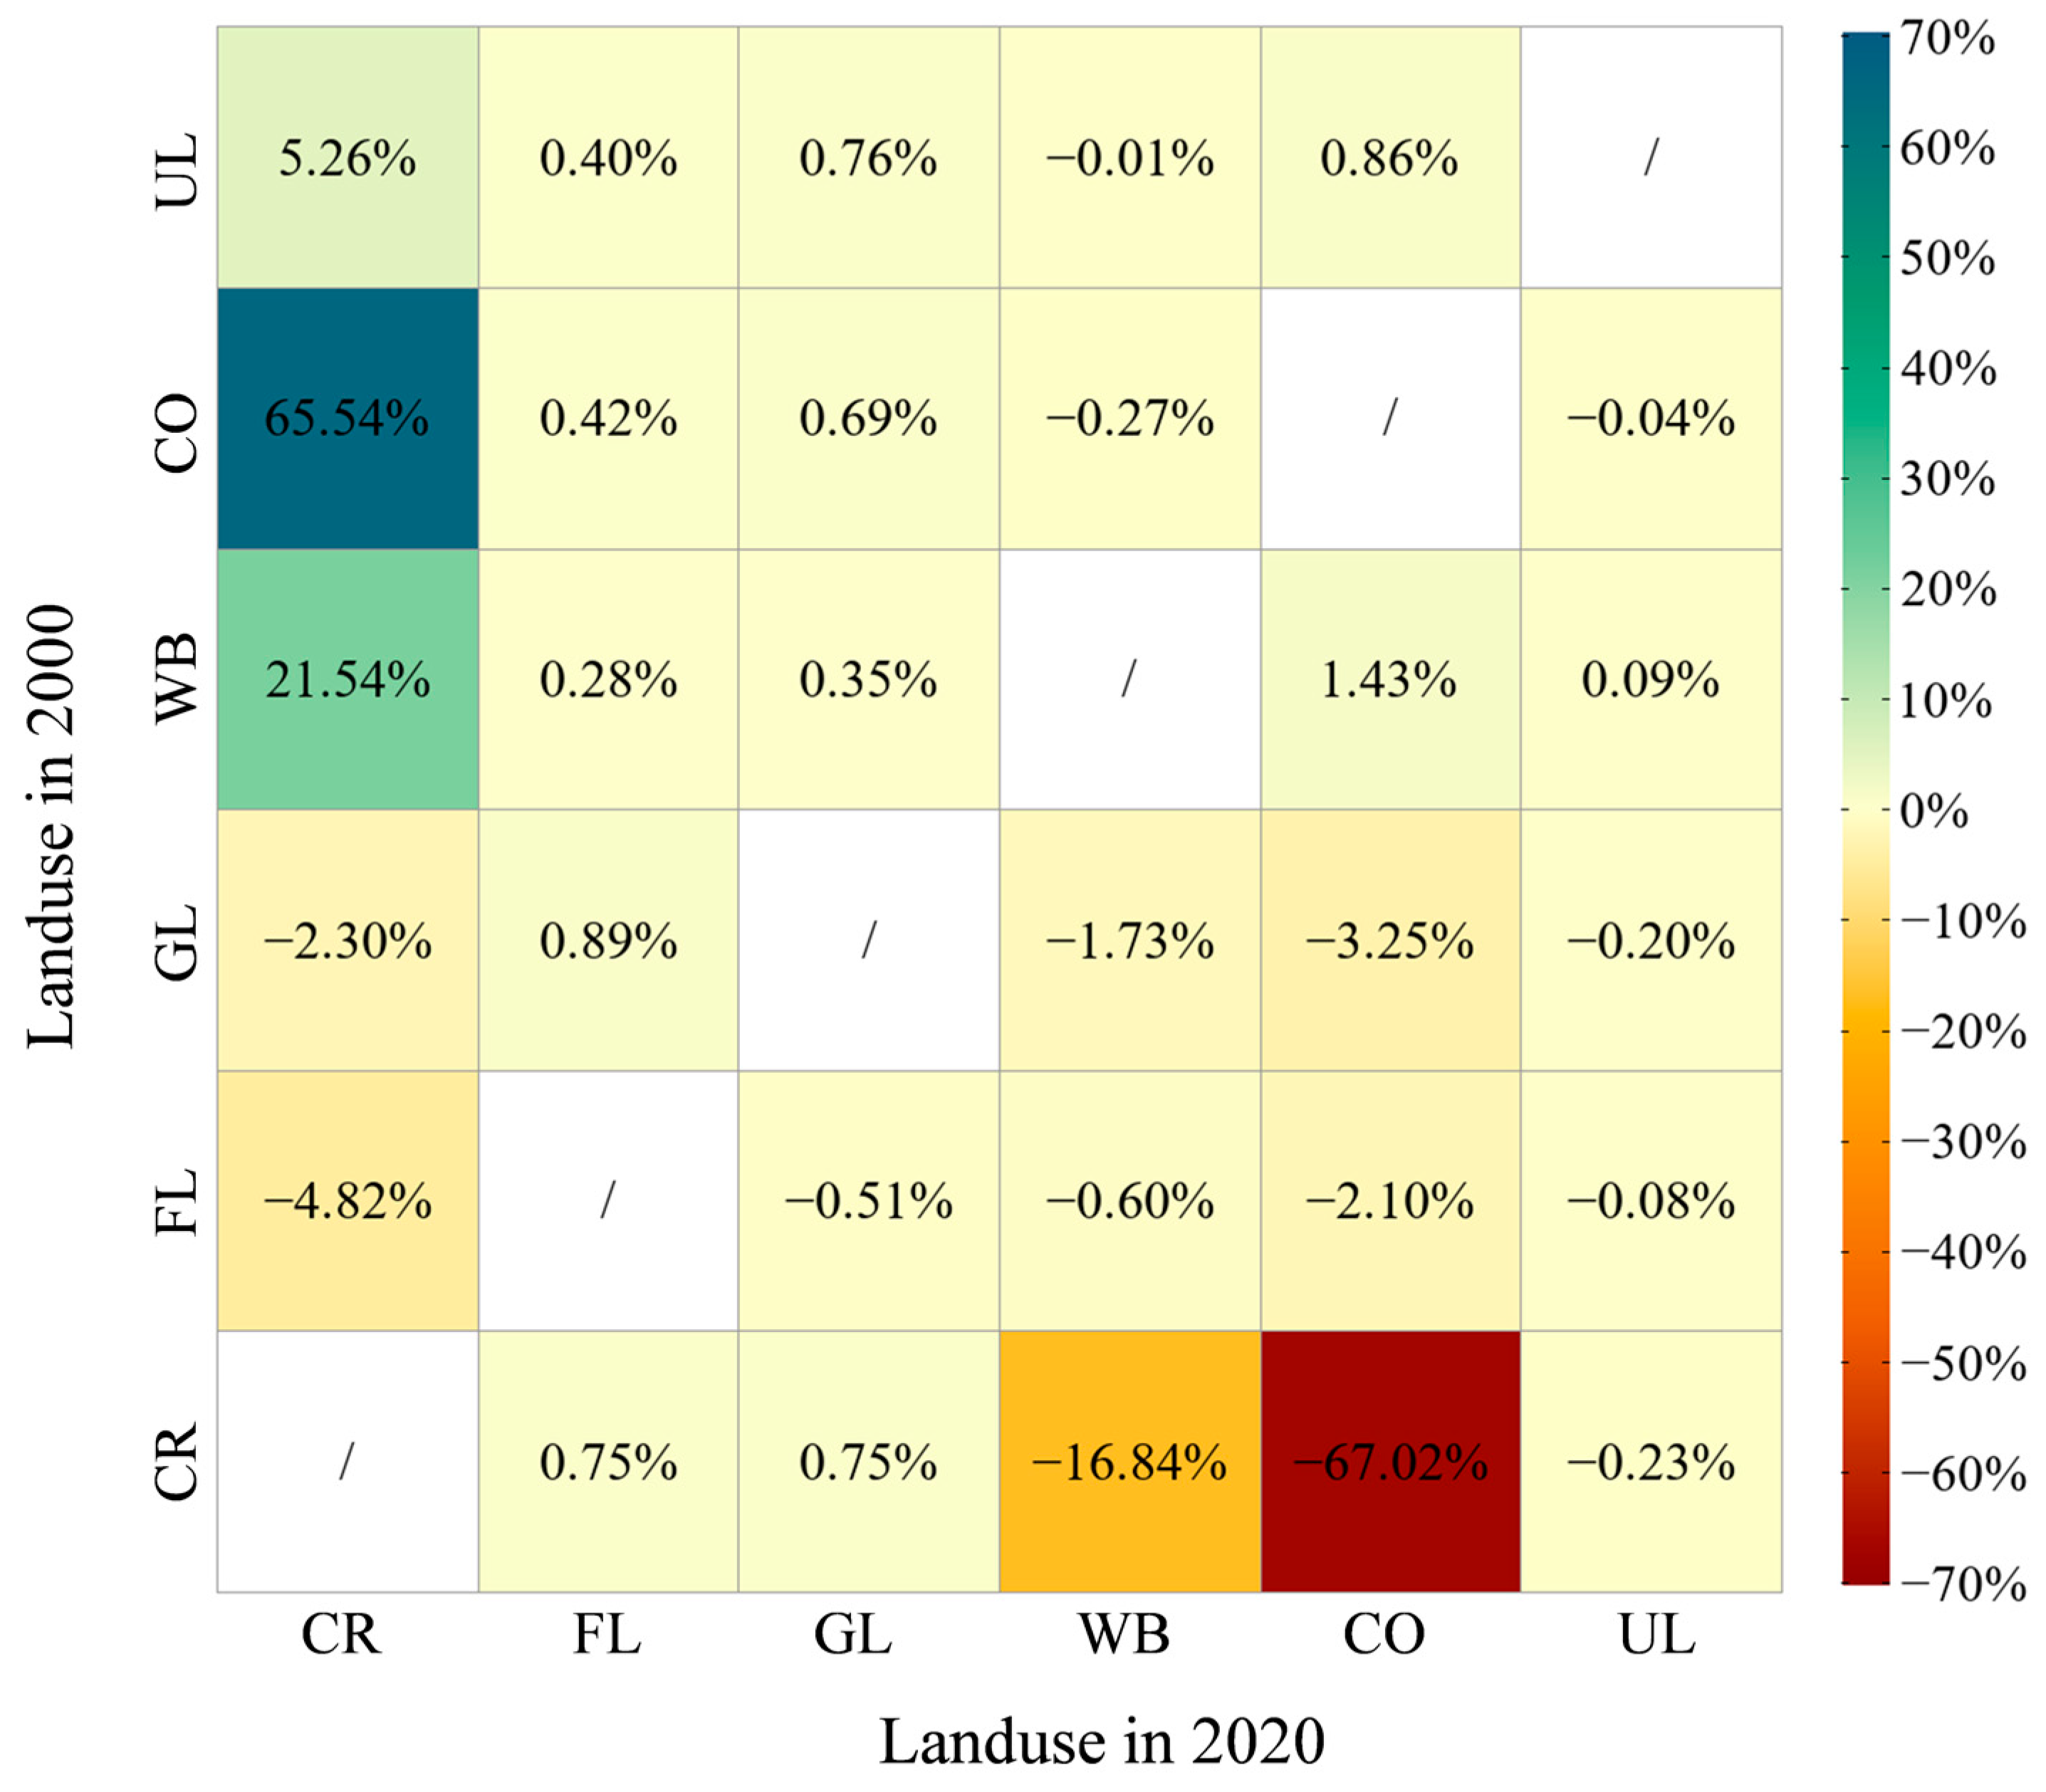
To investigate the response mechanism of carbon storage to land use/land cover (LULC) changes, this study analyzed the impact of land transitions on carbon storage from 2000 to 2020. As shown in
Figure 10, the results indicate that different types of land transitions have significantly different effects on carbon storage gains and losses. The cumulative positive impact of LULC transitions on carbon storage amounted to 24.15 Tg, with the conversion of construction land to cropland contributing the most—accounting for 65.54% of the total positive impact—followed by the conversion of water bodies to cropland (21.54%) and unused land to cropland (5.26%). Meanwhile, the cumulative negative impact of LULC changes on carbon storage reached 55.67 Tg. Among these, the conversion of cropland to construction land contributed the most to carbon loss, accounting for 67.02%, followed by the conversion of cropland to water bodies (16.84%) and forest land to cropland (4.82%).
3.2.3. Analysis of Differences in Carbon Storage Changes Between Mining and Non-Mining Areas
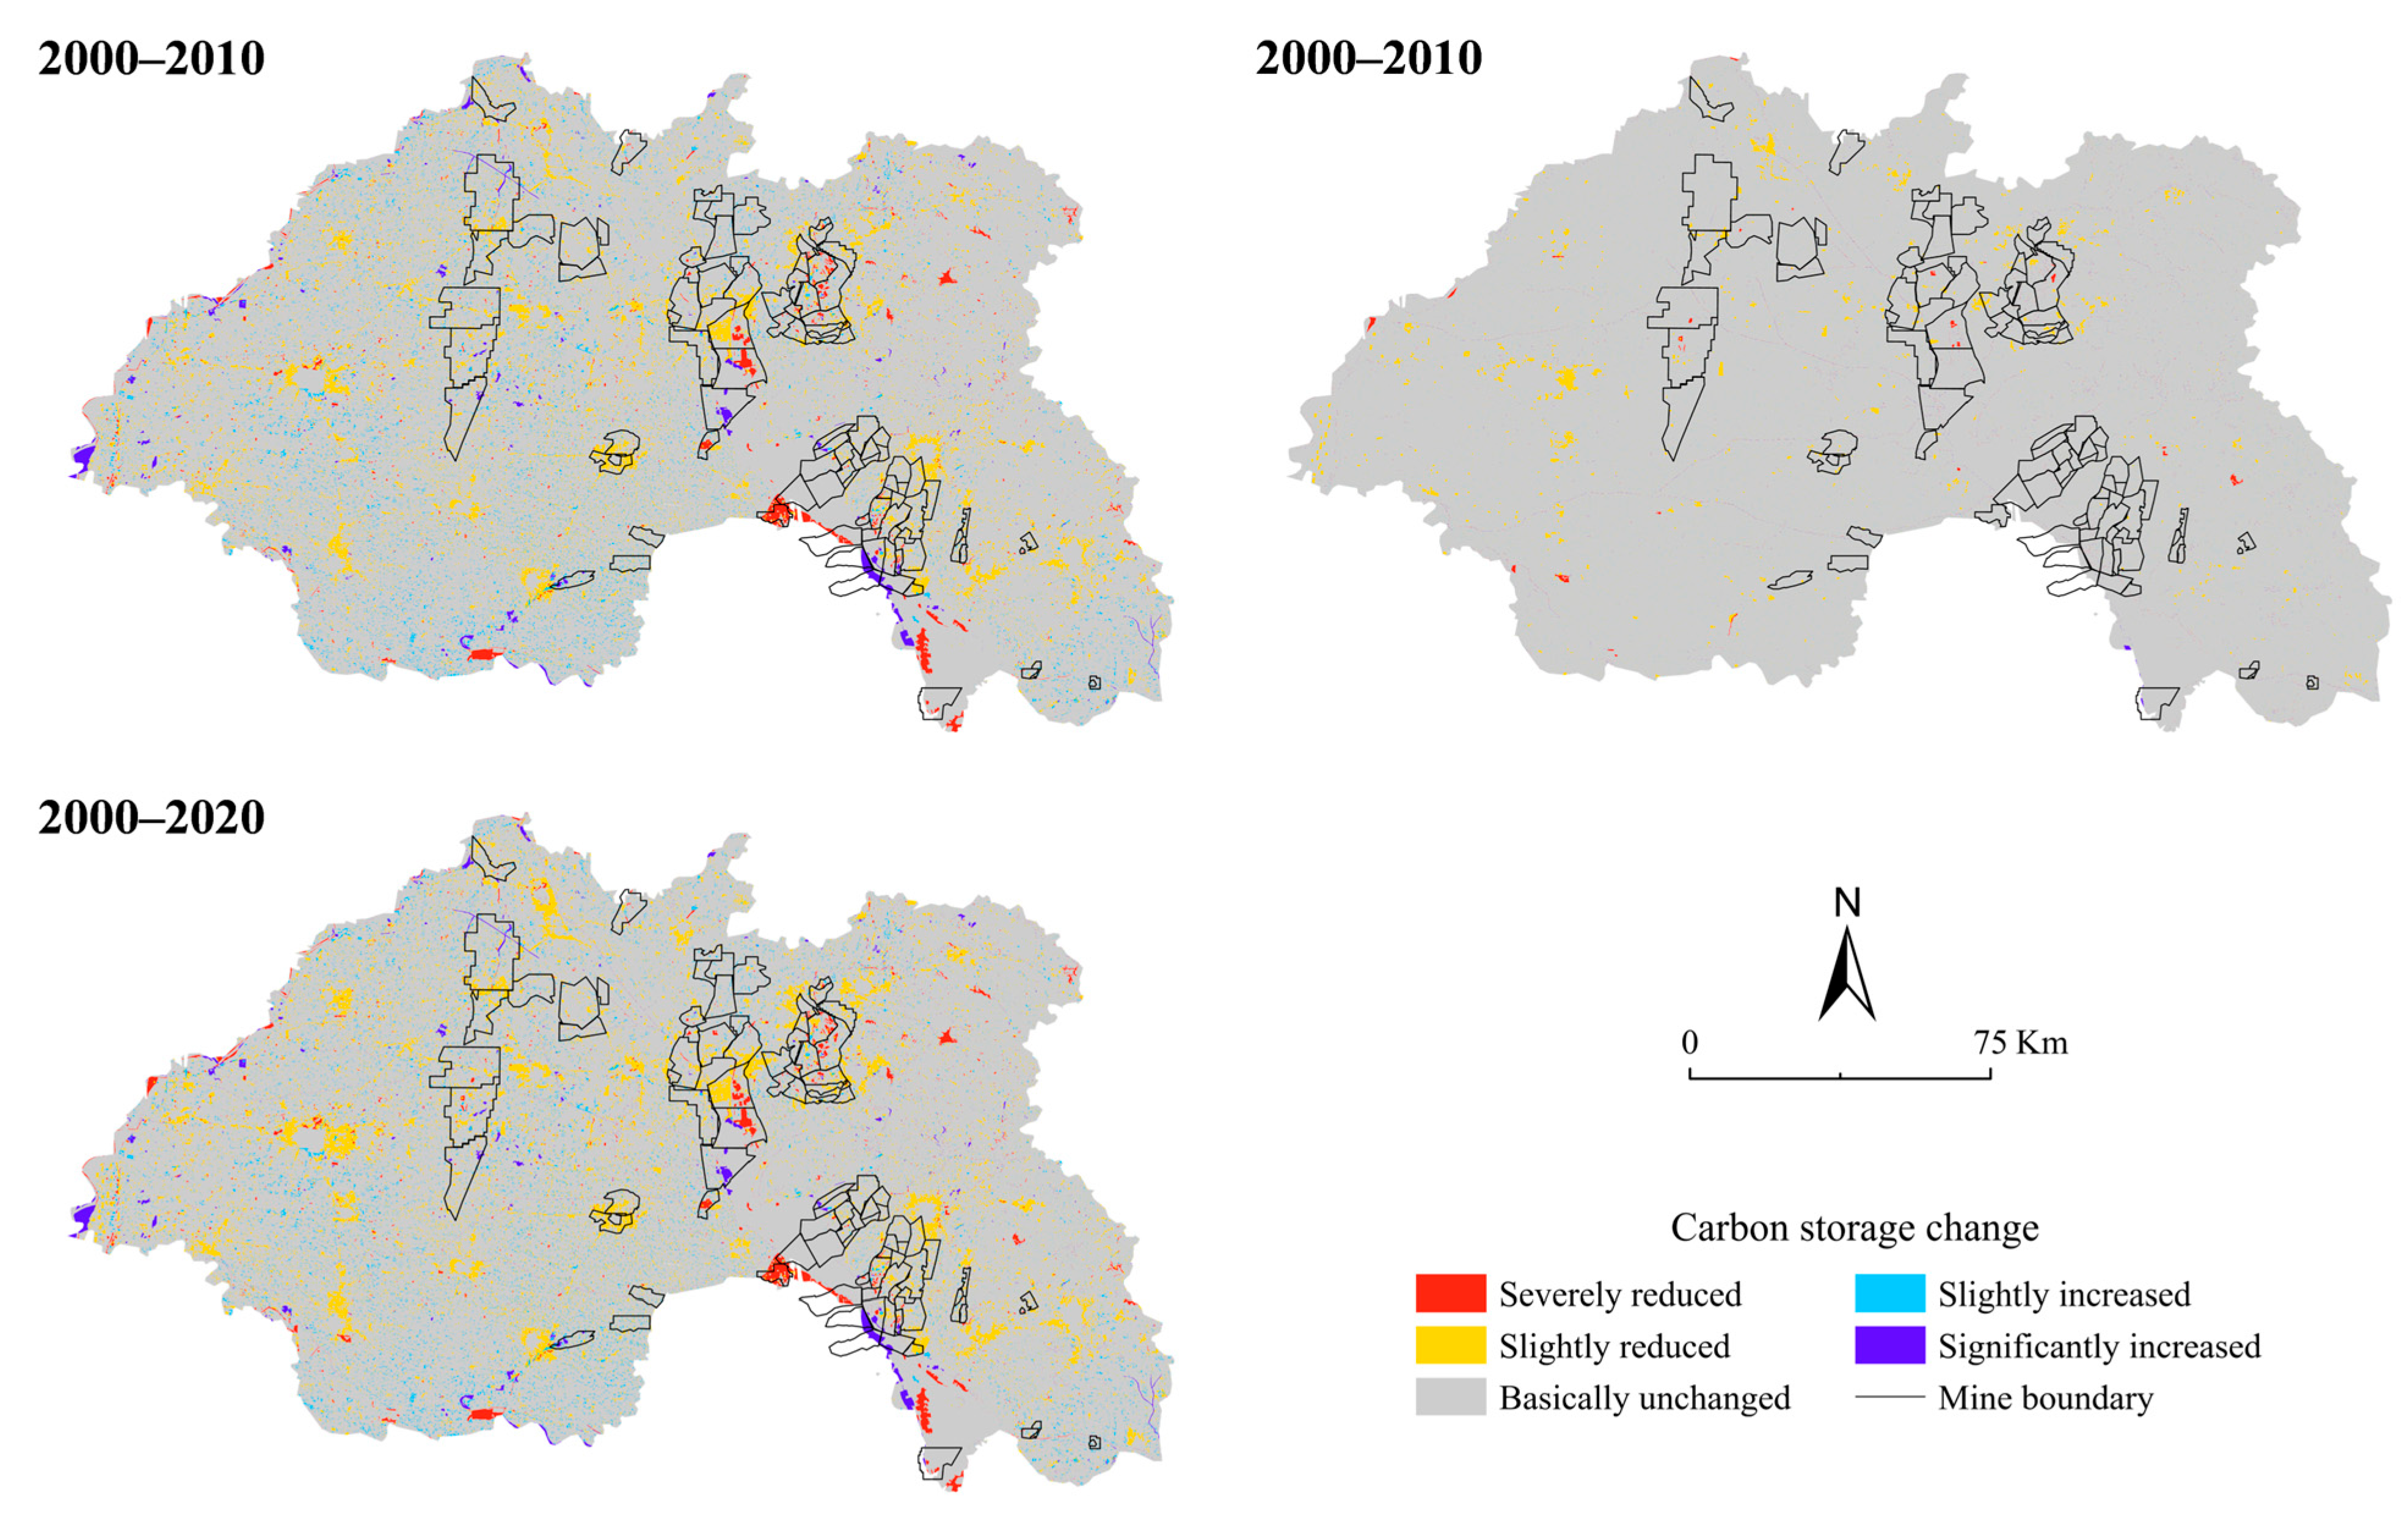
To more comprehensively analyze the characteristics of carbon storage changes within and outside mining areas, this study divided the research period into two stages: 2000–2010 and 2010–2020 (
Figure 11,
Table S9). Overall, the carbon storage exhibited a significant downward trend from 2000 to 2010, with a total reduction of 24.40 Tg, accounting for 77.40% of the total carbon loss over the 20-year period. In contrast, the rate of carbon storage loss slowed during 2010–2020, with a total decrease of 7.13 Tg.
Spatially, the changes in carbon storage from 2000 to 2020 were dominated by areas with “no significant change,” which accounted for over 85% of the study area, indicating that land use and ecological conditions remained relatively stable in most regions. However, areas with decreased carbon storage (including both “significant decrease” and “slight decrease”) made up 9.29% of the total area, far exceeding the 4.03% accounted for by areas with increased carbon storage. This confirms an overall declining trend in regional carbon storage. Among these, “slight decrease” zones were most prevalent, likely associated with land use changes such as cropland degradation or conversion to construction land.
There was a pronounced contrast in carbon storage changes between mining and non-mining areas. Although mining areas accounted for only 12.08% of the total study area, they contributed 6.08 Tg to the total carbon loss over 20 years, representing 19.27% of the regional decline. In comparison, non-mining areas experienced a carbon storage reduction of 25.45 Tg over the same period, further highlighting the more intense carbon loss dynamics within mining zones.
Over the entire 20-year period (2000–2020), areas with stable carbon storage in non-mining regions accounted for 87.23% (21,401.28 km
2), slightly higher than the proportion in mining areas, which was 82.43% (2668.32 km
2) (
Table 8). The proportion of “Severely Reduced” areas in carbon storage was significantly higher in mining areas (3.14%) than in non-mining areas (1.01%), indicating that drastic carbon loss was more concentrated and severe within mining zones. Similarly, “Slightly Reduced” areas made up 10.03% of the mining areas, compared to 7.77% in non-mining areas, reflecting that both the extent and intensity of carbon storage decline were greater in mining regions.
Comparing the two stages, 2000–2010 was the period with the most significant carbon loss. In this decade, the proportion of carbon-decreased areas (including both “Severely” and “Slightly Reduced”) reached 11.57% in mining areas and 7.25% in non-mining areas. During 2010–2020, the decline slowed, with the proportions dropping to 2.04% and 1.99% in mining and non-mining areas, respectively. Notably, the proportion of “Significantly Increased” areas in carbon storage was slightly higher in mining zones during both time periods. This may be attributed to stronger efforts in land reclamation and ecological restoration within mining areas compared to non-mining regions.
3.3. Analysis of Driving Factors of Carbon Storage Changes from 2000 to 2020
This study identified a total of 287 distinct processes driving changes in carbon storage. To ensure representativeness, we selected those with an affected area larger than 5 km
2, resulting in 16 major processes for in-depth analysis. As shown in
Figure 12, these 16 processes collectively accounted for 99.48% of the area where carbon storage change occurred. Single-factor drivers played a dominant role in carbon dynamics, contributing to 85.33% of the total carbon loss and 69.44% of the total carbon gain.
Among all driving factors, urban expansion emerged as the most significant single driver of carbon loss, with a cumulative reduction of 38.83 Tg, accounting for 69.76% of the total carbon decrease. In comparison, mining, as a standalone driving force, resulted in a carbon loss of 3.36 Tg—approximately 8.65% of the loss induced by urban expansion. Although mining areas occupy a relatively small portion of the region, their impact on carbon storage remains substantial and cannot be overlooked.
Notably, under compound driving scenarios, the mining–reclamation (M–R) pathway covered an area of only 3.62 km2 and led to a cumulative carbon loss of 0.043 Tg. This indicates that even when reclamation measures are implemented following mining activities, complete restoration of the original land use type is often unattainable, and varying degrees of carbon loss persist.
We performed a cluster analysis using Euclidean distance on the 16 major carbon storage driving processes and categorized them into three distinct clusters. Cluster 1 represents areas influenced by multiple driving forces. In these areas, carbon storage exhibited a pattern of initial decline followed by recovery over the 20-year period, although the overall magnitude of change remained relatively small. Cluster 2 comprises the dominant drivers of carbon loss. Although this cluster covers only 1.25% of the total study area, it was responsible for as much as 86.61% of the cumulative carbon storage decline, indicating highly intensive and spatially concentrated negative impacts on the carbon pool. Cluster 3, in contrast, includes the primary contributors to carbon gain, accounting for 62.62% of the total increase in carbon storage across the study area. This suggests that the processes within this cluster, such as reclamation and ecological restoration, have considerable potential for enhancing regional carbon sequestration.
3.4. Analysis of Ecosystem Carbon Storage Changes Under Different Scenarios in 2030
3.4.1. Evaluation of Mining-Induced Land Damage in 2030
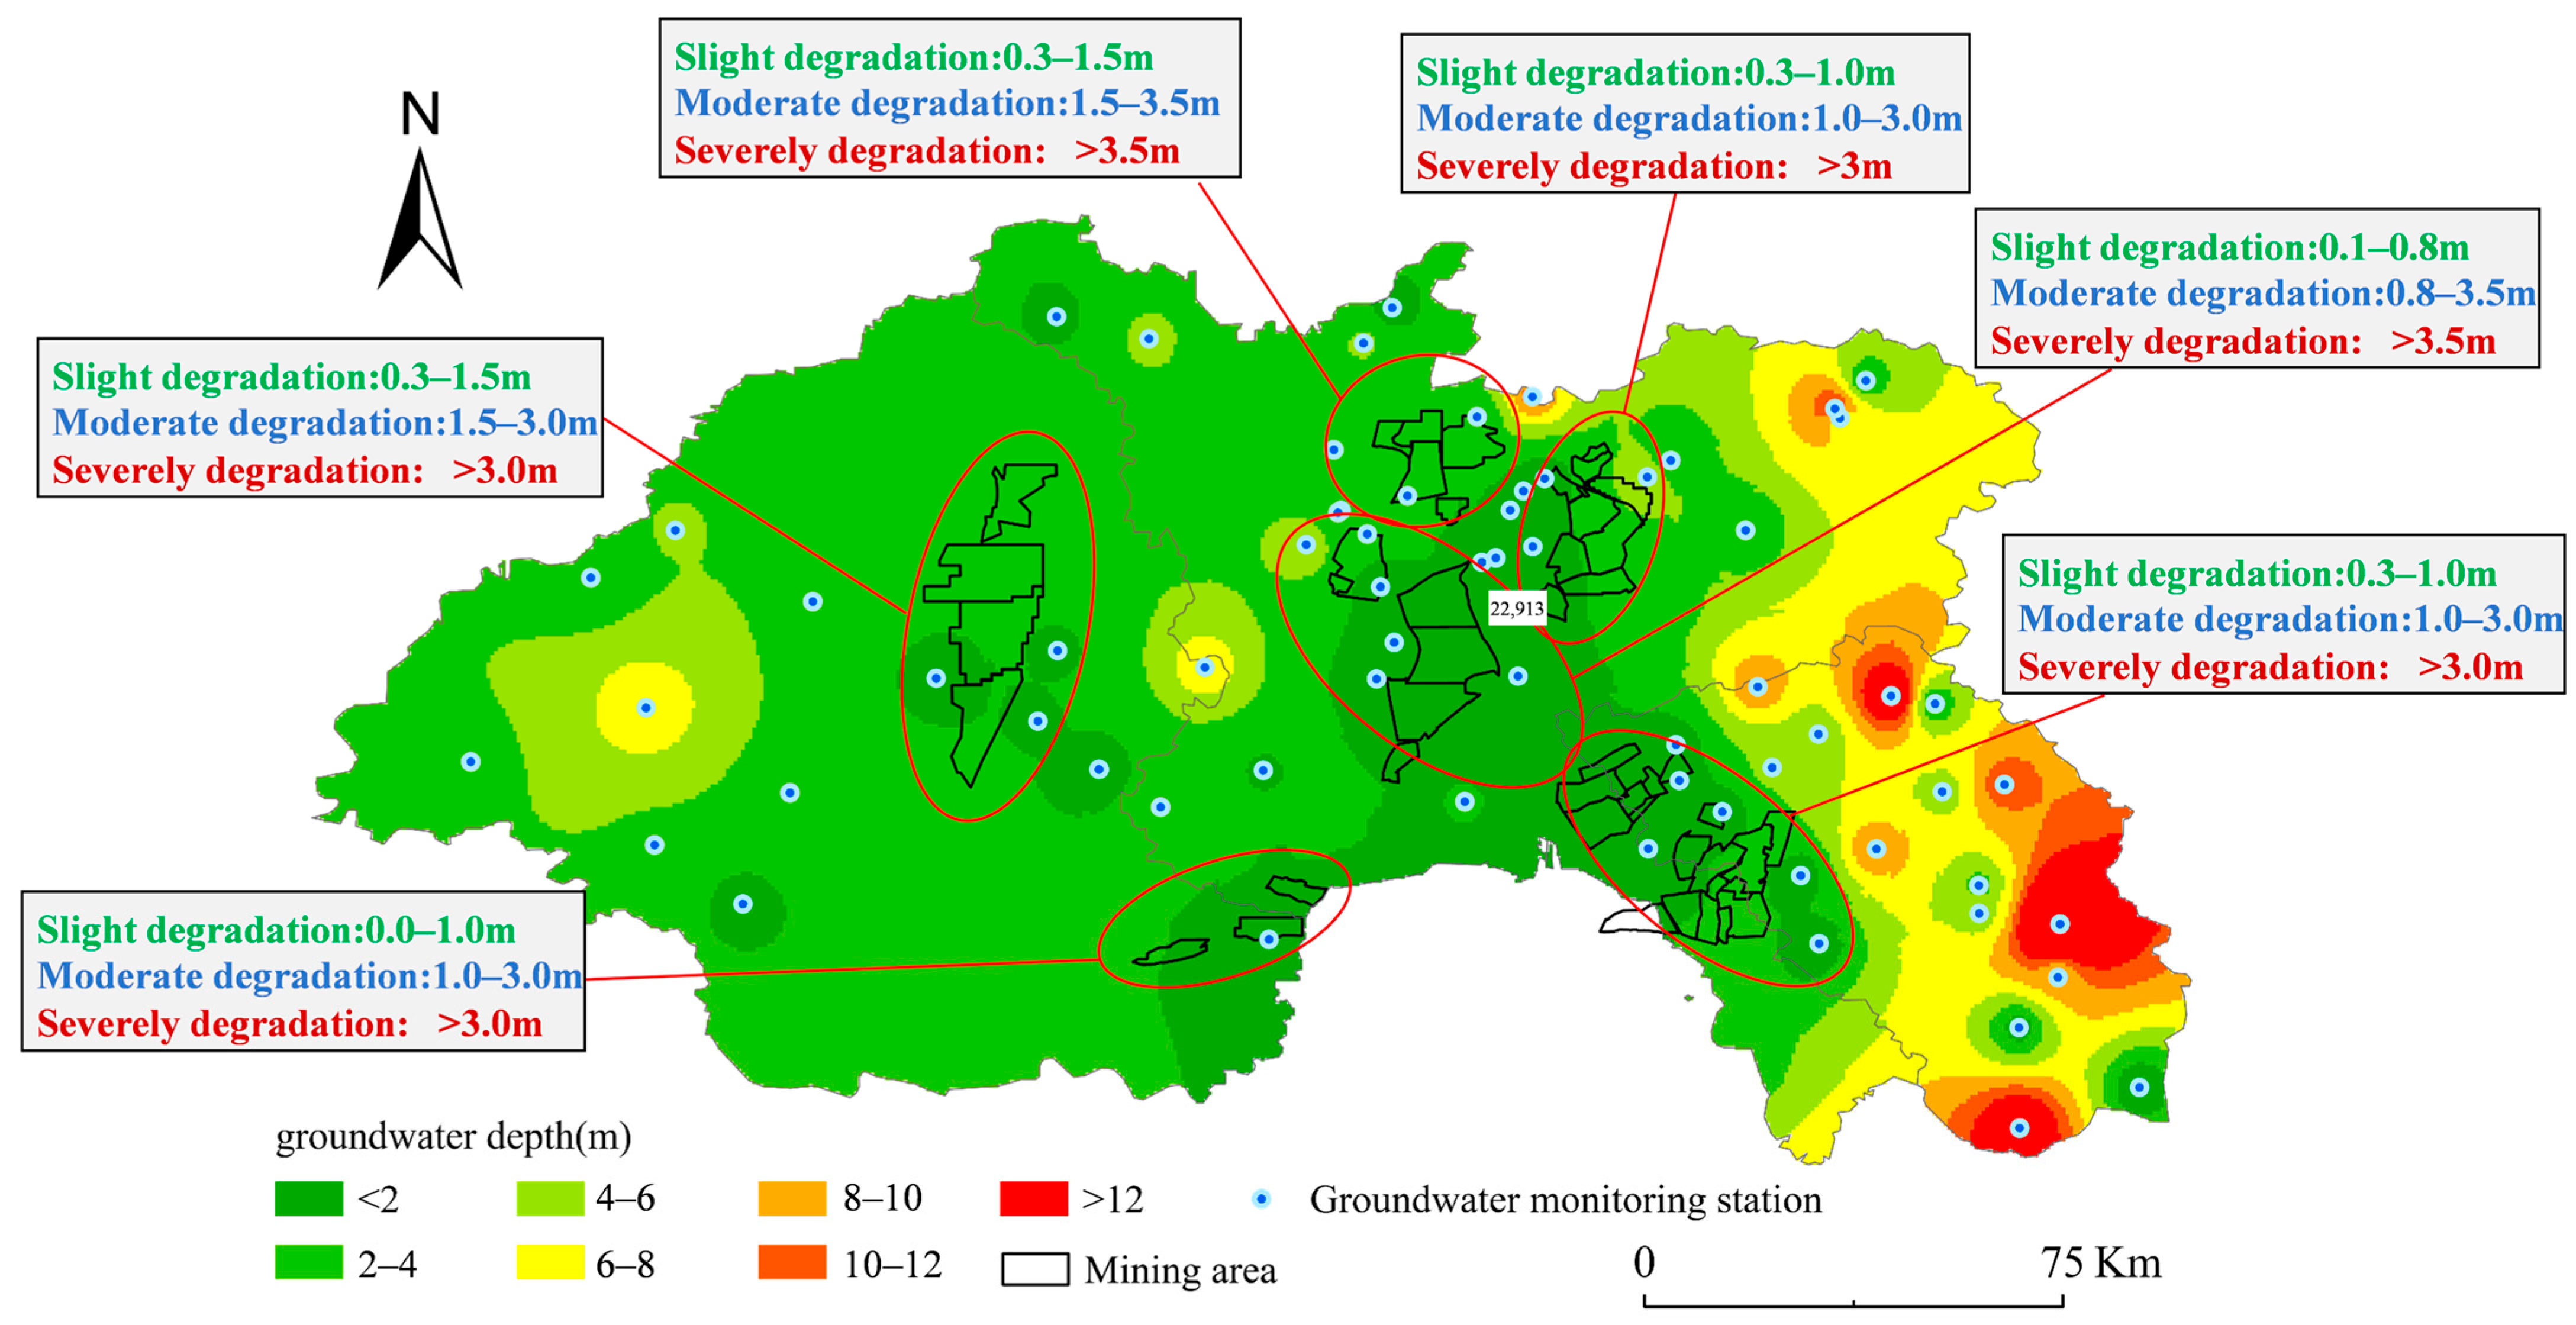
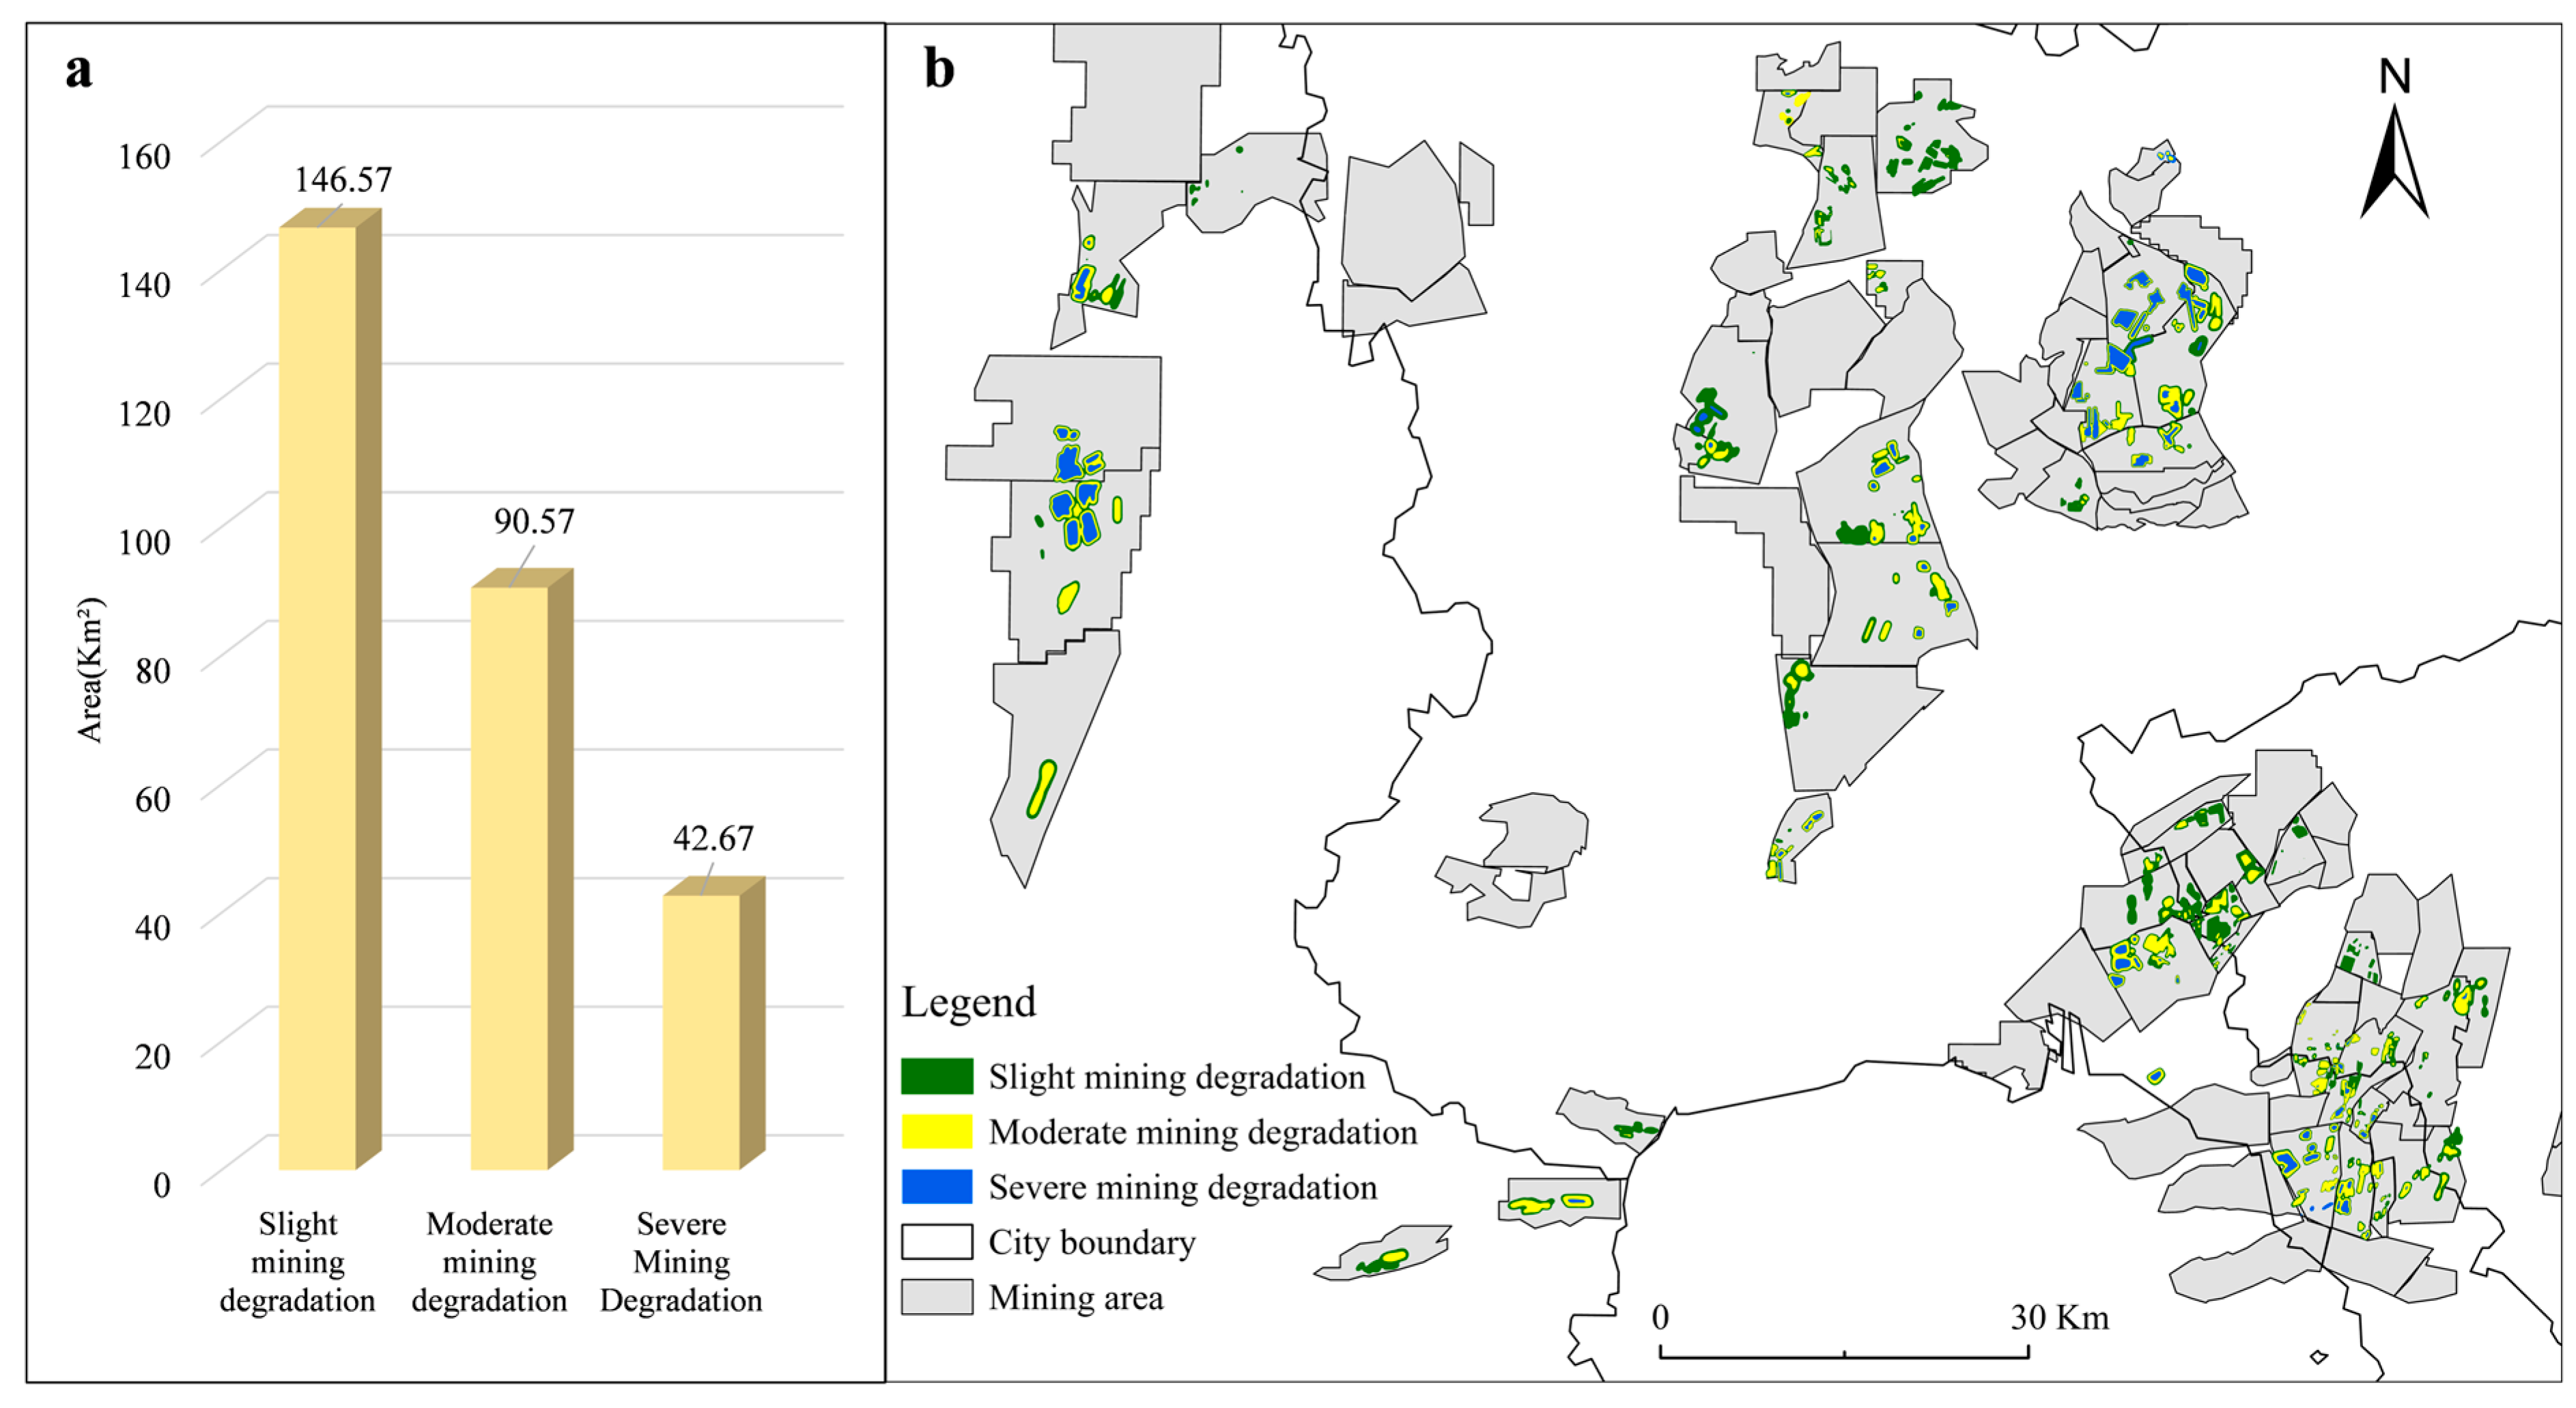
Based on the PIM model prediction, the spatial distribution and intensity of land degradation within the mining areas of High-Groundwater-Level Coal Resource-Based Cities (HGCRBCs) in 2030 exhibit clear stratification. As shown in
Figure 13, areas with slight degradation dominate the landscape, covering 146.57 km
2 and accounting for approximately 50.4% of the total degraded area. Moderate degradation follows, with a total area of 90.57 km
2, representing 31.1% of the total. Severely degraded land occupies the smallest portion, with only 42.67 km
2, comprising 18.5% of the total degradation extent.
3.4.2. Differences in Ecosystem Carbon Storage Under Different Scenarios
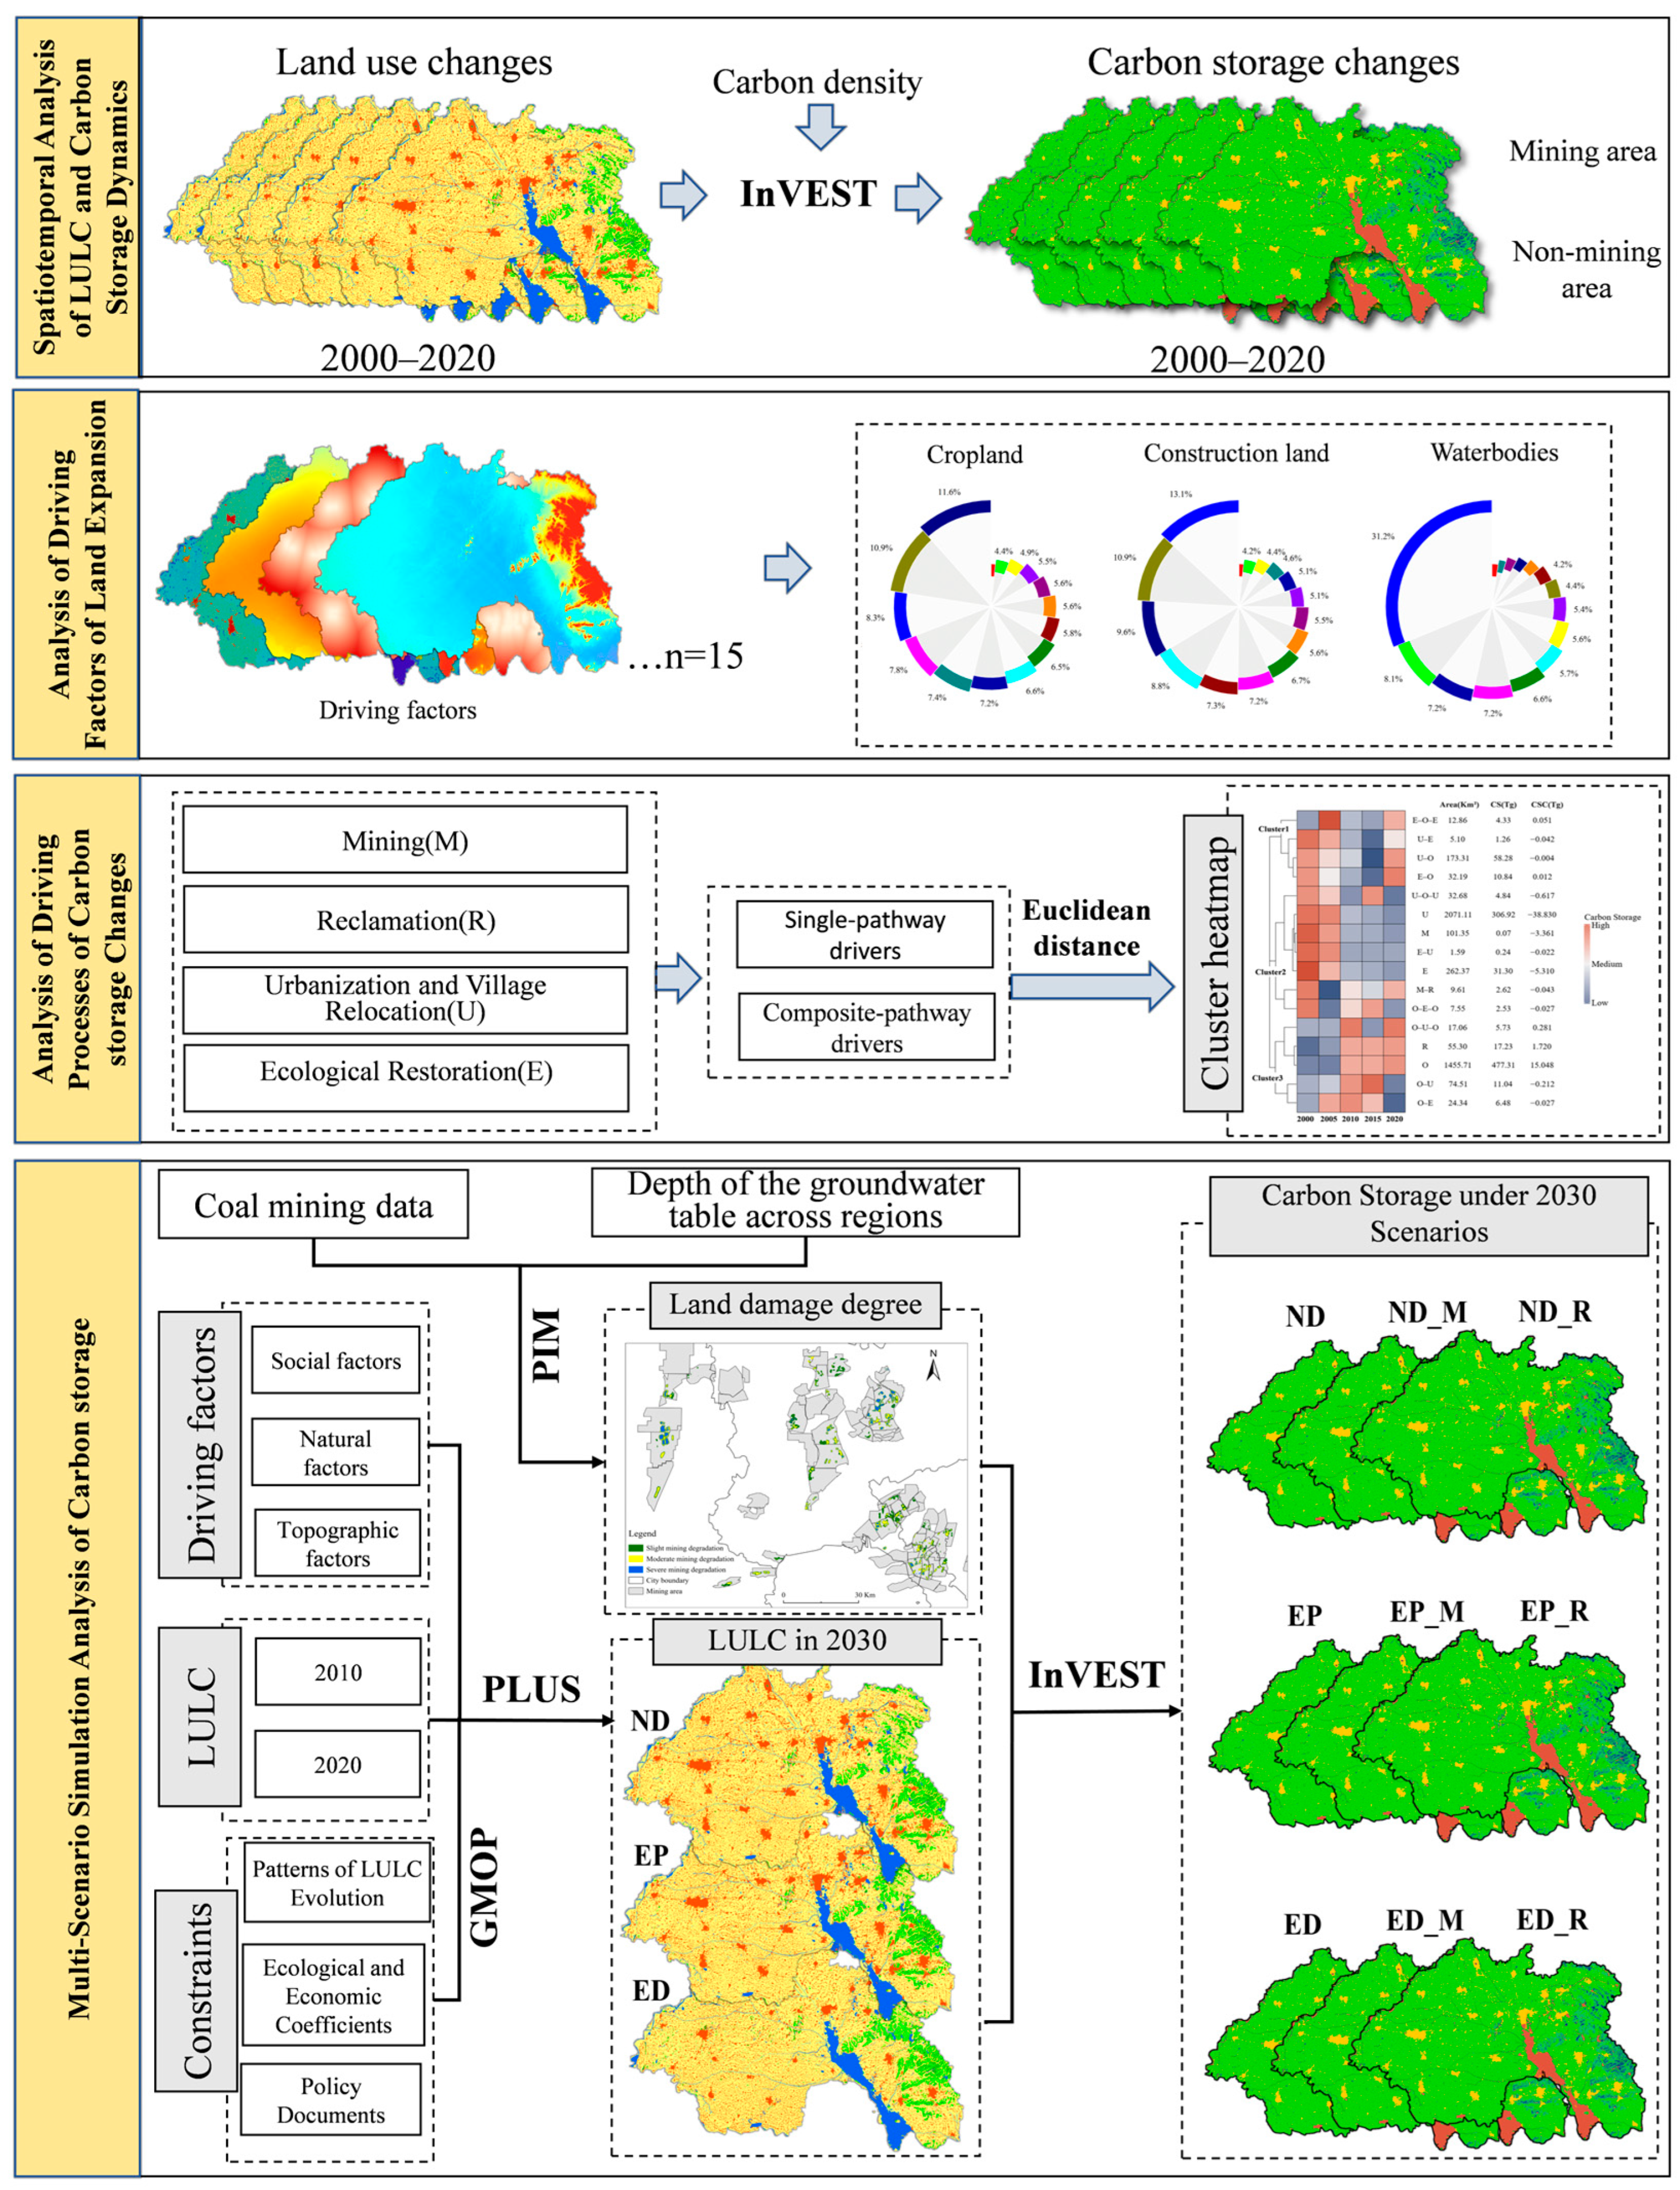
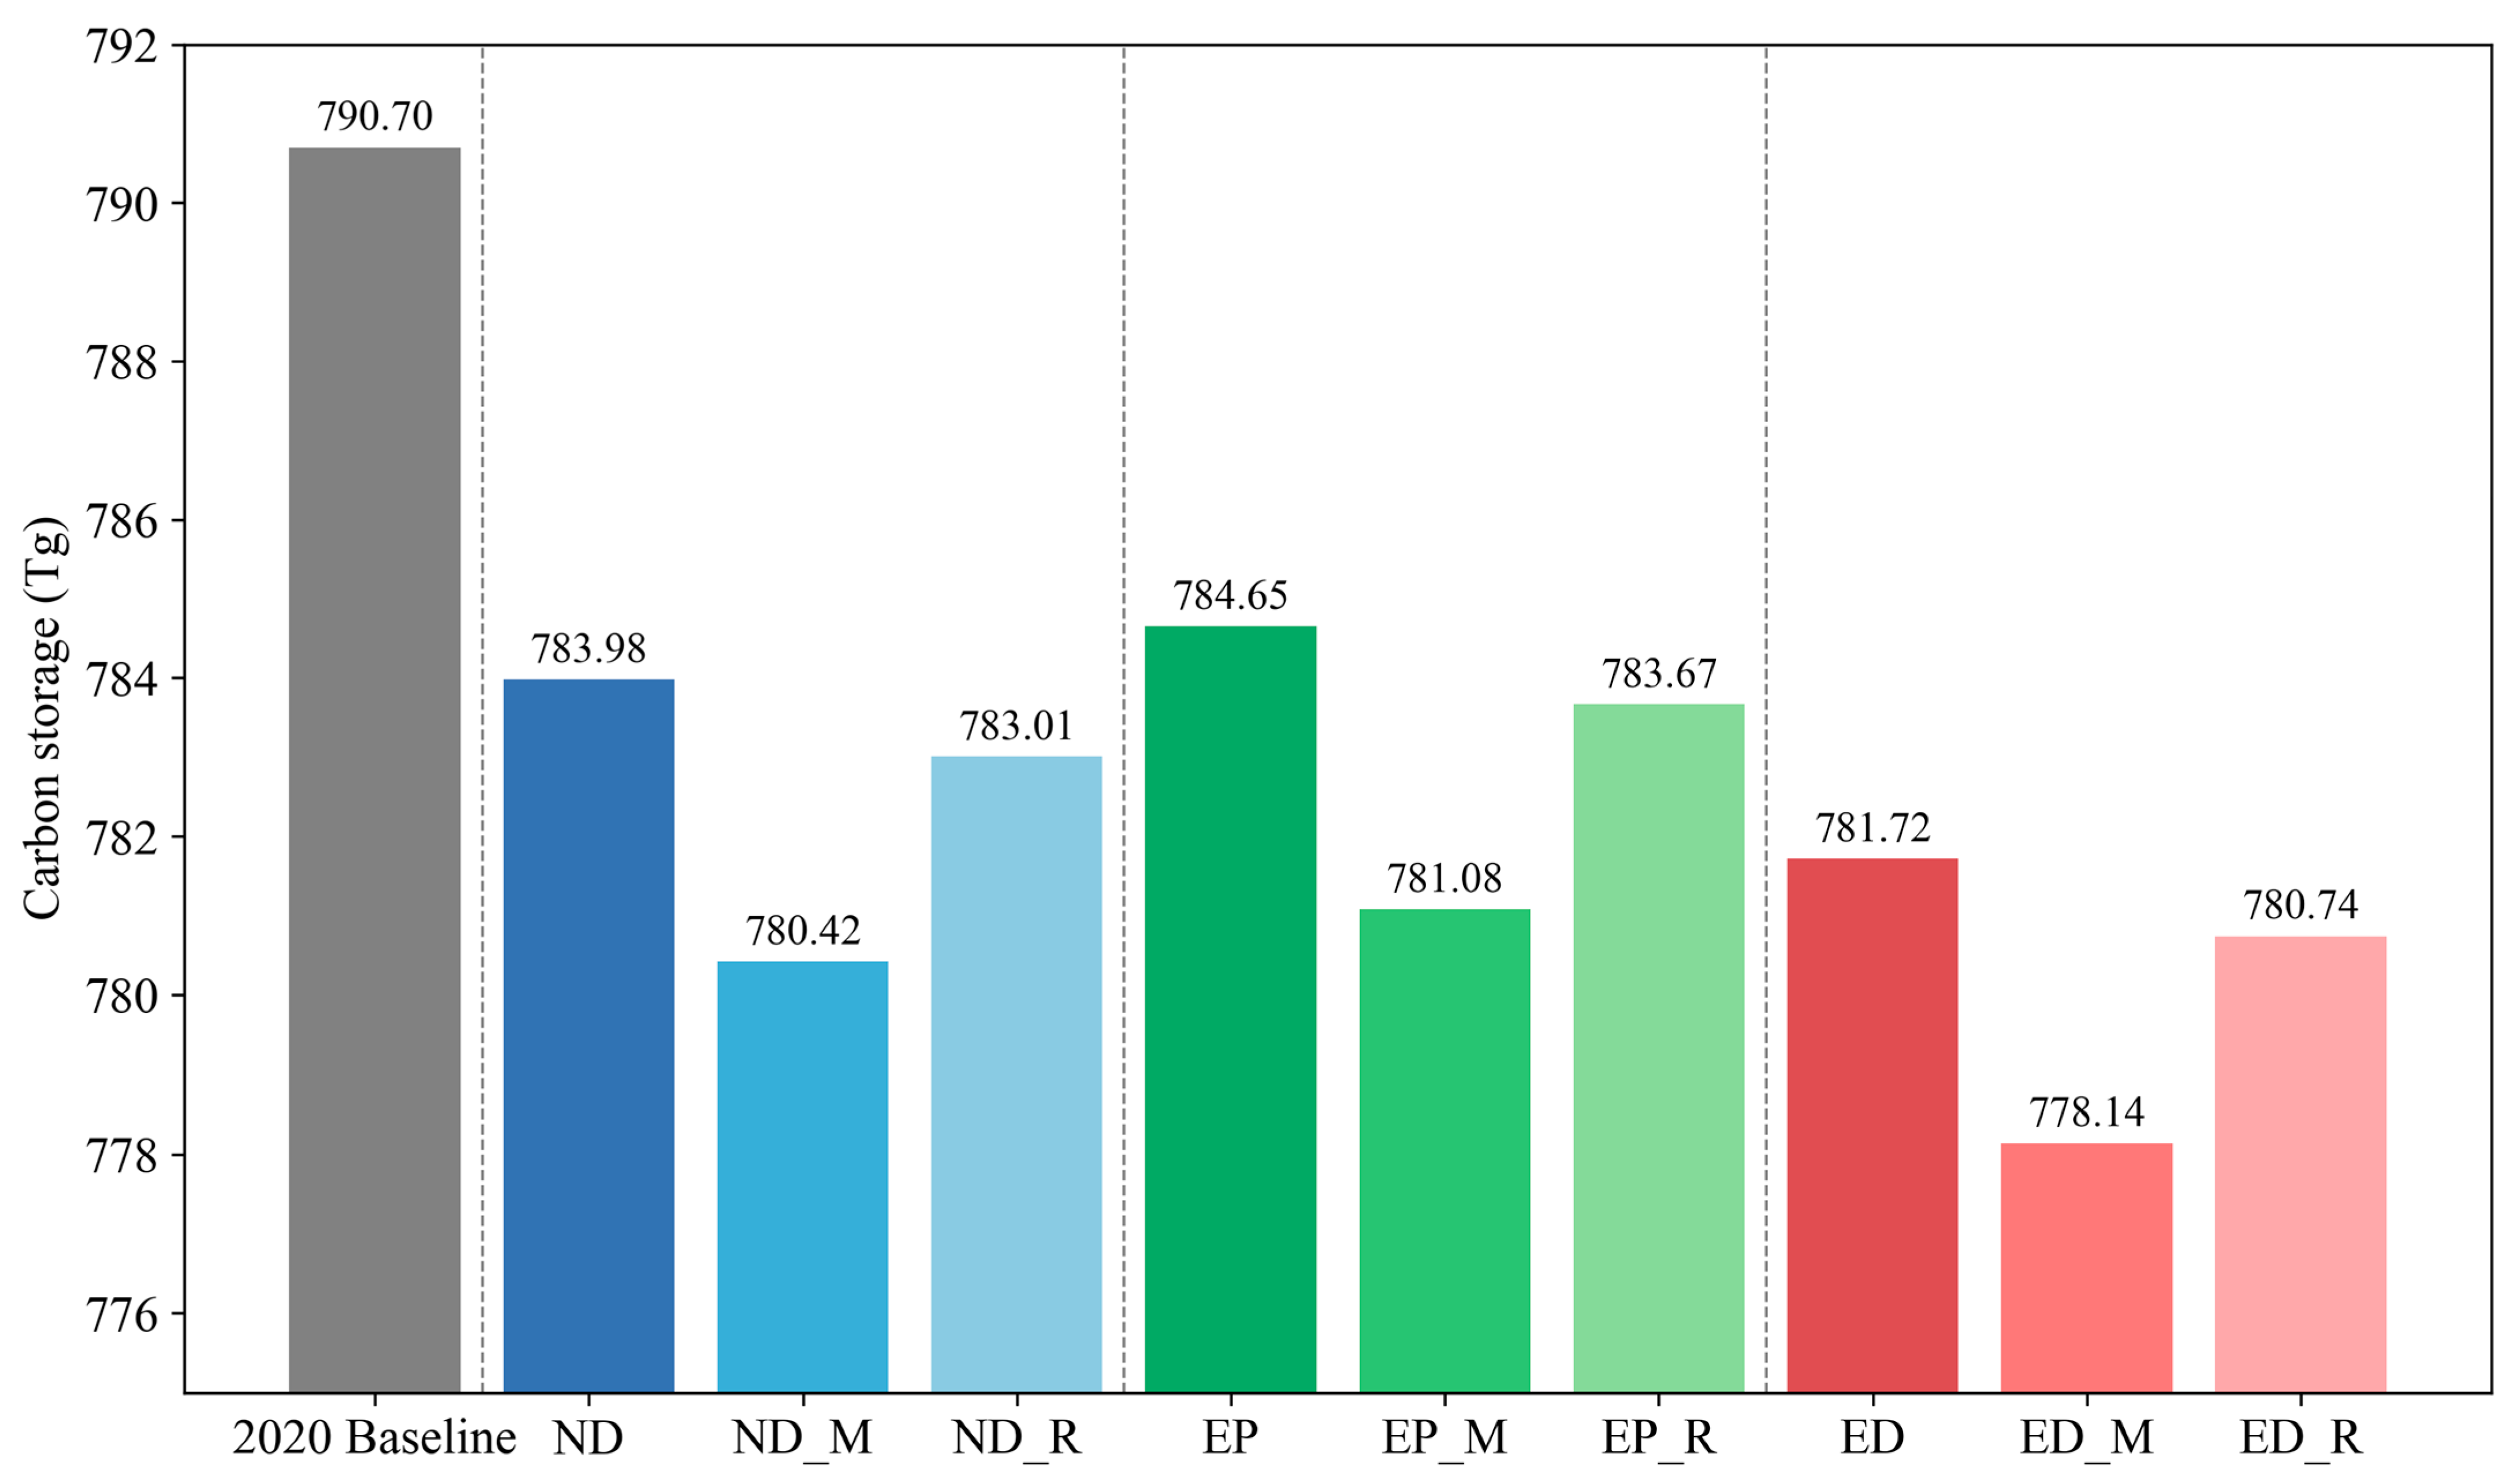
Using the integrated GMOP–PLUS–PIM–InVEST framework, we simulated future land use patterns and evaluated regional carbon storage under multiple scenarios (
Figure 14,
Figure S1 and Figure S2). The results indicate that mining disturbances and ecological restoration activities exert a significant influence on future carbon storage patterns, and that the carbon storage levels of all three development pathways—Natural Development (ND), Ecological Priority (EP), and Economic Development (ED)—are lower than the 2020 baseline.
Under the Natural Development (ND) scenario, the total regional carbon storage reaches 783.98 Tg. When mining disturbances are introduced (ND_M), carbon storage declines to 780.42 Tg, resulting in a loss of 3.56 Tg. The implementation of post-mining reclamation (ND_R) effectively restores carbon storage to 783.01 Tg, recovering approximately 72.65% of the mining-induced loss.
In the Ecological Priority (EP) scenario, carbon storage is the highest among all scenarios, reaching 784.65 Tg. This outcome underscores the significant carbon sink enhancement effect of ecologically driven policies. However, under mining disturbance (EP_M), carbon storage decreases to 781.08 Tg (a reduction of about 0.46%). After reclamation (EP_R), carbon storage rebounds to 783.67 Tg, with a recovery ratio of 72.58%.
In contrast, the Economic Development (ED) scenario yields the lowest total carbon storage, at only 781.72 Tg. With added mining disturbance (ED_M), the carbon storage drops further to 778.14 Tg, down by 3.58 Tg (approximately 0.46%). Reclamation efforts (ED_R) restore carbon to 780.74 Tg, achieving a 72.56% recovery rate.
In terms of land use types, cropland remains the primary carbon storage carrier, accounting for over 80% of the regional carbon storage (
Tables S10 and S11). In the EP scenario, the expansion of forest land and grassland serves as key contributors to increased carbon storage. Conversely, the expansion of construction land—particularly evident in the ED scenario—is associated with significant carbon loss, highlighting a strong negative correlation between urban expansion and carbon sequestration capacity.
4. Discussion
This study integrates four analytical frameworks to systematically evaluate the carbon storage dynamics of High-Groundwater-Level Coal Resource-Based Cities (HGCRBCs). First, the InVEST model was applied to quantify the spatiotemporal variations of carbon storage from 2000 to 2020. Second, the LEAS module of the PLUS model was employed to systematically identify the driving mechanisms of land expansion from socio-economic, natural, and topographic dimensions, thereby revealing how multiple drivers jointly shaped land use/land-cover transitions. Third, carbon storage responses to human activities were examined through explicit LULC transition pathways, highlighting the combined effects of urban expansion, mining disturbance, and ecological restoration. Finally, an integrated framework combining GMOP, PLUS, PIM, and InVEST was developed to simulate land use patterns and carbon storage evolution under different development scenarios for 2030, with particular emphasis on the spatially heterogeneous impacts of mining subsidence and reclamation practices.
Most existing studies on carbon storage in resource-based cities mainly rely on single-model approaches or scenario-based simulations, which often fail to capture the complex processes of mining subsidence and waterlogging that largely determine the future land use patterns of coal resource-based cities [
38,
44]. In this study, the PIM model was introduced and combined with GMOP, PLUS, and InVEST, which not only enabled more accurate projections of land use changes under mining disturbance but also allowed the construction of reclamation scenarios based on land management regulations. This integrated approach provides a more refined assessment of the impacts of future mining and reclamation activities on carbon storage, thereby significantly improving the reliability and practical value of the results. The proposed multi-model framework not only strengthens the systematic identification of driving factors but also better reveals the complex coupling between human activities and carbon storage, offering a solid scientific basis for more comprehensive evaluations of the trade-offs between development and ecological sustainability.
4.1. LULC Transformation Pathways Drive Carbon Storage Evolution: Urban Expansion Suppresses Carbon Sequestration, Mining Disturbances Intensify Spatial Heterogeneity
LULC change is recognized as the core driving factor influencing regional carbon storage dynamics [
45]. Between 2000 and 2020, the total carbon storage in the study area declined by 31.53 Tg, with the most substantial reduction occurring during 2000–2010, amounting to 24.40 Tg and accounting for 77.4% of the total loss. This period coincided with a phase of rapid urbanization, during which large-scale expansion of construction land led to the occupation and conversion of high-carbon-density land types such as cropland and forest land [
46]. The conversion of cropland to construction areas and waterbodies was the primary pathway of carbon loss, contributing 89.86% of the total reduction. This finding aligns with the conclusions of Wu et al., who identified urban expansion as one of the dominant pressures driving terrestrial carbon storage degradation [
9].
Meanwhile, mining areas, as typical zones of intensive LULC change, exhibited more pronounced disturbances and spatial heterogeneity in carbon storage dynamics. Although mining areas accounted for only 12.08% of the total study area, they contributed 19.27% of the total carbon loss, indicating a much higher carbon loss intensity per unit area compared to non-mining regions. Further analysis revealed that areas classified as “Severely Reduced” in terms of carbon storage accounted for 3.14% of the mining area, in contrast to only 1.01% in non-mining areas. This underscores the strong disruption to the carbon system caused by coal mining, including surface subsidence, cropland degradation, and the formation of waterlogged areas.
It is worth noting that although carbon storage in mining areas generally showed a declining trend, the proportion of areas with “Significantly Increased” carbon storage was consistently higher in mining areas than in non-mining areas across both time periods. This suggests that land reclamation and ecological restoration efforts in mining zones have achieved some success. On one hand, some subsided lands have been reclaimed and now exhibit strong carbon sequestration capacity. On the other hand, the policy-driven emphasis on ecological restoration in mining areas—through stronger investment and stricter management—has led to a distinctive pattern of “high disturbance–high restoration.”
4.2. Spatiotemporal Dynamics of Carbon Storage Under Typical LULC Transition Pathways
This study investigates the spatiotemporal evolution of carbon storage in high-groundwater-level coal resource-based cities (HGCRBCs) by analyzing 16 major LULC transition pathways. These pathways account for 99.48% of the areas with significant carbon storage change and were categorized into three typical evolution patterns through clustering analysis, capturing the complex responses of carbon systems under anthropogenic disturbance.
- (1)
Single-Process Dominance in Carbon Storage Dynamics
Among all identified pathways, single-process transitions played a dominant role in shaping carbon storage outcomes, accounting for 85.33% of the total carbon loss and 69.44% of the total carbon gain. Urban expansion (U) emerged as the most impactful driver, contributing to a cumulative carbon loss of 38.83 Tg—nearly 70% of the total loss in the study area. This process involved widespread land conversion (306.92 km2), primarily characterized by the replacement of high-carbon-density land types such as cropland, forest land, and grassland by construction areas. The continued expansion of urban space significantly weakened the region’s carbon sink capacity.
Although spatially concentrated, mining (M) activities affected 101.35 km2 and led to a carbon loss of 3.36 Tg—approximately 8.65% of the carbon loss attributed to urban expansion. This indicates that mining-induced disturbances—such as surface subsidence, waterbody formation, and vegetation destruction—have substantial carbon impacts even within limited areas, demonstrating high carbon loss intensity per unit area.
In contrast, the land reclamation (R) pathway exhibited a degree of carbon storage restoration. Covering an area of 55.30 km
2, reclamation activities contributed to a cumulative recovery of 1.72 Tg of carbon. While these efforts did not fully offset the losses caused by mining, they partially mitigated the long-term degradation of the regional carbon sink. However, considering prior findings that subsided waterbodies may have different carbon densities compared to natural waterbodies [
47], this study may have overestimated the impacts of mining and reclamation on carbon storage due to data limitations.
- (2)
Compound Pathways Reveal the Coupled Mechanism Between Human Disturbance and Ecological Response
Compound pathways illustrated the complex land use transitions influenced by policy, economic development, and ecological restoration. These transitions showed pronounced temporal fluctuations. For instance, the U–O–U pathway (urban–abandonment–reurbanization) resulted in a net carbon change of −0.617 Tg, reflecting the instability of carbon sinks during the cyclical transformation of urban land.
Notably, the mining–reclamation (M–R) pathway, although intended as an ecological compensation strategy, failed to deliver ideal restoration outcomes. Even after reclamation, carbon storage in these areas still experienced a net loss of 0.043 Tg. This suggests that post-mining reclamation cannot fully restore carbon levels, likely due to limitations in returning land to its original ecological state [
12].
4.3. Impacts of Mining and Reclamation Under Different Development Scenarios
Scenario simulations based on the PLUS model revealed significant variations in carbon storage by 2030 under three land use scenarios: Natural Development (ND), Ecological Priority (EP), and Economic Development (ED). These differences underscore the profound influence of policy orientation and land use structure on regional carbon dynamics. The EP scenario demonstrated the highest carbon sequestration potential, highlighting the effectiveness of expanding forest and grassland areas while controlling urban sprawl—an approach consistent with findings by Chen et al. [
48].
In contrast, the ED scenario exhibited the lowest carbon storage, driven by the rapid expansion of construction land that displaced high-carbon-density land types such as cropland and forest land. This efficiency-oriented land configuration significantly weakened ecosystem carbon sinks and is unfavorable for achieving carbon peaking and neutrality goals.
Mining disturbances were integrated into all three scenarios and consistently led to significant carbon reductions—approximately 3.5 Tg in each case. This confirms mining as a major negative driver of regional carbon storage in HGCRBCs [
27]. The main causes of these losses include land degradation from subsidence, expansion of waterbodies, and cropland loss—particularly the destruction of cropland, which originally had high carbon density.
Further simulations evaluated the impact of post-mining reclamation on carbon recovery. Results showed that reclamation consistently offset around 72% of the mining-induced carbon loss across all scenarios, demonstrating strong ecological compensation potential. This recovery rate was consistent under the ND, EP, and ED scenarios, suggesting that reclamation is a broadly effective and adaptive measure for restoring carbon sink functions in mining areas. Nevertheless, the effectiveness of reclamation is constrained by factors such as land use conversion types, technical feasibility, implementation delays, and policy enforcement [
49] making it difficult to fully restore pre-disturbance carbon levels.
Although the differences in carbon storage among the ND, EP, and ED scenarios are smaller compared to the magnitude of historical changes, this outcome reflects the policy-oriented nature of the scenario design: under strict land use regulations and planning constraints, the overall range of variation among scenarios is limited. At the same time, we also observed relatively small differences between the _M and _R sub-scenarios within each pathway. This is mainly attributable to the scale effect—mining-affected areas account for only a small proportion of the entire study region, causing the localized impacts of mining disturbances and ecological restoration to be diluted when assessed at the city-wide level. This explains why the observed differences between the _M and _R scenarios are relatively insignificant.
According to the findings of this study, mining activities exert a significant negative impact on carbon storage, whereas reclamation can substantially restore carbon stocks. However, further reducing the adverse effects of mining and enhancing the restorative capacity of reclamation critically depend on policy orientation. In particular, the conflict between mining rights approval and ecological protection red lines has not yet been effectively addressed. Future efforts should strengthen the enforcement of ecological red line controls, establish sound ecological compensation mechanisms, and promote multi-objective land use planning to optimize the mining and reclamation process. Such policy-oriented measures are essential for reconciling mining development with ecological protection and for enhancing the long-term stability of regional carbon storage.
4.4. Scientific Significance and Limitations
This study focuses on High-Groundwater-Level Coal Resource-Based Cities (HGCRBCs), integrating mining disturbances, land reclamation processes, and multi-scenario simulations to construct an analytical framework for the coupled relationship between mining, reclamation, and carbon storage. Methodologically, it integrates the Multi-Objective Programming (MOP) model, Patch-generating Land Use Simulation (PLUS) model, Probability Integral Method (PIM), and the InVEST carbon storage assessment model. This combination ensures both high spatial accuracy in land use/cover change (LULC) simulation and ecological logic in the carbon storage process, significantly improving the spatial resolution and dynamic response capacity of carbon assessments. In addition, this study is the first to systematically identify and quantify the impacts of 16 typical LULC transition pathways on carbon dynamics. Through pathway clustering, it reveals the heterogeneous responses of carbon storage to various combinations of anthropogenic disturbances, thus expanding the scope of ecosystem service impact assessments related to land use change. Furthermore, by incorporating reclamation policies into future scenario simulations, this research provides quantitative evidence and theoretical support for ecological restoration, low-carbon transition, and refined land use policymaking in resource-based cities.
Nevertheless, several limitations remain. First, the InVEST model applies fixed carbon pool values for each LULC type. Although this study adjusts those values using regional climate data (e.g., temperature and precipitation), it does not fully capture carbon density variability within the same land class under different environmental or successional conditions. Second, existing research has shown that the carbon density of subsidence-induced waterbodies is significantly higher than that of natural waterbodies [
47]. However, this study does not differentiate between these two types in the model settings, potentially leading to an underestimation of carbon storage in waterbody-related areas. Third, the accuracy of carbon storage assessments is heavily dependent on the quality and classification of LULC data. Although the datasets used in this study have been widely validated in academic literature [
8] and are of relatively high accuracy, inherent uncertainties in remote sensing interpretation and land classification may still introduce errors that affect the precision of the carbon storage simulations. Moreover, given that subsidence zones in coal resource–based cities are often fragmented, the use of 30 m resolution may fail to detect small, localized subsidence waterbodies, thereby underestimating the spatial heterogeneity of carbon-stock changes. Fourth, the economic and ecological efficiency coefficients used in the GMOP model are subject to uncertainty. Although the economic efficiency coefficients were derived from local statistical yearbooks and the ecological efficiency coefficients were based on the widely used ESV equivalent factor method proposed by Xie et al. [
50]., these values may not fully represent the actual conditions of the study area. Finally, the scenario settings (e.g., “low-carbon development” and “coordinated governance”) were designed from a national strategic perspective and may not be fully consistent with local policies, while the ecological migration recommendations were proposed qualitatively without cost–benefit analysis. These issues should be addressed in future research.

