Article

Projections of Urban Land Under the Shared Socioeconomic Pathways—A Case Study of Yangtze River Delta Region

1
State Key Laboratory of Climate System Prediction and Risk Management, School of Geographical Science, Nanjing University of Information Science and Technology, Nanjing 210044, China
2
Key Laboratory for Climate Risk and Urban-Rural Smart Governance, School of Geography, Jiangsu Second Normal University, Nanjing 210013, China
3
School of Geographical Science, Qinghai Normal University, Xining 810008, China
*
Authors to whom correspondence should be addressed.
Land 2025, 14(10), 1995; https://doi.org/10.3390/land14101995
Submission received: 28 July 2025 / Revised: 29 September 2025 / Accepted: 30 September 2025 / Published: 4 October 2025

Abstract

Rapid socioeconomic development has continuously driven urban land expansion at the expense of other land types, leading to significant changes in land use and environment. However, existing studies still lack fine-resolution, long-term projections of urban land. Using seven periods of land use data from 1990 to 2020, this study projects urban land in the Yangtze River Delta (YRD) region under the framework of Shared Socioeconomic Pathways (SSPs). A multiple linear regression model and the land use change scenario simulation model (GeoSOS-FLUS) were employed to make projection at a high spatial resolution of 1 km. The findings are as follows: (1) From 1990 to 2020, the rate of urban land expansion in the study area showed a pattern of initial acceleration followed by deceleration, with the average annual expansion rate decreasing from 1.36 × 10³ km2 to 0.24 × 10³ km2. The center of gravity shifted toward the southeast. (2) Future urban land expansion is projected to increase by 14 × 103 km2 (SSP3) to 48 × 103 km2 (SSP5). The northern and central parts of the region will experience more significant growth, and the center of gravity is projected to shifting northwest. (3) Under SSP2 and SSP5, the urban land will increase continuously. The findings can offer a valuable insight for regional planning and sustainable development.

1. Introduction

Amid global climate change and the pursuit of sustainable development goals (SDGs), urban land transformation has emerged as a crucial issue in building sustainable cities. The global urbanization rate has exceeded 50% and is projected to reach 70% by 2050 [1]. China represents a prime case of rapid urbanization, with an urbanization rate rising to 66% by 2023, a 55% increase since 1949 [2]. The rapid development has imposed significant negative impacts on urban environments and resource sustainability [3,4]. China’s land use patterns have long been constrained by the challenge of balancing economic growth and ecological protection. With a large population and limited per capita land resources, the country must prioritize high-quality, sustainable urbanization to conserve land resources [5,6]. The Yangtze River Delta (YRD) region, with an area of 21.9 × 10⁴ km2, hosts nearly 13% of the China’s population while occupying less than 3% land area. As one of China’s most economically developed, highly urbanized, and densely populated regions, the YRD region contributes nearly 20% of the GDP and has an urbanization rate exceeding 70%. However, rapid urban expansion has led to large-scale conversion of cropland, resulting in inefficient land use, environmental pollution, and ecosystem degradation [7,8,9]. Existing research on urban land in this region has primarily focused on historical land use changes, while studies addressing future urban land in different scenarios remain limited [10]. Consequently, making long-term projections, which is important for developing scientifical land use planning strategies to address future urbanization challenges, has become an urgent priority.
Urban land changes are driven by a complex interplay of social, economic, and natural factors, with economic growth and population dynamics serving as primary drivers of urban expansion [11]. Economic development typically accelerates urbanization, which in turn promotes the expansion of urban land. Population growth will increase demand for housing and infrastructure. Conversely, regions experiencing significant out-migration often encounter reduced demand for urban land. Because of the finite availability of land resources, accurate projection and rational planning are essential for promoting sustainable development.
To evaluate future urban land changes, researchers have employed various studies. Some studies rely on historical trends or predefined scenarios. Although it can provide a useful reference for urban planning, the simulation based on a single scenario often ignores the multiplicity of future uncertainties and has greater limitations. Moreover, scenario design is often subjective and is influenced by researchers’ assumptions [12,13,14]. The Shared Socioeconomic Pathways (SSPs) provide a valuable framework for projection of urban land. The SSPs represent a set of alternative socio-economic development scenarios that assume no additional climate policies or adaptation measures [15]. They provide a multi-scenario foundation for long-term projections and have been widely applied in climate change, economic development, and land use projection. The five Shared Socioeconomic Pathways (SSPs) are summarized as follows: SSP1 (Sustainability Pathway) is characterized by a relatively low global population and moderate economic growth. By the end of the century, the global economy is projected to exceed five times its 2020 level, with relatively low challenges for climate change mitigation and adaptation. SSP2 (Middle of the Road Pathway) follows historical trends, with gradual population and economic growth. Low-income countries continue to experience demographic pressures due to relatively low levels of educational attainment. SSP3 (Regional Rivalry Pathway) depicts a fragmented world with limited international cooperation. Population growth remains high, exceeding 12 billion by 2100, while economic development is projected to slow and become uneven, resulting in high adaptation challenges and limited mitigation capacity. SSP4 (Inequality Pathway) reflects a future of high socioeconomic divergence. Middle and high-income countries exhibit modest growth, while low-income countries fall further behind. This pathway entails low mitigation challenges but high adaptation challenges due to significant vulnerability and limited institutional capacity in disadvantaged regions. SSP5 (Fossil-Fueled Development Pathway) assumes a globalized economy driven by intensive energy consumption and rapid technological progress. Economic output grows substantially, exceeding ten times the 2020 level by 2100, while global population remains relatively low. Fertility rates decline rapidly in developing countries but increase slightly in developed regions. This pathway is associated with low adaptation challenges but very high mitigation challenges [16,17]. While numerous studies have examined urban land dynamics under SSPs, most operate at coarse resolutions (global or national scales), failing to capture detailed regional variations [18,19,20,21]. Although some regional-scale projections exist, they typically cover short time spans, and cannot reveal long-term urban land trends [22,23]. Consequently, projecting urban land changes under different pathways is essential for optimizing land resource allocation and guiding sustainable development in the study region.
Regarding modeling approaches, existing studies of future urban land have mainly employed dynamic models for simulations, including Cellular Automata (CA), Support Vector Machines (SVM), The System Dynamics (SD) model, PLUS model, and GeoSOS-FLUS model. CA and SVM have lower precision [24,25,26]. The SD model cannot provide the integration of multiple dynamic simulation scenarios, which limits its prediction accuracy [21,22,23,24,27]. The PLUS model can reflect the influence of different drivers on land, with high simulation accuracy [28]. But it needs complicated parameterization and high data requirements [21]. By considering multi-dimensional factors such as socio-economic development, policy adjustments, environmental changes, the GeoSOS-FLUS model is particularly suitable for multi-scenario land use simulations with operational simplicity and high accuracy [29,30]. This model has been successfully applied in urban expansion, agricultural land conversion and ecological protection in China, which provide reliable references for land use planning and policy making.
This study focuses on the Yangtze River Delta (YRD) region, analyzing urban land dynamics and the relationship with the population and economy from 1990 to 2020. Combined with the multiple linear regression model and the GeoSOS-FLUS model, this study makes a long-term projection of urban land from 2021 to 2100 under SSPs. To scientifically assess the multi-scenario spatial trajectories of future development in the Yangtze River Delta (YRD) urban agglomeration, this study is conducted based on three core hypotheses: (1) the driving mechanisms of historical urban expansion remain applicable under future SSP scenarios; (2) the GeoSOS-FLUS model is capable of effectively capturing and simulating the evolution of detailed spatial patterns in complex urban agglomerations like the YRD; and (3) different SSP socio-economic pathways will lead to significant differences in the scale and spatial pattern of urban land expansion in the study area. Based on these hypotheses, this study aims to firstly, utilize the GeoSOS-FLUS model to quantitatively simulate and project urban land use changes in the YRD up to 2100 under various SSP scenarios; secondly, reveal the potential impacts and disparities of different development pathways on the regional spatial pattern through a systematic comparison of multi-scenario simulation results. It is expected that this multi-scenario simulation will provide a scientific quantitative reference for optimizing territorial spatial planning and formulating differentiated adaptive strategies under uncertainties, thereby supporting the achievement of sustainable development goals in the YRD urban agglomeration.

2. Study Area and Data Sources

2.1. Study Area

The study focuses on the core Yangtze River Delta (YRD) region, which lies between 116° E and 124° E, 26° N and 36° N, covering 21.9 × 10³ km2 and occupying 3% of China’s territory (Figure 1). It is located in the eastern seaboard of China and includes three regions, Jiangsu Province, Zhejiang Province, and Shanghai Municipality. With a mild climate and abundant rainfall, it is one of the most economically developed and densely populated regions in China. Because of the rapid economic development, the land use changes have been drastic, and the continuous expansion of urban land has led to the utilization of a large amount of cropland and forest, which has severely challenged the process of sustainable development.

2.2. Data Sources

Three types of data from all cities in the study region were collected in this study. First, historical land use data were obtained from 30 m resolution annual land cover datasets derived from landsat satellite imagery (http://www.ncdc.ac.cn, accessed on 8 October 2023), and we selected seven time periods 1990, 1995, 2000, 2005, 2010, 2015, and 2020. To uniform resolution, we used the reclassification function in ArcGIS to reclassify the 30 m land use data to 1 km. And reclassified the land use types in the study area into urban land, water, and other land. Second, urban land change is a complex geographical phenomenon influenced by many factors. In this study, we selected 11 driving factors from three categories: topography, hydrometeorology, and socioeconomic conditions (Table 1). All factors were standardized to a 1 km resolution for consistency. Third, we utilized population and economic projection data under the Shared Socioeconomic Pathways (SSP1-5) to estimate future urban land demand (https://doi.org/10.57760/sciencedb.01683, accessed on 8 October 2023). The spatial resolution is 0.5°.

3. Methods

3.1. Measurement of Urban Land Expansion

First, urban land expansion speed was used to reflect the rate of urban sprawl. The formula is as follows:
V i = S i t 2 S i t 1 Δ t
where V i refers to urban expansion rate of city i . S i t 2 ,   S i t 1 refer to urban land area of city i at time t2, t1. Δt refers to time interval between t2 and t1.
Second, intensity index was used to reflect the spatial heterogeneity of urban expansion among different cities within the study area, expressed as the ratio of a city’s expansion rate to the overall expansion rate of the study region. The formula is as follows:
E i = | S i t 2 S i t 1 | × S t 1 S t 2 S t 1 × S i t 1
where E i refers to urban expansion disparity index for city i . S i t 2 and S i t 1 refer to urban land area of city i at time t2, t1. S t 2 and S t 1 refer to total urban land area of the entire study region at time t2, t1. The symbol |…| means absolute value.
We classified it into five categories: slow expansion ( E i < 0.4), low-speed expansion (0.4 ≤ E i < 0.8), medium-speed expansion (0.8 ≤ E i < 1.2), rapid expansion (1.2 ≤ E i < 2.0) and high-speed expansion ( E i ≥ 2.0).
Third, kernel density estimation was employed to analyze the spatial clustering characteristics of urban land use within the study area. The formula is as follows:
f x = 1 n × h i = 1 n k D i j h
where f x refers to Density estimate at location x . n refers to number of urban land patches (1 km) within the search radius. h refers to bandwidth. k refers to kernel function. D i j refers to distance from point j to the i . n refers to the number of points in the range h .
To characterize the spatial distribution of urban land, we employed the “Kernel Density” tool in ArcGIS to quantify the spatial distribution of urban land. Using the natural breakpoint method, we then classified the urban land density into four levels: low, medium, high, and extremely high.
Fourth, the standard deviational ellipse method was employed to quantitatively characterize the spatial distribution patterns of urban land use. The formula is as follows [31]:
x i = x i X i , y i = y i Y i tan θ = Σ i = 1 n w i 2 x i 2 Σ i = 1 n w i 2 y i 2 + ( Σ i = 1 n w i 2 x i 2 Σ i = 1 n w i 2 y i 2 ) + 4 ( Σ i = 1 n w i 2 x i y i ) 2 2 Σ i = 1 n w i 2 w i x i 2 w i y i 2 δ x = Σ i = 1 n ( w i x i cos θ w i x y i s i n θ ) 2 Σ i = 1 n w i 2 , δ y = Σ i = 1 n ( w i x i sin θ w i x y i c o s θ ) 2 Σ i = 1 n w i 2
where X i , Y i refer to Geometric center coordinates of urban land spatial unit i . x i , y i refer to deviations from the mean center coordinates. w i refers to Weight value for spatial unit i . θ refers to rotation angle of the ellipse. δ x , δ y refer to Standard deviations along the x-axis and y-axis, respectively.

3.2. The Projection of Urban Land Demand Based on SSP1-5 Pathways

This study used a multiple linear regression model to establish the relationship between socioeconomic factors and urban land area. The formulation is as follows:
Z i = C + A × P O P i   +   B   ×   G D P i
where Z i refers to urban land area in year i . C refers to Constant term. A, B refers to ratio of population and GDP.

3.3. Urban Land Spatial Simulation Model

The GeoSOS-FLUS model is designed for multi-scenario land use change simulations under the combined influences of human activities and natural factors. The model operates through two key phases: Firstly, the neural network algorithm was used to obtain the image-by-image suitability probabilities of various land use types in the study area by combining the natural, socioeconomic, and other land use drivers. Next, the spatial distribution of land use under specific scenarios is modeled through probabilities of suitability, constraints on development, and future land demand (Figure 2).
To verify the applicability of GeoSOS-FLUS for urban land simulation, we set 2015 and 2020 as the validation period. The Kappa coefficient of the simulation in 2015 was 0.84 and 2020 was 0.89, the model simulation was effective and can be used for future urban land simulation (Figure 3).
The SSPs primarily integrate with the GeoSOS-FLUS model by influencing future urban land demand and the spatial distribution of certain drivers within the study area: Firstly, the GeoSOS-FLUS model requires input of total land demand for each future period. Different SSPs will have different urban land demands. We employed multiple linear regression to establish a relationship model between historical urban land area, population, and GDP. Subsequently, we substitute projected population and GDP data from different SSPs to calculate the total urban land demand for each future year under each SSPs. Secondly, during the first phase of the GeoSOS-FLUS model, an artificial neural network (ANN) is employed to compute the probability of each grid cell becoming urban land. The ANN training relies on driving factors. We assume that topographic factors such as elevation and slope are unaffected by SSPs and remain constant in the future. Population and economic drivers are dynamic, and their future spatial distribution varies across SSP scenarios. This leads the neural network to compute different suitability probability maps, thereby influencing the location selection for future urban spatial expansion.
When performing SSP1-5 urban land use simulations, we assume that urban land cannot be transferred out. The water is set as a restricted area, and the SSP1 simulation strictly adheres to the red line of ecological protection and the red line of permanent basic farmland. In addition, the neighborhood weight calculation formula is as follows [32,33,34,35]:
X * = ( X X m i n ) ( X m a x X m i n )
where X * refers to the urban land expansion capacity. X   r e f e r s   t o   u r b a n   l a n d   a r e a .   X m a x refers to maximum values. X m i n refers to minimum values.

3.4. Coordination Between Urban Land, Population, and GDP

The coordinated development of population, GDP, and urban land use reflects high-quality urban expansion. To assess this, we developed coordination coefficients for population–urban land and GDP–urban land relationships to evaluate the quality of urban land expansion in the study area (Table 2).
First, urban land expansion index and population density are used to reflect the quality of urban land expansion, where E means the difference between the rate of urban land use and population growth in the study area. The formulation of E is as follows:
E = s t 1 s t 2 1 t 2 t 1 P t 1 P t 2 1 t 2 t 1
where S, P refer to Urban land area and population. t1, t2 refer to the initial and final years of study periods.
We consider compact growth when E < 0, looser growth when it lies in [0,0.9], and loose growth when it is greater than 0.9. Lastly, the degree of population–urban land synergy (E) in the study area was categorized into low density population—looser growth (a), low density population-compact growth (b), high density population-looser growth (c) in conjunction with E.
Second, the coordination degree between GDP and urban land expansion was analyzed based on the relative changes in economic growth and urban land expansion. The formulation is as follows [36]:
U G = G t 2 G t 1 1 t 2 t 1 1 S t 2 S t 1 1 t 2 t 1 1
where U G refers to the GDP–urban land coordination elasticity coefficient. G refers to GDP of study area.
Based on study results, we classified U G into four types: GDP/urban land shrinking (e), urban land expansion-dominated (f), GDP–urban land basic coordination (g) and GDP growth-dominated (h).

4. Results

4.1. Analysis of Historical Urban Land Expansion

(1) Urban land expansion patterns
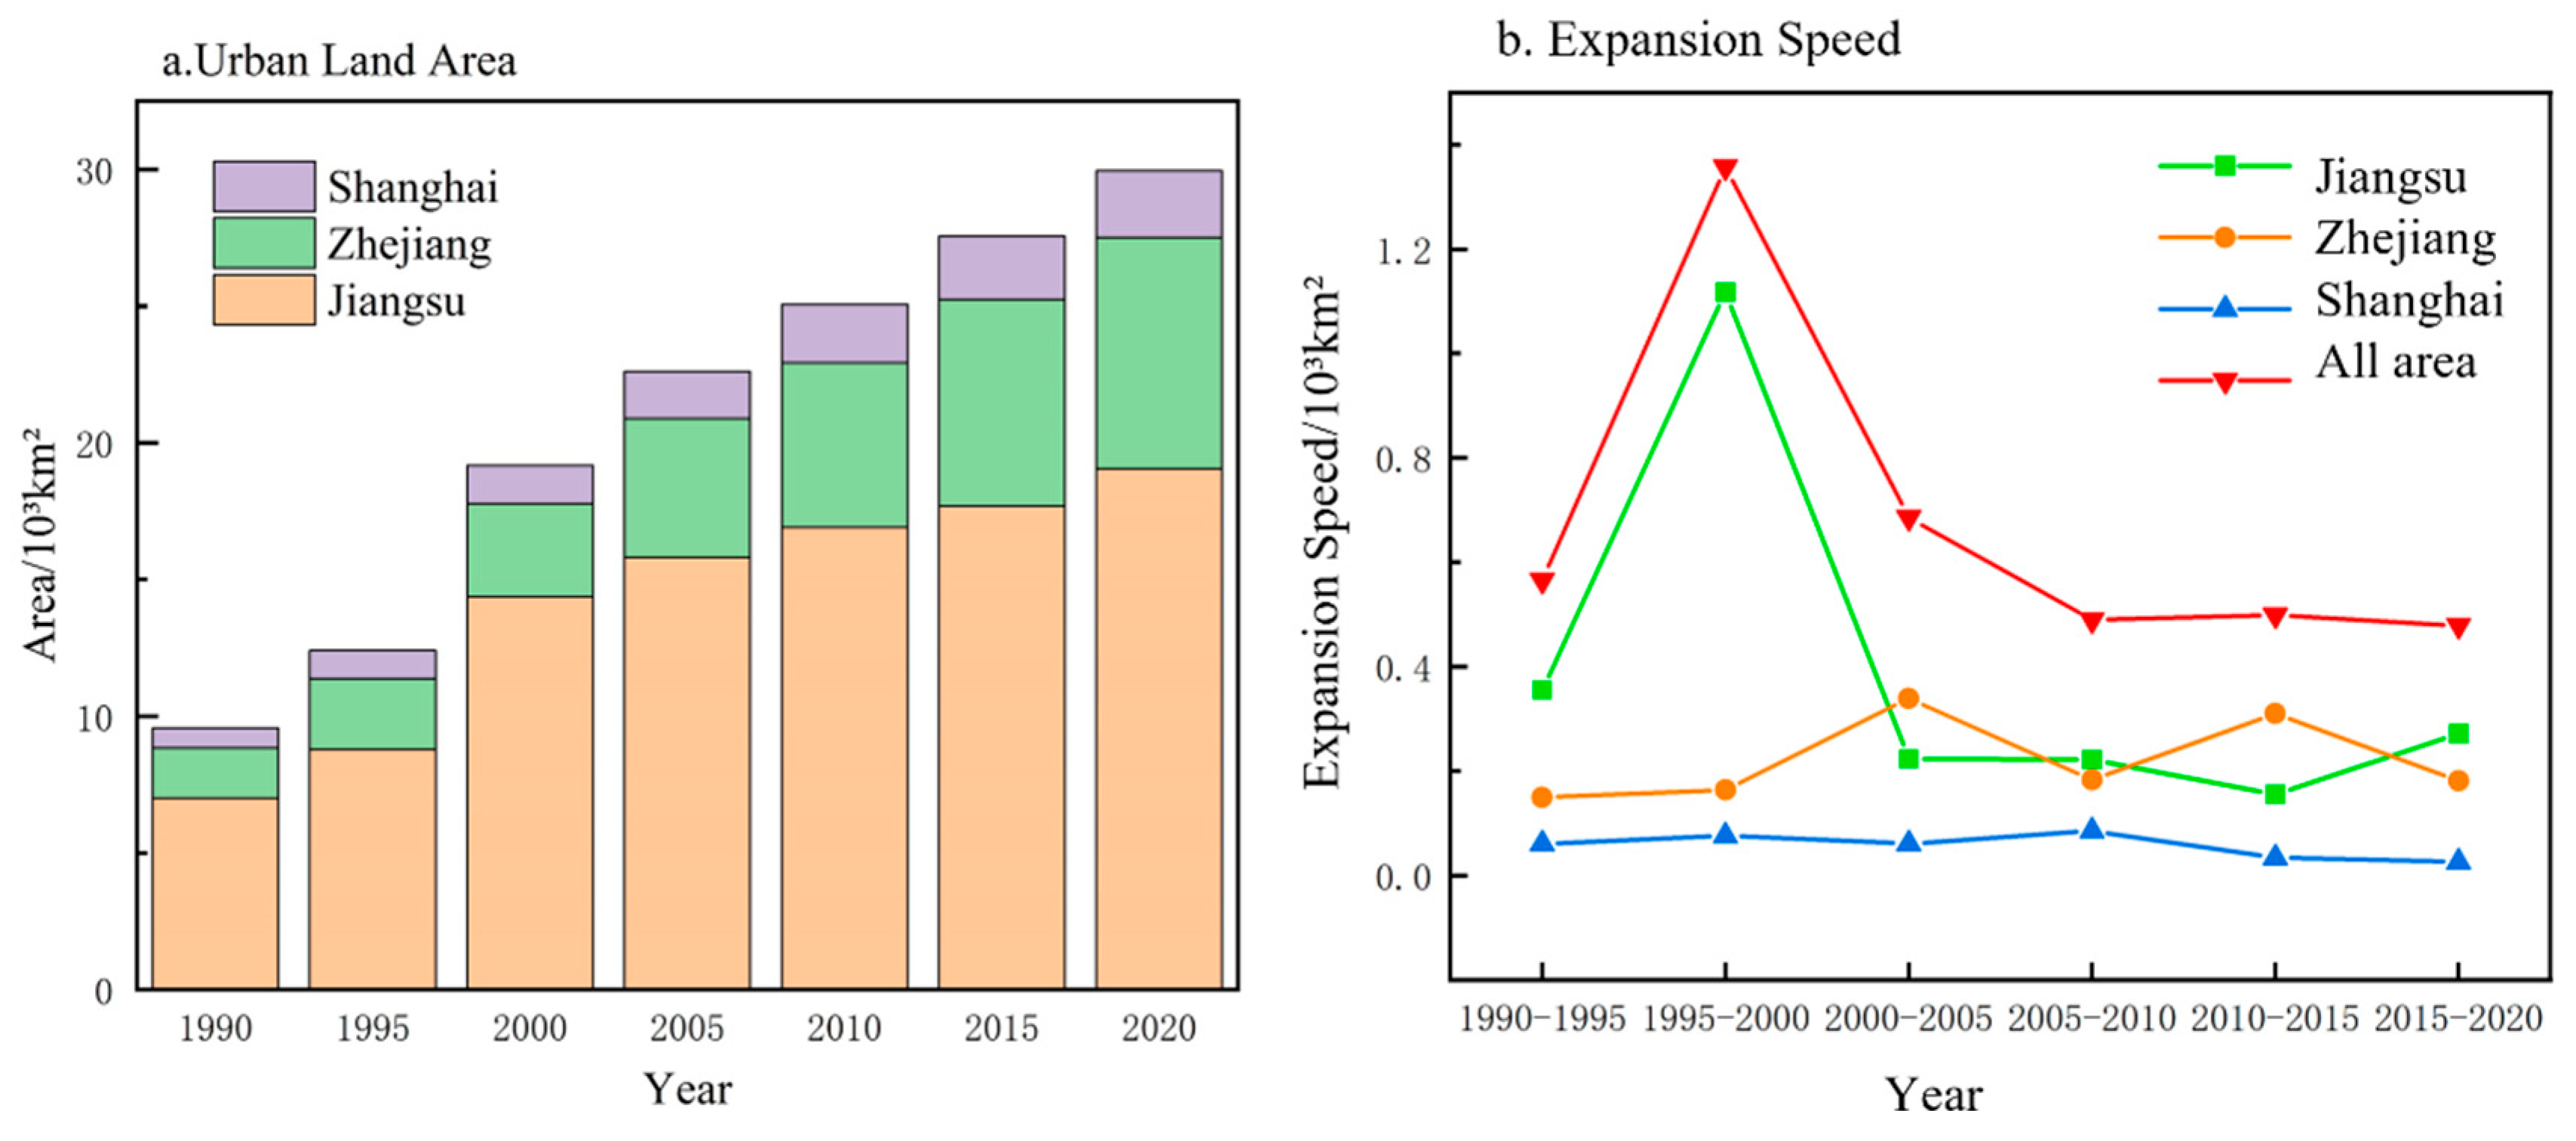
From 1990 to 2020, the urban land area exhibited continuous expansion, increasing from 9.6 × 10³ km2 to 30 × 103 km2, reflecting a growth rate of 213% (Figure 4a). The urban land expansion follows a pattern of “fast -then- slow”. The period between 1995 and 2000 marked the fastest five-year phase of urban expansion in the region (Figure 4b).
Regional variations in urban land expansion are clearly observed. As shown in Figure 4 and Table 3, the urban land area in Jiangsu Province increased from 7 × 10³ km2 to 19 × 103 km2, achieving a growth rate of 172%. Expansion remained relatively steady but peaked between 1995 and 2000, averaging 1.12 × 10³ km2/year (Figure 4b). The process of urbanization in Jiangsu Province was more balanced, reflecting a medium-fast-low transition. In contrast, Zhejiang Province saw a significant expansion from 1.8 × 10³ km2 to 8.5 × 10³ km2, resulting in a growth rate of 361%. Urban land expansion in Zhejiang was more volatile, with rapid growth alternating with periods of slower expansion. The peak years of urban expansion occurred between 2000 and 2005 and 2010 and 2015, driven by policy, economic, and regional development factors. Shanghai, with a smaller land area, expanded from 0.73 × 10³ km2 to 2.44 × 10³ km2, marking a growth rate of 234%. Overall, Shanghai experienced a gradual shift from rapid to slow urban expansion, entering a phase of deceleration between 2005 and 2010, as urbanization began to approach saturation.
From 2015 to 2020, urban land expansion rate across the study area, signaling a stabilization of the urbanization process. Looking ahead, Jiangsu Province should focus on maintaining balanced development, while Zhejiang Province must address the environmental and resource pressures arising from continued urban expansion. Shanghai, on the other hand, should explore innovative development models to manage the challenges posed by the saturation of urbanization.
(2) Spatial distribution of urban land
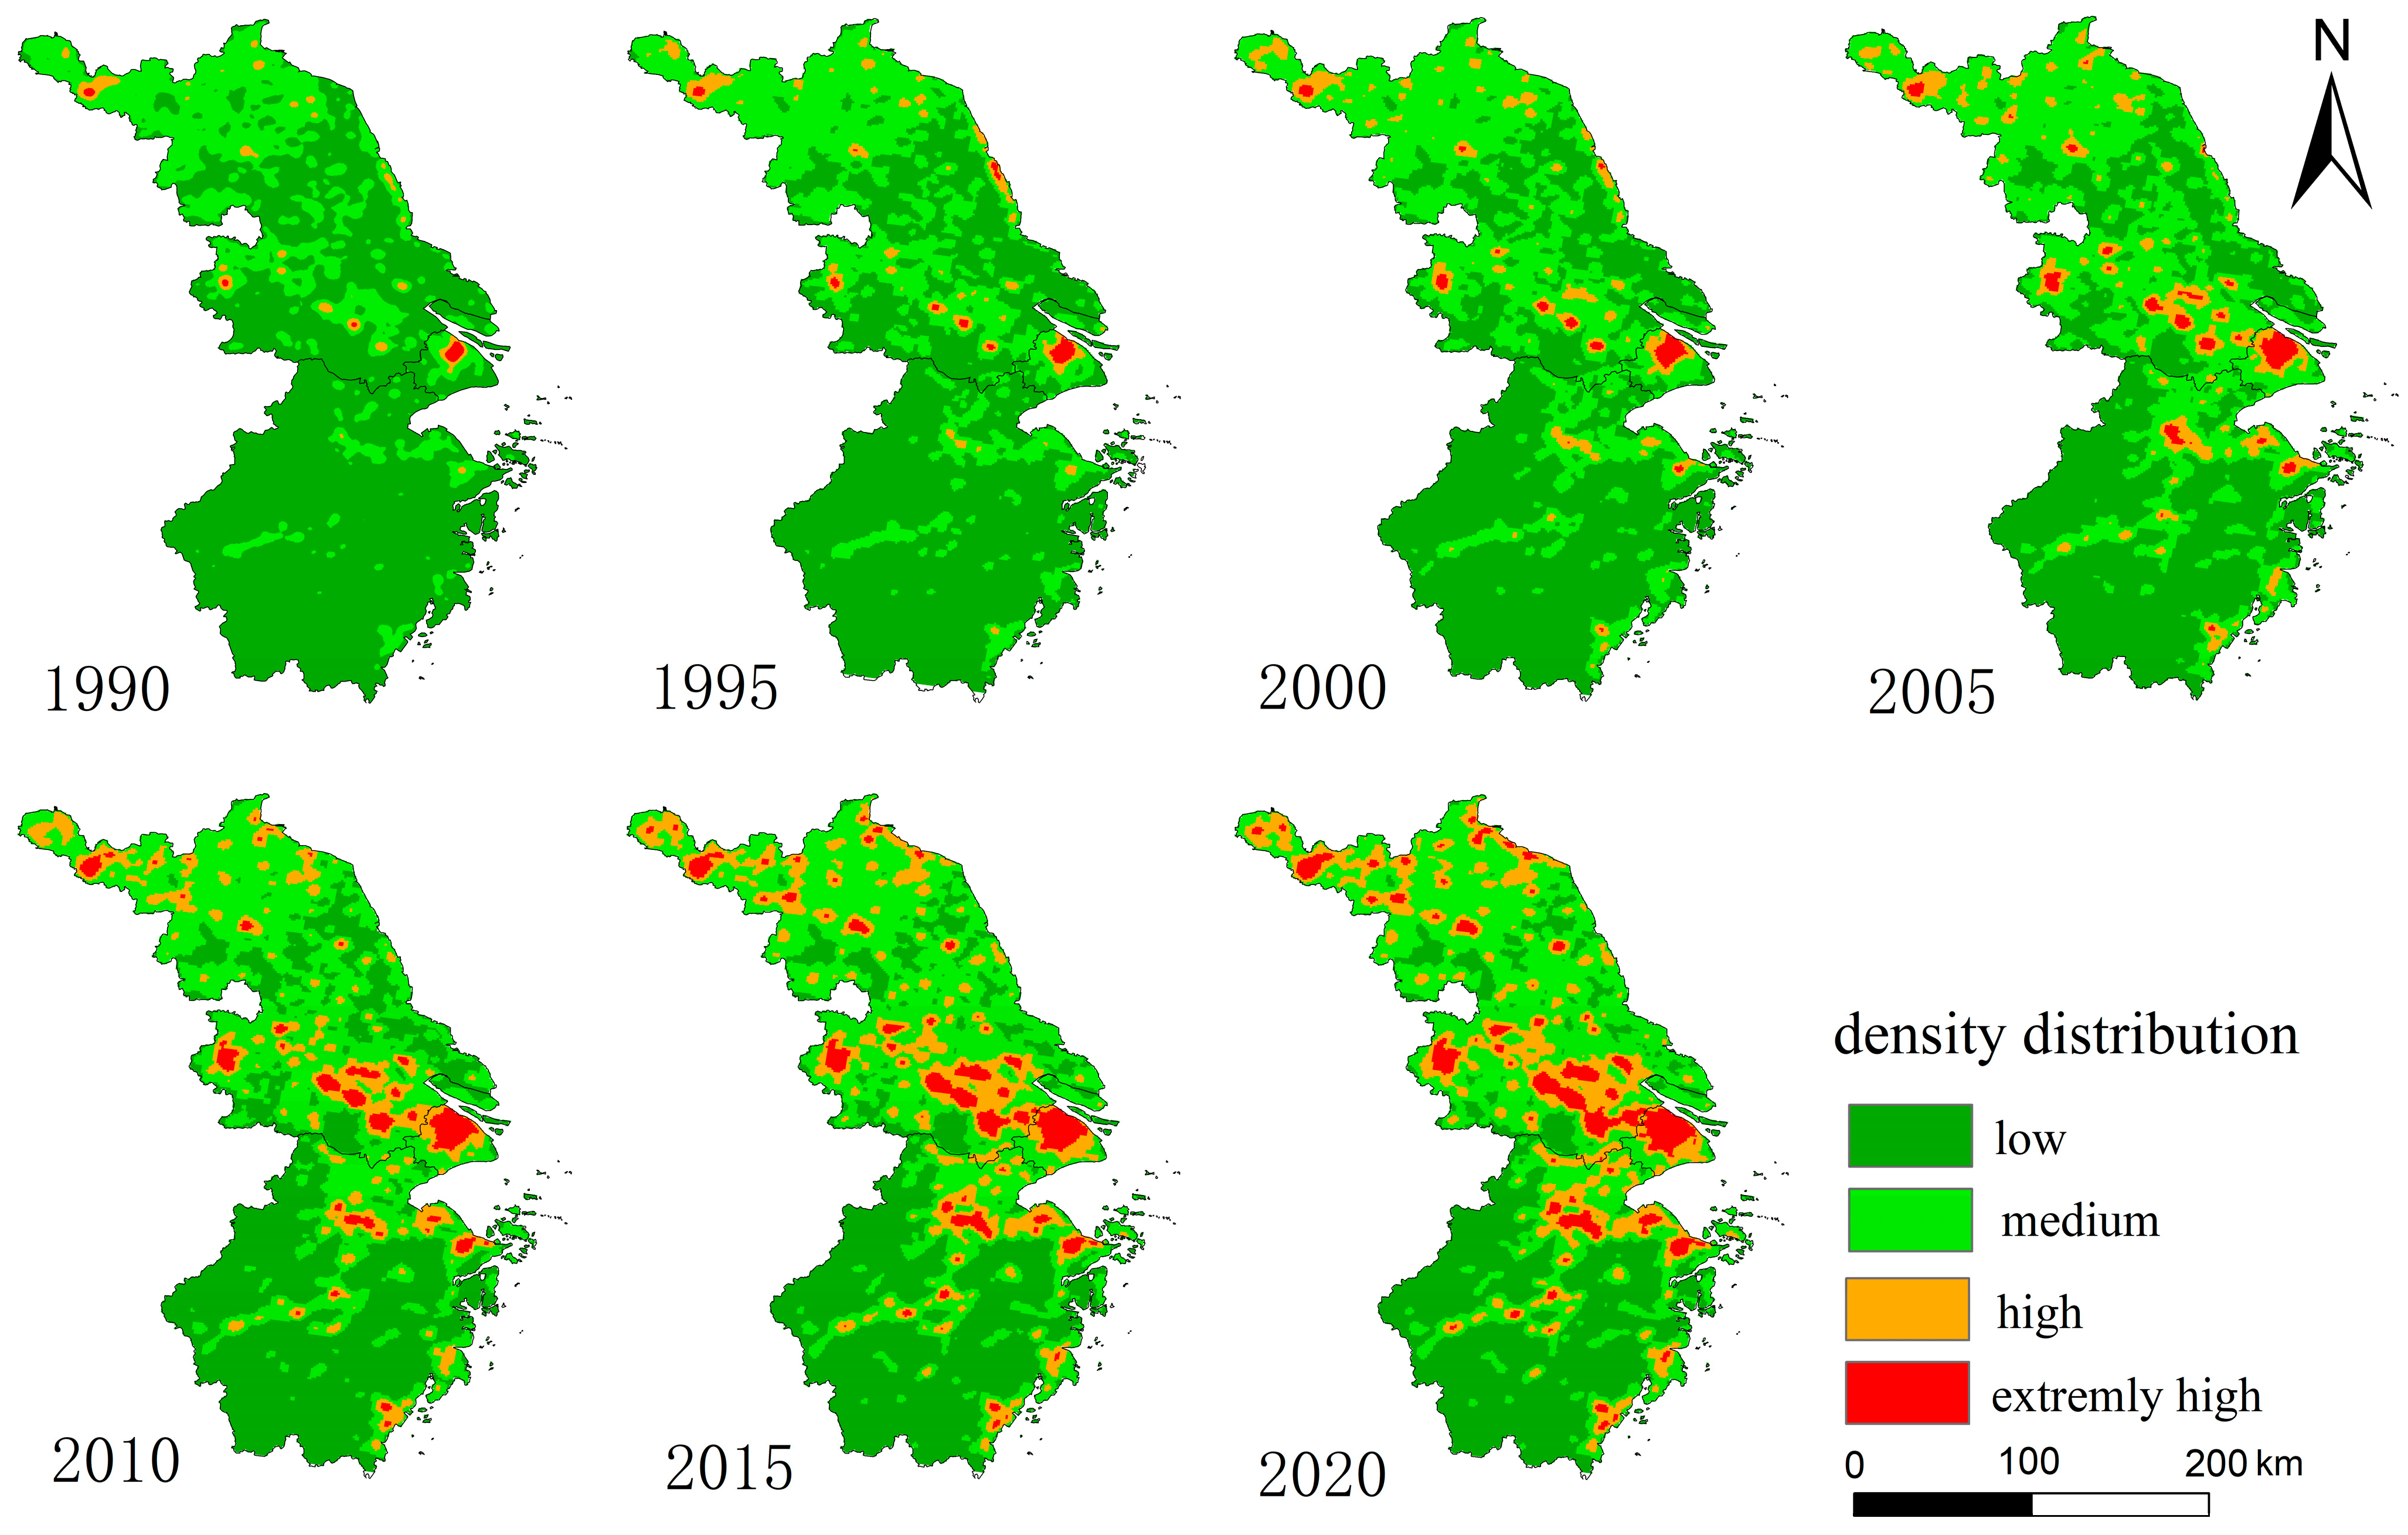
From 1990 to 2020, urban land in the study area exhibited a progressive process of spatial agglomeration, with density notably increasing in southern Jiangsu Province and Shanghai (Figure 5). Between 1990 and 2005, urban land was primarily characterized by medium and low densities, exhibiting a relatively balanced and decentralized distribution across cities without a clear centralization trend. However, from 2005 to 2020, urban land distribution saw a significant shift towards aggregation, with a large portion of urban land transitioning from medium-density areas to high-density zones. During the period from 1990 to 2020, the density of urban land in southern Jiangsu Province experienced substantial growth, resulting in the emergence of high and extremely high-density zones. This was followed by an increase in urban land density in northern Jiangsu Province, which is characterized mainly by medium- and high-density areas. In Zhejiang Province, urban land density increased in the northern and southeastern coastal regions, where land was transformed from medium-density to high and extremely high-density areas. In contrast, the rest of the province continues to be dominated by low-density urban land. In Shanghai, urban land density has consistently risen, with many areas transitioning into extremely high-density zones.
Overall, the density of urban land in southern Zhejiang has maintained relatively low density, while the areas around Shanghai have developed into an obvious high-density zone. This spatial pattern reflects varying characteristics of urban aggregation within the study area, indirectly highlighting the differences and imbalances in economic development across regions.
(3) Urban land gravity center
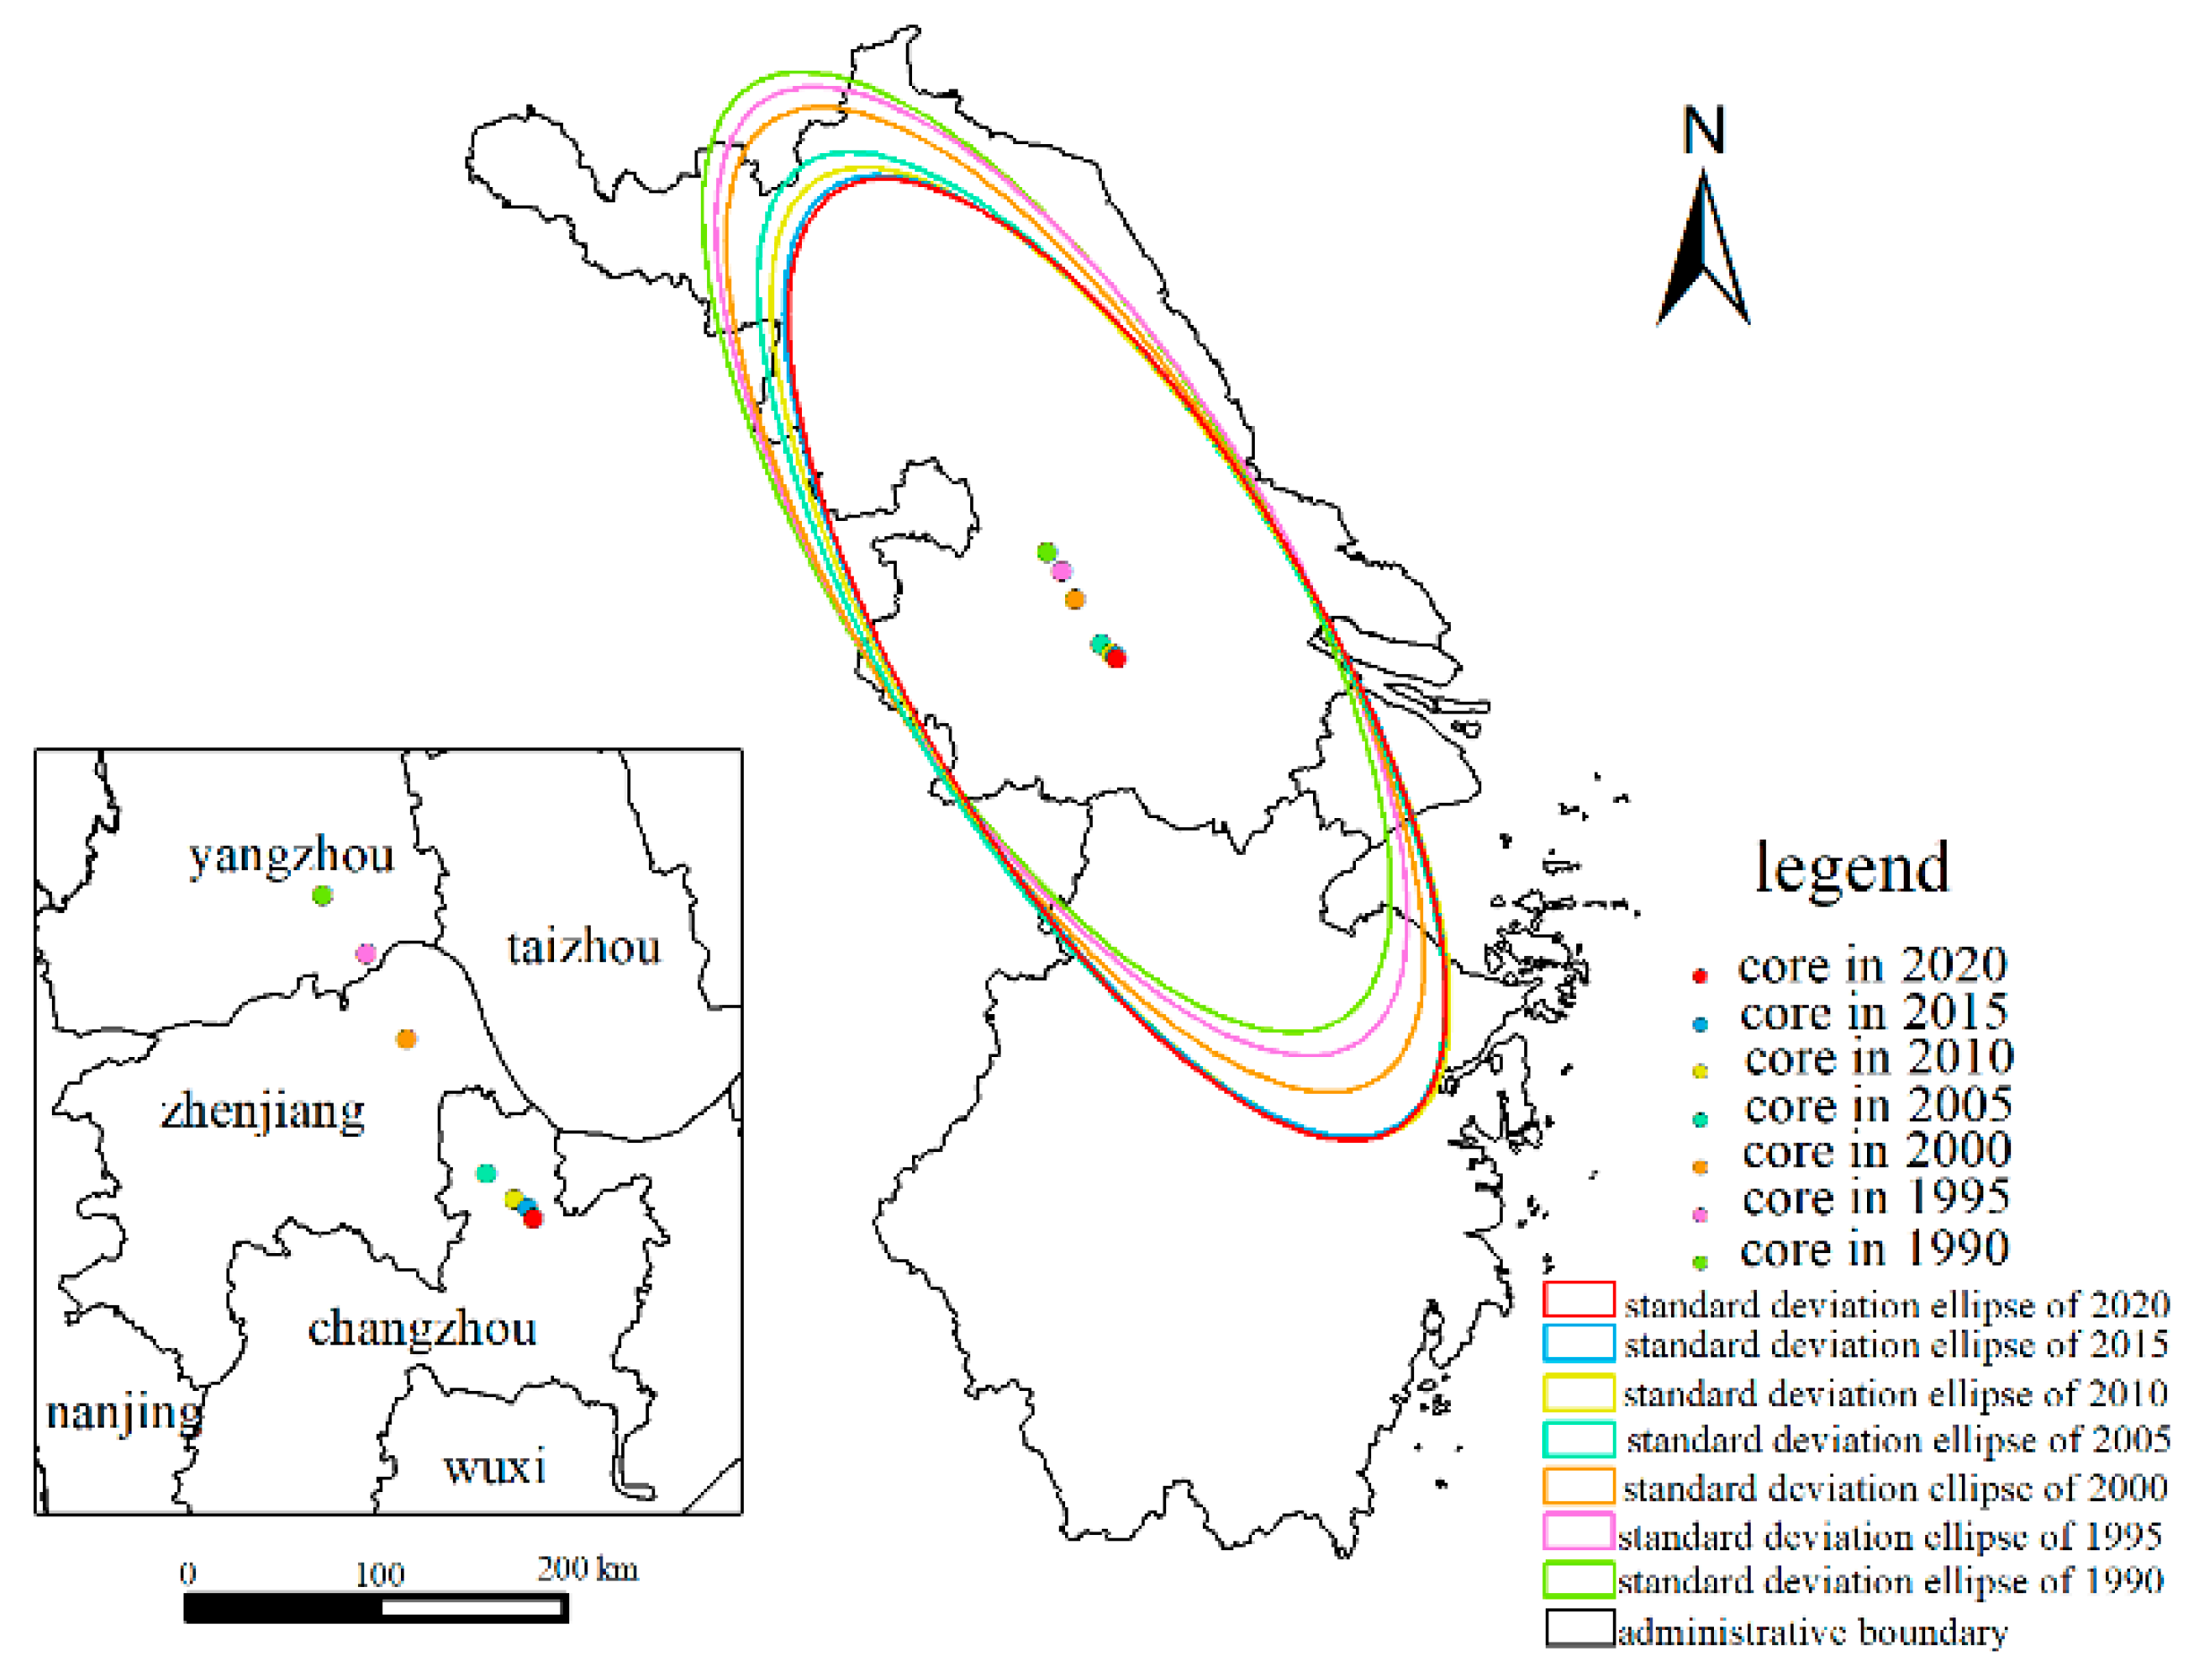
From 1990 to 2020, the center of gravity of urban land in study area was consistently located in the central region, yet exhibited a continuous southeasterly shift. The standard deviation ellipse shape and area did not change significantly, and the transfer distance was gradually shortened. As illustrated in Figure 6, the establishment of the Shanghai economic zone drove the most substantial shift during 1990–2005, with the center of gravity moving approximately 60 km. After 2005, more balanced urban land construction led to a noticeably reduced displacement, with the center shifting only 12 km between 2005 and 2020. At the municipal scale, the center of gravity of urban land was situated in Yangzhou from 1990 to 1995, with a shift distance of 13 km. Between 1995 and 2000, it moved to Zhenjiang, spanning 17 km. After 2000, continued expansion of the Shanghai Economic Zone resulted in a sustained southward shift, relocating the center to Changzhou with a displacement of 30 km.

4.2. Population and GDP Trends Under SSP1-5 Pathways

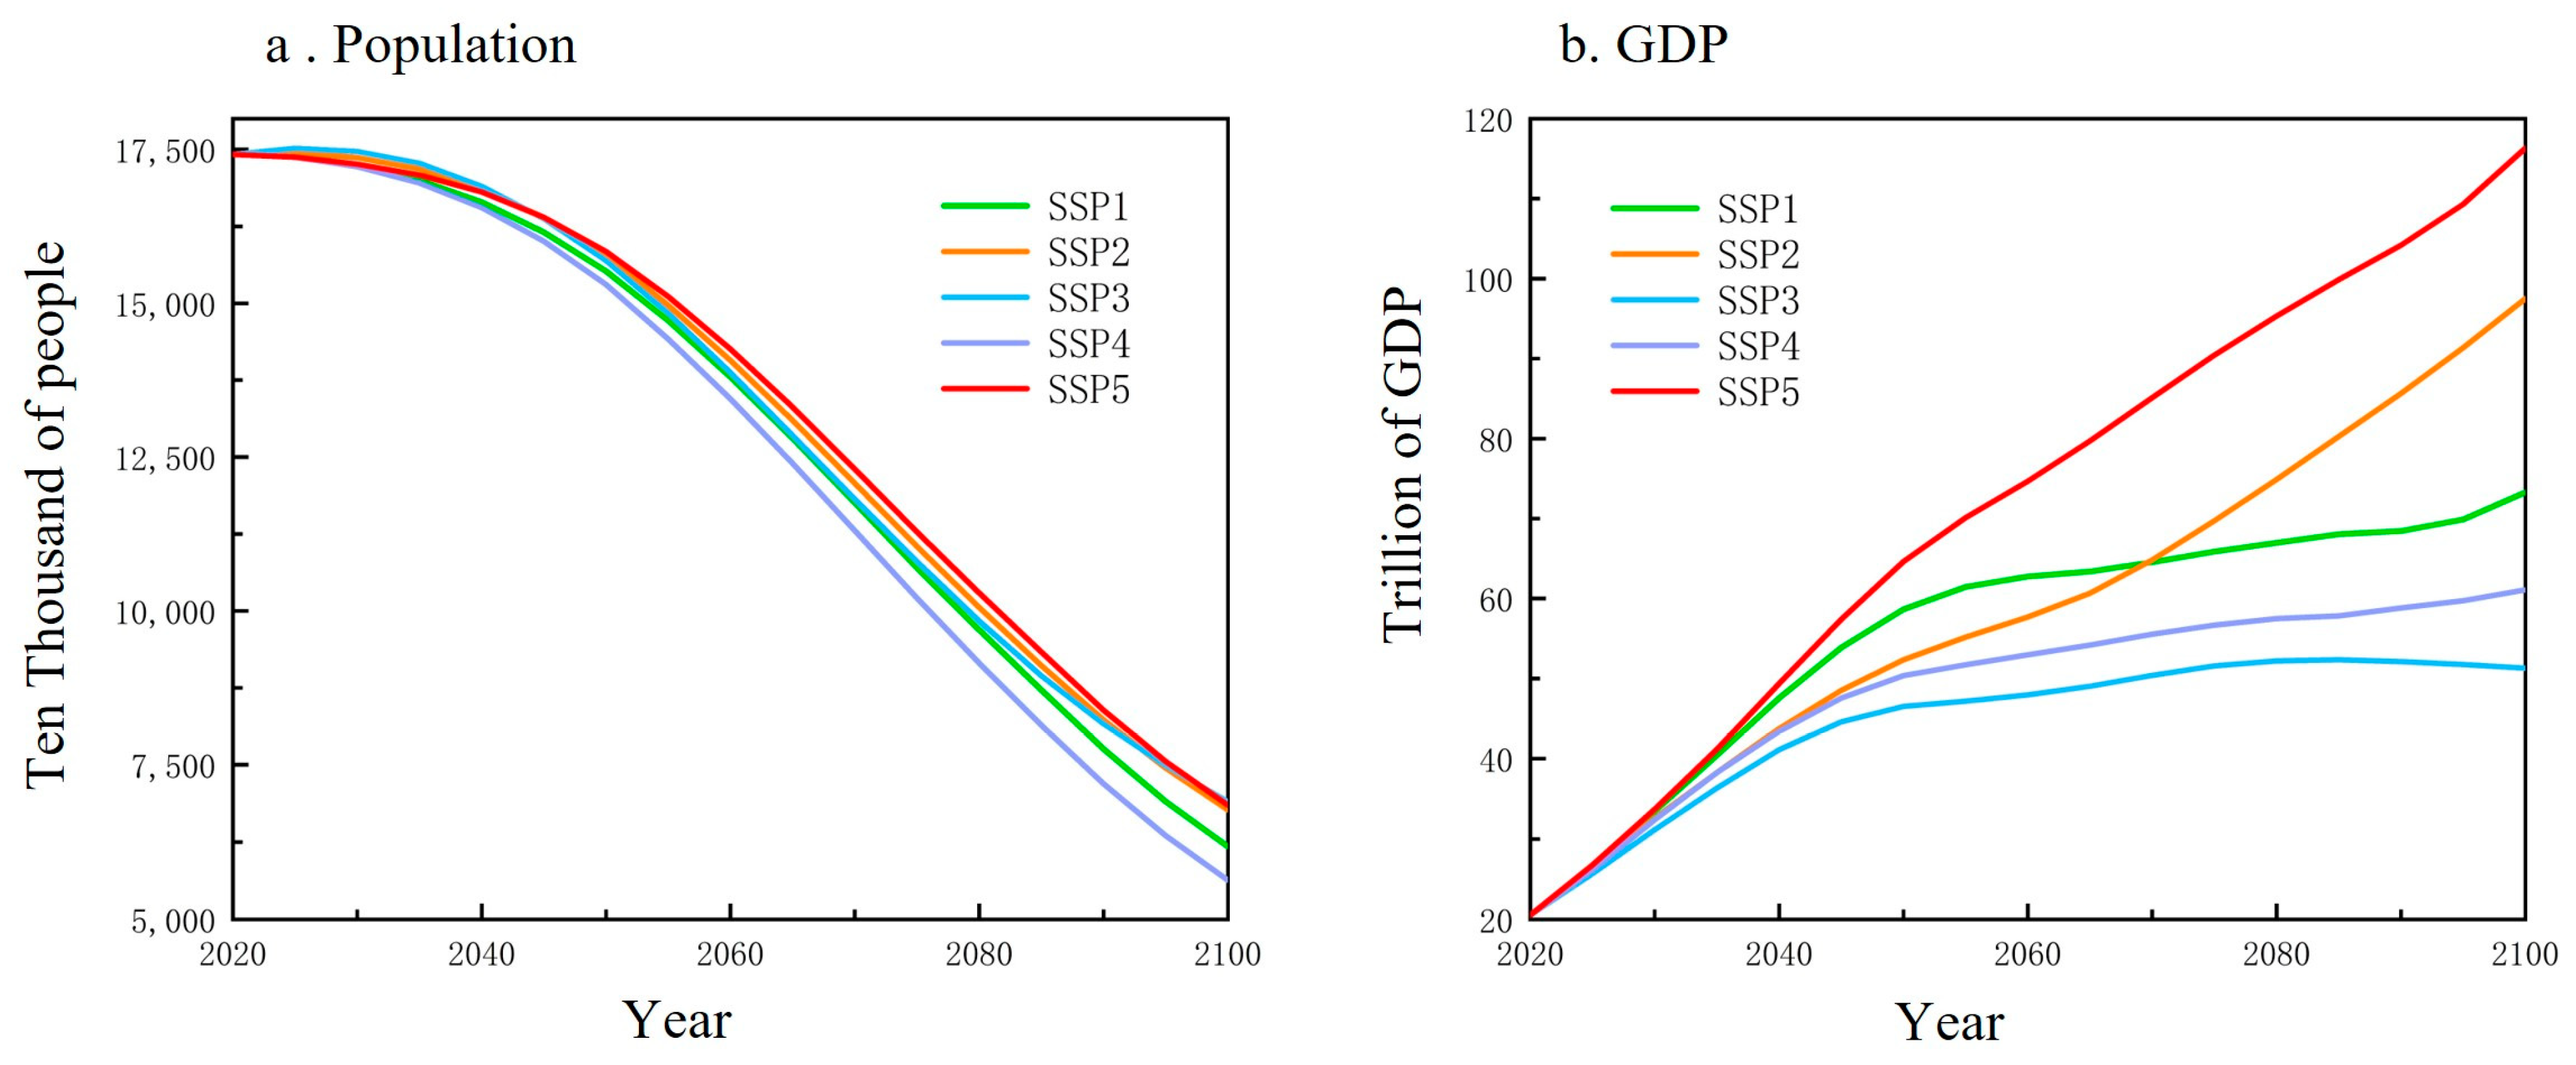
In 2020, the population was 174,336,200. Under all pathways, the population is projected to continue declining throughout the 21st century. It is projected to 56.31 million (SSP4) to 68.44 million (SSP3) by the end of the 21st century, with a decrease of about 61% to 68%. SSP4 will decrease the most rapidly, with the population decreasing to 56.31 million by the end of the century. In SSP1, the population is projected to reach 61.79 million by the end of the century. The SSP2, SSP3, and SSP5 pathways have similar population changes, with smaller differences between pathways, and the population is projected to reach 67.69 to 68.45 million by the end of this century (Figure 7a).
The GDP was CNY 20.6 trillion in 2020, and it continues to increase under all pathways in the future. It is projected to reach CNY 51 (SSP3) to CNY 116 (SSP5) trillion by the end of this century, which is an increase of about 2.5 to 5.6 times. There are obvious differences in GDP changes in study area between the pathways, with the SSP5 growing most rapidly, SSP2 trending similarly to SSP5 but at a slower rate of growth at about CNY 116 and 98 trillion by the end of the century. Respectively, SSP1, SSP3, and SSP4 show trending similarly, with GDPs of CNY 73.3, 51.3 and 61.1 trillion by the end of the century (Figure 7b).
Overall, the population in study area is projected to exhibit a continuous decline from 2021 to 2100, with relatively minor variation across the different pathways. In contrast, GDP shows sustained growth across all scenarios, characterized by rapid expansion in the near term followed by a gradual slowdown. Significant disparities in economic performance among the pathways become especially pronounced between 2050 and 2100.

4.3. Urban Land Expansion Trends Under SSP1-5

(1) Urban land expansion patterns
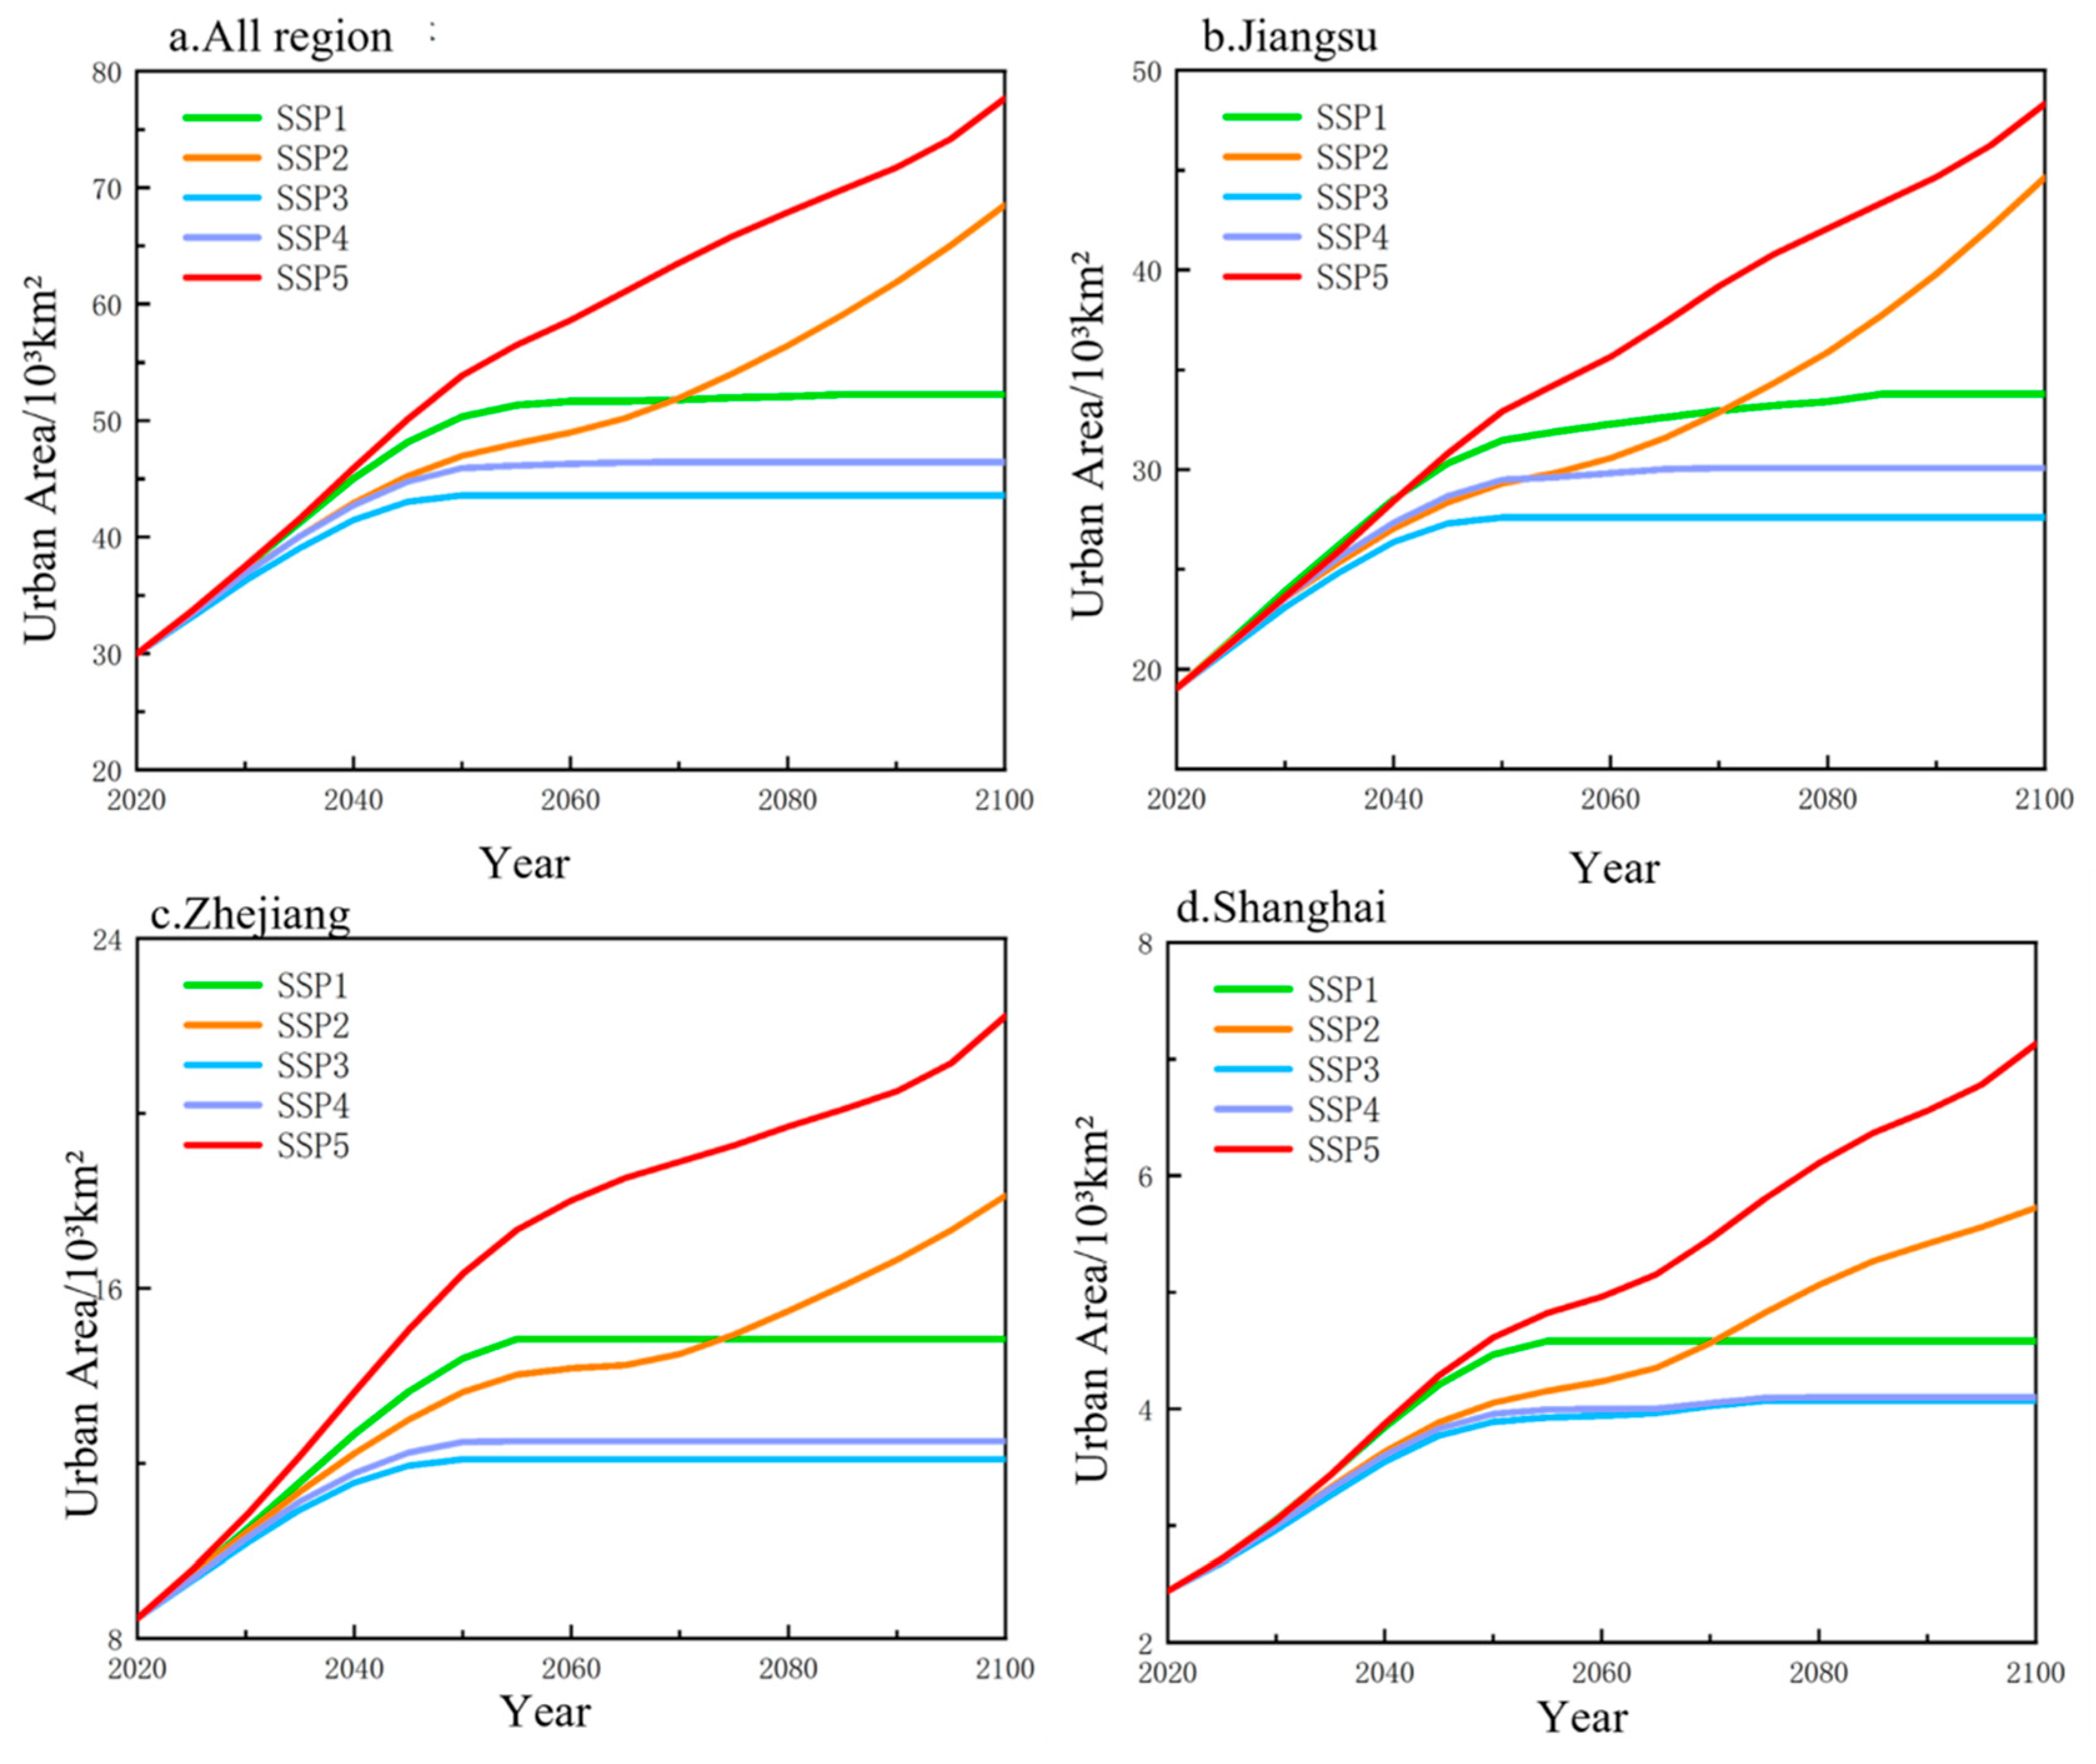
The urban land area of study area was 30 × 103 km2 in 2020. By the end of the 21st century, it is projected to be 44 × 103 km2 (SSP3) to 78 × 103 km2 (SSP5) with a growth rate of 47% (SSP3) to 160% (SSP5). Urban land expansion varies considerably across pathways: SSP2 and SSP5 show continuous growth, with SSP5 exhibiting the fastest expansion. Meanwhile, SSP1, SSP3, and SSP4 exhibit similar trends, continuing to increase from 2020 to 2050, then stabilizing with minimal change from 2050 to 2100 (Figure 8).
As indicated in Table 4, the rates and scales of urban expansion differ noticeably among the pathways. In SSP1, the urban expansion is relatively slow, with a notable decline between 2040 and 2050. This suggests urbanization may prioritize resource conservation and environmental protection. SSP2 shows a moderate expansion rate, intermediate between SSP1 and SSP5. The growth trend remains stable, with the urban expansion rate in Jiangsu and Zhejiang continuing at a steady pace from 2050 to 2100, indicating sustained urbanization. In SSP3, the expansion rate decreases significantly between 2040 and 2050 due to resource constraints and regional competition, leading to a stabilization in the latter half of the century. SSP4 follows a pathway similar to SSP3, though Jiangsu Province remains a relatively high expansion rate of 0.2 × 10³ km2/year during 2040–2050. This implied urbanization in Jiangsu may remain relatively strong under this pathway. SSP5, while similar to SSP2 in terms of urban land expansion, exhibits a faster pace of urbanization, peaking between 2030 and 2040 before gradually declining.
In summary, the rate of urban land expansion in the study area is projected to highest during 2020–2030, reflecting a phase of accelerated urbanization, before gradually decelerating. The urban expansion levels in the municipalities of the study area generally mirror those of the region as a whole, characterized by medium-speed expansion and improved regional integration. Jiangsu Province shows a faster and more consistent expansion rate, while Zhejiang exhibits greater fluctuation. Under SSP1 and SSP2, rapid urbanization is projected to be between 2040 and 2050, with pathway-specific influences playing a key role. In contrast, Shanghai displays a more mature urbanization pattern, with a relatively stable expansion rate. However, under the SSP3 scenario, Shanghai is projected to achieve higher expansion rates between 2040 and 2050 compared to the overall study area, indicating a period of rapid urban expansion.
(2) Spatial distribution of urban land under SSP1-5
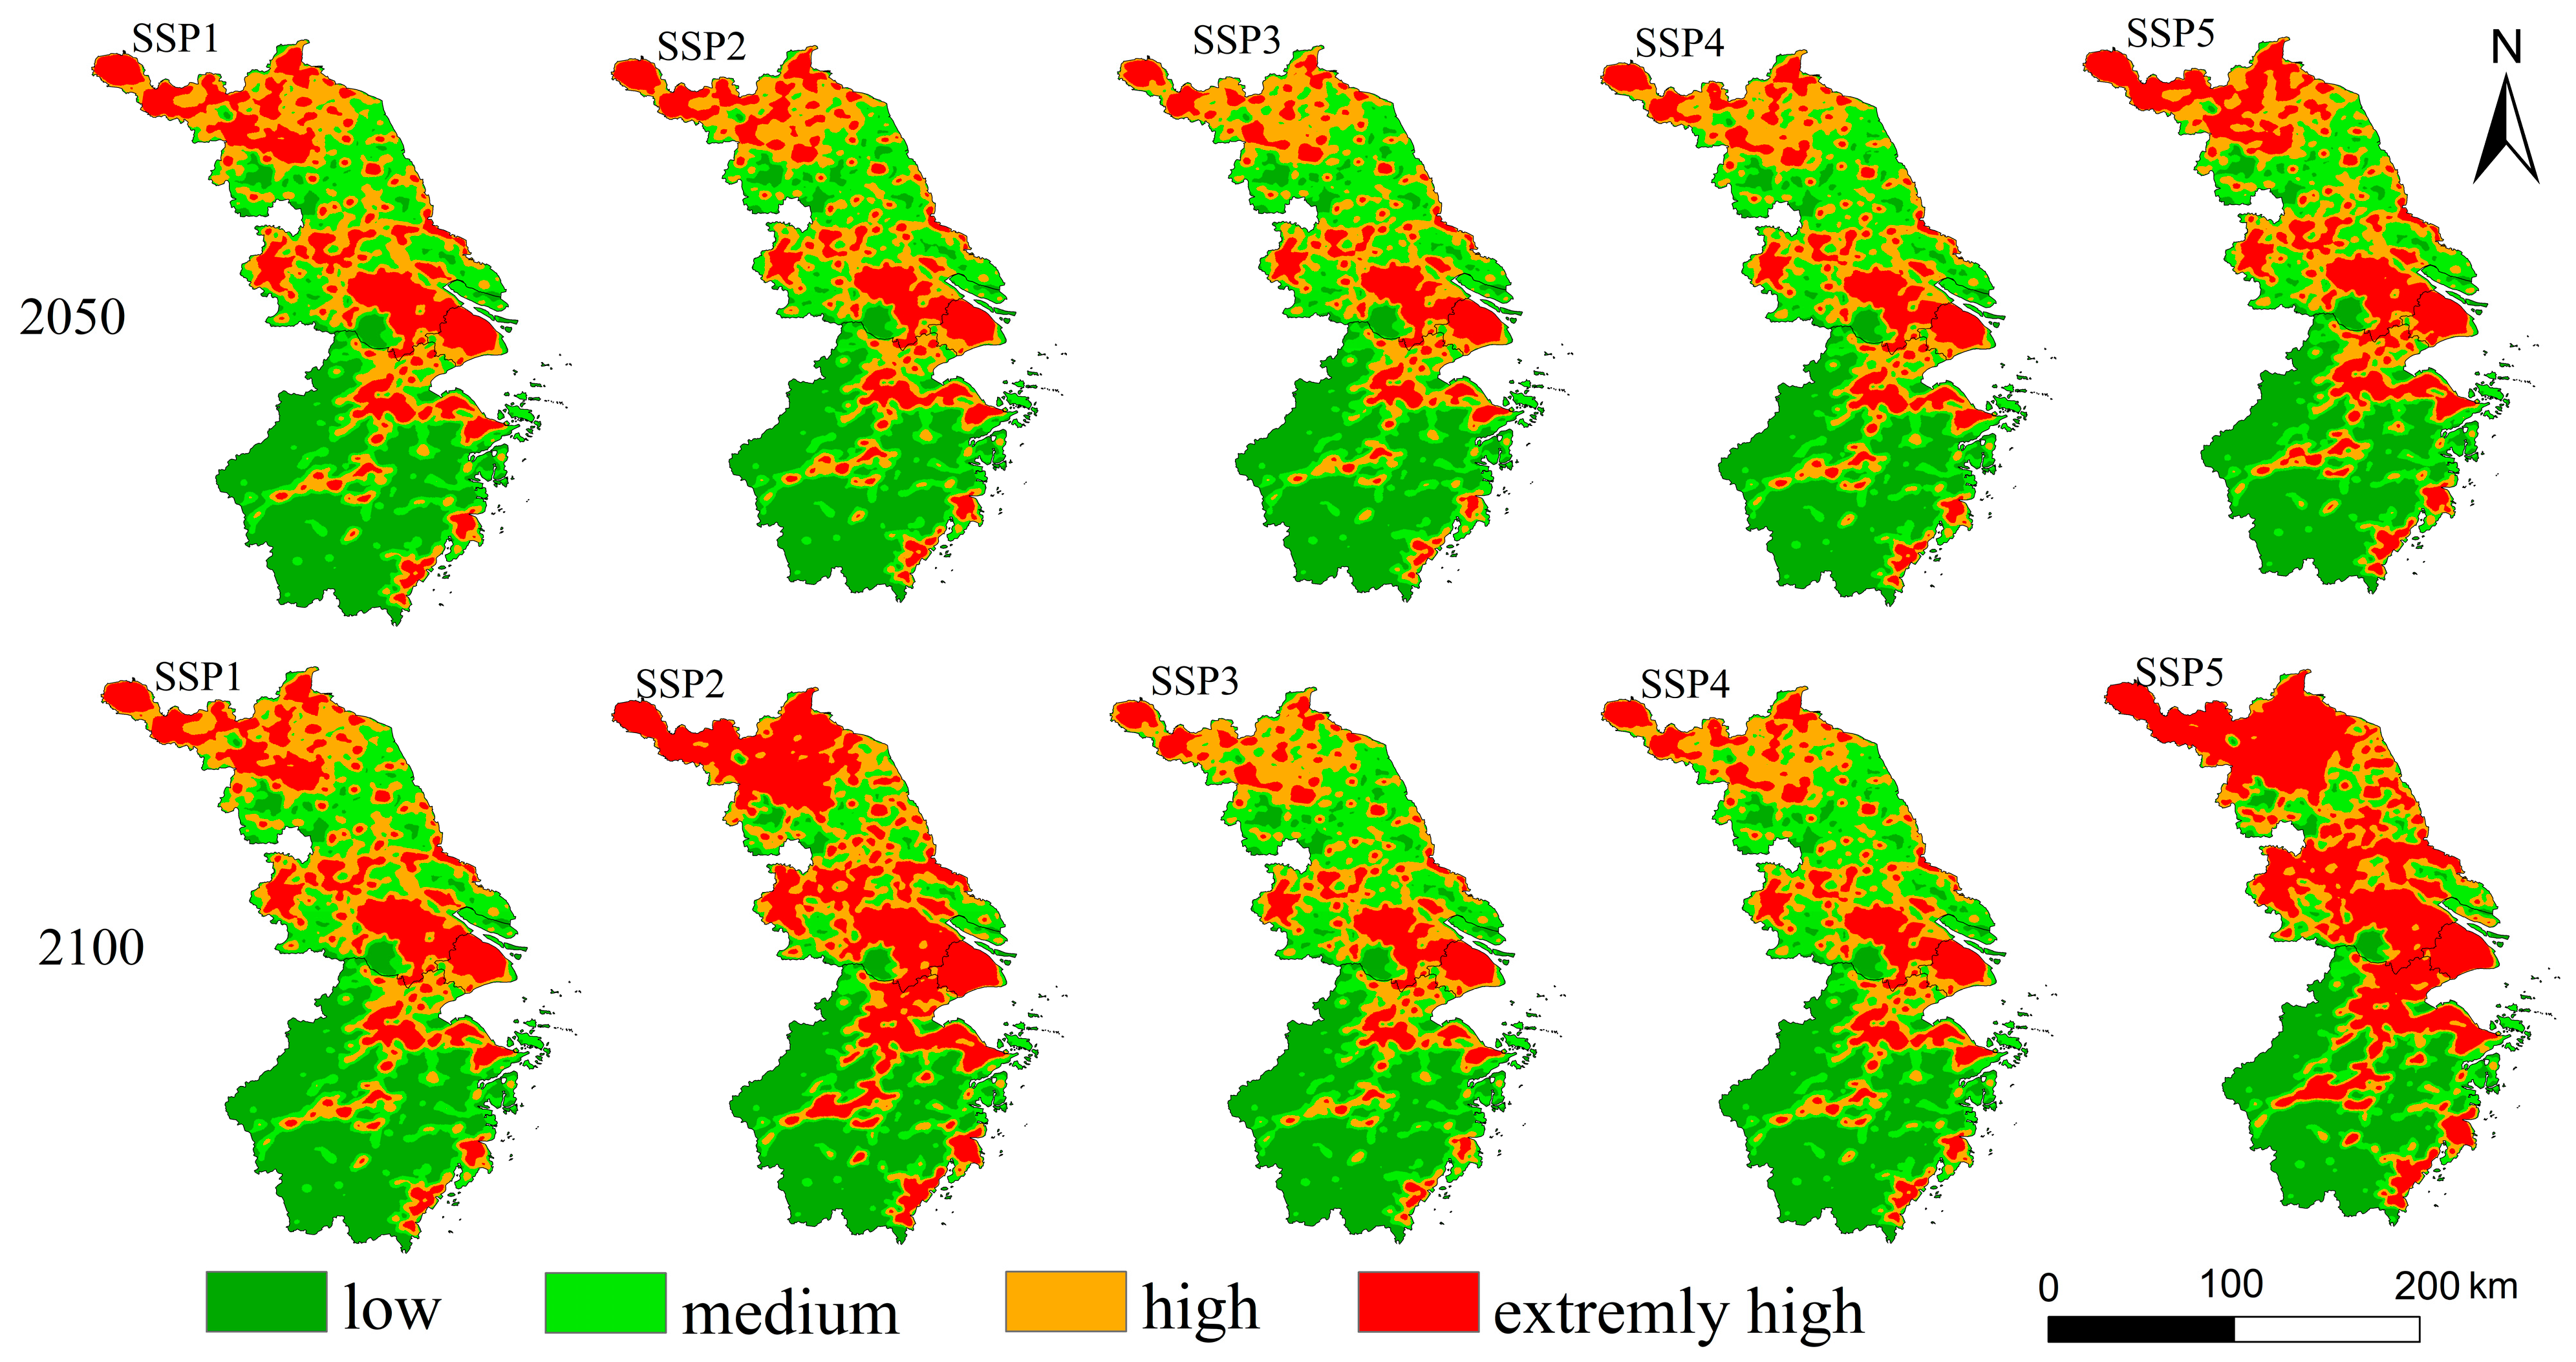
Compared with the historical period (1990–2020), the increase in urban land in the northern and central regions of the study area is projected to be most pronounced in the future (Figure 9). Under the SSP1-5 pathways, urban land expansion remains evident and spatial clustering becomes increasingly marked. By 2050, large portions of Jiangsu Province, Shanghai, northern Zhejiang Province, and coastal areas will transition into very high-density zones, exhibiting a highly concentrated spatial pattern. The projections for the 2050–2100 period reveal notable divergence across different pathways. Under SSP1, SSP3, and SSP4, there are projected to be minimal changes in urban land distribution, with kernel densities remaining largely stable. In contrast, SSP2 and SSP5 are characterized by continued spatial aggregation, with a substantial portion of the area being converted into very high-density zones.
Overall, in 2021–2100, the region is projected to evolve into an area of extremely high urban land density, with increasingly concentrated spatial distribution. Under the sustainability pathway (SSP1), the overall scale of urban expansion is considered moderate and spatially rational. However, the high aggregation observed in Shanghai and Suzhou warrants attention. Relevant authorities need consider measures such as controlling building density, promoting high-rise buildings in suitable areas, and expanding green infrastructure to enhance the urban ecological quality.
If the current trends persist (SSP2) or high economic development continues (SSP5), a significant concentration of urban land is projected to in northern Jiangsu, southern Jiangsu, and northern Zhejiang. Meanwhile, southwestern Zhejiang is projected to maintain relatively low kernel densities. This may lead to an imbalanced urban spatial structure, characterized by disordered expansion and significant encroachment on ecological land.
(3) Urban land gravity center under SSP1-5
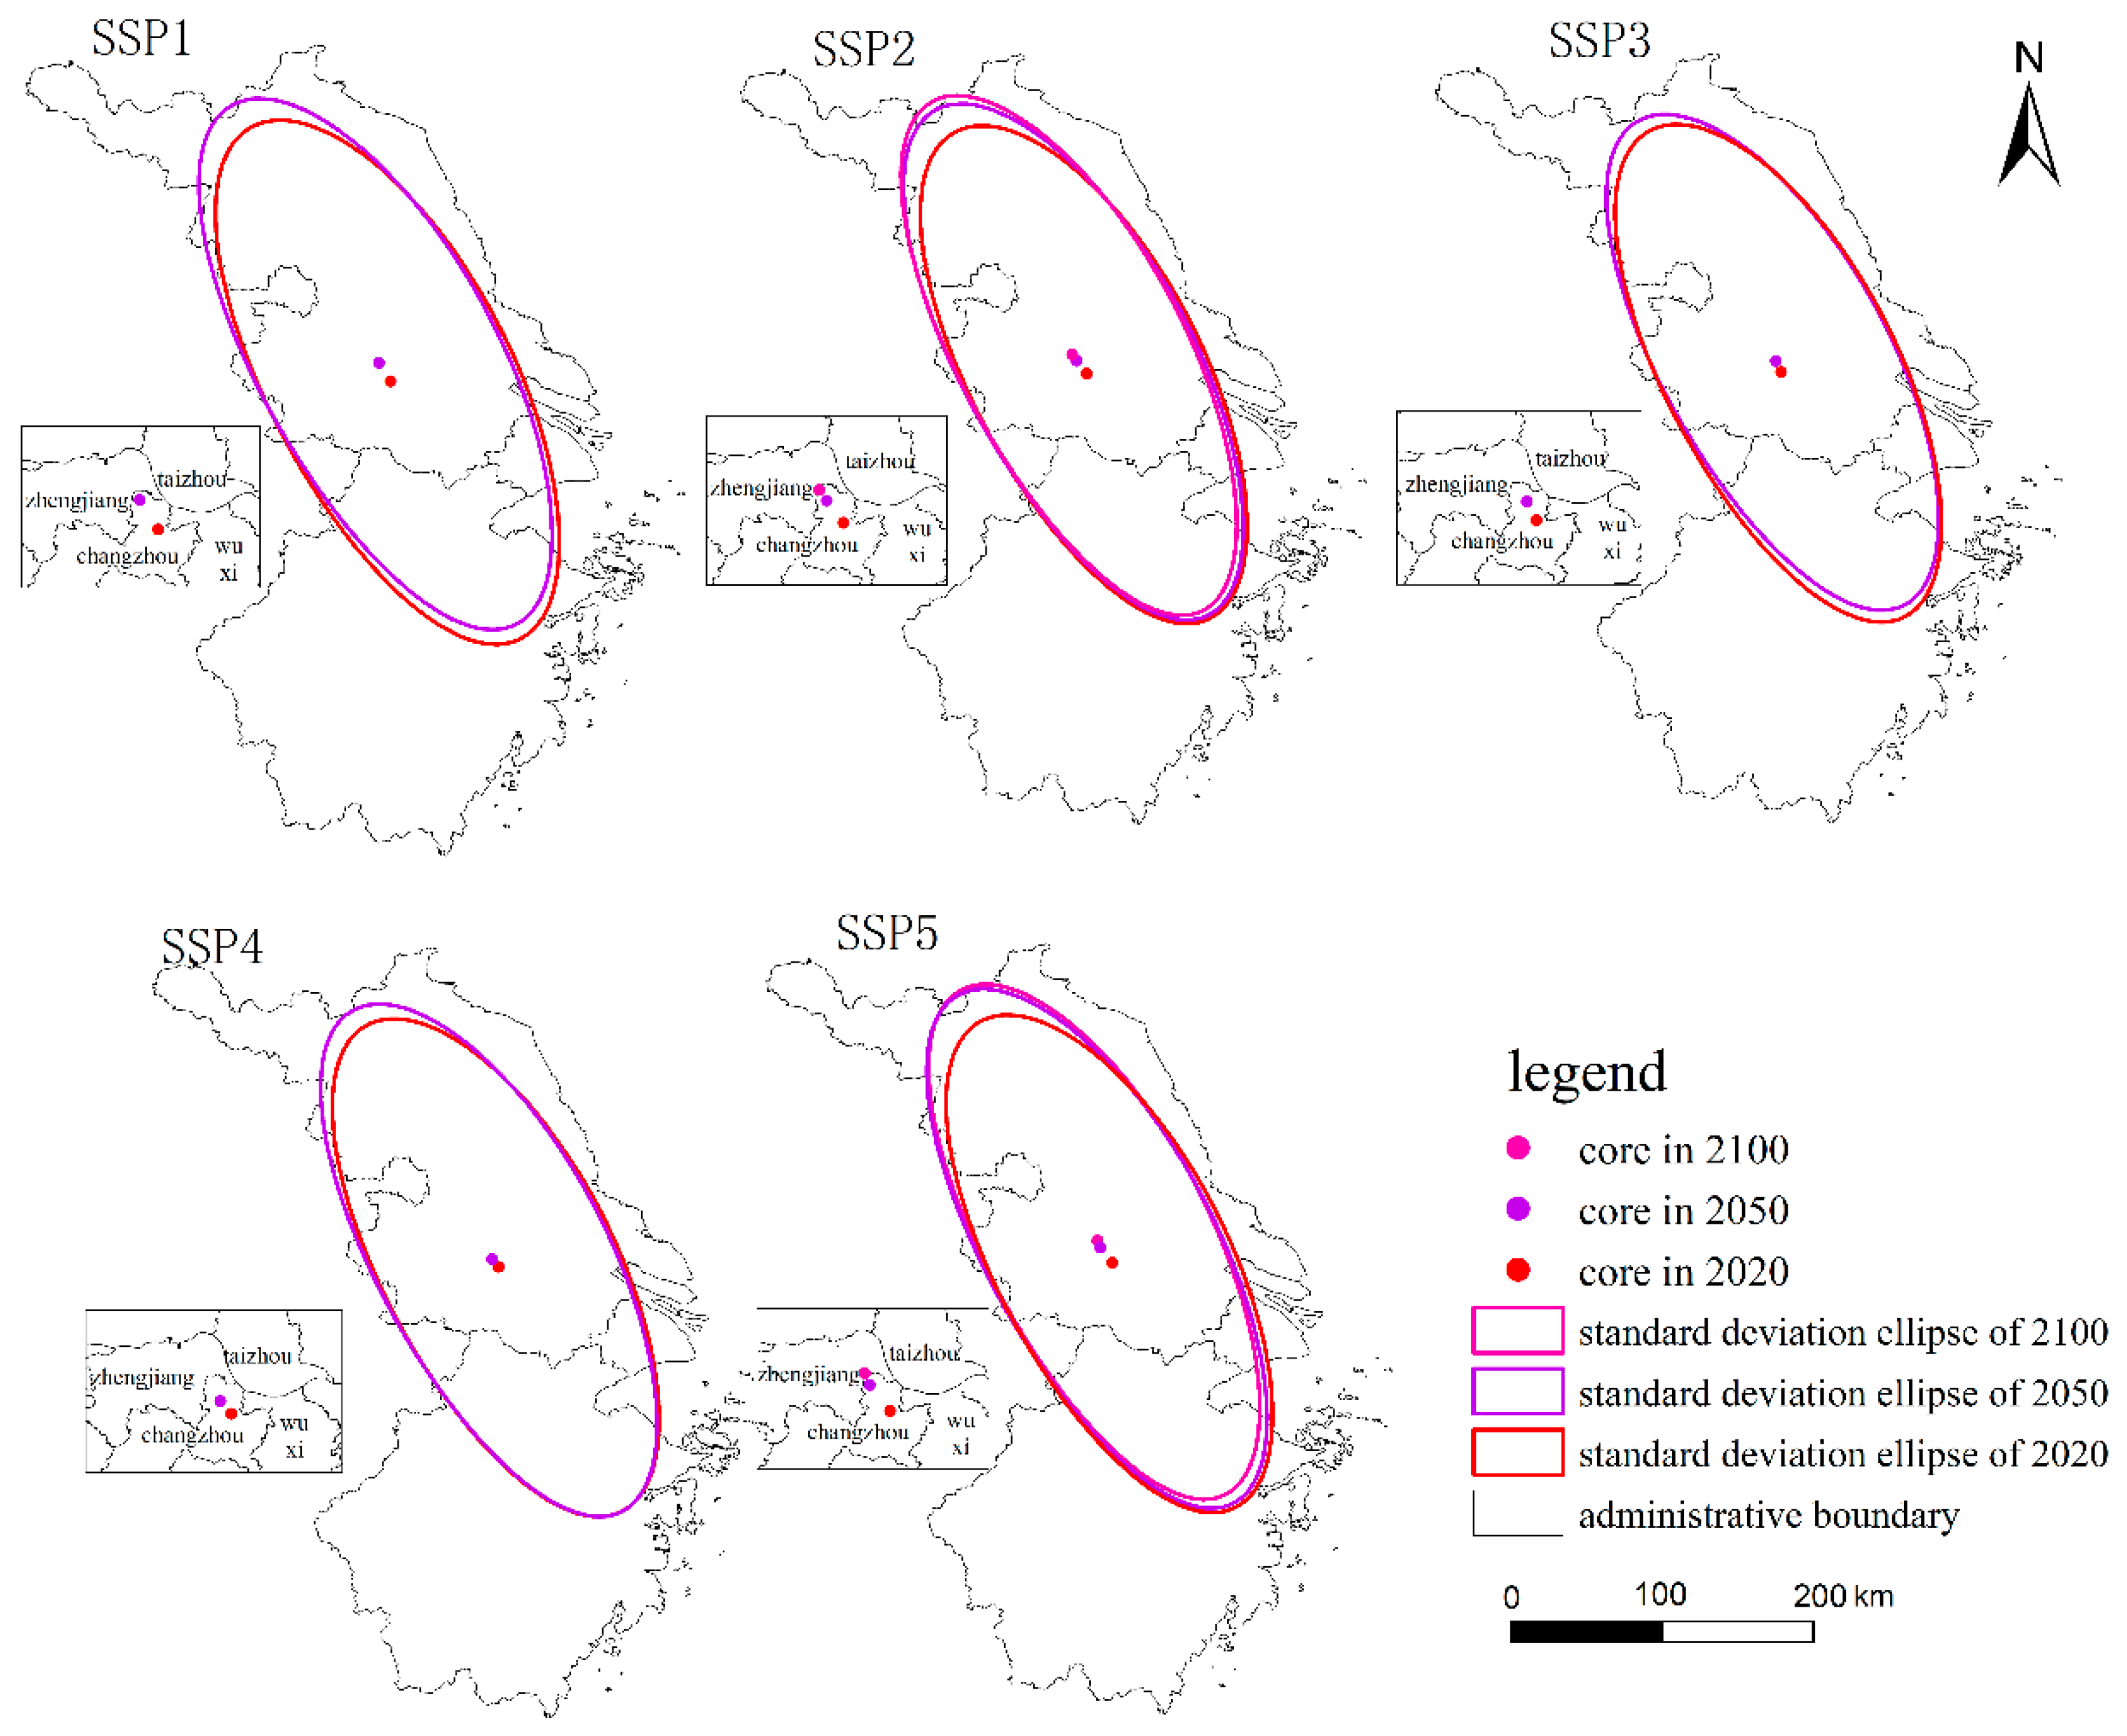
Influenced by population decline and economic development, the center of gravity of urban land in study area is projected to shift northwest in the future. However, the overall transfer distance is projected to relatively limited, with minimal change in the shape and area of the standard deviation ellipse (Figure 10). Before 2050, economic development and population concentration are projected to drive the most substantial shifts in northern Jiangsu Province. Under SSP1 and SSP5, the center of gravity is projected to move approximately 22 km and 21 km, respectively. SSP2 follows with an expected shift of around 18 km, while SSP3 and SSP4 show more modest displacements of about 13 km and 10 km. In 2050–2100, the urban land demand in SSP1, SSP3, and SSP4 is projected to stabilize, resulting in negligible movement of the center of gravity. Conversely, SSP2 and SSP5 are projected to continue shifting northwestward. By 2100, the center is anticipated to relocate northward to the vicinity of Zhenjiang, with a total displacement limited to approximately 8 km.

4.4. Coordination Between Urban Land, Population, and GDP

(1) Historical coordination
From 1990 to 2020, the urbanization process in Jiangsu Province was characterized by low-density population distribution and extensive urban land construction, resulting in relatively low urban land use efficiency. During this period, the relationship between GDP and urban land expansion during this period primarily reflected a GDP-driven growth pattern, indicating that economic development heavily relied on continuous land consumption. In contrast, Zhejiang Province experienced a gradual decrease in population density. Especially after 2015, the focus has shifted toward the more intensive use of land resources. Accordingly, the relationship between economic growth and urban land expansion became more balanced, transitioning to a basic synergistic model of GDP and urban land. Meanwhile, Shanghai urbanized rapidly with high population density yet relatively loose spatial growth. Economic growth in Shanghai is gradually becoming more dependent on urban land expansion, transitioning from a basically synergistic relationship to GDP-dominated growth pattern (Table 5).
Historically, urban land development in study area outpaced population growth, leading to a decline in population density and relatively low land utilization efficiency. To promote sustainable land development, it is essential to optimize the economic growth model and reduce dependency on urban land expansion. Jiangsu Province and Shanghai should consider adopting a compact city development model, which would entail optimizing urban planning and land resource allocation, thereby improving land use efficiency.
(2) Future coordination under SSP1-5
As summarized in Table 6, the coordination between economic growth and urban land expansion in the study area remains relatively balanced across all pathways from 2020 to 2100. The GDP–urban land relationship consistently follows a basic synergistic pattern. There is no significant difference in the degree of synergy between population-urban land and GDP-urban land across the various pathways in the study area.

5. Discussion

5.1. Spatiotemporal Dynamics of Urban Land

Our analysis reveals distinct spatiotemporal changes in urban land from 1990 to 2020, with significant regional variations in the study area. The study period can be divided into two main phases: During the rapid expansion phase (1990–2005), the development of the Pudong New Area in Shanghai attracted a significant amount of foreign investment. However, due to restrictions on population inflow, the overall increase in urban land has been relatively slow. The implementation of riverside development strategies and the concentration of foreign investment in the southern part of Jiangsu province, coupled with the rapid development of small townships and development zones, drove the accelerated expansion in Jiangsu Province. In Zhejiang Province, the establishment of the Hangzhou Bay Cross-Sea Bridge between 2000 and 2005 facilitated regional integration and emphasized the development of coastal and mountainous areas, leading to the most significant increase in urban land. After 2005, the urban expansion access moderated growth phase, and greater emphasis was placed on high-quality development and regional integration. By 2020, the urban land had reached 30 × 103 km2, with the center of gravity of urban land shifting southeast, a trend consistent with previous studies [37]. While national-scale studies project declining urban land demand after 2050 [18], our projections suggest urban land demand in the Yangtze River Delta (YRD) may continue to increase between 2050 and 2100, particularly under SSP2 and SSP5. This may be attributed to the varying economic development across Chinese provinces and municipalities under different pathways, which affects urban land demand [38].
The coordination between economic growth and urban land expansion in the study area, as summarized in Table 6, is projected to remain relatively balanced across all SSPs from 2020 to 2100, with the GDP–urban land relationship consistently exhibiting a synergistic pattern. However, a key finding is that decreasing population levels are projected to result in less efficient utilization of urban land, accompanied by a trend toward population dispersion. Although no significant difference in the synergy degree was observed between population–urban land and GDP–urban land across the pathways, the long-term convergence of population decline, persistent urban land expansion, and economic growth may pose several challenges. These potential risks include land resource waste, economic imbalance, environmental degradation, and social issues.
This study utilizes the latest population and economic projections released in 2024 under the shared socioeconomic pathways model. It reveals that due to low fertility rates and population aging, the study area’s population will continue to decline in the future. High living costs and intense competitive pressures in urban areas also impact people’s willingness to have children [38,39]. Traditional views hold that economic growth relies heavily on labor supply. While population decline implies reduced labor force, it does not necessarily lead to economic recession. China’s economic growth is shifting toward qualitative improvement [38]. Technological progress and innovation have substantially boosted productivity [34,40]. Furthermore, despite the decline in the young population, the Yangtze River Delta region’s strong attraction to high-quality labor (talent) will mitigate the pressure from population decline. Consumer demand for quality goods and industrial upgrading both continuously drive economic growth. Under these influences, urban land use in the study area is also evolving [41]. Economic growth remains the dominant driver of urban land expansion in the study area. This leads to sustained growth in urban land use under both SSP2 and SSP5 pathways. Specifically, the influx of talent and migrants under SSP5 will delay the population decline trend, while sustained high-speed economic development continuously fuels demand for industrial and commercial centers as well as high-end residential areas. Urban land growth under SSP2 is lower than under SSP5. Under SSP1, China’s economic development model undergoes a significant transformation toward sustainable development. Scientific planning reduces per capita land demand, potentially leading to peak urban land use followed by declining demand. Under SSP3 and SSP4, slow economic growth may stimulate modest urban land expansion.

5.2. The Comparison of Projections

The projection results indicate that urban land is projected to increase continuously from 2021 to 2050 (Figure 8). To validate the accuracy of projections, we compared the actual urban land and spatial distribution for 2023 with related studies. The urban land area under the SSP2 pathway in 2023 is slightly lower than the actual value with a 4% difference. The spatial difference was primarily observed in the northern part of study area. This is because demographic economic projections data indicates that the population in the study area is projected to decline rapidly starting from 2020, which indirectly results in lower projections in this paper. The Yangtze River Delta, as a region with a high population density and strong economic development in China, has a significant attraction for migrant populations, which may reduce the impact of low fertility rates on population numbers to some extent. In addition, this study does not consider the intensive use of urban three-dimensional space, which may lead the high results of projection, and the choice of driving factors, models, and environment also affect it [42]. When simulating future urban land in the study area, we took terrain factors into account in the selection of driving factors. By simulating training with historical data, we identified mountainous areas with high development costs and believe that future urban land expansion will prioritize areas that are suitable in terms of terrain and have lower development costs. At the same time, national policies (such as permanent basic cropland and ecological protection red lines) will prioritize defining steep slopes and high-risk geological disaster areas as non-urban land conversion areas. Moreover, socio-economic factors, such as population decline and the rate of economic growth, will fundamentally impact the expansion for urban land. When comparing the projection in 2050, the results are higher than Liao [43] with a difference ranging from 3% to 17%. The differences between SSP1 and SSP5 were smaller, ranging from 3% to 8%. Compared to Chen [18] the difference was 10–16%.
As shown in Figure 9, there are regional differences in urban land expansion under different pathways. In SSP1, influenced by topography, Zhejiang Province metropolitan and coastal areas’ compact development, the demand for urban land is projected to peak around 2055. Shanghai has already entered the post-industrialization phase, with an urbanization rate exceeding 90%. The city has strict restrictions on the transfer of ecological land, resulting in a relatively low demand for urban land. This demand is projected to peak around 2055, after which it will decline rapidly. However, the low transfer rate of impervious surfaces means that the urban land will remain largely unchanged after 2055. In contrast, Jiangsu Province has differences in development between regions and the central region having greater potential for growth. As a result, urban land demand is projected to peak around 2085. In SSP2 and SSP5, there are no significant differences in the urban land expansion trends between regions. Because both pathways prioritize economic development. In SSP3 and SSP4, Jiangsu and Zhejiang show similar trends, with urban land demand projected to peak around 2050. On the other hand, Shanghai’s urban land demand is projected to peak around 2070 due to agglomeration of populations.

5.3. Policy Recommendations

Urban land projections based on Shared Socioeconomic Pathways (SSPs 1–5) can help explore potential future changes under different pathways. However, the long-term projections entail inherent uncertainties, the recommendations just interpreted as plausible guidance under specific narrative assumptions.
Rational development suggestions are proposed for the various pathways: For the sustainable development pathway (SSP1) and the continuation of historical development pathway (SSP2), it is essential to make full use of economic and environmental conditions for green and sustainable urban planning. In terms of action, strict enforcement of urban growth boundary regulations is necessary, adhering to public transport-oriented urban development to prevent disorderly urban expansion. All new development projects are required to integrate green infrastructure (such as green roofs and permeable pavements) and renewable energy systems (such as solar panels). It is crucial to actively convert underutilized land into public green spaces to enhance the quality of the living environment. In addition, SSP2 is projected to moderate pressure on urban land expansion. Ecological corridors should still be maintained, and land use changes should be closely monitored using remote sensing and GIS technologies to ensure sustainable development [44]. The regional competition pathway (SSP3) and inequality pathway (SSP4) face issues such as slow economic growth and reduced coordination in urban governance, which may lead to a decrease in overall pressure for urban expansion in the study area, but the risks of inefficient and unbalanced urban development have increased. Thus, in ecologically sensitive areas (like wildlife habitats), the establishment of new urban land should be strictly prohibited. Given the rapid population decline in SSP4, policies should focus on urban integration and reducing residential land development. The focus should be on the renovation of existing infrastructure, ensuring reasonable public infrastructure development (such as clinics and schools) within the existing urban area, rather than constructing new urban districts. SSP5 is facing the highest pressure of rapid urban land expansion, primarily due to high energy consumption demands and resource-intensive growth. Future strategies must actively address the environmental impacts of expansion. The emphasis should be on the redevelopment of abandoned land rather than the development of unused land. All major projects must enforce building waste recycling regulations. To reduce emissions, incentives and building codes can promote the installation of renewable energy facilities. Additionally, proactive measures should be taken to address population aging, expanding healthcare and elderly care facilities, and increasing accessible green spaces in urban centers.

6. Conclusions

This study projects the spatial–temporal distribution of urban land under the shared socioeconomic pathways (SSP1-5) by integrating data from multiple sources. It employs data from seven periods of land use data in 1990–2020, the shared socioeconomic pathways data, and applies a range of multimodal analytical techniques. The findings are as follows:
(1) The urban land in YRD region has increased continuously from 9.6 × 10³ km2 to 30 × 103 km2 in 1990–2020. The rate of urban expansion exhibited a pattern of rapid growth followed by a slowdown, with the fastest expansion occurring between 1995 and 2000. The center of gravity for urban land has shifted to southeast. In addition, the urban land expansion slowed from 2015 to 2020, indicating a stabilization of the urbanization process.
(2) the urban land is projected to increase to 44 × 103 km2 (SSP3)~78 × 103 km2 (SSP5) by the end of the 21st century. The most significant expansion is projected in the northern and central regions, with the center of gravity shift to the northwest.
(3) The future urban land expansion under SSP1-5 from 2021 to 2100 is projected to synergy with economic growth. Under SSP2 and SSP5, the urban land will increase continuously.
The study presented in this paper provides valuable insights for regional governments, real estate developers, and urban planners involved in urban planning and management. However, there are still some limitations. Firstly, due to limited access to data, the driving factors considered in this study are restricted, only socio-economic factors in making urban land demand projections, and the intensive use of urban three-dimensional space was not taken into account. This may lead to an overestimation in urban land projections. Secondly, the future development of urban land in coastal areas is significantly influenced by sea-level rise under the context of global warming. Therefore, future studies could integrate climate scenarios to delineate risk areas where sea-level rise threatens, prohibiting the construction of permanent buildings in these zones to rational spatial layout. Lastly, this paper examines urban land at the regional level, without providing better projections for individual towns and localities, which could lead to overlooking regional disparities in urban development. Future research should integrate multi-source data to further refine functional areas within the city, allowing for more precise and localized urban planning.

Author Contributions

Conceptualization, H.W., T.J. and B.S.; methodology, Z.D.; validation, H.W. and B.S.; Visualization, H.W.; Writing—Original Draft, H.W.; Writing—Review and Editing, B.S., T.J. and R.X.; Supervision, B.S., T.J. and J.H.; Project administration, B.S. All authors have read and agreed to the published version of the manuscript.

Funding

This work was supported by National Natural Science Foundation of China (Grant No. 42271081), Jiangxi Meteorological Bureau Key Projects Foundation (No. JX2021Z06, JX 2022Z08).

Data Availability Statement

The data that support the findings of this study are available from the corresponding author upon reasonable request.

Conflicts of Interest

The authors declare that there is no known competing financial interests or personal relationships that could have appeared to influence the work reported in this paper.

References

  1. UN-Habitat. World Cities Report 2024; UN-Habitat: Nairobi, Kenya, 2024. [Google Scholar]
  2. National Bureau of Statistics of China. China Statistical Yearbook; China Statistical Publishing House: Beijing, China, 2023.
  3. Ding, C.; Zhao, X. Land market, land development and urban spatial structure in Beijing. Land Use Policy 2014, 40, 83–90. [Google Scholar] [CrossRef]
  4. Liu, Y.; Li, Y. Revitalize the world’s countryside. Nature 2017, 548, 275–277. [Google Scholar] [CrossRef]
  5. Ma, S.; Wang, G.; Xu, C.; Zhang, X.; Zhao, Y.; Cai, Y. Does the optimal land use pattern for cross-regional cooperation change at different stages of urbanization? Evidence from the trade-off between urban growth scenarios and SDGs indicators. Appl. Geogr. 2024, 167, 103294. [Google Scholar] [CrossRef]
  6. Cheng, G.; Pan, C.; Zhou, Y. Urban-rural disparities in the ecological impact of built-up land expansion: A comprehensive assessment from China. Appl. Geogr. 2025, 179, 103618. [Google Scholar] [CrossRef]
  7. Kong, X.; Chen, J.; Wang, J.; Zhao, X. Evaluation of ecological disturbance coupling land use pattern and process change: Taking the Yangtze River Delta as an example. Sci. Geogr. Sin. 2021, 41, 2031–2041. [Google Scholar] [CrossRef]
  8. Liang, Y.; Zhang, J.; Sun, W.; Guo, Z.; Li, S. Tracking the Construction Land Expansion and Its Dynamics of Ho Chi Minh City Metropolitan Area in Vietnam. Land 2025, 14, 1253. [Google Scholar] [CrossRef]
  9. Chen, Y.; Ge, H.; Chen, M. What drives urban land green use efficiency in China: A global meta-frontier Malmquist Index approach. Ecol. Indic. 2025, 175, 113550. [Google Scholar] [CrossRef]
  10. Wang, S.; Wang, Z. The spatio-temporal differentiation of urban land expansion and influencing factors in the Yangtze River Delta in the economic transition context. J. Nat. Resour. 2021, 36, 993–1007. [Google Scholar] [CrossRef]
  11. Li, L.; Huang, C.; Liu, Y. Detecting the contribution of transport development to urban construction land expansion in the Beijing-Tianjin-Hebei region of China based on machine learning. Land Use Policy 2025, 157, 107622. [Google Scholar] [CrossRef]
  12. Guo, R.; Wu, T.; Wu, X.; Stendardo, L.; Wang, Y. Simulation of Urban Land Expansion Under Ecological Constraints in Harbin-Changchun Urban Agglomeration, China. Chin. Geogr. Sci. 2022, 32, 438–455. [Google Scholar] [CrossRef]
  13. Yuan, X.; Zhou, J.; Hu, B.; Gao, Q. Multi-scenario simulation and prediction of ecological-productive-living spaces in Guangdong-Hong Kong-Macao Greater Bay Area based on FLUS model. Geogr. Sci. 2023, 43, 564–574. [Google Scholar] [CrossRef]
  14. Aghaloo, K.; Ayyoob Sharifi, A. Balancing priorities for a sustainable future in cities: Land use change and urban ecosystem service dynamics. J. Environ. Manag. 2025, 382, 125460. [Google Scholar] [CrossRef] [PubMed]
  15. Jing, C.; Jiang, T.; Su, B. Multiple application of shared socioeconomic pathways in land use, energy and carbon emission research. J. Atmos. Sci. 2022, 45, 397–413. [Google Scholar] [CrossRef]
  16. Zeng, L.; Liu, X.; Lia, W.; Oua, J.; Cai, Y.; Chen, G.; Li, M.; Li, G.; Zhang, H.; Xua, X. Global simulation of fine resolution land use/cover change and estimation of aboveground biomass carbon under the shared socioeconomic pathways. J. Environ. Manag. 2022, 312, 114943. [Google Scholar] [CrossRef]
  17. Jiang, T.; Zhao, J.; Cao, L.; Wang, Y.; Su, B.; Jing, C.; Wang, R.; Gao, C. Projection of national and provincial economy under the shared socioeconomic pathways in China. Clim. Change Res. 2018, 14, 50–58. [Google Scholar]
  18. Chen, G.; Li, X.; Liu, X. Global projections of future urban land expansion under shared socioeconomic pathways. Nat. Commun. 2020, 11, 537. [Google Scholar] [CrossRef]
  19. Siabi, E.; Kabo-bah, A.; Anornu, G.; Akpoti, K.; Mortey, E.; Yeboah, K. Future land use simulation modeling for sustainable urban development under the shared socioeconomic pathways in West African megacities: Insights from Greater Accra Region. J. Environ. Manag. 2025, 376, 124300. [Google Scholar] [CrossRef]
  20. Zhang, W.; Yang, M.; Guo, R.; Li, Y.; Zhong, F. Land Use Transition and Regional Development Patterns Under Shared Socioeconomic Pathways: Evidence from Prefecture-Level Cities in China. Land 2025, 14, 454. [Google Scholar] [CrossRef]
  21. Hou, Y.; Li, Y.; Li, J.; Huang, Q.; Duan, X.; Feng, X.; Zhu, G. Simulating the dynamics of urban land quantity in China from 2020 to 2070 under the Shared Socioeconomic Pathways. Appl. Geogr. 2023, 159, 103094. [Google Scholar] [CrossRef]
  22. Wu, H.; Qin, F.; Dunchev, D.; Che, S.; Ivanova, B. Urban climate risk assessment under climate and land use changes impact: A multi-dimensional approach. Urban Clim. 2025, 61, 102379. [Google Scholar] [CrossRef]
  23. Steward, R.; Chopin, P.; Verburg, P. Impact-driven spatial planning for future-proofing small island states: A scenario-based land model analysis in Curaçao. Appl. Geogr. 2025, 178, 103604. [Google Scholar] [CrossRef]
  24. Zhu, E.; Deng, J.; Zhou, M.; Gan, M.; Jiang, R.; Wang, K.; Shahtahmassebi, A. Carbon emissions induced by land-use and land-cove change from 1970 to 2010 in Zhejiang, China. Sci. Total Environ. 2019, 646, 930–939. [Google Scholar] [CrossRef]
  25. AlDousari, A.; Kafy, A.; Saha, M. Modelling the impacts of land use/land cover changing pattern on urban thermal characteristics in Kuwait. Sustain. Cities Soc. 2022, 86, 101407. [Google Scholar] [CrossRef]
  26. Mansour, S.; Alotaibi, O.; Alnasrallah, M. Geospatial modelling of urban expansion effects on the land ecosystems in Kuwait using random forest and cellular automata. J. Urban Manag. 2025; in press. [Google Scholar] [CrossRef]
  27. Wu, H.; Yang, Y.; Li, W. Dynamic prediction of the land-use carbon balance in urban agglomerations under the two-way effects of climate and socioeconomic interactions. Sustain. Cities Soc. 2025, 130, 106555. [Google Scholar] [CrossRef]
  28. Liang, X.; Guan, Q.; Keith, C.; Liu, S.; Wang, B.; Yao, Y. Understanding the drivers of sustainable land expansion using a patch-generating land use simulation (PLUS) model: A case study in Wuhan, China. Comput. Environ. Urban Syst. 2021, 85, 101569. [Google Scholar] [CrossRef]
  29. Li, X.; Li, D.; Liu, X. Geographic Simulation optimization System (GeoSOS) and its application in the analysis of geographical national conditions. Acta Geod. Cartogr. Sin. 2017, 46, 1598–1608. [Google Scholar] [CrossRef]
  30. Yang, H.; Huang, J.; Liu, D. Linking climate change and socioeconomic development to urban land use simulation: Analysis of their concurrent effects on carbon storage. Appl. Geogr. 2025, 115, 102135. [Google Scholar] [CrossRef]
  31. Liu, H.; Shao, M.; Ji, Y. The spatial pattern and distribution dynamic evolution of carbon emissions in China: Empirical study based on county carbon emission data. Sci. Geogr. Sin. 2021, 41, 1917–1924. [Google Scholar] [CrossRef]
  32. Li, X.; Lin, C.; Lin, M.; Jim, C.Y. Drivers, scenario prediction and policy simulation of the carbon emission system in Fujian Province, China. J. Clean. Prod. 2024, 434, 140375. [Google Scholar] [CrossRef]
  33. Wang, W.; Shen, K.; Cai, Y. When the abundance ends: Economic transformation, population aging, and shrinking lifecycle surplus in China. J. Econ. Ageing 2025, 30, 100544. [Google Scholar] [CrossRef]
  34. Lin, Y.; Xu, X. Intelligence-driven Growth: Exploring the dynamic impact of digital transformation on China’s high-quality economic development. Int. Rev. Econ. Financ. 2025, 101, 104240. [Google Scholar] [CrossRef]
  35. Wang, B.; Liao, J.; Zhu, W.; Qiu, Q.; Wang, L.; Tang, L. The weight of neighborhood setting of the FLUS model based on a historical scenario: A case study of land use simulation of urban agglomeration of the Golden Triangle of Southern Fujian in 2030. Acta Ecol. Sin. 2019, 39, 4284–4298. [Google Scholar]
  36. Ouyang, X.; Zhu, X. Spatio-temporal characteristics of urban land expansion in Chinese urban agglomerations. Acta Geogr. Sin. 2020, 75, 571–588. [Google Scholar] [CrossRef]
  37. Xu, Y.; Gao, M.; Zhang, Z. Land Use Change and Its Impact on Habitat Quality in the Middle and Lower Reaches of the Yangtze River Based on InVEST Model. Res. Soil Water Conserv. 2024, 31, 355–364. [Google Scholar] [CrossRef]
  38. Yang, Y.; Zhai, J.; Su, B.; Jing, C.; Jiang, T.; Guo, H. National and provincial economy projection databases under Shared Socioeconomic Pathways (SSP1−5) v2. Clim. Change Res. 2024, 20, 498–503. [Google Scholar] [CrossRef]
  39. Xu, H.; Pan, S. Policy combinations, high-quality population development, and China’s economic growth: An endogenous fertility model. Econ. Model. 2025, 151, 107206. [Google Scholar] [CrossRef]
  40. Zhao, Z.; Li, H.; Lu, Y. Mechanism analysis of the impact of regional digital transformation on the employment quality in the perspective of labor force structure. Sci. Rep. 2024, 14, 25229. [Google Scholar] [CrossRef] [PubMed]
  41. Wang, Y.; Jasper, V.; Niels, D.; Pu, L.; Peter, H. Settlement changes after peak population: Land system projections for China until 2050. Landsc. Urban Plan. 2021, 209, 104045. [Google Scholar] [CrossRef]
  42. Dong, N.; You, L.; Cai, W.; Li, G.; Lin, H. Land use projections in China under global socioeconomic and emission scenarios: Utilizing a scenario-based land-use change assessment framework. Global Environ. Change 2018, 50, 164–177. [Google Scholar] [CrossRef]
  43. Liao, W.; Liu, X.; Xu, X.; Chen, G.; Liang, X.; Zhang, H.; Li, X. Projections of land use changes under the plant functional type classification in different SSP-RCP scenarios in China. Sci. Bull. 2020, 65, 1935–1947. [Google Scholar] [CrossRef]
  44. Liu, T.; Yang, X. Monitoring land changes in an urban area using satellite imagery, GIS and landscape metrics. Appl. Geogr. 2015, 56, 42–54. [Google Scholar] [CrossRef]
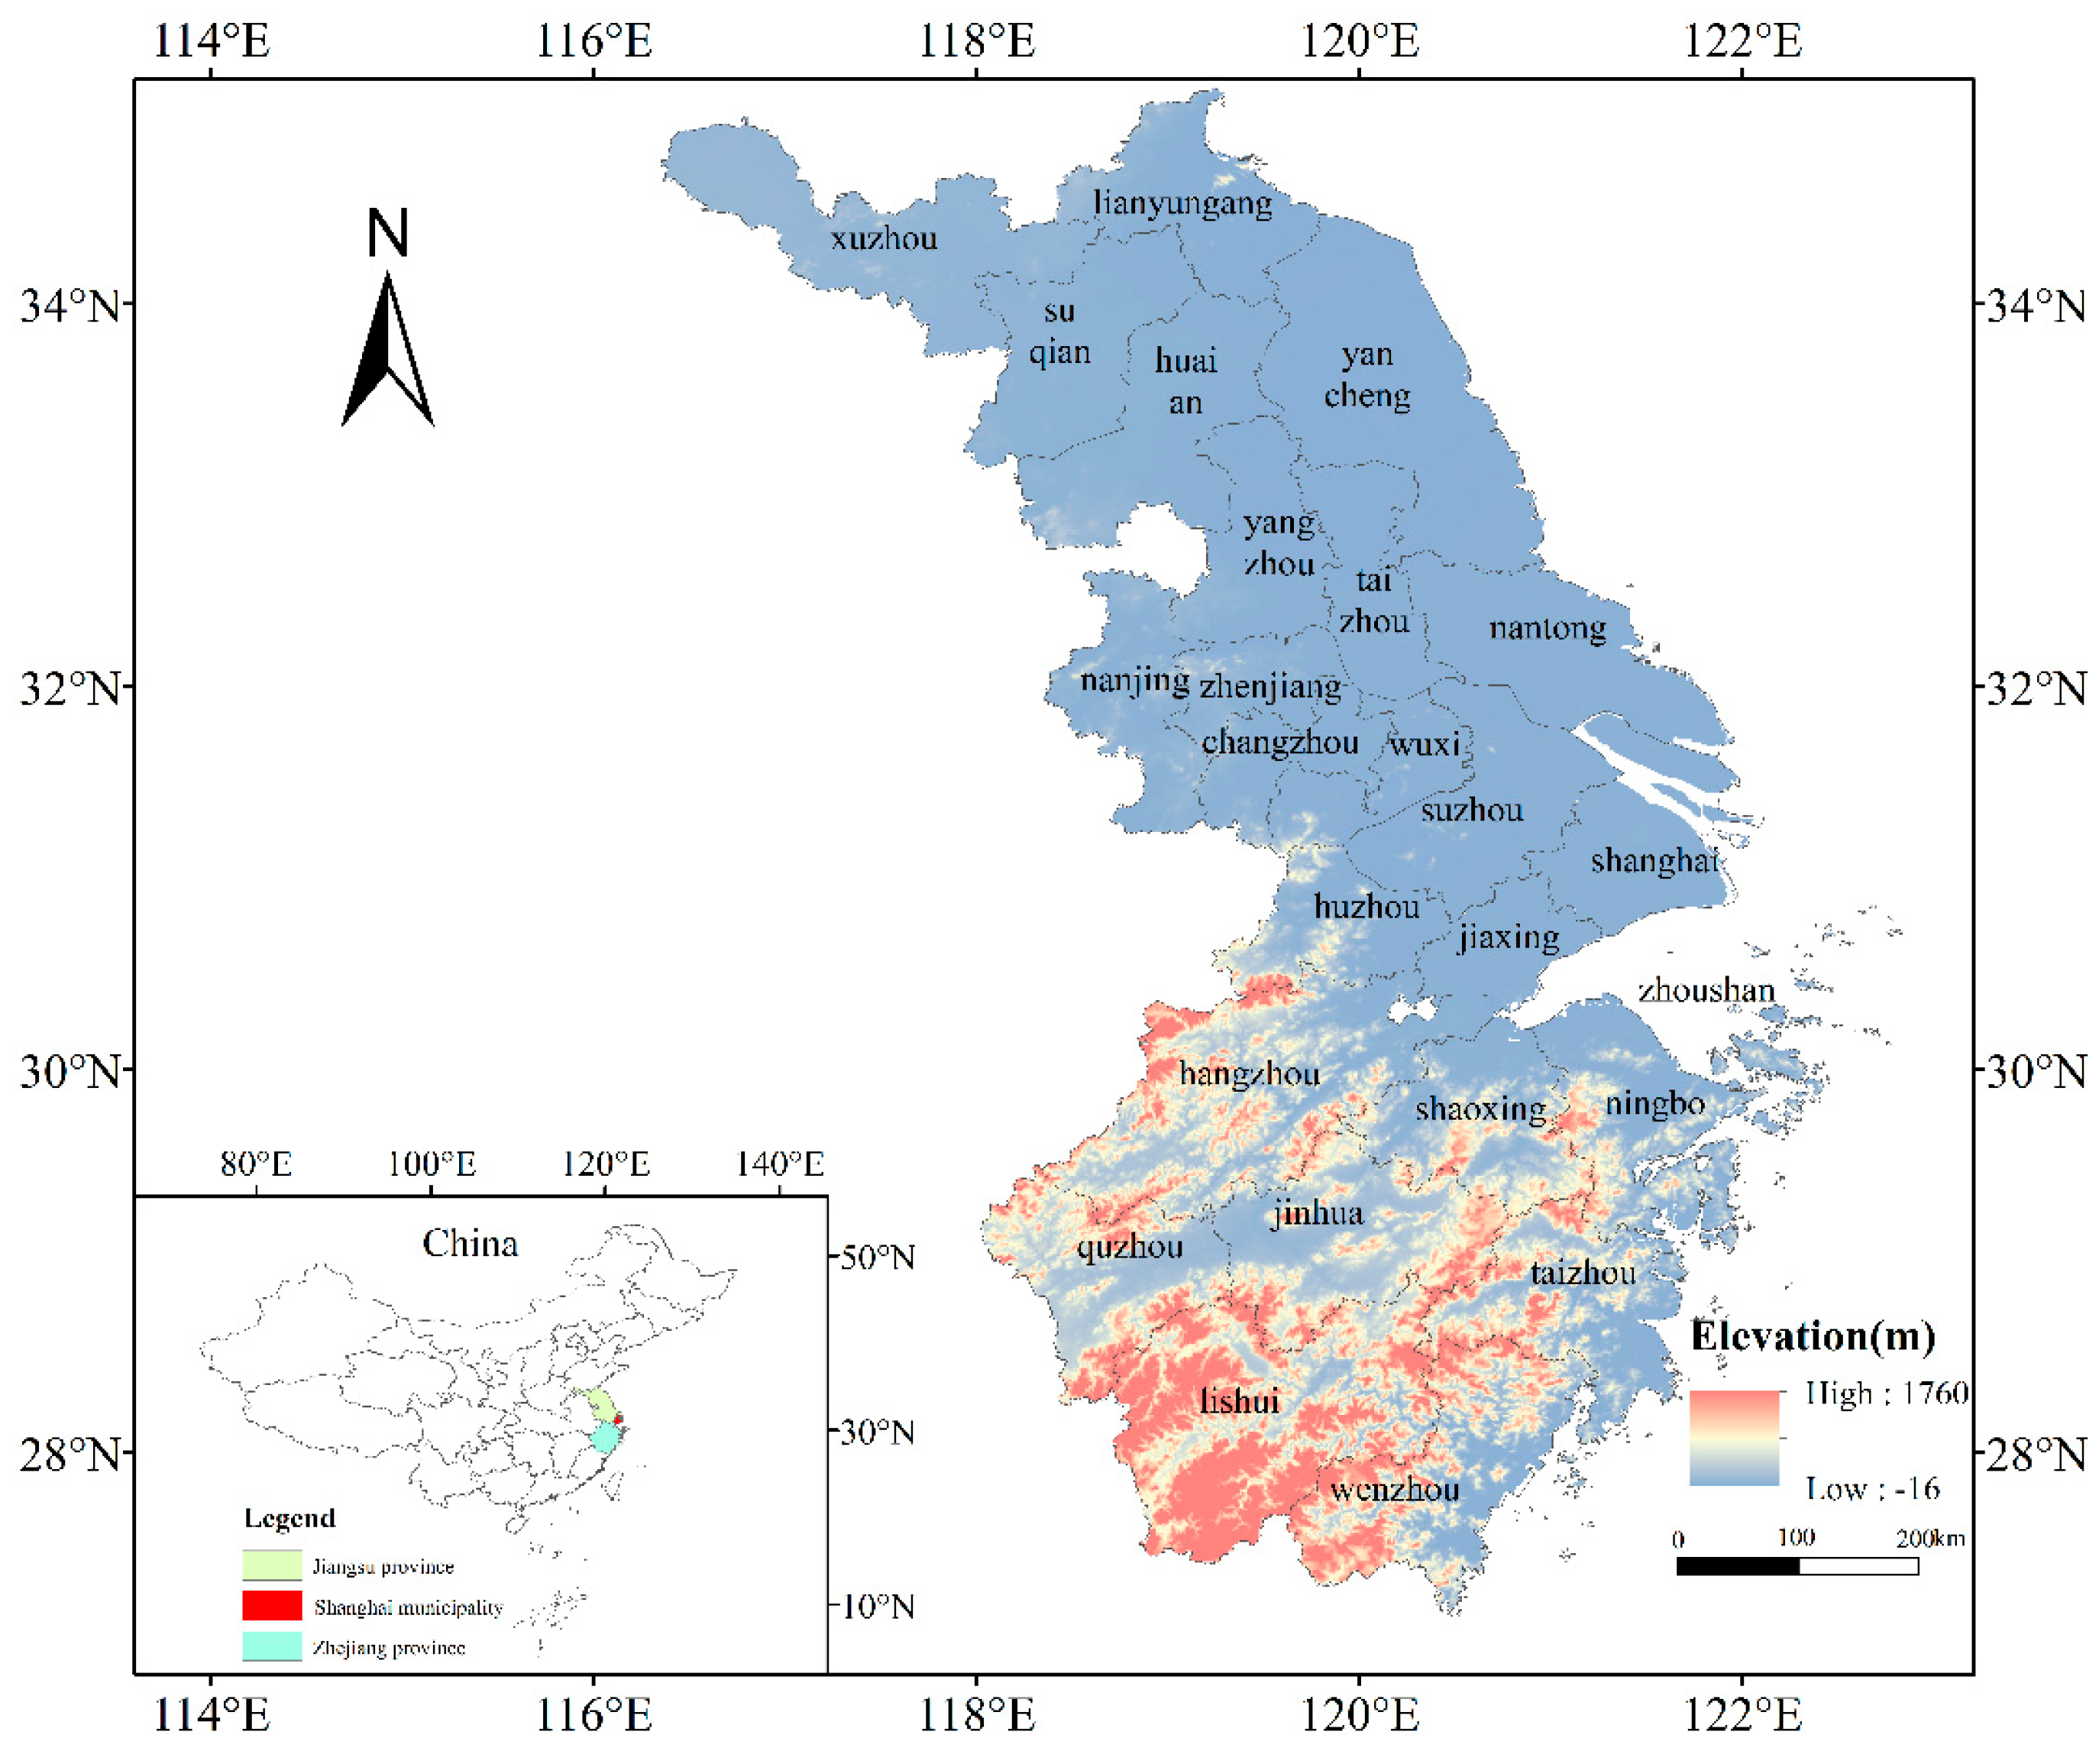
Figure 1. Location of study area.
Land 14 01995 g001
Figure 2. The simulation process of GeoSOS-FLUS model.
Land 14 01995 g002
Figure 3. (ac) The urban land comparison of simulation results and actual results in study area.
Land 14 01995 g003
Figure 4. The urban land area (a), the expansion speed (b) in study area from 1990 to 2020.
Land 14 01995 g004
Figure 5. The distribution of urban land in study area from 1990 to 2020.
Land 14 01995 g005
Figure 6. The central distribution of urban land in study area from 1990 to 2020.
Land 14 01995 g006
Figure 7. The population and GDP in study area from 2021 to 2100.
Land 14 01995 g007
Figure 8. Area change in urban land in study area from 2020 to 2100.
Land 14 01995 g008
Figure 9. The distribution of urban land in the study area for 2050 and 2100.
Land 14 01995 g009
Figure 10. The central distribution of urban land in study area for 2050 and 2100.
Land 14 01995 g010
Table 1. Driving factors and data sources of urban land.
TypeNameSource
SocioeconomicPrimary industry outputhttps://www.stats.gov.cn/sj/ndsj/, accessed on 8 October 2023
Secondary industry outputhttps://www.stats.gov.cn/sj/ndsj/, accessed on 8 October 2023
Tertiary industry outputhttps://www.stats.gov.cn/sj/ndsj/, accessed on 8 October 2023
GDP per capitahttps://www.stats.gov.cn/sj/ndsj/, accessed on 8 October 2023
GDPhttp://www.resdc.cn/10.12078/2017121102, accessed on 8 October 2023
Population densityhttp://www.resdc.cn/10.12078/2017121101, accessed on 8 October 2023
TopographyDEMhttps://www.gscloud.cn/, accessed on 8 October 2023
SlopeDerived from DEM
AspectDerived from DEM
HydrometeorologyAnnual mean temperaturehttp://www.resdc.cn/10.12078/2022082501, accessed on 8 October 2023
Annual precipitationhttp://www.resdc.cn/10.12078/2022082501, accessed on 8 October 2023
Table 2. The coordination coefficients description of urban land expansion.
DefinitionDescription
Ealow density population-looser growthPopulation density is relatively low, with a dispersed population distribution; urban land expansion has not been highly concentrated.
blow density population-compact growthWhile the population distribution is dispersed, urban land is concentrated in certain areas through robust planning policies or topographical constraints.
chigh density population-looser growthUrban land in densely populated areas continues to expand extensively outward.
UGeGDP/urban land shrinkingGDP and urban land decline simultaneously; occurs during periods of severe economic recession, population outflow, or post-industrial decline.
furban land expansion-dominatedEconomic output consumes vast amounts of land.
gGDP-urban land basic coordinationEconomic growth and land expansion have largely progressed in tandem; Economic agglomeration benefits have been achieved efficiently without causing excessive land consumption.
hGDP growth-dominatedEconomic growth far outpaces urban land expansion; Economic growth is primarily driven by productivity gains, technological innovation, and others.
Table 3. The urban land expansion intensity in study area from 1990 to 2020.
1990–19951995–20002000–20052005–20102010–20152015–2020
Jiangsu0.861.160.560.650.460.88
Zhejiang1.380.582.781.652.591.38
Shanghai1.390.671.210.290.790.65
Table 4. The expansion rate and expansion intensity of urban land in study area from 2020 to 2100.
Expansion Rate (×103 km2/Year)Expansion Intensity
2020–20302030–20402040–20502050–21002020–20302030–20402040–20502050–2100
SSP1Jiangsu0.49 0.46 0.30 /1.02 0.95 0.88 /
Zhejiang0.20 0.22 0.17 /0.95 1.03 1.16 /
Shanghai0.060.080.06 /1.00 1.28 1.37 /
SSP2Jiangsu0.45 0.35 0.22 0.31 1.01 0.93 0.88 1.14
Zhejiang0.19 0.18 0.14 0.090.98 1.09 1.20 0.72
Shanghai0.06 0.060.040.031.01 1.27 1.21 0.90
SSP3Jiangsu0.41 0.33 0.12 /1.02 0.98 0.92 /
Zhejiang0.17 0.14 0.05/0.95 0.95 0.91 /
Shanghai0.05 0.05 0.03 /1.02 1.37 1.91 /
SSP4Jiangsu0.45 0.38 0.21 /1.03 1.00 1.04 /
Zhejiang0.18 0.15 0.07 /0.93 0.92 0.81 /
Shanghai0.06 0.06 0.04 /0.99 1.27 1.32 /
SSP5Jiangsu0.46 0.48 0.45 0.31 0.96 0.90 0.91 1.06
Zhejiang0.23 0.280.27 0.12 1.09 1.16 1.15 0.82
Shanghai0.06 0.08 0.07 0.050.99 1.20 1.11 1.24
Table 5. The coordination between urban land, population, and GDP in study area from 1990 to 2020.
1990–19951995–20002000–20052005–20102010–20152015–2020
EUGEUGEUGEUGEUGEUG
Jiangsuahagahahahah
Zhejiangcgcgcgagagbg
Shanghaicgcgcgcgchch
Table 6. The coordination between urban land, population, and GDP in study area from 2020 to2100.
2020–20302030–20402040–20502050–2100
EUGEUGEUGEUG
SSP1Jiangsuagagag//
Zhejiangcgcgag//
Shanghaicgcgcg//
SSP2Jiangsuagagagag
Zhejiangcgcgagag
Shanghaicgcgcgag
SSP3Jiangsuagagag//
Zhejiangcgcgcg//
Shanghaicgcgcg//
SSP4Jiangsuagagag//
Zhejiangcgcgag//
Shanghaicgcgcg//
SSP5Jiangsuagagagag
Zhejiangcgcgagag
Shanghaicgcgcgag
Disclaimer/Publisher’s Note: The statements, opinions and data contained in all publications are solely those of the individual author(s) and contributor(s) and not of MDPI and/or the editor(s). MDPI and/or the editor(s) disclaim responsibility for any injury to people or property resulting from any ideas, methods, instructions or products referred to in the content.