Article

An Integrated Framework for Assessing Dynamics of Ecological Spatial Network Resilience Under Climate Change Scenarios: A Case Study of the Yunnan Central Urban Agglomeration

1
Faculty of Land Resource Engineering, Kunming University of Science and Technology, Kunming 650093, China
2
Natural Resources Intelligent Governance Industry-University-Research Integration Innovation Base, Kunming 650093, China
*
Author to whom correspondence should be addressed.
Land 2025, 14(10), 1988; https://doi.org/10.3390/land14101988
Submission received: 17 August 2025 / Revised: 28 September 2025 / Accepted: 29 September 2025 / Published: 2 October 2025
(This article belongs to the Section Landscape Ecology)

Abstract

Rapid climate change has exacerbated global ecosystem degradation, leading to habitat fragmentation and landscape connectivity loss. Constructing ecological networks (EN) with resilient conduction functions and conservation priorities is crucial for maintaining regional ecological security and promoting sustainable development. However, the spatiotemporal modeling and dynamic resilience assessment of EN under the combined impacts of future climate and land use/land cover (LULC) changes remain underexplored. This study focuses on the Central Yunnan Urban Agglomeration (CYUA), China, and integrates landscape ecology with complex network theory to develop a dynamic resilience assessment framework that incorporates multi-scenario LULC projections, multi-temporal EN construction, and node-link disturbance simulations. Under the Shared Socioeconomic Pathways and Representative Concentration Pathways (SSP-RCP) scenarios, we quantified spatiotemporal variations in EN resilience and identified resilience-based conservation priority areas. The results show that: (1) Future EN patterns exhibit a westward clustering trend, with expanding habitat areas and enhanced connectivity. (2) From 2000 to 2040, EN resilience remains generally stable, but diverges significantly across scenarios—showing steady increases under SSP1-2.6 and SSP5-8.5, while slightly declining under SSP2-4.5. (3) Approximately 20% of nodes and 40% of links are identified as critical components for maintaining structural-functional resilience, and are projected to form conservation priority patterns characterized by larger habitat areas and more compact connectivity under future scenarios. The multi-scenario analysis provides differentiated strategies for EN planning and ecological conservation. This framework offers adaptive and resilient solutions for regional ecosystem management under climate change.

1. Introduction

Global climate change and human activities have exacerbated ecosystem degradation, severely impairing its structures and functions [1,2]. This degradation has reduced habitat connectivity, biodiversity, and ecosystem services (ES) [3,4], ultimately threatening regional ecological security and constraining sustainable development. In response, the Kunming-Montreal Global Biodiversity Framework emphasizes reversing biodiversity loss and restoring ecosystems to strengthen ecological integrity [5,6]. However, in urban areas, intensive land development and human activities are closely intertwined with ecosystems, rendering restoration measures that attempt to exclude human influence largely ineffective [7]. Against this backdrop, ecological networks (EN) have emerged as a viable solution to reconcile ecological conservation with regional development [8,9], effectively mitigating negative ecological impacts while enhancing ecosystem benefits [10].
Originating from landscape ecological planning, EN consists of patches, corridors, and the matrix, forming a spatially coherent system that supports the balanced coexistence of human-dominated areas and natural landscapes [11,12]. Its core objective is to regulate and organize regional ecological processes to promote ecosystem health and long-term stability [8,13]. The expansion of EN facilitates the identification of spatial (conservation) priorities and provides essential information on biodiversity values and landscape functions in urbanized regions [7,14]. However, unpredictable climate change, natural disasters, and human disturbances often exacerbate the sensitivity, vulnerability, and instability of EN, potentially leading to cascading failures and disruptions of ecological processes [15,16,17]. Therefore, exploring the dynamic evolution of EN and its underlying mechanisms under various disturbances has become a central focus of sustainable ecosystem management [15,16,18].
Resilience is a key concept for understanding the stability of EN. It generally refers to the capacity of ecosystems to absorb disturbance and maintain their essential structures, functions, and feedbacks [19,20]. Constrained by ecosystem complexity and data scarcity, early studies had difficulty developing parameterized models to quantify resilience [20,21]. With the advancement of research, complex network theory and topological analysis frameworks have provided effective approaches for resilience evaluation [22,23]. Compared with studies on static characteristics [24,25], dynamic modeling approaches emphasize the importance of non-equilibrium and transient dynamics in ecosystems, aiming to diagnose the co-evolutionary mechanisms of resilience [26,27]. EN is inherently dynamic, as patches (nodes) and corridors (links) may shift into new stable states under environmental fluctuations [26,28]. By capturing information flows within network topologies, it is possible to explore the resilience interactions and dynamic evolution among system components [16,28]. Simulating disturbance scenarios (e.g., random or deliberate attacks) and monitoring key indicators (e.g., network efficiency and connectivity) allow quantitative assessment of EN responses to disturbances, including connectivity damage and failure [16,29]. Such response processes reflect mechanisms of disturbance-absorbing and adaptation, effectively revealing the intensity of human–nature interactions and the complex feedbacks of ecological processes [20]. Existing research has examined structural centrality measures of nodes (e.g., degree, betweenness, closeness) [29,30,31], ecological functional regulation (e.g., patch size, ecological redlines, habitat risk) [32,33], and functional protection of links (e.g., corridor quality, main–branch corridor optimization) [34,35]. However, most studies focus only on either structural or functional dimensions of nodes or links, lacking a comprehensive assessment of dynamic resilience. Moreover, although some studies have attempted to measure resilience by identifying critical thresholds or abrupt shifts in network performance [18,36,37], they often overlook the integrity and robustness of EN. Therefore, it is necessary to integrate both structural and functional attributes of nodes and links to systematically assess the overall resilience of EN.
Moreover, most studies have focused on the resilience of EN in historical contexts, while the potential impacts of future climate and land-use changes have received little attention. Once triggered, the collapse of large, vulnerable ecosystems may occur within only a few decades [38]. Similarly, the spatial patterns and ecological benefits of EN are increasingly threatened by rising temperatures, extreme precipitation, and rapid urbanization [10]. Therefore, early interventions are essential to mitigate the adverse impacts of environmental change on ecosystems. Land use/land cover (LULC) dynamics are key drivers of EN patterns and performance, influencing changes in habitat patches and their surrounding matrices [39,40]. Projecting and evaluating the differentiated impacts of LULC change on EN structure and function is crucial for strengthening resilience against future disturbances. Scenario analysis, by exploring potential future transitions, promotes more sustainable land management [41,42]. Such exploration helps navigate uncertainties associated with climate and LULC changes, thereby informing adaptive strategies to cope with environmental transformations [41]. The latest iteration of the Coupled Model Intercomparison Project Phase 6 (CMIP6) integrates Shared Socioeconomic Pathways and Representative Concentration Pathways (SSP-RCP) scenarios [43,44]. These scenarios represent plausible future states of nature and human society under global climate change [45], offering valuable insights for projecting future EN dynamics [8,40]. Therefore, incorporating climate scenario projections into a dynamic resilience assessment framework enables a systematic understanding of how future EN changes may affect stability.
To address these research gaps, this study focuses on the Central Yunnan Urban Agglomeration (CYUA), China, a representative mountainous highland economic region highly sensitive to climate and LULC changes [46,47]. We propose a forward-looking research framework that integrates climate scenario projections with network dynamics assessment and spatial prioritization analysis to address the impacts of uncertain climate and LULC changes on regional EN connectivity resilience. The specific objectives are to: (1) project future LULC patterns under SSP-RCP scenarios and incorporate them into the construction of multi-temporal EN with high ES provision; (2) develop disturbance simulation strategies to assess and quantify EN resilience and its spatiotemporal dynamics under node and link failures; and (3) establish a resilience-based priority index to identify conservation priorities that satisfy both structural and functional connectivity needs. The effective integration of scenario projections and resilience analysis provides differentiated strategies for EN planning. The results are expected to support the long-term conservation of landscape connectivity in CYUA and provide a reference for sustainable ecosystem management in similar regions.

2. Materials and Methods

2.1. Study Area

The CYUA, located in central and eastern Yunnan Province, China, is a core region of economic, industrial, and demographic concentration. It covers approximately 111,400 km2 and includes the prefecture-level cities of Kunming, Qujing, Yuxi, and Chuxiong, along with seven counties in northern Honghe Prefecture (Figure 1). The region lies on the central Yunnan-Guizhou Plateau, with terrain higher in the north and lower in the south, characterized by alternating mountains and basins. The region has a low-latitude plateau monsoon climate, with annual precipitation of 900–1000 mm and a mean annual temperature of 16 °C. It contains six major plateau lakes and three major rivers. As part of Yunnan’s biogeographic transition zone, the region has a forest coverage rate exceeding 50% and hosts 21 protected natural areas at or above the provincial level. These features make the region a critical biodiversity reservoir and an ecological security barrier in Southwest China. However, the CYUA has experienced increasing ecological degradation and geological hazards due to the combined impacts of climate and LULC change, including vegetation fragmentation, karst rocky desertification, biodiversity loss, soil erosion, landslides, and debris flows. These issues pose serious threats to ecosystem stability.

2.2. Data Sources

This study employs a range of datasets, including LULC, climate, socioeconomic, physical geography, territorial spatial planning, and SSP-RCP scenario data. Detailed sources and descriptions of the datasets are provided in Table 1. All raster data were resampled to a 250 m spatial resolution and standardized coordinate systems.

2.3. Methods

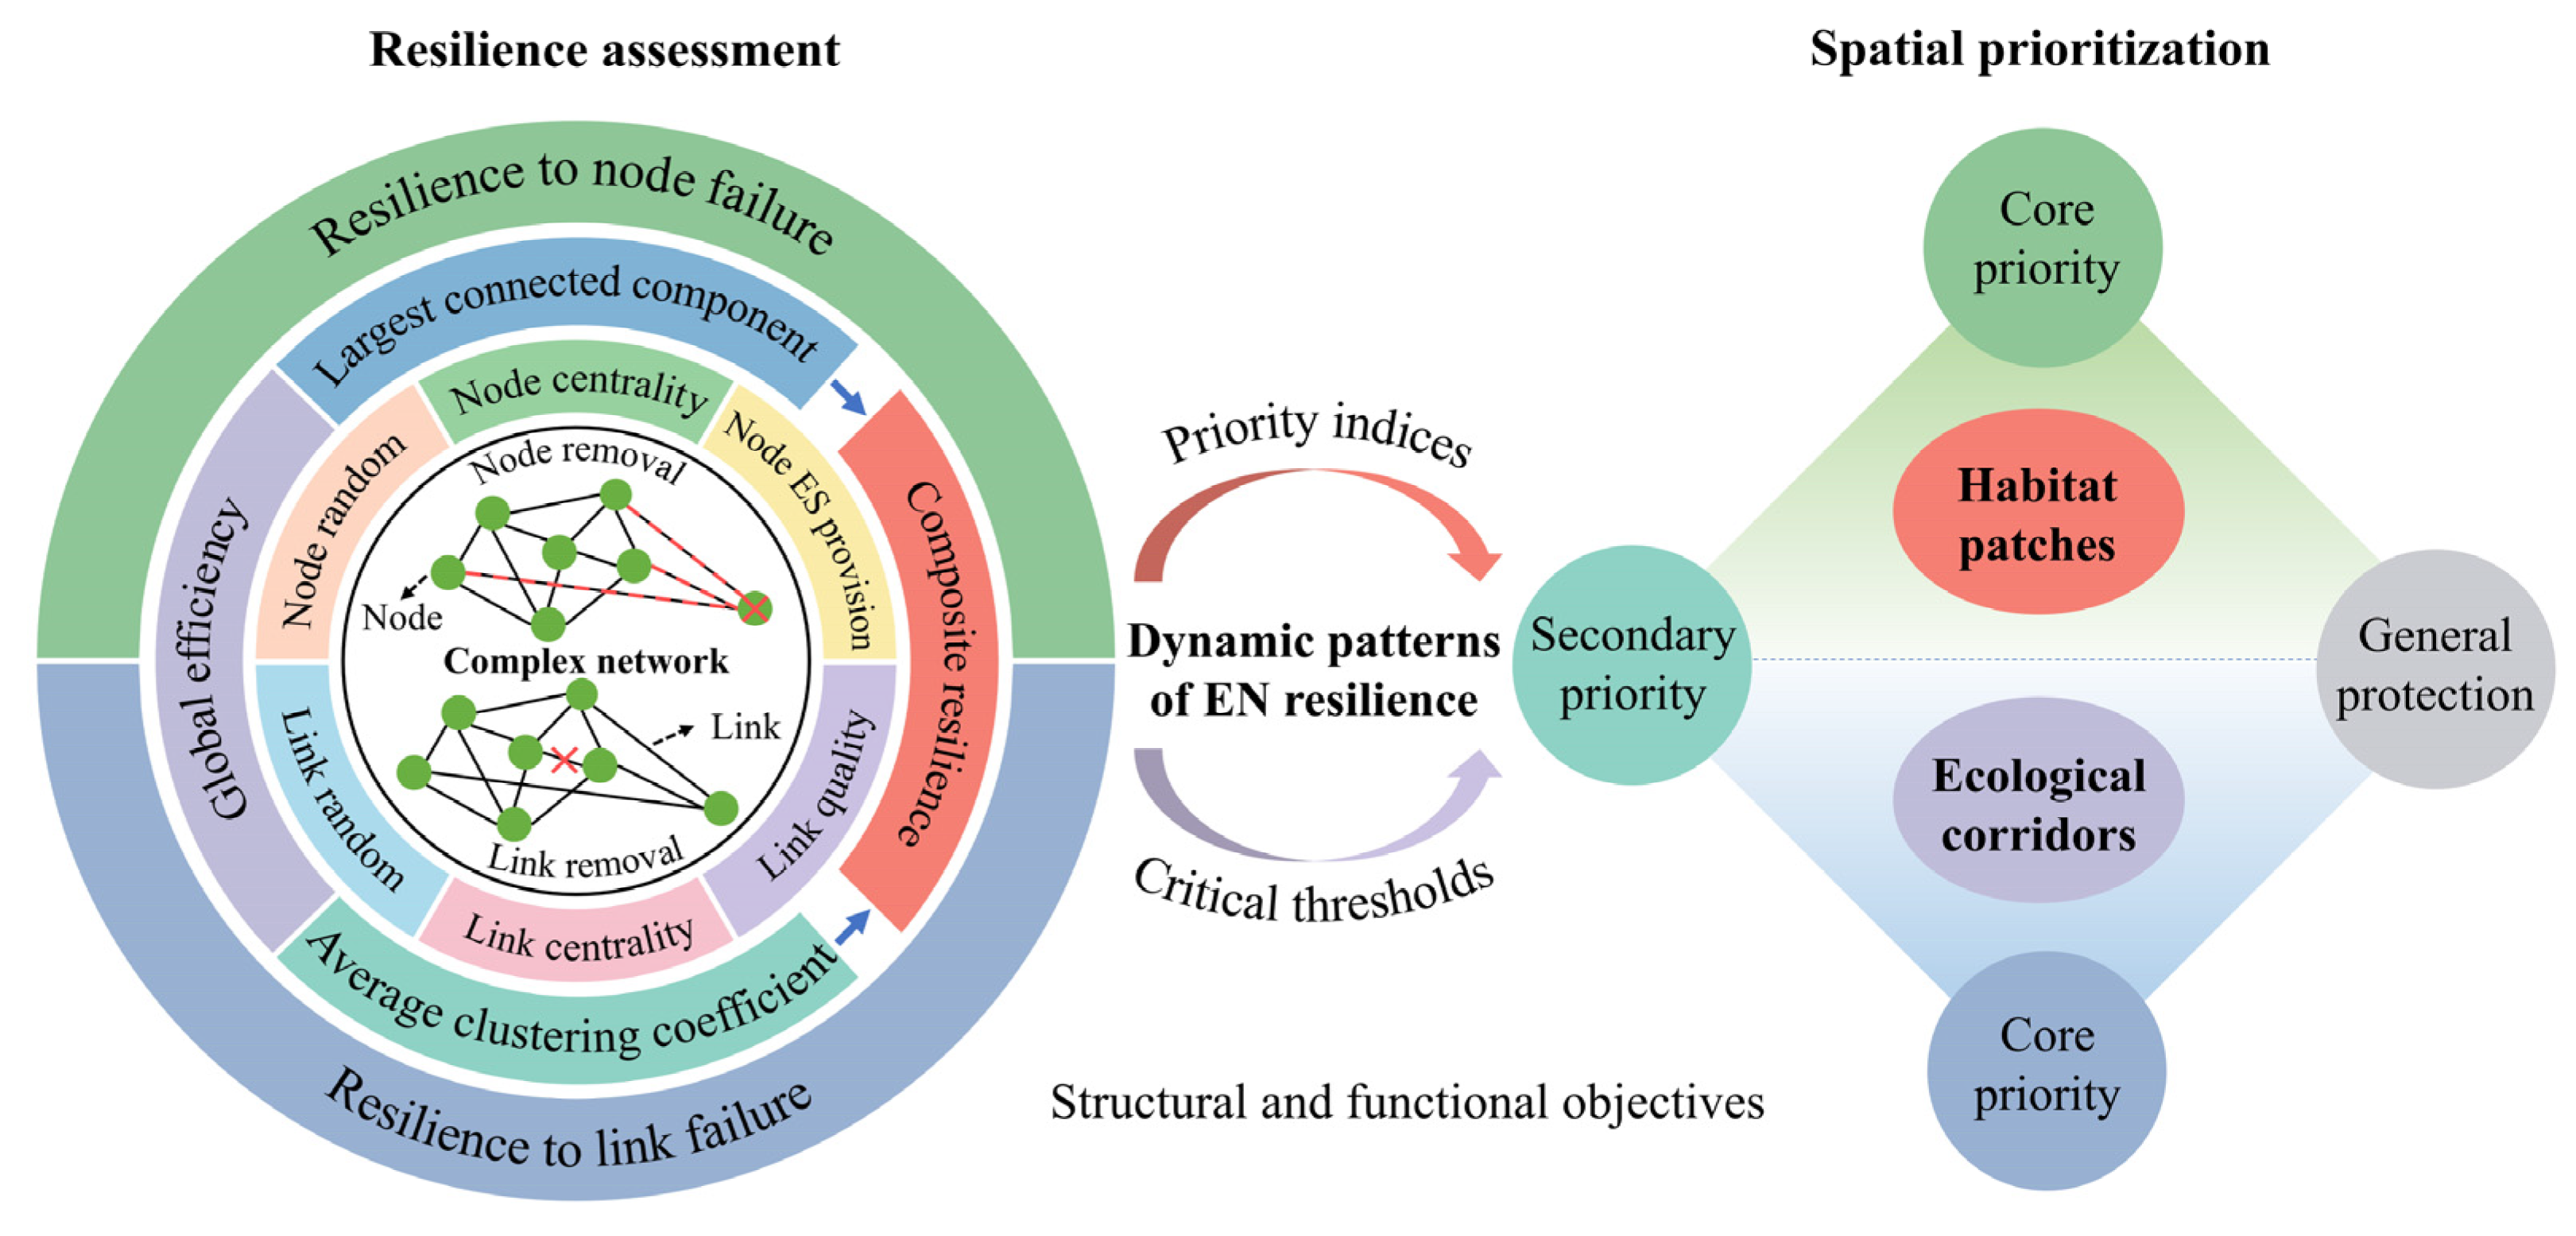
The methodological framework comprises four steps (Figure 2): (1) Future LULC patterns under three SSP-RCP scenarios were projected using the patch-generating land use simulation (PLUS) model. (2) Multi-temporal EN with high ES provision were constructed by combining the Integrated Valuation of Ecosystem Services and Tradeoffs (InVEST) model, spatial principal component analysis (SPCA), least-cost path (LCP) model, and circuit theory. (3) Based on complex network theory, six attack strategies were designed to simulate random, structural, and functional interference, and the resilience of EN under node and link failures was assessed using the largest connected component, global efficiency, and average clustering coefficient indicators. (4) A priority index was developed by integrating the structural-functional importance ranking with overall resilience. This index, together with critical thresholds, was used to identify EN’s spatial priorities with critical impacts.

2.3.1. Projections of LULC Patterns Under SSP-RCP Scenarios

1.
Selection of Scenarios
The SSP-RCP scenario framework in CMIP6 outlines five distinct pathways that describe potential socioeconomic and climate trajectories through the end of the 21st century [43,49]. Each pathway corresponds to a specific level of radiative forcing and global temperature rise. To examine the impacts of different warming levels on ENs, we selected three representative scenarios: SSP1-2.6, SSP2-4.5, and SSP5-8.5, which are among the most widely used combinations in LULC change projections [41,45,50]. SSP1-2.6 represents a sustainable development pathway, emphasizing low greenhouse gas emissions and a green future. SSP2-4.5 represents an intermediate pathway, with moderate greenhouse gas emissions and steady socioeconomic development. SSP5-8.5 represents a fossil-fuel development pathway, with high greenhouse gas emissions and rapid population and economic growth.
2.
Simulations of Future LULC
The PLUS model integrates a rule-mining framework based on a land expansion analysis strategy with a cellular automata model driven by multi-type random patch seeds [51]. The former embeds a random forest algorithm to quantify the influence of driving factors on LULC change and estimate the expansion probability of each type. The latter simulates the evolution of LULC patches by combining a patch-generation mechanism with a threshold descent method. LULC allocation is guided by projected demand, while adaptive coefficients regulate competition among LULC types. In this study, LULC changes were simulated using 12 driving factors, including precipitation, temperature, population density, GDP, DEM, slope, NDVI, soil type, soil erosion intensity, and distances to water bodies, railways, and roads. Using 2000 as the baseline, the model simulated LULC for 2020, which was then validated against actual data. The model achieved an overall accuracy of 93.0% and a Kappa coefficient of 0.89, indicating high reliability for simulating future LULC dynamics in CYUA. Furthermore, LULC demand for 2040 was projected based on four key variables of precipitation, temperature, population, and GDP, and was incorporated into the PLUS model to simulate future LULC patterns under different scenarios.

2.3.2. Construction of EN

1.
Identification of Habitat Patches
Habitat patches, defined as contiguous areas of natural vegetation or water bodies that meet species’ persistence needs (e.g., survival, foraging, reproduction) and provide multiple high-quality ES [52,53], were identified in three stages. First, given their sensitivity to climate and LULC changes, six ES indicators were selected: habitat quality, carbon storage, water conservation, soil retention, nutrient retention, and landscape aesthetics. These indicators were quantified and spatially mapped using the InVEST model, based on biophysical parameters and empirical data. Detailed calculation procedures are provided in Supplementary Materials S1.
Second, all ES layers were normalized, with inverse normalization applied to negative indicators (Figure S1). Following previous studies [54,55], an equal-weight overlay method was applied to generate the composite ES map. To ensure sustained ES provision and maximize habitat function aggregation, hotspot analysis was conducted to identify clusters of high composite ES values (Figure S2). Hotspots with confidence levels above 95% were selected as candidate patches.
Third, a minimum area threshold was applied to exclude highly fragmented patches. The minimum habitat area threshold is inversely related to patch number and fragmentation, meaning that larger thresholds correspond to fewer patches and lower fragmentation [40,56]. Several values (1, 3, 5, 6, 8, and 10 km2) were tested, and given the large study area, 5 km2 was selected as the interval unit for threshold identification. Using this 5 km2 interval, we measured changes in candidate patch counts and their proportion of the total area to determine the minimum area threshold (Figure S3). Ultimately, a minimum patch size of 15 km2 was identified as the habitat threshold, consistent with the expectations of the CYUA ecological planning [57]. Given the distinct ecological functions and importance of water bodies in highland mountainous regions, six major plateau lakes were designated as habitat patches due to their exceptional conservation value.
2.
Construction of Resistance Surfaces
Resistance surfaces describe the extent to which the landscape matrix impedes species movement and energy flow [58]. Fourteen resistance factors were considered and grouped into four categories: topography (DEM, slope), climate (precipitation, temperature, evapotranspiration), landscape (LULC, NDVI, NPP, biological abundance index, distance to water bodies), and threats (soil erosion intensity, distance to built-up areas, population density, GDP). To minimize spatial multicollinearity and information redundancy among variables, SPCA was employed to construct a composite resistance surface. The detailed procedure is provided in Supplementary Materials S2.
3.
Identification of Ecological Corridors
Ecological corridors, as low-resistance pathways between habitat patches, serve as links that facilitate ecological processes. Potential corridors across the resistance surface were identified using the LCP model, implemented with the Linkage Mapper tool [40]. The cost-weighted distance threshold, a key parameter in modeling, determines the spatial extent of the corridor. As a complement to the LCP model, circuit theory simulates species movement as a random walk and integrates the cumulative probabilities of all possible dispersal pathways to identify areas with high migration potential in the landscape matrix [59,60]. The model generates cumulative current density to quantify connectivity. A greater number of paths connecting two patches corresponds to lower effective resistance and thus higher connectivity. Analyses were performed using Circuitscape 4.0.5 software.

2.3.3. Dynamic Simulation of EN Resilience

Nodes and links in EN are often subject to unpredictable disruptions. Based on complex network theory, dynamic simulations were conducted to assess EN resilience under node and link failures. Iterative removal of network components represented disturbance and renewal processes. The attack followed specific rules: when a node was attacked and removed, all its associated links were also deleted; in contrast, removing a link did not eliminate any nodes [61]. All simulations were implemented using the NetworkX library in Python 3.12
1.
Establishment of Node and Link Attack Strategies
Network resilience is typically assessed through random and deliberate approaches [62]. Random attacks simulate the random removal of nodes or links until the network collapses. Deliberate attacks involve the intentional removal of components in a specified order, often causing more severe disruptions. By prioritizing the removal of highly influential components, deliberate attacks enable a more effective examination of an ecosystem’s capacity to withstand extreme conditions [62]. To compare network performance under different stress conditions, we designed six representative attack strategies (one random and two deliberate strategies for both node and link failures) to simulate disturbances across stochastic, structural, and functional dimensions. Detailed procedures are provided in Supplementary Materials S3.
(1) Node random (Strategy 1): Stochastic/standard strategy. It simulated disturbances by randomly removing nodes, representing accidental failures under natural conditions.
(2) Node centrality (Strategy 2): Structural strategy. It assessed the network’s vulnerability to the loss of structurally important patches. Node importance was quantified using three centrality metrics: degree centrality, betweenness centrality, and PageRank, each reflecting different aspects of network topology [63].
(3) Node ES provision (Strategy 3): Functional strategy. It examined the EN’s resistance to the loss of patches with varying levels of ES provision. Habitat patches with higher population sizes and ES provision levels were considered to have greater functional importance and ecological contributions [64,65].
(4) Link random (Strategy 4): Stochastic/standard strategy. It simulated the impact of random link failures or deactivations on network connectivity.
(5) Link centrality (Strategy 5): Structural strategy. It evaluated the impact of failures in structurally important corridors on EN stability. Link weights reflected their carrying capacity and connectivity strength between nodes. Link importance was calculated using three weighted centrality metrics proposed by Babaei et al. [66]: edge betweenness centrality, the product of endpoint degrees, and the product of endpoint betweenness centralities.
(6) Link quality (Strategy 6): Functional strategy. It investigated the impact of losing corridors with varying ecological quality on landscape connectivity. Corridor quality was measured using resistance-weighted distance per unit length, calculated as the ratio of cost-weighted distance to LCP distance [35].
2.
Selection of Resilience Indicators
Resilience indicators were used to quantify changes in network stability following component removal. A network was considered more resilient if it retained a greater proportion of its original properties. Three global indicators were selected to represent different dimensions of network performance: largest connected component, global efficiency, and average clustering coefficient (Table 2). These indicators were normalized and equally weighted to derive a composite resilience indicator representing the impact of individual attack strategies on overall EN stability.
3.
Measurement of Overall Resilience
Previous studies have mainly observed changes in EN resilience by identifying critical thresholds, often overlooking the network’s overall strength. The robustness index proposed by Schneider et al. [69] quantitatively measures a network’s overall resistance to failure. This index, defined as R = q = 1 n S q / n , reflects the relationship between the relative size of the largest connected component and the proportion of nodes removed, providing a numerical standard for measuring robustness. It was further extended to measure link robustness [70]. In practice, this value is approximated by the area under the curve (AUC) of the S q function. Accordingly, AUC has been adopted as a normalized summary index of network robustness [71], with higher values indicating greater robustness. Given the strong association between resilience and robustness in EN [72,73], this study adopts AUC index to quantify overall EN resilience.

2.3.4. Resilience-Based Spatial Prioritization

Spatial prioritization analysis aims to provide planners with essential information on conservation priority areas and optimal corridors within EN [14,64]. In the resilience assessment framework, deliberate attack simulations are employed to efficiently rank the importance of network components [18]. Lower resilience values indicate higher attack efficiency and more accurate identification of critical nodes and links. We proposed an integrated approach to identify key structural and functional components of resilience as spatial priorities, aiming to meet connectivity needs under dual objectives. A priority index was derived from the ranked scores of a composite resilience indicator based on both structural and functional strategies. The overall resilience values of each strategy were used as reciprocal weighting coefficients in the calculation. The equation is as follows:
P i = A U C F × C S i + A U C S × C F i
where P is the priority index; A U C is the overall resilience value; C is the score ranking of the composite resilience indicator; S and F is structural and functional strategies, respectively; i is node or link.

3. Results

3.1. Spatiotemporal Changes of LULC Patterns Under Multiple Scenarios

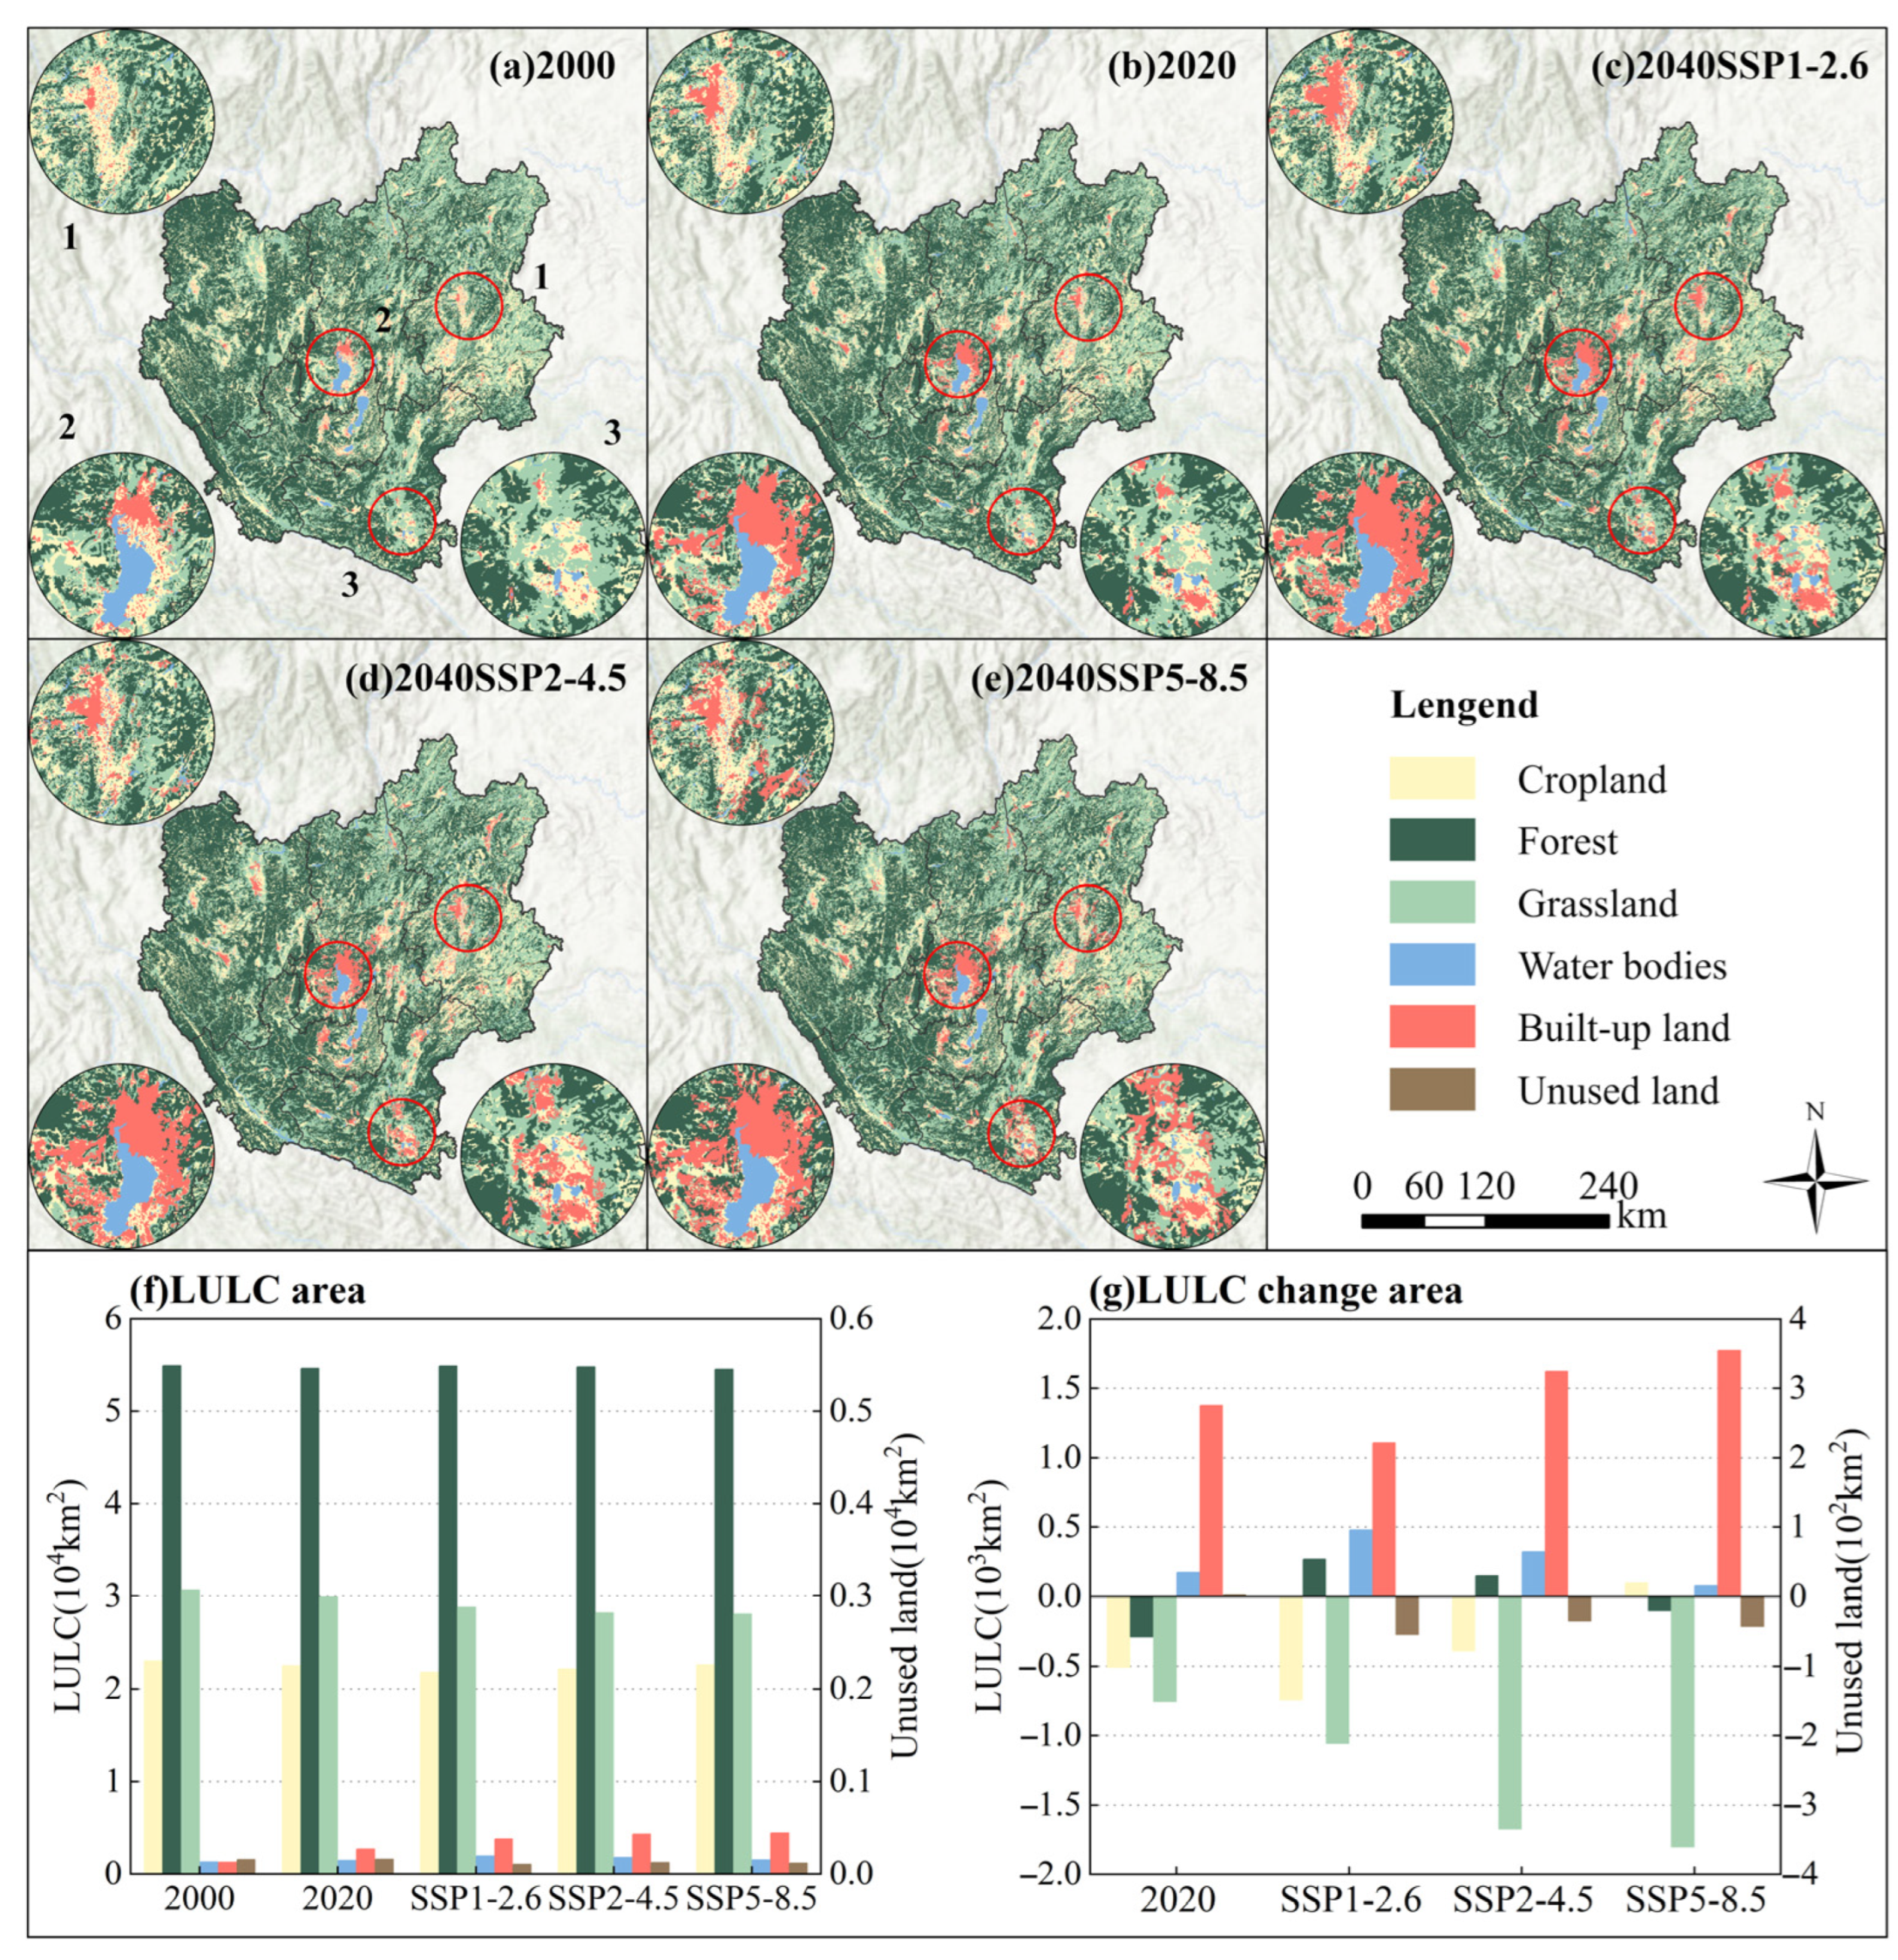
LULC patterns in 2000, 2020, and projected 2040 showed that forest, grassland, and cropland consistently dominate the landscape, accounting for approximately 49%, 25%, and 20% of the total area, respectively (Figure 3a–e). Forests are mainly distributed in the mountainous western regions, croplands are concentrated in the flat central and eastern basins, and grasslands occur in transitional mountainous or semi-mountainous zones between forest and cropland. Ecological land types (i.e., forest, grassland, and water bodies) collectively occupy over 75% of the total area, forming the foundation of ecological stability in CYUA.
Between 2000 and 2020, LULC changes in CYUA were dominated by the conversion of grassland and cropland into built-up land, reflecting significant urban expansion. Projections indicate continued expansion of built-up land by 2040, with three representative regions selected to monitor spatial changes. Under SSP1-2.6, SSP2-4.5, and SSP5-8.5 scenarios, the proportion of built-up land is projected to increase to 3.38%, 3.84%, and 3.98%, respectively, representing relative increases of 41.57%, 60.99%, and 66.64% (Figure 3f–g). Conversely, grassland area is expected to decrease by 0.95%, 1.50%, and 1.62% under the respective scenarios, largely corresponding to the expansion of built-up land. Under SSP1-2.6, cropland experiences moderate reductions, while forest and water bodies are well preserved and exhibit slight increases. Built-up land expands slowly, with minimal encroachment into ecological land (Region 3). Under SSP2-4.5, changes in cropland, forest, and water bodies are similar to those under SSP1-2.6, though less pronounced, while built-up land expands at a moderate pace. Under SSP5-8.5, cropland and forest undergo minimal and opposite changes compared with the other scenarios, while built-up land expands rapidly, substantially encroaching upon grassland areas (Regions 1, 2).

3.2. Spatiotemporal Evolution of EN

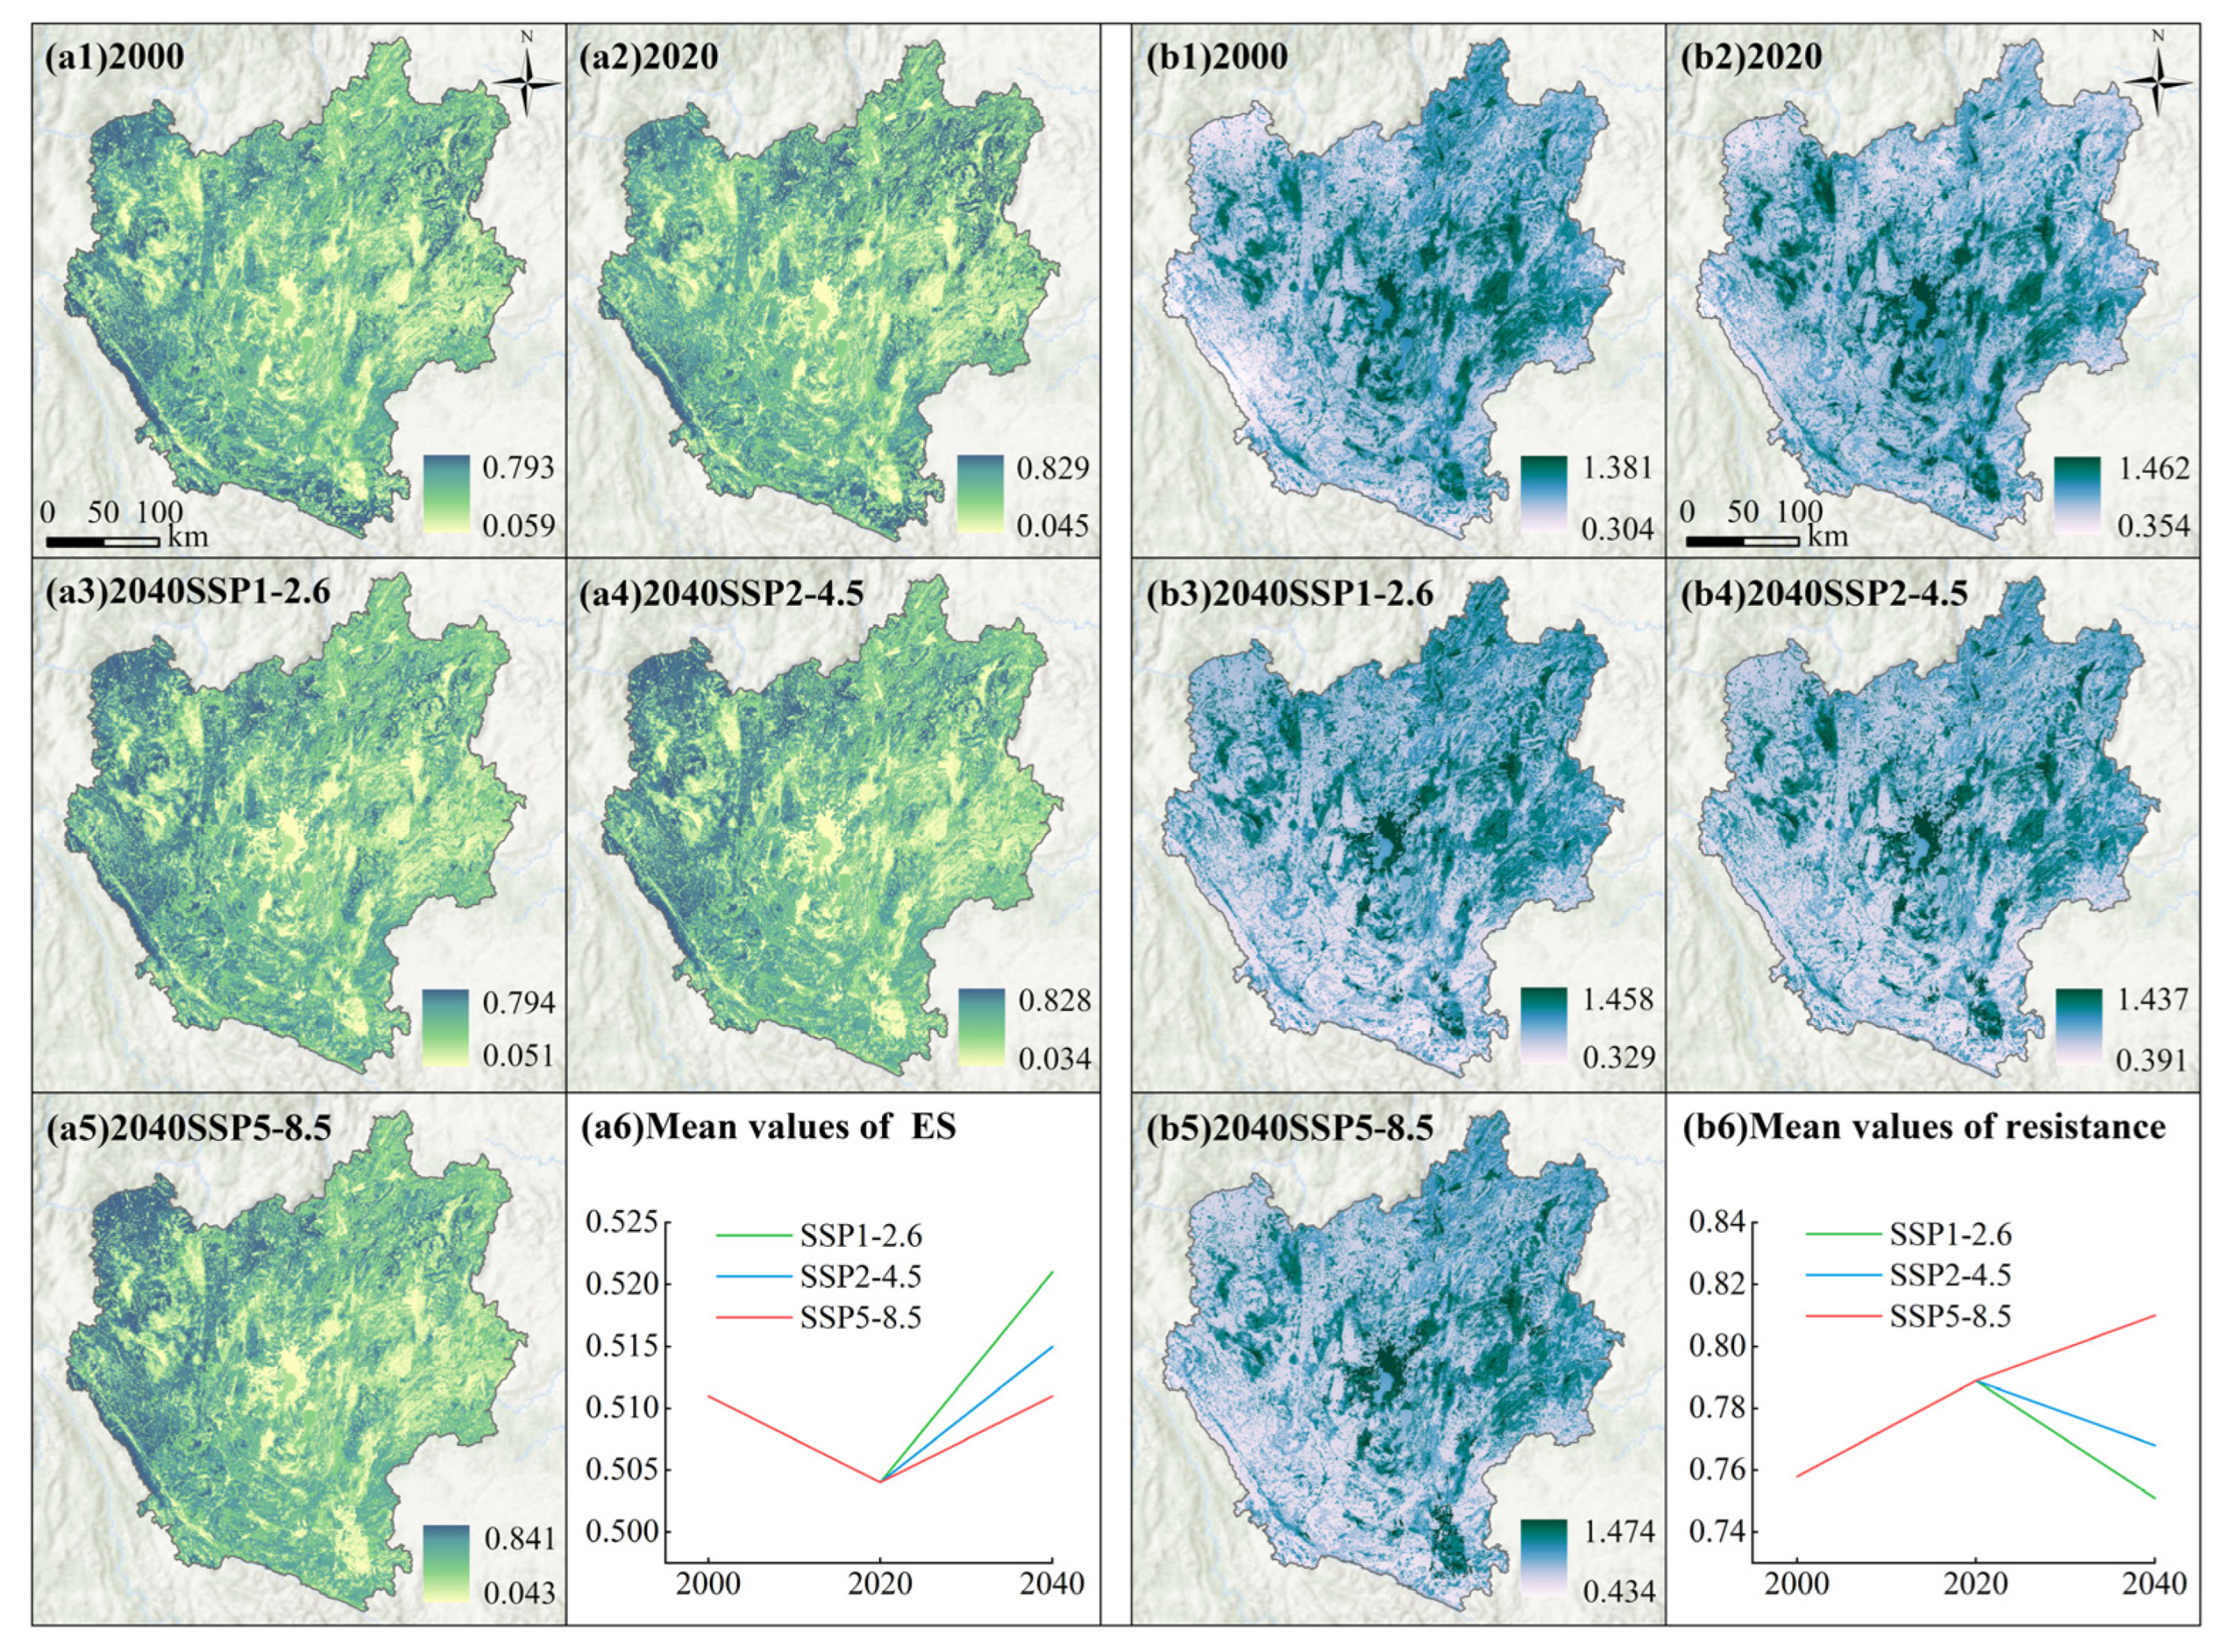
From 2000 to 2040, the spatial distribution of composite ES gradually shifted from a “low-central, high-peripheral” pattern to a “low-southeast, high-northwest” configuration (Figure 4a). The mean composite ES value initially declined and then increased, with relatively small fluctuations, reaching the highest levels under SSP1-2.6. The spatial distribution of the resistance surfaces was generally inverse to that of the composite ES, with higher values concentrated in urban and peri-urban areas (Figure 4b). In SSP5-8.5, the mean resistance value showed a continuous upward trend, while the other scenarios exhibited a rise followed by a decline.
Across the three periods, EN exhibited a spatial pattern of higher density in the west and lower density in the east (Figure 5). Areas of high current density, mainly located in the northern and southwestern parts of the landscape matrix, represented areas with high potential for species dispersal and energy flow. Between 2000 and 2020, most habitat patches contracted, with only slight expansion observed in Qujing. From 2020 to 2040, habitat patches are projected to further concentrate in Chuxiong and Yuxi, resulting in a westward aggregation of the overall EN configuration (Region 1). In contrast, ecological corridors in Qujing are expected to disappear due to habitat degradation (Region 2).
Over the past two decades, an increase in patch number and a decrease in total area indicated significant habitat loss and fragmentation in CYUA, resulting in longer and more numerous corridors (Table 3). Under future scenarios, habitat area is projected to expand and corridor length to shorten, although the number of patches and corridors is expected to decline. Statistical metrics of habitats and corridors suggest that the SSP1-2.6 scenario provides the most favorable conditions for EN development. Under SSP1-2.6, SSP2-4.5, and SSP5-8.5, the total area of EN is projected to decrease slightly by 1.44%, 1.85%, and 1.48%, respectively. Overall, due to increases in habitat area, along with higher levels of aggregation and connectivity, the spatial cohesion of the CYUA’s EN is expected to improve. These changes are primarily driven by climate change and increases in forest and water bodies.

3.3. Analysis of Resilience Changes in EN

Simulated attacks on the abstracted EN (Figure S4) revealed how removal ratios of nodes and links affected the largest connected component, global efficiency, and average clustering coefficient (Figure S5). These metrics collectively reflected changes in EN resilience.

3.3.1. Changes in EN Resilience Under Node Failures

Figure 6 shows that under node random attacks (Strategy 1), resilience trends were generally consistent across the three time periods. When the removal ratio was 0–30%, the curve declined slowly and the network structure remained stable. Once the removal ratio exceeded 30%, the curve dropped rapidly, and as it approached 1, the network collapsed completely. Node deliberate attacks (Strategies 2 and 3) resulted in a steeper decline in resilience, confirming that nodes with higher structural and functional importance had a greater impact on network stability. When the removal ratio was 0–20%, the curve decreased by nearly half. The continuous removal of critical nodes caused rapid network fragmentation, severely reducing connectivity, transmission efficiency, and aggregation. Between 20–60% removal, the rate of decline slowed. When removal exceeded 60%, the network under Strategy 2 collapsed, whereas Strategy 3 required over 80% removal to reach collapse. The resilience index threshold, defined as the removal ratio at which the curve falls to half its initial value, serves as a key indicator of whether the system can maintain stability [15,18]. From 2000 to 2040, the resilience index thresholds for Strategies 1–3 ranged from 0.49–0.54, 0.13–0.19, and 0.18–0.33, respectively. The thresholds for Strategies 2 and 3 increased over time, indicating a growing importance of critical nodes.
Table 4 summarizes the overall resilience of EN under node and link failures. From 2000 to 2040, the AUC indices under Strategy 1 ranged from 0.514–0.544, with slight decreases in both SSP1-2.6 and SSP2-4.5. Strategies 2 and 3 showed consistent increases, with AUC indices ranging from 0.202–0.284 and 0.281–0.359, respectively. The former exhibited a 7.1% increase under SSP1-2.6, while the latter showed a 5.9% increase in 2020. Comparatively, Strategy 3 demonstrated greater overall resilience (10.5% higher AUC indices), reflected in a gentler decline in the resilience curve during the mid-term period, whereas Strategy 2 approached network collapse more rapidly. The difference was attributed to Strategy 2 prioritizing the removal of nodes with high composite centrality, which severely disrupted the network’s structural integrity. Conversely, Strategy 3 focused on removing nodes with high ES provision, which enhanced the robustness of functionally important yet structurally vulnerable nodes, thereby delaying system collapse.

3.3.2. Changes in EN Resilience Under Link Failures

Across the three link attacks, EN resilience trends were generally similar across years and scenarios (Figure 7). Under random strategy (Strategy 4), resilience declined slowly when the removal ratio was 0–40%, followed by a steeper decline between 40–80% and a slower decline thereafter. When the removal ratio exceeded 95%, resilience approached 0. Under deliberate strategies (Strategies 5 and 6), the decline in resilience curve was relatively steady. Notably, in Strategy 5, all resilience curves showed a sharp drop between 35–55% removal, primarily due to the disconnection of highly important nodes, which severely disrupted network connectivity. From 2000 to 2040, the resilience index thresholds for Strategies 4–6 ranged from 0.59–0.62, 0.36–0.52, and 0.46–0.54, respectively. While Strategy 4 showed a slight decline, Strategies 5 and 6 exhibited divergent trends across future scenarios.
From 2000 to 2040, Strategy 4 exhibited the highest overall resilience among all attack strategies, with AUC indices ranging from 0.561–0.582, which first increased and then declined (Table 4). Strategy 5 yielded AUC indices ranging from 0.413–0.452, with a slight decrease under SSP2-4.5 and increases under the other scenarios. Compared to node attacks, it exhibited significantly higher overall resilience than Strategy 2 (20.6% higher AUC indices). Strategy 6 showed AUC indices ranging from 0.475–0.503, with a minor increase under SSP1-2.6 and decreases under the other scenarios. Relative to node attacks, it was notably less disruptive than Strategy 3 (15.0% higher AUC indices). Between Strategies 5 and 6, the latter exhibited higher overall resilience (5.0% higher AUC indices), suggesting that functional links are more effective in maintaining EN stability.
Overall, node attacks were more disruptive than link attacks, particularly under deliberate strategies, as they caused a more rapid decline in resilience. Removing a node disconnects it from all adjacent nodes, whereas removing a single link does not disconnect the connected nodes unless all of their links are severed. Under future scenarios, SSP1-2.6 exhibited the highest overall resilience for Strategies 2 and 6, whereas the other strategies performed best under SSP5-8.5. On average, overall resilience increased by 1.5% in SSP1-2.6, decreased by 0.9% in SSP2-4.5, and increased by 0.6% in SSP5-8.5, suggesting that the sustainable development pathway provides the greatest potential for the stability and persistence of CYUA’s EN over the next two decades.

3.4. Spatiotemporal Evolution of EN Resilience Conservation Patterns

3.4.1. Dynamic Simulation of EN Resilience Spatial Patterns

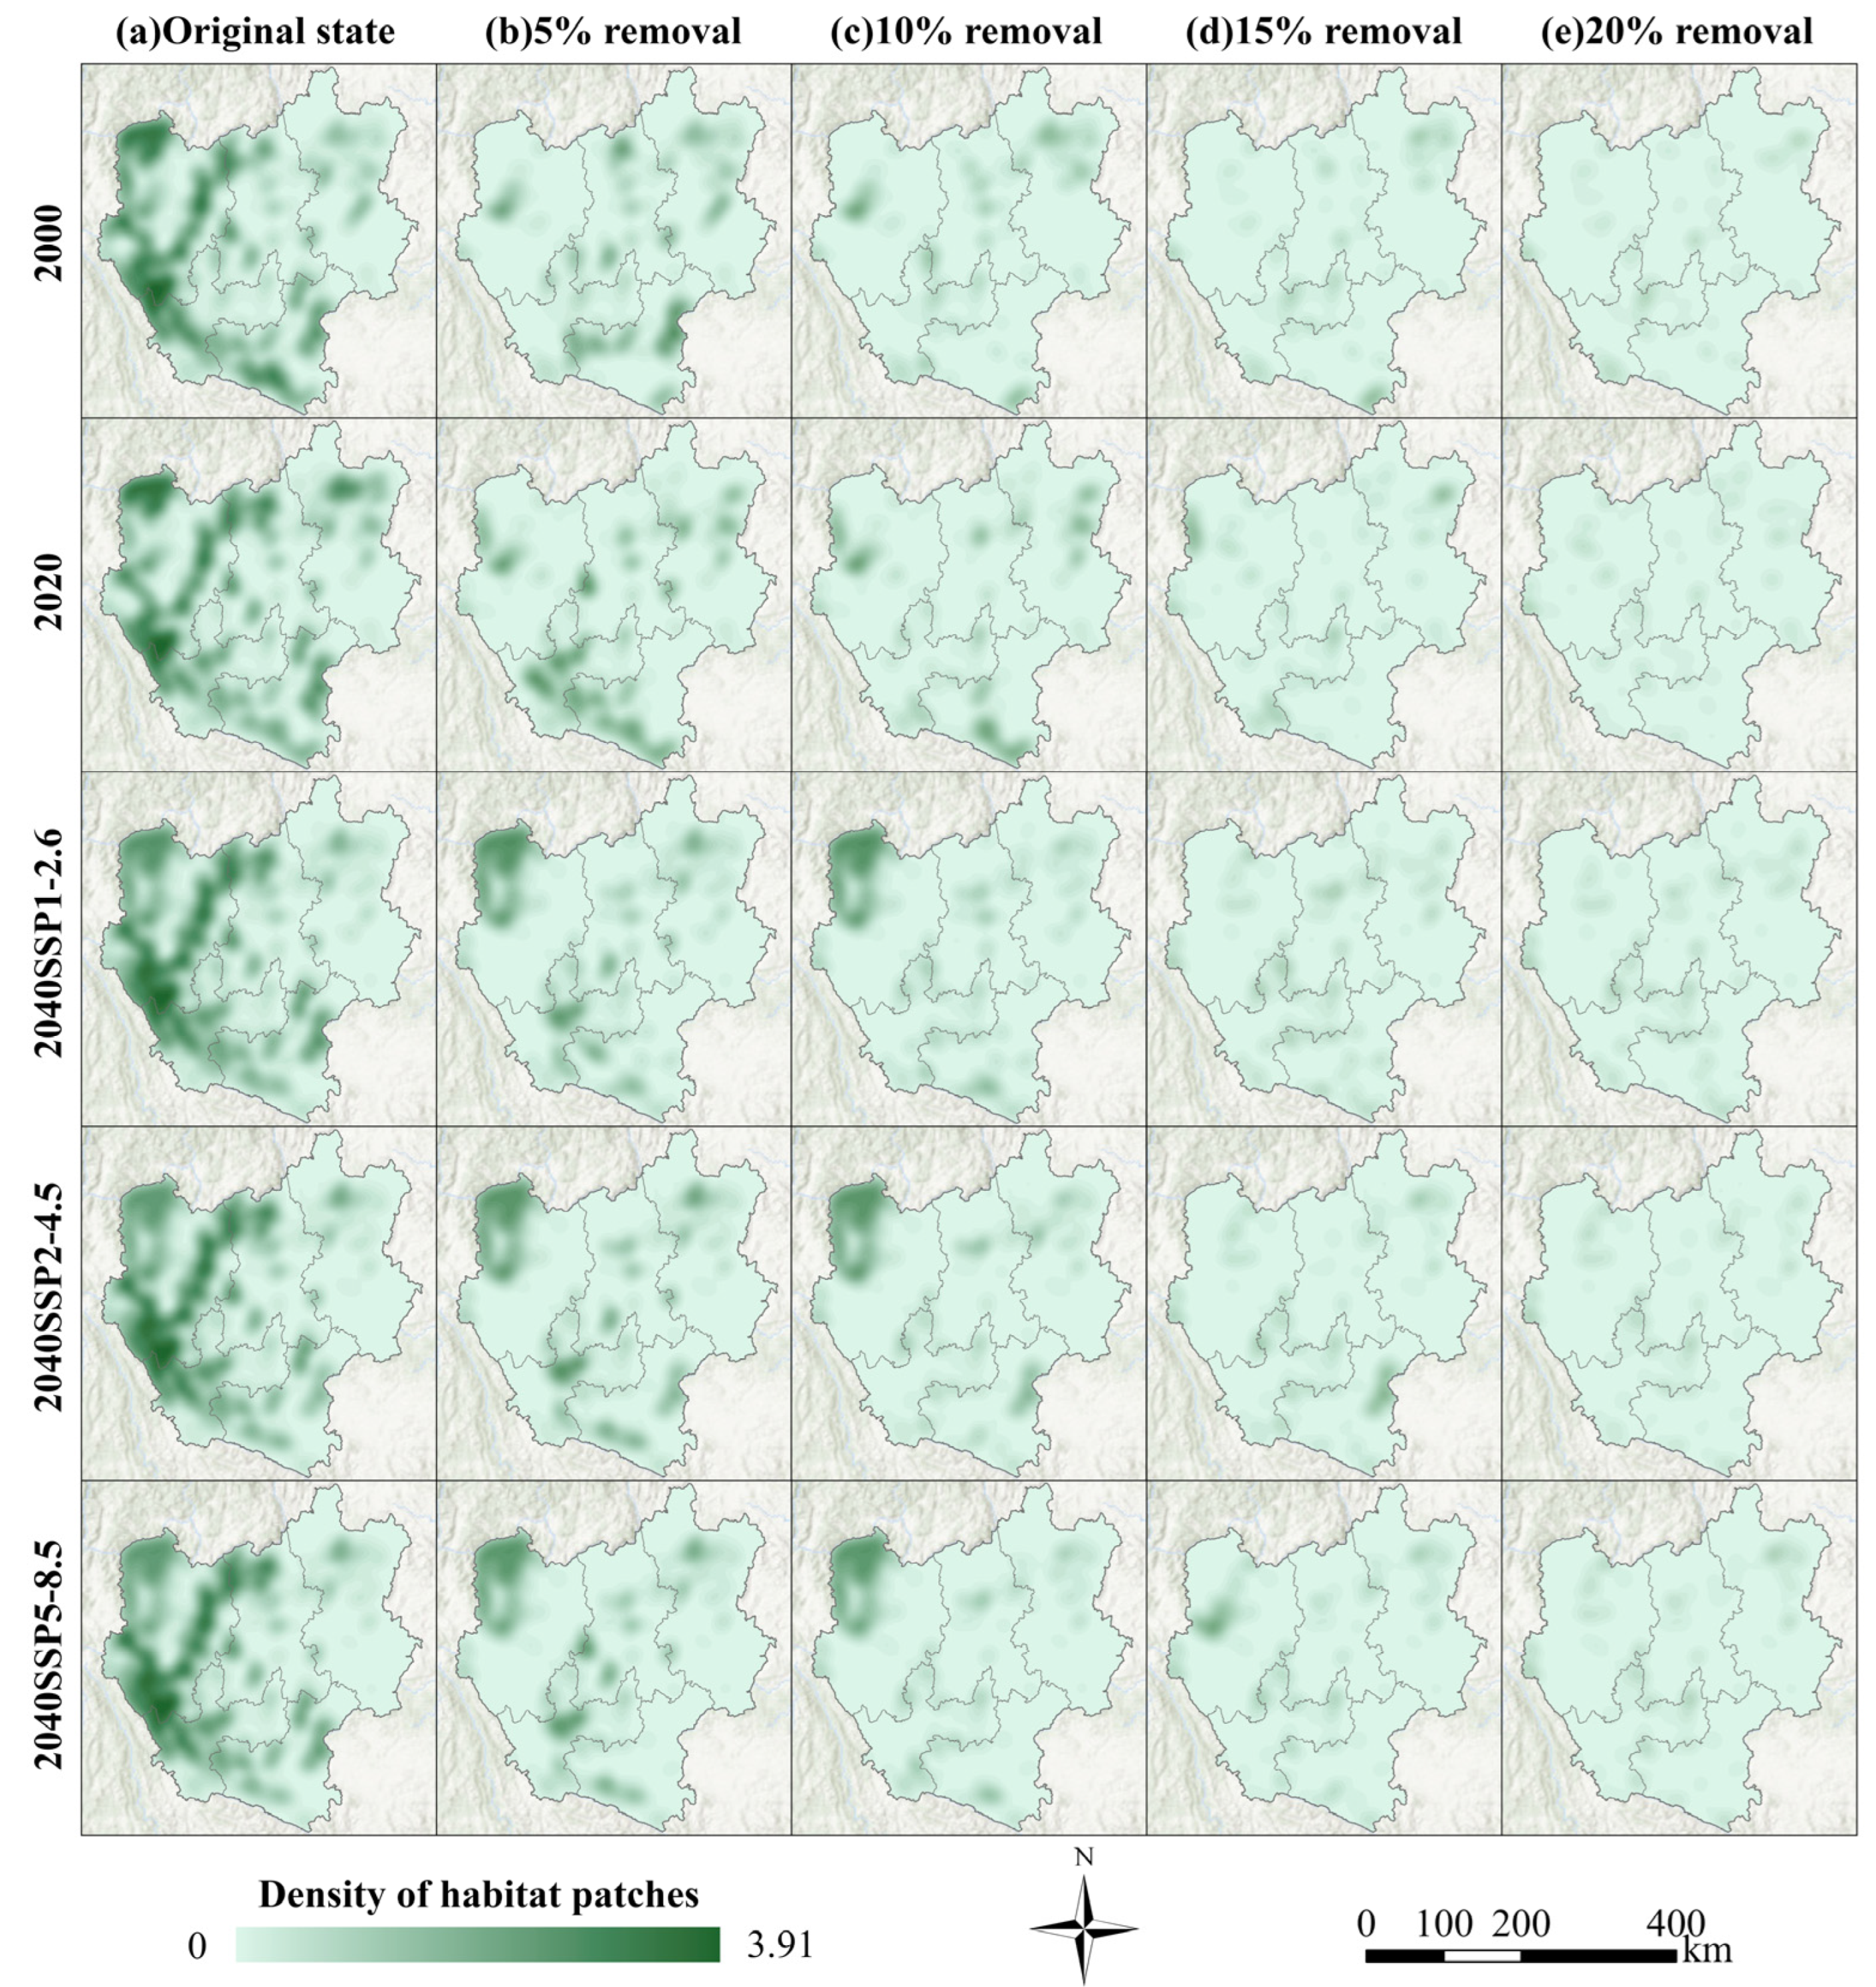
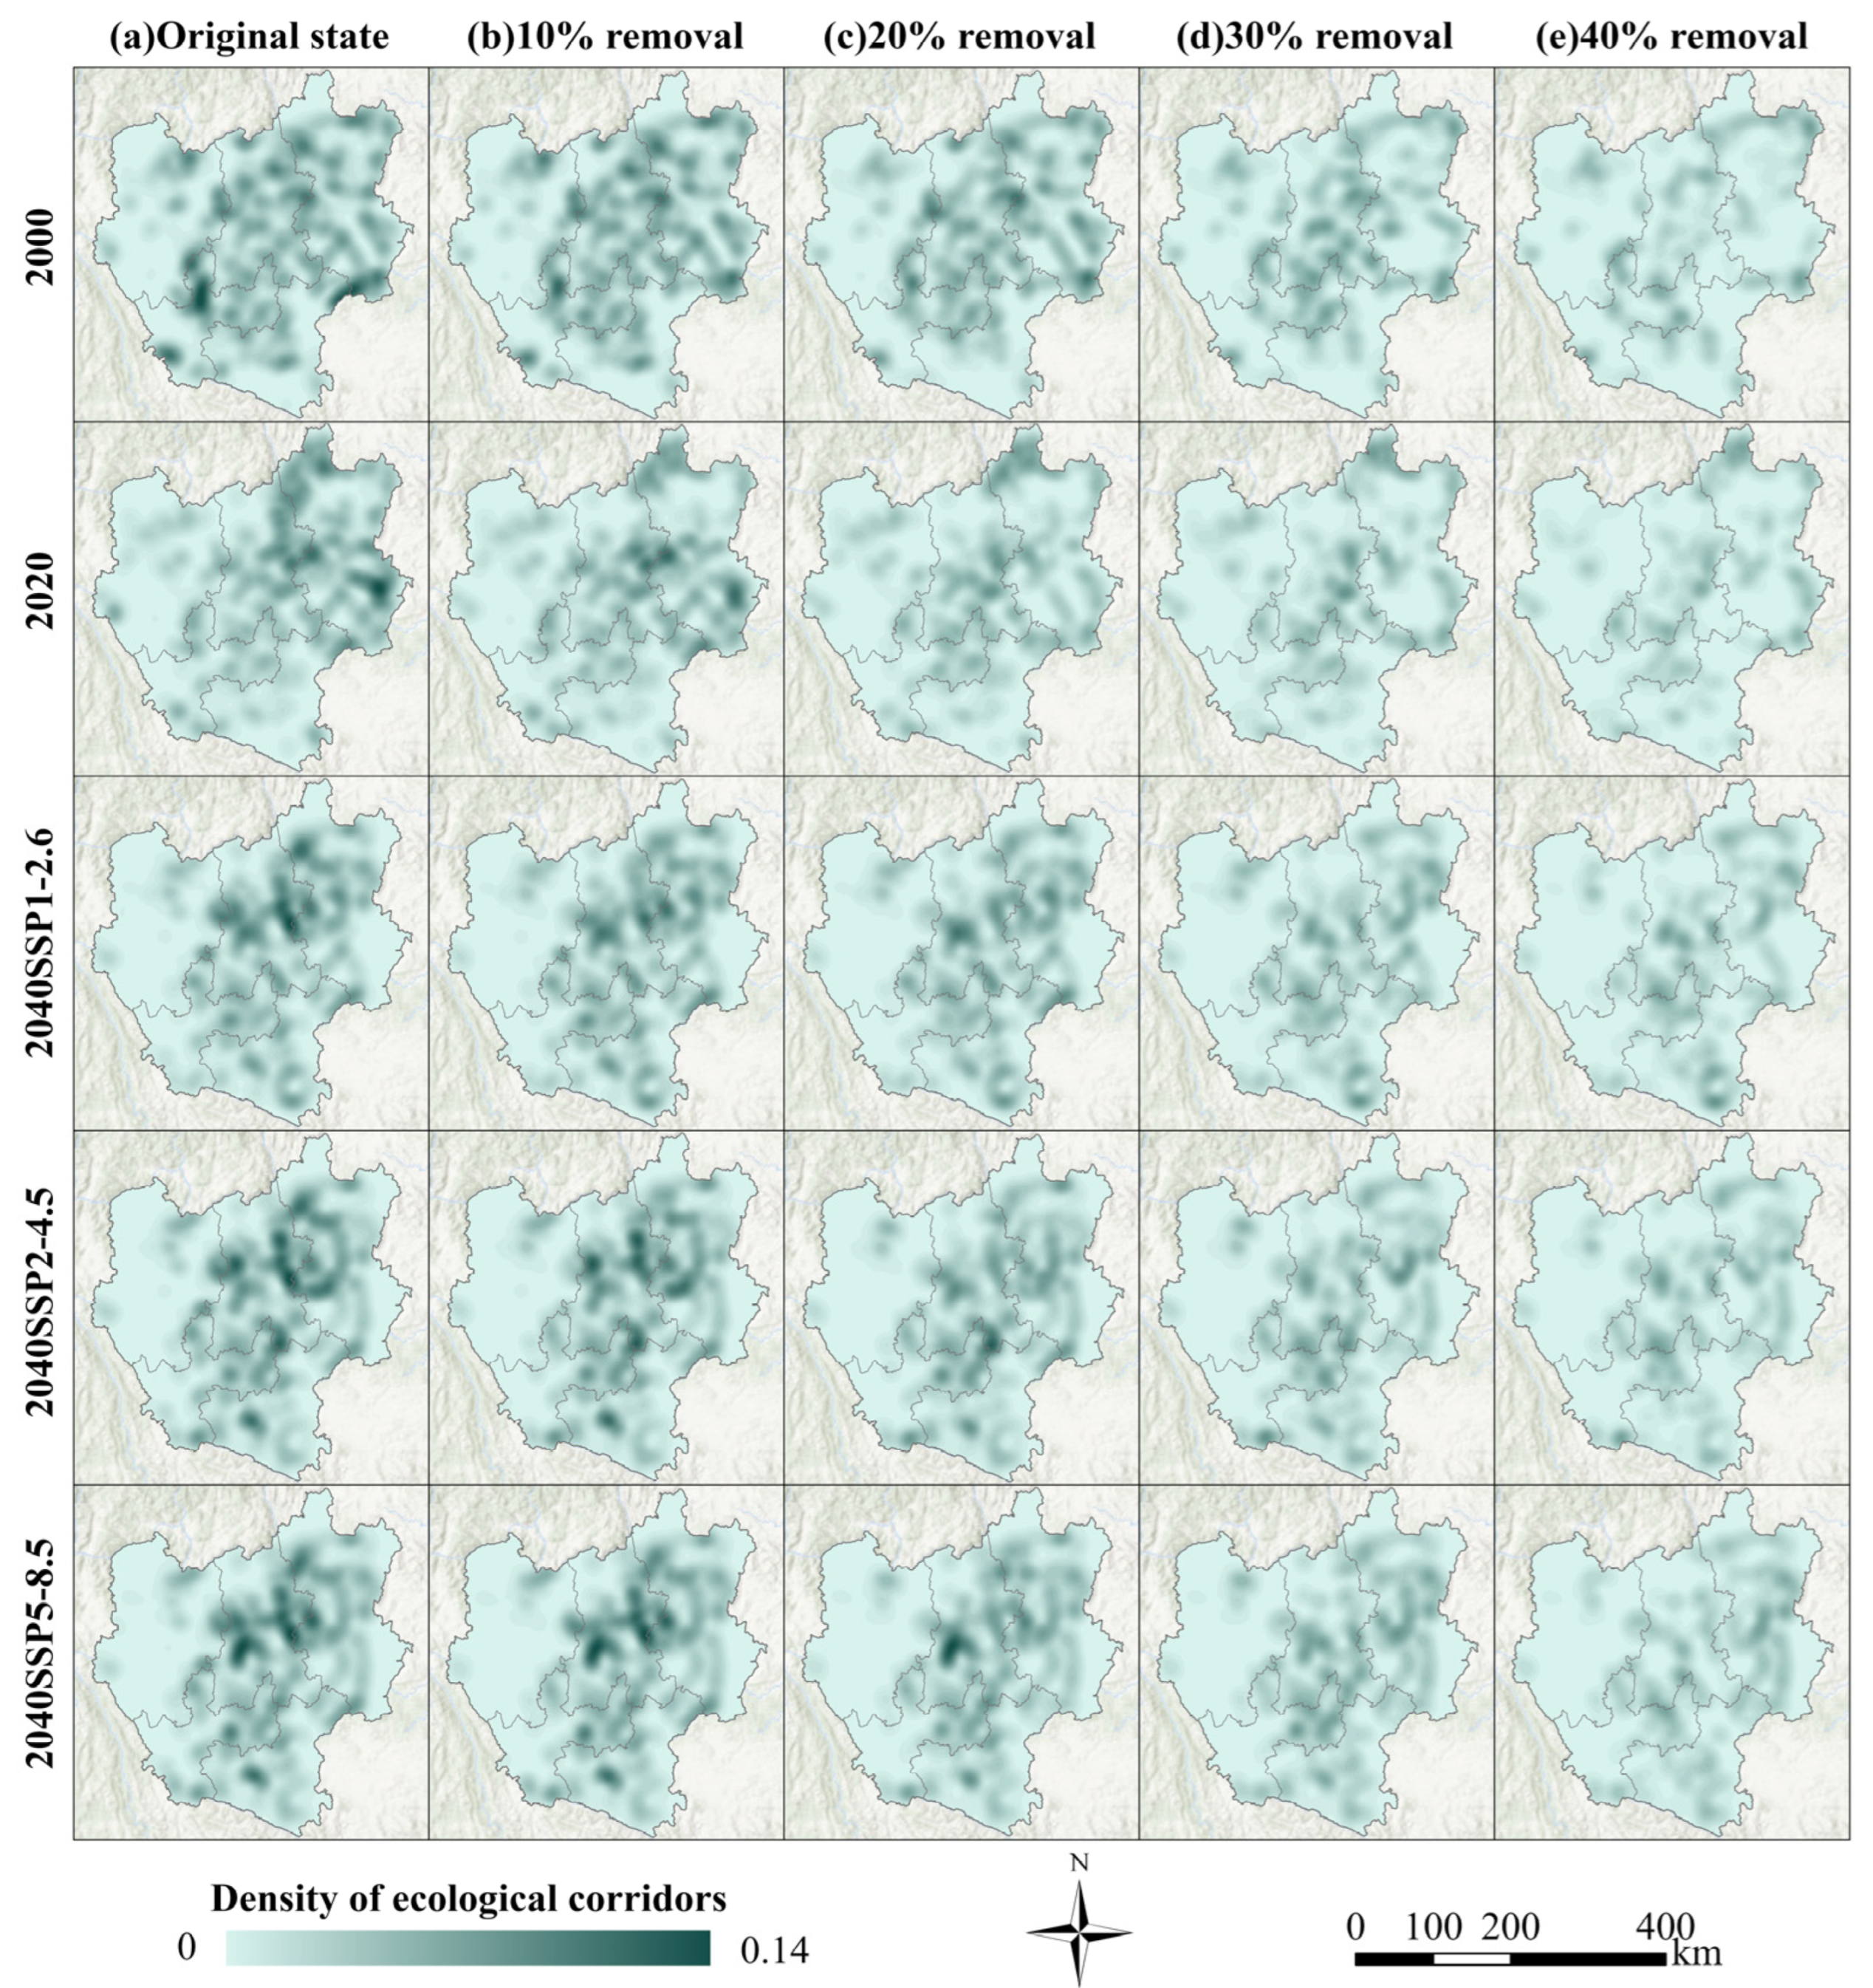
By integrating the priority indices and resilience index thresholds, approximately the top 20% of nodes and 40% of links were identified as critical resilience components for maintaining the stability of EN. To visualize the spatial dynamics of resilience patterns, kernel density analysis was performed on the remaining network, based on the priority indices and using intervals of every 5% of nodes and 10% of links.
Figure 8 shows that the spatial distribution of high-density nodes in the initial networks of CYUA is similar across different periods, with a primary concentration in the west. These nodes were mainly centered around important nature reserves and forest parks, such as Ailao Mountains, Dinosaur River, Mopan Mountain, Zixi Mountain, Huajiaoyuan, Sanfeng Mountain, Baicao Mountain, Yunlong, and Jiaozi Mountain, forming a contiguous “Y-shaped” hotspot cluster. When 5% of nodes were removed, most high-density areas disappeared, and the extent of habitat hotspots was significantly reduced, highlighting their core role in maintaining EN resilience. As the removal ratio increased, the remaining hotspots continued to decline. Compared with historical periods, future scenarios show a notable increase in resilience values in the northwest. Under the 20% removal condition, all high-density areas vanished, with the initial hotspots reduced to a lower level and showed a highly fragmented state.
Figure 9 illustrates that the spatial distribution of high-density links in the initial networks of CYUA varied across three time periods. In 2000, these links were dispersed across the center and east, while by 2020, they concentrated in the east. By 2040, under all three scenarios, high-density links showed similar spatial distributions, primarily clustered in the north-central area, forming a ring-shaped hotspot at the junction of Kunming and Qujing. As links were progressively removed, high-density areas gradually disappeared, and the extent of corridor hotspots contracted. When 10% of links were removed, the hotspot pattern remained largely unchanged, likely because these corridors were relatively short and connected critical resilient habitats. At a 20% removal rate, high-density areas declined significantly, suggesting that the top 20% of corridors served as core connectors in the resilient EN. With 40% link removal, few high-density areas remained, and the initial hotspots diminished to moderate or even low levels.

3.4.2. Spatial Prioritization Analysis of EN

Based on the dynamic evolution of resilience patterns, EN elements were classified into three conservation levels: core priority, secondary priority, and general conservation. According to the priority index rankings, nodes and links were divided into three classes (the top two representing critical resilience components), corresponding to these conservation levels.
Across the three periods, the CYUA region exhibited a resilience-ased priority conservation pattern with stronger periphery and weaker center (Figure 10). Most critical resilience nodes were concentrated in the Honghe and Jinsha River basins, forming the core of the ecological landscape. Compared to 2020, habitat priority levels in the northwest are projected to decline markedly under future scenarios. Several nodes, including 110, 159 and 161, are projected to merge into a large-scale habitat in the west (corresponding to Node 139 in SSP1-2.6, 134 in SSP2-4.5, and 133 in SSP5-8.5), which is expected to greatly enhance both structural and functional resilience. Critical resilience links ensured connectivity between critical nodes and their adjacent nodes, forming a clearly hierarchical network structure. The spatial pattern shifted from a relatively balanced distribution to a more peripheral concentration. Under future scenarios, primary links are projected to form an arc-shaped belt centered in the west, extending from the southwest through the west and north to the northeast, thereby enhancing connectivity resilience among critical nodes.
Following detailed analysis, the top 15.8%, 17.8%, 23.8%, 19.6%, and 20.4% of nodes are identified as critical resilience habitats in 2000, 2020, and three projected 2040 scenarios, respectively (Table 5). They account for 73.1%, 73.4%, 78.5%, 76.1%, and 76.2% of their respective habitat areas, with core habitats comprising nearly or over half of each. Both the number and area proportions show an increasing trend, with SSP1-2.6 performing best. This suggests that future habitats are likely to receive higher conservation priority. In terms of link priority, critical resilience corridors represent 39.9%, 46.2%, 42.2%, 36.9%, and 40.2% of the total number across the same timeframes and scenarios, with corresponding length proportions of 46.0%, 51.3%, 39.2%, 34.6%, and 38.3%. Both the number and length proportions follow a rise-then-decline trend, with SSP2-4.5 appearing most vulnerable. These findings indicate that future prioritized corridors may form a more compact and better-connected structure.

4. Discussion

4.1. Feedback of SSP-RCP Scenarios’ Impacts on EN Construction

Multi-scenario EN construction contributes to strengthening regional ecological management. This study employs SSP-RCP scenario data to project the future configuration of EN. Validation shows that the multi-scenario EN results are highly consistent with the “three rivers, six lakes, and multiple points” ecological spatial pattern outlined in the “Special Territorial Spatial Plan for the Central Yunnan Urban Agglomeration (2021–2035)” [57], particularly in terms of habitat distribution. Climate and LULC changes profoundly affect landscape ecological processes. Compared with 2020, urban expansion and substantial grassland loss by 2040 are expected to intensify local connectivity pressures, such as habitat fragmentation and increased corridor cost-distance (Figure 3). Nevertheless, the future EN pattern in CYUA does not fully align with the common phenomenon that climate change and land expansion generally cause habitat loss and connectivity decline [39,74,75]. Under SSP1-2.6, SSP2-4.5, and SSP5-8.5 scenarios, habitat area is projected to increase by 2040 (Table 3), which slightly differs from findings of similar studies in other regions of China [8,10,55,76]. This discrepancy can primarily be attributed to the high proportion of ecological land in CYUA, which accounts for over three-quarters of total LULC. In addition, the interaction between climatic (especially increased precipitation) and socioeconomic factors is expected to enhance ES provision capacity [45]. Furthermore, with changes in the location and number of habitat patches and corridors, the overall EN pattern shows a westward clustering tendency and improved connectivity (Figure 5).
Comparative analysis across scenarios reveals that SSP1-2.6 results in the largest ecological land area and the highest composite ES value (Figure 3f and Figure 4a). Under this scenario, favorable climatic and socioeconomic conditions support the greatest number and extent of habitats (Table 3). This suggests that under a sustainable pathway, ecological protection-focused policies and strict land-use regulations can effectively alleviate the socioeconomic pressures of urban agglomerations while promoting natural ecosystem development [42,76]. In comparison, SSP2-4.5 scenario provides a relatively larger ecological land area and higher ES value than SSP5-8.5 but supports the smallest habitat extent. As an intermediate pathway, SSP2-4.5 represents a natural trajectory of ecological and socioeconomic development, leading to increased landscape fragmentation and lower efficiency of biodiversity conservation [77]. Although the SSP5-8.5 scenario involves large-scale expansion of built-up land, it retains a degree of ecological landscape aggregation [40].
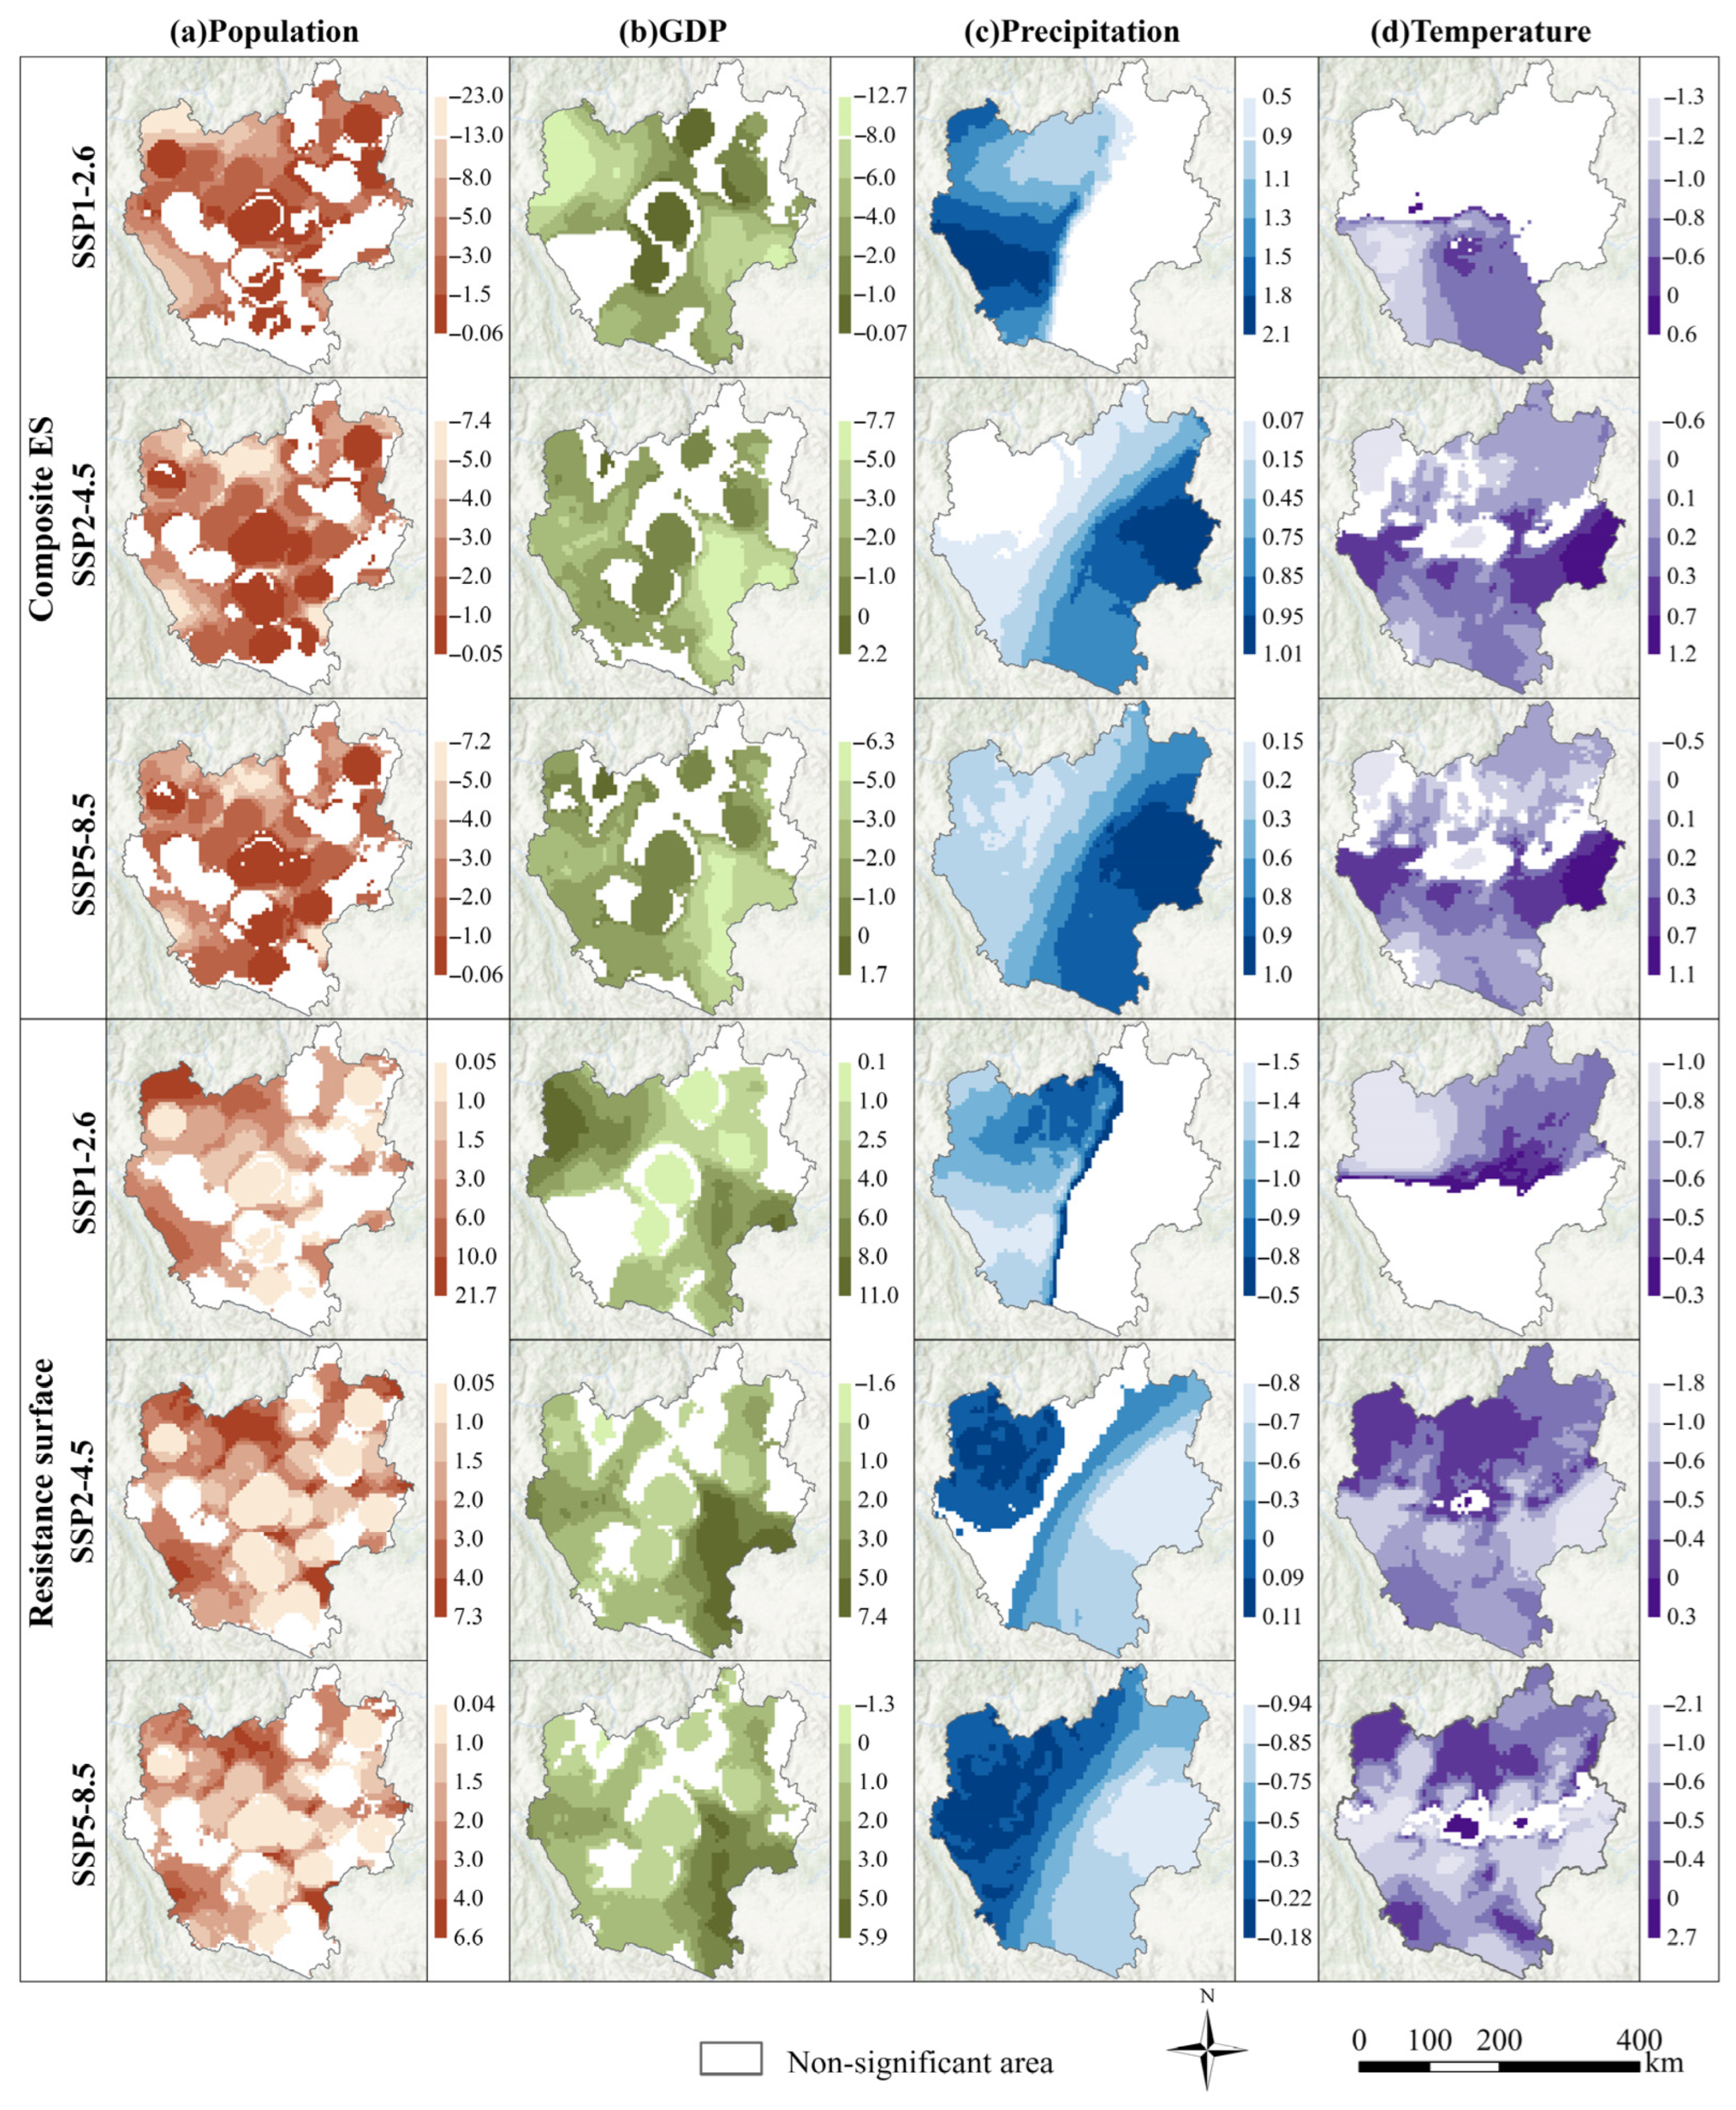
The above analysis indicates that LULC dynamics and ES changes are key drivers of structural and functional changes in EN and are jointly influenced by climatic and socioeconomic factors under different SSP-RCP scenarios. A multiscale geographically weighted regression (MGWR) model was employed to quantify the spatially heterogeneous impacts of different climate and socioeconomic factors (population, GDP, precipitation, and temperature) on EN. Composite ES and resistance surfaces, two critical landscape attributes influencing habitat and corridor distribution, were used to characterize EN. Two indicators showed different spatial dependencies on the explanatory variables. The proportion of areas with significant coefficients ranged from 38.9-99.9%, exceeding 60% in most cases (Figure 11). Specifically, population and GDP were negatively correlated with composite ES, while precipitation and temperature were positively correlated (except for temperature in SSP1-2.6). Resistance surfaces exhibited generally opposite responses to these variables compared to composite ES. In terms of the absolute values of mean correlation coefficients, population and GDP had stronger impacts on EN than precipitation and temperature (Table S7). Composite ES were more sensitive to changes in population, GDP, and precipitation than resistance surfaces. Population and GDP exhibited similar spatial patterns, with higher correlations in peripheral areas and lower correlations in urban centers, in contrast to the intensity of human activities. Correlations with precipitation increased from northwest to southeast, while those with temperature strengthened from both the northern and southern edges toward the center. Notably, although SSP1-2.6 yielded higher mean correlation coefficients than SSP2-4.5 and SSP5-8.5, it exhibited smaller areas of significance and greater spatial variability, particularly for precipitation and temperature. Overall, the interactions among the four factors showed greater spatial heterogeneity in peripheral areas than in urban centers, emphasizing the complexity of EN dynamics in CYUA under future scenarios.

4.2. Advantages of EN Resilience for Spatial Prioritization under Node and Link Failures

Resilient EN can enhance the persistence of natural ecosystems [78]. Building on complex network theory, this study integrates node-link failure mechanisms with structural and functional attributes into a dynamic simulation model (Figure 12). In contrast to traditional conceptual, single-dimensional, or static studies [24,25,79], this framework provides a dynamic assessment approach to simulate multidimensional disturbances, quantify EN resilience, and identify spatial priority areas with dual conservation benefits. Specifically, by simulating disturbances from natural and anthropogenic sources and capturing detailed ecological processes, the framework accounts for ecosystem complexity and enables more accurate quantification of adaptive risks [17]. Two key advantages are highlighted: resilience assessment and spatial prioritization, whose integration addresses the challenge of maintaining both structural and functional connectivity in resilient EN.
Firstly, the assessment of EN resilience is based on node and link failure simulations. In the quantitative evaluation of resilience, complex network theory offers a dynamic perspective, which is characterized by simulating the network’s responses to various types of disturbances (i.e., node or link failures) [72]. Unlike previous analyses that primarily focused on single-attack dimensions [29,34], our study considers both node and link failure perspectives to comprehensively evaluate EN resilience. Network stability is further examined under various attack conditions using random, functional and structural strategies. The analysis reveals that node failures consistently cause more severe disruptions to EN performance than link failures across random and deliberate strategies (Figure 6 and Figure 7). This reflects the inherent topological characteristics of complex networks—removing a node simultaneously eliminates all its connected links, whereas removing a link does not affect node existence [61]. Notably, this study introduces the AUC index to quantify overall resilience, enabling a more effective analysis of the evolution of the EN dynamic response (i.e., perturbation absorption and adaptation) across past to future scenarios. This approach overcomes limitations of previous studies, which relied solely on identifying critical thresholds or abrupt shifts in network performance. The analysis of mean overall resilience indicates that the SSP1-2.6 scenario has a clear advantage in enhancing the stability of EN. Although the functional importance of EN components appears more effective than structural ones in resisting extreme disturbances, the findings also underscore the necessity of managing structural configurations to enhance stability.
Furthermore, spatial priorities are identified based on the dynamic patterns of EN resilience. The integration of spatial prioritization with network resilience has emerged as a novel research direction [32,34,36], aiming to prioritize the conservation of habitats and corridors that are essential for maintaining EN stability. Resilience-based prioritization entails linking priority indices and critical thresholds to dynamic patterns, thereby forming a decision process that combines rational and emotional motives [11]. The analysis shows that the disruption of critical nodes has a more detrimental impact on spatial resilience patterns than the removal of critical links. Removing just 5% of nodes results in the disappearance of numerous high-density areas, whereas achieving a similar effect requires the removal of 20% of links (Figure 8 and Figure 9). Unlike previous studies that focused solely on habitat size [33,80], our prioritization results identify several medium-sized and even smaller patches (Figure 10). Owing to their notable topological advantages, these patches function as stepping stones within the network. Our prioritization scheme is distinct in that it integrates both structural and functional objectives of the EN, avoiding biased conclusions that focus solely on elements with high ES provision or ecological quality while neglecting structural linkages. The analysis further reveals that resilience-based prioritization outputs show slight spatial differences under different future scenarios (Figure 10). These variations are likely driven by a combination of intrinsic biophysical factors (e.g., LULC, climate, and biodiversity) and socioeconomic factors (e.g., urbanization intensity, human activity intensity, and agricultural practices) [64]. Moreover, certain critical resilience habitats and corridors play varying roles across scenarios, exhibiting either structural or functional importance.
Overall, we present a systematic framework for assessing EN resilience. By simulating node and link failures, we analyze changes in resilience across historical and future scenarios, and summarize prioritized connectivity characteristics of habitats and corridors, providing necessary spatial information for EN planning. This framework highlights the effectiveness of integrating structural and functional prioritization schemes to achieve dual conservation objectives. Moreover, it is designed to remain flexible and adaptable, allowing the incorporation of additional structural or functional disturbances, such as ES supply-demand balance, landscape morphology, socioeconomic costs, and other network topological attributes, to support broader spatial prioritization for multiple objectives and purposes.

4.3. Implications for Planning and Management

Incorporating scenario projections and resilience analysis into EN modeling elucidates the impacts of habitat change on landscape connectivity [25,39,76], thereby providing decision support for spatial planning and management. Results indicate that SSP1-2.6 represents the optimal scenario for enhancing EN resilience in CYUA and offers insights for planning decisions. Moreover, EN planning objectives vary depending on land and financial resources; thus, effective recommendations should be aligned with local ecological planning goals [64]. As stated in the “Special Territorial Spatial Plan for the Central Yunnan Urban Agglomeration (2021–2035)”, priority should be given to ecological protection and to pursuing a green, low-carbon development pathway [57]. Given CYUA’s moderate level of urbanization, orderly urban development exerts limited impacts on the distribution of large natural habitats. Therefore, based on the integration of spatial prioritization and policy guidance, we propose several strategies and recommendations for EN planning and refined management. These insights aim to optimize EN patterns and enhance ecosystem stability.
First, protection and restoration strategies should be developed according to spatial priorities. (1) Restoration of priority habitats. Priority habitats are critical areas for biodiversity and landscape functioning. Approximately 20% of priority nodes contribute over 75% of the total habitat area (Table 5). Most of them are located away from urban centers and are dominated by extensive natural forests, playing a central role in ES provision and structural connectivity. These resilient habitats must be prioritized for protection. Strengthening multifunctional forest management and water resource conservation can enhance ES functions such as carbon storage, water regulation, and habitat quality [81]. Establishing nature reserves and delineating ecological redlines are essential to prevent landscape degradation. Vegetation, soil, and lake restoration projects should be implemented to enhance the protection of ecologically fragile zones. Optimizing spatial configurations and enforcing zoning controls can improve matrix permeability and expand habitat areas [53,78]. Strengthening linkages with general habitats is also necessary to prevent connectivity loss and avoid cascading structural collapse of the network. (2) Restoration of priority corridors. As the main conduits for energy and material flows, priority corridors establish strong connections among priority habitats and greatly enhance the spatial cohesion of EN. Protection and management must be reinforced to safeguard network health and stability. Corridor buffer zones should be established to strengthen resistance against disturbances. Land use and spatial conflicts around corridors should be optimized to reduce human interference and avoid network disruption. Vegetation restoration should be promoted to reduce resistance, shorten corridor distances, enhance connectivity, and strengthen ecological flows for species dispersal. These actions can help mitigate the collapse of sparse EN under ongoing climate and LULC changes and enhance structural and functional resilience [39].
Second, establishing stepping-stone habitats extends beyond spatial prioritization. Several medium-sized and relatively small priority habitats identified in this study possess strategic ecological conservation value. Although these patches may lack strong ES functions, their strategic geographic positions enable them to act as key connectivity hubs among multiple habitats, thereby exerting notable topological advantages. They also represent weak points in the EN, and their loss could significantly compromise overall connectivity [82]. Therefore, it is necessary to designate these patches as stepping stones and provide them with targeted protection. Planning efforts should prioritize maintaining their high structural centrality to ensure their role as bridges for material circulation and energy flow, thereby enhancing network connectivity and stability [64]. Furthermore, the quality of these stepping-stone patches can be improved through long-term conservation, afforestation, and other natural or artificial restoration measures, which could expand their size and strengthen connections among important habitats. Where possible, these patches should be incorporated into protected natural areas, forest parks and ecological conservation redlines to reduce human disturbances and improve protection effectiveness and regulatory efficiency.
Third, cost-effective planning should be implemented to restore and reinforce the ecological foundation of the “Three Rivers and Six Lakes” system. Most habitats and corridors are distributed in the peripheral mountainous areas of the Jinsha, Honghe, and Nanpan River basins and are connected to the six central plateau lakes (Figure 5). Together, they form the ecological security foundation of the CYUA. However, this integrated mountain–lake ecosystem faces serious challenges, including lake pollution, soil erosion in the Jinsha River dry–hot valleys, and karst rocky desertification in the Nanpan River basin, all of which continue to threaten habitats and connectivity. Passive restoration (i.e., natural recovery/regeneration) is regarded as a cost-effective measure for landscape-scale forest restoration [83,84]. Spatial zoning management is also effective in addressing such multifaceted environmental problems. Therefore, a strategy that integrates both approaches is suitable for the entire EN. However, most ecosystems require years to decades to recover naturally from disturbances [83]. From a nature-based solutions perspective, timely optimization and adjustment of the ecological foundation are necessary to enable ecosystems to undergo natural recovery. Priority should be given to establishing a natural conservation system comprising the Ailao–Wuliang Mountains biodiversity conservation zone, the Jinsha River valley soil and water conservation zone, and the “Six Lakes” water-source conservation zone. This should be accompanied by sustained efforts in vegetation management and aquatic ecosystem restoration. Targeted interventions, such as vegetation restoration and soil erosion control, are required in key karst rocky desertification areas in the Nanpan River basin, which may necessitate dedicated financial investment. Collectively, only a stable ecosystem can safeguard the integrity and continuity of CYUA’s blue-green infrastructure, thereby promoting the sustainable development of EN.
As these measures span multiple dimensions, a diversified management approach is recommended. EN planning projects, including the establishment of protected area systems, ecosystem conservation and restoration programs, and the development of smart ecological monitoring networks, require coordinated implementation and management across institutions, sectors, and administrative levels. In addition to governmental agencies, broader stakeholder engagement, particularly from land users, indigenous peoples, and community groups, should be actively encouraged. Their participation in area-based conservation measures is crucial for achieving positive socioeconomic and ecological benefits [79,85]. Such diversified implementation and management facilitate the collective realization of EN’s long-term sustainable vision and goals.

4.4. Limitations

Although this study makes contributions, several limitations require further exploration. First, climate scenarios have inherent constraints. The global SSP–RCP scenarios assume that no overwhelming external shocks occur, and their applicability at the regional scale remains uncertain. Although the datasets were downscaled, they can only reflect the general trends of climate change [10,43]. The simplified coupling of climate and socio-economic factors may fail to capture the complex nonlinear feedbacks within ecosystems. Moreover, the omission of specific ecological protection policies may weaken the accuracy of projections. Future research should integrate local policy interventions into climate scenario modeling to provide more realistic guidance for conservation and management.
Second, the representation of ecological processes in the models remains simplified. The InVEST model, which relies on biophysical parameters, may oversimplify ES functions, and greater attention should be given to ES flows. The EN is constructed using potential connectivity methods such as LCP model and circuit theory, but it does not account for the habitat and migration behaviors of key species. The chained framework of “LULC simulation–ES assessment–EN construction” may also introduce cascading errors. Future studies should emphasize empirical validation by incorporating observed biodiversity distribution and dispersal data to enhance model applicability and develop more accurate and effective EN.
Finally, the resilience assessment framework still requires expansion. The current assessment simulates stability changes only under possible failure conditions and has not fully considered the effects of spatial heterogeneity, actual disturbance events, and their intensities. Future research should develop multi-scale and long-term analytical frameworks to more comprehensively reveal the feedbacks between resilience and ecosystem functions. In addition, resilience-based spatial prioritization considered only individual structural and functional attributes. To avoid potential bias, future studies should incorporate multiple conservation objectives to validate the outcomes of resilience assessments and spatial prioritization.

5. Conclusions

This study proposes a forward-looking dynamic assessment framework to examine the impacts of climate and LULC changes on ecosystem stability and connectivity. By integrating SSP-RCP scenario projections with node-link failure simulations, the framework effectively reveals the spatiotemporal dynamics of EN resilience and spatial priorities in CYUA. The results demonstrate that: (1) From 2000 to 2040, LULC underwent continuous transformation, with urban expansion primarily replacing grasslands. (2) Under SSP1-2.6, SSP2-4.5, and SSP5-8.5 scenarios, the overall EN pattern is projected to shift westward, with more cohesive spatial connections, increased habitat areas, and improved connectivity. (3) Mean overall resilience is expected to increase by 1.5%, decrease by 0.9%, and increase by 0.6%, respectively, indicating divergent trends in future stability. These findings highlight the superior potential of sustainable development pathways in enhancing EN performance. Resilience under link failures consistently exceeded that under node failures, while disruptions caused by structural strategies were more severe than those resulting from functional ones. (4) Approximately the top 20% of nodes and 40% of links were identified as critical components for maintaining EN resilience, although their number and spatial distribution varied across time periods. Future scenarios are expected to generate larger areas of priority habitats and more compact corridors, reflecting an overall improvement in resilience-based EN conservation patterns. Although the optimal scenario provides planning insights, the proposed differentiated conservation and management strategies are aligned with local ecological planning goals, thereby fostering the sustainable development of regional ecosystems.

Supplementary Materials

The following supporting information can be downloaded at: https://www.mdpi.com/article/10.3390/land14101988/s1.

Author Contributions

Conceptualization, B.Q. and G.C.; methodology, B.Q. and R.W.; software, B.Q. and R.W.; validation, J.Z.; formal analysis, B.Q. and R.W.; data curation, B.Q.; writing—original draft preparation, B.Q.; writing—review and editing, J.Z. and G.C.; visualization, B.Q. and Y.L.; supervision, J.Z., G.C. and Y.L.; project administration, J.Z.; funding acquisition, G.C. and Y.L. All authors have read and agreed to the published version of the manuscript.

Funding

This research was funded by the Natural Science Foundation of China (Y.L., 42301304), and the Philosophy and Social Sciences Planning of Yunnan Province, China (G.C., ZX2024YB59).

Data Availability Statement

Data will be made available on request.

Conflicts of Interest

The authors declare that they have no known competing financial interests or personal relationships that could have appeared to influence the work reported in this paper.

Abbreviations

The following abbreviations are used in this manuscript:
ENEcological networks
LULCLand use/land cover
CYUACentral Yunnan Urban Agglomeration
SSP-RCPShared Socioeconomic Pathways and Representative Concentration Pathways
ESEcosystem services
CMIP6Coupled Model Intercomparison Project Phase 6
GDPGross domestic product
DEMDigital elevation model
NDVINormalized difference vegetation index
NPPNet primary productivity
PLUSPatch-generating land use simulation
InVESTIntegrated Valuation of Ecosystem Services and Tradeoffs
SPCASpatial principal component analysis
LCPLeast-cost path
AUCArea under the curve
MGWRMultiscale geographically weighted regression

References

  1. Bevacqua, E.; Schleussner, C.; Zscheischler, J. A year above 1.5 °C signals that Earth is most probably within the 20-year period that will reach the Paris Agreement limit. Nat. Clim. Chang. 2025, 15, 262–265. [Google Scholar] [CrossRef]
  2. Williams, B.A.; Venter, O.; Allan, J.R.; Atkinson, S.C.; Rehbein, J.A.; Ward, M.; Di Marco, M.; Grantham, H.S.; Ervin, J.; Goetz, S.J.; et al. Change in Terrestrial Human Footprint Drives Continued Loss of Intact Ecosystems. One Earth 2020, 3, 371–382. [Google Scholar] [CrossRef]
  3. Molné, F.; Donati, G.F.A.; Bolliger, J.; Fischer, M.; Maurer, M.; Bach, P.M. Supporting the planning of urban blue-green infrastructure for biodiversity: A multi-scale prioritisation framework. J. Environ. Manag. 2023, 342, 118069. [Google Scholar] [CrossRef]
  4. Yang, X.; Cai, H.; Zhao, X.; Zhang, H. Revealing the ecological security pattern in China’s ecological civilization demonstration area. Land 2025, 14, 1560. [Google Scholar] [CrossRef]
  5. CBD. Decision adopted by the conference of the parties to the convention on biological diversity. 15/4. Kunming-Montreal global biodiversity framework. In Proceedings of the Conference of the Parties to the Convention on Biological Diversity Fifteenth Meeting—Part II, Montreal, QC, Canada, 7–19 December 2022; United Nations Environment Programme: Nairobi, Kenya, 2022. Available online: https://www.cbd.int/doc/decisions/cop-15/cop-15-dec-04-en.pdf (accessed on 5 May 2025).
  6. Shen, X.; Liu, M.; Hanson, J.O.; Wang, J.; Locke, H.; Watson, J.E.M.; Ellis, E.C.; Li, S.; Ma, K. Countries’ differentiated responsibilities to fulfill area-based conservation targets of the Kunming-Montreal global biodiversity framework. One Earth 2023, 6, 548–559. [Google Scholar] [CrossRef]
  7. Jalkanen, J.; Vierikko, K.; Moilanen, A. Spatial prioritization for urban biodiversity quality using biotope maps and expert opinion. Urban For. Urban Green. 2020, 49, 126586. [Google Scholar] [CrossRef]
  8. Chen, Y.; Xiong, K.; Luo, L.; Zhang, S.; Chen, J. Promoting ecological conservation through multi-objective ecological early warning and network regulation in the karst plateau, China. J. Environ. Manag. 2025, 385, 125635. [Google Scholar] [CrossRef]
  9. Dong, X.; Wang, F.; Fu, M. Research progress and prospects for constructing ecological security pattern based on ecological network. Ecol. Indic. 2024, 168, 112800. [Google Scholar] [CrossRef]
  10. Sun, H.; Yin, H.; Kong, F.; Shen, Z.; Su, J. Integrating the functions and structures to assess ecological network sustainability under climate change scenarios. Landsc. Ecol. 2024, 39, 20. [Google Scholar] [CrossRef]
  11. Opdam, P.; Steingröver, E.; Rooij, S.V. Ecological networks: A spatial concept for multi-actor planning of sustainable landscapes. Landsc. Urban Plan. 2006, 75, 322–332. [Google Scholar] [CrossRef]
  12. Ríos-Alvear, G.; Meneses, P.; Ortega-Andrade, H.M.; Santos, C.; Muzo, A.; López, K.G.; Bentley, A.G.; Villamarín, F. Key connectivity areas in the Llanganates-Sangay Ecological Corridor in Ecuador: A participative multicriteria analysis based on a landscape species. Landsc. Urban Plan. 2024, 246, 105039. [Google Scholar] [CrossRef]
  13. Beger, M.; Metaxas, A.; Balbar, A.C.; McGowan, J.A.; Daigle, R.; Kuempel, C.D.; Treml, E.A.; Possingham, H.P. Demystifying ecological connectivity for actionable spatial conservation planning. Trends Ecol. Evol. 2022, 37, 1079–1091. [Google Scholar] [CrossRef] [PubMed]
  14. Jalkanen, J.; Toivonen, T.; Moilanen, A. Identification of ecological networks for land-use planning with spatial conservation prioritization. Landsc. Ecol. 2020, 35, 353–371. [Google Scholar] [CrossRef]
  15. Hong, W.; Guo, R.; Li, X.; Liao, C. Measuring urban ecological network resilience: A disturbance scenario simulation method. Cities 2022, 131, 104057. [Google Scholar] [CrossRef]
  16. Huang, L.; Wang, J.; Lu, Y.; Ye, Y.; Zhai, T. Measuring the resilience of mountain city ecological network: A methodological framework integrating real disaster shocks and simulated disturbance scenarios. J. Environ. Manag. 2025, 384, 125573. [Google Scholar] [CrossRef] [PubMed]
  17. Dang, H.; Bai, J.; Lü, Y.; Li, J. The cascade failure model under ecological network is effective for quantifying the resilience of urban regions. Sust. Cities Soc. 2024, 114, 105749. [Google Scholar] [CrossRef]
  18. Li, J.; Nie, W.; Zhang, M.; Wang, L.; Dong, H.; Xu, B. Assessment and optimization of urban ecological network resilience based on disturbance scenario simulations: A case study of Nanjing city. J. Clean. Prod. 2024, 438, 140812. [Google Scholar] [CrossRef]
  19. Holling, C.S. Resilience and stability of ecological systems. Nnual Rev. Ecol. Syst. 1973, 4, 1–23. [Google Scholar] [CrossRef]
  20. Jeynes-Smith, C.; Bode, M.; Araujo, R.P. Identifying and explaining resilience in ecological networks. Ecol. Lett. 2024, 27, e14484. [Google Scholar] [CrossRef]
  21. Meyer, K. A mathematical review of resilience in ecology. Nat. Resour. Model. 2016, 29, 339–352. [Google Scholar] [CrossRef]
  22. Artime, O.; Grassia, M.; De Domenico, M.; Gleeson, J.P.; Makse, H.A.; Mangioni, G.; Perc, M.; Radicchi, F. Robustness and resilience of complex networks. Nat. Rev. Phys. 2024, 6, 114–131. [Google Scholar] [CrossRef]
  23. Messier, C.; Bauhus, J.; Doyon, F.; Maure, F.; Sousa-Silva, R.; Nolet, P.; Mina, M.; Aquilué, N.; Fortin, M.; Puettmann, K. The functional complex network approach to foster forest resilience to global changes. For. Ecosyst. 2019, 6, 21. [Google Scholar] [CrossRef]
  24. Aquilué, N.; Filotas, É.; Craven, D.; Fortin, M.; Brotons, L.; Messier, C. Evaluating forest resilience to global threats using functional response traits and network properties. Ecol. Appl. 2020, 30, e2095. [Google Scholar] [CrossRef]
  25. Mina, M.; Messier, C.; Duveneck, M.; Fortin, M.; Aquilué, N. Network analysis can guide resilience-based management in forest landscapes under global change. Ecol. Appl. 2021, 31, e2221. [Google Scholar] [CrossRef]
  26. Sánchez-Pinillos, M.; Dakos, V.; Kéfi, S. Ecological dynamic regimes: A key concept for assessing ecological resilience. Biol. Conserv. 2024, 289, 110409. [Google Scholar] [CrossRef]
  27. Wang, Y.; Cai, Y.; Xie, Y.; Zhang, P.; Chen, L. Resilience and dynamism: Innovative modeling of ecological group dynamics in urban landscapes. Environ. Impact Assess. Rev. 2024, 108, 107613. [Google Scholar] [CrossRef]
  28. Gonzalez, A.; Thompson, P.; Loreau, M. Spatial ecological networks: Planning for sustainability in the long-term. Curr. Opin. Environ. Sustain. 2017, 29, 187–197. [Google Scholar] [CrossRef] [PubMed]
  29. De Montis, A.; Ganciu, A.; Cabras, M.; Bardi, A.; Peddio, V.; Caschili, S.; Massa, P.; Cocco, C.; Mulas, M. Resilient ecological networks: A comparative approach. Land Use Policy 2019, 89, 104207. [Google Scholar] [CrossRef]
  30. Wang, H.; Zhou, L.; Su, K.; Zhou, Y.; Yang, Q. Resilience evolution and optimization strategies of ecological networks in the three gorges reservoir area: A scenario-based simulation approach. Ecol. Inform. 2025, 90, 103285. [Google Scholar] [CrossRef]
  31. Nawaz, T.; Ismail Ansari, M.G.; Avirmed, B.; Zhao, T.; Liu, W.; Lian, J.; Wang, Y.; Liu, Y.; Zhao, J.; Yang, X.; et al. Ecological network optimization and its correlation with net primary productivity in the Thal Desert: A 20-year analysis. Geo-Spat. Inf. Sci. 2025, 1–25. [Google Scholar] [CrossRef]
  32. Karimi, S.; Amiri, M.J.; Yavari, A.R. Identifying priority areas for conservation based on the evaluation of ecological network resilience in the Hyrcanian Forest ecosystem. Integr. Environ. Assess. Manag. 2025, 21, 570–582. [Google Scholar] [CrossRef] [PubMed]
  33. Lu, Z.; Li, W.; Zhou, S. Constructing a resilient ecological network by considering source stability in the largest Chinese urban agglomeration. J. Environ. Manag. 2023, 328, 116989. [Google Scholar] [CrossRef] [PubMed]
  34. Dang, H.; Lü, Y.; Guo, J.; Wu, X. Multi-scenario simulation can contribute to identify priorities for regional ecological corridors conservation. Ecol. Indic. 2024, 165, 112166. [Google Scholar] [CrossRef]
  35. Lu, Y.; Liu, Y.; Xing, L.; Liu, Y. Robustness test of multiple protection strategies for ecological networks from the perspective of complex networks: Evidence from Wuhan Metropolitan Area, China. Land Degrad. Dev. 2023, 34, 52–71. [Google Scholar] [CrossRef]
  36. Zhang, S.; Zhu, J.; Lv, L.; Wang, Z. Spatial scale increment identification and dynamic simulation of network resilience disturbances in landscape infrastructure: A comprehensive approach for optimizing regional planning. Sust. Cities Soc. 2025, 121, 106180. [Google Scholar] [CrossRef]
  37. Arani, B.M.S.; Carpenter, S.R.; Lahti, L.; van Nes, E.H.; Scheffer, M. Exit time as a measure of ecological resilience. Science 2021, 372, eaay4895. [Google Scholar] [CrossRef]
  38. Cooper, G.S.; Willcock, S.; Dearing, J.A. Regime shifts occur disproportionately faster in larger ecosystems. Nat. Commun. 2020, 11, 1175. [Google Scholar] [CrossRef]
  39. Albert, C.H.; Rayfield, B.; Dumitru, M.; Gonzalez, A. Applying network theory to prioritize multispecies habitat networks that are robust to climate and land-use change. Conserv. Biol. 2017, 31, 1383–1396. [Google Scholar] [CrossRef]
  40. Gao, J.; Gong, J.; Li, Y.; Yang, J.; Liang, X. Ecological network assessment in dynamic landscapes: Multi-scenario simulation and conservation priority analysis. Land Use Policy 2024, 139, 107059. [Google Scholar] [CrossRef]
  41. Chen, Q.; Ning, Y. Projecting LUCC dynamics and ecosystem services in an emerging urban agglomeration under SSP-RCP scenarios and their management implications. Sci. Total Environ. 2024, 949, 175100. [Google Scholar] [CrossRef] [PubMed]
  42. Gomes, L.C.; Bianchi, F.J.J.A.; Cardoso, I.M.; Schulte, R.P.O.; Arts, B.J.M.; Fernandes Filho, E.I. Land use and land cover scenarios: An interdisciplinary approach integrating local conditions and the global shared socioeconomic pathways. Land Use Policy 2020, 97, 104723. [Google Scholar] [CrossRef]
  43. O’Neill, B.C.; Carter, T.R.; Ebi, K.; Harrison, P.A.; Kemp-Benedict, E.; Kok, K.; Kriegler, E.; Preston, B.L.; Riahi, K.; Sillmann, J.; et al. Achievements and needs for the climate change scenario framework. Nat. Clim. Change 2020, 10, 1074–1084. [Google Scholar] [CrossRef]
  44. Tebaldi, C.; Debeire, K.; Eyring, V.; Fischer, E.; Fyfe, J.; Friedlingstein, P.; Knutti, R.; Lowe, J.; O’Neill, B.; Sanderson, B.; et al. Climate model projections from the Scenario Model Intercomparison Project (ScenarioMIP) of CMIP6. Earth Syst. Dynam. 2021, 12, 253–293. [Google Scholar] [CrossRef]
  45. Ai, X.; Zheng, X.; Zhang, Y.; Liu, Y.; Ou, X.; Xia, C.; Liu, L. Climate and land use changes impact the trajectories of ecosystem service bundles in an urban agglomeration: Intricate interaction trends and driver identification under SSP-RCP scenarios. Sci. Total Environ. 2024, 944, 173828. [Google Scholar] [CrossRef] [PubMed]
  46. Ma, D.; Peng, S.; Lin, Z. Towards a more comprehensive scenario analysis: Response of soil erosion to future land use and climate change in the central Yunnan urban agglomeration, China. J. Environ. Manag. 2025, 376, 124523. [Google Scholar] [CrossRef]
  47. Pepin, N.; Bradley, R.S.; Diaz, H.F.; Baraer, M.; Caceres, E.B.; Forsythe, N.; Fowler, H.; Greenwood, G.; Hashmi, M.Z.; Liu, X.D.; et al. Elevation-dependent warming in mountain regions of the world. Nat. Clim. Change 2015, 5, 424–430. [Google Scholar]
  48. Wang, R.; Zhao, J.; Lin, Y.; Qin, B.; Chen, G.; Bao, L.; Long, X. Study on the response and prediction of SDGs based on different climate change scenarios: The case of the urban agglomeration in central Yunnan. Ecol. Indic. 2023, 156, 111076. [Google Scholar] [CrossRef]
  49. O’ Neill, B.C.; Kriegler, E.; Ebi, K.L.; Kemp-Benedict, E.; Riahi, K.; Rothman, D.S.; van Ruijven, B.J.; van Vuuren, D.P.; Birkmann, J.; Kok, K.; et al. The roads ahead: Narratives for shared socioeconomic pathways describing world futures in the 21st century. Glob. Environ. Change 2017, 42, 169–180. [Google Scholar] [CrossRef]
  50. Huang, H.; Xue, J.; Feng, X.; Zhao, J.; Sun, H.; Hu, Y.; Ma, Y. Thriving arid oasis urban agglomerations: Optimizing ecosystem services pattern under future climate change scenarios using dynamic Bayesian network. J. Environ. Manag. 2024, 350, 119612. [Google Scholar] [CrossRef]
  51. Liang, X.; Guan, Q.; Clarke, K.C.; Liu, S.; Wang, B.; Yao, Y. Understanding the drivers of sustainable land expansion using a patch-generating land use simulation (PLUS) model: A case study in Wuhan, China. Comput. Environ. Urban Syst. 2021, 85, 101569. [Google Scholar] [CrossRef]
  52. Peng, J.; Yang, Y.; Liu, Y.; Hu, Y.; Du, Y.; Meersmans, J.; Qiu, S. Linking ecosystem services and circuit theory to identify ecological security patterns. Sci. Total Environ. 2018, 644, 781–790. [Google Scholar] [CrossRef] [PubMed]
  53. Synes, N.W.; Ponchon, A.; Palmer, S.C.F.; Osborne, P.E.; Bocedi, G.; Travis, J.M.J.; Watts, K. Prioritising conservation actions for biodiversity: Lessening the impact from habitat fragmentation and climate change. Biol. Conserv. 2020, 252, 108819. [Google Scholar] [CrossRef]
  54. Kong, W.; Shen, W.; Yu, C.; Niu, L.; Zhou, H.; Zhang, Z.; Guo, S. The neglected cost: Ecosystem services loss due to urban expansion in China from a triple-coupling perspective. Environ. Impact Assess. Rev. 2025, 112, 107827. [Google Scholar] [CrossRef]
  55. Li, Y.; Liu, W.; Feng, Q.; Zhu, M.; Yang, L.; Zhang, J.; Yin, X. The role of land use change in affecting ecosystem services and the ecological security pattern of the Hexi Regions, Northwest China. Sci. Total Environ. 2023, 855, 158940. [Google Scholar] [CrossRef]
  56. Men, D.; Pan, J. Incorporating network topology and ecosystem services into the optimization of ecological network: A case study of the Yellow River Basin. Sci. Total Environ. 2024, 912, 169004. [Google Scholar] [CrossRef] [PubMed]
  57. DNRYP. Special Territorial Spatial Plan for the Central Yunnan Urban Agglomeration (2021–2035) (Draft for Public Comment). Department of Natural Resources of Yunnan Province. 2023. Available online: https://dnr.yn.gov.cn/uploadfile/s58/2023/1108/20231108025955118.pdf (accessed on 18 May 2025).
  58. Jiang, J.; Zhang, H.; Huang, Q.; Liu, F.; Li, L.; Qiu, H.; Zhou, S. Diagnosis of Key Ecological Restoration Areas in Territorial Space under the Guidance of Resilience: A Case Study of the Chengdu–Chongqing Region. Land 2023, 12, 973. [Google Scholar] [CrossRef]
  59. Dickson, B.G.; Albano, C.M.; Anantharaman, R.; Beier, P.; Fargione, J.; Graves, T.A.; Gray, M.E.; Hall, K.R.; Lawler, J.J.; Leonard, P.B.; et al. Circuit-theory applications to connectivity science and conservation. Conserv. Biol. 2019, 33, 239–249. [Google Scholar] [CrossRef]
  60. McRae, B.H.; Dickson, B.G.; Keitt, T.H.; Shah, V.B. Using circuit theory to model connectivity in ecology, evolution, and conservation. Ecology 2008, 89, 2712–2724. [Google Scholar] [CrossRef]
  61. Lou, Y.; Wang, L.; Chen, G. Structural robustness of complex networks: A survey of a posteriori measures. IEEE Circuits Syst. Mag. 2023, 23, 12–35. [Google Scholar] [CrossRef]
  62. De Montis, A.; Caschili, S.; Mulas, M.; Modica, G.; Ganciu, A.; Bardi, A.; Ledda, A.; Dessena, L.; Laudari, L.; Fichera, C.R. Urban–rural ecological networks for landscape planning. Land Use Policy 2016, 50, 312–327. [Google Scholar] [CrossRef]
  63. Song, S.; Gong, Y.; Yu, Y. Integrating pattern, process, and function in urban landscape ecological network planning: A case study of Harbin central city. Ecol. Indic. 2024, 159, 111671. [Google Scholar] [CrossRef]
  64. Chen, H.; Yan, W.; Li, Z.; Wende, W.; Xiao, S. A framework for integrating ecosystem service provision and connectivity in ecological spatial networks: A case study of the Shanghai metropolitan area. Sust. Cities Soc. 2024, 100, 105018. [Google Scholar] [CrossRef]
  65. Donaldson, L.; Bennie, J.J.; Wilson, R.J.; Maclean, I.M.D. Designing effective protected area networks for multiple species. Biol. Conserv. 2021, 258, 109125. [Google Scholar] [CrossRef]
  66. Babaei, M.; Jalili, M.; Safari, M.; Mirzasoleiman, B. Cascaded failures in weighted networks. Phys. Rev. E 2011, 84, 46114. [Google Scholar] [CrossRef] [PubMed]
  67. Zhang, M.; Li, J.; Wang, L.; Xu, B.; Nie, W. The impact of connectivity in natural protected areas on the resilience of urban ecological networks: A research framework based on hierarchical disturbance scenario simulation. Ecol. Indic. 2024, 164, 112144. [Google Scholar] [CrossRef]
  68. Wang, X.; Shi, J.; Wang, C.; Jiao, X. Measuring the green infrastructure network resilience: Based on disturbance scenario simulations. Ecosyst. Health Sustain. 2025, 11, 337. [Google Scholar] [CrossRef]
  69. Schneider, C.M.; Moreira, A.A.; Andrade, J.S.; Havlin, S.; Herrmann, H.J. Mitigation of malicious attacks on networks. Proc. Natl. Acad. Sci. USA 2011, 108, 3838–3841. [Google Scholar] [CrossRef]
  70. Liu, W.; Zeng, A. Enhancing network robustness against malicious attacks. Phys. Rev. E 2012, 85, 66130. [Google Scholar] [CrossRef]
  71. Engsig, M.; Tejedor, A.; Moreno, Y.; Foufoula-Georgiou, E.; Kasmi, C. Domirank centrality reveals structural fragility of complex networks via node dominance. Nat. Commun. 2024, 15, 56. [Google Scholar] [CrossRef]
  72. Qi, X.; Mei, G. Network resilience: Definitions, approaches, and applications. J. King Saud Univ. Comput. Inf. Sci. 2024, 36, 101882. [Google Scholar] [CrossRef]
  73. Xiang, Q.; Yu, H.; Huang, H.; Li, F.; Ju, L.; Hu, W.; Yu, P.; Deng, Z.; Chen, Y. Assessing the resilience of complex ecological spatial networks using a cascading failure model. J. Clean. Prod. 2024, 434, 140014. [Google Scholar] [CrossRef]
  74. Lucet, V.; Gonzalez, A. Integrating land use and climate change models with stakeholder priorities to evaluate habitat connectivity change: A case study in southern Québec. Landsc. Ecol. 2022, 37, 2895–2913. [Google Scholar] [CrossRef]
  75. Pelorosso, R.; Noce, S.; De Notaris, C.; Gobattoni, F.; Apollonio, C.; Petroselli, A.; Recanatesi, F.; Ripa, M.N. The nexus between connectivity, climate, and land use: A scenario assessment of bio-energy landscape connectivity in central Italy. J. Environ. Manag. 2025, 376, 124521. [Google Scholar] [CrossRef]
  76. Sun, X.; Lian, A.; Wang, Z.; Cai, Y.; Dong, R. Structural, functional, and resilience dynamics of ecological networks in the Guangdong-Hong Kong-Macao Greater Bay Area: Impacts of climate and urbanization. J. Environ. Manag. 2025, 393, 126990. [Google Scholar] [CrossRef] [PubMed]
  77. Liu, Q.; Hang, T.; Wu, Y.; Song, Y.; Tang, X. Unveiling differences in biodiversity conservation efficiency across multi-level ecological networks under future climate change scenarios. Ecol. Indic. 2024, 169, 112933. [Google Scholar] [CrossRef]
  78. Isaac, N.J.B.; Brotherton, P.N.M.; Bullock, J.M.; Gregory, R.D.; Boehning-Gaese, K.; Connor, B.; Crick, H.Q.P.; Freckleton, R.P.; Gill, J.A.; Hails, R.S.; et al. Defining and delivering resilient ecological networks: Nature conservation in England. J. Appl. Ecol. 2018, 55, 2537–2543. [Google Scholar] [CrossRef]
  79. Diniz, M.F.; Dallmeier, F.; Gregory, T.; Martinez, V.; Saldivar-Bellassai, S.; Benitez-Stanley, M.A.; Sánchez-Cuervo, A.M. Balancing multi-species connectivity and socio-economic factors to connect protected areas in the Paraguayan Atlantic Forest. Landsc. Urban Plan. 2022, 222, 104400. [Google Scholar] [CrossRef]
  80. Saura, S.; Rubio, L. A common currency for the different ways in which patches and links can contribute to habitat availability and connectivity in the landscape. Ecography 2010, 33, 523–537. [Google Scholar] [CrossRef]
  81. Lin, Z.; Wu, T.; Xiao, Y.; Rao, E.; Shi, X.; Ouyang, Z. Protecting biodiversity to support ecosystem services: An analysis of trade-offs and synergies in southwestern China. J. Appl. Ecol. 2022, 59, 2440–2451. [Google Scholar] [CrossRef]
  82. Wimberly, M.C.; Narem, D.M.; Bauman, P.J.; Carlson, B.T.; Ahlering, M.A. Grassland connectivity in fragmented agricultural landscapes of the north-central United States. Biol. Conserv. 2018, 217, 121–130. [Google Scholar] [CrossRef]
  83. Holl, K.D.; Aide, T.M. When and where to actively restore ecosystems? For. Ecol. Manag. 2011, 261, 1558–1563. [Google Scholar] [CrossRef]
  84. Morán-Ordóñez, A.; Hermoso, V.; Martínez-Salinas, A. Multi-objective forest restoration planning in Costa Rica: Balancing landscape connectivity and ecosystem service provisioning with sustainable development. J. Environ. Manag. 2022, 310, 114717. [Google Scholar] [CrossRef] [PubMed]
  85. Maxwell, S.L.; Cazalis, V.; Dudley, N.; Hoffmann, M.; Rodrigues, A.S.L.; Stolton, S.; Visconti, P.; Woodley, S.; Kingston, N.; Lewis, E.; et al. Area-based conservation in the twenty-first century. Nature 2020, 586, 217–227. [Google Scholar] [CrossRef] [PubMed]
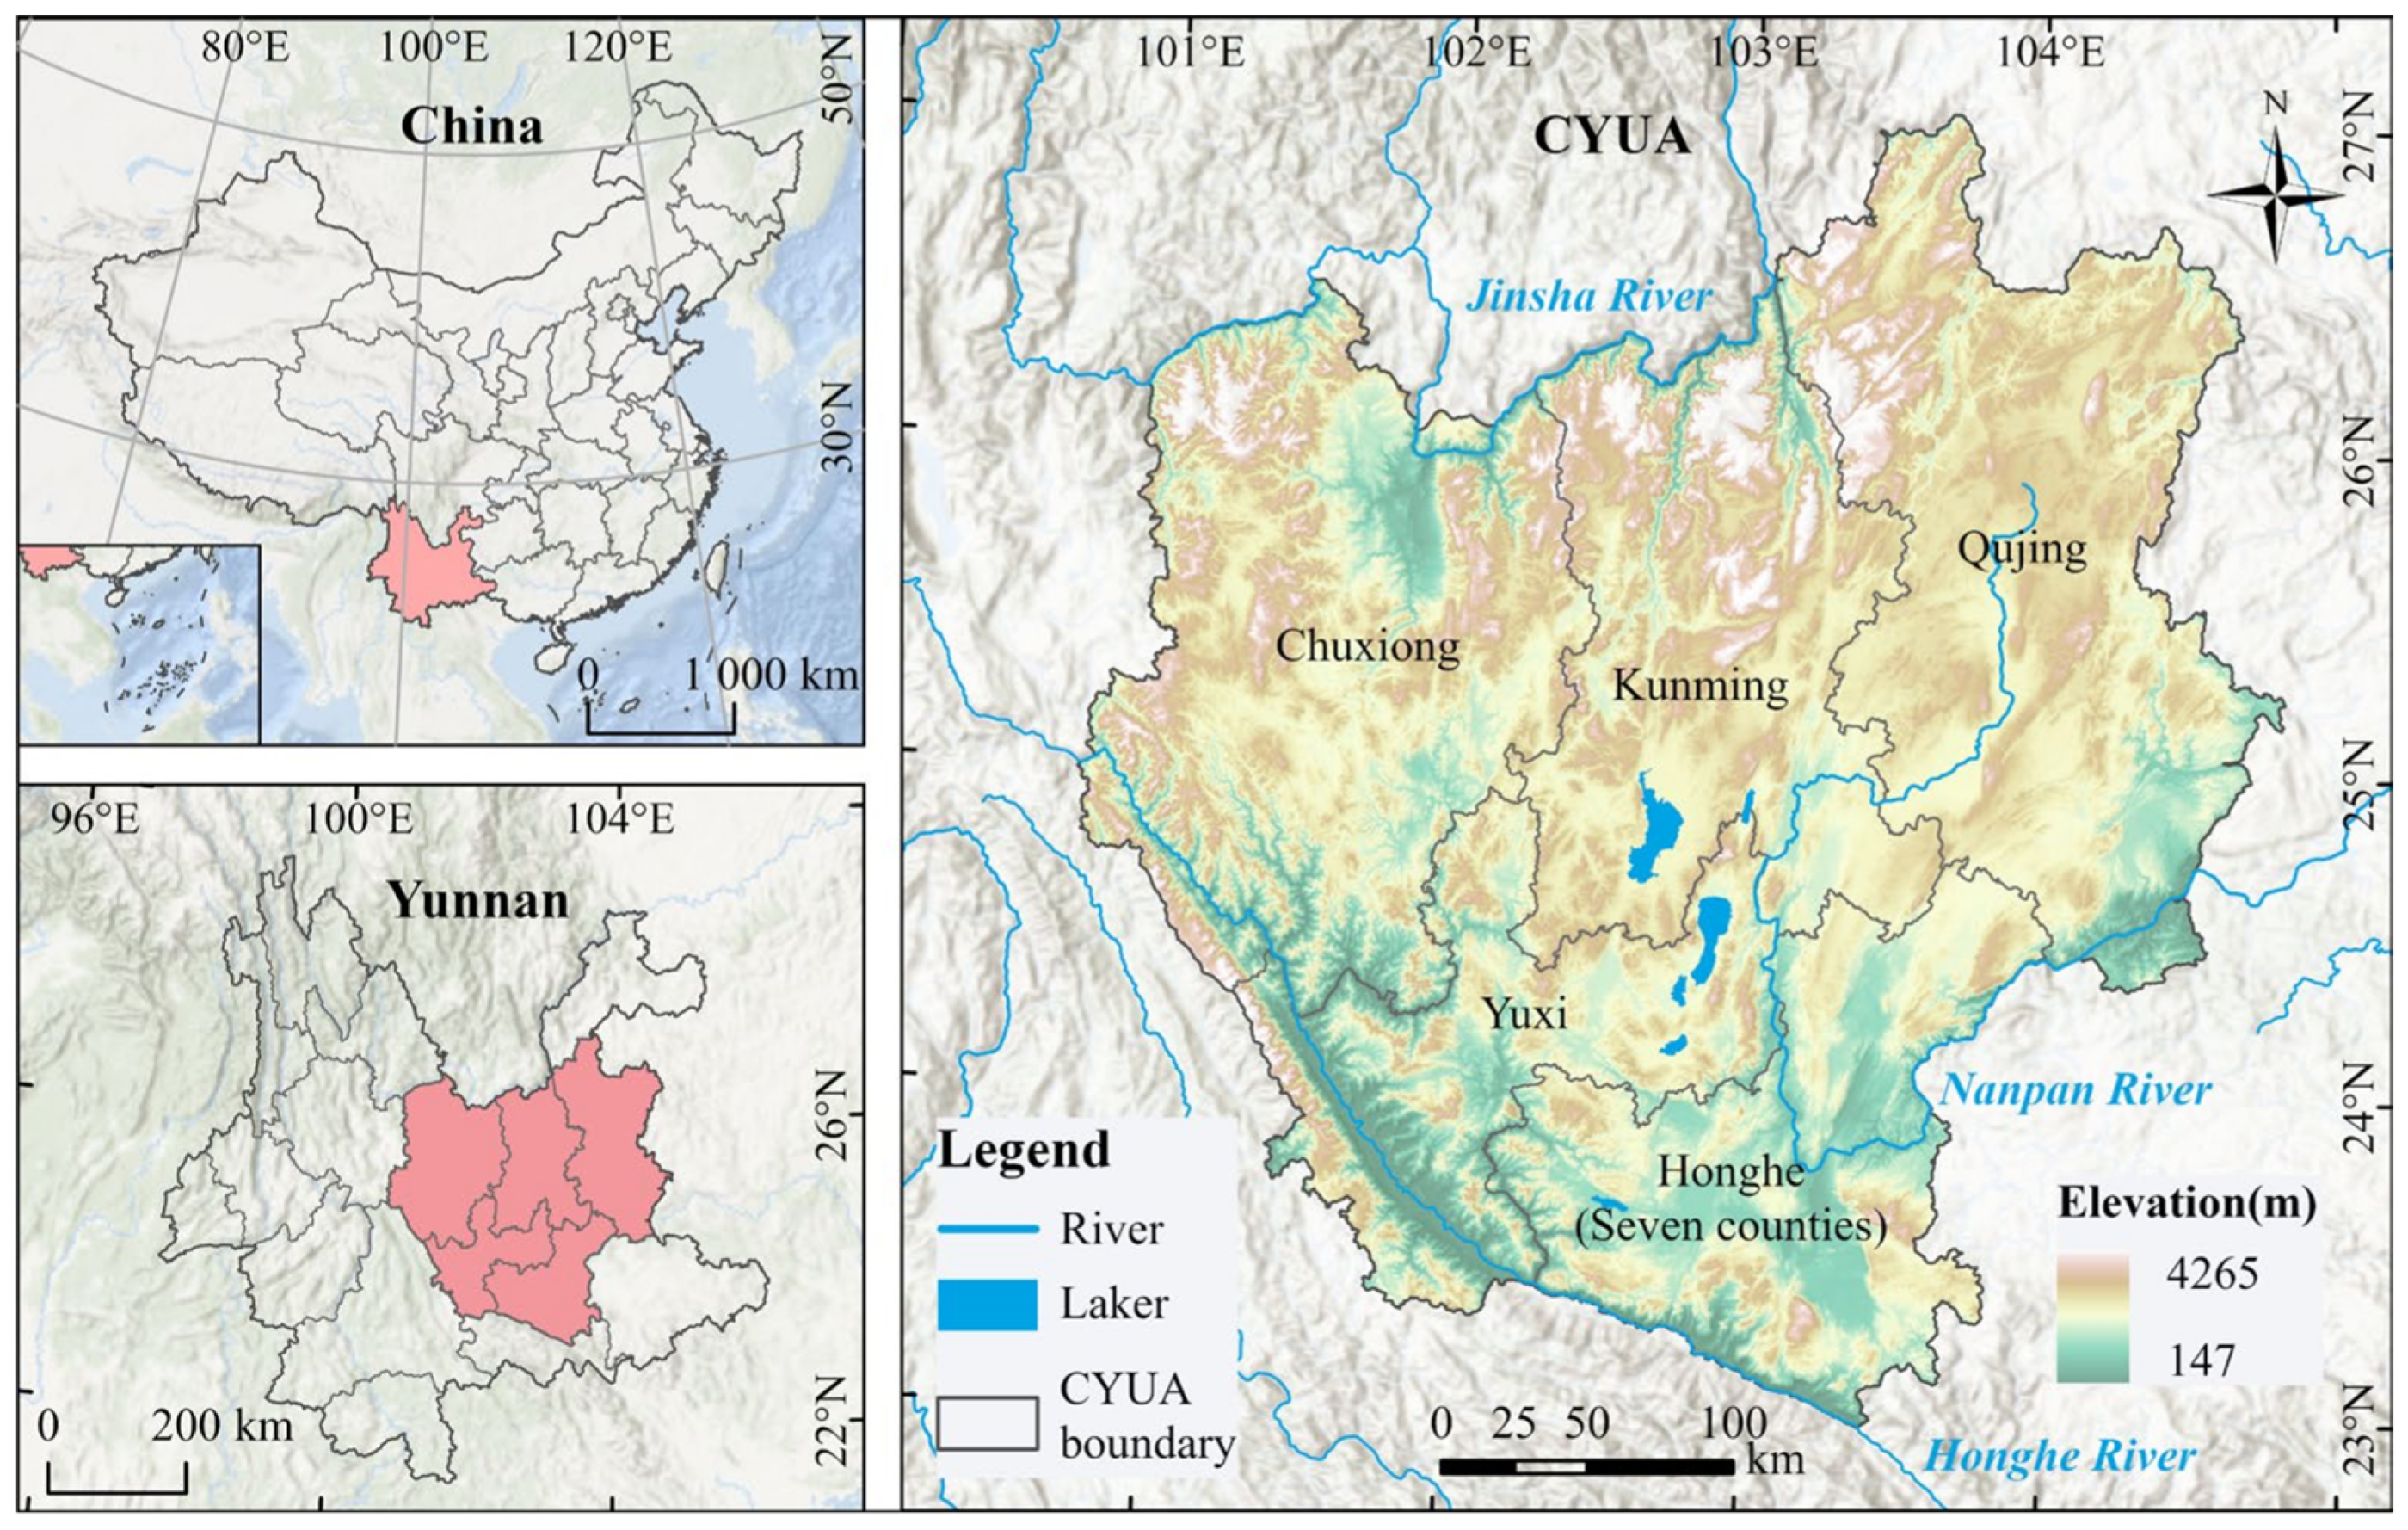
Figure 1. Location of the study area.
Land 14 01988 g001
Figure 2. Workflow and methodological framework.
Land 14 01988 g002
Figure 3. Spatial patterns and changes of LULC: (ae) Spatial distribution of LULC in 2000, 2020, and under three scenarios in 2040; (f,g) Land demand and changes in LULC types under different scenarios.
Land 14 01988 g003
Figure 4. Foundations for constructing EN: (a1a6) Spatial distribution and temporal trends of composite ES provision; (b1b6) Spatial distribution and temporal trends of resistance surfaces.
Land 14 01988 g004
Figure 5. Spatial patterns of EN.
Land 14 01988 g005
Figure 6. Changes in EN resilience under node failures.
Land 14 01988 g006
Figure 7. Changes in EN resilience under link failures.
Land 14 01988 g007
Figure 8. Evolution of EN resilience patterns under node failure.
Land 14 01988 g008
Figure 9. Evolution of EN resilience patterns under link failure.
Land 14 01988 g009
Figure 10. Spatial conservation patterns of resilient EN.
Land 14 01988 g010
Figure 11. Spatial distribution of significant MGWR coefficients under future scenarios (p < 0.05). Note: Dependent variables are composite ES and resistance surfaces; Explanatory variables include population, GDP, precipitation, and temperature. All variables were standardized to eliminate dimensional effects before modeling.
Land 14 01988 g011
Figure 12. Framework for spatial prioritization based on EN resilience assessment.
Land 14 01988 g012
Table 1. Datasets and sources.
CategoryNameYearResolutionSources and Descriptions
LULCLand use2000–202030 m × 30 mResource and Environmental Science Data Platform (https://www.resdc.cn/, accessed on 25 November 2024). The dataset was reclassified into six types: cropland, forest, grassland, water bodies, built-up land, and unused land.
ClimatePrecipitation (annual), temperature (mean annual), evapotranspiration (annual)2000–20201 km × 1 kmResource and Environmental Science Data Platform (https://www.resdc.cn/, accessed on 16 January 2025)
SocioeconomicPopulation; gross domestic product (GDP)2000–20201 km × 1 kmResource and Environmental Science Data Platform (https://www.resdc.cn/, accessed on 20 January 2025)
Railway and road network2020VectorNational Catalogue Service for Geographic Information (http://www.webmap.cn, accessed on 8 February 2025)
Physical geographyDigital elevation model (DEM)30 m × 30 mGeospatial Data Cloud (http://www.gscloud.cn/, accessed on 2 February 2025)
Soil types, components and erosion intensity1 km × 1 kmFood and Agriculture Organization of the United Nations (http://www.fao.org/soils-portal/soil-survey/, accessed on 3 March 2025); Resource and Environmental Science Data Platform (https://www.resdc.cn/, accessed on 21 February 2025)
Normalized difference vegetation index (NDVI); net primary productivity (NPP)2000–202030 m × 30 m;
1 km × 1 km
Landsat-8 OLI data were accessed and processed via Google Earth Engine; Moderate Resolution Imaging Spectroradiometer (https://modis.gsfc.nasa.gov/data/, accessed on 12 February 2025)
River network2020VectorNational Catalogue Service for Geographic Information (http://www.webmap.cn, accessed on 9 March 2025)
Territorial spatial planningEcological conservation redlines; protected natural areas2022VectorDepartment of Natural Resources of Yunnan Province, China
SSP-RCP scenarioPopulation; GDP2020–20400.1°Science Data Bank (https://doi.org/10.57760/sciencedb.01683, accessed on 3 December 2024). Gridded data under SSPs were interpolated.
Precipitation, temperature, evapotranspiration2020–20400.25°Earth System Grid Federation (http://esgf.nci.org.au/projectscmip6-nci/, accessed on 18 November 2024). Gridded data were downscaled using the MRI-ESM2-0 model [48].
Table 2. Resilience indicators and their descriptions for EN.
IndicatorsDescriptionsEquationsExplanation
Largest connected componentConnectivity strength after network removal [36] L = n max n Where   n max is the number of nodes in the largest connected component of the residual network, n is the total number of nodes in the network, G is the set of all nodes, d i j is the shortest path length between nodes i and j , l i is the number of actual links among the neighbors of node i , and k i is the degree of node i .
Global efficiencyInformation transmission efficiency between all node pairs in the network [67] E = 1 n n 1 i j G 1 d i j
Average clustering coefficientNetwork cohesion and clustering characteristics [68] C = 1 n i = 1 n 2 l i k i k i 1
Table 3. Statistical characteristics of EN elements.
ContentMetrics200020202040
SSP1-2.6SSP2-4.5SSP5-8.5
Habitat patchNumber177186172168167
Area (103 km2)29.8529.6030.5330.0030.35
Ecological corridorNumber449474417404411
Length (103 km)5.305.714.985.155.28
Area (103 km2)16.3017.7915.1415.3315.39
Mean cumulative current density (A)7.518.426.587.097.08
ENProportion of CYUA area (%)41.4542.5641.0240.7141.08
Table 4. Overall resilience of the EN under node and link failures (AUC indices).
Failure ConditionsAttack Strategies200020202040
SSP1-2.6SSP2-4.5SSP5-8.5
Node failureStrategy 10.5440.5400.5350.5140.543
Strategy 20.2020.2130.2840.2300.222
Strategy 30.2810.3400.3520.3460.359
Link failureStrategy 40.5750.5820.5610.5580.572
Strategy 50.4330.4340.4470.4130.452
Strategy 60.4880.4850.5030.4750.477
Mean0.4210.4320.4470.4230.438
Table 5. Classification of critical resilience elements.
Priority200020202040
SSP1-2.6SSP2-4.5SSP5-8.5
HabitatCore priorityNumber101291413
Percentage5.6%6.5%5.2%8.3%7.8%
Area (103 km2)16.5115.0313.9414.9015.23
Secondary priorityNumber1821321921
Percentage10.2%11.3%18.6%11.3%12.6%
Area (103 km2)5.326.7110.037.927.90
CorridorCore priorityNumber6189826378
Percentage13.6%18.8%19.7%15.6%19.0%
Length (103 km)0.481.120.620.480.57
Secondary priorityNumber118130948687
Percentage26.3%27.4%22.5%21.3%21.2%
Length (103 km)1.961.811.331.301.45
Disclaimer/Publisher’s Note: The statements, opinions and data contained in all publications are solely those of the individual author(s) and contributor(s) and not of MDPI and/or the editor(s). MDPI and/or the editor(s) disclaim responsibility for any injury to people or property resulting from any ideas, methods, instructions or products referred to in the content.