Abstract
Extreme heat events (EHEs), intensified by climate change, threaten urban sustainability and public health. Blue–green spaces (BGSs) offer synergistic cooling potential to mitigate urban heat, yet their combined effects at medium scales remain understudied. Using Landsat-8 remote sensing imagery from the summer of 2022 and land use data for the same year, we retrieved land surface temperature (LST) in Fuzhou City, China, and developed an evaluation index system to quantify the collaborative cooling characteristics of blue–green spaces (BGSs) across 89 research units. Regression analysis was then applied to examine the relationship between the spatial distribution of BGSs and their cooling effects. Key findings reveal the following: (1) the area of blue–green spaces is the most critical factor affecting the cooling intensity; (2) increasing the proportion of green space would yield a more pronounced cooling effect than expanding the blue space; (3) increasing blue space would grow the contribution of higher cooling amplitude and distance, but cooling efficiency would decrease accordingly; and (4) the seamless integration of blue–green spaces along the coastline can significantly amplify their synergistic cooling effect. This study has implications for addressing the synergistic cooling effects of blue and green spaces to improve the resistance of urban ecosystems to climate change-induced environmental stress and extreme heatwaves.
1. Introduction
The urbanization process is accelerating globally, and the global urbanization rate is expected to reach 68 percent by 2050 [1]. The forms of the urban landscape have changed due to continuous, fast urbanization [2], which results in a modification of urban land cover type. Land use and cover change (LULCC) alter surface characteristics. More impervious surfaces lead to decreased carbon sink capacity and increased heat capacity and thermal conductivity, causing urban heat island effects and other ecological consequences [3,4,5].
Global warming has increased the frequency of excessive heat events [6]. Urban heatwave s (UHW) intensify extreme heat events and increase health risks, particularly for vulnerable groups such as the elderly, children, and those with chronic conditions. Prolonged exposure can exacerbate existing illnesses and pose serious risks even to healthy individuals [7,8]. In addition, heatwave s also lead to air pollution [9], reduce biodiversity [10], increase energy consumption [11] and wildfires in forest grasslands [12], and have many other adverse effects. Therefore, finding ways to alleviate high summer urban temperatures, actively coping with global climate change, and improving urban resistance to unfavorable factors have emerged as a focal point for research across multiple disciplines. This is significant and has a role in improving living environments and promoting human health.
Many studies have demonstrated that urban blue–green spaces, including water bodies (such as rivers, lakes, waterways, and other water systems) and green spaces (natural or artificial ecosystems, such as forests, parks, vegetation cover, etc.), have critical ecological functions in mitigating UHW [13,14,15]. Green space can evaporate water into the air through vegetation transpiration, absorbing heat from the surrounding environment. Vegetation also consumes solar radiation and forms a shield to reduce the effects of direct sunlight, thereby reducing surface temperatures. The water body possesses a significant specific heat capacity which can absorb solar radiation, convert it into latent heat, and elevate the air’s humidity around it, lowering the surrounding temperature [16,17]. In recent years, owing to the swift flow and intensive population development in various countries, the high population-density phenomenon in urban centers has become more prominent [18]. Exploring methods for enhancing the cooling effect of blue and green spaces in constrained areas is crucial.
Numerous studies have examined the impact of blue–green spaces on the abatement of urban heat islands. For example, many studies have shown that the built-up index (NDBI) strongly influences LST. In contrast, blue–green spaces have the potential to lower surface temperatures and alleviate the UHI effect [19]. Some studies explored the possibility of blue–green spaces in improving the local thermal environment of residential areas in a humid and hot city through field measurements and numerical simulations. They found that blue–green spaces are more capable of stabilizing temperature fluctuations than other urban infrastructures [20]. In particular, the separate effects of blue space and green space on land surface temperature are inconsistent with the mechanism of action, and many studies compared the cooling characteristics of the two spaces [21,22]. Starting from the perspective of large-scale planning, some studies explored the influence of the overall blue–green spatial pattern on cooling intensity and estimated the proportion of land-use components that can maximize cooling efficiency [23]. However, although the previous studies on the heat relief of blue and green spaces in cities have been extensively discussed, the following issues have not been resolved well. (1) Only the role and extent of blue and green spaces in lowering surface temperatures have been discussed, while less is known about their internal spatial forms and cooling mechanisms. It is unclear which spatial form factors contribute substantially to the cooling effect of blue and green spaces. (2) Most studies concentrate on the individual cooling effects of green or blue spaces. However, quantitative research on synergistic cooling effects is limited. (3) In urban planning and design, most studies focus on the overall impact of large-scale blue and green spatial networks on surface temperatures from a macro perspective. At the same time, research on the specific optimal design of blue and green spaces at the meso and micro dimensions has been limited.
Therefore, this study regards blue–green infrastructure as a whole and conducts research and analysis on the relationship between the internal blue–green coupling morphology and surface temperature and cooling characteristics, including the following aspects: (1) surface temperature inversion, identification, and extraction of blue–green spatial units, and the establishment of a quantitative index system for evaluating the blue–green coupling features of the blue–green infrastructure; (2) calculation of spatial indicators and cooling indicators to explore the relation between the internal coupling morphology of blue–green infrastructure and the cooling rate; (3) based on the research results, propose specific design schemes and transformation strategies for urban blue–green spaces. This study aims to explore specific spatial layout modes of blue–green infrastructure that can significantly reduce urban temperature and alleviate heatwave effects to achieve efficient cooling in the high-density core areas of modern cities and provide scientific evidence for cities to address heatwaves resulting from climate change. We selected Fuzhou, China as the research area. This area’s hot–humid subtropical climate, basin terrain, and frequent extreme heat events create severe urban heat challenges, while its rich forest and water resources provide an ideal context for evaluating the cooling potential of blue–green infrastructure.
2. Study Area
Fuzhou, Fujian Province, is situated on the southeastern coast of China, with a latitude ranging from 25°15′ to 26°39′ and a longitude ranging from 118°02′ to 120°31′. It is adjacent to the Taiwan Strait. The city has a subtropical monsoon climate characterized by hot, humid summers and mild, rainy winters. Abundant precipitation and pronounced seasonal variability strongly influence vegetation water supply and river hydrology. However, high atmospheric humidity during the summer months limits evaporative cooling, thereby intensifying thermal stress in the urban environment. Additionally, Fuzhou’s geomorphology is more complex. The northwest region features elevated terrain, whereas the southeast is characterized by lower elevations encircled by mountains. Located in the center of the estuary basin, Fuzhou experiences restricted air circulation, which promotes the accumulation of heat and moisture. As a result, the mean annual temperature ranges between 20 and 25 °C, with summer daytime temperatures frequently surpassing 36 °C. Since 2013, it has become one of the four hottest cities in China, where extreme heat events (EHEs) occur with increasing frequency. At the same time, the city is endowed with abundant ecological resources. Forests cover 7792 km2, accounting for approximately 65% of the municipal area, while an extensive network of interconnected rivers with generally good water quality provides a favorable ecological foundation for blue–green infrastructure (B&GI).
Against this climatic and geographic backdrop, optimizing the spatial configuration of blue and green spaces is particularly critical. The combined pressures of high summer temperatures, frequent heatwaves, and poor ventilation underscore the need for effective nature-based solutions to mitigate urban heat stress. Assessing the collaborative cooling potential of B&GI in Fuzhou not only addresses urgent local challenges but also yields insights applicable to other cities with similar climatic and topographic conditions. By adopting a rational layout and optimizing B&GI, the urban thermal environment can be effectively enhanced, ecological quality improved, and a more livable environment created for urban residents. At the same time, it is also a crucial measure for mitigating climate change and promoting sustainable urban development.
According to Fuzhou’s land cover type data, this study selects the urban core area with high building density as the research area, and the specific districts and counties are listed in Table 1. Some districts and counties have low population and building densities and do not exhibit the scale characteristics of high-density central urban areas; therefore, they are not considered research areas (Figure 1).

Table 1.
Fuzhou high-density core area.
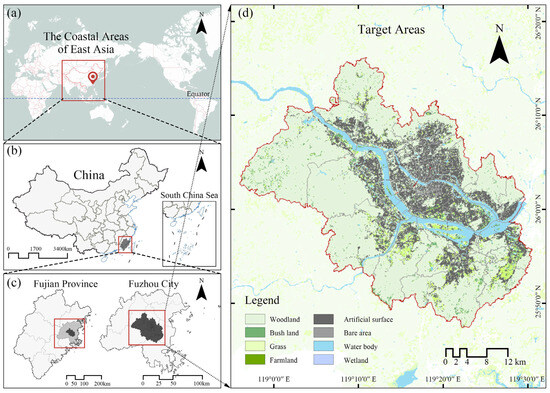
Figure 1.
Location of the study area in Fuzhou City. (a) Location of the research area on a global scale; (b) Location of the research area on a national scale; (c) Location of the research area on a provincial or municipal scale; (d) Specific scale range and land use distribution of the research area.
3. Methods
3.1. Methodological Framework
The methodological framework of this study is shown in Figure 2. (1) Extract the high-density core construction area of Fuzhou City, invert the land surface temperature through Landsat 8 OLI/TIRS data, and obtain the LST data of the study area. (2) Based on open source data and Landsat 8 images, land use was classified to obtain blue space, green space, and gray space in the study area. (3) The blue space is divided into plane and ribbon, and the 300 m blue and green space containing water is identified to obtain the research unit. (4) Through literature review, based on the perspective of blue–green collaborative cooling, the index system of blue–green spatial coupling relationship was constructed, and the unit index value and the unit average LST value were calculated. (5) SPSS was used to conduct correlation analysis on the blue–green spatial coupling relationship and LST, explore the micro-blue–green spatial coupling layout affecting LST, and propose recommendations for the development of urban blue–green spaces. The following is a detailed description of the research methods.
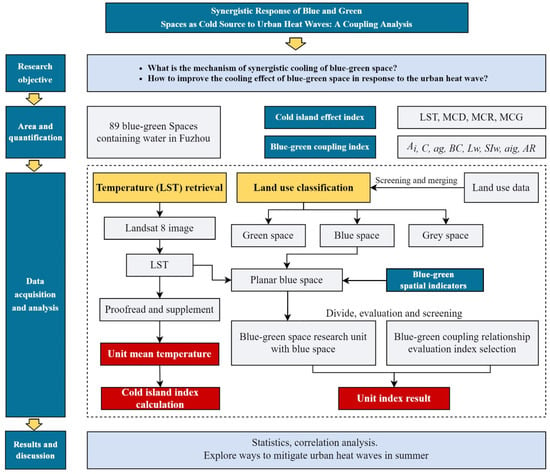
Figure 2.
Research framework of the study. We selected 89 blue–green space research units containing flake blue space, quantified the cooling characteristics of the units through surface temperature inversion and four cold island indicators, quantified the internal blue–green space characteristics through 8 blue–green space coupling indicators, and a regression analysis was conducted to examine the relationship between the layout of blue–green spaces and their cooling characteristics.
3.2. Surface Temperature (LST) and Normalized Vegetation Index (NDVI) Inversion
We obtained Landsat 8 imagery from the United States Geological Survey (https://glovis.usgs.gov/, accessed on 13 October 2023) and utilized the radiative transfer equation method and ENVI (5.3) software to retrieve land surface temperature data for our study area. The study area’s cloud coverage is less than 10%, meeting the image quality requirement. We used Landsat8 OLI/TIRS images from 26 August 2022, as the database. The orbit numbers are 119/42, with a central latitude of 25.9928° and a longitude of 118.919°. The spatial resolution is 30 m. Here is the algorithm [23,24,25] (Equation (1)):
where LST = Land surface temperature. K1, K2 = Calibration constant.
The parameters in the equation are determined according to the following computational formula:
- Vegetation index (NDVI) and vegetation coverage (Fv); (Equations (2) and (3)):
NDVI values vary from −1.0 to +1.0. Values below 0.1 are frequently associated with bare soil, water bodies, or snow, while places with sparse vegetation typically exhibit values between 0.2 and 0.5 [26].
where Fv = vegetation coverage. NDVImin = NDVI value of the area not covered by vegetation. NDVImax = NDVI value of the area entirely covered by vegetation.
Fv reflects the degree of vegetation aggregation. It varies from −1.0 to +1.0. A higher value indicates a greater degree of aggregation.
- 2.
- Specific surface emissivity (ε) [27] (Equation (4)):
The land surface is divided into three types—natural vegetation, artificial surfaces, and water bodies, to obtain a more accurate specific surface emissivity. The following formula calculates the specific surface emissivity of different land surfaces:
where εgreen = Surface specific emissivity of natural vegetation. εartificial = Surface-specific emissivity of artificial surface. εwater = Surface emissivity of water body.
- 3.
- Blackbody radiation brightness (B(Ts)) [28] (Equation (5)):
Using the radiative transfer equation, the land surface temperature (LST) of Fuzhou City was retrieved, revealing a range of 13.51–40.85 °C (Figure 3). The accuracy of the retrieved result was evaluated using observed temperature data collected from ground meteorological stations across 9 districts and counties of Fuzhou City at 13:00 on 26 August 2022. We obtained it through the China Environmental Meteorological Data Service Platform (http://eia-data.com/, accessed on 6 September 2025). Comparative analysis demonstrated a strong correlation between the two datasets, with a coefficient of determination (R2) of 0.932. This result indicates that the retrieved LST values satisfy the accuracy requirements of the present study. The spatial distribution of LST exhibited a decreasing gradient from the urban center toward the periphery, with higher temperatures concentrated in the central urban areas and lower temperatures observed in the surrounding regions.
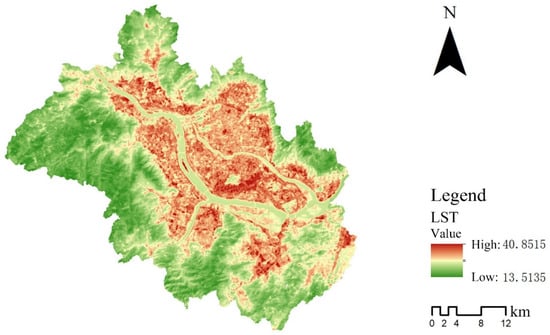
Figure 3.
Inversion map of land surface temperature (LST).
3.3. Screening of Blue–Green Space Containing Water Based on the Cold Island Effect
The land-use data was obtained in 2022 with an accuracy of 10 m, and the overall quality was good. It included 11 land use types, of which 9 categories were included in the study area: forest land, shrubbery land, grassland, cultivated land, artificial surface, bare land or sparse vegetation area, water body, wetland, mangrove, and others. According to the classification basis, on the ArcGIS 10.8 platform, forest land, shrub land, grassland, cultivated land, and mangrove were combined into green space. In contrast, wetlands and water bodies were combined into blue space. Since there is no significant difference in daily maximum surface temperature between the bare land/sparse vegetation area and artificial surface (such as buildings and roads) in the summer half year [29,30], the bare land/sparse vegetation area and artificial surface are combined into gray space. Subsequently, green and blue spaces that are spatially connected or within 30 m of each other are merged. Studies have shown that most blue–green spaces with an area that is too small do not have a cold island effect or a weak effect. To reduce calculation and eliminate interference, the blue–green spaces below 1 ha2 are excluded by referring to relevant studies [31]. In addition, in the study area, Gushan Mountain in the east, Qishan Mountain in the west, Wuhu Mountain in the south, and Lotus Peak in the north are connected to a large number of surrounding cultivated land areas, forming giant patches larger than 10,000 hm2, which are very different from other blue–green spaces in terms of scale, and do not have the typical and universal scale characteristics of blue–green space in high-density central urban areas, so these patches are deleted.
The blue–green space method, featuring the cold island effect, has been proposed [32]. Multi-stage buffers with a 30 m spacing and a total length of 300 m are established for the blue–green space, and the average surface temperature difference Δt between the impermeable underlying surfaces of adjacent buffers is calculated. After removing the patches whose Δt change rate in the buffer zone is not all less than 0 (Δtn − Δtn−1 < 0), 1393 blue–green spaces with cold island effect characteristics in the buffer zone, spanning a size range of 2.49–9968.66 hm2 within the study area, were finally obtained (Figure 4).
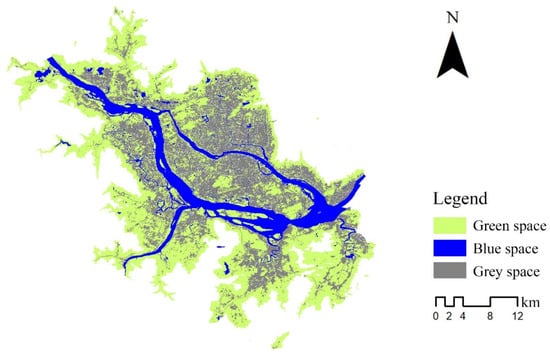
Figure 4.
Blue–green space with cold island effect characteristics.
Since this study explores the influence of blue–green spatial coupling degree on land surface temperature, the research unit must include water. Due to the significant difference in landscape pattern between patches and corridors, the blue space is divided into planar blue and ribbon blue. Studies have shown that the maximum radiation distance of the blue–green space cold island effect predominantly falls within the 200–300 m range. The effect is most pronounced within a range of 100 m [14], and the presence of a water body and an impervious cushion within a range of 300 m has a significant impact on the cold island effect [33]. Therefore, the blue–green space within the 300 m cooling range of the blue space is classified and extracted, resulting in 128 research units. Among them, excluding eight blue spaces in huge mountains, 89 research units containing water bodies were obtained (Figure 5).
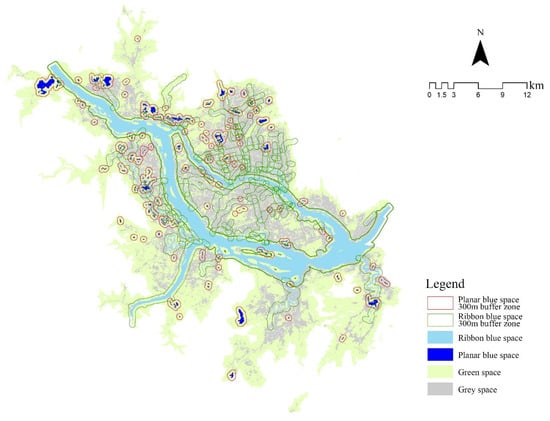
Figure 5.
Blue–green spatial distribution based on the significant cooling range of blue space.
3.4. Construction and Calculation of Blue–Green Coupling Evaluation Index System
Based on reviewing a large number of relevant studies on the mitigation of urban heat island effect by blue–green space, the blue–green space area (Ai), total water area (ag), green coverage rate (C), and blue coverage ratio (BC) are identified as four essential blue–green characteristics that may affect vitality. The green coverage ratio (C) represents the proportion of a site’s total area occupied by the vertical projection of vegetation, including tree canopy shadows, lawns, shrubs, and groundcover. The blue coverage ratio (BC) refers to the proportion of surface water features such as rivers, lakes, reservoirs, ponds, and wetlands relative to the total area. Due to the lack of relevant studies on the coupling relationship between blue–green space in site-scale cities, there is no unified quantitative standard. To quantitatively evaluate the impact of the relationship between blue space and green space on LST, the study comprehensively considered the blue–green coupling difference of various blue–green spaces in Fuzhou. From the aspects of the blue–green boundary relationship and blue–green spatial relationship, the study selected the blue–green boundary length (Lw), blue–green boundary shape index (SIw), water area surrounded by green space (aig), and blue–green area ratio (AR). Among them, the blue–green border length (Lw) represents the total length of waterfront shorelines where blue and green spaces meet. The blue–green boundary shape index (SIw) quantifies the geometric complexity of these interface zones. The area of water enclosed by green space (aig) denotes the combined surface area of lakes and river segments embedded within surrounding vegetation. The blue–green area ratio (AR) is defined as the proportion of water area to green area within a given spatial unit. There are eight indexes to quantitatively characterize the blue–green coupling relationship within each research object (Table 2).

Table 2.
Blue–green coupling relationship evaluation index.
3.5. Index System of Cold Island Strength
The blue–green space cold island effect refers to the phenomenon where the average internal temperature is lower than the surrounding ambient temperature. In this study, consistent with prior research [39,40], the characteristics of the cold island effect were analyzed, including maximum cooling distance (MCD), maximum cooling amplitude (MCR), and maximum cooling gradient (MCG). The cooling range (CD) is defined as the distance from the first turning point of the surface temperature curve to the edge of the blue–green space, measured in meters (Figure 6). To evaluate cooling distances both internally (CDin) and externally (CDout), cross-sectional profiles of land surface temperature (LST) were generated for each study region. The cooling intensity (CR) is quantified as the temperature difference between the first turning point of the surface temperature curve and the average temperature within the blue–green space, expressed in degrees Celsius (°C). Cooling efficiency (CG) is defined as the average cooling amplitude per unit distance, calculated as cooling intensity divided by cooling range, expressed in °C/m. A lower average LST, a greater CD, a higher CR, and a higher CG indicate more substantial cooling effects.
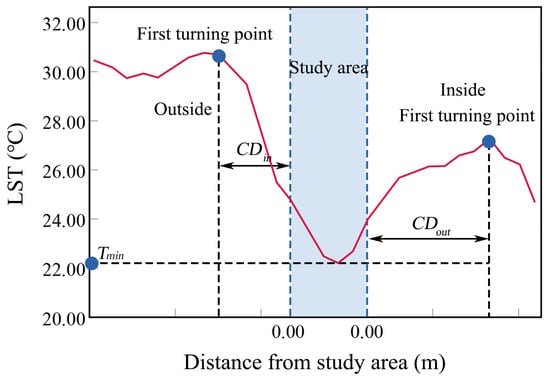
Figure 6.
Standard cold island effect temperature curve. The red line indicates the trend of surface temperature (LST) changes as the distance to the area with the cold island effect varies. As the distance from the cold island increases, LST initially rises and then falls. The distance from the temperature turning point to the cold island is the cooling distance (CD) of the cold island. Tmin: minimum temperature. CDin: the internal cooling distance. CDout: the external cooling distance.
Using SPSS 25 software, we performed regression analysis to examine the relationship between eight independent spatial indicators and the dependent variable, which was the average temperature within the research units. Additionally, we assessed and validated the sample distribution of both variables to ensure the robustness of the analysis.
4. Results
4.1. The Coupling Characteristics of Blue–Green Space in Fuzhou City
Surrounded by mountains, Fuzhou is the center of the estuary basin. In the core urban area, most of the scattered water space buffer and blue and green space areas are small, with an area of mostly less than 100 m2. The total area of scattered water bodies is small, mostly below 60 ha2, and the blue–green space containing water bodies in a large area is mainly located near the edge of the core area, indicating that the blue–green space containing water bodies in the high-density core area of Fuzhou is dispersed and small in area. The variance in green coverage is significant, indicating that the proportion of green space around scattered water bodies varies. The relatively low water coverage rate, mostly below 20%, suggests that scattered water is primarily distributed in green or gray spaces. However, no significant correlation exists between water and green coverage, indicating that the land surrounding scattered water bodies is rich in components (Figure A1).
The length of the blue–green boundary around scattered water bodies is shorter, mostly less than 5 km, and a large water area or a high blue–green boundary shape index primarily characterizes the elderly space. The blue–green boundary shape index is low, mostly below 4. The higher regions are mainly distributed in the Xiyuan River basin, the Xindian River system, and the Baima River system, which may be attributed to the degradation of the river network in Fuzhou City [29,39]. There is a significant correlation between the length of the blue–green boundary and its shape index, indicating that most of the blue–green space edges are regular [26]. The water area, surrounded by green space, is small, with most areas not exceeding 15 hectares in size, and the larger ones are distributed at the edge of the core area. However, the ratio of the total area of scattered water surrounded by green space to the total area of scattered water is high, which is 80.33%. It indicates that the dispersed water area in Fuzhou is relatively small, and most of it is surrounded by green spaces. The blue–green area is relatively low, with most values below 0.5, and the distribution is concentrated between 0 and 0.3, indicating that green space remains the primary component in the blue–green space, which contains scattered water (Figure A2). Details can be found in Appendix A.
4.2. Effect of Blue–Green Spatial Coupling Degree on LST
SPSS software was used to perform a regression analysis between LST and eight selected indicators, with the results presented in Table 3. The analysis revealed that six indicators exhibit a significant correlation with LST. Additionally, except for the blue–green area ratio (AR), all remaining indicators show a negative correlation with LST.

Table 3.
Correlation analysis between blue–green spatial coupling evaluation index and LST.
4.2.1. Statistical Correlation Between BASIC Features of Blue–Green Space and LST Value
The correlation analysis results for the essential characteristics of blue–green spaces and LST values showed that the blue–green space area (Ai), green coverage rate (C), total water area (ag), and water coverage rate (BC) were significantly negatively correlated with LST. It shows that with the increase of these four indexes, the average temperature in the research unit decreases, and the blue–green space will have a more significant cooling effect. The relationship between blue and green space area (Ai), total water area (ag), and LST is logarithmic, indicating that as the area of the two regions increases, the mean surface temperature (LST) in the study area gradually decreases and tends to stabilize. This indicates that the blue–green space has a threshold in increasing the area and enhancing the cooling effect. Specifically, when the total area of blue–green space (Ai) exceeds 114.65 hm2, each additional 100 hm2 contributes less than a 0.5 °C reduction in land surface temperature (LST). Once the area surpasses 748.05 hm2, the marginal cooling benefit declines further, with an increase of 100 hm2 corresponding to less than a 0.1 °C reduction. A similar pattern is observed for water areas (ag): when the water surface exceeds 19.69 hm2, every additional 100 hm2 lowers LST by less than 0.5 °C. The green coverage rate and water coverage rate (BC) showed a linear function relationship with LST, indicating that in a space containing scattered water, increasing the proportion of blue space and green space in the area would reduce LST. When the blue–green space proportion reached 1, LST would be the lowest. The total blue–green space of the research unit is approximately 101.02 hectares, with an average temperature of 26.79 °C (Figure 7).
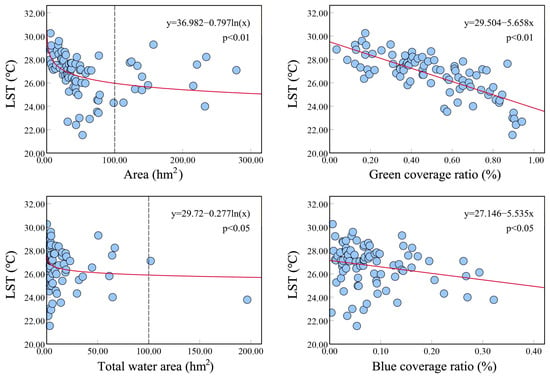
Figure 7.
Relationship between basic features of blue–green space and mean LST of urban blue–green space. The red curve represents the regression fitting relationship between land surface temperature (LST) and the fundamental indicators of blue and green space. The black dotted line represents the boundary of the distribution interval of sample points. p-value shows the correlation significance.
4.2.2. Statistical Correlation Between Blue–Green Spatial Coupling Relationship and LST Value
The correlation analysis of blue–green spatial coupling characteristics and LST value shows that the four indexes have a logarithmic function relationship with LST. Among these, the blue–green boundary length (Lw), blue–green boundary shape index (SIw), and the area of water surrounded by green space (aig) were negatively correlated with LST. In contrast, the blue–green boundary length (Lw) was positively correlated with the blue–green boundary shape index (SIw).
The more significant the water area surrounded by green space (aig), the more effective the synergistic cooling effect of blue and green spaces, and the better they can cope with urban heatwaves. The blue–green area ratio (AR) positively correlates with LST, indicating that increasing the area and proportion of green space around the blue space can more effectively reduce the surrounding surface temperature in a blue–green space containing scattered water. However, these indicators also have a threshold. For boundary length (Lw), when the blue–green interface exceeds 184.52 m, each additional kilometer contributes less than a 0.5 °C reduction, and once the boundary length surpasses 2220.75 m, the effect diminishes to less than 0.1 °C per kilometer. Likewise, when the area of water bodies embedded within green space (aig) exceeds 18.62 hm2, each additional 100 hm2 reduces LST by less than 0.5 °C, and beyond 223.1 hm2, the effect declines to below 0.1 °C per 100 hm2. In addition, the correlation between blue–green boundary length (Lw), blue–green boundary shape index (SIw), and LST is weak, which may be due to the small size of some study areas and their limited cooling ability to the surrounding environment, so that they are more susceptible to other factors such as the nature of surrounding land use, resulting in data fluctuations (Figure 8).
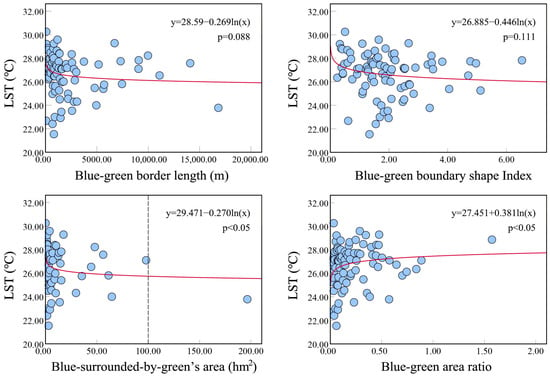
Figure 8.
Relationship between the blue–green space coupling degree and the mean LST of urban blue–green spaces. The red curve represents the regression fitting relationship between land surface temperature (LST) and blue–green spatial coupling relationship indicators. The black dotted line represents the boundary of the distribution interval of sample points. p-value shows the correlation significance.
4.3. Feature Calculation of Blue–Green Space Cold Island Effect
For the 89 research units, 20 buffer zones were delineated at 30-m intervals, extending over a total distance of 600 m. The average surface temperature for each buffer zone was then calculated. Using these data, the relationship between the average surface temperature of each buffer zone and its distance from the center of the research unit was analyzed, generating a surface temperature profile for each unit (Figure A3). Details can be found in Appendix A.
The results reveal that the surface temperature of blue–green spaces within the FuZhou urban area ranges from 30.91 °C to 33.76 °C, with an average of 31.78 °C. The synergistic cooling effect of these spaces on the surrounding environment is evident, with cooling distances spanning from 60 to 570 m, averaging 287.42 m. The cooling intensity ranges from 0.11 °C to 1.32 °C, with a mean value of 0.55 °C. The cooling gradient ranges from 0.00028 °C/m to 0.00307 °C/m, with an average of 0.0018 °C/m, highlighting the significant role of blue–green spaces in mitigating the urban heat island effect and enhancing the surrounding environment’s cooling capacity.
The average temperature of such research units is higher than the surrounding environment’s surface temperature. It radiates around as a high-temperature center, indicating that not all urban parks have the cold island effect, which is influenced by various factors [41]. The size of the research unit and the composition of the land have specific effects on the cooling distance and cooling range, but other factors also influence these effects. These research units are excluded because they do not have the cold island effect.
When studying the influence of cold island distance, cold island intensity, cold island efficiency, and blue–green space coupling index, because the temperature of the buffer zone around the research unit is greatly affected by land use type, overlap with other blue–green spaces may cause the superposition of cold island effect to interfere with the experimental results. Hence, the research unit and other ample blue–green spaces overlap with the surrounding area. The result is 36 research units. After calculating the cold island index of the unit, regression analysis is performed on the results and the corresponding blue–green spatial coupling index of the unit, one by one. The analysis results are presented in Table 4 and illustrated in Figure 9.

Table 4.
Feature calculation of blue–green space cold island effect.
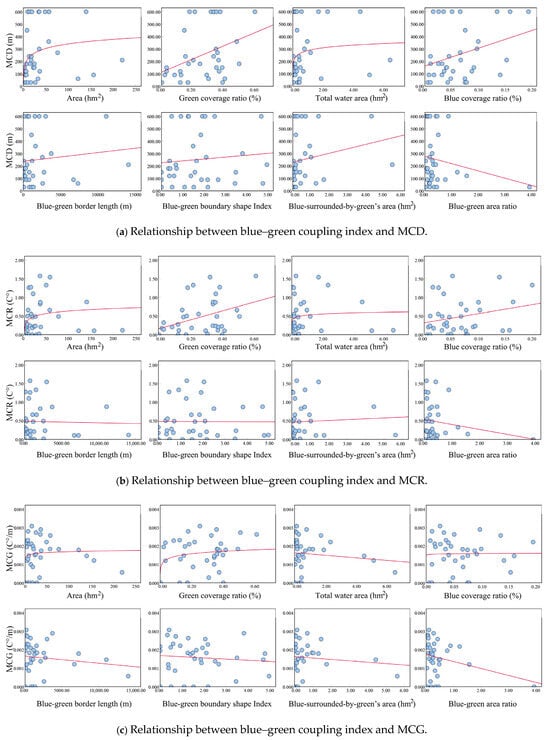
Figure 9.
Feature calculation of the blue–green space cold island effect (a–c). The red curve represents the regression fitting relationship between the cold island index (MCD, MCR, and MCG) and blue–green spatial indicators. MCD: maximum cooling distance. MCR: maximum cooling amplitude. MCG: maximum cooling gradient.
As shown in the chart, there is a significant correlation between the primary blue–green space index and the cold island effect index. Among them, cold island distance and cold island intensity are positively correlated with blue–green space area, green coverage ratio, blue space area, and blue coverage ratio, indicating that the larger the area scale, the higher the green coverage ratio, the larger the water area, the higher the blue coverage ratio, and the higher the cooling distance and cooling intensity of blue–green space, the more significant the cooling effect. Among them, the blue–green space area, green coverage ratio, and blue coverage ratio are significantly correlated with maximum cooling distance (MCD) and maximum cooling amplitude (MCR), indicating that the scale of blue–green space should be increased in urban construction planning, and the space greening and water body rate should be higher. While the blue–green space boundary length and shape index had a weak correlation with the cold island effect index, it still showed a positive correlation overall, consistent with the above results. The water area surrounded by green space positively correlates with the cold island effect index, indicating that the combination of blue and green space has a more substantial cooling effect than that of blue space alone. The blue–green ratio is negatively correlated with both MCD and MCR, indicating that when the total area of blue–green space is constant, appropriately increasing the proportion of green space is conducive to better exerting the cooling effect, and the plant characteristics of green space in blue–green space have a significant influence on the intensity of spatial cold island [42,43].
5. Discussion
5.1. Key Factors Affecting the Cooling Effect of Blue–Green Space
The study first analyzes the surface temperature of the blue–green space containing planar water in the high-density core area of Fuzhou City. Then, it examines the cooling characteristics of each research unit by constructing a multistage buffer zone. Results show that the blue–green spatial location of the city has the most significant correlation with land surface temperature and cold island index, showing a log-negative correlation. However, the correlation between shape index, blue–green boundary length surface temperature, and cold island index is weak. The blue and green space scale remains the primary factor influencing its cooling intensity [20,21,31]. However, increasing the area has a threshold in enhancing the cooling effect [44]. When the area of blue–green spaces is limited (less than 1 ha in this study), compact shapes such as circles or squares are more effective in reducing land surface temperature (LST). In contrast, for larger blue–green spaces (more than 1 ha), more complex shapes can enhance the cooling effect to some extent, though the magnitude of this enhancement is constrained [45]. For urban high-density core areas, the scale of blue–green infrastructure can be expanded in limited spaces by improving the connectivity of blue–green space and increasing urban vertical greening and roof greening.
Secondly, it is found that although the temperature of blue space is generally lower than that of green space, for blue–green space, the slope of the fitting curve (−5.66) of green coverage ratio (C) and land surface temperature is lower than that of the fitting curve (−5.54) of blue coverage ratio (BC) and land surface temperature. The blue–green area ratio (AR) has a significant positive logarithmic relationship with land surface temperature. It shows that in the same blue–green space, increasing the ratio of green space yields a more pronounced cooling effect than increasing the ratio of blue space. Vegetation plays a pivotal role in regulating the microclimate by lowering both surface temperatures and local air temperatures, affecting air temperatures over more expansive areas [15]. Blue spaces’ high specific heat capacity drives peak diurnal evaporative heat flux, which declines by evening, and persists at a lower intensity throughout the night. Consequently, blue spaces primarily provide cooling during daytime hours. However, at night—particularly in late summer—they may even exhibit a slight warming effect [46]. Additionally, the blue space examined in this research object primarily consists of static water. Unlike dynamic water bodies such as river galleries, water bodies in lakes and ponds have a slow velocity and cannot transport absorbed radiation outside the urban system through flat flow downstream [47]. Their cooling intensity is weaker than that of flowing water bodies. Water body area (ag) is negatively correlated with cooling amplitude and cooling distance and positively correlated with surface temperature and cooling efficiency. This suggests that blue–green infrastructure, which includes large water bodies, is more conducive to a cooling effect. Still, the cooling efficiency is lower than that of smaller water bodies, congruent with the research findings [48]. However, during rapid urbanization, the deployment of blue and green spaces tends to be fragmented and clustered, significantly reducing the cold island effect provided by these natural infrastructures [20]
Finally, the area of water enclosed by green space (aig) shows a negative correlation with surface temperature. At the same time, it is positively associated with both cooling amplitude and cooling distance, indicating that improving the green space and vegetation planting around the blue space along the waterfront and ensuring the integrity of the mutual nesting of the blue and green space will help improve the cooling effect of the blue and green infrastructure (Figure 10). The shading and transpiration of coastal vegetation can regulate the thermal characteristics of the water edge, not only improving the radiation balance of the water body, but also causing different heating and cooling, and promote the mixed convection inside and outside the water body [48]. Additionally, the close combination of blue–green spaces can also promote the formation of small habitats and create local microclimates to regulate temperature.
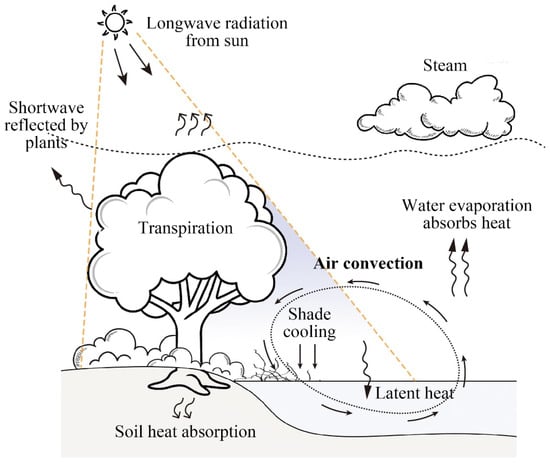
Figure 10.
Coordinated cooling of blue space and green space along the waterfront. Vegetation radiates heat from the sun upward through transpiration and reflection, which reduces the temperature of the water body at the junction of blue and green, promotes the mixed convection inside and outside the water body, and strengthens the synergistic cooling effect of blue and green space.
However, the climatic and topographic setting of Fuzhou may limit the broader applicability of our quantitative results. Located in a subtropical monsoon zone, Fuzhou experiences hot, humid summers and high annual precipitation. Under such high-humidity conditions, the limited moisture absorption capacity of the air restricts evaporative cooling potential [49]. By contrast, in arid and semi-arid cities where the air has greater vapor demand, surface water can drive substantially stronger evaporative cooling, often yielding greater cooling benefits than green space alone [50]. The monsoonal precipitation regime also imposes marked seasonality on vegetation water availability and river levels. In Mediterranean climates or drought-prone cities, water stress can reduce plant transpiration, considerably diminishing the cooling effect of green spaces [51]. Moreover, Fuzhou’s basin terrain inhibits ventilation and promotes the accumulation of heat and humidity [52], which shortens the cooling range of blue–green infrastructure compared to open or well-ventilated cities—despite potentially higher local cooling efficacy [53]. Topographic barriers and weak winds hinder the dispersal of cool air generated by blue–green spaces. Conversely, coastal flat cities—such as Rotterdam and the Netherlands—benefit from sea breezes that transport cool air from large parks further inland, forming extended and effective cooling corridors [54].
Accordingly, the paper’s reported quantitative relationships between blue–green area, layout, and cooling metrics should be applied with caution in arid climates or in flat, well-ventilated settings. Nonetheless, the qualitative recommendations—expanding the extent and proportion of blue–green space and enhancing their structural complexity and connectivity—remain broadly relevant. Future studies should validate these relationships across diverse climatic and geomorphological contexts to derive more universally transferable planning guidance.
5.2. Countermeasures and Suggestions to Enhance the Cooling Effect of Urban Blue–Green Space
Studies have shown that for blue–green spaces containing scattered water bodies, increasing the area of blue–green space and the area of water in blue–green space, expanding the green coverage ratio and water coverage rate, increasing the length and tortuosity of space boundaries, increasing the area of water surrounded by green space, and reducing the ratio of the blue–green area can effectively reduce the surface temperature around water bodies (Figure 11). As a typical nature-based urban climate change adaptation solution, blue–green infrastructure has become a multi-scale ecological framework necessary for the sustainable development of urban environment, society and economy. To enhance the cooling impact of urban blue–green spaces and address the challenges posed by urban heatwaves, the following strategies can be implemented:
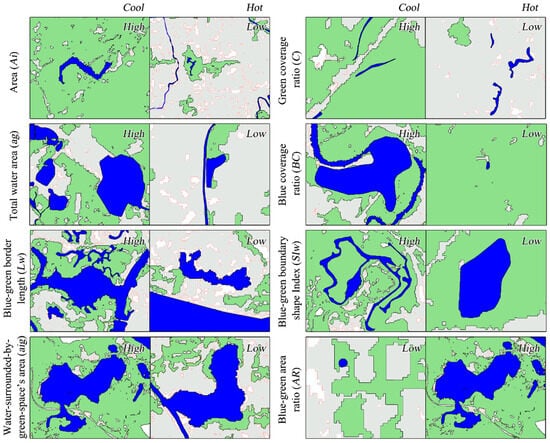
Figure 11.
Blue and green space layout to enhance cooling effect. Select the typical research unit corresponding to the high value and the low value, respectively, for 8 indicators, and display its blue–green spatial layout. The left side of the graph is cooler, and the right side is hotter.
- Expanding the quantity and scale of blue–green infrastructure remains a critical component of urban planning and environmental enhancement. The findings indicate that large water bodies and extensive vegetation significantly mitigate the urban heat island effect. For blue–green spaces with robust landscape characteristics, such as Qishan Lake Park and Jinshui Lake Scenic Spot, which feature expansive green areas and high NDVI values, prioritizing the preservation of existing vegetation is essential. However, there is a threshold for the cooling effect brought about by the scale. It is recommended that the area of each blue–green space should not exceed 120 hm2. When the area is less than 1 hm2, a regular and compact layout form should be preferred. When the area is greater than 1 hm2, the complexity of the shape should be given priority consideration. In high-density urban core areas, alternative strategies such as rooftop cooling and vertical greening offer practical solutions. Roof greening, for instance, increases green infrastructure area and enhances the city’s overall cooling capacity [55]. Planting grasses, flowers, and other vegetation on building rooftops not only purifies the air and reduces ambient temperatures but also enriches urban biodiversity and creates a more livable environment for residents. Additionally, integrating photovoltaic systems with green roofs through innovative design [56] can further lower building temperatures while simultaneously promoting energy efficiency and carbon reduction.
- In high-density urban areas characterized by numerous dispersed water bodies and limited surrounding land use, it is crucial to integrate aquatic ecosystems and regulate the intensity of urban development along river corridors. Enhancing landscape connectivity and reducing fragmentation between patches [57] can significantly amplify the cooling effect. To balance visual landscape design with ecological protection, urban park water bodies should be optimized by moderately reducing their size and adopting a layout of evenly distributed multiple water features. The area of a single water body is recommended to be no more than 20 hm2. This approach avoids the concentrated distribution of large water bodies, thereby improving their ecological functionality. For vegetation design, ensuring adequate patch sizes is critical to minimizing fragmentation and avoiding scattered vegetation clusters. Within a 300 m radius of the water body, the higher the green coverage ratio, the better. Additionally, increasing green spaces between water bodies and impervious surfaces can prevent the accumulation of impermeable patches, thus extending the cooling effects to a broader area. These strategies collectively enhance the ecological resilience of urban water and vegetation systems, contributing to improved urban thermal environments and environmental quality.
- Increasing the complexity of lake water boundaries and green patch shapes, as well as extending the length of green spaces and shorelines around lakes, can further amplify the cooling effects of blue–green spaces [15,58]. In the actual planning, the combined length of individual blue–green shorelines should be kept as long as possible, preferably no less than 200 m. In the design of vegetation patches, adopting complex and meandering forms is recommended to maximize the contact area between vegetation and water bodies. This design facilitates heat absorption by vegetation and provides shaded cover over water surfaces, creating localized microclimates that enhance the synergistic cooling effects of blue–green spaces. When the water body area is less than 20 hm2, efforts should be made to ensure that the entire periphery of the water body is surrounded by green spaces. By leveraging the combined cooling benefits of vegetation and water, ambient air temperatures can be significantly reduced, contributing to an improved regional thermal environment [59,60]. These strategies not only mitigate the urban heat island effect but also enhance the ecological and aesthetic value of urban landscapes, fostering more sustainable and livable urban environments.
- Urban construction should prioritize increasing the proportion of arborescent plant communities while maintaining an appropriate balance with grassland coverage. This approach not only enhances the capacity for regulating temperature and humidity but also improves biodiversity in coastal zones, thereby increasing ecosystem stability and resilience to adverse environmental factors. A greater emphasis on tree-dominated vegetation helps achieve a more stable and sustained cooling effect per unit area, contributing to the long-term improvement of the urban thermal environment. Such strategies provide critical support for the sustainable development of urban ecological systems, fostering resilience against climate change and promoting the development of livable cities.
6. Conclusions
Using Landsat 8 OLI/TIRS images, this study assessed the synergistic cooling effects of blue–green spaces (BGSs) in Fuzhou, China, and clarified how BGS characteristics influence land surface temperature and cooling intensity. Results indicate that while the scale of BGSs is still the primary determinant of cooling, the effect exhibits a threshold beyond which further expansion yields diminishing benefits. This indicates that optimizing the spatial configuration and composition of BGSs is as critical as increasing their area. In particular, a higher proportion of green space within BGS complexes exerts stronger cooling effects than a comparable increase in water area, underscoring the greater role of vegetation transpiration over surface water evaporation under humid subtropical conditions.
Furthermore, increasing landscape complexity, such as irregular patch shapes and longer shoreline interfaces, enhances the cooling efficiency of BGSs. The spatial integration of vegetation and water bodies is also essential. Seamless coupling, especially along coastlines and waterfronts, amplifies their synergistic cooling by facilitating ecological and hydrological interactions. Vegetation shading and transpiration improve the radiative balance and convective cooling of adjacent water surfaces, thereby extending the spatial reach of cooling. In addition, while expanding water areas contributes to greater cooling magnitude and distance, efficiency tends to decline as area increases, suggesting the need for balanced design strategies.
Rapid urbanization necessitates efficient BGS deployment, and these findings provide a framework for deploying BGSs more efficiently within dense urban cores to strengthen resilience against environmental stress and extreme heat events. Nevertheless, the quantitative thresholds identified here should be applied cautiously in cities with different climatic or geomorphological conditions. Future research should employ predictive modeling to evaluate BGS configurations under projected climate change, ensuring that blue–green infrastructure remains effective and adaptive to future extremes.
Author Contributions
Conceptualization, Y.Z. and J.Q.; methodology, J.Q. and Y.Z.; software, J.Q.; validation, J.Q., Y.Z. and J.W.; formal analysis, J.Q.; investigation, J.Q.; resources, Y.Z.; data curation, J.Q.; writing—original draft preparation, J.Q.; writing—review and editing, Y.Z. and J.Q.; visualization, J.Q.; supervision, Y.Z. and J.W.; project administration, Y.Z.; funding acquisition, Y.Z. and J.W. All authors have read and agreed to the published version of the manuscript.
Funding
This research received no external funding.
Data Availability Statement
The data and codes that support the findings of this study are available on request from the corresponding author.
Acknowledgments
The authors have nothing to report. The authors have reviewed and edited the output and take full responsibility for the content of this publication.
Conflicts of Interest
The authors declare no conflicts of interest.
Abbreviations
The following abbreviations are used in this manuscript:
| EHEs | Extreme Heat Events |
| LST | Land Surface Temperature |
| LULCC | Land Use and Cover Change |
| UHW | Urban Heatwaves |
| B&GI | Blue–green Infrastructure |
| NDVI | Normalized Vegetation Index |
| Ai | Area |
| C | Green Coverage Ratio |
| ag | Total Water Area |
| BC | Blue Coverage Ratio |
| Lw | Blue–green Border Length |
| SIw | Blue–green Boundary Shape Index |
| aig | The Area of Water Surrounded by Green Space |
| AR | Blue–green Area Ratio |
| CD | Cooling Range |
| CDin | The Internal Cooling Distance |
| CDout | The External Cooling Distance |
| Tmin | Minimum Temperature |
| MCD | Maximum Cooling Distance |
| MCR | Maximum Cooling Amplitude |
| MCG | Maximum Cooling Gradient |
Appendix A
Appendix A.1
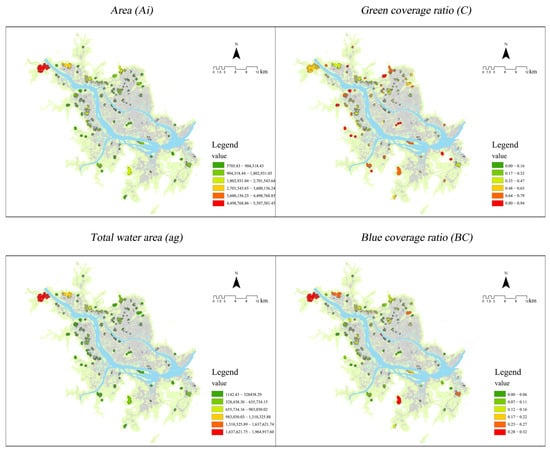
Figure A1.
Basic features of blue–green space with planar blue space in Fuzhou City.
Appendix A.2
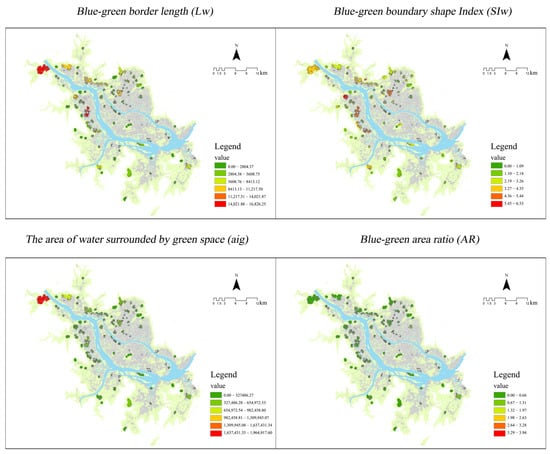
Figure A2.
Coupling features of blue–green space with planar blue space in Fuzhou City.
Appendix A.3
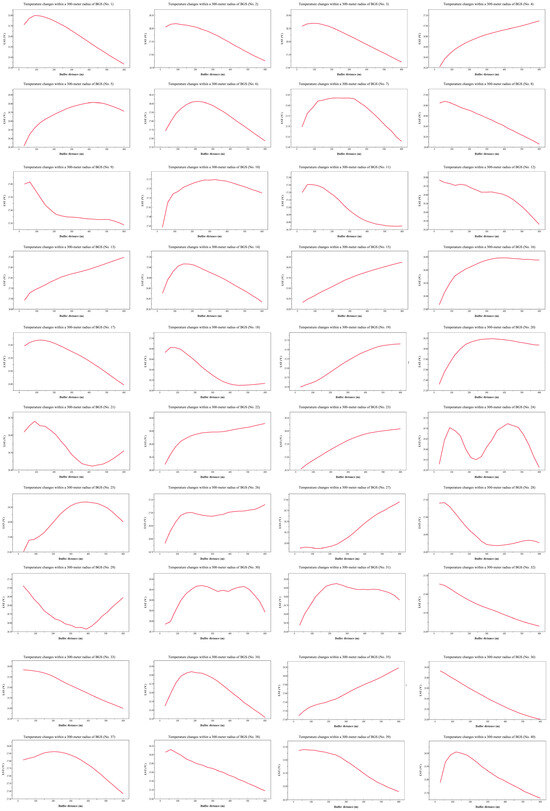
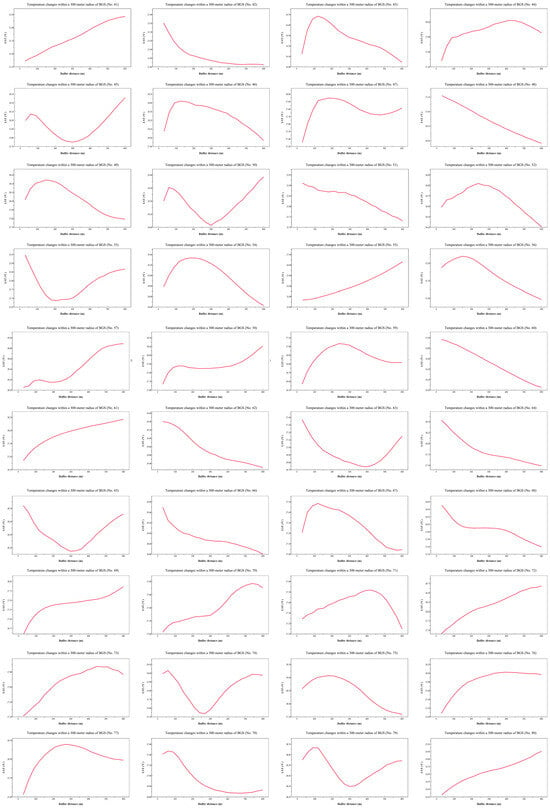
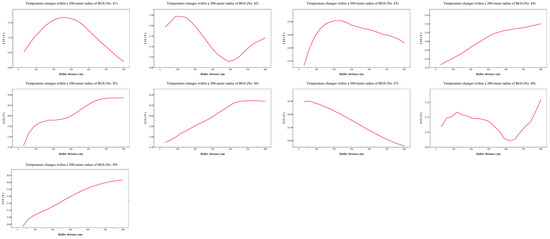
Figure A3.
The continuous buffer average temperature curve of the 89 units. We can judge whether the research unit has cold island effect from the curve, and calculate its cold island effect index.
References
- UN-Habitat. World Cities Report 2022: Envisaging the Future of Cities. 2022. Available online: https://unhabitat.org/sites/default/files/2022/06/wcr_2022.pdf (accessed on 7 November 2023).
- Chen, L.; Wang, X.; Cai, X.; Yang, C.; Lu, X. Combined Effects of Artificial Surface and Urban Blue-green Space on Land Surface Temperature in 28 Major Cities in China. Remote Sens. 2022, 14, 448. [Google Scholar] [CrossRef]
- Roy, P.S.; Ramachandran, R.M.; Paul, O.; Thakur, P.K.; Ravan, S.; Behera, M.D.; Sarangi, C.; Kanawade, V.P. Anthropogenic Land Use and Land Cover Changes-A Review on Its Environmental Consequences and Climate Change. J. Indian Soc. Remote Sens. 2022, 50, 1615–1640. [Google Scholar] [CrossRef]
- Jia, S.; Yang, C.; Wang, M.; Failler, P. Heterogeneous Impact of Land-Use on Climate Change: Study From a Spatial Perspective. Front. Environ. Sci. 2022, 10, 840603. [Google Scholar] [CrossRef]
- Hong, T.; Wu, J.; Kang, X.; Yuan, M.; Duan, L. Impacts of Different Land Use Scenarios on Future Global and Regional Climate Extremes. Atmosphere 2022, 13, 995. [Google Scholar] [CrossRef]
- Lee, H.; Calvin, K.; Dasgupta, D.; Krinner, G.; Mukherji, A.; Thorne, P.; Trisos, C.; Romero, J.; Aldunce, P.; Barrett, K.; et al. Climate Change 2023: Synthesis Report. Contribution of Working Groups I, II and III to the Sixth Assessment Report of the Intergovernmental Panel on Climate Change; The Australian National University: Canberra, Australia, 2023. [Google Scholar]
- Hall, S. Cool innovations to protect cities from dangerous heat. Nature 2024, 632, 971–973. [Google Scholar] [CrossRef]
- Ledford, H. Human body’s ageing ‘clock’ ticks faster after heat stress. Nature 2024, 636, 534. [Google Scholar] [CrossRef]
- Kalisa, E.; Fadlallah, S.; Amani, M.; Nahayo, L.; Habiyaremye, G. Temperature and air pollution relationship during heatwaves in Birmingham, UK. Sustain. Cities Soc. 2018, 43, 111–120. [Google Scholar] [CrossRef]
- Sarkar, U.K.; Paul, T.T.; Puthiyottil, M.; Karnatak, G.; Das, V.G.; Lianthuamluaia; Bandyopadhyay, A.; Bakshi, S.; Das, B.K. Inland heat waves (IHWs) and associated impacts on hydro-biology of aquatic ecosystems in lower Ganga basin. India. Int. J. Biometeorol. 2022, 66, 235–245. [Google Scholar] [CrossRef]
- Santamouris, M. Recent progress on urban overheating and heat island research. Integrated assessment of the energy, environmental, vulnerability and health impact. Synergies with the global climate change. Energy Build. 2020, 207, 109482. [Google Scholar]
- Park, J.-H.; Cho, G.-H. Examining the Association between Physical Characteristics of Green Space and Land Surface Temperature: A Case Study of Ulsan, Korea. Sustainability 2016, 8, 777. [Google Scholar] [CrossRef]
- Cai, J.; Tan, W.; Yan, B. The Structure of Urban Green Space System to tackle Heat-island Effect. Res. J. Chem. Environ. 2011, 15, 755–758. [Google Scholar]
- Wu, C.; Li, J.; Wang, C.; Song, C.; Chen, Y.; Finka, M.; La Rosa, D. Understanding the relationship between urban blue infrastructure and land surface temperature. Sci. Total Environ. 2019, 694, 133742. [Google Scholar] [CrossRef]
- Gunawardena, K.R.; Wells, M.J.; Kershaw, T. Utilising green and bluespace to mitigate urban heat island intensity. Sci. Total Environ. 2017, 584, 1040–1055. [Google Scholar] [CrossRef] [PubMed]
- Ballinas, M.; Barradas, V.L. Transpiration and stomatal conductance as potential mechanisms to mitigate the heat load in Mexico City. Urban For. Urban Green. 2016, 20, 152–159. [Google Scholar] [CrossRef]
- Yang, J.; Shi, B. Scale or size? An analysis of the factors that affect building density: Evidence from high-density central urban zones in Asia. Urban Des. Int. 2021, 26, 220–233. [Google Scholar]
- Pritipadmaja; Garg, R.D.; Sharma, A.K. Assessing the Cooling Effect of Blue-Green Spaces: Implications for Urban Heat Island Mitigation. Water 2023, 15, 2983. [Google Scholar]
- Shi, D.; Song, J.; Huang, J.; Zhuang, C.; Guo, R.; Gao, Y. Synergistic cooling effects (SCEs) of urban green-blue spaces on local thermal environment: A case study in Chongqing, China. Sustain. Cities Soc. 2020, 55, 102065. [Google Scholar] [CrossRef]
- Qiu, X.; Kil, S.-H.; Jo, H.-K.; Park, C.; Song, W.; Choi, Y.E. Cooling Effect of Urban Blue and Green Spaces: A Case Study of Changsha, China. Int. J. Environ. Res. Public Health 2023, 20, 2613. [Google Scholar] [CrossRef]
- Tan, X.; Sun, X.; Huang, C.; Yuan, Y.; Hou, D. Comparison of cooling effect between green space and water body. Sustain. Cities Soc. 2021, 67, 102711. [Google Scholar] [CrossRef]
- Yujie, R.; Tang, X.; Fan, T.; Kang, D. Does the spatial pattern of urban blue-green space at city-level affects its cooling efficiency? Evidence from Yangtze River Economic Belt, China. Landsc. Ecol. Eng. 2023, 19, 363–379. [Google Scholar] [CrossRef]
- Jiménez-Muñoz, J.C.; Sobrino, J.A.; Skoković, D.; Mattar, C.; Cristóbal, J. Land Surface Temperature Retrieval Methods From Landsat-8 Thermal Infrared Sensor Data. IEEE Geosci. Remote Sens. Lett. 2014, 11, 1840–1843. [Google Scholar] [CrossRef]
- Avdan, U.; Jovanovska, G. Algorithm for Automated Mapping of Land Surface Temperature Using LANDSAT 8 Satellite Data. J. Sens. 2016, 2016, 1480307. [Google Scholar] [CrossRef]
- Wang, F.; Qin, Z.; Song, C.; Tu, L.; Karnieli, A.; Zhao, S. An Improved Mono-Window Algorithm for Land Surface Temperature Retrieval from Landsat 8 Thermal Infrared Sensor Data. Remote Sens. 2015, 7, 4268–4289. [Google Scholar] [CrossRef]
- Liao, L.; Song, J.; Wang, J.; Xiao, Z.; Wang, J. Bayesian Method for Building Frequent Landsat-Like NDVI Datasets by Integrating MODIS and Landsat NDVI. Remote Sens. 2016, 8, 452. [Google Scholar] [CrossRef]
- Sekertekin, A.; Bonafoni, S. Land Surface Temperature Retrieval from Landsat 5, 7, and 8 over Rural Areas: Assessment of Different Retrieval Algorithms and Emissivity Models and Toolbox Implementation. Remote Sens. 2020, 12, 294. [Google Scholar] [CrossRef]
- Wan, J.-K.; Shen, Z.-H.; Li, S. Difference and parameter analysis of LST inversion based on Landsat data. J. Infrared Millim. Waves 2024, 43, 226–234. [Google Scholar]
- Zhao, J.; Zhao, X.; Liang, S.; Zhou, T.; Du, X.; Xu, P.; Wu, D. Assessing the thermal contributions of urban land cover types. Landsc. Urban Plan. 2020, 204, 103927. [Google Scholar] [CrossRef]
- Song, J.; Chen, W.; Zhang, J.; Huang, K.; Hou, B.; Prishchepov, A.V. Effects of building density on land surface temperature in China: Spatial patterns and determinants. Landsc. Urban Plan. 2020, 198, 103794. [Google Scholar] [CrossRef]
- Jiang, Y.; Huang, J.; Shi, T.; Wang, H. Interaction of Urban Rivers and Green Space Morphology to Mitigate the Urban Heat Island Effect: Case-Based Comparative Analysis. Int. J. Environ. Res. Public Health 2021, 18, 11404. [Google Scholar] [CrossRef]
- Pan, Z.; Xie, Z.; Wu, L.; Pan, Y.; Ding, N.; Liang, Q.; Qin, F. Simulation of Cooling Island Effect in Blue-Green Space Based on Multi-Scale Coupling Model. Remote Sens. 2023, 15, 2093. [Google Scholar] [CrossRef]
- Tian, P.; Li, J.; Pu, R.; Cao, L.; Liu, Y.; Zhang, H. Assessing the cold island effect of urban parks in metropolitan cores: A case study of Hangzhou, China. Environ. Sci. Pollut. Res. 2023, 30, 80931–80944. [Google Scholar] [CrossRef]
- Quan, S.; Li, M.; Li, T.; Liu, H.; Cui, Y.; Liu, M. Nonlinear effects of blue-green space variables on urban cold islands in Zhengzhou analyzed with random forest regression. Front. Ecol. Evol. 2023, 11, 1185249. [Google Scholar] [CrossRef]
- Liu, Y.; Xu, X.; Wang, F.; Qiao, Z.; An, H.; Han, D.; Luo, J. Exploring the cooling effect of urban parks based on the ECOSTRESS land surface temperature. Front. Ecol. Evol. 2022, 10, 1031517. [Google Scholar] [CrossRef]
- Xue, Z.; Hou, G.; Zhang, Z.; Lyu, X.; Jiang, M.; Zou, Y.; Shen, X.; Wang, J.; Liu, X. Quantifying the cooling-effects of urban and peri-urban wetlands using remote sensing data: Case study of cities of Northeast China. Landsc. Urban Plan. 2019, 182, 92–100. [Google Scholar] [CrossRef]
- Li, X.; Stringer, L.C.; Dallimer, M. The role of blue green infrastructure in the urban thermal environment across seasons and local climate zones in East Africa. Sustain. Cities Soc. 2022, 80, 103798. [Google Scholar] [CrossRef]
- Wang, M.; Song, H.; Zhu, W.; Wang, Y. The Cooling Effects of Landscape Configurations of Green-Blue Spaces in Urban Waterfront Community. Atmosphere 2023, 14, 833. [Google Scholar] [CrossRef]
- Huang, B.-X.; Chiou, S.-C.; Li, W.-Y. Landscape Pattern and Ecological Network Structure in Urban Green Space Planning: A Case Study of Fuzhou City. Land 2021, 10, 769. [Google Scholar] [CrossRef]
- Cao, X.; Onishi, A.; Chen, J.; Imura, H. Quantifying the cool island intensity of urban parks using ASTER and IKONOS data. Landsc. Urban Plan. 2010, 96, 224–231. [Google Scholar] [CrossRef]
- Yazdanie, M.; Densing, M.; Wokaun, A. Cost optimal urban energy systems planning in the context of national energy policies: A case study for the city of Basel. Energy Policy 2017, 110, 176–190. [Google Scholar] [CrossRef]
- Robitu, M.; Musy, M.; Inard, C.; Groleau, D. Modeling the influence of vegetation and water pond on urban microclimate. Sol. Energy 2006, 80, 435–447. [Google Scholar] [CrossRef]
- Maroni, D.; Cardoso, G.T.; Neckel, A.; Maculan, L.S.; Oliveira, M.L.; Bodah, E.T.; Bodah, B.W.; Santosh, M. Land surface temperature and vegetation index as a proxy to microclimate. J. Environ. Chem. Eng. 2021, 9, 105796. [Google Scholar] [CrossRef]
- Yu, Z.; Yang, G.; Zuo, S.; Jørgensen, G.; Koga, M.; Vejre, H. Critical review on the cooling effect of urban blue-green space: A threshold-size perspective. Urban For. Urban Green. 2020, 49, 126630. [Google Scholar] [CrossRef]
- Yang, G.; Yu, Z.; Jørgensen, G.; Vejre, H. How can urban blue-green space be planned for climate adaption in high-latitude cities? A seasonal perspective. Sustain. Cities Soc. 2020, 53, 101932. [Google Scholar] [CrossRef]
- Steeneveld, G.; Koopmans, S.; Heusinkveld, B.; Theeuwes, N. Refreshing the role of open water surfaces on mitigating the maximum urban heat island effect. Landsc. Urban Plan. 2014, 121, 92–96. [Google Scholar] [CrossRef]
- Hathway, E.A.; Sharples, S. The interaction of rivers and urban form in mitigating the Urban Heat Island effect: A UK case study. Build. Environ. 2012, 58, 14–22. [Google Scholar] [CrossRef]
- Lin, X.; Cui, Y.; Hao, S.; Hong, H.; Zhang, M.; Zhang, J.; Li, R.; Liu, M. Quantitative analysis of lake-cooling effect in Hefei City, China, based on multispectral remote sensing and its response to urban expansion. Environ. Sci. Pollut. Res. 2023, 30, 12495–12507. [Google Scholar] [CrossRef] [PubMed]
- Wu, S.; Yang, H.; Luo, P.; Luo, C.; Li, H.; Liu, M.; Ruan, Y.; Zhang, S.; Xiang, P.; Jia, H.; et al. The effects of the cooling efficiency of urban wetlands in an inland megacity: A case study of Chengdu, Southwest China. Build. Environ. 2021, 204, 108128. [Google Scholar] [CrossRef]
- Behzad, Z.; Guilandoust, A. Enhancing outdoor thermal comfort in a historic site in a hot dry climate (Case study: Naghsh-e-Jahan Square, Isfahan). Sustain. Cities Soc. 2024, 102, 105209. [Google Scholar] [CrossRef]
- Zhang, J.; Jiang, H.; Song, X.; Jin, J.; Zhang, X. The Responses of Plant Leaf CO2/H2O Exchange and Water Use Efficiency to Drought: A Meta-Analysis. Sustainability 2018, 10, 551. [Google Scholar] [CrossRef]
- Aquino-Martínez, L.P.; Ortega-Guerrero, B.; Quintanar, A.I.; Díaz-Esteban, Y. Synoptic patterns and heatwaves: Intensifying urban heat islands in the Mexico Basin. Urban Clim. 2025, 59, 102318. [Google Scholar] [CrossRef]
- Zheng, Z.; Lin, X.; Chen, L.; Yan, C.; Sun, T. Effects of urbanization and topography on thermal comfort during a heat wave event: A case study of Fuzhou, China. Sustain. Cities Soc. 2024, 102, 105233. [Google Scholar] [CrossRef]
- He, B.-J.; Ding, L.; Prasad, D. Relationships among local-scale urban morphology, urban ventilation, urban heat island and outdoor thermal comfort under sea breeze influence. Sustain. Cities Soc. 2020, 60, 102289. [Google Scholar] [CrossRef]
- Sisco, L.; Monzer, S.; Farajalla, N.; Bashour, I.; Saoud, I.P. Roof top gardens as a means to use recycled waste and A/C condensate and reduce temperature variation in buildings. Build. Environ. 2017, 117, 127–134. [Google Scholar] [CrossRef]
- Onmura, S.; Matsumoto, M.; Hokoi, S. Study on evaporative cooling effect of roof lawn gardens. Energy Build. 2001, 33, 653–666. [Google Scholar] [CrossRef]
- Gómez-Villarino, M.T.; Urquijo, J.; Villarino, M.G.; García, A.I. Key insights of urban agriculture for sustainable urban development. Agroecol. Sustain. Food Syst. 2021, 45, 1441–1469. [Google Scholar] [CrossRef]
- Wang, N.; Zhu, L.; Bing, Y.; Chen, L.; Fei, S. Assessment of Urban Agriculture for Evidence-Based Food Planning: A Case Study in Chengdu, China. Sustainability 2021, 13, 3234. [Google Scholar] [CrossRef]
- Wu, Z.J.; Zhang, Y.X. Spatial variations of urban thermal environment and its relations to green space patterns: Implication to sustainable landscape planning. Sustainability 2018, 10, 2249. [Google Scholar] [CrossRef]
- Wu, Z.J.; Zhang, Y.X. Water bodies’ cooling effects of on urban land daytime surface temperature: Ecosystem service reducing heat island effect. Sustainability 2019, 11, 787. [Google Scholar] [CrossRef]
Disclaimer/Publisher’s Note: The statements, opinions and data contained in all publications are solely those of the individual author(s) and contributor(s) and not of MDPI and/or the editor(s). MDPI and/or the editor(s) disclaim responsibility for any injury to people or property resulting from any ideas, methods, instructions or products referred to in the content. |
© 2025 by the authors. Licensee MDPI, Basel, Switzerland. This article is an open access article distributed under the terms and conditions of the Creative Commons Attribution (CC BY) license (https://creativecommons.org/licenses/by/4.0/).