Article

Rural Transformation in Northern Anhui, China: Spatio-Temporal Patterns and Driving Mechanisms in Traditional Agricultural Areas

1
School of Architecture and Planning, Anhui Jianzhu University, Hefei 230601, China
2
Anhui Academy of Territorial Spatial Planning and Ecology, Hefei 230601, China
3
Anhui Province Rural Revitalization Collaborative Technology Service Center, Hefei 230601, China
*
Authors to whom correspondence should be addressed.
Land 2025, 14(10), 1940; https://doi.org/10.3390/land14101940
Submission received: 24 August 2025 / Revised: 21 September 2025 / Accepted: 21 September 2025 / Published: 25 September 2025
(This article belongs to the Section Land Use, Impact Assessment and Sustainability)

Abstract

Rural transformation is crucial to alleviating development pressure on traditional agricultural areas and stimulating rural vitality. This study aims to comprehensively analyze the spatio-temporal patterns, identify the key influencing factors, and propose targeted development strategies for rural transformation specifically within Northern Anhui, a quintessential traditional agricultural area in China. Utilizing the entropy method, exploratory spatial analysis, and geographic detector, we systematically evaluated the level of rural transformation and its spatial distribution characteristics across 35 counties and districts in Northern Anhui from 2011 to 2023. The results demonstrate a significant 35.93% increase in the average rural transformation level over the past decade, evolving from an initially low-level pattern to one characterized by “Central high, peripheral low”, with significantly narrowing disparities between counties and districts. Significant global positive spatial autocorrelation was consistently observed, alongside distinct localized clustering, including high-value clusters (H-H) and low-value clusters (L-L). A driver analysis identified investment efficiency, economic development level, industrialization, transportation accessibility, and fiscal revenue level as the predominant factors driving the spatial differentiation of rural transformation, with interaction detection revealing crucial synergistic effects among these factors. These findings provide valuable empirical insights and a scientific basis for formulating differentiated rural development strategies tailored to specific county types within traditional agricultural areas like Northern Anhui, thereby facilitating the rural transformation process in developing countries.

1. Introduction

Rural transformation, defined as the fundamental restructuring of rural socio-economic systems encompassing population dynamics, land-use patterns, industrial structures, and social services, represents a critical pathway for alleviating developmental pressures in traditional agricultural regions and revitalizing rural areas globally [1]. While the challenges of rural decline, characterized by population exodus, land abandonment, industrial stagnation, and an eroding social fabric—often termed “rural diseases”—manifest worldwide [2], their specific drivers and potential solutions exhibit significant regional variations shaped by distinct historical trajectories, policy frameworks, and resource endowments.
International scholars early on conceptualized rural transformation as an evolutionary process from the ‘pre-productivist’ stage, characterized by maximizing agricultural output, to ‘post-productivism’. While the former focuses mainly on maximizing agricultural output, the latter segment emphasizes the multifunctionality of the countryside, i.e., that rural space not only has production value, but is increasingly valuable as a space for consumption and ecological services [3]. This transition stems mainly from the pressure of globalization on agricultural markets, growing awareness, changing consumer preferences for rural quality of life, and the need to cope with the consequences of agricultural overcapacity and rural decline [4]. Some countries have reflected this through differentiated policy pathways: Germany’s ‘urban-rural equivalence’ legislation ensures the equalization of public services and infrastructure investment to address spatial inequality [5]; Japan’s ‘six-times industrialization’ strategy promotes the integration of production, processing, and services and facilitates value-added to improve rural entrepreneurship through tax incentives [6]; and South Korea’s ‘return to agriculture, return to the village’ policy establishes a gradient talent incentive mechanism that providing customized support to attract youth and skilled talent back to their villages to reverse the brain drain and revitalize communities [7]. These diversified policies aim to mitigate regional decline by making villages multifunctional spaces that can retain population and achieve endogenous growth.
Chinese studies rooted in the perspective of rural territorial systems provide a more comprehensive framework: rural transformation involves a complex interaction between urban–rural population mobility and rural industrial restructuring, triggering profound changes in territorial spatial structure, production and consumption, and social organization, and ultimately leading to urban–rural integration [8,9,10]. This perspective incorporates Marxist theory on the dialectical relationship between productive forces (e.g., technology, infrastructure, human capital) and production relations (e.g., land tenure systems, labor organization, market structures). It is driven by adaptive adjustments in advanced productive forces (industrialization) and the corresponding production relations (e.g., land transfer policies, new agricultural management entities), aiming to overcome the inherent structural constraints hindering rural development. Currently, empirical studies on rural transformation have widely covered multiple themes, such as land use transformation [11,12,13,14], characteristics of rural transformation [15,16,17,18,19], land de-farming [20,21], evaluation of rural transformation [22], and the spatio-temporal pattern of rural transformation and development [23,24,25]. Recently, studies have increasingly focused on factors influencing rural transformation [26,27,28,29] and potential development trajectories [30]. In general, there is a shift from single-factor analysis to the integration of “population-land-industry” dimensions, and from the description of patterns to the analysis of driving forces.
However, significant knowledge gaps persist, particularly concerning traditional agricultural areas, which form the backbone of national food security yet struggle with constraints in industrialization and urbanization. These gaps critically limit the formulation of effective and context-sensitive policies. First, existing research often lacks robust theoretical frameworks tailored to the specific constraints and opportunities of traditional agricultural areas. While the factors affecting transition and potential pathways have been explored, coherent theoretical models explaining the interaction of these factors in the context of traditional agricultural areas remain imperfect, and the lack of exploration to address the unique constraints of agricultural regions has led to a fragmentation of perspectives. Second, there is a predominant focus on quantitative methods, with insufficient attention paid to crucial qualitative dimensions like farmers’ perceptions, cultural contexts, and social relationships, which are essential for understanding the human and social dynamics of transformation. Third, and most critically, despite a trend towards diverse research scales, there is still a lack of attention to regional variations and specificities within traditional agricultural areas. Profound heterogeneity exists within them due to unique combinations of natural environments, economic structures, social capital, and functional positioning. Existing studies frequently fail to adequately account for this internal diversity, potentially leading to generalized conclusions that overlook critical local nuances and hinder the formulation of targeted policies.
In order to fill these gaps, there is an urgent need for this study to construct a degree-integrated analytical framework and utilize a comprehensive analytical approach in order to deeply reveal the complex mechanisms of the transition process. More importantly, it needs to fill the gaps in the study of agricultural areas and provide a comprehensive and precise regional interpretation and universal recommendations.
This study seeks to fill this void by focusing on Northern Anhui, a quintessential representative of traditional agricultural areas in China. As a vital part of the Huang-Huai-Hai Plain, China’s largest grain-producing region, it shoulders immense responsibility for national food security. However, it simultaneously exhibits classic symptoms of “rural diseases”, such as significant urban–rural disparities, strong outmigration pressures, an aging agricultural workforce, and economic lag in relation to the coastal industrial zones. The Chinese government has prioritized revitalizing such areas, exemplified by the national Rural Revitalization Strategy and the annual No. 1 Central Document, which consistently emphasize stabilizing agricultural production and rural development [8]. The study of Northern Anhui is not only crucial for understanding the dynamics of the transformation of the core grain silo under the national policy focus, but also provides valuable lessons for similar regions around the globe that are facing the challenges of balancing food production, economic diversification, and population maintenance, and which are highly migratory in terms of coping with spatial differentiation strategies and overcoming internal heterogeneity.
Therefore, this study aims to address these gaps by conducting a comprehensive analysis of rural transformation in Northern Anhui, a quintessential traditional agricultural area. Our core research objectives are: (1) to quantify the spatio-temporal patterns and evolutionary characteristics of rural transformation across counties and districts in Northern Anhui from 2011 to 2023; (2) to identify the key drivers shaping this transformation and their interactive effects, establishing the novel “Pattern-Mechanism-Regulation” (PMR) theoretical framework that systematically integrates spatio-temporal diagnostics, causal analysis, and policy translation; and (3) to uncover the regional heterogeneity in transformation pathways within Northern Anhui and propose differentiated development strategies. By integrating quantitative spatial analysis (exploratory spatial data analysis—ESDA) with a robust factor detection method (geographic detector), this research seeks to provide a nuanced understanding of how rural transformation unfolds in a complex, internally diverse traditional agricultural areas, contributing both empirically and methodologically to the broader literature on sustainable rural development, and to provide a basis for policy formulation related to rural transformation in the region, advancing a replicable model that is specific to the region.

2. Materials and Methods

2.1. Study Area

The Northern Anhui region [31] is located in China, in the Yangtze River Delta (114°87′ E~118°18′ E, 34°65′ N~31°90′ N), bordering Jiangsu to the east, Henan to the west, Shandong to the north, and Southern Anhui to the south. This strategically positioned region is dominated by plains and serves as a vital link between the north–south and east–west transportation corridors. It encompasses six cities: Suzhou, Huaibei, Bozhou, Bengbu, Fuyang, and Huainan (Figure 1), with the color gradient representing elevation differences. The total area of these cities is 42,802 km2, accounting for 30.3% of the province’s total area. As of 2023, the resident population is 26.3 million (42.97% provincial total), and the GDP reaches CNY 1,218,848 million (25.91% provincial output), all calculated from 2023 municipal statistical yearbooks. As Anhui’s agricultural core, it features dense farming populations, lower industrialization levels, and agriculture-driven economies. Challenges like volatile grain prices, arable land retention pressures, and “rural diseases” necessitate transformative development strategies.

2.2. Data Collection

This study uses a multi-source data system to support the analysis (Table 1), constructing socioeconomic benchmarks through authoritative statistical yearbooks, official databases, and field consultations, geospatial data to establish a three-dimensional substrate, and is supplemented with targeted departmental consultations to complement microdemographic data. The base map adopts the unaltered version of the review map number GS (2016) 2556, and missing data are processed by interpolation. Given the administrative divisions during the study period, the data are calibrated against the 2016 divisions, and the 35 counties and districts are finally identified as the study unit.

2.3. Methods

The “Pattern-Mechanism-Regulation” (PMR) theoretical framework constructed in this study is a systematic analytical system for understanding and promoting rural transformation. The framework forms an organic whole from the three dimensions of “pattern identification–mechanism analysis–regulation optimization”, and is committed to revealing the spatial, economic, and social patterns (Pattern) manifested in the process of rural development, exploring the interactions of the multiple driving forces behind them (Mechanism), and ultimately achieving benign guidance and optimal regulation (Regulation) through policy and planning instruments.
Based on the PMR theoretical framework, this study conducts the following research: (1) Evaluating rural transformation development and identifying its spatio-temporal patterns. An indicator system is constructed from population, land, industry, and society dimensions. Using a comprehensive weighting method, the rural transformation level of counties in Northern Anhui from 2011 to 2023 is comprehensively assessed, and its spatio-temporal agglomeration patterns are revealed. (2) It analyzes spatial differentiation and classifies types. Based on transformation levels and spatial autocorrelation analysis, counties are categorized into high–high, low–low, transitional, and non-significant types to define their developmental stages. (3) It investigates driving mechanisms via geo-detection. Natural, locational, industrial, and socio-economic factors are selected to quantitatively identify key drivers and their interactive effects using geographic detectors. (4) It formulates targeted regulation strategies. Differentiated policy pathways are proposed according to the influencing mechanisms and current conditions of various types of areas, promoting rural revitalization and regional coordination.

2.3.1. Selection of Indicators for Evaluating the Level of Rural Transformation and Development

The selection of indicators in this study adhered to the principles of comprehensiveness, representativeness, and scientific rigor, integrating theoretical analysis, the comprehensive weighting method, the intrinsic nature of rural transition and development, regional characteristics of traditional agricultural areas, and insights from the existing literature [26,27]. In this process, we also consulted with five experts in rural development and urban–rural planning in Anhui Province to confirm the final indicators, in order to further improve the rationality of the selected indicators. Specifically, the population dimension incorporates the urbanization rate (E1) and the structure of practitioners (E2) to capture the shift from agricultural to non-agricultural employment [23], and the urban–rural income gap (E3) reflects the welfare disparities critical for equitable transition [27,32]. The land dimension employs the proportion of cultivated land area (E4) and the share of rural settlement area (E5) to assess spatial restructuring pressure based on farmland preservation theory and to represent the distribution traits of arable land [11,13], along with the proportion of land used for urban construction (E6) to reflect the intensity of urban expansion and its impact on rural spatial transformation. Additionally, the recovery index (E7) is introduced to evaluate multiple-cropping efficiency and cultivated land use intensity. The industrial dimension integrates the share of secondary and tertiary industry output (E8) and the gross agricultural machinery power per capita (E9) to identify industrialization drivers and quantify sectoral upgrading [26]; agricultural labor productivity (E11) is included to measure efficiency gains in agricultural production. Finally, the social dimension evaluates public service coverage and quality of life using indicators such as the level of electricity consumption by rural residents (E12) to reflect modern living standards, the number of full-time teachers per 10,000 people (E13), and the number of hospital beds per 10,000 people (E14). Considering data availability and practical research constraints, through consultations with five experts specializing in rural development in Anhui Province, key refinements were made: the “food crop specialization rate” (E10) was incorporated to underscore the region’s role in national food security [31].
The resulting framework is structured around three core aspects—foundations, motivations, and outcomes—and encompasses four dimensions: population transition, land-use transition, industrial transition, and social transition (Table 2).

2.3.2. Interpolation Method

For the treatment of missing values of socio-economic data, this study used time-series linear interpolation or mean interpolation to fill them. Continuous functions were constructed from discrete data with known time points to estimate the indicator values for missing years to ensure the continuity and consistency of the data in the time dimension [33,34,35].

2.3.3. Calculation of Portfolio Weights Using AHP–Entropy Method

In this study, the hierarchical analysis method (AHP) and entropy value method are used to comprehensively determine the weights of rural transformation evaluation indicators. At the subjective empowerment level, the evaluation system containing 14 indicators is constructed based on the AHP framework, the expert consultation questionnaire is designed using the 1–9 scale method, and the two-by-two comparison judgment matrices of five experts in the field are integrated, and the subjective weight vectors are extracted by a consistency test (Table 3) [36,37].
At the objective empowerment level, the discrete characteristics of the indicator data are analyzed using the entropy method, and the objective weights are calculated through information entropy to effectively avoid the interference of subjective preferences. Ultimately, the subjective and objective weights are fused by equal-weight linear weighting to form comprehensive weights with both expert and data-driven characteristics, so as to improve the scientific and fault-tolerant nature of the evaluation results [38]. The entropy method is calculated as:
(1)
Indicators were standardized using the extreme value standardization method. The formulae are as follows:
Positive-indicator formula:
x i j = x i j x j , m i n x j , m a x x j , m i n
Negative-indicator formula:
x i j = x j , m a x x i j x j , m a x x j , m i n
In the formula, i denotes the sample unit; j denotes the indicator layer index, and X i j is the normalised value. x i , m a x and x i , m i n are the maximum and minimum values of the i are the maximum and minimum values of the indicators.
(2)
Calculate the share of the ith program for the jth indicator
p i j = x i j i = 1 n x i j       ( i = 1 , 2 , m ,   j = 1 , 2 , , n )
(3)
Calculate the entropy value of the jth indicator Ej:
E j = 1 ln n i = 1 n P i j ln ( P i j )       ( j = 1 , 2 , , n )
(4)
Calculate the weight of the jth indicator Wj:
W j = 1 E j ( 1 E j )
(5)
Linear weighting by the AHP–entropy method. Determine the comprehensive weights of the evaluation indicators:
W j = β W 1 j + 1 β W 2 j
In the formula, W j is the combined weight; β is the preference coefficient, W 1 j is the expert assignment, and W 2 j is the objective assignment; and 0 ≤ β ≤ 1. In this study, a is taken as 0.5.
(6)
To measure the comprehensive level of rural transformation development (RTD) for each county and district, the following formula is applied:
R T D i = j = 1 n ( W j x i j )
In the formula, R T D i is the comprehensive score of rural transformation development for the i th county.

2.3.4. Classification of Development Levels

In this study, the natural breakpoint method was used to categorize the four-year transformation of rural Northern Anhui into five levels: low development, lower development, medium development, higher development, and high development.
The natural breakpoint method grades data according to its inherent statistical patterns, and its core principle is to find natural grouping points inherent in the data by minimizing within-group differences and maximizing between-group differences [39]. The core principle is to find the natural grouping points inherent in the data by minimizing within-group differences and maximizing group differences. The method can be adapted to the actual distribution of the data and is especially suitable for dealing with the inhomogeneous data commonly found in socio-economic fields, so as to more accurately reveal the high-value and low-value areas in the region. The method can be adapted to the actual distribution of the data. The method has become a common tool in spatial differentiation in geography and regional economic analysis [40]. This study adopts this method with the aim of objectively presenting the inherent hierarchy and spatial differentiation pattern of the level of rural transformation in the counties of Northern Anhui Province.

2.3.5. Calculation of Exploratory Spatial Data Analysis

Exploratory spatial data analysis (ESDA) is a method to reveal the spatial distribution characteristics of socio-economic development [41]. In this paper, global autocorrelation and local autocorrelation, which are commonly used in ESDA methods, are used to study the spatial correlation of the level of rural transformation and development in Northern Anhui. It explores the spatial agglomeration or disagglomeration status of the whole and local areas in Northern Anhui.
(1)
Global spatial autocorrelation is used to characterize the overall spatial dependence of an attribute within a study area, reflecting its tendency to cluster or diverge over the entire spatial scale [42]. The formula is as follows:
I = n S 0 i = 1 n j = 1 n W i j ( x i x ¯ ) ( x j x ¯ ) i = 1 n ( x i x ¯ ) 2
(2)
Local spatial autocorrelation reveals the spatial heterogeneity of the study area by measuring the local spatial correlation between each spatial unit and its neighboring units, so as to accurately identify significant agglomerations and anomalous units at the local scale. The formula is as follows:
I i = ( x i x ¯ ) j = 1 n W i j ( x j x ¯ ) S 2
In the formula, x ¯ = 1 n i = 1 n x i , S 2 = 1 n i = 1 n ( x i x ¯ ) 2 . I is the global Moran’s I, I i is the local Moran’s I, n is the number of districts in the study universe, x i and x j are the observed values of the indicators of transformative rural development, x ¯ is the mean observed values of each indicator, S 0 is the sum of all weight values in the spatial weight matrix, S 2 is the variable variance, and W i j is the weight matrix for the spatial relationship between areas i and j .

2.3.6. Selection of Indicators for Rural Transformation Factors

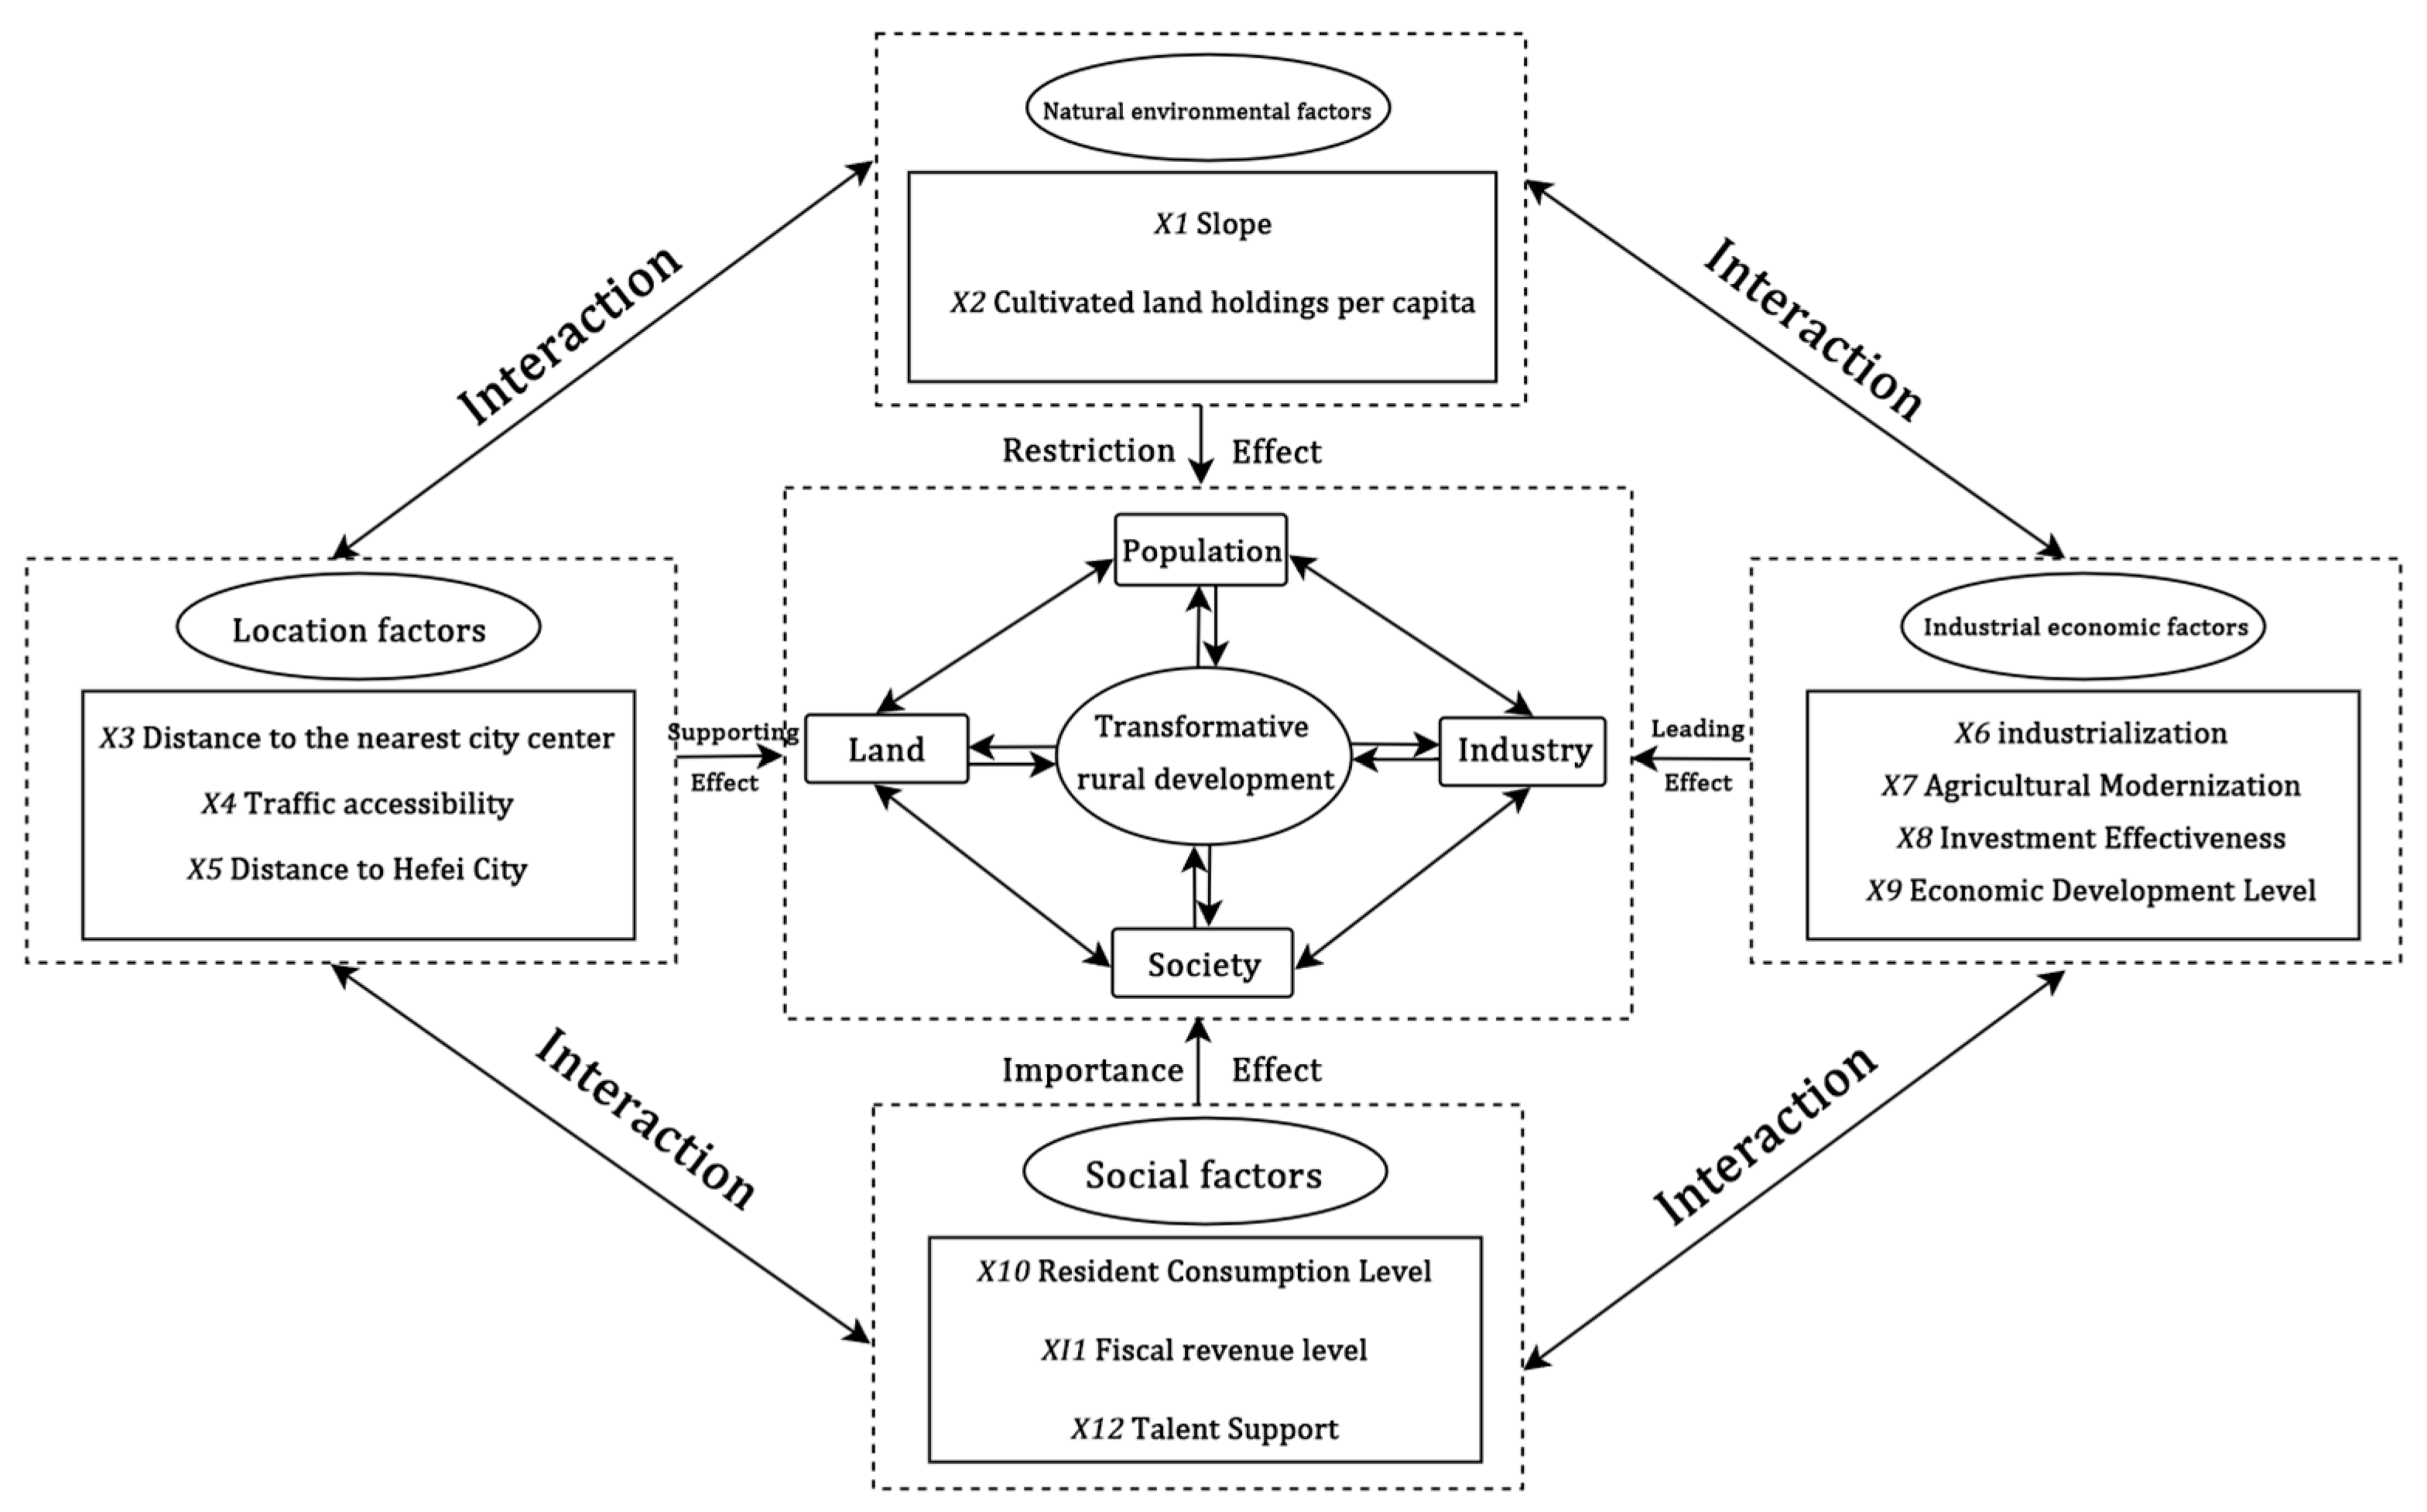
The transformation and development of rural areas are influenced by a multitude of factors [27]. To quantitatively investigate the determinants of rural transformation in Northern Anhui, this study, based on a review of the existing literature [28] and a consideration of the regional context, selects 12 key variables across four dimensions: natural conditions, location, industry and economy, and society (Figure 2). This selection aims to capture the multifaceted drivers of rural transformation, including natural resources, geographical location, industrial activities, societal dynamics, and cultural aspects [27]. These variables provide the basis for the subsequent geo-detector analysis to identify key influencing factors and their interactive effects.

2.3.7. Geodetector Analysis

A geodetector is a statistical method to detect the spatial heterogeneity of geographic phenomena and to explain the driving factors behind them [43,44]. The geodetector consists of four detectors: factor detection, interaction detection, risk area detection, and ecological detection. The factor detection and interaction detection reveal the key influencing factors of rural transformation and development in Northern Anhui. The theoretical formulae are as follows:
q = 1 1 n σ 2 h = 1 L N h σ h 2
In the formula, q is the explanatory power of factor X for the rural transition Y, with a value in the range of [0, 1]. The larger the q value, the greater the influence. h (1, 2, …, L) is the stratification of the dependent variable Y or the independent variable X . L is the stratification of the variable. N h and N are the number of samples of the region h and the total number of samples, respectively. σ h 2 is the variance of the region h , and σ 2 is the variance of the total region.

3. Results

3.1. Temporal and Spatial Patterns of Transformation and Development in Rural Villages of Northern Anhui

3.1.1. Time Characteristics

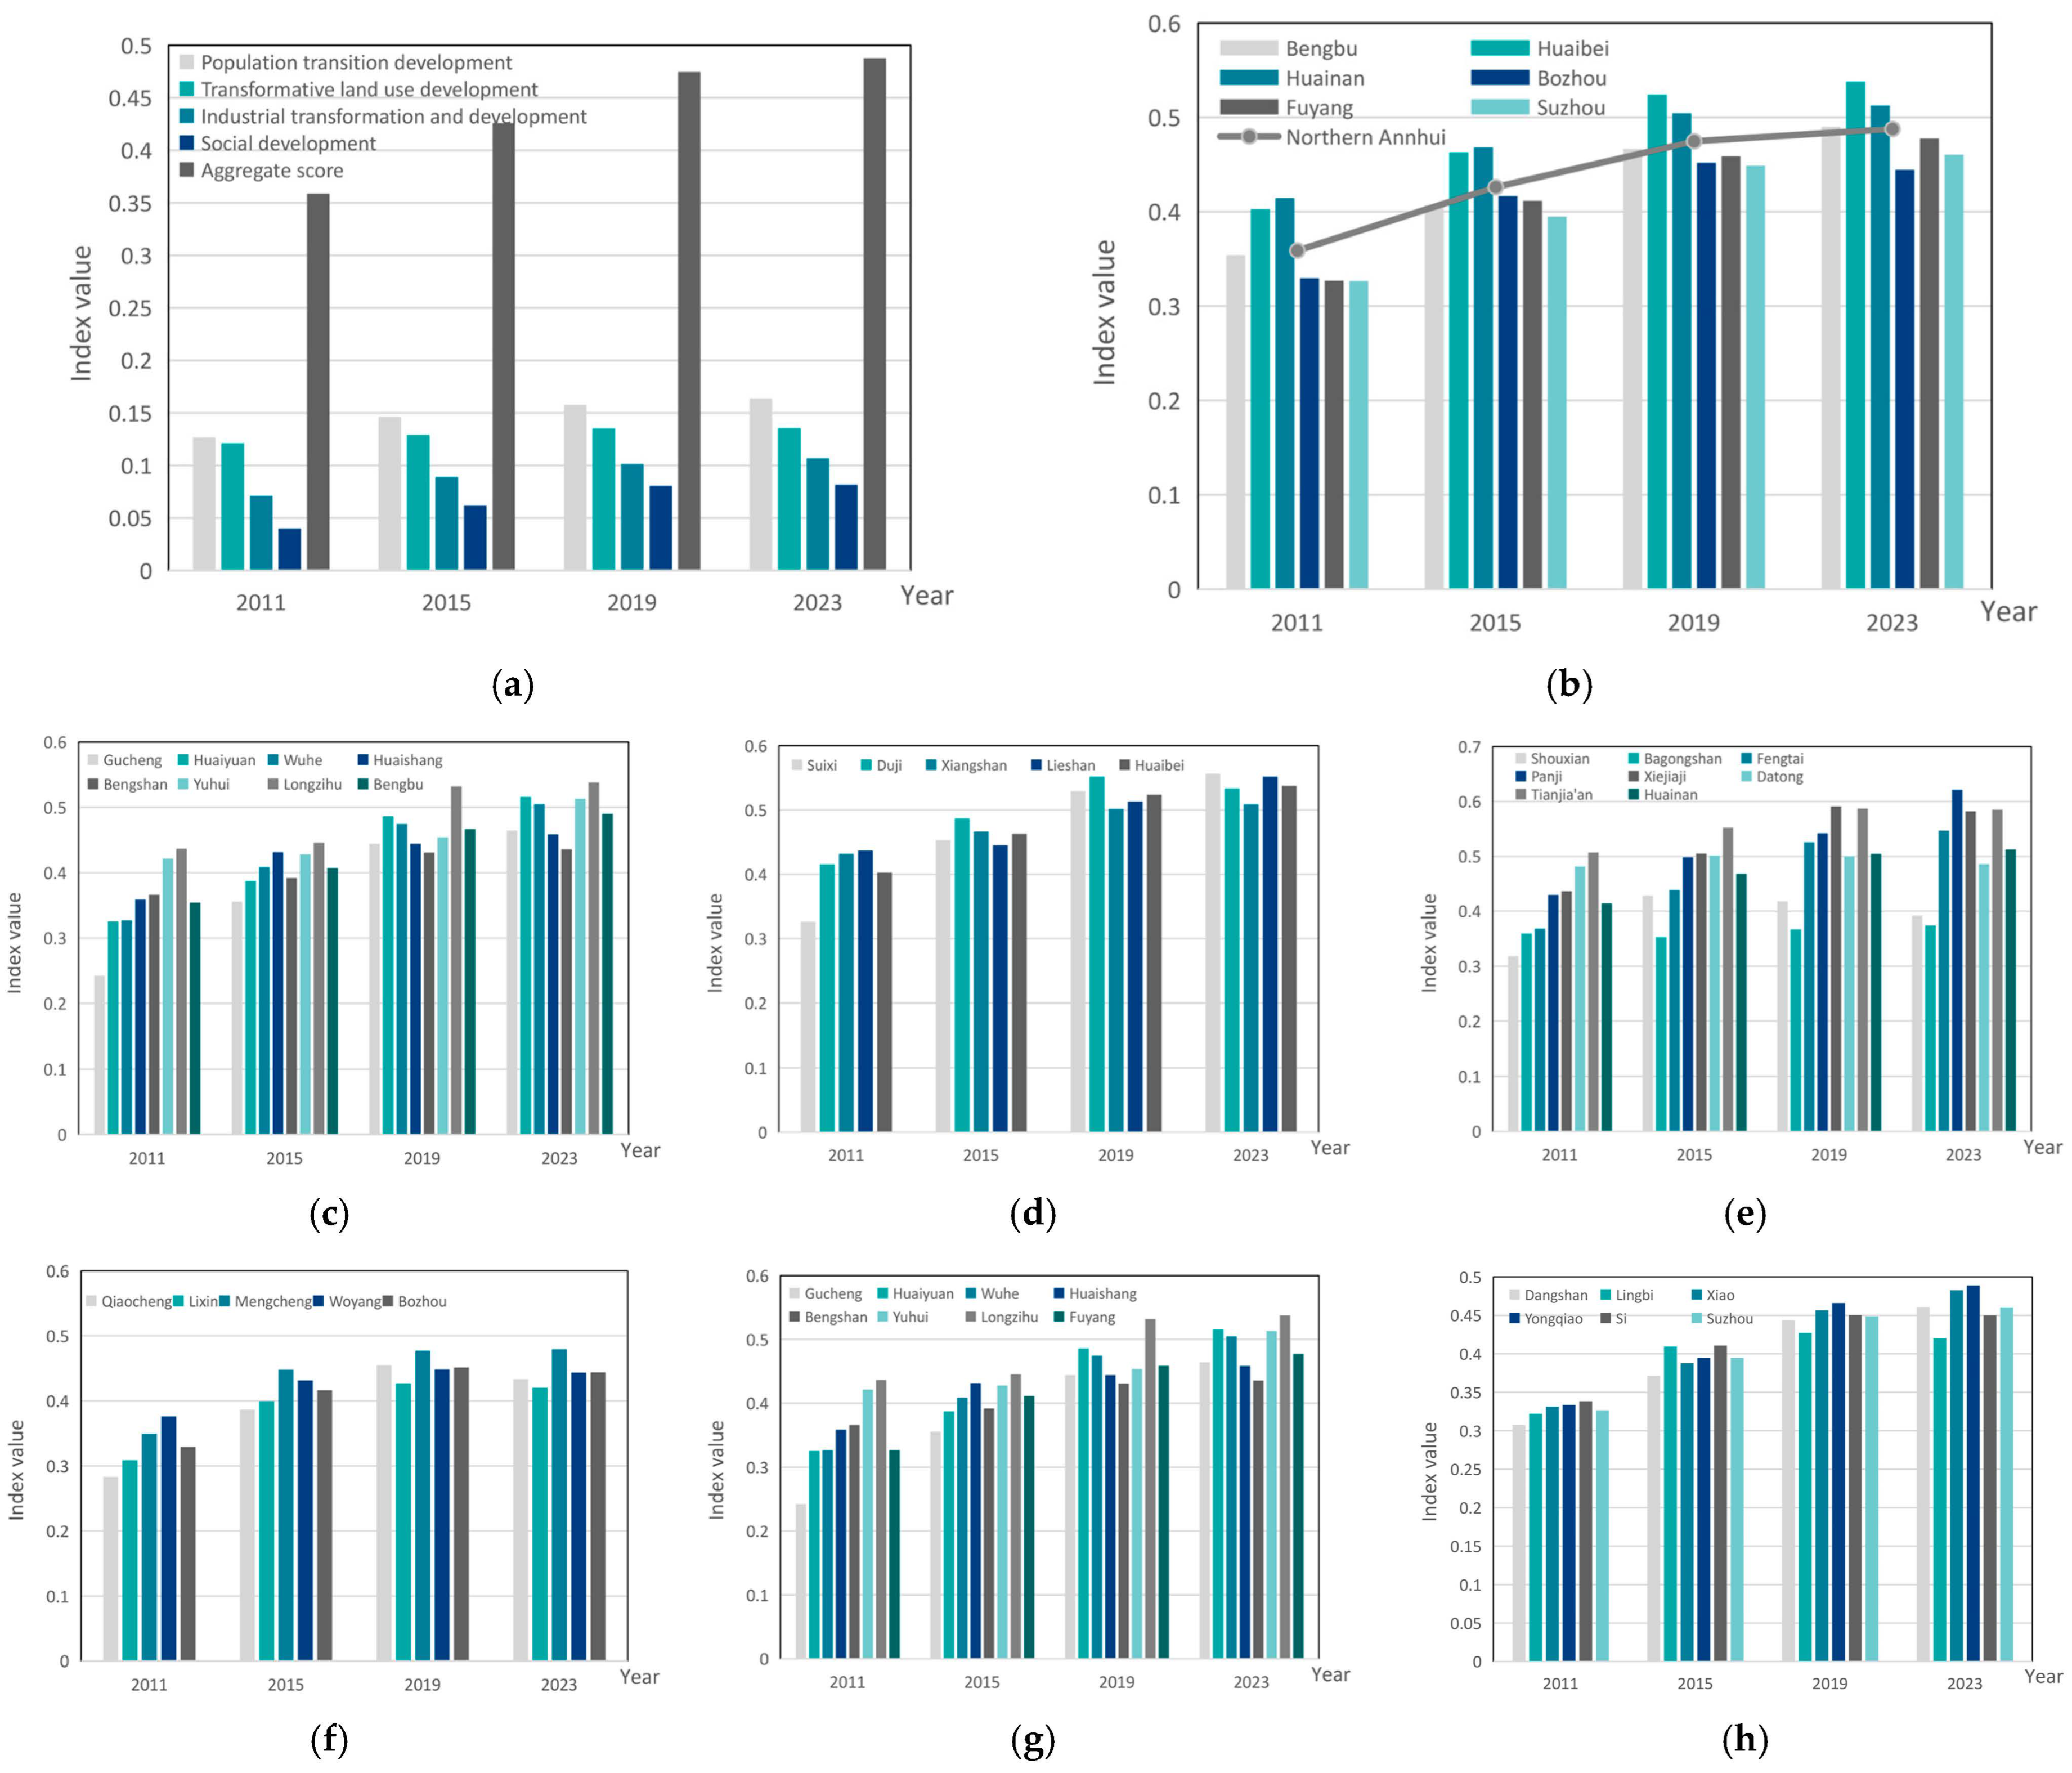
From 2011 to 2023, the level of rural transformational development in Northern Anhui showed a continuous upward trend, with the average index for the study area increasing from 0.359 in 2011 to 0.488 in 2023, an overall increase of 35.93% (Figure 3). This progression exhibited distinct dimensional characteristics: the population transition dimension consistently maintained leadership, reflecting accelerated urbanization and substantial shifts from agricultural to non-agricultural employment patterns; the industrial transformation dimension displayed the most rapid change, driven by targeted policies promoting economic restructuring and strengthening secondary and tertiary sectors; land use transformation evolved at a more measured pace, moderated by strategic spatial planning policies implemented between 2015–2023 that regulated expansion patterns; and social transformation demonstrated steady advancement alongside improvements in education, healthcare, and public services, collectively contributing to a holistic rural development (Figure 3a).
A municipal analysis reveals significant spatial heterogeneity in Northern Anhui’s rural transformation (Figure 3b). Bengbu, Huainan, and Huaibei outperformed the regional averages through integrated development strategies, including industrial specialization (e.g., Huaibei’s aluminum processing), policy innovation, and enhanced rural–urban linkages. In contrast, Suzhou, Fuyang, and Bozhou initially lagged due to agriculture-dependent economies but show promising transitions through emerging specialties like Bozhou’s Chinese herbal medicine industry (CNY 100-billion output) and Fuyang’s agricultural reform pilots, indicating strong catch-up potential.
A secondary regional level analysis (Figure 3c–h) illuminates the intra-city disparities and specific county-level drivers across Northern Anhui. For instance, Bengbu’s transformation was led by urban districts benefiting from superior infrastructure and industrial policies, while the rural counties lagged but showed agricultural modernization progress (Figure 3c). Huaibei achieved balanced development through cohesive industrial strategies and land consolidation initiatives like the “Whole-Village One Field” program (Figure 3d). Huainan transitioned from a resource-based economy to agricultural processing and eco-tourism, reducing coal dependency (Figure 3e). Bozhou demonstrated notable advancements in counties specializing in Chinese herbal medicine, leveraging traditional strengths (Figure 3f). Fuyang, as a largely agriculturally dominant prefecture, demonstrated varied paces across counties, with land reform pilots (e.g., “big trusteeship”) accelerating transformation through scale operations and new agricultural entities (Figure 3g). Suzhou mirrored Fuyang’s pattern, with transformation tied to the effective land transfer policies and secondary-industry development in county seats (Figure 3h).
This multi-scalar analysis, from dimensions to municipalities and down to counties, underscores that rural transformation in Northern Anhui is not a monolithic process but a complex mosaic of differentiated regional pathways, deeply influenced by local resource endowments, historical industrial bases, and the specificity of policy interventions.

3.1.2. Spatial Characteristics

During the study period, rural transformation in Northern Anhui exhibited significant spatial clustering effects, with obvious spatial differentiation characteristics. The overall pattern is “high in the center and low in the periphery”. The development gap among districts and counties is gradually narrowing, indicating reduced polarization. Specifically, in 2011, 74.3% of the counties were at low development levels, but by 2023, driven by poverty alleviation and comprehensive well-being initiatives, 60% achieved higher or high development levels, with only Shou County remaining as a lower-development area (Figure 4).

3.1.3. Evolutionary Characteristics of Global Spatial Patterns

This study examines the correlation of rural transformation in Northern Anhui by constructing a spatial neighbor weight matrix and calculating Moran’s I values from 2011 to 2023 (Table 4). The results indicate that all Moran’s I values are positive, with a significance level (p-value) below 0.05, confirming a positive autocorrelation. This suggests that the development levels of rural transformation are influenced by neighboring counties and districts. Additionally, the Moran’s I value remained above 2.0 with a slight decline, suggesting a slowing agglomeration trend.

3.1.4. Characteristics of Local Spatial Pattern Evolution

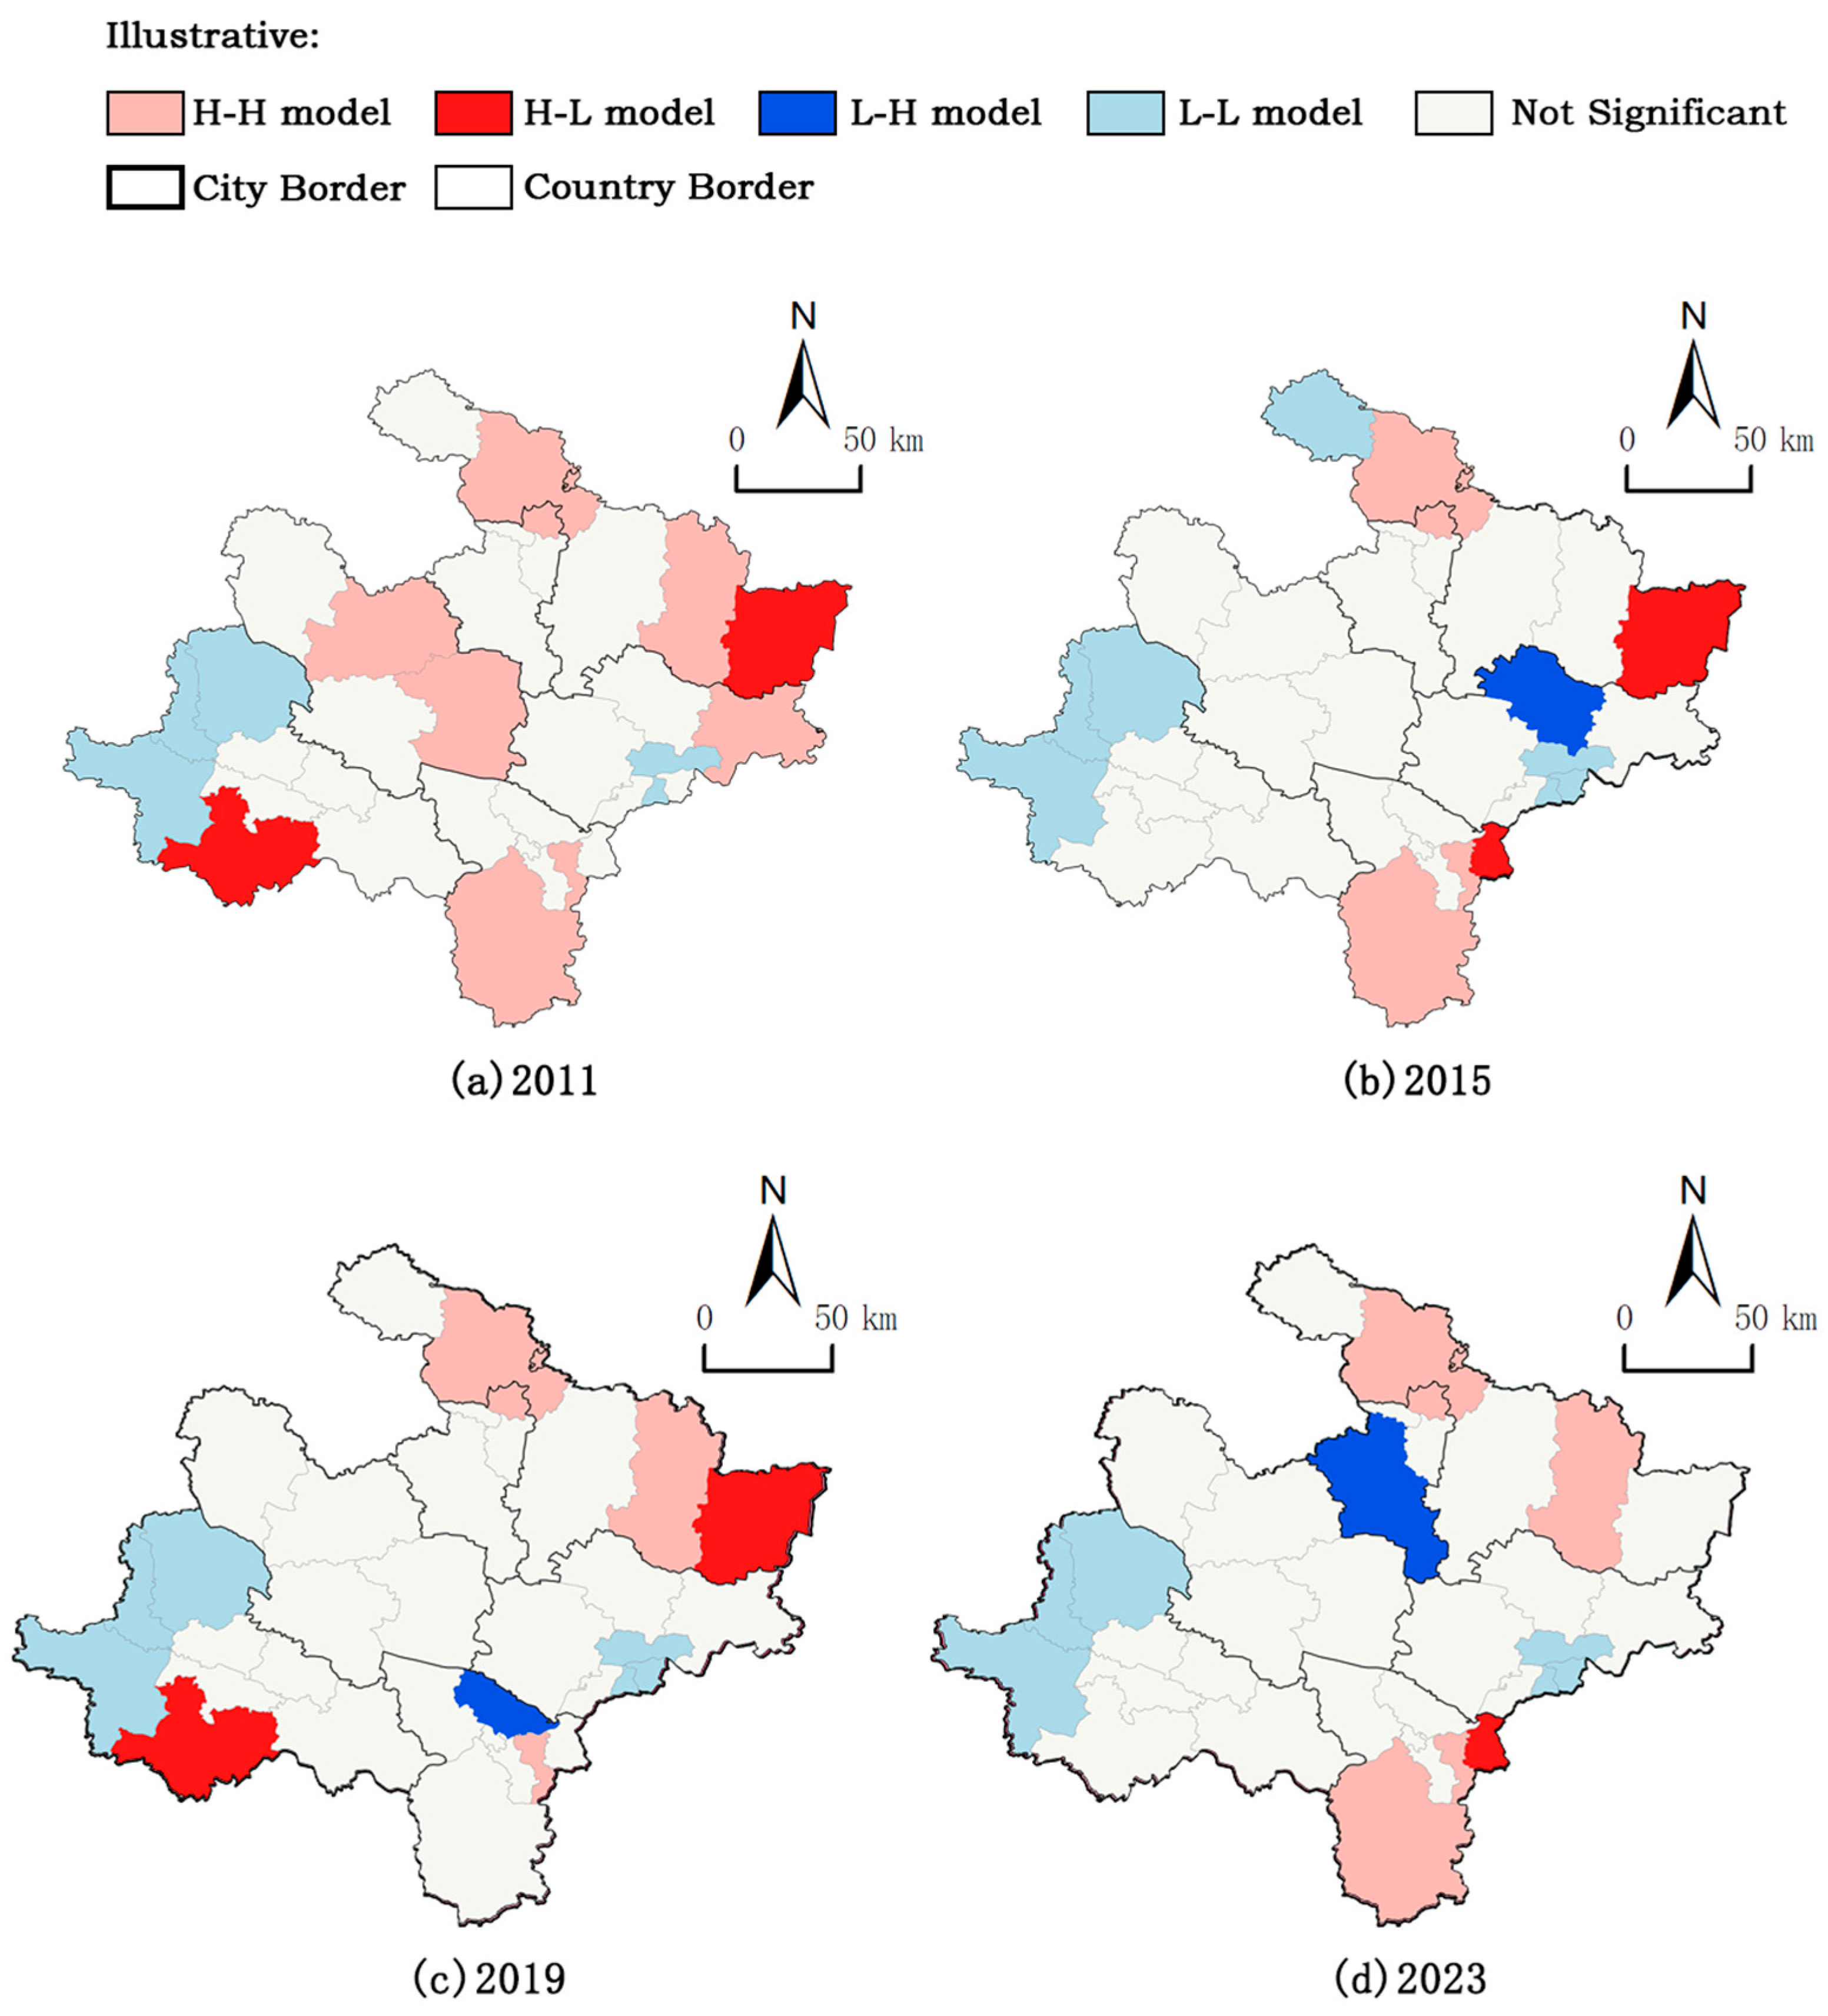
In order to further reveal the local spatial correlation pattern of rural transformation in Northern Anhui, this study employed a local Moran’s I to identify the spatial agglomeration type of county units from 2011 to 2023, and visualized the expression through ArcGIS (Figure 5). The spatial pattern was classified into five types [45]: (1) high–high agglomeration type (H-H), indicating mutual high development; (2) low-high agglomeration type (L-H), showing low value surrounded by high values; (3) low–low agglomeration type (L-L), reflecting mutual low development; (4) high–low agglomeration type (H-L), indicating high value surrounded by low values; and (5) non-significant type, lacking a significant spatial pattern of localized agglomeration or decentralization. The analysis shows that rural transformation in Northern Anhui presents more obvious spatial differentiation and dynamic evolution characteristics.
There are obvious localized spatial agglomeration phenomena at different stages of rural transformation in Southern Anhui, which are mainly manifested in diffusion protection zones (H-H) and development depression area depression zones (L-L) (Figure 6). For spatial distribution, the H-H type is mainly distributed in the east, north, center, and south, with Duji District, Lingbi District, and Shouxian County as the core, which shows a certain growth pole and industrial agglomeration effect. The L-L types are concentrated in some western and southeastern districts and counties, such as Lingquan County, Taihe County, and Huashang District, reflecting a certain degree of marginalization and lagging effects within these areas. H-L is found in western and eastern areas, such as Funan County and Siachen County in Huaishang District, indicating pronounced gradient differences and transitional dynamics, highlighting industrial transfer and radiation effects. Notably, the L-H type in districts and counties, such as Suixi County and Panji District, exhibits a “wave-peak” distribution reflecting the “depression phenomenon” in the region. This reflects the “depression phenomenon” in the region, which fails to effectively receive industrial radiation and technological overflow from neighboring districts, leading to marginalization. In addition, the range of non-significant regions has expanded during 2019–2023, mainly in the central regions such as Lixin County and Fengtai County, indicating that they are weakly affected by the spatial influence of neighboring regions and have strong independence, and that the internal differentiation of the Northern Anhui region has gradually come to the fore.
The analysis of the regional spatial pattern shows that there is a spatial proximity effect on the level of rural transformation in the counties and districts of Northern Anhui, and that their spatial types have gradually evolved from the early period, which was dominated by H-H and L-L agglomerations, into the coexistence of a variety of types, and the emergence of a region characterized by H-L, which strengthens the development pattern of “multi-pole synergy and axial band linkage”.

3.2. Analysis of Influence Mechanism

3.2.1. Factor Detection

In order to identify the main factors affecting rural transformation and development in Northern Anhui, the drivers for 2011–2023 were analyzed using a geodetector. As shown in Table 5, investment efficiency (X8), economic development level (X9), industrialization (X6), transportation accessibility (X4), and fiscal revenue level (X11) were identified as the key influencing factors, appearing in the top five rankings across multiple study years. Higher q-values indicate stronger explanatory power for rural transformation levels, underscoring these variables’ crucial role in promoting spatial differentiation within the region.
Among them, investment efficiency (X8) consistently ranked in the top three, with high q-values, indicating strong explanatory power for spatial changes in rural transformation and development. This is attributed to financial support to strengthen rural infrastructure, expand production, and modernize agriculture, thus improving the production and living conditions of the rural population. Industrialization (X6) maintained significant influence from 2015 to 2023 (ranging from 0.562 to 0.399), reflecting the important role of industrial transformation. Economic development level (X9) demonstrated stable explanatory power with a high q-value (above 0.480) after 2019, highlighting its fundamental role in rural transformation. Transportation accessibility (X4) showed consistent influence (ranging from 0.355 to 0.405), underscoring the importance of infrastructure connectivity in rural development. Notably, fiscal revenue level (X11) emerged as a crucial factor, ranking first in 2011 and maintaining strong explanatory power, indicating local fiscal capacity’s vital role in public investment and service provision.
In contrast, proximity to the city center (X3) demonstrated relatively lower explanatory power (ranging from 0.098 to 0.240), suggesting that, while urban proximity influences rural transformation, it is not among the most dominant drivers in this regional context. The improvement of transportation infrastructure and the enhancement of local fiscal capacity appear more crucial to the development and transformation of agriculture and rural areas in traditional regions.

3.2.2. Interaction Detection

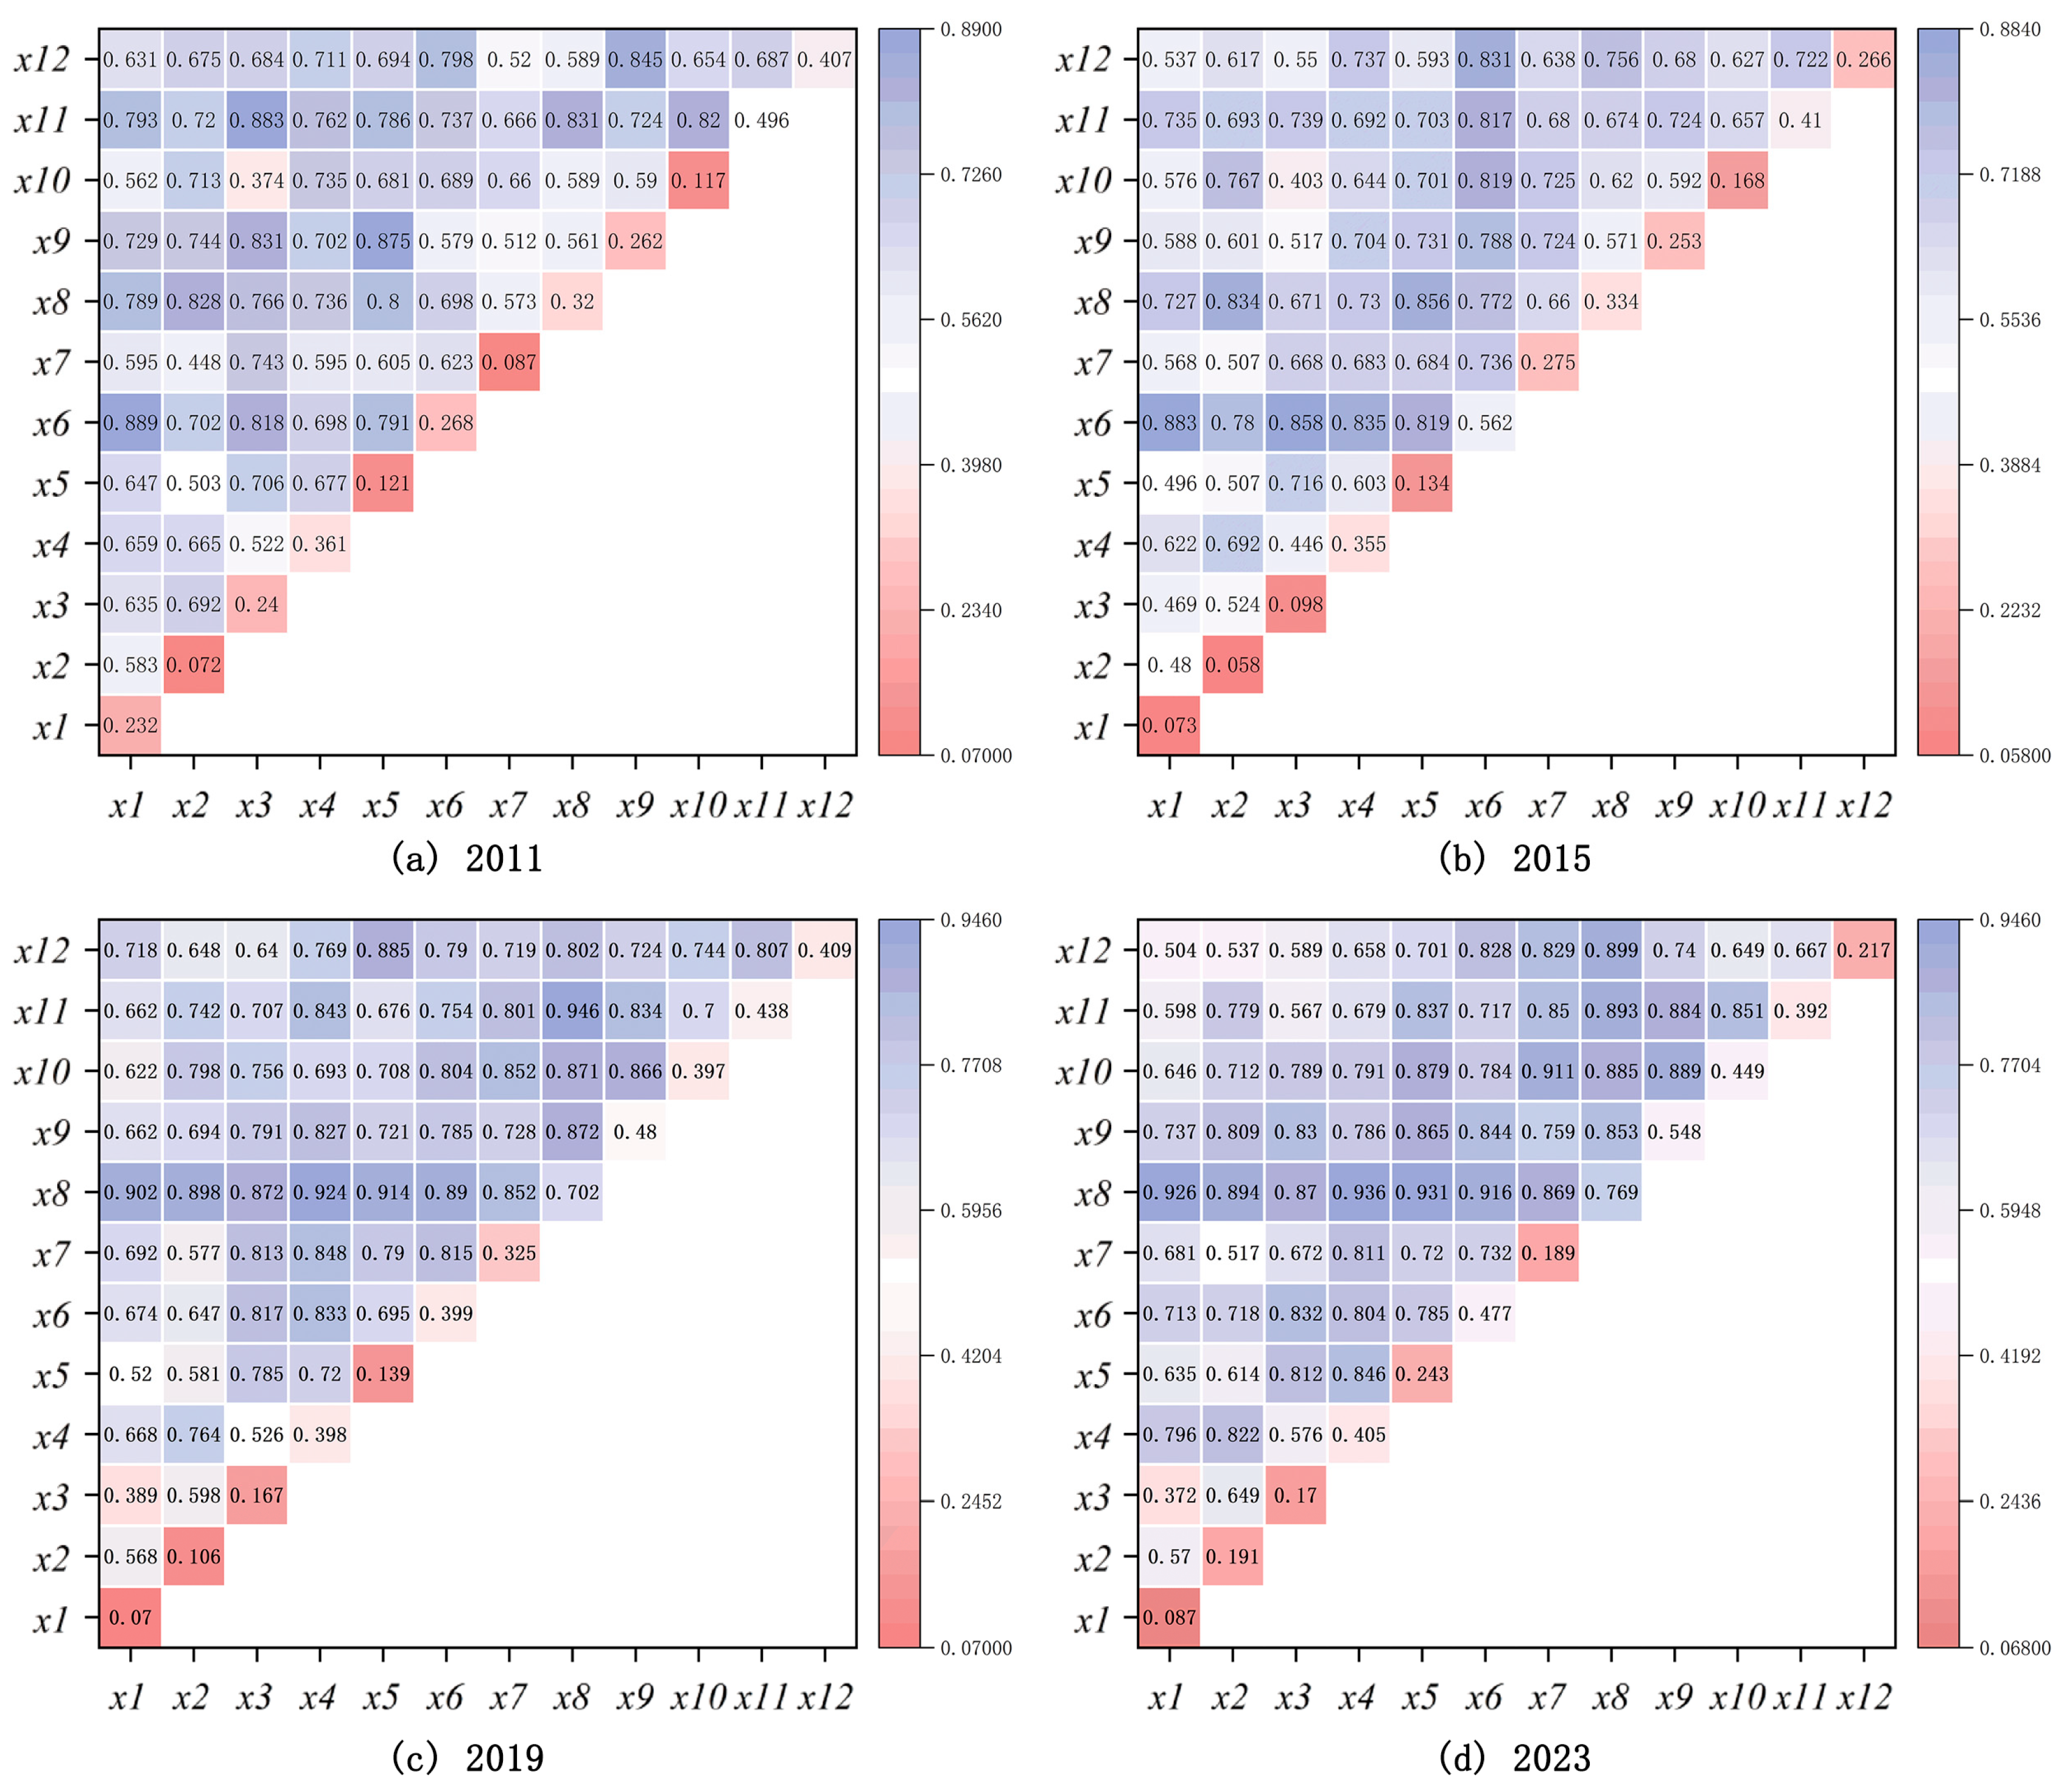
To assess the extent to which the interactions between factors affect rural transformation and development, we analyzed the interaction effects of 12 drivers in 2011, 2015, 2019, and 2023 (Figure 7). All interactions exhibited enhancement relationships, manifesting as either two-factor or nonlinear enhancement, indicating that the combined explanatory power of any two interacting factors on rural transformation and development exceeds that of any single factor alone.
An analysis of synergistic effects revealed that industrialization (X6) demonstrated the strongest synergistic impact in 2011 and 2015, with q-values exceeding 0.60, while investment effectiveness (X8) showed the strongest synergistic effect in 2019 and 2023. Similarly, economic development level (X9) and other factors, particularly fiscal revenue level (X11), showed q-values generally above 0.70, indicating robust synergistic drivers of rural transformation. The interaction between industrialization (X6) and talent support (X12) emerged as particularly significant, reflecting how industrial upgrading and human capital accumulation jointly drive development.
Conversely, slope (X1) exhibited limited individual explanatory power, yet its interactions with traffic accessibility (X4) and economic development level (X9) significantly enhanced its influence. This pattern indicates that, while topographical constraints alone may hinder development, their negative effects can be substantially mitigated through strategic investments in transportation and economic diversification.
Additionally, although the one-factor effect of agricultural modernization (X7) was small during the study period, its q-value increased significantly when interacting with industrialization (X6) and level of economic development (X9), demonstrating a synergistic mechanism of “technology infusion–market expansion–productivity enhancement.” This indicates that industrial advancement provides technological support for agriculture, while economic growth expands market demand and enables infrastructure investments, collectively overcoming the limitations imposed by natural conditions and operational scale.
These interactions collectively form a multi-level synergistic mechanism that integrates factor upgrading, structural optimization, and institutional guarantee. Specifically, industrialization (X6) and talent support (X12) contribute technology and human capital; economic development (X9) and consumption upgrading (X10) facilitate industrial transformation and demand restructuring; and fiscal revenue (X11) and investment efficiency (X8) enhance infrastructure and public services. Additionally, significant enhancement effects are observed in interactions among other factors, such as between the distance to Hefei City (X5) and economic development level (X9), as well as between cultivated land holdings per capita (X2) and agricultural modernization (X7). These findings underscore that the spatial heterogeneity of rural transformation in Northern Anhui stems from the cumulative and interactive effects of multiple drivers, rather than from the influence of any single factor. Overall, the results highlight the importance of adopting integrated policy measures that leverage synergistic effects among factors.

4. Discussion

4.1. Theoretical and Methodological Novelty

This research contributes to the existing literature on rural transformation in several significant ways, particularly in the context of traditional agricultural areas in developing countries.
First, this study is innovative in its choice of regions. Existing studies on rural transformation have mostly focused on macro-regions [23], developed coastal areas [24], or poverty-stricken mountainous regions [25], neglecting the internal differences of agricultural areas. As a major national grain-producing area and the core area of the Yellow–Huaihai Plain, Northern Anhui, with its agriculture-dominated economic structure, unique resource conditions, and bottlenecks, provides a highly representative sample for the study of rural transformation [31]. By providing a meticulous, county-scale analysis of this region, our study effectively bridges the gap of insufficient research on the internal differences of agricultural areas, not only profoundly revealing the internal mechanism of agricultural areas but also providing an important reference for similar areas.
Second, this study demonstrates substantial innovation in its theoretical framework. Previous research often employed fragmented perspectives, analyzing single dimensions such as land use [11,12] in isolation. In the theoretical framework of this study, we have changed the previous limitations of focusing on a single dimension, such as land or economy, and constructed a “population-land-industry-society” analysis system that effectively captures the systemic and complex nature of rural transformation. On this basis, the research framework of “Pattern-Mechani-Regulation” is further proposed: at the pattern level, the spatial pattern of “central high–peripheral low” and the evolution path of spatial clustering are revealed through district and county scale analysis; at the mechanical level, the nonlinear synergistic effect of each key factor is empirically demonstrated by geographic detectors, revealing the driving principle of degree–dynamics coupling. At the regulation level, the system of zoning policies is proposed based on the spatial heterogeneity, which provides a systematic theoretical support and operational decision-making framework for the governance of the transformation of the agricultural areas.
Third, the AHP–entropy weighting method was applied in a comprehensive manner to determine indicator weights [36,38]. This approach effectively balances subjective and objective assignments, thereby increasing the scientific rigor and reducing the potential biases that may result from using either method alone. In addition, the combined use of Exploratory Spatial Data Analysis (ESDA) and geoprobe models not only visualizes the spatio-temporal patterns but also robustly quantifies the drivers and their interactions. This triangulation of methods provides a more reliable and nuanced analysis than studies relying on a single statistical technique.
In conclusion, the novelty of this research lies not in isolated elements but in the synergistic combination of a critical case study region, a purpose-built theoretical framework, and an integrated methodology. This method effectively addresses research issues related to internal heterogeneity, key driving factors, and their interactions, and formulates targeted policies, providing a comprehensive solution to the knowledge gap in rural transformation research in traditional agricultural areas.

4.2. Interpretation and Comparison of Key Findings

This study found that the rural transformation index in Northern Anhui increased from 2011 to 2023 and showed a spatial pattern of “high in the center and low in the periphery,” with significantly narrowing disparities between counties and districts. This is similar to the findings of other agricultural regions [23]. The micro-mechanisms at the district and county levels reveal that H-H type areas mostly correspond to early industrialized areas (e.g., Datong District) or policy-advantageous areas, while L-L type areas are concentrated in regions with a strong dependence on agricultural paths and a weak industrial base. This demonstrates that rural transformation follows spatially heterogeneous pathways requiring tailored policy interventions. For high-value clusters (H-H) that function as regional growth poles, policy should focus on sustaining the growth momentum through industrial upgrading and enhanced regional connectivity to amplify their radiation effects. Conversely, for low-value clusters (L-L) that face challenges of marginalization and path dependence, targeted interventions must prioritize precision investments in agricultural modernization, poverty alleviation, and critical infrastructure to break the cycle of underdevelopment. The transitional zones exhibiting mixed clustering patterns require policies that either remove barriers to receiving economic radiation or ensure that their growth benefits wider hinterlands.
From the results of the driver identification analysis, investment efficiency (above 0.330), economic level (above 0.250), industrialization (above 0.260), and transportation accessibility (above 0.355) are consistent with established studies [28,46]. However, the time-series analysis using the geodetector shows the dynamic evolution of their relative importance: for example, investment efficiency (0.769 in 2023) became the top driver in 2019 and 2023, reflecting the maturation of policy instruments such as the National Precision Poverty Reduction Strategy and the Rural Revitalization Fund and directing precision investments into rural infrastructure and capacity building. This finding adds nuance to previous research that may have prioritized industrialization alone. The factor interaction analysis further indicates key synergistic effects among these factors, emphasizing that effective policies must adopt a comprehensive approach. Unlike isolated interventions, coordinated policy packages that simultaneously address infrastructure development, industrial transformation, and fiscal capacity building will yield the greatest impact, offering valuable insights for formulating differentiated yet synergistic development strategies in traditional agricultural regions worldwide.

4.3. Policy Implications and International Relevance

The findings have important implications for policymaking. Significant spatial heterogeneity calls for differentiated strategies rather than one-size-fits-all policies. High-agglomeration regions should focus on promoting innovation and industrial upgrading to maintain their leadership role. Other regions could prioritize improving infrastructure connectivity, increasing the efficiency of investments in agricultural modernization, and fostering local industries that build on agricultural strengths. This is also relevant for a large number of medium-sized countries around the world. These countries often have large agricultural areas and generally face the challenges of poverty, outmigration, and lag. The practice in Northern Anhui, China, shows that:
(1).
Targeted investment: Strategic investment in infrastructure, agricultural science and technology, and rural public services, especially in areas with low market incentives, is needed to drive transformation;
(2).
Integration of agricultural modernization and industrial diversification: while improving agricultural production efficiency, selective industrial and tertiary industries are used to create non-farm employment, echoing the multi-factor “synergy” mechanism;
(3).
The importance of spatial planning: relying on high-value growth poles, strengthening their linkages with neighboring regions, and promoting regional balance;
(4).
Multi-factor integrated approach: successful transformation relies on synergizing the drivers of investment, industry, infrastructure, and human capital, rather than on isolated interventions by a single sector.

4.4. Limitations and Future Research Prospects

This study has some limitations. First, although county-level data is conducive to macro analysis, it may mask internal differences at the township or village level. The essence of transformation is localized and requires a more refined scale of exploration. Second, although the selection of indicators is relatively comprehensive, qualitative dimensions such as cultural protection, ecological quality, and grassroots governance can be included to more comprehensively reflect the connotation of sustainable transformation. In addition, the study identified driving factors and correlations, but causal mechanisms need to be further validated through case studies or in-depth interviews.
Future research can be expanded in the following directions: delving deeper into the village and farmer levels at the scale, analyzing micro mechanisms and behavioral responses; integrate diverse data, such as big data on farmers’ perceptions, environmental indices, and digital infrastructure; construct forward-looking scenarios to simulate the long-term impact of different policies on rural sustainability; and conduct comparative research on traditional agricultural areas in China and abroad and distinguish universal laws and regional differences.

5. Conclusions

Based on the comprehensive spatial and temporal analysis of the Northern Anhui region from 2011 to 2023, this study draws the following conclusions:
(1).
Stable but differentiated transformation: Over the past decade, the level of rural transformation in the Northern Anhui region has shown a clear and overall upward trend (over 35% growth). However, the spatial pattern has been uneven, with a predominantly low level in the early period gradually evolving into a structure of “high in the center and low in the periphery”, and the differences between counties have narrowed;
(2).
Spatial dependence: There is a strong positive spatial autocorrelation in Northern Anhui, and the local spatial analysis reveals a stable pattern of coexistence of high-value aggregation and low-value aggregation zones, reflecting the influence of initial conditions and spatial spillovers;
(3).
Importance of driving factors and synergistic mechanisms: investment efficiency, economic level, industrialization, and transportation accessibility are the key factors driving the transformation. Factor interactions show a nonlinear enhancement effect, indicating that multi-factor synergy is a more important driver than a single factor, and that transformation needs to rely on integrated policies rather than isolated measures.
In summary, rural transformation in agricultural areas is a complex and spatially embedded process driven by economic, industrial, and infrastructure factors. This study provides empirical evidence for the development of differentiated and measured policies in Northern Anhui and similar regions, which will help promote the revitalization of rural areas.

Author Contributions

Conceptualization, J.L. and H.S.; methodology, J.L., C.Z., and H.S.; software, J.L.; validation, J.L., C.Z., and H.S.; data curation, J.L., C.Z., and H.S.; writing—original draft preparation, J.L.; writing—review and editing, T.X., K.G. and S.Z.; visualization, J.L.; supervision, T.X.; funding acquisition, T.X. and K.G. All authors have read and agreed to the published version of the manuscript.

Funding

This research was funded by the Ministry of Education of the People’s Republic of China Humanities and Social Sciences Research Project, grant number 24YJA630025.

Institutional Review Board Statement

Not applicable.

Informed Consent Statement

Not applicable.

Data Availability Statement

The data that support the findings of this study are available from Anhui Jianzhu University, School of Architecture and Planning, but restrictions apply to the availability of these data, which were used under license for the current study, and so are not publicly available. Data are, however, available from the authors upon reasonable request and with permission of Anhui Jianzhu University, School of Architecture and Planning.

Conflicts of Interest

The authors declare no conflict of interest.

References

  1. Liu, Y.S. Rural Transformation Development and New Countryside Reconstruction in Eastern Coastal China. Acta Geogr. Sin. 2007, 62, 563–570. [Google Scholar]
  2. Zhang, Q.; Zhang, H.C.; Liu, Z.F. Rural Revitalization: Strategic Choice from Decline to Revival. Econ. Manag. 2018, 32, 6–11. [Google Scholar]
  3. He, Y.X. Theoretical Connotation and Practical Mode of Rural Transformation in China. Agric. Econ. J. 2023, 433, 37–39. [Google Scholar]
  4. Li, Y.H.; Yan, J.Y.; Wu, W.H.; Liu, Y.S. Transformation History and Sustainable Development Outlook of the World’s Countryside. Adv. Geosci. 2018, 37, 627–635. [Google Scholar]
  5. Han, F.; Cai, J.M. The Morphological Evolution and Reconstruction of Rural Settlements in Semi-Urbanized Areas of China. Geogr. Res. 2011, 30, 1271–1284. [Google Scholar]
  6. Hao, H.; Xin, L. International Experience of Integrated Development of Rural Tertiary Industry and Its Enlightenment to China. Agric. Econ. J. 2023, 12, 107–109. [Google Scholar]
  7. Du, Y.H. The Inner Logic and Governance Mechanism of Urban-Rural Economic Imbalance. Ph.D. Thesis, Southwest University of Finance and Economics, Chengdu, China, 2022. [Google Scholar] [CrossRef]
  8. Sun, J.W.; Liu, Y.S.; Gao, D.Z.; Lu, Y.Q.; Niu, B. Synergistic Mechanism of Comprehensive Land Management and Rural Transformation and Development in Plains Agricultural Areas. J. Geogr. 2022, 77, 1971–1986. [Google Scholar]
  9. Yang, H.; Zhai, S.X.; Wang, Y.Q. Empowering the Transformation of Rural Industries through Comprehensive Land Consolidation: Theoretical Logic and Practical Pathways. Planners 2025, 41, 48–55. [Google Scholar]
  10. Liu, Y.S.; Yang, R. Measuring the Transformation Pattern of Urban-Rural Development in China’s Bohai Rim. J. Geogr. 2015, 70, 248–256. [Google Scholar]
  11. Long, H.L.; Chen, K.Q. Land Use Transformation and Urban-Rural Integration Development Based on Land System Science. J. Geogr. 2021, 76, 295–309. [Google Scholar]
  12. Long, H.L. Land Use Transitions and Rural Restructuring in China; Springer: Singapore, 2020. [Google Scholar]
  13. Hu, S.G.; Tong, L.Y.; Long, H.R. On the Theoretical Framework of Land Use Transformation Potential and Its Evaluation. Geogr. Res. 2019, 38, 1367–1377. [Google Scholar]
  14. Su, K.C.; Yang, Q.Y.; Zhang, B.L.; Zhang, Z.X. The Coupling Mechanism Between Rural Land Use Transition and Small-Scale Peasant Economy Change in Mountainous Areas. Geogr. Res. 2019, 38, 2593–2602. [Google Scholar]
  15. Yang, R.; Chen, Y.C.; Gong, J.Z. Sorting out the rural development process and geographical patterns in the Pearl River Delta region under the perspective of transformation. Geogr. Res. 2019, 38, 725–740. [Google Scholar]
  16. Long, H.; Qu, Y. Land use transitions and land management: A mutual feedback perspective. Land Use Policy 2018, 74, 111–120. [Google Scholar] [CrossRef]
  17. Tu, S.S.; Long, H.L.; Zhang, Y.N.; Ge, D.Z.; Qu, Y. Rural restructuring at village level under rapid urbanization in metropolitan suburbs of China and its implications for innovations in land use policy. Habitat Int. 2018, 77, 143–152. [Google Scholar] [CrossRef]
  18. Woods, M. Rural cosmopolitanism at the frontier? Chinese farmers and community relations in northern Queensland, c. 1890–1920. Aust. Geogr. 2018, 49, 107–131. [Google Scholar] [CrossRef]
  19. Sudaryanto, T.; Purba, H.J.; Rachmawati, R.R.; Erwidodo; Dermoredjo, S.K.; Yusuf, E.S.; Nuryantono, N.; Pasaribu, S.H.; Amalia, S.; Amin, M. Three decades of agricultural and rural transformation in Indonesia. IOP Conf. Ser. Earth Environ. Sci. 2021, 892, 012056. [Google Scholar] [CrossRef]
  20. Yang, R.; Liu, Y.S.; Long, H.L. Characteristics of synergistic evolution of population-land-industry non-agriculturalisation transition in China’s Bohai Rim. Geogr. Res. 2015, 34, 475–486. [Google Scholar]
  21. Cheng, M.Y.; Liu, Y.S. Spatial Pattern of Non-Agriculturalised Land and Its Influencing Factors in the Huanghuaihai Plain. Geogr. Res. Dev. 2019, 38, 170–176. [Google Scholar]
  22. Zheng, Z.Y.; Liao, H.P.; Yang, W.; Zhao, Z.Y. On Type Division and Pattern Characteristics of the Rural Areas in Chongqing—Based on the Rural Development Level and Transition Assessment. J. Southwest Univ. Nat. Sci. Ed. 2018, 40, 104–112. [Google Scholar]
  23. Li, T.T.; Long, H.L. Spatio-Temporal Pattern of Rural Transformation and Development in Shandong Province. Geogr. Res. 2014, 33, 490–500. [Google Scholar]
  24. Liu, S.F.; Dai, W.Y.; Bao, X.Y.; Huang, W.L.; Wu, G.S. Characteristics of the Evolution of Spatio-Temporal Pattern of Rural Transformation and Development in Developed Coastal Areas: Taking Southeast Fujian as an Example. Hum. Geogr. 2023, 38, 139–147. [Google Scholar]
  25. Shi, Y.Z.; Zhao, L.L.; Zhao, X.Y.; Lan, H.X. Spatio-Temporal Pattern and Evolution Mechanism of Rural Transformation Based on Institutional Transformation: Taking Yuzhong County of Gansu Province as an Example. Prog. Geogr. Sci. 2022, 41, 2311–2326. [Google Scholar] [CrossRef]
  26. Wu, K.S.; Kong, D.Y.; Wang, Y.; Yang, X.J. Spatial Differentiation of Influencing Factors and Their Role Effects of Rural Transformation and Development: Taking Shanxi Province as an Example. J. Nat. Resour. 2022, 37, 2033–2050. [Google Scholar]
  27. Zhang, R.T.; Zhang, X.L.; Lu, J.F.; Li, C.W. Analysis of Spatial and Temporal Differentiation Pattern and Influence Mechanism of Rural Transformation and Development in China. Hum. Geogr. 2021, 36, 138–147. [Google Scholar]
  28. Qu, Y.B.; He, X.H.; Dong, X.Z.; Liu, C.Q.; Yang, Y.; Li, Y.C. Transformation Characteristics and Driving Mechanisms of Different Types of Rural Settlements in Plain Agricultural Areas. Resour. Sci. 2025, 47, 68–83. [Google Scholar]
  29. Chen, H.; Yu, B.; Guo, X.W.; Ren, J.H. Analysis of the Characteristics and Influencing Factors of Rural Transformation in Typical Counties of Jianghan Plain. J. Hubei Univ. Nat. Sci. Ed. 2023, 45, 73–81. [Google Scholar]
  30. Qiu, J.J.; Benfica, R.; Yu, J. Connotation Characteristics, Driving Mechanism and Realisation Path of Digital Transformation and Upgrading of Rural Industries. J. Northwest Agric. For. Univ. Soc. Sci. Ed. 2023, 23, 53–66. [Google Scholar]
  31. Yao, X.J.; Tong, L.; Li, J.L. Measurement of Agricultural Production Efficiency in Traditional Farming Areas Based on DEA: Taking Northern Anhui as an Example. China Agric. Resour. Reg. Plan. 2020, 41, 131–139. [Google Scholar]
  32. Imran, M.; Tufail, M.; Mo, C.; Wahab, S.; Khan, M.K.; Hoo, W.C.; Ling, Z. From resources to resilience: Understanding the impact of standard of living and energy consumption on natural resource rent in Asia. Energy Strategy Rev. 2025, 57, 101590. [Google Scholar] [CrossRef]
  33. Zhou, J.N.; Qin, F.C.; Liu, J.; Zhu, G.L.; Zou, W. Measurement of Urban-Rural Integration Level, Spatio-temporal Evolution and Influence Mechanism in China from a Multi-Dimensional Perspective. Chin. Popul. Resour. Environ. 2019, 29, 166–176. [Google Scholar]
  34. Chen, S.L.; Wang, D. The Impact Effect and Mechanism of Digital Economy on Economic Resilience. Ind. Technol. Econ. 2022, 41, 26–34. [Google Scholar]
  35. Li, J.; Sun, Y.Y.; Deng, M.M. Development of Small Cities in the High-Speed Rail Era: A Study Based on Population Hollowing Out. J. Financ. Econ. 2021, 47, 154–168. [Google Scholar]
  36. Ma, Y.; Wang, A.Z.; Guo, H.F.; Zhang, Y.R.; Nie, J.Q. Research on the Evaluation Index System of Teacher Education Discipline Cluster Based on AHP. Mod. Educ. Manag. 2021, 7, 81–88. [Google Scholar]
  37. Tian, X. Construction of Teaching Laboratory Evaluation System Based on AHP-Entropy Weight Method. Lab. Res. Explor. 2020, 7, 264–269. [Google Scholar]
  38. Li, L.M.; Yu, Y.; Liu, B.Q. Research on Performance Evaluation of Industry-University-Research Cooperation Innovation in Qingdao Based on AHP-Entropy Method. Sci. Technol. Manag. Res. 2014, 15, 40–43,49. [Google Scholar]
  39. Jenks, G.F. The Data Model Concept in Statistical Mapping. Int. Yearb. Cartogr. 1967, 7, 186–190. [Google Scholar]
  40. Wu, Z.H.; Li, T. Research on Spatial Distribution of Comprehensive Performance of High-Tech Development Zones: Analysis Based on Natural Breakpoint Method. Stat. Inf. Forum 2013, 28, 82–88. [Google Scholar]
  41. Anselin, L. Spatial Econometrics: Methods and Models; Kluwer Academic Publishers: Dordrecht, The Netherlands, 1988. [Google Scholar]
  42. Chen, Y.G. Theoretical Development and Method Improvement of Spatial Autocorrelation Based on Moran Statistics. Geogr. Res. 2009, 28, 1449–1463. [Google Scholar]
  43. Cao, M.M.; Peng, P.; Wang, X.; Zhou, G.; Zhou, R.; Liu, X. Analysis of Spatial and Temporal Evolution Characteristics of Rural Transformation and Its Influencing Factors in Wuling Mountain Area of Hunan. Resour. Environ. Yangtze Basin 2020, 29, 1930–1940. [Google Scholar]
  44. Wang, J.F.; Xu, C.D. Geographical Detector: Principle and Prospect. Acta Geogr. Sin. 2017, 72, 116–134. [Google Scholar]
  45. Shi, J.G.; Duan, K.F.; Wu, G.D. Measurement of the Level of Urban-Rural Integration and Development in the Yangtze River Delta Region and Its Spatial and Temporal Characterization. J. Tongji Univ. Soc. Sci. Ed. 2022, 33, 78–89. [Google Scholar]
  46. Chen, M.; Zhang, J.J.; Xu, Z.; Hu, X.H.; Hu, D.X.; Yang, G. Does the setting of local government economic growth targets promote or hinder urban carbon emission performance? Evidence from China. Environ. Sci. Pollut. Res. 2023, 30, 117404–117434. [Google Scholar] [CrossRef]
Figure 1. Location of the Northern Anhui Region (Source: Authors).
Land 14 01940 g001
Figure 2. Factors influencing the development of rural transformation (Source: Authors).
Land 14 01940 g002
Figure 3. Temporal evolution of rural transformation development levels across different dimensions in Northern Anhui (2011–2023). (a) Evaluation indicator dimensions. (b) Six municipal dimensions. (c) Districts and counties of Bengbu. (d) Districts and counties of Huaibei. (e) Districts and counties of Huainan. (f) Districts and counties of Bozhou. (g) Districts and counties of Fuyang. (h) Districts and counties of Suzhou (Source: Authors).
Land 14 01940 g003
Figure 4. Spatial distribution of rural transformation development levels in Northern Anhui in 2011, 2015, 2019, and 2023. (a) Spatial distribution in 2011. (b) Spatial distribution in 2015. (c) Spatial distribution in 2019. (d) Spatial distribution in 2023 (Source: Authors).
Land 14 01940 g004
Figure 5. Global Moran’s I scatter plot of rural transformation in Northern Anhui, China in 2011, 2015, 2019, and 2023. (a) Scatter plot in 2011. (b) Scatter plot in 2015. (c) Scatter plot in 2019. (d) Scatter plot in 2023 (Source: Authors).
Land 14 01940 g005
Figure 6. Schematic diagram of agglomeration types in the Northern Anhui region (2011–2023). (a) Agglomeration type in 2011. (b) Agglomeration type in 2015. (c) Agglomeration type in 2019. (d) Agglomeration type in 2023. (Source: Authors).
Land 14 01940 g006
Figure 7. Results of interaction detection of factors influencing rural transformation in Northern Anhui (2011–2023). (a) Interaction detection in 2011. (b) Interaction detection in 2015. (c) Interaction detection in 2019. (d) Interaction detection in 2023. (Source: Authors).
Land 14 01940 g007
Table 1. Classification explanation of data sources (Source: Authors).
Data CategoryData TypeData SourceNotes
Socioeconomic dataSocio-economic dataChina County Statistical Yearbook, Anhui Statistical Yearbook, and Local Yearbooks of Various Cities, Counties, and DistrictsSource of core economic indicators
Supplementary socio-economic dataNational Economic and Social Development Bulletin, Anhui Provincial Bureau of Statistics, Local Statistical WebsiteSupplementary sources of regional and economic data
Population dataLocal Bureau of Statistics and Human Resources ConsultationObtain for specific districts and counties
Three-dimensional spatial dataRaster dataResources and Environmental Science Data Center, Chinese Academy of Sciences (https://www.resdc.cn/ (accessed on 17 April 2025))Urban and rural land use data
Topographic dataGeospatial Data Cloud Platform (https://www.gscloud.cn/ (accessed on 13 May 2025))Elevation and terrain information
Vector dataNational Geographic Information Resource Directory Service System (https://www.webmap.cn/ (accessed on 13 May 2025))Transportation network, administrative divisions, etc.
Table 2. Indicators of transformative rural development (Source: Authors).
Normative LayerIndicator LayerIndex
Properties
Calculation MethodAHP Method WeightingEntropy WeightingCombined Weights
Population transition developmentUrbanization rate (E1)+Urban population/total population0.1180.0710.095
Practitioner structure (E2)+Non-farm workers/total rural workers0.1510.0240.087
Rural–urban income gap (E3)+Per capita disposable income of rural residents/per capita disposable income of urban residents0.1690.0240.096
Transformative land use developmentCultivated land area share (E4)+Cultivated land area/total county area0.0690.0370.053
Rural settlements as a percentage of area (E5)-Area of rural settlements/total area of the county0.0370.1070.072
Proportion of land used for urban construction (E6)+Land area for urban, industrial, and mining construction/total area of the region0.0290.1070.068
Recovery index (E7)-Total sown area of crops/area of arable land0.1100.0100.060
Industrial transformation and developmentShare of output value of secondary and tertiary industries (E8)+Secondary and tertiary output/total output0.1080.0530.081
Gross power of agricultural machinery per capita (E9)+Total power of agricultural machinery/population of primary sector0.0670.0530.060
Percentage of food crops (E10)+Area sown with food crops/total sown area0.0200.0850.053
Agricultural labor productivity (E11)+Agriculture, forestry, and fisheries output/number of people working in agriculture0.0150.0990.057
Social dimensionLevel of electricity consumption by rural residents (E12)+Rural electricity consumption/rural population0.0100.1370.073
Number of full-time teachers per 10,000 population (E13)+Number of full-time teachers/number of secondary school students0.0630.0770.070
Beds per 10,000 population (E14)+Number of beds in health-care institutions/total population0.0340.1160.075
Table 3. Judgment matrix index table (Source: Authors).
Indicator HierarchyMaximum EigenvalueCoherence IndicatorsConsistency Ratio
Normative layer4.06010.020050.0225
Population transition development3.00090.000430.0008
Transformative land use development4.05990.019980.0224
Industrial transformation and development4.10350.03450.0388
Social dimension3.02440.012180.0234
Table 4. Global Moran’s I values.
YearMoran’s IP(I)Z(I)
20110.25740.00033.6126
20150.24060.00073.3938
20190.20600.00332.9410
20230.22920.00123.2494
Table 5. Detection results of rural transformation factors (Source: Authors).
22011.201520192023
Factor Orderingq-ValueFactor Orderingq-ValueFactor Orderingq-ValueFactor Orderingq-Value
X110.496 **X60.562 **X80.702 **X80.769 **
X120.407 **X110.410 **X90.480 **X90.548 **
X40.361 **X40.355 **X110.438 **X60.477 **
X80.320 **X80.334 **X120.409 **X100.449 **
X60.268 **X70.275 **X60.399 **X40.405 **
X90.262 **X120.266 **X40.398 **X110.392 **
X30.240 **X90.253 **X100.397 **X50.243 **
X10.232 **X100.168 **X70.325 **X120.217 **
X50.121 **X50.134 **X30.167 **X20.191 **
X100.117 **X30.098 **X50.139 **X70.189 **
X70.087 **X10.073 **X20.106 **X30.170 **
X20.072 **X20.058 **X10.070 **X10.087 **
Note: ** denotes significance test at 0.01.
Disclaimer/Publisher’s Note: The statements, opinions and data contained in all publications are solely those of the individual author(s) and contributor(s) and not of MDPI and/or the editor(s). MDPI and/or the editor(s) disclaim responsibility for any injury to people or property resulting from any ideas, methods, instructions or products referred to in the content.