Article

Evaluation of the Economic Convenience Deriving from Reforestation Actions to Reduce Soil Erosion and Safeguard Ecosystem Services in an Apulian River Basin

by
Giuliano Rocco Romanazzi
1,
Giovanni Ottomano Palmisano
1,*,
Marilisa Cioffi
2,
Claudio Acciani
1,
Annalisa De Boni
1,
Giovanni Francesco Ricci
1,
Vincenzo Leronni
3,
Francesco Gentile
1 and
Rocco Roma
1
1
Department of Soil, Plant and Food Sciences (DISSPA), University of Bari Aldo Moro, via Amendola 165/a, 70126 Bari, Italy
2
Reagri S.r.l., via Chiatona 62, 74016 Massafra, Italy
3
Green Agency C.C., via A. De Curtis 14/g, 70023 Gioia del Colle, Italy
*
Author to whom correspondence should be addressed.
Land 2025, 14(10), 1936; https://doi.org/10.3390/land14101936
Submission received: 12 August 2025 / Revised: 16 September 2025 / Accepted: 17 September 2025 / Published: 24 September 2025

Abstract

Soil erosion is a widespread problem leading to land degradation in many watersheds, including the Lato Basin, an Apulian permanent river that supplies water used for irrigation in many agricultural territories along the Ionian coast with considerable economic importance for crop production. The loss of fertile soil makes land less productive for agriculture; soil erosion decreases soil fertility, which can negatively affect crop yields. The present research aimed to determine soil loss (t/ha/year) in the Lato watershed in 2024, and then four ecosystem services—loss of carbon, habitat quality, crop productivity and sustainable tourism suitability—directly or indirectly linked to erosion, were defined and evaluated in monetary terms. These ecosystem service evaluations were made for the actual basin land use, and also for two hypothetical scenarios applying different afforestation strategies to the watershed. The first scenario envisages afforestation interventions in the areas with the highest erosion; the second scenario envisages afforestation interventions in the areas with medium erosion, cultivated with cereal crops. Each scenario was also used to evaluate the economic convenience and the effects of sustainable land management practices (e.g., reforestation) to reduce soil erosion and loss of ecosystem services. This study demonstrates that soil erosion is related to land use. It also underlines that reforestation reduces soil erosion and increases the value of ecosystem services. Furthermore, the economic analysis shows that crop productivity is the most incisive ecosystem service, as the lands with high productivity achieve higher economic values, making conversion to wooded areas economically disadvantageous if not supported with economic aid. The results of this study may help development of new management strategies for the Lato Basin, to be implemented through the distribution of community funds for rural development programs that consider the real economic productivity of each area through naturalistic engineering interventions. The reforestation measures need to be implemented over a long time frame to perform their functions; this requires relevant investments from the public sector due to cost management, requesting monetary compensation from EU funds for companies involved in forestation projects on highly productive areas that will bring benefits for the entire community.

1. Introduction

Soil is among the Earth’s most complex biomaterials [1] and is one of the key components in the land-based ecosystem, functioning at the interface between the lithosphere, biosphere, hydrosphere and atmosphere [2]. The soil is a crucial element of ecosystems and earth system functions which are vitally important to meet human needs [3,4,5]. Various studies have emphasized that the majority of the planet’s soil resources are in conditions that can be described as being fair, poor or very poor, and that the principal threat is due to soil erosion; this is mostly caused by water, but also by wind and tillage practices, and soil loss can also be caused by crop harvesting and land degradation [6,7]. In fact, soil degradation is causing increasing concern in Europe since water erosion has so far affected 12% of Europe’s total land area, while 4% has been affected by wind erosion [7].
Not only does soil erosion cause loss of land, but it also leads to water pollution. There are many factors underlying soil erosion, including the geological structure, climatic conditions, land morphology, poor or lack of vegetation cover, and land use. Solid and organic materials are carried in both surface and ground water, and are the principal cause of reduced water volume in the basin, as well as being the principal pollution factors affecting the water and the environment [8].
In order to deal with the present environmental crisis, a reliable means of reducing soil loss is to modify inappropriate land uses and consolidate sustainable land management. This strategy could positively influence the ecosystem services (ESs) directly or indirectly related to the erosive process, and specifically contribute to the restoration of the water balance at the slope and basin level [9], reducing the speed of surface flow.
Forest ecosystems benefit human society by providing a wide range of goods and ESs [10,11,12,13]. These ESs are the benefits that humans obtain from ecosystems, and they are produced by interactions within the ecosystem [11]. Soil functions are linked to ecosystem services (ESs), and there is ample documentation regarding the relationships between ESs and soil biota, carbon, moisture retention and nutrient cycling [14,15,16,17,18,19]. Although different methods have been used to classify ESs [20,21], they all use the following four categories: production/provisioning services, regulating services, habitat/supporting services and information/cultural services, as in [8].
However, most published papers have focused only on some soil-related ESs (provisioning and regulation). Few economic evaluation studies have focused on cultural services, and supporting services have mainly been related to the physical–chemical and biological properties of soil. Furthermore, although research focusing on the evaluation, appraisal and payment of services has become more important since the 1990s [14], and there has been a sharp increase since the 2000s in the number of articles published on ecosystem services (ESs), focusing on the most frequently studied regulatory services, such as carbon sequestration, climate and gas regulation, this research has not always been carried out via monetary valuation.
Similarly, some research has also investigated how the spatial aspects and dynamics of soil properties are related to ESs, using mapping or scenario modeling to simulate future changes; some of this mapping and modeling has made use of environmental variables as a proxy for soil information [22,23,24,25,26]. Of these, the proxy most frequently used in this type of study is land use and land cover (LULC) data [27,28,29,30,31], which proved to be useful in areas for which there is a lack of data [19]. LULC data are often preferred for the production of the spatially distributed biophysical parameter values required for production function models, e.g., many InVEST models [22].
Soil impoverishment, and consequently impoverishment of the related ESs, inevitably has a negative effect on productivity (support services); this could entail risks of extremely high costs of restoration [5,32] leading to further degradation and economic devaluation. There is an abundance of scientific literature underlining that erosion is connected to the loss of ESs [33,34] and indicating the strategies to implement in order to counteract it, thus providing a response to the Common Agricultural Policy (CAP) [26] and 2030 Agenda Sustainable Development Goals (SDGs) alike [27]. Measures aimed at the protection and restoration of soils and at ensuring that their use is sustainable are contained and defined in the European Commission (EC) “Soil Strategy for 2030” [28]. The principal aim of this is that by 2050 all European Union member states will avoid land consumption (zero net land take) and implement concrete actions to make sure that their soils are “healthy” by 2030. In addition, the European Union (EU) Soil Strategy also intends to achieve the following goals by 2050:
  • All European soils are healthy with enhanced resilience, and are able to continue providing their fundamental services (ESs);
  • Net land consumption ceases, and soil pollution returns to levels that do no damage to human health or ecosystems;
  • The protection and management of soils is performed sustainably, including the restoration of soils which at present are degraded.
  • The Soil Strategy document also includes a set of fixed points and actions for implementation in the future, among which are the following:
  • A European law concerning protection of soil health, incorporating the entire strategy;
  • Sustainable soil management, i.e., a European practice for soil management, promoted via some specific actions of the Common Agricultural Policy, in order to share and develop the best management practices for agriculture, with campaigns providing free analysis of agricultural soil;
  • Encouraging organic carbon accumulation in soils to alleviate the impacts of climate change, also via legislation to protect and constrain wetlands and organic soils;
  • Action to prevent desertification by developing a common methodology for the evaluation of its level and the prevention of land degradation (EU Soil Strategy for 2030) [28].
The necessity to assess soil ESs and promote soil–ecosystem linkage when developing land resource policy and management was emphasized by [35,36].
Afforestation interventions appear capable of playing a beneficial role in sustainable management of the basin, which aims to combat soil erosion and protect and enhance ecosystem services. Afforestation reduces soil loss and minimizes landslide risk worldwide. Up to now, numerous revegetation programs have been performed across the world in order to reduce soil erosion by using the positive effects of afforestation on soil properties and microenvironment in terms of reducing runoff and sediment transport rates [37,38,39,40]. A previous study (Liu et al., 2020) has shown that the benefits derived from vegetation restoration are increased by increasing the vegetation cover [33]. However, afforestation projects do not always appear to be economically sustainable, as evidenced by the small area of land afforested through EU programs in the Puglia Region [34,41]. This modest increase in afforested areas is probably due to a general lack of economic sustainability at the farm level, and poor understanding of the economic value of the increase in ESs that forests produce.
The aim of this article is to highlight the importance of appropriate land use management, specifically helping to fill research gaps regarding the economic and monetary evaluation of ESs in the four macrocategories of MEA (Millenium Ecosystem Assessment), with particular attention to cost–benefit analysis, which is useful for understanding the economic viability of implementing changes in land use.
In particular, the present work aims to quantify the erosion process in the Lato River (Puglia Region) and to evaluate the ESs of the entire basin before and after interventions of reforestation, in order to estimate the economic convenience of these sustainable land management practices (e.g., reforestation) to reduce soil erosion and the loss of ESs at the entire watershed scale. Economic convenience is defined as the ability of a reforestation project to generate positive economic value, as the difference between the economic value generated by the project and its implementation cost. Two different scenarios of afforestation (as detailed in Materials and Methods Section 2) were hypothesized, starting from the actual land use (called Scenario 0).
To achieve these research objectives, we identified and monetarily quantified for the actual land use of the basin and for two different scenarios the principal ESs directly and indirectly connected with soil erosion and compared soil loss to the strategies for basin restoration (e.g., reforestation) via a cost–benefit analysis.
The aim of this paper is to underline the importance of correct land use management and economic evaluation of ESs directly and indirectly linked to soil loss for a Mediterranean river in Italy, the Lato River. This river is the main source of agricultural water in the province of Taranto (Puglia Region, Southern Italy) used for crop irrigation.

2. Materials and Methods

2.1. Study Area

The study area is the watershed of the Lato River, situated north-west of Taranto (Figure 1). It has an area of 726 km2 and includes land within the administrative boundaries of each of the municipalities (Table 1).
The basin is also crossed in a north–south direction by a system of canyons connected to the sea through the Lato River system.
From the climatic point of view, the basin has a typical Mediterranean climate with an average temperature of 16.4 °C and a total annual precipitation of 644 mm. The monthly rainfall is not uniformly distributed, as precipitation mainly occurs in autumn and winter.
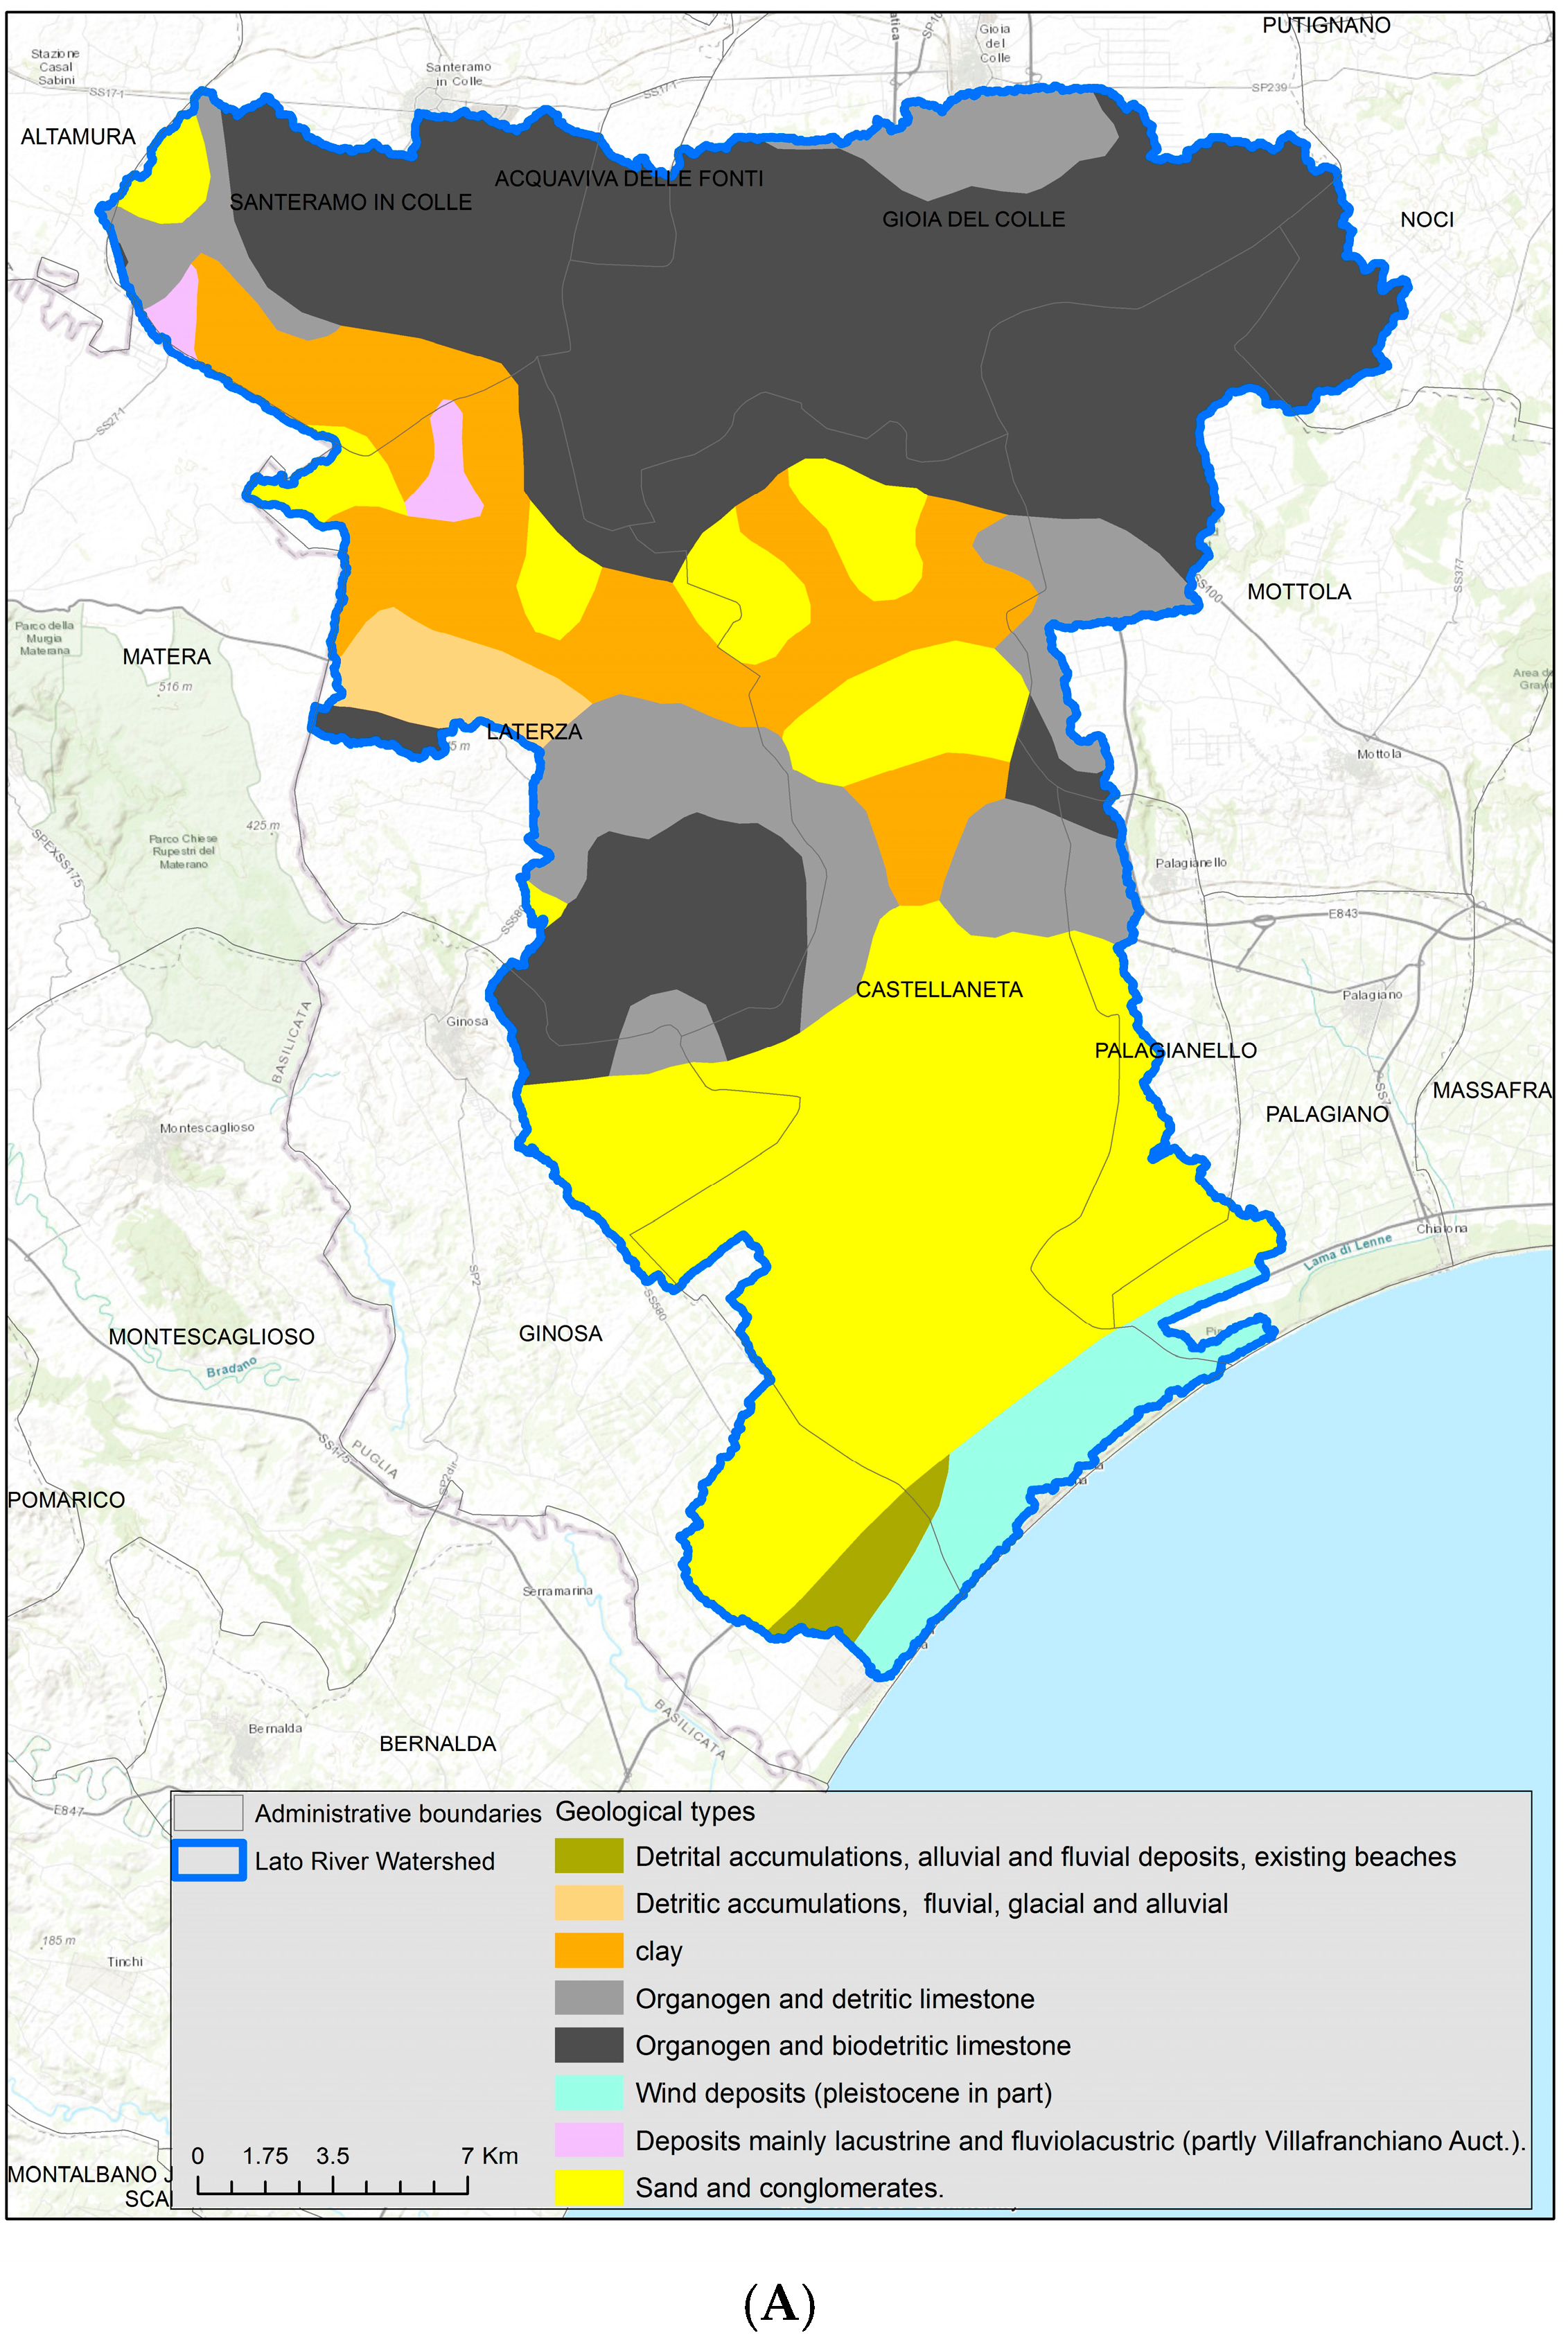
The pattern of runoff and the rate of erosion found in the watershed are conditioned by its (i) geology, (ii) vegetation, (iii) land use and (iv) topography. From the geopedological point of view, the basin is characterized by a predominance of limestone formations in the northernmost part and alluvial deposits and sands in the part closest to the coast (Figure 2A).
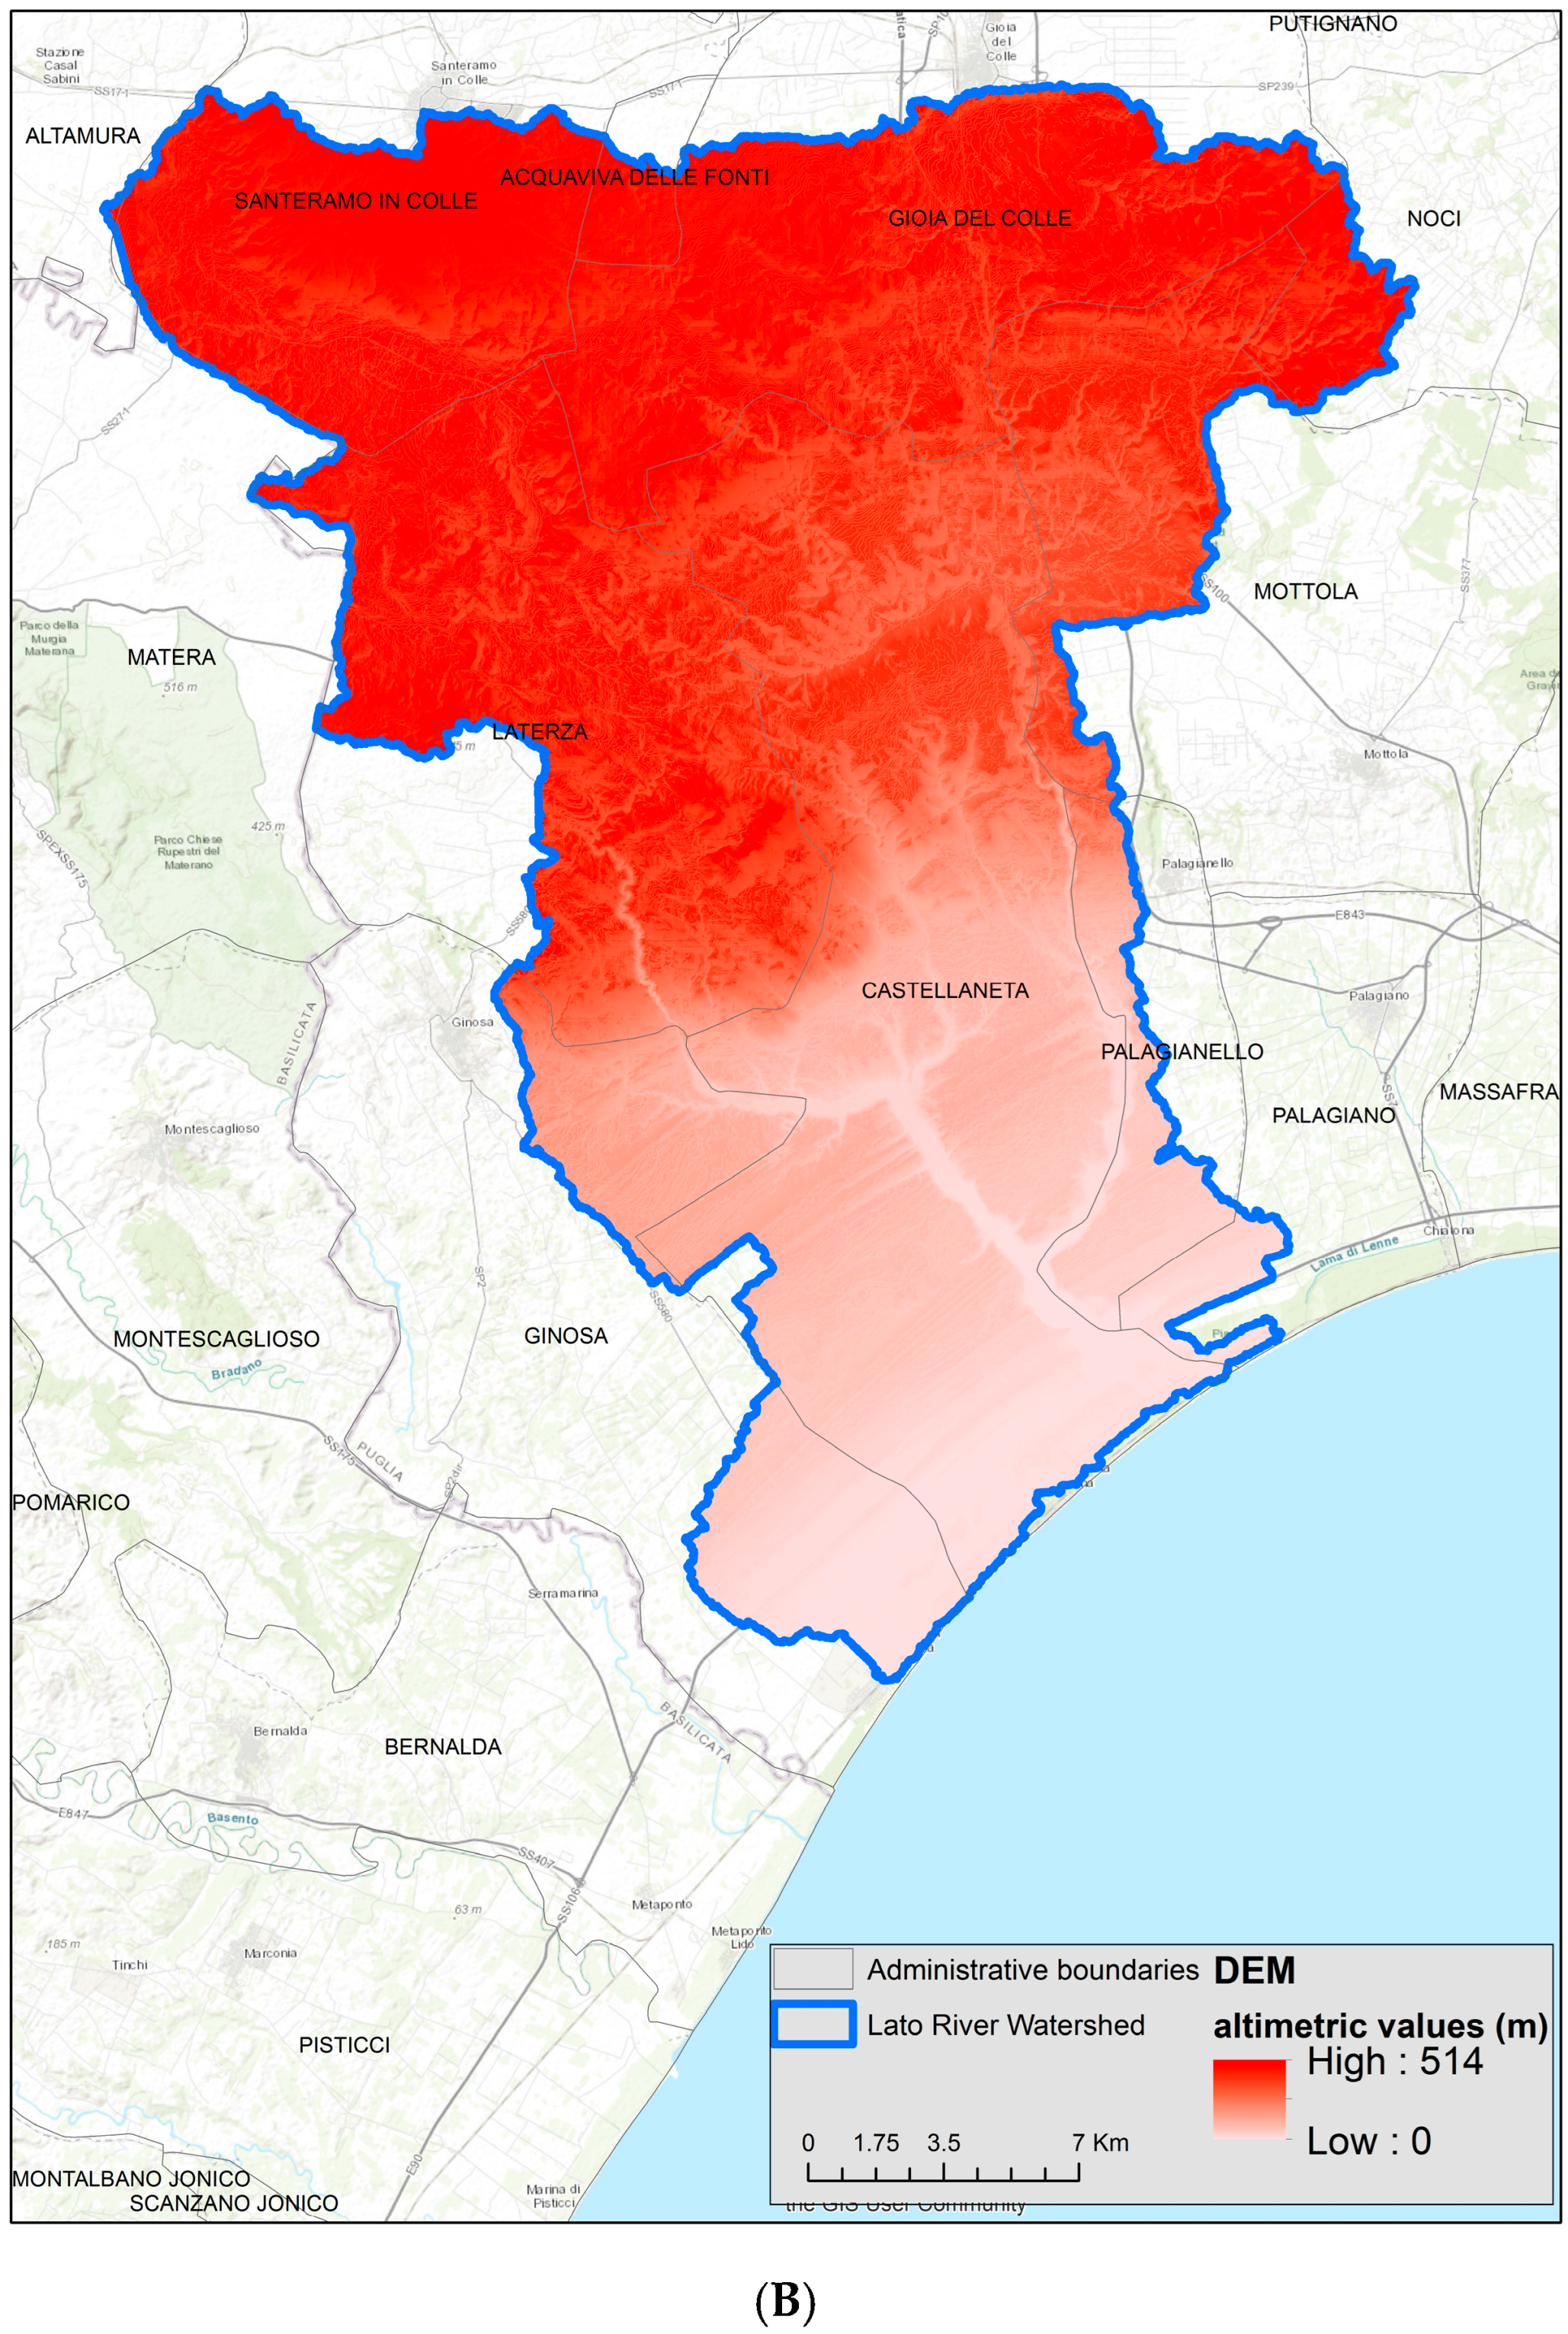
The elevation of the watershed varies from 0 to 514 m a.s.l., with localized intense altitude reductions near the canyons (Figure 2B).
The river basin is partially protected by four special areas of conservation (SACs) defined in the Habitats Directive (92/43/EEC) [42].
The Lato River plays a role in supplying water to agricultural crops in the area of study. The cereal crops of the hinterland are replaced by vineyards, citrus groves and vegetable crops in the areas closest to the sea. In addition, the territory studied also has a significant tourist value of two types: summer bathing on the coast linked to hiking and ecotourism in areas where the canyons are located.
Two different reforestation scenarios were hypothesized in the study area, starting from actual land use at present (Scenario 0):
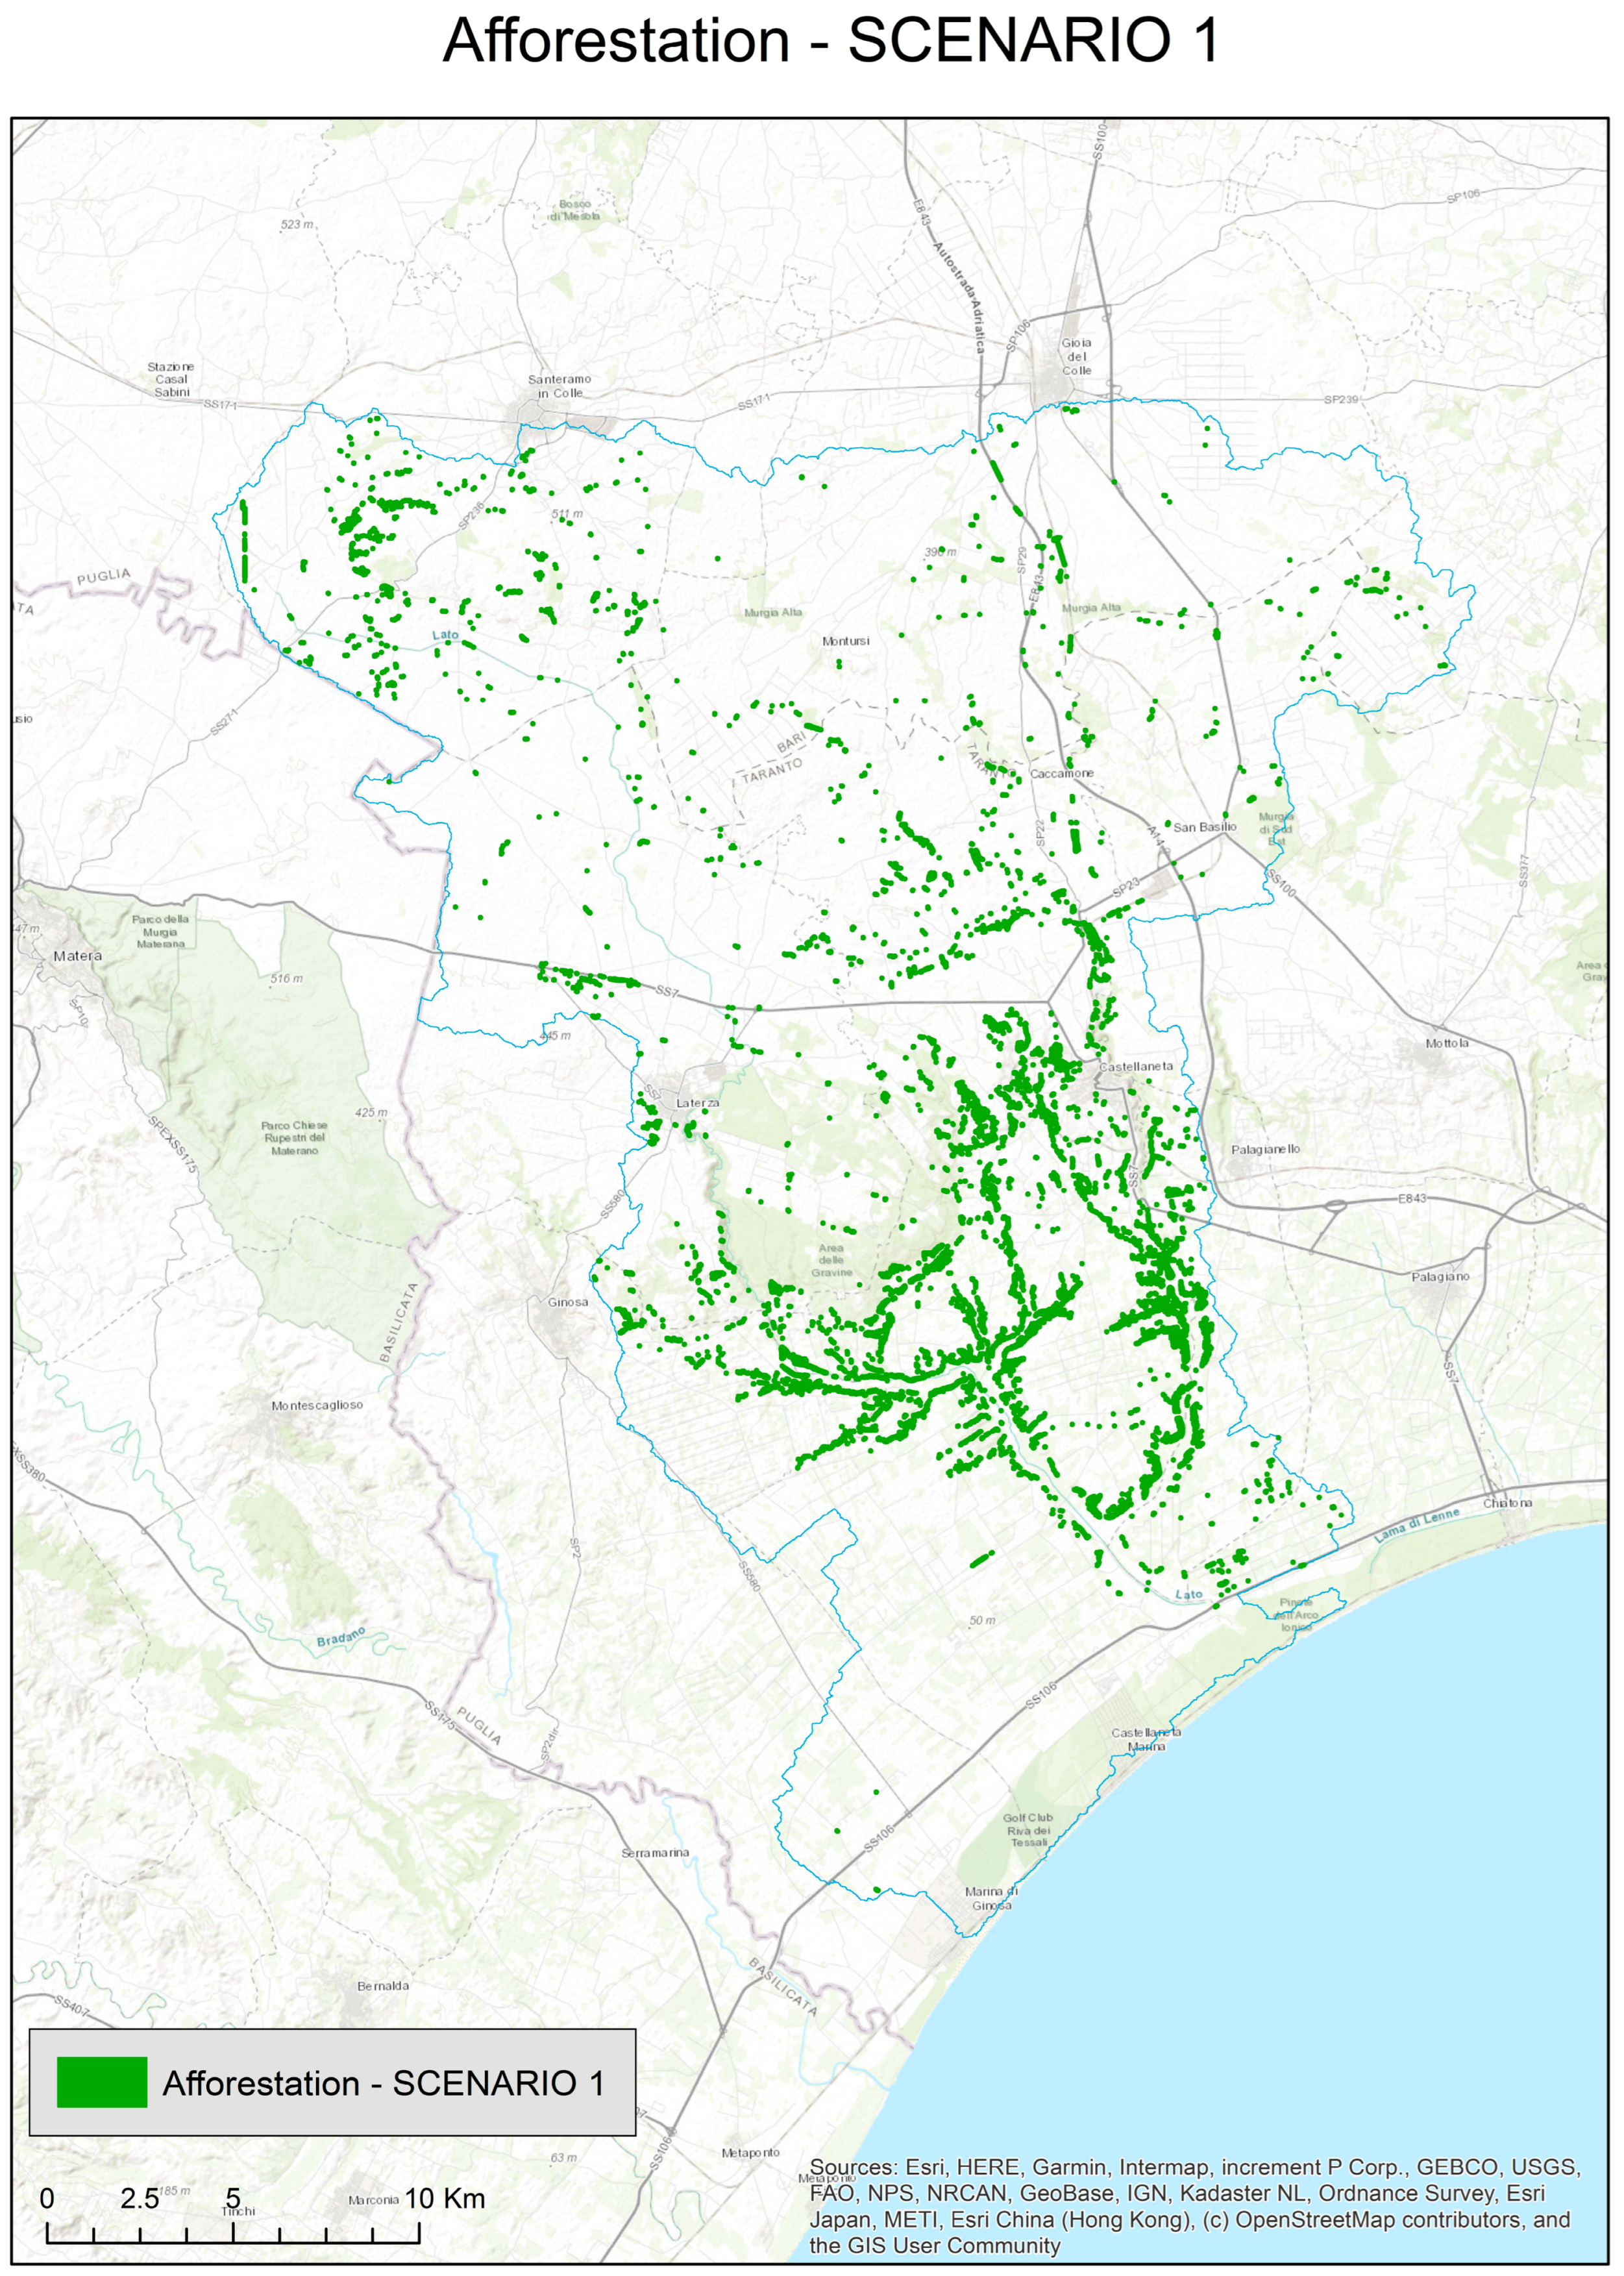
  • Scenario 1: Areas with high erosion (>10 t/ha/year, 284 ha) with the addition of buffer areas of 48 m width. Total afforestation area = 3500 ha (Figure A1, Appendix A).
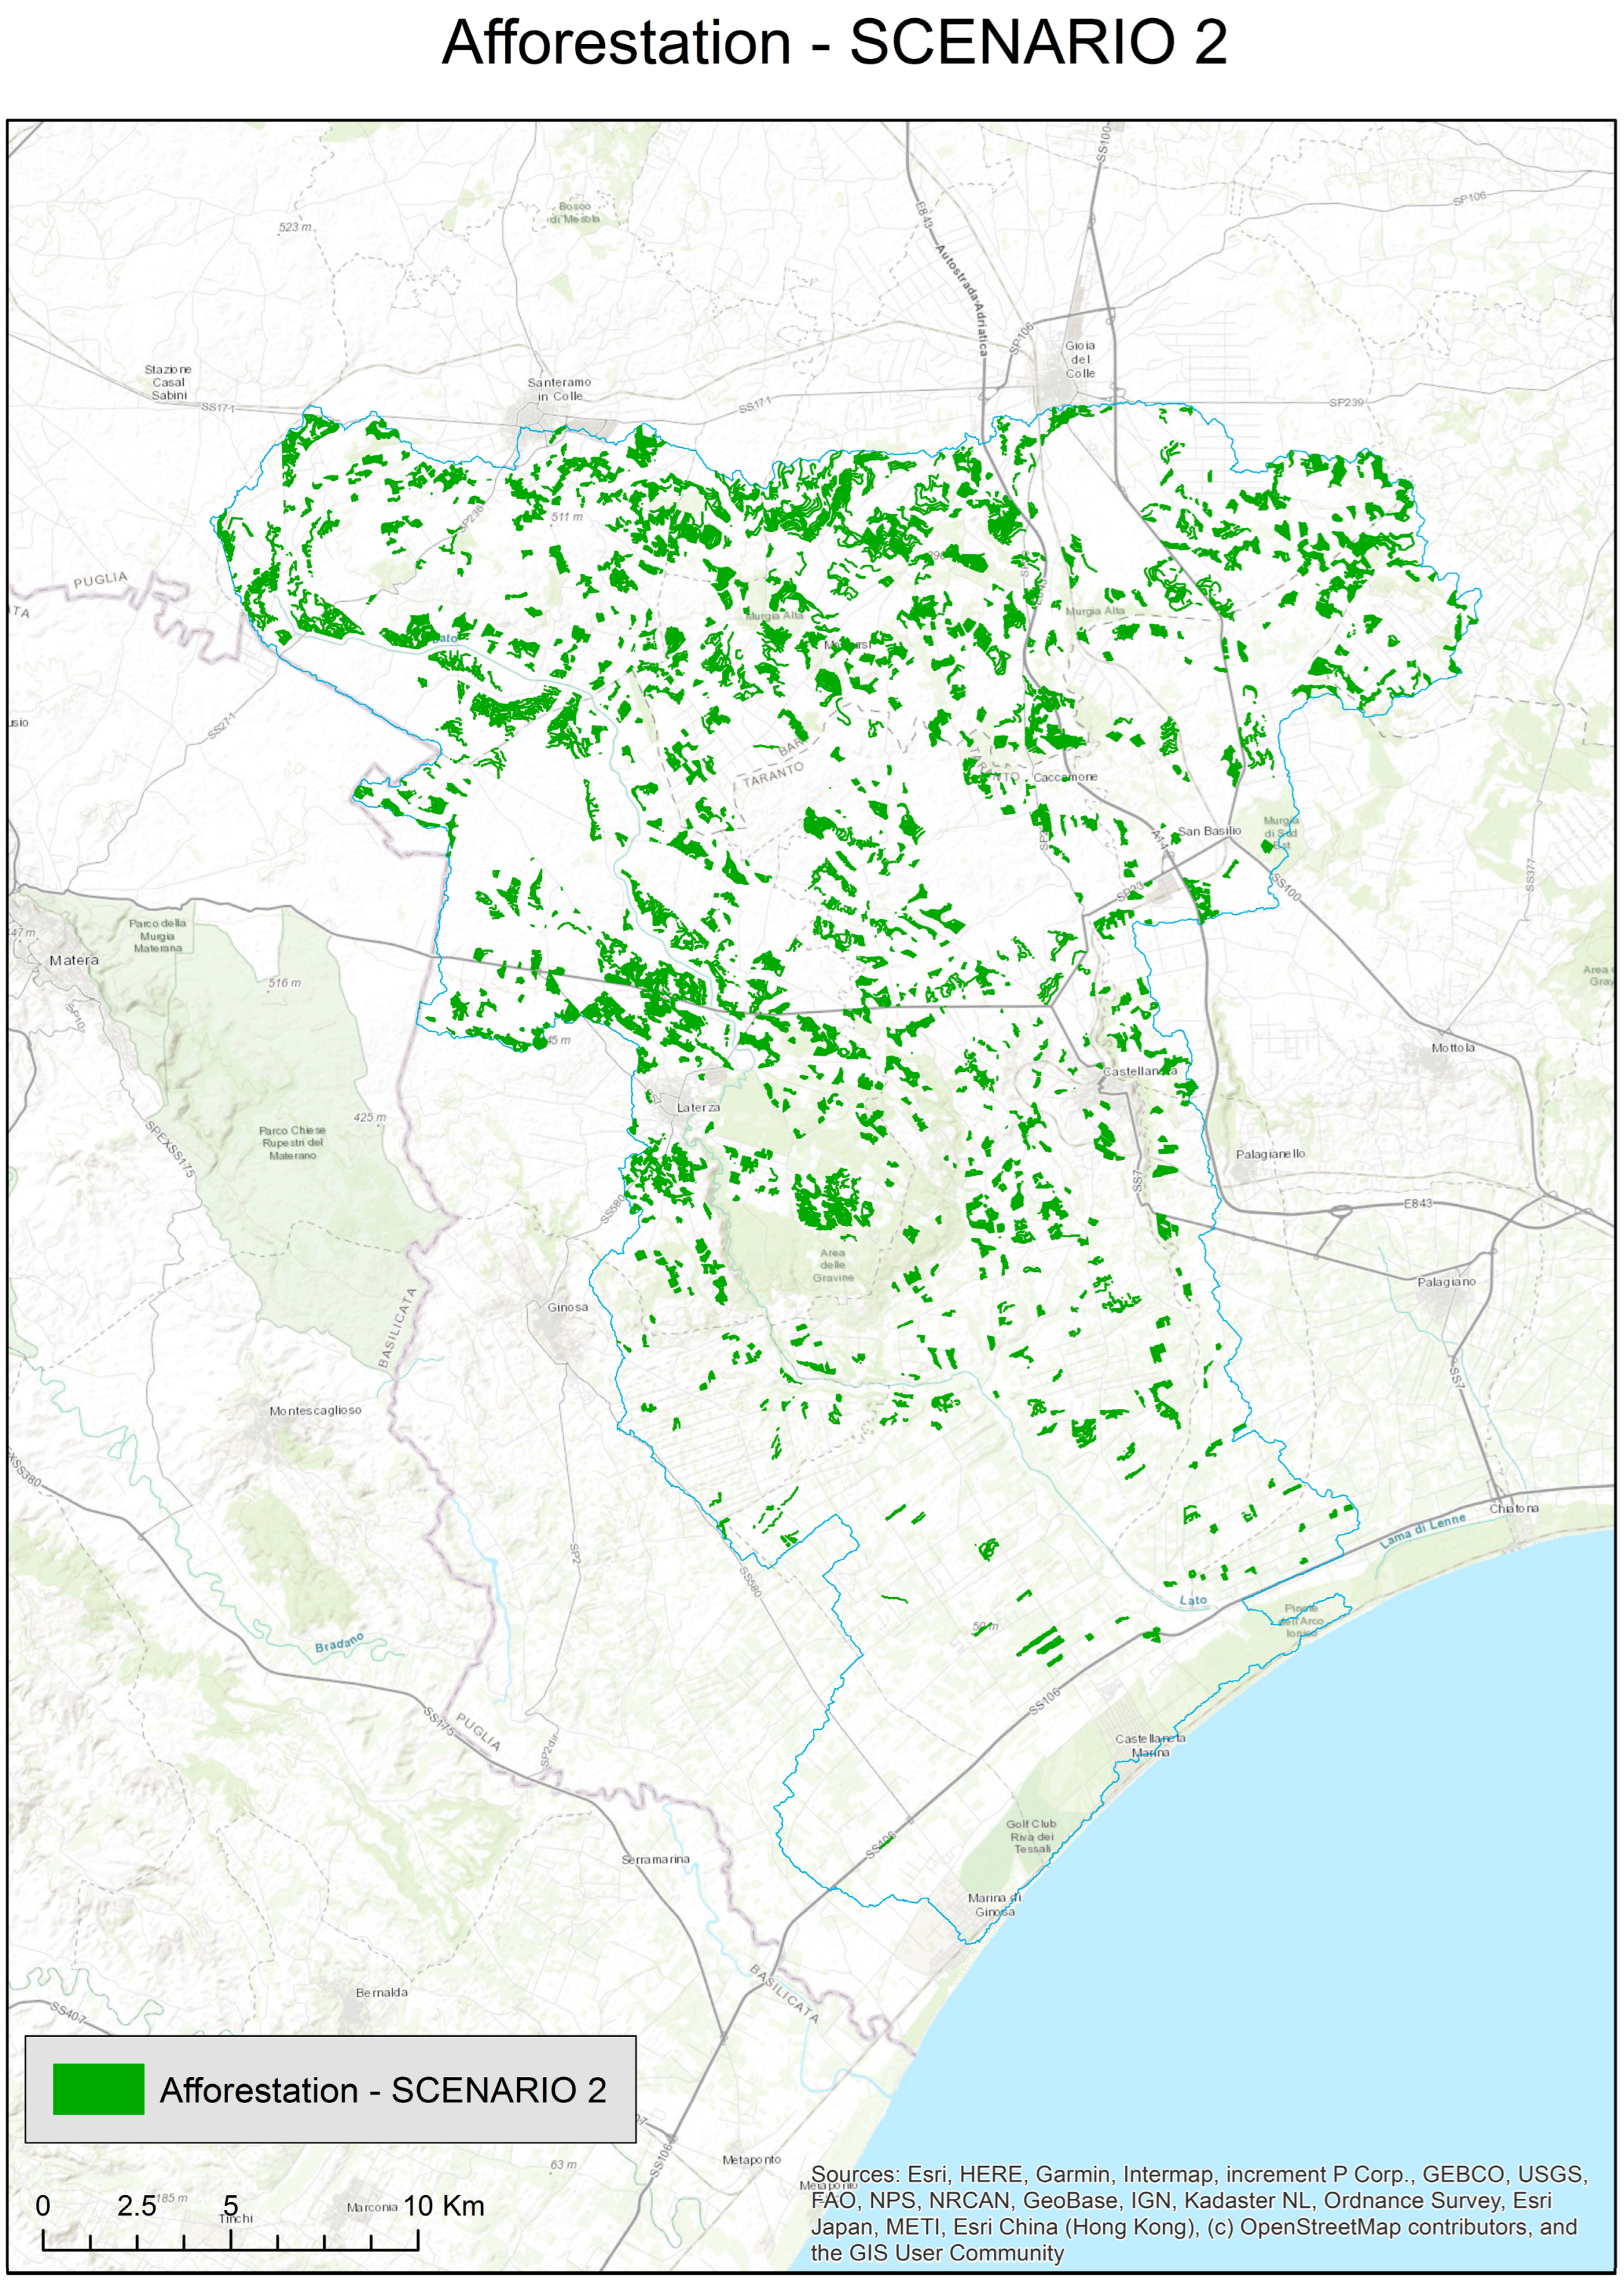
  • Scenario 2: Areas with medium erosion (1.4–10 t/ha/year) cultivated as cereal crops, no less than 150 m from river networks and with an area between 1.00 and 20.00 ha (according to the current regulations). Total afforestation area = 3500 ha (Figure A2, Appendix A).
There are some differences between the two scenarios: the first scenario was defined without considering the land use within the 48 m of buffer and does not take into account the regulatory constraints that guide land use transformations (e.g., financing measures, hydraulic regulations, etc.); the second scenario was defined based on the indications contained in the current legislation regarding the hydraulic protection of the basin, the requirements arising from financing policies and the legislation on land protection.
In Scenario 1, a geometric–spatial approach was adopted to select the areas, and reforestation interventions were chosen in all areas with the highest levels of erosion, which, for almost the entire study basin, coincide with the areas bordering the river channels and their respective 48 m buffer areas. In Scenario 1, the areas targeted for reforestation amount to 3500 ha (Figure A1, Appendix A), regardless of current land use and the actual technical and authorization feasibility of the intervention. Analysis of Table 2 shows that the land use of these areas is quite heterogeneous, with a prevalence of arable crops in non-irrigated areas and other crops (41.87%) and high-yield crops (27.24%).
For comparison purposes, in Scenario 2, the choice of the target area was based on selective criteria aimed at making the intervention feasible:
-
Criterion 2: Presence of cereal crops and therefore low-yield crops (which means low monetary value).
-
Criterion 3: Distance of at least 150 m from river networks.
-
Criterion 4: Single intervention area between 1.00 and 20.00 ha. Total reforestation area = 3500 ha (Figure A2, Appendix A).
The reasons for the choice of Criterion 3 stem from the need to comply with environmental constraints (Basin Plan, Hydrogeomorphological Asset Excerpt of the Puglia AdB, Articles 6 and 10—link [43]).
The reasons for the choice of Criterion 4 stem from two considerations: compliance with the technical conditions and the maximum allocation of EUR 200,000 for each individual project, drawn from the financial resources of PSR Puglia 2014/2020, SM 8.1 [35]; this allocation, divided by a presumed maximum value of approximately EUR 10,500.00/ha, produces an estimated surface area that never exceeds 20 ha. Furthermore, to reinforce the requirement of technical feasibility of the intervention for areas no larger than 20.00 hectares, it is highlighted that Annex IV to Part 2 of Legislative Decree no. 152/2006 (Consolidated Environmental Law [44]) provides that for interventions “of initial forestation of an area larger than 20 hectares”, reduced by 50% in the case of sensitive areas, it is necessary to activate complex Environmental Impact Assessment procedures with uncertain favorable outcomes.

2.2. Determination of Soil Loss

The present work investigates soil erosion using the InVEST (Integrated Valuation of Ecosystem Services and Trade-offs) [37] model to assess the erosion process at the basin scale.
InVEST (Integrated Valuation of Ecosystem Services and Trade-offs) [37] is a model that quantifies ecosystem services based on environmental conditions and processes [38], assessing the impact of changes in ecosystems on benefits to people. It uses a production function approach which specifies ecosystem service outputs through the concepts of supply, service and value.
InVEST’s toolkit includes several models for analyzing environmental benefits, divided into supporting and final ecosystem service models, as well as additional tools. Supporting ecosystem services include, for example, habitat quality, while final ecosystem services include carbon storage and the SDR module.
The study of erosion processes and water resources analysis can use the Sediment Delivery Ratio (SDR) module, which enables mapping of the formation and distribution of sediment in watersheds and allows an estimate of their erosional impacts. The module is based on the Revised Universal Soil Loss Equation (RUSLE), used to calculate the average yearly rate of erosion based on factors such as rainfall, soil type, elevation and management practices. RUSLE is as follows:
A = R × K × LS × C × P
where
R is rainfall erosivity (MJ mm ha−1 h−1 yr−1);
K is the soil erodibility (t ha hr (MJ ha mm)−1);
LS is the length-slope of the slope;
C is the coverage management factor;
P is the supporting practice.
Using the digital terrain model (DEM) of the Puglia Region (8 × 8 m pixel size) as input, the SDR model first determines the annual soil loss and then calculates the proportion of sediment that reaches the stream (SDR). However, it does not simulate inland transport processes in rivers, assuming that sediment reaches the mouth of the basin directly.
Applied at the basin scale, the SDR module provides maps of soil loss and transport, supporting environmental planning choices.
In the present study, the analyzed area is the Lato Basin. To ensure accurate representation, the input data for the model were cropped based on the extent of the basin.
The values of soil erodibility (K) and rainfall erosivity (R) were defined through spatial interpolation of annual rainfall data from 5 local rainfall stations.
Specifically, the dataset used to calculate K values comes from the Puglia regional project ACLA2 [39], which has a resolution of 250 × 250 m, while the R values were retrieved from weather data (1921−2019) of 5 regional weather stations.
Soil erodibility is calculated as follows:
K = [(2.1 × 10⁻⁴ M 1.14 (12 − OM) + 3.25 (s−2) + 2.5 (p − 3))/100] × 0.1317
where
M is the texture factor that considers the content of very fine clay silt and sand fraction;
OM indicates the percentage of organic matter content;
s refers to the soil texture class;
p refers to the permeability class.
Rainfall erosivity is calculated as follows [40]:
R j = 0.524 F a , j 1.59
where
Fj (mm) index is equal to [45]
F j = i = 1 12 p i , j 2 P j
Pi,j (mm) is the height of precipitation in a generic month i of year j, and Pj (mm) is the precipitation of year j. The results were spatially distributed using a Thiessen polygon within a GIS environment.
The S and L factors were derived from the digital elevation model (DEM) with an 8 m resolution provided by the Puglia Regional Geoportal. Land use data were also obtained from the Puglia regional portal. The cover management factor (C) was obtained from the scientific literature. Since there are no supporting practices, the value of the P factor was set equal to 1.
All the maps used as input were transformed into raster format and then resampled at the resolution of 8 × 8 m.
In order to properly represent the basin, the Threshold Flow Accumulation (in GIS hydrological modeling, Threshold Flow Accumulation is a critical parameter used when extracting stream networks from a digital elevation model (DEM)) was fixed at 1500 pixels. The other parameters, such as the Borselli K Parameter, Maximum SDR Value, Borselli IC0 Parameter and Maximum L Value, were obtained from the scientific literature [45].
Specifically:
-
The Borselli K Parameter is a calibration parameter that determines the relationship between hydrological connectivity (the degree of connection between plots of land and watercourses) and nutrient input (the percentage of nutrients that actually reach the watercourse);
-
The Borselli IC0 Parameter is an empirical parameter that represents the threshold value of hydrological connectivity beyond which an area is hydrologically connected to the flow network.
Applied at a basin scale, the SDR module provided the map of soil loss and transport of sediments, highlighting the areas in which the erosion process is considered most severe and worrying (areas with low, medium and high erosion).
In order to estimate four ESs linked to erosion (loss of carbon, habitat quality, crop productivity and suitability for sustainable tourism), in the two afforestation scenarios (Scenario 1 and Scenario 2, described above), we again estimate the soil erosion at the watershed scale through the InVEST (Integrated Valuation of Ecosystem Services and Trade-offs) model.
The land use classes (intervention areas of 3500 ha) for the afforestation interventions in Scenario 1 and Scenario 2 are shown in the following table (Table 2).

2.3. Identification of Ecosystem Services Correlated to Soil Erosion

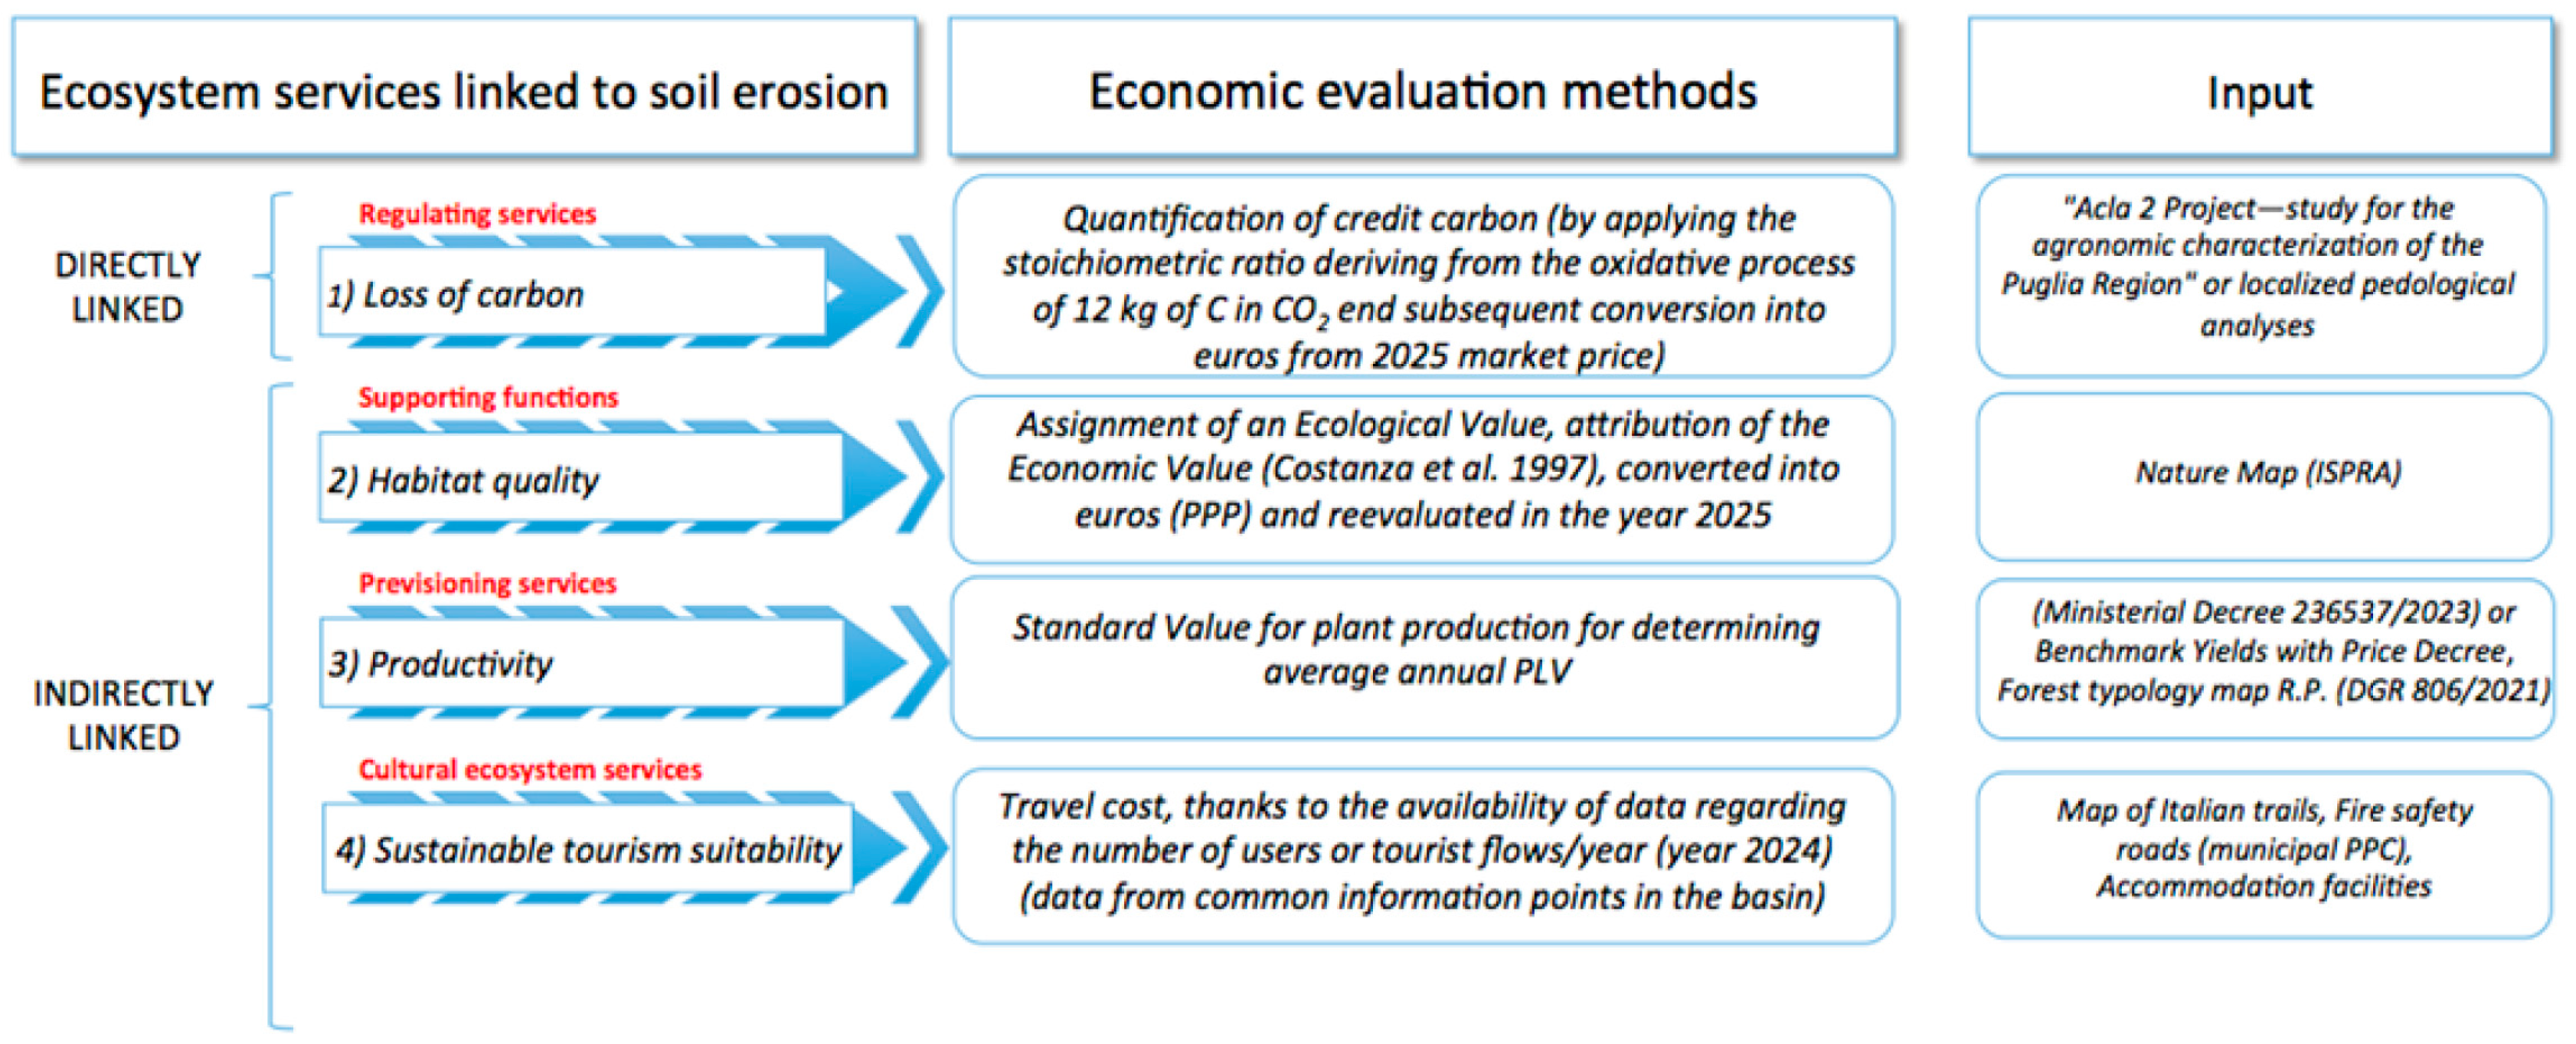
For the study, four ESs connected with soil loss were chosen: carbon loss (regulating services), habitat quality (supporting functions), crop productivity (provisioning services) and suitability for sustainable tourism (cultural ecosystem services). For the description of each ES, refer to [8].
These ESs were economically valued as reported in Figure 3.

2.4. Application of Monetary Evaluation for Ecosystem Services Linked to Erosion

Finally, the economic convenience of a change in land use was evaluated for the actual situation and for each afforestation scenario through a cost–benefit analysis, in order to estimate how ESs vary in relation to management practices.
This made it possible to (1) determine the soil loss in t/ha/year of the Lato Basin for 2024, before and after afforestation interventions; (2) monetarily estimate the four ESs linked to erosion in the Lato Basin; and (3) suggest implementation of payments for ecosystem services (PES).
European currency (EUR) was used in the standardization of economic evaluation of the ESs; the value of each ES was estimated at the basin scale. The evaluation was made before and after the simulation of two different reforestation interventions (Scenario 1 and 2) to estimate how ESs vary in relation to management practices.
The four ESs and the related methods used for their estimation are as follows:
  • Loss of carbon (regulating services):
The starting data consist of the characterization of the soils of Puglia Region combined with information relating to the biomass of the different land use types.
In particular, we refer to the following:
-
Organic carbon inside the soil (t/ha) from Acla 2 [39] project: A total of 23 profiles of soil horizons of the basin uniformly distributed were examined, in which the values of the organic carbon content detected over time were used. The data were interpolated in a GIS environment, from which the average value/ha of organic C content was obtained.
-
Organic carbon present in forest plant components from the Forest Inventory of Puglia Region [46], with particular attention to the above-ground biomass of forest stands (divided into living biomass of adult individuals, shrubs, regeneration, large and fine necromass) and underground biomass (stumps).
-
Organic carbon (Mg/ha) present in the permanent agricultural crops most representative of the area of interest (vines, olives, citrus fruits and other fruit trees) as reported by [47,48,49,50,51]. The transformation of C (kg) into CO2 was carried out with the application of the stoichiometric ratio resulting from the oxidative process of 12 kg of carbon, therefore equal to 3.66 (12 kg of C + 32 kg of O2 = 44 kg of CO2) [49], except for Actinidia and apples, where the data expressed in CO2 were already detected and published [50] for the year 2025, which were used and compared with the average data for the last 52 weeks, namely from February 2025 backward = EUR 71.15 + EUR 68.35 (average 69.73 EUR/t CO2) [51].
The same type of assessment was carried out at the basin scale for 3 different situations (actual situation: Scenario 0, and two hypothetic scenarios: Scenario 1 and Scenario 2), hypothesizing a change in land use from agricultural cultivation to permanent forest. Finally, an economic comparison was carried out before and after the intervention.
  • Economic assessment of habitat quality (supporting functions):
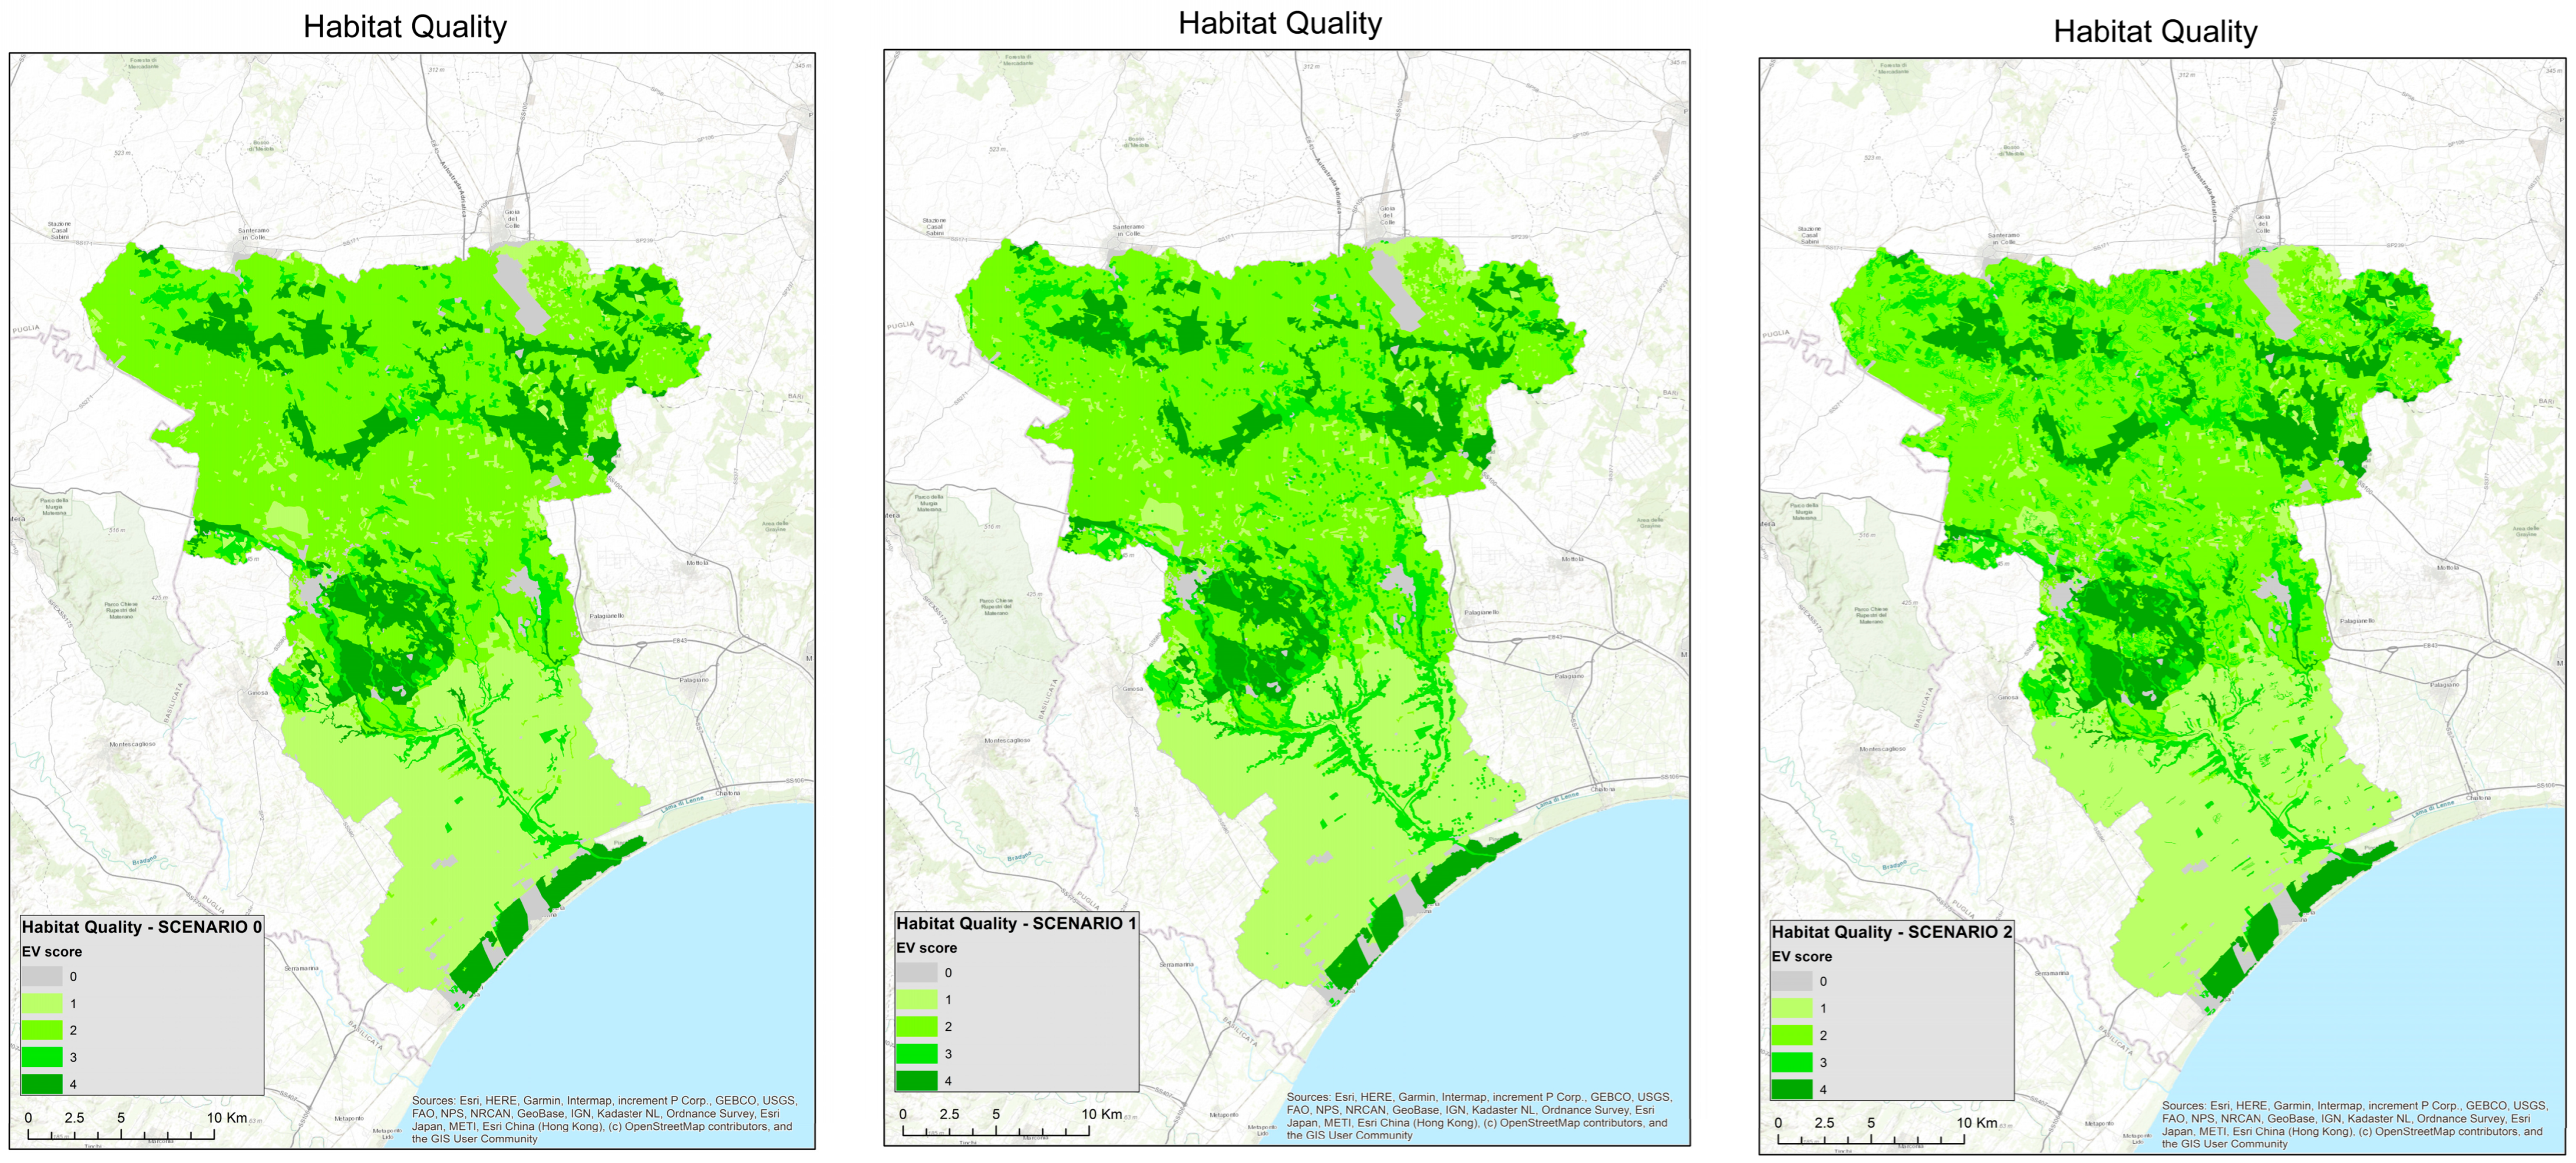
This study assessed the habitats found in the basin in terms of ecological value as indicated by the Ispra Nature Charter (Habitat Quality) [52]. Within the Nature Charter, ecological value is understood with the meaning of natural value, and for its estimation, a set of indicators is calculated that can be traced back to three different groups: one that refers to so-called institutional values, i.e., areas and habitats already reported in community directives (Dir. 92/43/EEC, Dir. 79/409/EEC, Ramsar Areas—Ramsar Convention on Wetlands of 02/02/1971); one that takes into account the biodiversity components of the habitats (animals and plants); and a third group that considers typical indicators of landscape ecology such as the surface, rarity and shape of the biotopes, indicative of their state of conservation. The result of the processing is a map of the habitat quality in terms of ecological value, in which each cell is assigned a rating between null, low, medium, high and very high. The ecological values obtained (range 0–4, Table 3), assigned to each type of land use analyzed, were then converted into economic value according to what was proposed by [53], which assigns an economic weight to each area with different land use. The value assigned, reported in USD/ha/year 2007, was first converted into EUR 2007 through the application of the reference dollar–euro exchange rate in 2007 [54] and subsequently corrected to 2025 by consulting the data available from the Italian Institute of Statistics [55].
The same type of assessment was carried out at the basin scale for 3 different situations (actual situation: Scenario 0, and two hypothetic scenarios: Scenario 1 and Scenario 2), hypothesizing a change in land use from agricultural cultivation to permanent forest. Finally, an economic comparison was carried out before and after the intervention.
For the newly reforested areas related to Scenarios 1 and 2, a habitat value of 3 was assigned, derived from the average of the values of the coniferous and deciduous forests already present in the basin. This value corresponds to an economic value of EUR 1806.83.
  • Crop productivity (provisioning services):
Quantification regarding the economic value of agricultural production that can be obtained from cultivated areas of the watershed was performed via application of Italian Ministerial Decree No. 360972 of 08/08/2024 and No. 236.537 of 5 May 2023, which established identification of the standard values for plant production to estimate the value of the average yearly production and the maximum values which can be insurable on the subsidized market and to join mutual funds (years 2023 and 2024, EUR/ha) (Table 4).
For forest crops, instead, the value of the tons of organic carbon present in the forest plant components has been transformed [46], with particular attention to the above-ground biomass of forest stands [56].
The total volume (q/ha) was multiplied by 6 EUR/q (for conifers) and by 12 EUR/q (for broadleaf trees); the average purchase and sale value of coniferous and broadleaf forests is expressed in EUR, while q stands for “quintal” (a non-SI unit of mass measurement widely used in Italy and Europe and equivalent to 100 kilograms).
The economic values obtained were divided by 20 (technical rotation equal to 20 years required by law for broadleaf forests) and by 10 (percentage incidence of thinning permitted on pine forests and other wooded areas with no economic value) (Table 5).
The same type of assessment was carried out at the basin scale for 3 different situations (actual situation: Scenario 0, and two hypothetic scenarios: Scenario 1 and Scenario 2), hypothesizing a change in land use from agricultural cultivation to permanent forest. Finally, an economic comparison was carried out before and after the intervention.
  • Sustainable tourism suitability (cultural ecosystem services):
To evaluate this ES, we considered “sustainable tourism suitability” (STS), which is defined as the territory’s potential to provide services for sustainable tourism. To achieve an estimate regarding performance of this service, we began with the assumption that a territory, or some of its parts, can be evaluated in terms of tourism suitability according to the presence or absence in it of certain elements: roads, hiking trails, habitat/naturalistic areas, restaurants, bars, hotels, sports facilities, historical–cultural elements and woodland areas (Table 6). To evaluate the spatial distribution of the ecosystem service, we then proceeded to evaluate the spatial distribution of each characteristic by carrying out a density analysis in a GIS environment. The density map of each feature was normalized. An overlay analysis was then performed to obtain a performance map of STS, for which each cell (cell size of 8 m) was attributed with a value within the range of 0–4 (low–high STS) as a result of the sum of the spatial density values of the individual territorial elements.
The data on total tourist flows within the basin for the year 2024 were deduced from the publications of Pugliapromozione and BIT Milano [57,58]. In total, the basin recorded an annual tourist flow of 106,010 units (a unit is defined as someone who has used at least one cultural tourism service offered by the territories located within the Lato Basin).
These publications show that the average price for an overnight stay with full board within the facilities is EUR 158.46. However, the number of tourist flows for each municipal territory does not reflect the average value, with a prevalence of access to accommodation facilities facing the areas with the greatest suitability for tourism (beach areas and green areas for hiking). Therefore, the average economic value in terms of tourist attractiveness of the entire area is equal to 276.32 EUR/year (EUR 29,293,087.07: 106,010.17, sum of the induced effects of the individual territories divided by the number of units) (Table 7).
The extent of the Lato Basin is 72,617.80 ha; therefore, the entire area’s economic value in terms of tourist attractiveness is equal to EUR 29,293,087.07, with an average value per hectare of EUR 403.39 (29,293,087.07/72,617.8 ha = 403.39 EUR/ha, average annual tourist productivity/ha).
The same type of assessment was carried out at the basin scale for 3 different situations (actual situation: Scenario 0, and two hypothetic scenarios: Scenario 1 and Scenario 2), hypothesizing a change in land use from agricultural cultivation to permanent forest. Finally, an economic comparison was carried out before and after the intervention.

2.5. Application of the Replacement Cost Method

We used the replacement cost method to transform the land uses of the three scenarios to forest land so as to compare the result with the total value of the previous four ESs. The transformation value (i.e., the replacement cost) of land use of the basin under study here was compared in economic terms with the creation of an initial afforestation plan. The transformation value (EUR/ha) was calculated using two different methods. Firstly, we used the economic values of the transformation of agricultural land into forest, in compliance with the Rural Development Programme (RDP) of Puglia Region, the principal funding tool in the European Agricultural Fund for Rural Development (FEASR); the regional government of Puglia uses this to promote key interventions aimed at the development of rural areas. Following this, the second method applied the unit values (EUR/ha) of the cost items on the price list of Puglia Region, attached to the Decision of the Regional Council (DGR) LLP/DEL/2023/00012 [59]. For both methods, we added the economic values of income loss and the maintenance values of the forestation systems to the values obtained, multiplied by 12 years (see the notice of the first afforestation of agricultural land—Measure 8.1 of the RDP of Puglia Region 2014–2020) [35].
Each intervention of land use change was estimated through the application of the replacement cost analysis, in order to examine the economic convenience and make a suggestion as to sustainable practices of land management to adopt at the scale of the entire river basin.

3. Results

3.1. Determination of Soil Loss at the Basin Scale

The amount of soil loss for the year 2024 was 1.02 t/ha (average for Scenario 0). This value was reduced to 0.84 t/ha for Scenario 1 and to 0.88 t/ha for Scenario 2 (Table 8).
Analysis of the data described above shows that both scenarios contribute to reducing soil erosion at the basin scale: in Scenario 1, soil loss is reduced by 0.18 t/ha, and in Scenario 2 by 0.14 t/ha.
In this regard, afforestation in Scenario 1 is slightly more effective than in Scenario 2, which is unexpected given that the areas experience high levels of erosion, with a high level of hydraulic risk and steep slopes. This could suggest that:
  • Scenario 1 and Scenario 2 both contribute significantly to reducing soil erosion, despite having very different site conditions, such as the degree of erosion, vegetation cover and slopes. The variation in soil erosion severity at the basin scale could, therefore, depend on geomorphological, climatic and anthropogenic factors, not strictly linked to a specific study area but also to the effects of surrounding areas.
  • For the same intervention surface area, the reforestation action carried out on soils covered for only a few months/year (Scenario 2) is equally effective compared to others permanently covered by vegetation.

3.2. Assessment and Economic Evaluation of Ecosystem Services at the Basin Scale

The value and graphical representation of the four analyzed ecosystem services evaluated at the basin scale (loss of carbon, habitat quality, crop production and cultural ecosystem services) before and after the reforestation is reported in Appendix A/Table A1. Basin-scale statistical analysis of the spatial distributions of erosion and the four ecosystem services in Scenario 1 and in Scenario 2 is shown in Figure A3, Figure A4, Figure A5, Figure A6 and Figure A7.
From the results obtained, we observed that:
The physical value of carbon sequestered (CO2 t/ha), and therefore not lost due to soil erosion, varies from an average of 30.68 for the current situation (Scenario 0) to 33.64 for Scenario 1 and 34.76 for Scenario 2 (Table 9). The corresponding economic value ranges from 2139.31 EUR/ha for Scenario 0 to 2345.87 EUR/ha for Scenario 1 and 2423.88 EUR/ha for Scenario 2 (Table 10). This confirms that both afforestation Scenario 1 and Scenario 2 determine a reduction in the value of lost soil, and therefore an increase in its economic value.
Specifically, the regulation service increases by 0.38 tons/ha in Scenario 1 and by 0.48 tons/ha in Scenario 2, due to the action of the root systems of broadleaf forest species, which act directly by contributing stable organic biomass to the soil, and indirectly through their capacity for water regulation and soil retention (Table 11).
As detailed in Table A1, although the minimum and maximum values of carbon sequestered are identical for the current situation (Scenario 0) and for Scenarios 1 and 2, the abovementioned increase generates an increase in CO2 sequestered and an increase in the economic value of the soil.
The variation observed in Scenarios 1 and 2 depends on the two following factors, based on the data reported in Table 2:
-
The presence in Scenario 1 of already forested crops, where reforestation is not permitted;
-
The presence of permanent replacement crops (tree crops) that already contribute, albeit less effectively, to the reduction in soil loss.
Table 9. Comparison of carbon values (t) in Scenario 0, Scenario 1 and Scenario 2.
CO2 (t)
ScenarioMinMaxRangeMeanStdSum
00.226139.78139.5630.6841.70348,064,211.72
10.2264139.78139.5633.6443.08381,673,394.29
20.2264139.78139.5634.7643.44394,366,484.40
Table 10. Comparison of carbon values (EUR/t) in Scenario 0, Scenario 1 and Scenario 2.
Carbon (EUR/ton)
ScenarioMinMaxRangeMeanStdSum
015.799747.059731.262139.312907.6824,270,517,483.54
115.799747,059731.262345.873004.0926,614,085,783.97
215.799747.059731.262423.883029.0227,499,174,957.07
Table 11. Comparison of carbon values (Mg/ha) in Scenario 0, Scenario 1 and Scenario 2.
Carbon (Mg/ha)
ScenarioMinMaxRangeMeanStdSum
00.0638.1938.138.3811.3995,099,511.40
10.0638.1938.139.1911.77104,282,348.17
20.0638.1938.139.5011.87107,750,405.60
The physical value in terms of ecological value of habitat quality varies from an average of 2.00 for the current situation (Scenario 0) to 2.05 for Scenario 1 and 2.06 for Scenario 2 (Table 12). The economic value ranges from 1663.06 EUR/ha for Scenario 0 to 1757.90 EUR/ha for Scenario 1 and 1674.20 EUR/ha for Scenario 2. For the newly reforested areas, a habitat value of 3 was assigned, derived from the average of the values of the coniferous and broadleaf forests already present in the basin, as detailed in Table 3. This value corresponds to an economic value of EUR 1806.83. The resulting average economic value ranges from EUR 1663.06/ha for the current situation (Scenario 0) to EUR 1757.90/ha for Scenario 1 and EUR 1674.20/ha for Scenario 2. The initial analysis therefore suggests that the greatest increase is found in Scenario 1; this is because the territories of Scenario 2 already contain habitats of high ecological value before the reforestation intervention, as indicated by the Ispra Nature Charter (Habitat Quality) [52], and with particular regard to the habitats identified in EU directives (Dir. 92/43/EEC, Dir. 79/409/EEC, Ramsar Areas), such as the SIC and SPA “Area delle Gravine IT9130007 and SPA IT120007 ‘Murgia Alta’”. In fact, despite being simple arable land, these are areas of high plant and animal biodiversity, for which afforestation produces only a minimal improvement in terms of habitat quality.
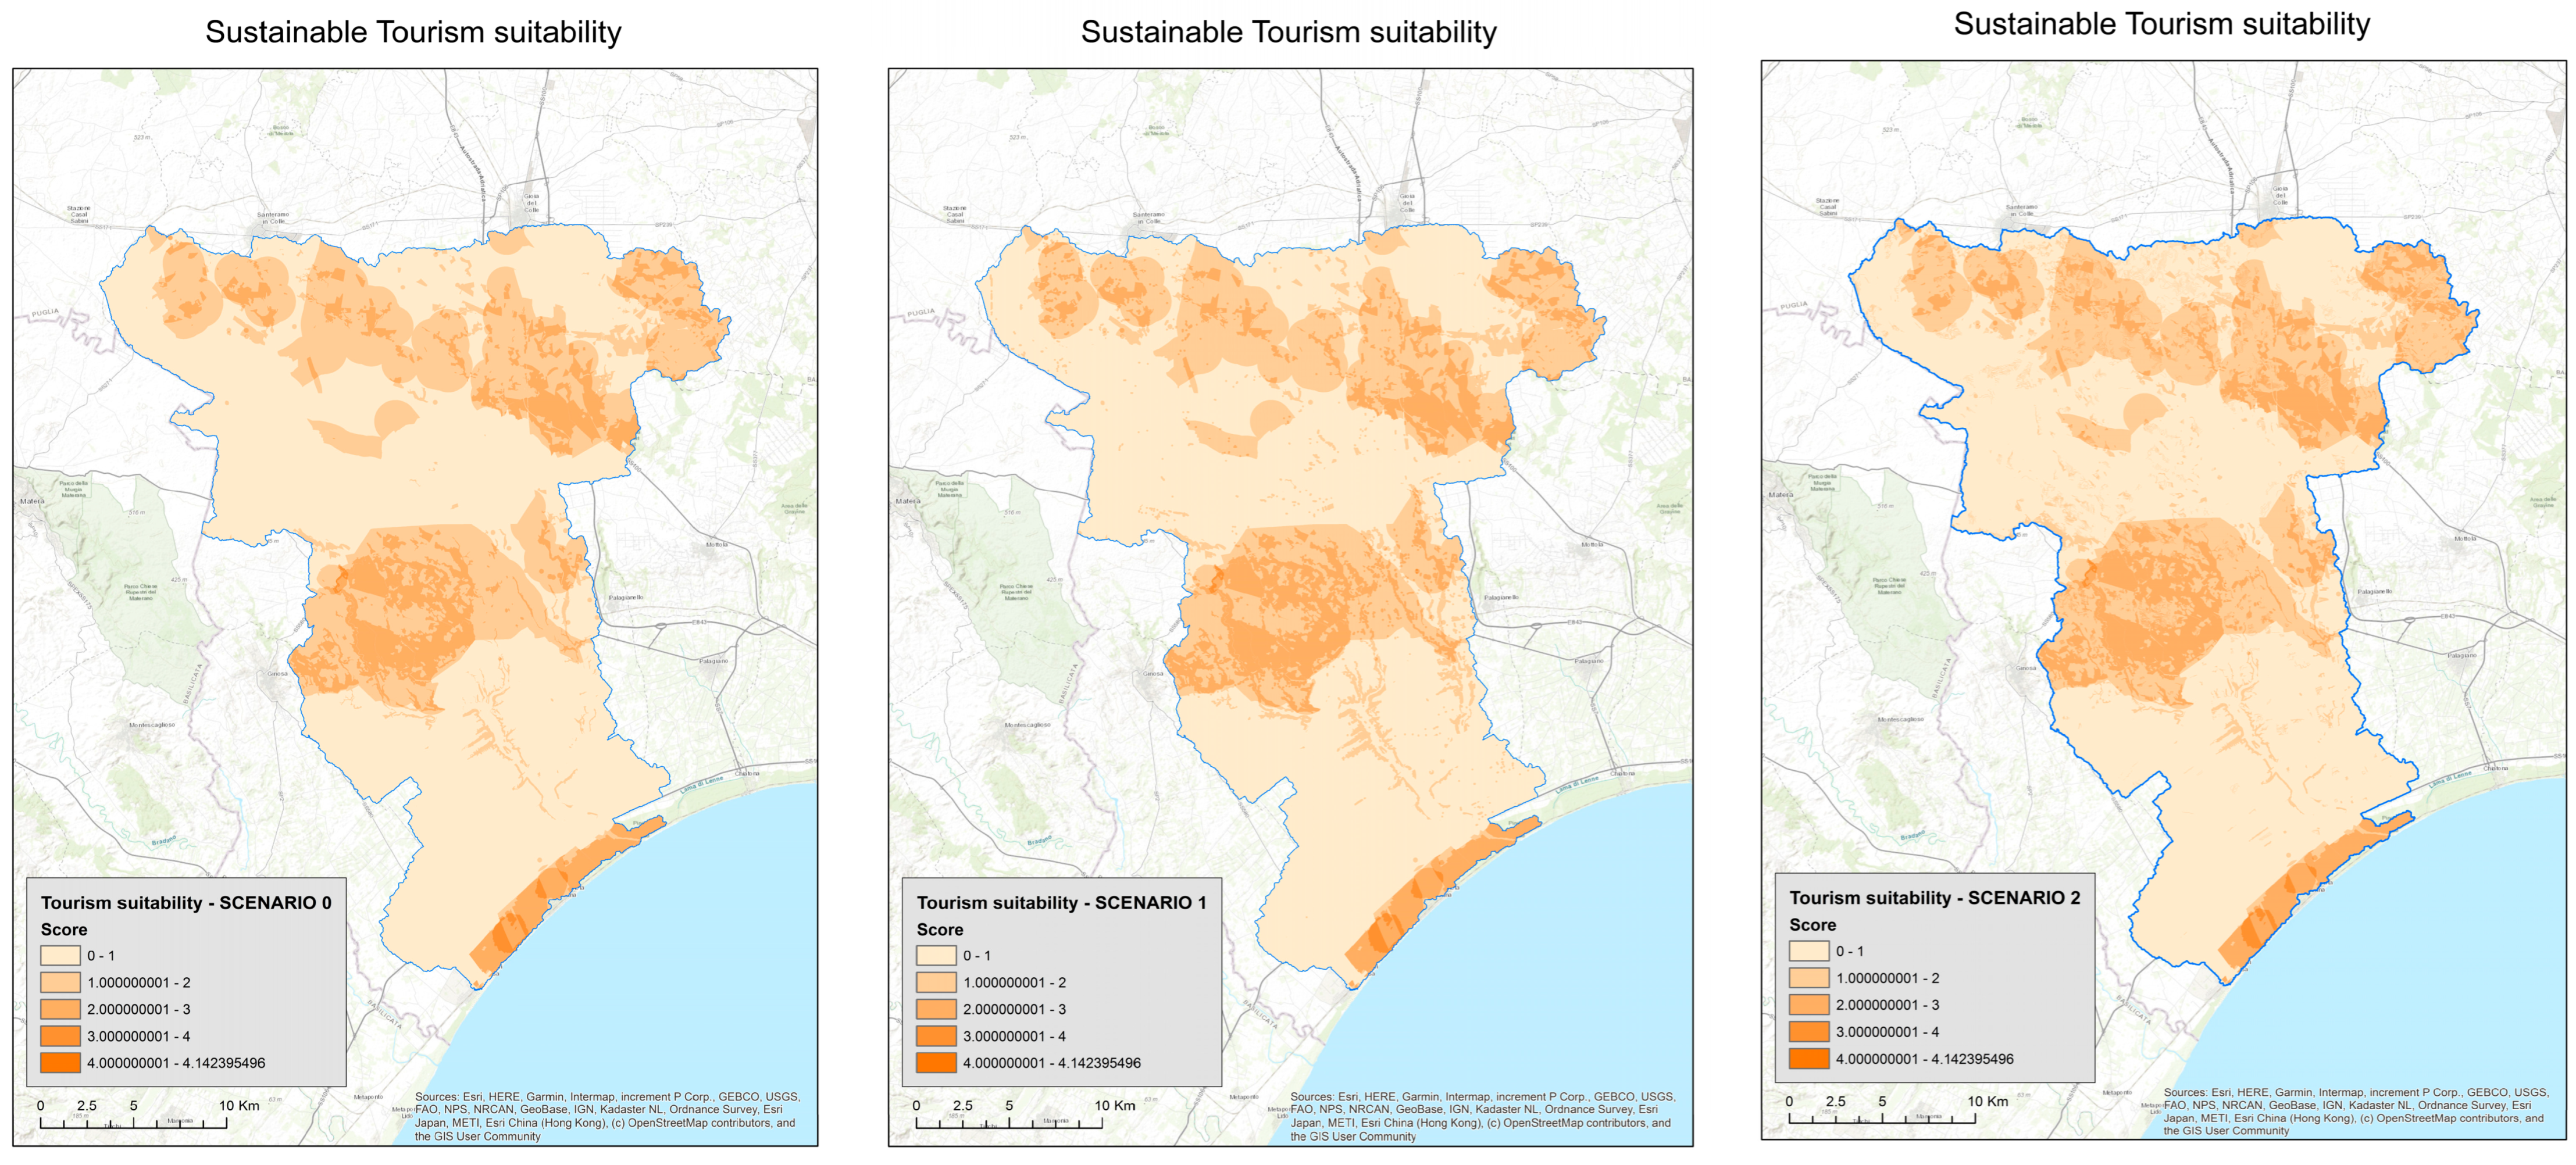
Sustainable tourism suitability (cultural ESs) varies from 0.8 for the current situation (Scenario 0) to 0.84 for Scenario 1 and 0.85 for Scenario 2 (Table 13). The economic value ranges from 324.27 EUR/ha for the current situation (Scenario 0) to 332.95 EUR/ha for Scenario 1 and 343.9 EUR/ha for Scenario 2. The cultural ecosystem service also increases in value in Scenarios 1 and 2. In particular, a slightly higher increase is observed in Scenario 2, and this depends on the greater density in that portion of the territory of elements related to tourist suitability (such as the network of paths, recreational sites and sites of cultural interest, as detailed in Table 6).
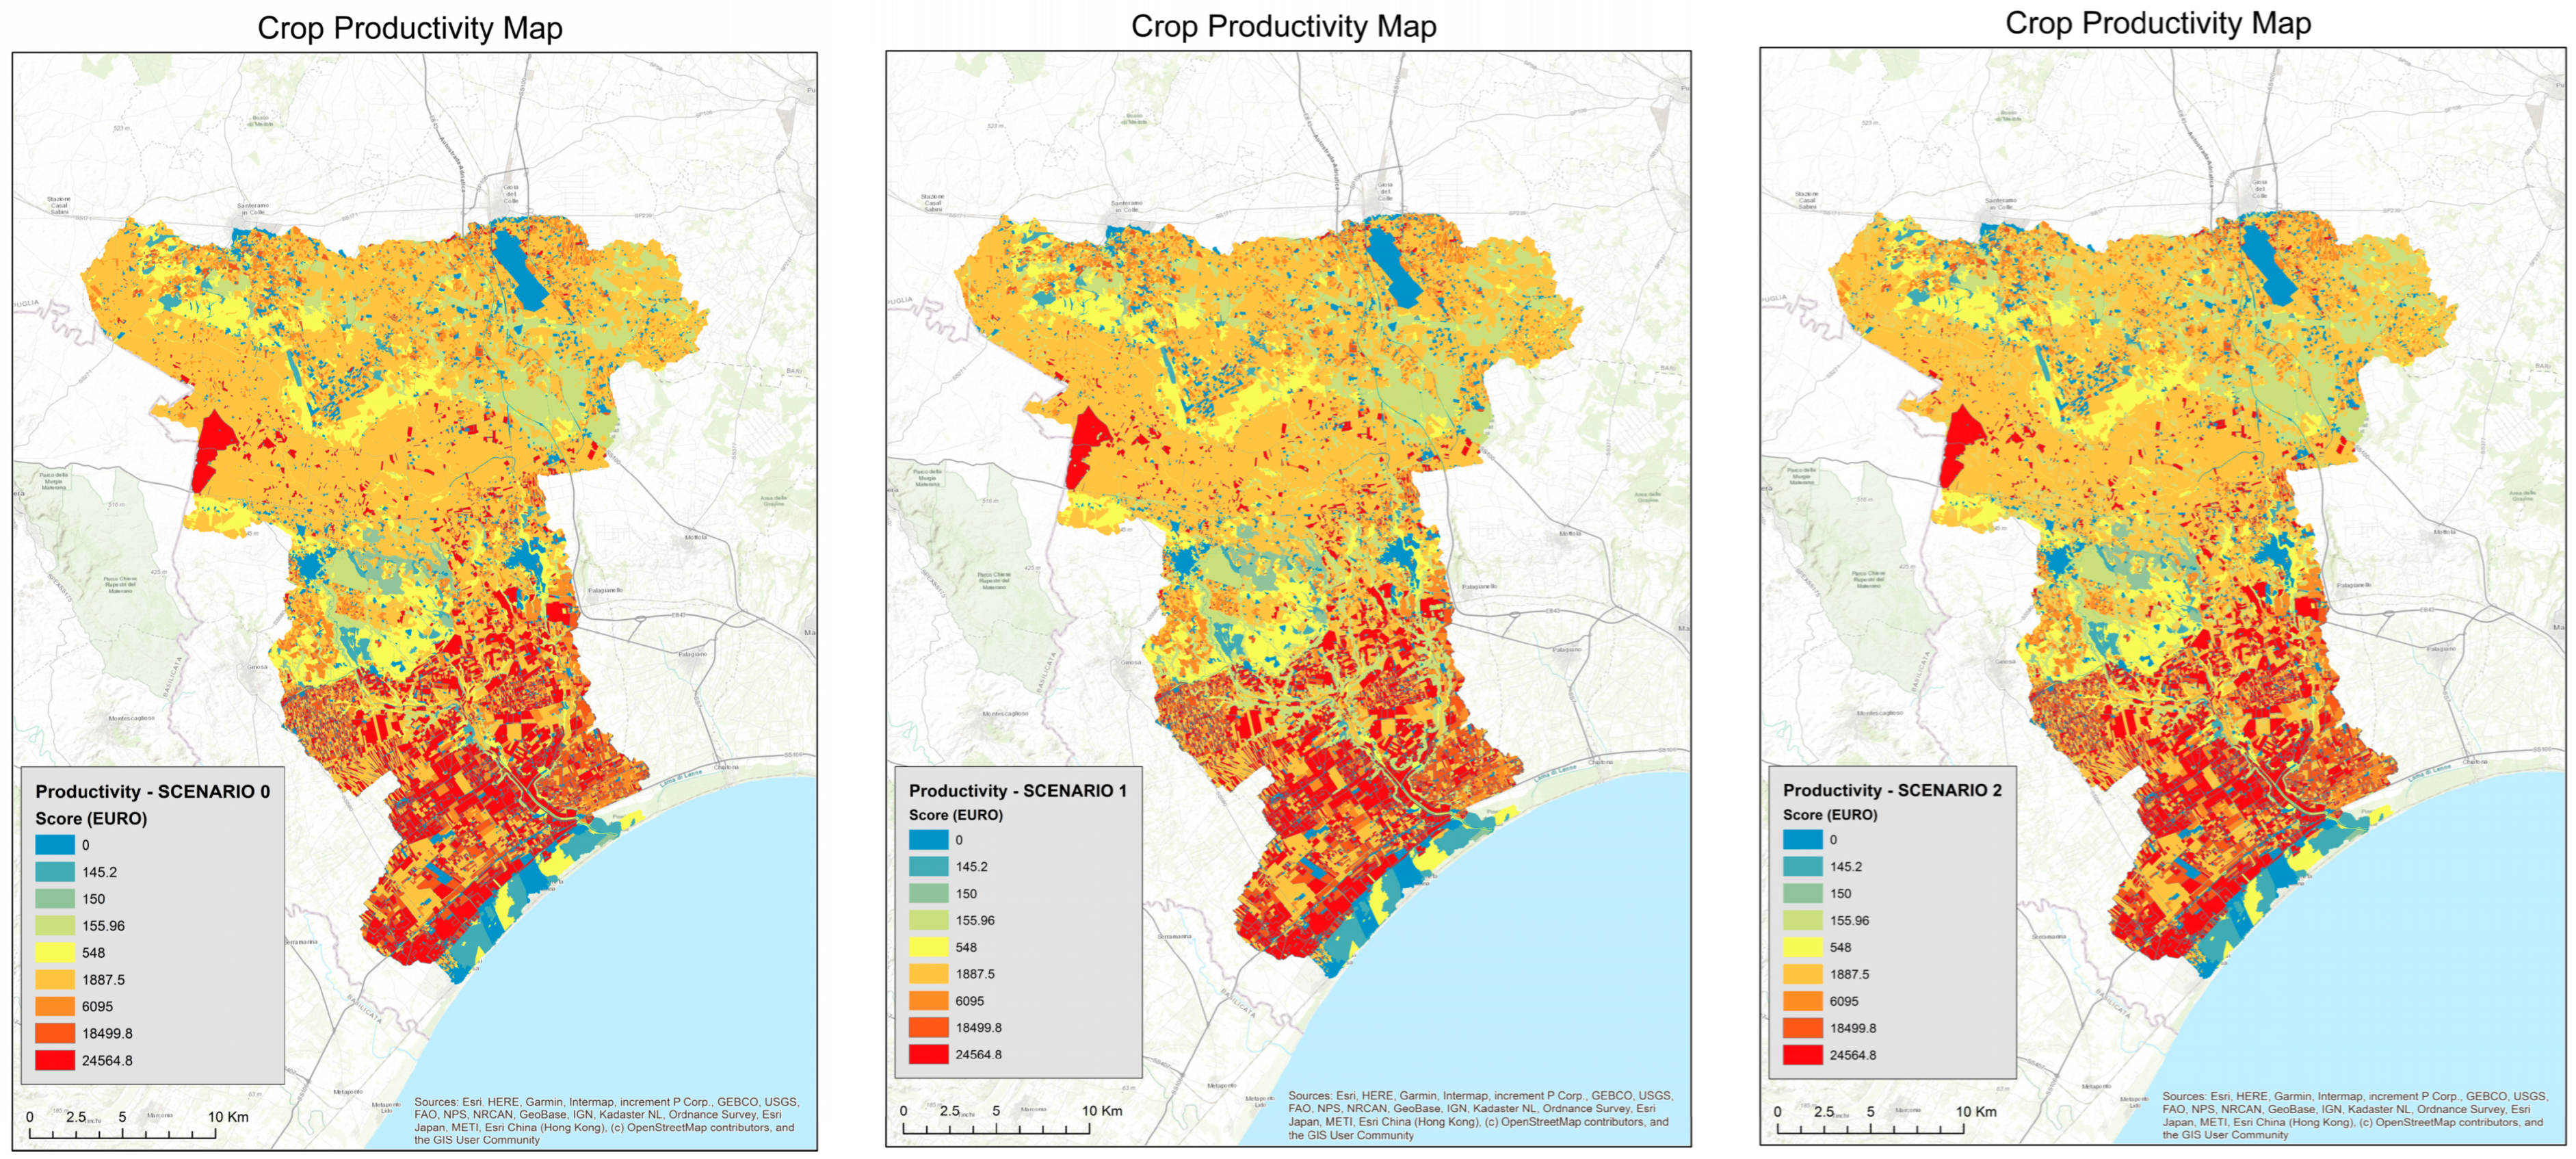
The economic value of production varies from an average of 5612.36 EUR/ha for the current situation (Scenario 0) to 5383.67 EUR/ha for Scenario 1 and 5492.58 EUR/ha for Scenario 2 (Table 14). Unlike the other three ESs described above, there is a significant reduction in productivity for both scenarios; in fact, as can be seen from a comparison of the data in Table 4 and Table 5, annual agricultural land production is significantly higher than forestry production for all crops. The reduction in value is particularly pronounced in Scenario 1 because, as shown in Table 2, it contains 27.24% of high-yield crops, which more than offset the low production values of annual and natural crops (41.87% and 30.91%, respectively), unlike Scenario 2, which focuses entirely on productive but low-yield crops (arable land).
Afforestation actions in both scenarios lead to a reduction in soil loss at the basin scale. An improvement in the physical and economic performance of ecosystem services such as habitat quality, loss of carbon and tourism suitability was also obtained. Regarding crop productivity, the economic value of the service is reduced in Scenarios 1 and 2. Referring to Table 2 “Distribution of land use classes (area and percentage) affected by afforestation in Scenario 1 and Scenario 2”, it can be seen that in Scenario 1, the transformation impacts approximately 30% of areas with very low productivity (natural areas), approximately 41% of areas with medium–low productivity (cereal crops) and finally, almost 30% of crops with high or very high productivity.
Scenario 2, on the other hand, focuses entirely on areas with medium–low productivity, potentially economically sustainable at the farm scale.

3.3. Replacement Cost

Appendix A, Table A2 reports the calculated replacement cost. The financial convenience of transformation of agricultural land and pastures into forests (cost–benefit analysis and replacement cost). The restoration cost granted by the Puglia Region (estimated for agricultural land, meadows and pastures only) is around 10,500.00 EUR/ha given the contribution values provided by the Rural Development Programme Call for Sub-measures 8.1—2022—PSR Puglia), while it is around EUR 18,192.00 if the estimate is made only with data from the Puglia Region price list for the year 2024 [59].
No survey was conducted on existing forests because the intervention is not feasible in areas already forested. This survey was extended to a period of 12 years because the funding sources of Puglia Region’s Rural Development Programme include a public contribution related to lost income and maintenance of the existing forest, which extends to that period. The results correlate the sum of the economic values of the ecosystem services analyzed for that period, including the contribution related to public aid, and the income loss due to a decrease in productivity, which varies by crop type. It is clear that in the absence of EU subsidies, the increase in the three ESs analyzed is never offset by the economic loss related to productivity (Column 10). It is also clear that EU financial support fills this gap, making the conversion only of low-income crops, such as arable crops and olive groves, economically sustainable.

4. Discussion

For both scenarios, an improved erosion control at the basin scale was obtained, along with a concurrent improvement in the economic performance of three ESs: carbon loss, habitat quality and tourism suitability. It should be noted that the first scenario, although apparently feasible in terms of location (highly eroded sites and buffer zones with steep slopes), would be much more challenging in terms of implementation, as it would require authorization/clearance, opinions and permits in accordance with current regulations regarding land protection, particularly hydraulic management. Furthermore, the feasibility of Scenario 1 could be reduced, due to the poor economic sustainability of the transformation, precisely because of the presence of extensions of surfaces subject to intervention with high productivity or consisting of areas already naturalized (Table 2). Regarding Scenario 2, the actual economic sustainability of the conversion interventions requires further investigation, also in light of the financial support options promoted by the European Community through national and regional governments.
When comparing the economic values of restoration (afforestation) with the data obtained from application of the cost–benefit analysis, the following key points emerge:
  • It would always be economically convenient to modify land use from pasture to forest (where possible, and not in contrast with present environmental laws) and from cereal crops to forest. It is economically convenient if the values obtained from the cost–benefit analysis are compared with the economic values of replacement cost from the Puglia Region price list (Table A2, Appendix A, value “Replacement cost”), and the application of Measure 8.1 of the Rural Development Program of the Puglia Region.
  • It is possible to compare the values described above for a period of 12 years (the minimum time-span for a forestry seedbed to become young and stable to grant the economic reward for forest maintenance and compensate for the loss of income from the previous crop (Measure 8.1 of RDP of Puglia Region). This case also confirms the considerations of convenience reported in point 1.
  • It is more economically convenient to transform pasture into forest (where allowed by current legislation), as pastures are almost non-productive. It is also convenient to convert from productive agricultural land, even simply cereal or olive crops (Table 5, value “Economic Convenience EUR/ha”), since the value of the production ESs (supply of products) is calculated with the MASAF 2023 Standard Value.
  • It is not economically convenient to transform highly productive land, which provides ESs of extremely high economic value, which are not appropriately compensated by the replacement costs, maintenance reward and income loss (Table 5, value “Economic Convenience EUR/ha”). The maintenance reward should be raised from EUR 2846.00 to at least 13,659.01 EUR/ha for the conversion of orchards, 19,627.28 EUR/ha for the conversion of vineyards and at least 24,765.78 EUR/ha for the conversion of horticultural crops.
The data from this study may help to develop strategies for Lato watershed management related to the control of erosion and pollution and to sediment remediation, mostly on agricultural lands. Furthermore, the results of this study may help in the distribution of community funds for rural development programs based on the real economic productivity of each area and focused on the use of naturalistic engineering interventions (e.g. reforestation).
The present work concentrates on the identification and evaluation of the possibility of implementing schemes for PES, in order to promote the use of practices aimed at sustainable land management that will lead to improvements in the quality of the water in the Lato watershed. Yet, although the demand for assessment of soil ESs is increasing, it continues to prove a challenge to consider them in land management strategies. This framework for assessment of soil ESs, relating soil science to territorial governance, should enhance the integration of soil ESs into the decision-making process within the context of territorial planning, and should also provide valuable support for sustainable socio-economic development. This work helps to develop environmental and socio-economically sustainable management options, in particular for those agricultural businesses with high-productivity crops. ES soil studies may be useful for the development of local and national policy, and in programming the use and management of natural resources.

5. Conclusions

This study highlights that land use transformation (particularly reforestation, starting from productive uses with extensive or intensive cultivation), in addition to reducing the amount of soil erosion, produces positive effects in terms of reducing vulnerability to erosion at the basin scale. Carbon loss caused by soil erosion is drastically reduced in Scenarios 1 and 2, and this impacts both the soil component and the underground biomass, generating an increase in the ES and its economic value in different ways. This is due to the presence in Scenario 1 of existing forestry crops and the presence of permanent replacement crops (tree crops), which have already contributed to reducing soil loss.
The newly established plant material also generates beneficial effects in terms of biodiversity, increasing habitat quality in both intervention scenarios. In this regard, it is emphasized that the presence of sites already considered to be of high ecological value, partially overlapping with the intervention sites of the first scenario (SCI and SPA “Area delle” Gravine IT9130007 and SPA IT120007 “Murgia Alta”) produces a slightly lower increase in habitat quality than in Scenario 2.
The suitability for sustainable tourism also increases in both Scenarios 1 and 2. The suitability of intervention sites for sustainable tourism improves only slightly when considering this service at the basin, but new increases can be appreciated at micro-territorial scales, especially in the central areas of the basin (Municipality of Laterza), Figure A6 Appendix A. However, better performance is observed at the local level, especially in the innermost areas of the basin. Indeed, a more stable territory capable of mitigating meteorological effects also produces beneficial effects for sustainable tourism activities.
The analysis of the fourth ES related to primary production plays a crucial role in the cost–benefit analysis and economic sustainability of interventions, as it makes the conversion of highly productive areas into forested areas economically unfavorable without public incentives/financial support. Even with public subsidies, the current amounts granted by the European Community do not fully satisfy the owners and possessors of agricultural plots undergoing conversion to forest, particularly in the case of highly productive crops such as vineyards, vegetables and fruit trees.
The potential and corresponding economic value of the ESs generated by a bioengineering intervention like afforestation depend greatly on the exact location where this is carried out. The selection criteria relating to public notices [35] and other national scale “PNRR Reforestation” [36] do not include sub-criteria valid at the level of a single basin, thus making the interventions ineffective or even economically unsustainable, with consequences linked to a lower effectiveness of the interventions or even a reallocation of funds due to a lack of requests. In addition to being consistent with the specific area of intervention, these sub-criteria should also ensure that future beneficiaries are obliged to allocate equal surface areas to the agricultural crops replaced, with a view to food security, and not necessarily in the same area of intervention.
Therefore, the results of this study may help develop new management strategies for the Lato River Basin, to be implemented through a better distribution of EU rural development funds that take into account the actual economic productivity of each area deemed suitable for naturalistic engineering interventions aimed at mitigating and slowing erosion. Reforestation measures, which must be implemented over a long period of time to fulfill their intended purpose, should nevertheless include public contributions for maintenance investments and foregone income from the most significant productive crops. This should ensure not only maintenance of the converted areas but also adequate compensation for those who decide to undertake reforestation projects in highly productive areas, which will benefit the entire community.

Author Contributions

Conceptualization, C.A., F.G. and R.R.; methodology, G.R.R., G.O.P., G.F.R. and V.L.; validation, G.R.R., A.D.B. and R.R.; formal analysis, G.R.R., G.O.P., M.C. and V.L.; investigation, G.R.R., G.O.P., M.C. and V.L.; data curation, G.R.R., M.C. and V.L.; writing—original draft preparation, G.R.R., G.O.P., M.C., G.F.R. and V.L.; writing—review and editing, C.A., A.D.B., F.G. and R.R.; visualization, G.R.R., G.O.P., M.C. and V.L.; supervision, F.G. and R.R. All authors have read and agreed to the published version of the manuscript.

Funding

This research received no specific grant from funding agencies in the public, commercial or non-profit sectors.

Data Availability Statement

The data presented in this study are available on request from the corresponding author (the data are not publicly available due to privacy).

Acknowledgments

This study was carried out within the PRIN project “Soil Conservation for sustainable Agriculture in the framework of the European green deal” (SCALE). The authors would like to thank Rosalia Facendola for her collaboration in reviewing the layout.

Conflicts of Interest

The authors declare no conflicts of interest.

Appendix A

Figure A1. Scenario 1: Afforestation interventions in the areas with the highest erosion with the addition of buffer areas of 48 m width. Total afforestation area = 3500 ha (authors’ elaboration).
Land 14 01936 g0a1
Figure A2. Scenario 2: Afforestation interventions in the areas with medium erosion, cultivated as cereal crops, no less than 150 m from river networks and with an area between 1.00 and 20.00 ha (according to the current regulations). Total afforestation area = 3500 ha (authors’ elaboration).
Land 14 01936 g0a2
Table A1. Basin-scale statistical analysis of the spatial distributions of erosion and the four ecosystem services under Scenarios 0, 1 and 2 (authors’ elaboration).
SCENARIO MINMAXRANGEMEANSTDSUMValore Ha
0Erosion0.0062.8962.891.021.7211,037,428.40
Habitat (no.)0.004.004.002.001.0122,789,879.00
Habitat (EUR)0.00 7313.837313.831663.061146.7818,862,661,079.001662.45
Carbon (Mg/ha)0.0638.1938.138.3811.3995,099,511.40
CO2 (ton)0.23139.78139.5630.6841.70348,064,211.72
Carbon (EUR/ton)15.799747.059731.262139.312907.68 24,270,517,483.54 2139.06
Tourism value (no.)0.004.144.140.800.769,120,989.29
Tourism value (no./ha)0.000.0270.0270.0050.00558,374.33
Tourism value (EUR/ha)0.0010.6910.692.081.9523,547,621.57324.27
Productivity (EUR/ha)0.00 24,564.8024,564.805612.938438.9463,679,685,688.185612.36
1Erosion0.0010.0010.000.841.309,113,727.28
Habitat (no.)0.004.004.002.051.0123,304,160.00
Habitat (EUR)34.647313.837313.831757.901180.0819,939,154,841.031757.32
Carbon (Mg/ha)0.0638.1938.139.1911.77104,282,348.17
CO2 (ton)0.23139.78139.5633.6443.08381,673,394.30
Carbon (EUR/ton)15.799747.059731.262345.873004.0926,614,085,783.972345.61
Tourism value (no.)0.004.144.140.840.779,562,061.29
Tourism value (no./ha)0.000.030.030.010.0061,197.19
Tourism value (EUR/ha)0.0010.6910.69 2.18 1.9924,686,335.38 339.95
Productivity (EUR/ha)0.0024,564.8024,564.805384.198333.3161,084,878,858.41 5383.67
2Erosion0.0062.8962.890.881.659,443,885.25
Habitat (no.)0.004.004.002.061.03233,674,67.00
Habitat (EUR)0.007313.837313.831674.201140.5518,988,943,104.671673.58
Carbon (Mg/ha)0.0638.1938.139.5011.87107,750,405.6
CO2 (ton)0.23139.78139.5634.7643.44394,366,484.40
Carbon (EUR/ton)15.79 9747.059731.262423.883029.0227,499,174,957.072423.62
Tourism value (no.)0.004.144.140.850.789,673,038.56
Tourism value (no./ha)0.000.030.030.010.0161,907.45
Tourism value (EUR/ha)0.0010.6910.692.202.0224,972,844.97343.90
Productivity (EUR/ha)0.0024,564.8024,564.805493.098451.7262,320,593,389.905492.58
Figure A3. Mapping of catchment erosion under Scenarios 0, 1 and 2 (authors’ elaboration).
Land 14 01936 g0a3
Figure A4. Mapping of the total organic carbon content of the basin under Scenarios 0, 1 and 2 (authors’ elaboration).
Land 14 01936 g0a4
Figure A5. Mapping of basin habitat quality under Scenarios 0, 1 and 2 (authors’ elaboration).
Land 14 01936 g0a5
Figure A6. Mapping the basin’s suitability for sustainable tourism in Scenarios 0, 1 and 2 (authors’ elaboration).
Land 14 01936 g0a6
Figure A7. Mapping of crop productivity in the basin under Scenarios 0, 1 and 2 (authors’ elaboration).
Land 14 01936 g0a7
Table A2. Financial convenience in the transformation of agricultural land and pastures into forests (cost–benefit analysis and replacement cost) (authors’ elaboration).
Land Use Classes
(Corine 2012)
Carbon (Ton/ha)Conversion into Euros of CO2 (EUR/ton/ha)Monetary Revaluation of Habitat Quality 2007 > 2015
(EUR/ha)
Agric. and Forestry Production Before Afforestation
(EUR/ha)
Agric and Forestry Production After Afforestation
(EUR/ha)
Sustainable Tourism Suitability (EUR/ha)Increase in S.E. (EUR/ha) × 12 yearsDecrease in S.E. (EUR/ha) × 12 yearsEconomic
Advantage
(EUR/ha) × 12 years
Replacement CostCosts Authorized by PSR Puglia (EUR/ha)Lost Income
(EUR/ha)
Lost Income for 12 Years
(EUR/ha)
Maintenance
(EUR/ha)
Total Cost
(EUR/ha) (1)
Financial Convenience (EUR/ha)
Vineyards25.806584.461806.8324,564.83155.96601.0537,350.56294,777.96−257,427.4018,192.0010,500.00950.0011,400.0034,154.40 56,054.40−201,373.00
Olive groves25.806584.461806.836095.00155.96645.4237,883.0373,140.00−35,256.9718,192.0010,500.00550.006600.0034,154.40 51,254.40 15,997.43
Orchards and minor fruits25.806584.461806.8318,499.75155.96504.2436,188.79221,997.00−185,808.2118,192.0010,500.00950.0011,400.0034,154.4056,054.40−129,753.81
Vegetable gardens and seasonal crops25.806584.461806.8329,324.25155.96471.9735,801.54351,891.00−316,089.4618,192.0010,500.00700.008400.0034,154.40 53,054.40−263,035.06
Non-irrigated arable crops25.806584.461806.831887.50155.96665.5938,125.0722,650.0015,475.0718,192.0010,500.00400.004800.0034,154.4049,454.40 33,979.33
Wooded areas25.806584.461806.83155.96155.96693.8338,463.911871.5236,592.390.000.000.000.000.000.0036,592.39
Natural pasture areas and meadows25.806584.461806.830.00155.96722.0738,802.760.0038,802.760.000.000.000.000.00 0.0038,802.76
Shrubs and scrub25.806584.461806.830.00155.96689.8038,415.510.0038,415.510.000.000.000.00 0.000.0038,415.51

References

  1. Young, I.M.; Crawford, J.W. Interactions and Self-Organization in the Soil-Microbe Complex. Science 2004, 304, 1634–1637. [Google Scholar] [CrossRef] [PubMed]
  2. Greenland, D.J.; Szabolcs, I. Soil Resilience and Sustainable Land Use; CAB International: Wallingford, CT, USA, 1994; ISBN 978-0-85198-871-9. [Google Scholar]
  3. Amundson, R.; Berhe, A.A.; Hopmans, J.W.; Olson, C.; Sztein, A.E.; Sparks, D.L. Soil and Human Security in the 21st Century. Science 2015, 348, 1261071. [Google Scholar] [CrossRef]
  4. Robinson, D.A.; Panagos, P.; Borrelli, P.; Jones, A.; Montanarella, L.; Tye, A.; Obst, C.G. Soil Natural Capital in Europe; a Framework for State and Change Assessment. Sci. Rep. 2017, 7, 6706. [Google Scholar] [CrossRef] [PubMed]
  5. FAO. The Status of the World’s Soil Resources (SWSR)—Main Report Food and Agriculture Organization of the United Nations and Intergovernmental Technical Panel on Soils; FAO and ITPS: Rome, Italy, 2015. [Google Scholar]
  6. Borrelli, P.; Robinson, D.A.; Fleischer, L.R.; Lugato, E.; Ballabio, C.; Alewell, C.; Meusburger, K.; Modugno, S.; Schütt, B.; Ferro, V.; et al. An Assessment of the Global Impact of 21st Century Land Use Change on Soil Erosion. Nat. Commun. 2017, 8, 2013. [Google Scholar] [CrossRef]
  7. van den Born, G.J.; De Haan, B.J.; Pearce, D.W.; Howarth, A. Technical Report on Soil Degradation in Europe: An Integrated Economic and Environmental Assessment; RIVM, EFTEC, NTUA and IIASA in association with TME and TNO under contract with the Environment Directorate-General of the European Commission; PBL Netherlands Environmental Assessment Agency: The Hague, The Netherlands, 2000. [Google Scholar]
  8. Romanazzi, G.R.; Ottomano Palmisano, G.; Cioffi, M.; Leronni, V.; Toromani, E.; Koto, R.; De Boni, A.; Acciani, C.; Roma, R. A Cost–Benefit Analysis for the Economic Evaluation of Ecosystem Services Lost Due to Erosion in a Mediterranean River Basin. Land 2024, 13, 1512. [Google Scholar] [CrossRef]
  9. López-Vicente, M.; Sun, X.; Onda, Y.; Kato, H.; Gomi, T.; Hiraoka, M. Effect of Tree Thinning and Skidding Trails on Hydrological Connectivity in Two Japanese Forest Catchments. Geomorphology 2017, 292, 104–114. [Google Scholar] [CrossRef]
  10. Costanza, R.; d’Arge, R.; De Groot, R.; Farber, S.; Grasso, M.; Hannon, B.; Limburg, K.; Naeem, S.; O’Neill, R.V.; Paruelo, J.; et al. The Value of the World’s Ecosystem Services and Natural Capital. Nature 1997, 387, 253–260. [Google Scholar] [CrossRef]
  11. Millennium Ecosystem Assessment (Program) (Ed.) Ecosystems and Human Well-Being; Island Press: Washington, DC, USA, 2005; ISBN 978-1-59726-040-4. [Google Scholar]
  12. Barrios, E. Soil Biota, Ecosystem Services and Land Productivity. Ecol. Econ. 2007, 64, 269–285. [Google Scholar] [CrossRef]
  13. Williams, A.; Hedlund, K. Indicators of Soil Ecosystem Services in Conventional and Organic Arable Fields along a Gradient of Landscape Heterogeneity in Southern Sweden. Appl. Soil Ecol. 2013, 65, 1–7. [Google Scholar] [CrossRef]
  14. Adhikari, K.; Hartemink, A.E. Linking Soils to Ecosystem Services—A Global Review. Geoderma 2016, 262, 101–111. [Google Scholar] [CrossRef]
  15. Deng, S.; Shi, Y.; Jin, Y.; Wang, L. A GIS-Based Approach for Quantifying and Mapping Carbon Sink and Stock Values of Forest Ecosystem: A Case Study. Energy Procedia 2011, 5, 1535–1545. [Google Scholar] [CrossRef]
  16. Trabucchi, M.; O’Farrell, P.J.; Notivol, E.; Comín, F.A. Mapping Ecological Processes and Ecosystem Services for Prioritizing Restoration Efforts in a Semi-Arid Mediterranean River Basin. Environ. Manag. 2014, 53, 1132–1145. [Google Scholar] [CrossRef] [PubMed]
  17. Plieninger, T.; Dijks, S.; Oteros-Rozas, E.; Bieling, C. Assessing, Mapping, and Quantifying Cultural Ecosystem Services at Community Level. Land Use Policy 2013, 33, 118–129. [Google Scholar] [CrossRef]
  18. Seppelt, R.; Dormann, C.F.; Eppink, F.V.; Lautenbach, S.; Schmidt, S. A Quantitative Review of Ecosystem Service Studies: Approaches, Shortcomings and the Road Ahead: Priorities for Ecosystem Service Studies. J. Appl. Ecol. 2011, 48, 630–636. [Google Scholar] [CrossRef]
  19. Vrebos, D.; Staes, J.; Vandenbroucke, T.; D’Haeyer, T.; Johnston, R.; Muhumuza, M.; Kasabeke, C.; Meire, P. Mapping Ecosystem Service Flows with Land Cover Scoring Maps for Data-Scarce Regions. Ecosyst. Serv. 2015, 13, 28–40. [Google Scholar] [CrossRef]
  20. De Groot, R.S.; Wilson, M.A.; Boumans, R.M.J. A Typology for the Classification, Description and Valuation of Ecosystem Functions, Goods and Services. Ecol. Econ. 2002, 41, 393–408. [Google Scholar] [CrossRef]
  21. Kumar, P. (Ed.) The Economics of Ecosystems and Biodiversity: Ecological and Economic Foundations; Routledge: London, UK, 2012; ISBN 978-1-136-53880-3. [Google Scholar]
  22. Kareiva, P.; Tallis, H.; Ricketts, T.H.; Daily, G.C.; Polasky, S. (Eds.) Natural Capital: Theory and Practice of Mapping Ecosystem Services; Oxford University Press: Oxford, UK, 2011; ISBN 978-0-19-958899-2. [Google Scholar]
  23. Pereira, P.; Brevik, E.C.; Muñoz-Rojas, M.; Miller, B.A. (Eds.) Soil Mapping and Process Modeling for Sustainable Land Use Management; Elsevier: Amsterdam, The Netherlands, 2017; ISBN 978-0-12-805200-6. [Google Scholar]
  24. Steinhoff-Knopp, B.; Kuhn, T.K.; Burkhard, B. The Impact of Soil Erosion on Soil-Related Ecosystem Services: Development and Testing a Scenario-Based Assessment Approach. Environ. Monit. Assess. 2021, 193, 274. [Google Scholar] [CrossRef]
  25. Sartori, M.; Philippidis, G.; Ferrari, E.; Borrelli, P.; Lugato, E.; Montanarella, L.; Panagos, P. A Linkage between the Biophysical and the Economic: Assessing the Global Market Impacts of Soil Erosion. Land Use Policy 2019, 86, 299–312. [Google Scholar] [CrossRef]
  26. Economic Research Service. European Union—Common Agricultural Policy. Available online: https://www.ers.usda.gov/topics/international-markets-us-trade/countries-regions/european-union/common-agricultural-policy (accessed on 8 September 2025).
  27. Panagos, P.; Katsoyiannis, A. Soil Erosion Modelling: The New Challenges as the Result of Policy Developments in Europe. Environ. Res. 2019, 172, 470–474. [Google Scholar] [CrossRef]
  28. European Commission. Soil Strategy for 2030. Available online: https://environment.ec.europa.eu/topics/soil-health/soil-strategy-2030_en (accessed on 7 August 2025).
  29. McBratney, A.; Field, D.J.; Koch, A. The Dimensions of Soil Security. Geoderma 2014, 213, 203–213. [Google Scholar] [CrossRef]
  30. Robinson, D.A.; Fraser, I.; Dominati, E.J.; Davíðsdóttir, B.; Jónsson, J.O.G.; Jones, L.; Jones, S.B.; Tuller, M.; Lebron, I.; Bristow, K.L.; et al. On the Value of Soil Resources in the Context of Natural Capital and Ecosystem Service Delivery. Soil. Sci. Soc. Am. J. 2014, 78, 685–700. [Google Scholar] [CrossRef]
  31. García-Ruiz, J.M. The Effects of Land Uses on Soil Erosion in Spain: A Review. Catena 2010, 81, 1–11. [Google Scholar] [CrossRef]
  32. Chen, Y.; Wang, K.; Lin, Y.; Shi, W.; Song, Y.; He, X. Balancing Green and Grain Trade. Nat. Geosci. 2015, 8, 739–741. [Google Scholar] [CrossRef]
  33. Liu, Y.-F.; Liu, Y.; Shi, Z.-H.; López-Vicente, M.; Wu, G.-L. Effectiveness of Re-Vegetated Forest and Grassland on Soil Erosion Control in the Semi-Arid Loess Plateau. Catena 2020, 195, 104787. [Google Scholar] [CrossRef]
  34. Amoruso, A.; Luisi, N.; Sanesi, G. Prime valutazioni su alcuni impianti di arboricoltura realizzati in Pugllia nell’ambito della campagnia 1994/96 del Reg. CEE 2080/92. L’Italia For. Mont. 2005, 3, 293–316. [Google Scholar]
  35. Bando Sottomisura 8.1—2022—PSR Puglia. Available online: https://psr.regione.puglia.it/bando-sottomisura-8.1-2022 (accessed on 7 August 2025).
  36. Avviso Pubblico per La Presentazione Di Proposte Di Intervento Di Forestazione Urbana, Periurbana Ed Extraurbana Nelle Città Metropolitane—Annualità 2023/2024. Available online: https://www.mase.gov.it/portale/-/avviso-pubblico-per-la-presentazione-di-proposte-di-intervento-di-forestazione-urbana-periurbana-ed-extraurbana-nelle-citta-metropolitane-annualita-2023-2024 (accessed on 8 September 2025).
  37. InVEST | Natural Capital Project. Available online: https://naturalcapitalproject.stanford.edu/software/invest (accessed on 7 August 2025).
  38. Sharp, R.; Chaplin-Kramer, R.; Wood, S.; Guerry, A.; Tallis, H.; Ricketts, T.; Nelson, E.; Ennaanay, D.; Wolny, S.; Olwero, N.; et al. InVEST User’s Guide; The Natural Capital Project; Stanford University: Stanford, CA, USA; University of Minnesota: Minneapolis, MN, USA; The Nature Conservancy: Arlington, VA, USA; World Wildlife Fund: Washington, DC, USA, 2018. [Google Scholar]
  39. Caliandro, A.; Lamaddalena, N.; Stelluti, M.; Steduto, P. Riorientamenti Produttivi Del Territorio Agricolo Pugliese per Uno Sviluppo Rurale Sostenibile; CIHEAM: Bari, Italy, 2005; ISBN 2-85352-395-0. [Google Scholar]
  40. Bagarello, V.; Ferro, V. Erosione e Conservazione Del Suolo; McGraw-Hill: Milano, Italy, 2006; ISBN 88-386-6311-4. [Google Scholar]
  41. Valutazione Ex-Post—PSR 2007–2013 Puglia. Available online: https://www.reterurale.it/flex/cm/pages/ServeBLOB.php/L/IT/IDPagina/24783 (accessed on 8 September 2025).
  42. Direttiva—92/43—IT—EUR-Lex. Available online: https://eur-lex.europa.eu/eli/dir/1992/43/oj/ita (accessed on 15 September 2025).
  43. Piano Assetto Idrogeologico—Pericolosità Idraulica. Available online: https://www.distrettoappenninomeridionale.it/oldsite/index.php/elaborati-di-piano-menu/ex-adb-puglia-menu/piano-assetto-idrogeologico-pericolosita-idraulica-menu (accessed on 8 September 2025).
  44. Gazzetta Ufficiale. Available online: https://www.gazzettaufficiale.it/dettaglio/codici/materiaAmbientale (accessed on 8 September 2025).
  45. Vigiak, O.; Borselli, L.; Newham, L.T.H.; McInnes, J.; Roberts, A.M. Comparison of Conceptual Landscape Metrics to Define Hillslope-Scale Sediment Delivery Ratio. Geomorphology 2012, 138, 74–88. [Google Scholar] [CrossRef]
  46. Gasperini, P.; Di Cosmo, L.; Pompei, E. Il Contenuto Di Carbonio Delle Foreste Italiane. Inventario Nazionale Delle Foreste e Dei Serbatoi Forestali Di Carbonio; CREA: Rome, Italy, 2013; ISBN 978-88-97081-36-4. [Google Scholar]
  47. Iglesias, D.J.; Quiñones, A.; Font, A.; Martínez-Alcántara, B.; Forner-Giner, M.Á.; Legaz, F.; Primo-Millo, E. Carbon Balance of Citrus Plantations in Eastern Spain. Agric. Ecosyst. Environ. 2013, 171, 103–111. [Google Scholar] [CrossRef]
  48. Proietti, S.; Sdringola, P.; Desideri, U.; Zepparelli, F.; Brunori, A.; Ilarioni, L.; Nasini, L.; Regni, L.; Proietti, P. Carbon Footprint of an Olive Tree Grove. Appl. Energy 2014, 127, 115–124. [Google Scholar] [CrossRef]
  49. ISO 14235:1998; Soil Quality—Determination of Organic Carbon by Sulfochromic Oxidation. ISO: Geneva, Switzerland, 1998. Available online: https://www.iso.org/standard/23140.html (accessed on 25 July 2025).
  50. Prezzi CO2—Sendeco2. Available online: https://www.sendeco2.com/it/prezzi-co2 (accessed on 25 July 2025).
  51. Investing.Com—Stock Market Quotes & Financial News. Available online: https://www.investing.com/ (accessed on 25 July 2025).
  52. Carta Della Natura. Available online: https://www.isprambiente.gov.it/it/servizi/sistema-carta-della-natura (accessed on 7 August 2025).
  53. Costanza, R.; De Groot, R.; Sutton, P.; Van Der Ploeg, S.; Anderson, S.J.; Kubiszewski, I.; Farber, S.; Turner, R.K. Changes in the Global Value of Ecosystem Services. Glob. Environ. Change 2014, 26, 152–158. [Google Scholar] [CrossRef]
  54. Purchasing Power Parities (PPP). Available online: https://www.oecd.org/en/data/indicators/purchasing-power-parities-ppp.html (accessed on 25 July 2025).
  55. Istat—Rivaluta. Available online: https://rivaluta.istat.it/ (accessed on 25 July 2025).
  56. Carta Tipi Forestali. Available online: https://webapps.sit.puglia.it/freewebapps/CartaTipiForestali/index.html (accessed on 25 July 2025).
  57. Il Turismo in Puglia—Osservatorio. Available online: https://osservatorio.dms.puglia.it/knowage-vue/document-composite/Homepage_public (accessed on 28 July 2025).
  58. ARET—Agenzia Regionale Del Turismo Pugliapromozione—Liferay. Available online: https://aret.regione.puglia.it/ (accessed on 28 July 2025).
  59. Elenco Prezzi Opere Pubbliche. Available online: https://www.regione.puglia.it/web/territo-rio-mobilita-e-infrastrutture/elenco-prezzi-opere-pubbliche (accessed on 25 July 2025).
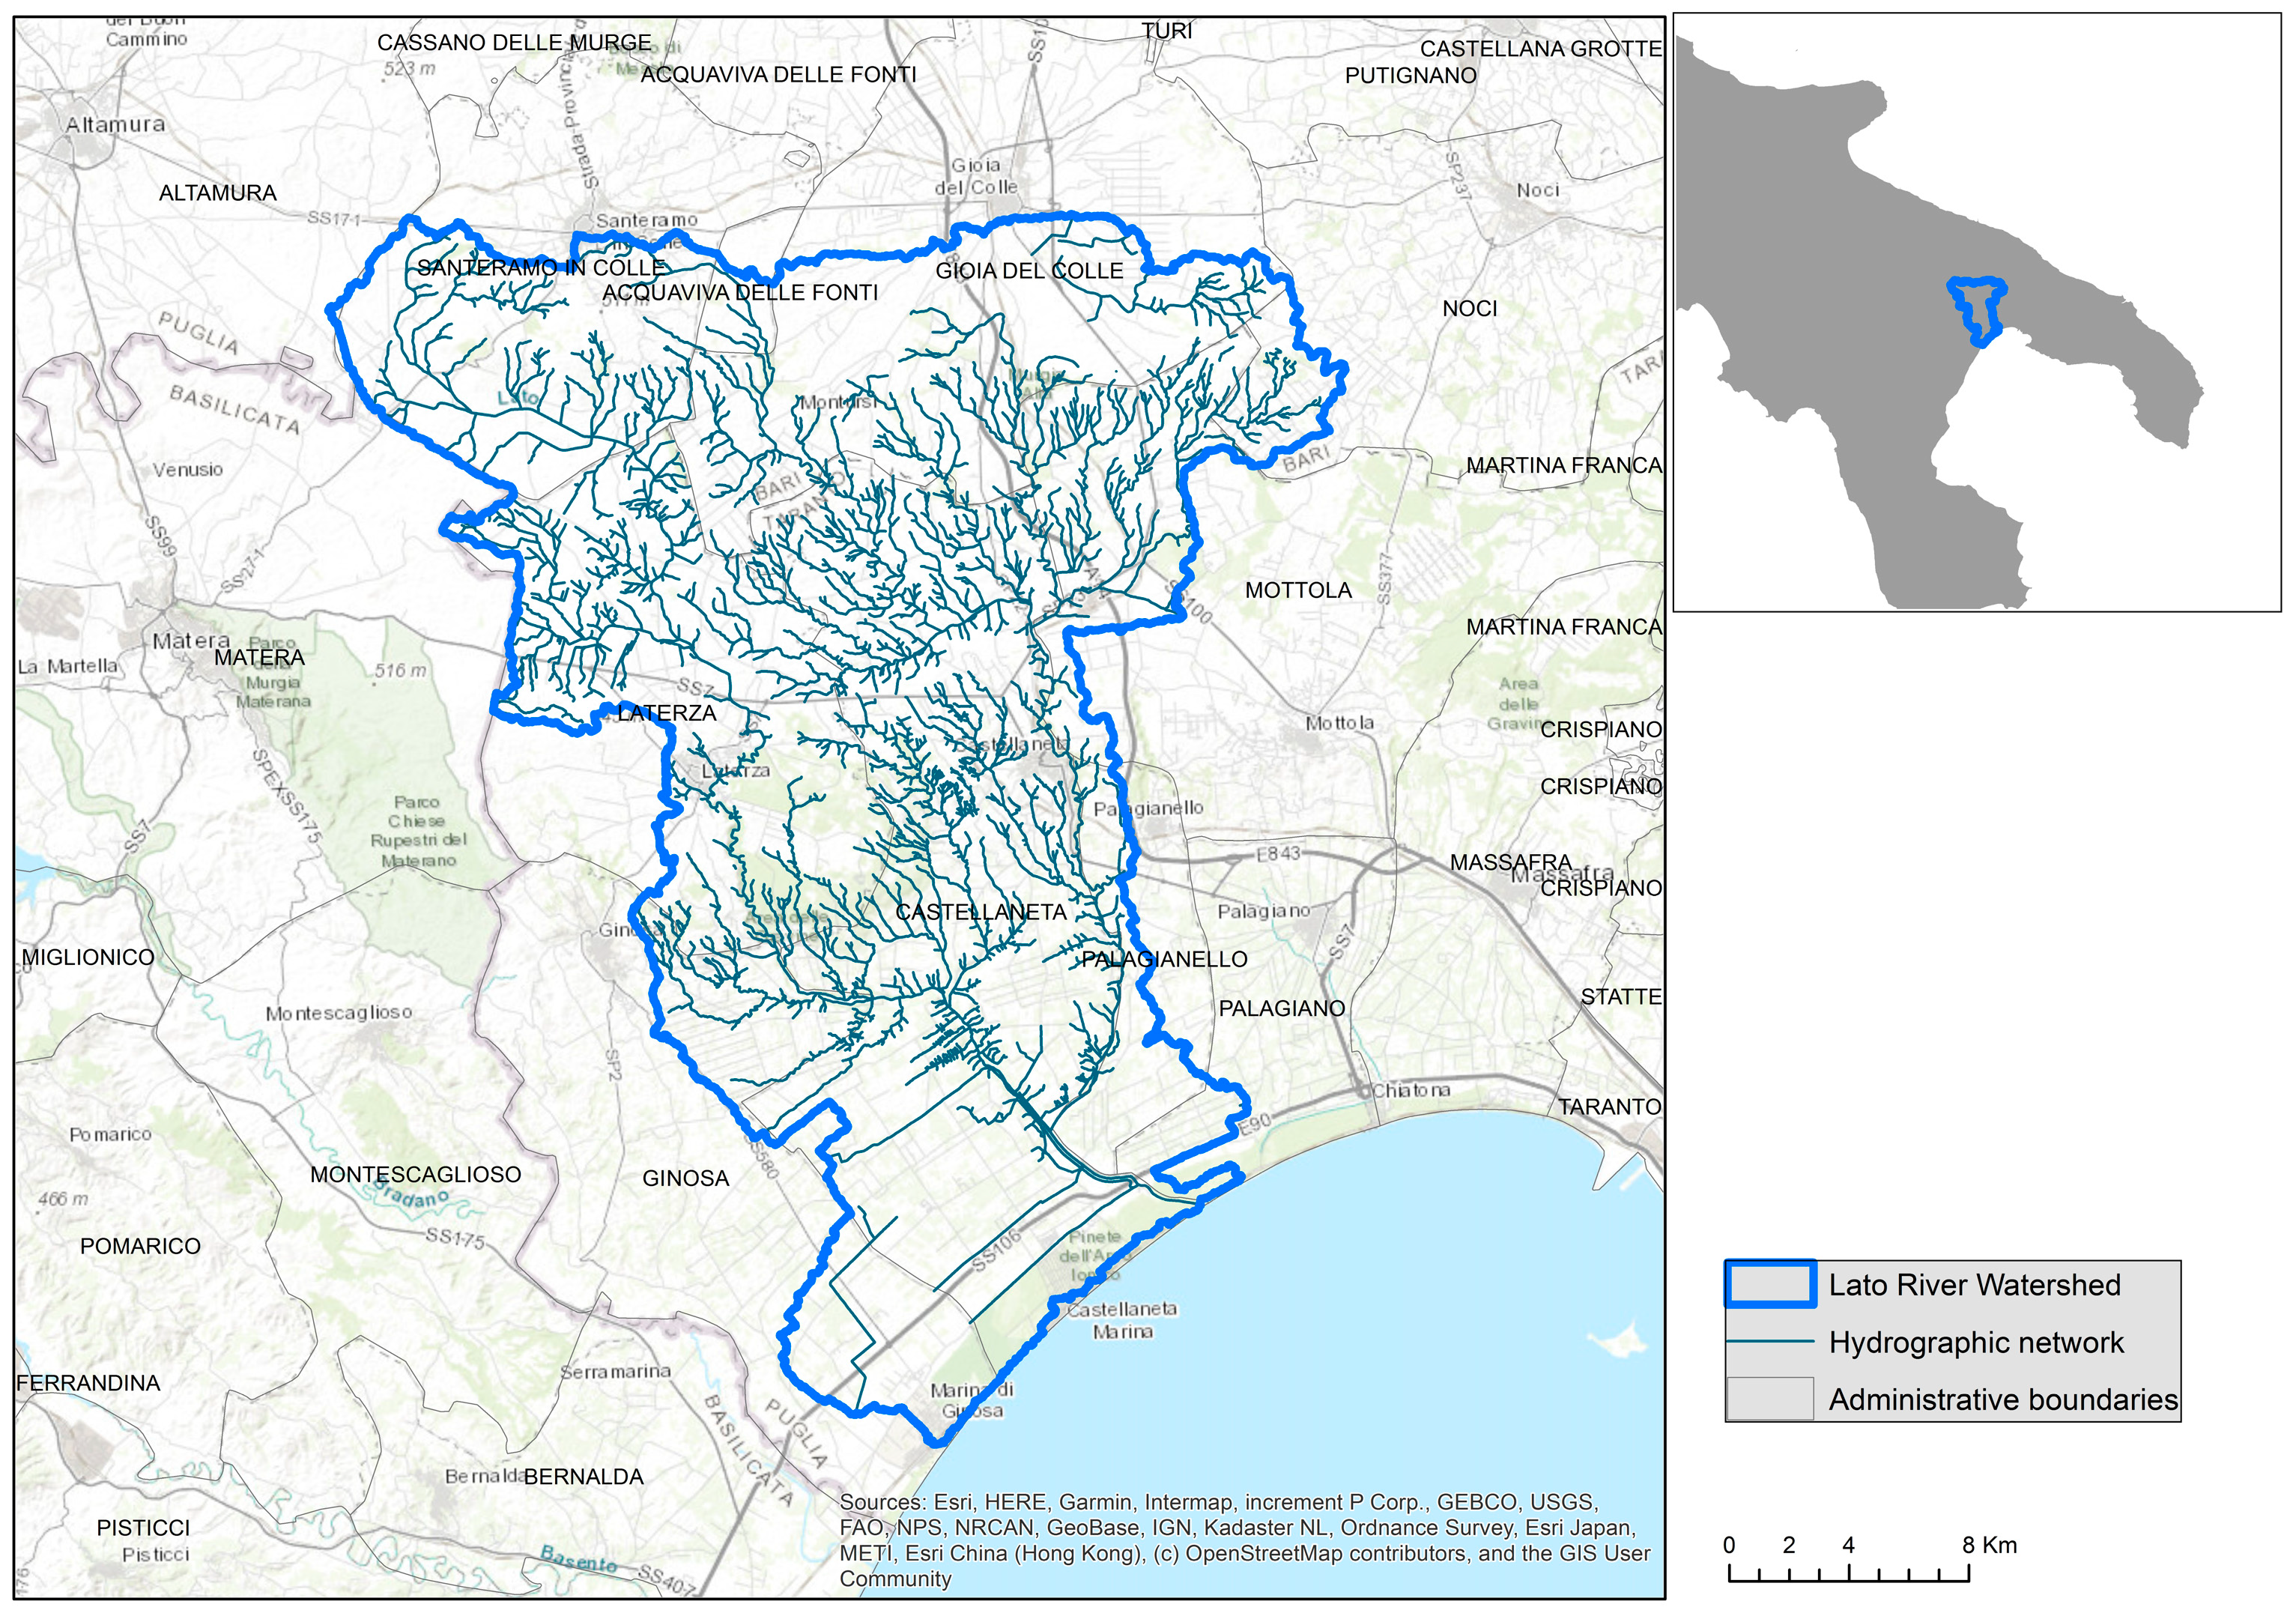
Figure 1. Lato River watershed on a topographic map (authors’ elaboration).
Land 14 01936 g001
Figure 2. (A) Geological types in the Lato River watershed (authors’ elaboration). (B) Altimetric distribution in the Lato River watershed (authors’ elaboration).
Land 14 01936 g002aLand 14 01936 g002b
Figure 3. Economic evaluation methods of ecosystem services (authors’ elaboration) [10].
Land 14 01936 g003
Table 1. Lato River watershed and distribution of the areas of each municipality.
MunicipalityArea
(km2)
Castellaneta243.3
Laterza126.8
Gioia del Colle119.9
Santeramo in Colle81.3
Ginosa55.6
Mottola54.1
Palagianello24.6
Noci13.6
Palagiano 8.7
Acquaviva delle Fonti7.0
Altamura0.2
Table 2. Distribution of land use classes (area and percentage) affected by afforestation in Scenario 1 and Scenario 2 (authors’ elaboration).
Economic ProductivityLand UseSCENARIO 1SCENARIO 2
ha%ha%
HighVineyards460.4513.1600
Olive groves339.589.7000
Orchards and minor fruits60.861.7400
Simple arable crops in irrigated areas (vegetable gardens)92.532.6400
MediumSimple arable land in non-irrigated areas1450.9741.463500100
Other crops14.210.4100
Low (natural areas)Wooded areas393.3011.2400
Natural pasture areas and meadows210.135.7500
Shrubs319.489.1300
Surface water17.740.5100
Other uses149.764.2800
Total 3500100.003500100.00
Table 3. Ecological values and relative converted economic values (authors’ elaboration).
Type of Land Use and Relative Converted Economic Value (EUR/ha/year 2007, Updated to April 2025)
ValueHabitat ValueConiferous and Deciduous ForestsPastures and ScrubsAgricultural CropsCoastal SystemsRivers and Lakes
0Null00000
1Low1294.56116.92788.2424.671363.39
2Medium1550.701941.681576.4829.653346.43
3High1806.843766.442364.7134.645330.22
4Very high2062.005591.213152.9539.677313.83
Table 4. Standard values for each crop (authors’ elaboration).
Agricultural CropStandard Value EUR/ha/year
Wine vine14,755.66
Table vine34,374.00
Olive6095.00
Cherry tree14,700.00
Peaches33,649.00
Almonds11,453.00
Wheat (average between hard and soft)2260.00
Legumes (average between lentils and chickpeas)1877.50
Pasture326.00
Pasture meadow770.00
Legume and grass crops (average)1362.50
Trifoglio2050.00
Mandarances (average between late and early)14,197.00
Vegetables (average among melons, radish, celery and spinach)29,324.25
Table 5. Economical productivity of forest (authors’ elaboration).
Forest Types (1)Pinus Halepensis ForestsPlantations of Other Broadleaf Trees (Eucalyptus)Quercus Ilex and Fraxinus Ornus ForestsOther Evergreen Broadleaf ForestsCarpinus sp. ForestsOak ForestsQuercus Petrea and Q. Pubescens Forests
Corg content (Mg/ha) in above-ground biomass24.23.622113633.1025
Conversion to EUR145221630801272430839722964
Annual value EUR145.2021.6015463.60215.40198.60148.20
Table 6. Territorial elements related to tourism suitability (authors’ elaboration).
Territorial ElementsStandard Value EUR/ha/year
Network of pathsThe network of pedestrian roads and hiking trails
Points of interest for accommodation and recreationRestaurants, bars, hotels, sports facilities
Point of cultural interestCultural element and historical–cultural elements, archaeological areas
Natural protected areasParks, reserves and Natura 2000 areas
Woods, plantations, etc.
Table 7. Data on total tourist flows in the basin for 2024 (authors’ elaboration).
MunicipalityTourist Flows (Arrivals in 2024)SourceAmount for Overnight Stay with Full Board
(Average Value)
(EUR)
SourcePercentage of Municipal Surface Area Falling within the BasinTourist Flow (Number of Visitors)Average Service Value (EUR)
Castellaneta57,701BIT Milano372Puglia promozione100.00%57,70121,464,772.00
Ginosa26,760BIT Milano225 84.00%22,478.45,057,640.00
Gioia del Colle16,901Pugliapromozione103.71 74.37%12,569.271,303,559.38
Laterza4319Oasi Lipu Laterza84 100.00%4319362,796.00
Mottola8169Pugliapromozione123 18.57%1516.98186,588.95
Noci15,127 130 20.90%3161.54411,000.59
Palagianello1094 110 45.21%494.6054,405.71
Santeramo in Colle6836 120 55.14%3769.37452,324.45
Total136,907 158.464 106,010.1729,293,087.07
Table 8. Comparison of soil erosion values in Scenario 0, Scenario 1 and Scenario 2.
EROSION (t/ha/year)
ScenarioMinMaxRangeMeanStdSum
00.0062.8962.891.021.7211,037,428.40
10.0010.0010.000.841.309,113,727.28
20.0062.8962.890.881.659,443,885.25
Table 12. Comparison of ecological value of habitat quality in Scenario 0, Scenario 1 and Scenario 2.
Habitat
Scenario MinMaxRangeMeanStdSum
0no.0.004.004.002.001.0122,789,879.00
EUR0.007313.837313.831663.061146.7818,862,661,079.00
1no.0.004.004.002.051.0123,304,160.00
EUR34.647313.837313.831757.901180.0819,939,154,841.03
2no.0.004.004.002.061.03233,674,67.00
EUR0.007313.837313.831674.201140.5518,988,943,104.67
Table 13. Comparison of sustainable tourism suitability in Scenario 0, Scenario 1 and Scenario 2.
TOURISM
Scenario MinMaxRangeMeanStdSum
0no.0.004.144.140.800.769,120,989.29
no./ha0.000.0270.0270.0050.00558,374.33
EUR/ha0.0010.6910.692.081.9523,547,621.57
1no.0.004.144.140.840.779,562,061.29
no./ha0.000.030.030.010.0061,197.19
EUR/ha0.0010.6910.692.181.9924,686,335.38
2no.0.004.144.140.850.789,673,038.56
no./ha0.000.030.030.010.0161,907.45
EUR/ha0.0010.6910.692.202.0224,972,844.97
Table 14. Comparison of production values in Scenario 0, Scenario 1 and Scenario 2.
PRODUCTIVITY (EUR/ha)
ScenarioMinMaxRangeMeanStdSum
00.0024,564.8024,564.805612.938438.9463,679,685,688.18
10.0024,564.8024,564.805384.198333.3161,084,878,858.41
20.0024,564.8024,564.805493.098451.7262,320,593,389.90
Disclaimer/Publisher’s Note: The statements, opinions and data contained in all publications are solely those of the individual author(s) and contributor(s) and not of MDPI and/or the editor(s). MDPI and/or the editor(s) disclaim responsibility for any injury to people or property resulting from any ideas, methods, instructions or products referred to in the content.