Article

City Health Assessment: Urbanization and Eco-Environment Dynamics Using Coupling Coordination Analysis and FLUS Model—A Case Study of the Pearl River Delta Urban Agglomeration

1
School of Politics and Public Administration, South China Normal University, Guangzhou 510006, China
2
School of Architecture and Urban Planning, Guangdong University of Technology, Guangzhou 510006, China
3
Department of Urban Regeneration and Planning Theory, University of Kassel, D-34127 Kassel, Germany
4
Zhejiang Hanyu Design Co. Ltd., No. 569 Jiangbin North Road, Jinhua 322001, China
*
Author to whom correspondence should be addressed.
Land 2025, 14(1), 46; https://doi.org/10.3390/land14010046
Submission received: 16 October 2024 / Revised: 13 December 2024 / Accepted: 26 December 2024 / Published: 28 December 2024

Abstract

:
Rapid urbanization in China has profoundly transformed its urban systems, bringing about considerable ecological challenges and significant imbalances between urban growth and ecological health. The Pearl River Delta (PRD) urban agglomeration, as one of China’s most economically dynamic regions, exemplifies the complex interactions between rapid urbanization and environmental sustainability. This study examined these dynamics using statistical yearbook and geographic information data from 1999 to 2018. Through a multi-scale approach integrating panel entropy, coupled coordination analysis, and FLUS models, we evaluated the relationship between urbanization and ecology at both the agglomeration and city levels. The findings revealed that while the overall coordination between urbanization and ecology in the PRD has improved, it remains at a moderate level with pronounced core-periphery disparities. Core cities face increasing ecological pressures and inefficient land use patterns. Simulation results, under three distinct policy scenarios—“unconstrained”, “growth machine”, and “compact and intensive usage/urban renewal”—and validated through field research, indicate that urban renewal presents a viable strategy for optimizing land use and mitigating ecological pressures. The study provides both a comprehensive diagnostic framework for assessing urban health and sustainability and practical intervention pathways, particularly for regions experiencing similar rapid urbanization challenges. The insights gained are especially relevant to other developing countries, offering strategies to enhance urban resilience and ecological sustainability while addressing persistent regional inequalities.

1. Introduction

1.1. Global Urban Dynamics and China’s Urbanization Challenges

The latter half of the 20th century witnessed a paradigm shift in global spatial dynamics, driven by the intensification of globalization, regional integration, and the emergence of novel governance structures [1,2]. This transformation has elevated metropolitan areas, coordinating regions, and urban agglomerations to pivotal roles in the global economic and political landscape, challenging the primacy of traditional nation-states [3,4]. Within this context, China’s urbanization trajectory since its 1978 reform and opening-up policy presents a compelling case study. The country’s urban population ratio surged from 17.92% in 1978 to 66.16% in 2023, marking one of the most rapid and extensive urbanization processes in human history [5,6]. However, this unprecedented urban growth has engendered a complex web of challenges, particularly in resource utilization and ecological preservation [7]. The pursuit of accelerated economic development has often overshadowed the criticality of the ecological carrying capacity, exacerbating what scholars term “urban diseases”—a constellation of social, environmental, and infrastructural issues plaguing rapidly expanding cities [8]. Consequently, the imperative to reconcile economic growth with environmental stewardship has emerged as a paramount concern for developing nations navigating the intricate pathways of industrialization and urbanization [9,10].

1.2. Policy Response: China’s City Assessment Framework

In response to the challenges posed by rapid urbanization, the Chinese government has instituted a comprehensive “city assessment” policy framework. The initiative was first introduced in 2018 when the Ministry of Housing and Urban-Rural Development (MOHURD) selected pilot cities to explore and practice urban assessment methodologies. This marked the beginning of systematic efforts to evaluate and guide urban development. In 2023, MOHURD issued the Guidance on Comprehensive Urban Assessment Work, which outlined detailed requirements and implementation steps for urban assessments across China. Starting from 2024, 297 Chinese cities will carry out city assessments to identify the shortcomings affecting the sustainable development of cities and the concerns of the residents as well as promote the systematic governance of “urban diseases”. The State Council of the People’s Republic of China has emphasized that integrating city assessments into national spatial planning serves multiple critical functions: it facilitates the timely identification of issues in spatial governance and urban functional layout while simultaneously promoting improvements in urban development quality [11]. Expanding on this directive, MOHURD has characterized the city assessment policy as a foundational tool for evaluating and guiding urban development in China [12]. The Ministry posits that this policy framework is instrumental in optimizing urban development objectives and addressing the multifaceted challenges collectively termed as “urban diseases”. These “urban diseases” encompass a range of issues including, but not limited to, traffic congestion, environmental degradation, and social inequality, which are common byproducts of rapid, uncontrolled urban expansion [13,14]. Therefore, carrying out a city assessment is not only an important means to address current urban governance problems, but also a key pathway to promote high-quality and sustainable development. The implementation of this policy reflects a growing recognition among Chinese policymakers of the need for data-driven, systematic approaches to urban planning and management in the face of complex, interrelated urban challenges [15].

1.3. Research Focus: Multi-Scalar Assessment of China’s Cities

In light of the aforementioned policy initiatives and implementation challenges, this study aimed to investigate the imbalances and uncoordinated phenomena related to ecological and environmental issues that have emerged during China’s rapid urbanization process. Specifically, we focused on the current developmental status of urban agglomerations in China. Existing practices and research on city assessments have predominantly concentrated on smaller urban scales such as streets, communities [16], or individual cities [17,18,19], however, there is a notable paucity of research examining city assessments at the scale of “urban agglomerations”—interconnected networks of cities that function as integrated economic and social units. Given the increasing importance of urban agglomerations in China’s spatial development strategy, this study endeavored to conduct a multi-scalar city assessment, transitioning from a “multiple cities” to a “singular city” perspective [20,21]. Our objective was to enhance the understanding of China’s urban development trajectories, with a specific focus on urban agglomerations and their core cities and aimed to elucidate the multifaceted challenges faced by developing countries in balancing rapid urbanization with coordinated ecological and environmental development. This study’s design builds on previous scholarship while offering a new perspective on the complex dynamics within urban agglomerations by zooming in from a macro to micro level. By combining large-scale assessments of urban agglomerations with detailed analyses of individual cities, the study sought to provide more comprehensive and practical references for sustainable urban planning and policy-making. By examining this complex interplay, we sought to illuminate strategies for achieving sustainable urban growth while safeguarding environmental resilience in the context of accelerated development. Through this comprehensive analysis, we aspire to contribute to the evolving discourse on urban sustainability and offer valuable insights applicable to other rapidly urbanizing regions worldwide.

2. Literature Review

2.1. Conceptual Foundations of City Assessment

As China’s urbanization process gains momentum, the city assessment has emerged as a critical tool for evaluating urban development and management efficacy. Systematic work on city assessments aims to regularly analyze, evaluate, monitor, and provide feedback on the status of urban human settlements to accurately grasp the state of urban development [22]. This comprehensive approach enables a systematic evaluation of all key urban components and continuously find the city’s advantages and problems in all aspects, facilitating the identification and precise management of “urban diseases”—a term encompassing various challenges arising from rapid urbanization. Qian et al. presented a sustainability-oriented smart city assessment framework that focused on humanity, technology, and sustainability [23]. This multifaceted approach advanced the development of smart cities in line with the new world development goals. Furthermore, Oppio et al. employed the application of the MAVT in assessing urban quality, which can be viewed as an innovative evaluation endeavor that considers both tangible and intangible aspects [24]. This approach can be useful for making better open spaces. By integrating these diverse perspectives, city assessment transcends mere problem identification to become a proactive tool for urban improvement and sustainable development.

2.2. Advancements in City Assessment Index Systems

In the realm of city assessment research, scholars have made significant strides in developing sophisticated index systems. Murakami et al. argued that CASBEE-City provides a combined evaluation of a city based on the concept of environmental efficiency [25]. Li et al. proposed a smart assessment and forecasting framework for human society, the assessment of the healthy development index in urban cities (HDI-UC) grounded in sociological evaluation models [26], where this model aims at fostering sustainable development. Further advancing the field, a study applied in Latin American cities utilized the framework of The Sustainable Development for Energy, Water, and Environment Systems (SDEWES) Index database for comparative analysis [27]. This approach aims to develop the most effective sustainable practices, thereby enhancing their reliability and practical applicability. Collectively, these scholarly contributions have significantly enriched the theoretical underpinnings and methodological approaches to index construction in city assessment, providing a robust foundation for future research and practical implementation.

2.3. Urban–Ecological Coupling in City Assessment

City assessment encompasses the intricate relationship between urbanization and ecology. Within this domain, research has explored various facets of urban development. Sun et al. employed the CRITIT-entropy weight method to investigate the coupling and coordination between urban resilience and its subsystems, providing insights into the complex dynamics of urban adaptability [28]. Luo et al. focused on exploring the interaction and coupling effects within the economy–society–environment (ESE) system in urban agglomeration areas [29]. These studies underscore the fact that the urbanization process involves comprehensive coordination between urban development and the ecological environment across multiple aspects.
The study of the relationship between urbanization and ecology has employed a diverse array of methodological approaches. Zhang et al. utilized a coupled coordination degree model [30], whereas Liu et al. employed a hybrid method using the fuzzy analytical hierarchy process (FAHP) [31]. Zeng et al. applied the entropy weight TOPSIS method [32], and Hu et al. utilized the coupled coordination degree (CCD) method to assess the degree of coordination [33]. These methodologies have significantly contributed to the establishment of comprehensive urbanization and ecological development index systems for urban agglomerations, and these analytical frameworks have enabled researchers to examine the spatial patterns of urbanization levels and ecological development within urban agglomerations as well as the spatial characteristics of their coupling and coordinated development [34]. Notable applications include the analysis of dynamic coupling and coordination relationships [35]. The widespread adoption of coupled coordinated development models has proven particularly effective in evaluating the complex interrelationships between urbanization and ecological development. Therefore, these models provide a robust framework for understanding the multifaceted dynamics of urban–ecological systems, offering valuable insights for sustainable urban planning and management.

2.4. A Data-Driven Multi-Scale Analysis Path

While the existing literature offers valuable insights into various aspects of city assessment, ecological coupling, and sustainability, a gap remains in the comprehensive evaluation of urban agglomerations. Most previous studies have focused on individual cities or specific components of urban systems, with relatively few addressing the overall dynamics, characteristics, and relationships within urban agglomerations as a whole. This study proposes the city health assessment (CHA) as a systematic approach to evaluating the comprehensive health status of urban development by examining the dynamic balance between urbanization processes and ecological environmental systems. It encompasses regular monitoring, tracking evaluation, and analytical feedback, with particular focus on the ecological pressures and resource consumption arising from rapid urbanization that affect urban sustainability. The proposed assessment framework includes:
  • Temporal dimension: Regular monitoring and tracking evaluation of urban and ecological development trends;
  • Spatial dimension: Multi-scale analysis from micro-communities to macro urban agglomerations;
  • Systematic dimension: Evaluation of interactions between urbanization and ecological systems;
  • Policy dimension: Support for evidence-based urban planning and management decisions.
To address these dimensions and fill the research gap, this study employed a data-driven approach, establishing a continuous research path from urban agglomerations down to individual cities. We began with a comprehensive evaluation at the urban agglomeration level, identifying key areas and representative cities that illustrate the coordinative relationship between urbanization and the ecological environment. The focus then shifted to a deeper analysis at the city level. By integrating existing assessment methods and analytical tools, the study aimed to address three key research questions:
  • How can we quantitatively measure and evaluate the coordination between urbanization and ecological environment in rapidly developing urban agglomerations?
  • What are the temporal-spatial characteristics of urban–ecological coupling coordination development in typical urban agglomerations?
  • How do different urban development strategies or models impact ecological resource utilization and urban–ecological coordination?
Through this systematic and multi-scale analytical framework, the study aimed to develop a more systematic and dynamic framework for evaluating urban development and provide a comprehensive understanding of the complex interactions between urbanization processes and ecological systems within urban agglomerations.

3. Methodology

3.1. Technical Route

With the accelerated process of global urbanization, urban agglomerations have become the core spaces for regional economic development and population concentration. However, rapid urban expansion often triggers issues such as ecological degradation, excessive resource consumption, and environmental pollution, severely affecting the sustainability of cities. In this context, conducting a comprehensive “city health assessment” is of great importance to diagnose the coordination level between urbanization systems and eco-environmental systems. Unlike the “urban acupuncture” approach, which focuses on housing, neighborhoods, and districts at the micro-scale, this study aimed at a macro-level health assessment of urban agglomerations. To this end, the study designed a technical route, as shown in Figure 1.
Focusing on the scale of urban agglomerations, a systematic indicator system and theoretical framework were constructed. First, the panel entropy method was used to determine the indicator weights and calculate the comprehensive development levels, ensuring the objectivity and scientific validity of the evaluation results. Second, coupling coordination analysis was applied to reveal the interaction and development dynamics between the two major systems—urbanization and the eco-environment. Finally, the FLUS model was used to simulate land use changes in individual cities under multiple policy scenarios, providing decision-making support for sustainable urban planning. This study not only offers a comprehensive diagnostic path for urban health development, but also provides strong academic support for achieving the coordinated development of urbanization and the eco-environment.

3.2. Subjects and Units of Analysis

In the context of global urbanization and regional economic integration, the Pearl River Delta (PRD) stands out as one of China’s most emblematic urban agglomerations, exhibiting remarkable economic dynamism and development potential. As a vanguard of China’s reform and opening-up policy and a crucial economic growth pole, the PRD encapsulates many of the challenges inherent in rapid urban development including resource and environmental pressures, urban functional imbalances, and ecological sustainability concerns. Consequently, selecting the PRD as the focal point for our city health assessment holds significant empirical value.
The PRD’s selection as a case study can be justified by several compelling factors (Figure 2):
Representativeness and Complexity: The PRD has undergone accelerated urbanization, achieving a high level of urban development that renders it both typical and exemplary. Its intricate urban cluster structure and pronounced economic diversification encompass a spectrum of urban development stages, from highly advanced core cities like Guangzhou and Shenzhen to comparatively less developed peripheral cities. This heterogeneity provides a multi-tiered and multidimensional analytical sample, offering insights into various urban development trajectories within a single agglomeration.
Environmental and Resource Pressures: As one of China’s most economically advanced regions, the PRD has experienced intense development pressures over an extended period, leading to increasingly acute resource scarcity and environmental degradation. This situation necessitates a rigorous assessment of the nexus between urban development and ecological sustainability through a comprehensive urban health evaluation. Investigating the PRD not only elucidates the impacts of rapid urbanization on regional resources and environmental systems, but also yields valuable insights applicable to other burgeoning urban areas globally.
Policy Relevance: The PRD’s status as a national economic powerhouse makes it a critical testbed for innovative urban policies and sustainable development strategies. Findings from this study can directly inform policy formulation at both the regional and national levels, potentially shaping the trajectory of urban development across China and beyond.

3.3. Framework, Indicator System Construction, and Data Acquisition

The clarification of concepts, refinement of the theoretical framework, construction of the evaluation indicator system, and accurate collection and organization of relevant data are the foundations for systematic analysis and assessment.
Urbanization refers to the process in which population, resources, and economic activities gradually concentrate in urban areas, accompanied by the expansion of urban scale and the increase in the number of cities. It involves population migration from rural to urban areas, changes in land use, and structural transformation from the social, economic, cultural, and environmental aspects. Urbanization is closely related to the ecological environment, with the two interacting and influencing each other during the development process. Urbanization not only drives economic growth and social progress, but also significantly impacts resource utilization, environmental quality, and ecosystems, leading to increased resource consumption, intensified environmental pollution, and even ecological degradation. Conversely, changes in the ecological environment’s carrying capacity may also constrain urbanization. Based on existing research, this study constructed an urbanization indicator system from four dimensions: Population—reflecting the level of urbanization of the population (i.e., the degree to which the population integrates into urban production); Economy—reflecting the level of economic urbanization (i.e., the efficiency under different modes of production); Land—reflecting the level of land urbanization (i.e., the intensity of urban expansion and land use); and Society—reflecting the level of social urbanization (i.e., the extent to which the population integrates into urban life and enjoys the amount of urban public services and welfare) as well as an ecological environment indicator system from three aspects: Pressure—reflecting the level of urban ecological pressure (i.e., the burden of urban living and production activities on the ecological environment); Resources—reflecting the state of urban ecological resources (i.e., the level at which the urban population enjoys artificial or natural resources); and Protection—reflecting the level of urban ecological protection (i.e., the capacity to manage waste from urban living and production activities).
The data composition for this study is as follows:
As shown specifically in Table 1, for the coupling coordination analysis, the study period was set from 1999 to 20182, with the data primarily sourced from China’s national “Urban Statistical Yearbook” (covering the nine cities of the PRD), “Urban Construction Statistical Yearbook”, “Urban-Rural Construction Statistical Yearbook”, “Land and Resources Statistical Yearbook”, Guangdong Province’s “Statistical Yearbook” and the “Rural Statistical Yearbook” as well as annual thematic reports from provincial government departments. Missing data were supplemented using the Lagrange interpolation method.
As shown specifically in Table 2, for the FLUS model simulation of land use change, the study period was also set from 2000 to 2018, with data primarily sourced from the Resource and Environment Science and Data Center, Chinese Academy of Sciences, and Amap Open Platform3.

3.4. Implementation of Processing

3.4.1. Weight Setting and Measurement of Comprehensive Development Level—Panel Entropy Method

The entropy method is a quantitative analysis technique based on information theory that is widely applied in multi-indicator evaluation systems to determine the weights of various indicators. The core idea of this method stems from the concept of entropy, which, in information theory, serves as a measure of uncertainty and is used to assess the degree of disorder in a system. The greater the amount of information, the lower the uncertainty and the smaller the entropy; conversely, the smaller the amount of information, the higher the uncertainty and the larger the entropy. Therefore, by utilizing the information contained in entropy to calculate the weights and combining the variation of each indicator, the entropy method provides an objective basis for multi-indicator comprehensive evaluations by determining the weights of the indicators [36].
Based on the selection and construction of the evaluation indicators, the operational process of the entropy method applied to panel data structure is as follows:
Let there be h years, m cities, and n evaluation indicators. Denote x λ ij as the value of the j-th indicator for the i-th city in the λ-th year. As shown in Equation (1), the range standardization method is used to non-dimensionalize each indicator in the evaluation system.
Z λ ij = x λ i j     min x j max x j     min x j P o s i t i v e   i n d i c a t o r max x j     x λ ij max x j     min x j N e g a t i v e   i n d i c a t o r
where j = 1, 2, 3, …, n, i = 1, 2, 3, …, m, represent the total number of evaluation indicators and evaluation objects, respectively. max x j and min x j are the maximum and minimum values of indicator j among all evaluation objects, respectively; x λ ij and Z λ ij represent the indicator values before and after non-dimensionalization for indicator i.
Subsequently, as illustrated in Equations (2) and (3), the indicators are normalized, and the entropy values for each indicator are calculated, where k = 1 / ln ( h × m ) .
P λ ij = Z λ ij λ = 1 h   i = 1 m   Z λ ij
E j = k λ = 1 h   i = 1 m   P λ ij l n P λ ij k = 1 ln ( h × m )
Finally, as shown in Equations (4)–(6), the redundancy, weights of the entropy values for each indicator, and the comprehensive development levels of urbanization and the eco-environment for each city in each year are calculated.
D j = 1 E j
W j = D j j = 1 m   D j
C λ i = P λ ij × W j

3.4.2. Dynamic Relationship Measurement Between Urbanization Development and Eco-Environment—Coupling Coordination Degree Analysis

Coupling coordination analysis is a method used to evaluate the interactions and coordinated development between two or more systems, which can better reflect the degree of interaction between subsystems [37]. This method originates from the coupling theory in physics and is primarily applied to analyze the relationships between multiple subsystems to assess whether they can develop in synergy [38]. The coupling degree refers to the association or dependency generated through the interaction of two or more systems, that is, the strength of interaction between the systems. The higher the coupling degree, the stronger the association between the systems and the closer their interactions. The coordination degree measures the balance and harmony in the interactions between systems, indicating whether systems can mutually promote each other during development rather than competing or suppressing each other. Through coupling coordination analysis, researchers can determine whether different systems exhibit positive interactions during their joint development and can assess the balance between them.
Following the construction of the indicator system and the evaluation of indicator weights based on the panel entropy method as well as the calculation of the comprehensive development levels of urbanization and eco-environment for the nine cities in the PRD, a coupling coordination degree analysis was further conducted, as shown in Equations (7) and (8). The study focused on whether a positive interaction and coordinated development relationship exists between the urban and ecological subsystems, therefore, when calculating the coupling degree (C), only U 1 and U 2 were used to represent the comprehensive development levels of the subsystems, with n set to 2. From the perspective of sustainable development, the urban and ecological subsystems are equally important, so when calculating the coordination degree (T), both β 1 and β 2 were set to 0.5. Finally, the coupling coordination degree level was calculated as shown in Equation (9).
C U 1 , U 2 , , U n = n × U 1 U 2 U n U 1 + U 2 + + U n n 1 n
T = β 1 U 1 + β 2 U 2 + β 3 U 3 + β n U n
D = C × T
Drawing on existing research, the types and characteristics of the coupling and coordinated development between urbanization and the ecological environment were identified by synthesizing the comprehensive coupling coordination degree with the subsystem evaluation index, as detailed in Table 3.

3.4.3. Comparison of Urban Land Expansion Under Multiple Policy Scenarios—FLUS Model

The FLUS (future land use simulation) model is designed to simulate land-use changes under the influence of human activities and natural factors as well as future land-use scenarios. The model’s principles are derived from cellular automata (CA), with significant improvements made over the traditional CA approach [39,40]. First, the FLUS model employs an artificial neural network (ANN) algorithm to derive the suitability probabilities for various land-use types within the study area, based on one phase of land-use data and multiple driving factors that include both human activities and natural effects (such as temperature, precipitation, soil, topography, transportation, location, and policy factors). Second, the FLUS model utilizes a sampling method from one phase of land-use distribution data, which effectively reduces the risk of error propagation. Additionally, during the land-use change simulation process, the FLUS model introduces an adaptive inertia competition mechanism based on roulette selection. This mechanism efficiently addresses the uncertainty and complexity associated with the transformation of multiple land-use types under the combined influence of natural factors and human activities, enhancing the model’s accuracy and yielding results that closely resemble real-world land-use distributions. Existing studies have shown that this model can predict future land use changes with a high degree of accuracy [41,42,43]. The FLUS model is mainly composed of the following modules [44]:
First, the Markov chain predicts the target value. The Markov chain is widely used in predicting the future quantity of various types of land [45]. The basic formula is:
S t + 1 = S t × P ij
In this formula, S t and S t + 1 represent the number of patches during the trend analysis and prediction at times t and t + 1 , respectively, while P ij denotes the transition probability matrix.
The land-use suitability probability is estimated using an artificial neural network (ANN) model. The ANN model is effective in analyzing nonlinear correlations, leveraging existing data and driving factors to train the model and calculate land-use suitability probabilities [40]. Typically, the ANN model comprises three layers: the input layer, hidden layer, and output layer. The formula is as follows:
sp p , k , t = j   w j , k × sigmoid   net   j p , t = j   w j , k × 1 + e netj p , t 1
In the formula, sp ( p , k , t ) represents the suitability probability of land-use type k at spatial location p at time t ; W j , k denotes the adaptive weight between the hidden layer and the output layer; sigmoid ( net j ( p , t ) ) is the activation function from the hidden layer to the output layer; and ( net j ( p , t ) refers to the signal feedback from the j -th neuron in the hidden layer at pixel p during training time t . For the suitability probabilities generated by the neural network model, the sum of the suitability probabilities for various land-use types is always equal to 1, as expressed below:
k   s p p , k , t = 1
The adaptive inertia competition model incorporates parameters such as neighborhood influence, inertia coefficient, conversion costs, and competition among different land-use types. The neighborhood influence is defined by the settings for both neighborhood range and neighborhood weight. The general formula is as follows [46]:
Ω p , k t = N × N   con c p t 1 = k N × N 1 × w k
In this formula, Ω p , k t represents the neighborhood influence of land-use type k on pixel p during the t -th iteration. N × N   con c p t 1 = k refers to the total number of pixels with land-use type k within the N × N neighborhood window following the t     1 -th iteration. w k denotes the neighborhood weight assigned to different land-use types. Neighborhood weights reflect the expansion potential of different land-use types under the combined influence of driving forces, with values ranging from 0 to 1. A higher value indicates a stronger expansion capability for a given land-use type.
The inertia coefficient is based on the discrepancy between the macro-level demand and the actual distribution of land-use types. During the iterative process, it is adaptively adjusted to align the quantity of each land-use type with the macro-level demand targets. The definition is as follows:
  Inertial   k t =   Inertial   k t 1 D k t 1 D k t 2   Inertial   k t 1 × D k t 2 D k t 1 0 > D k t 2 > D k t 1   Inertial   k t 1 × D k t 1 D k t 2 D k t 1 > D k t 2 > 0
In this formula,   Inertial   k t represents the inertia coefficient for land-use type k during the t -th iteration, while D k t 1 indicates the difference between the land-use demand and the allocated area at iteration t 1 . The inertia coefficient applies only to land-use types occupying pixels. If the potential land-use type k differs from the current land-use type c , the inertia coefficient for type k is set to 1 and does not impact the overall land-use probability for type k .
Through the above steps, the formula for calculating the total land use probability on each pixel is:
  TP   p . k t = P p , k × Ω p , k t × Inertia k t × 1 sc c k
In this formula,   TP   p . k t represents the combined probability of pixel p being converted from its original land-use type to target land-use type k at iteration time t ; P p , k indicates the probability of pixel p being assigned to land-use type k as generated by the neural network algorithm; Ω p , k t reflects the neighborhood influence of land-use type k on pixel p at time t ; and sc c k denotes the transition likelihood from the original land-use type c to target type k , where 1 signifies a possible transition, and 0 signifies an impossible transition.

4. Results of Empirical Analysis

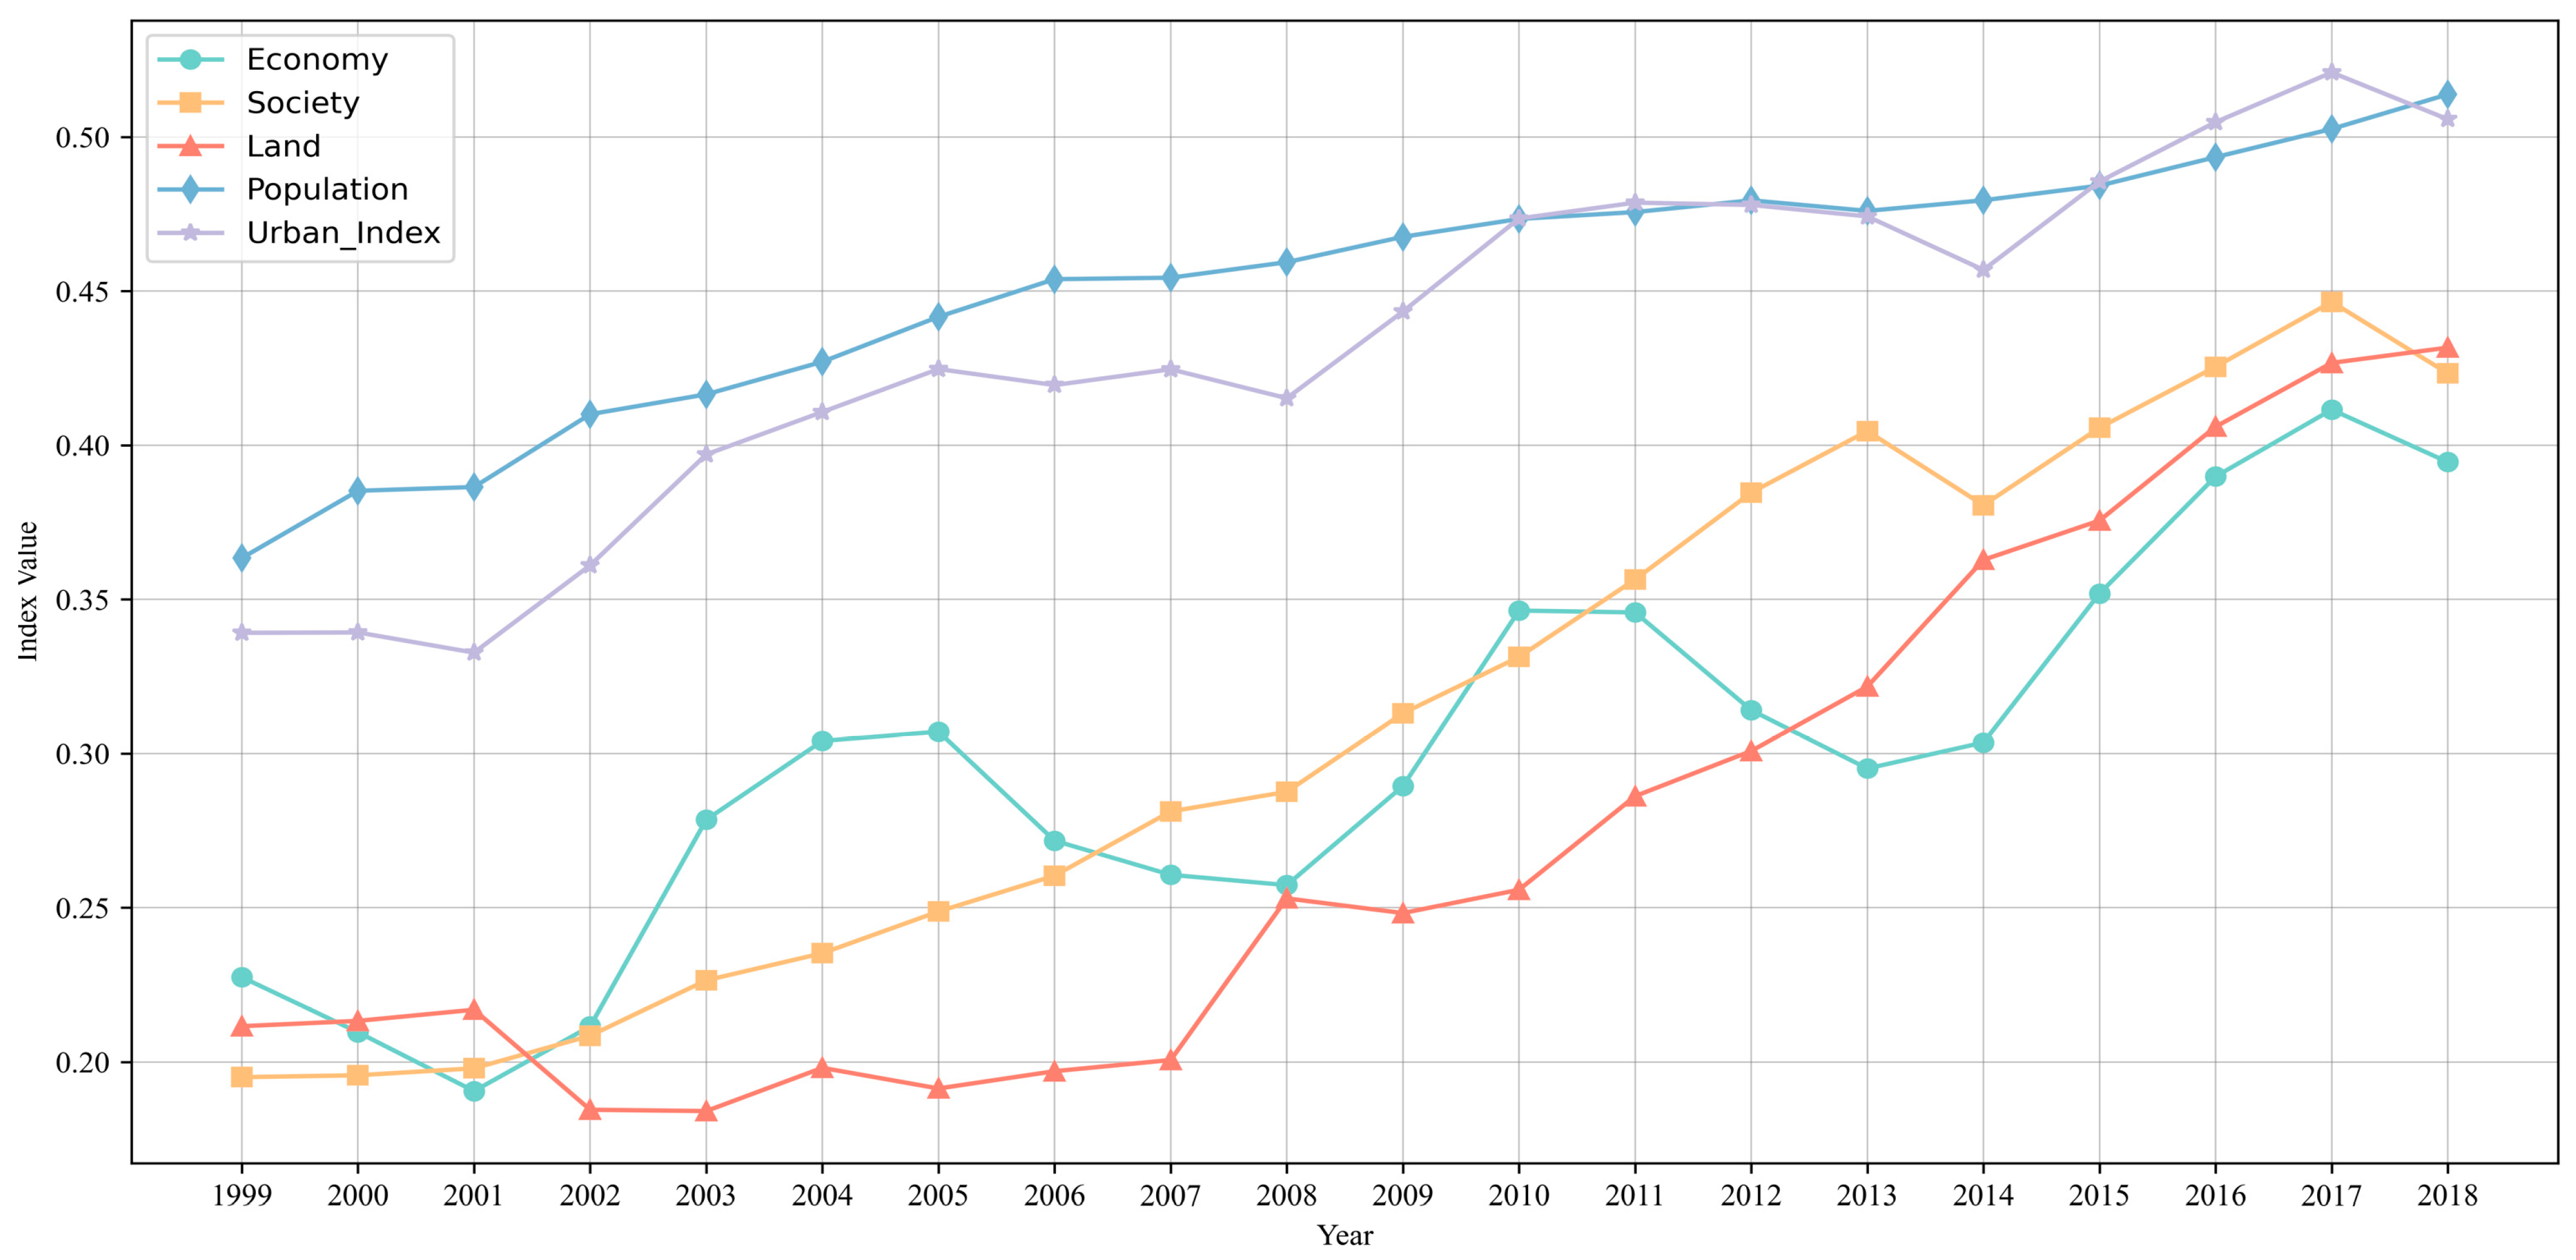
4.1. Temporal Variation Characteristics of the Coupling Coordination Between Urbanization and the Eco-Environment in the PRD Urban Agglomeration

4.1.1. Urbanization Development

As shown in Figure 3, between 1999 and 2018, although there were periodic fluctuations in the comprehensive urbanization development level of the PRD urban agglomeration, the overall trend was upward, reflecting the continuous advancement of urbanization in the region. Entering the 21st century, the early development phase (1999–2001) saw relatively low levels of most urbanization indicators, with the exception of the population urbanization indicator, which remained at a higher level and led in all subsequent stages, indicating that population inflow was the main driving force behind the urbanization of the PRD.
During the period of rapid growth (2002–2008), the urbanization process accelerated significantly. Population concentration continued steadily, and both economic and social urbanization began to rise rapidly, with land urbanization also slightly improving, showing comprehensive urbanization development. During this period, China’s official accession to the World Trade Organization in 2001 greatly promoted industrial production, and the PRD, known for the “Pearl River Model (Front Shop, Back Factory)”, entered a golden era of foreign trade development. The issuance of “The Pearl River Delta Urban Agglomeration Coordinated Development Plan (2004–2020)” proposed several major action plans to promote regional economic development. After 2005, as export trade declined, the region’s economic indicators began to fall. In 2008, the global subprime mortgage crisis broke out, causing the “Pearl River Model”, which relied on external demand, to lose one of its driving forces, leading to setbacks in foreign trade.
However, the Chinese government introduced a “4 Trillion Investment Plan”4 stimulus package to boost the economy, promoting a shift toward the real estate-driven tertiary industry, marking the start of an adjustment and transformation phase (2008–2015). Subsequent economic development was closely tied to the real estate sector, and urban built-up areas expanded as land urbanization formally began to rise, surpassing economic urbanization after 2012. During this period, the issuance of “The Pearl River Delta Urban-Rural Integrated Planning (2009–2020)” and the release of “The Outline of the Plan for the Reform and Development of the Pearl River Delta Region (2008–2020)” elevated the construction of the PRD to a national strategy, implementing industrial restructuring and transformation upgrades in the region.
The construction of new urban districts, high-tech industrial parks, urban industrial zones, and economic and technological development zones led to the continuous expansion of urban land areas. Despite the introduction of various regulatory to curb the overheating real estate market, including the “Eleven Regulations—Notice on Promoting the Stable and Healthy Development of the Real Estate Market (2010)”, the “New Ten Regulations—Notice on Firmly Curbing the Rapid Increase in Housing Prices in Certain Cities (2010)”, the “Eight Regulations—Notice on Further Strengthening the Regulation of the Real Estate Market (2011)”, and the “Five Regulations—Notice on the State Council Executive Meeting’s Discussion and Deployment of Strengthened Real Estate Market Regulation (2013)”, land urbanization continued to grow.
After 2015, the urbanization process accelerated once again, and all indicators showed convergence, indicating more balanced and coordinated regional urbanization development.

4.1.2. Eco-Environment Development

From 1999 to 2018, the overall ecological environment level of the PRD urban agglomeration showed a slight upward trend with fluctuations, reflecting the region’s continuous efforts in ecological environmental construction and the achievements made. In the early phase (1999–2003), the comprehensive ecological index remained relatively stable, but declined after 2001, indicating the pressure on the ecological environment brought about by the rapid industrialization and urbanization driven by the export-oriented economy in the PRD.
As illustrated in Figure 4, the ecological protection index began to rise in a stepwise manner after 2004, driving steady improvements in the overall level. During this period, the Guangdong provincial government released “The Outline of the Pearl River Delta Environmental Protection Plan (2004–2020)”, aiming to promote environmental protection and ecological construction in the PRD through measures such as optimizing regional spatial layout, enhancing water environment security, and improving air quality. Subsequently, in 2006, the Chinese government issued “The 11th Five-Year Plan for Environmental Protection”, which specifically set environmental protection goals and measures, particularly addressing urban air and water pollution.
After 2010, the region entered a phase of stable development. During this period, “The Pearl River Delta Regional Ecological Security System Integration Plan (2014–2020)” was issued, aimed at enhancing ecological security and management capabilities in the PRD and promoting integrated construction of the regional ecological security system. Additionally, “The National New-Type Urbanization Plan (2014–2020)” emphasized a green, low-carbon, and sustainable urban development model. The revised “Environmental Protection Law of the People’s Republic of China” further clarified the government’s supervisory and regulatory responsibilities regarding environmental protection, improving fundamental environmental protection systems such as ecological redlines, total pollutant control, environmental monitoring and impact assessments, and cross-administrative joint prevention and control.
Furthermore, “The Air Pollution Prevention and Control Action Plan” was issued by the national government (2013) and Guangdong Province (2014), proposing measures such as reducing coal consumption, improving energy efficiency, and promoting clean energy to enhance environmental quality. In 2014, the ecological pressure index began to show a slight downward trend. It is worth noting that the ecological resource index remained consistently low with little fluctuation, reflecting the relatively strained state of resources in the PRD region during its urbanization process. The region’s environmental carrying capacity is limited, and there remains significant room for improvement in resource use efficiency.

4.1.3. Degree of Coupling Coordination

As illustrated in Figure 5, the degree of coupling coordination between urbanization and the eco- environment in the PRD urban agglomeration showed a continuous upward trend, reflecting the region’s ongoing efforts to seek balance and coordination between urban development and ecological environmental protection.
Preliminary coordination phase (1999–2003): The coupling coordination degree increased from 0.657 to 0.678, remaining in the moderate coordination range. During this period, the improvement in coordination was relatively slow. The urbanization index showed a significant increase (17.057%), while the ecological environment index remained relatively stable (−2.989%), indicating that urban development may have exerted some pressure on the ecological environment.
Ecological transformation phase (2004–2008): The coupling coordination degree slowly increased from 0.680 to 0.699, still in the moderate coordination range. During this period, the eco-environment index showed a noticeable improvement (10.402%). In contrast, the urbanization index saw relatively little change, with an overall slight upward trend (1.085%), reflecting that the PRD region began to place greater emphasis on ecological environmental protection amid rapid urbanization.
Balanced development phase (2009–2013): The coupling coordination degree surpassed 0.7, approaching the threshold of high coordination. Both the urbanization index (6.962%) and the ecological environment index (6.739%) showed stable growth, with a similar rate of increase, indicating that the PRD region had largely achieved a good balance between urban development and ecological environmental protection.
Collaborative improvement phase (2014–2018): The coupling coordination degree continued to rise, increasing from 0.728 to 0.761, approaching the high coordination range. During this period, the growth of the ecological environment index (7.732%) was slightly lower than the growth of the urbanization index (10.703%). Despite the acceleration of the urbanization process, the ecological environment index maintained steady growth, reflecting that the PRD region continued to take effective measures to balance development and environmental protection.
Overall, the PRD urban agglomeration experienced a development process from moderate coordination to near high coordination between 1999 and 2018. This process reflects the region’s growing emphasis on ecological environmental protection alongside rapid urbanization, with notable achievements in policy formulation and implementation.

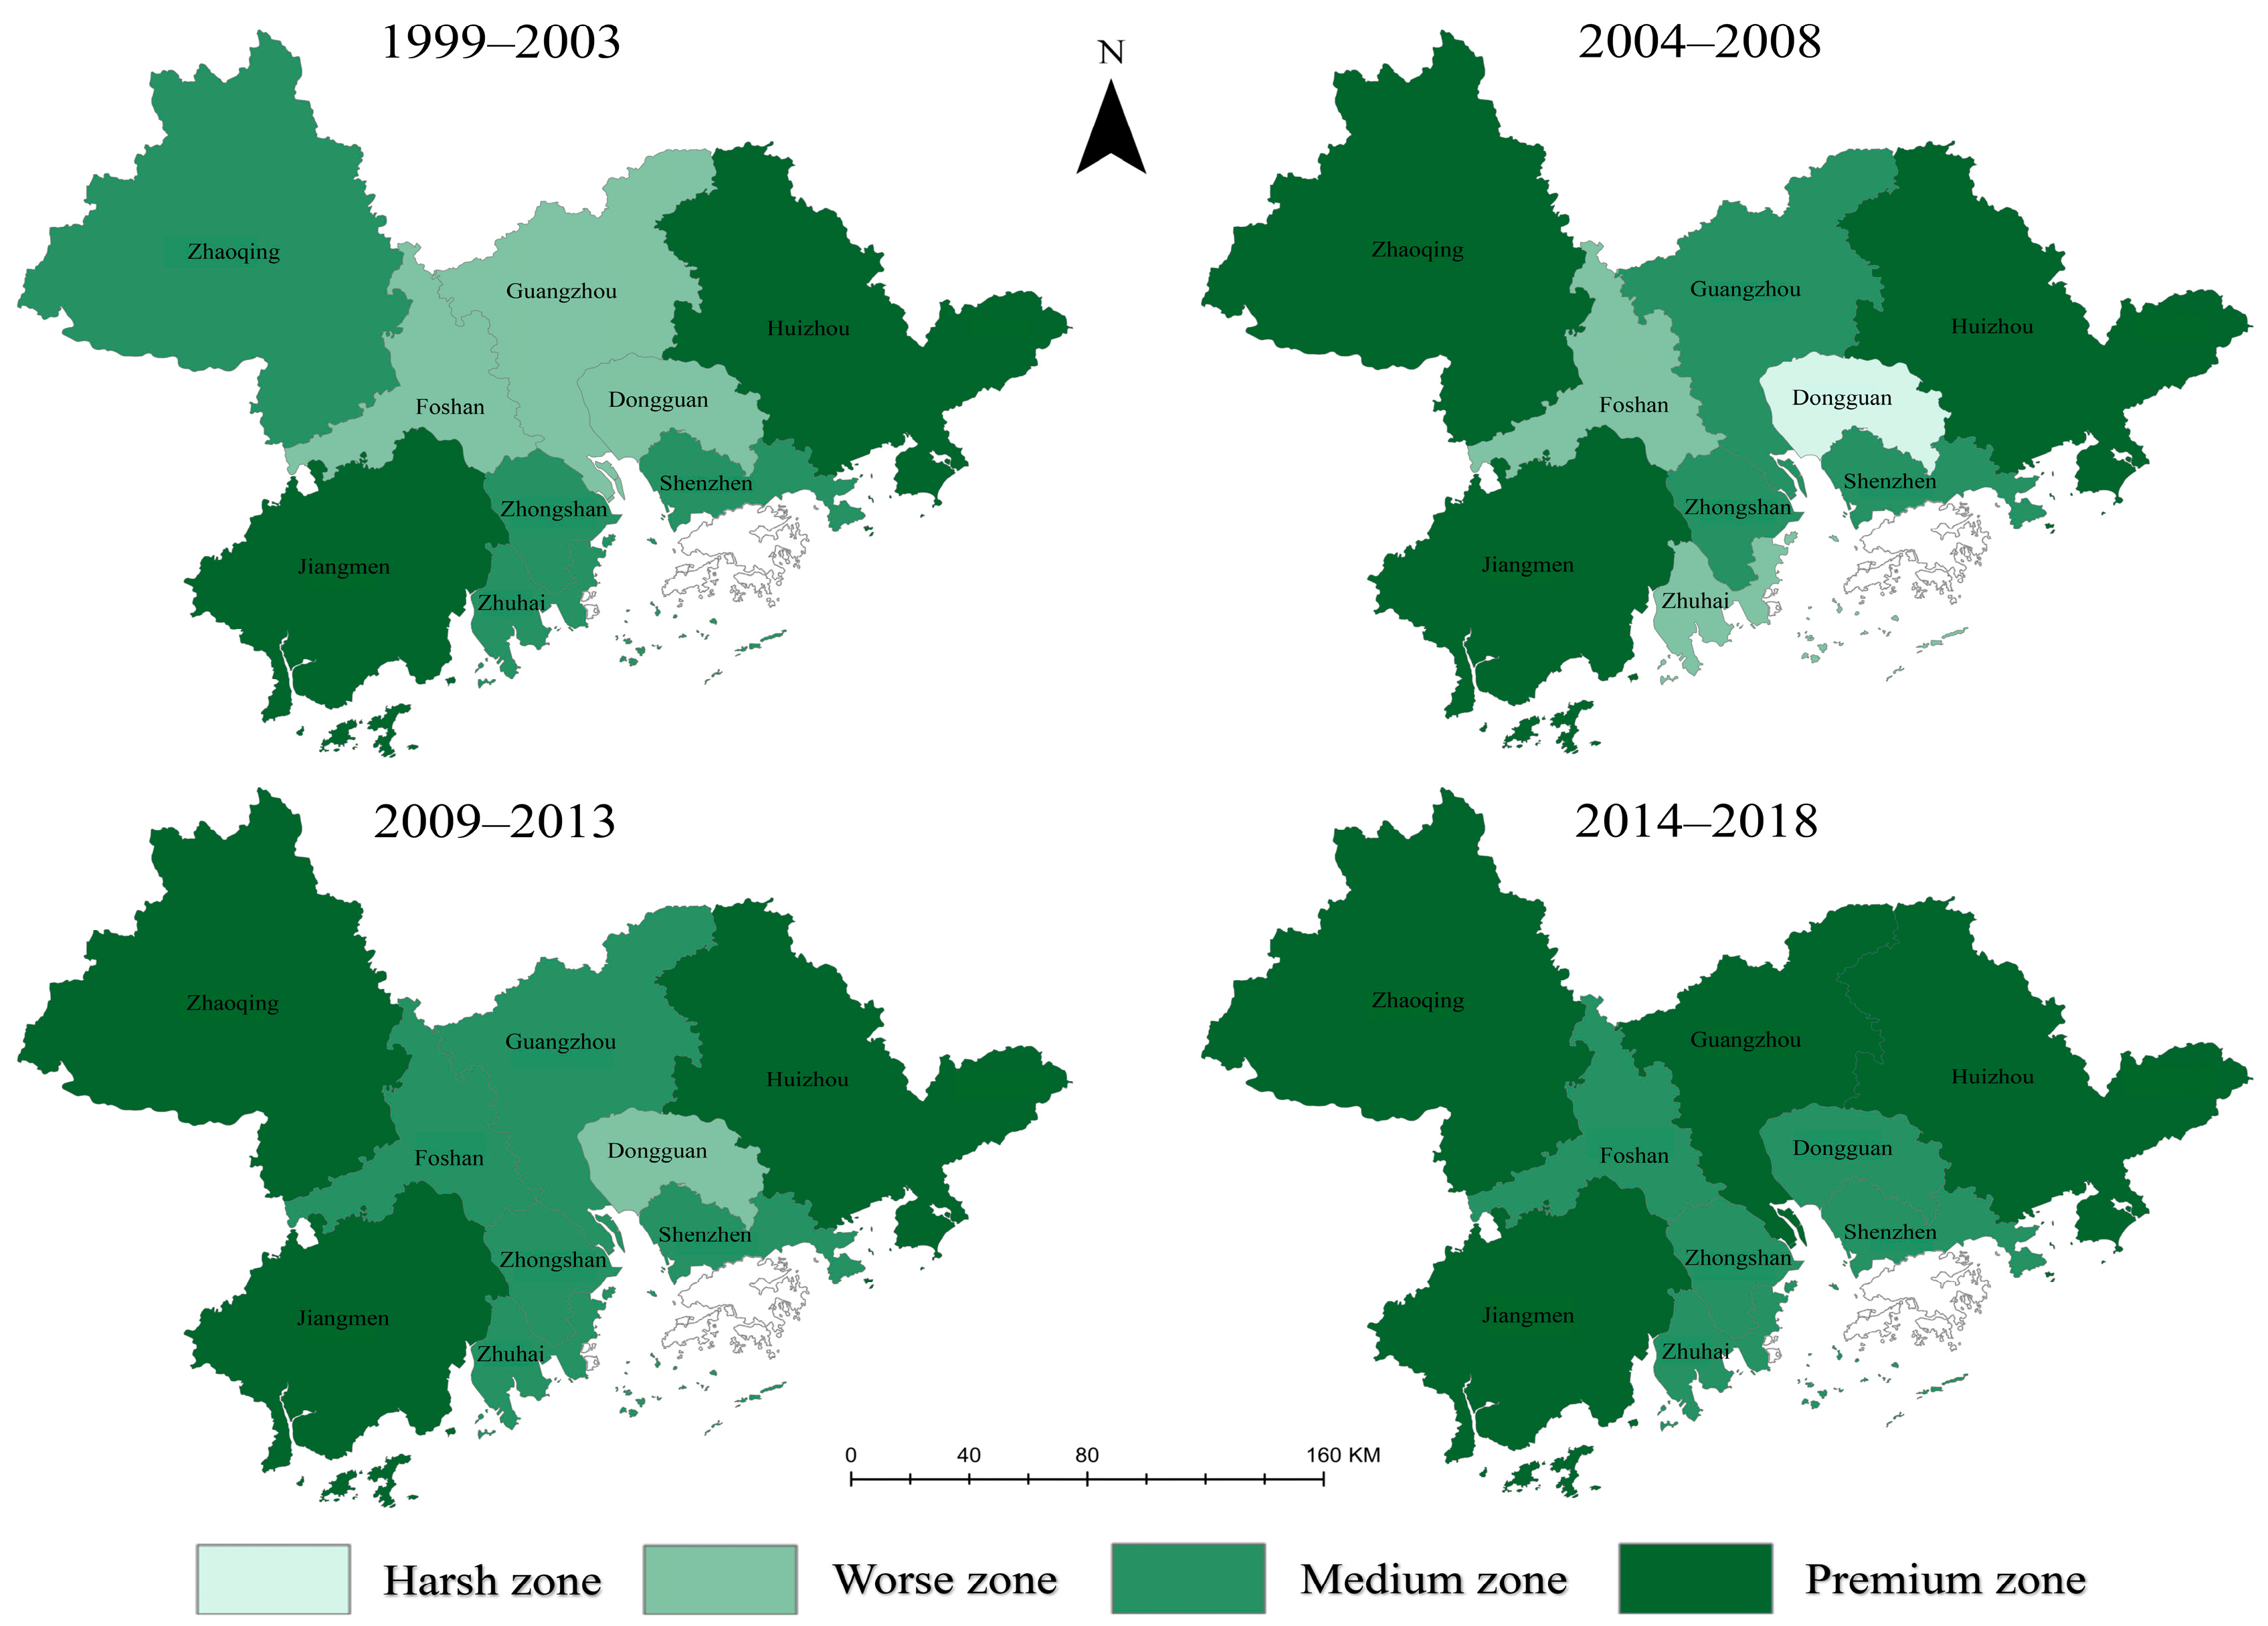
4.2. Spatial Pattern Characteristics of the Coupling Coordination Between Urbanization and the Eco-Environment in the PRD Urban Agglomeration

Based on the longitudinal analysis of the coupling coordination degree of the PRD urban agglomeration as a whole, further cross-sectional analyses of individual cities were conducted for the periods 1999–2003, 2004–2008, 2009–2013, and 2014–2018. This provided insights into the spatial-temporal evolution characteristics of the urbanization development level, ecological environment development level, and the coupling coordination degree between urbanization and the ecological environment for the nine cities. Given the differing rates of urbanization and ecological environment development, and referencing existing research, the urbanization development levels were classified into five categories: high-level urbanization area [0.6, 1], relatively high-level urbanization area [0.4, 0.6], medium-level urbanization area [0.3, 0.4], relatively low-level urbanization area [0.2, 0.3], and low-level urbanization area [0, 0.2]. For the slower-developing ecological environment, it was divided into four categories: excellent ecological environment area [0.6, 1], moderate ecological environment area [0.5, 0.6], poor ecological environment area [0.4, 0.5], and severely degraded ecological environment area [0, 0.4].

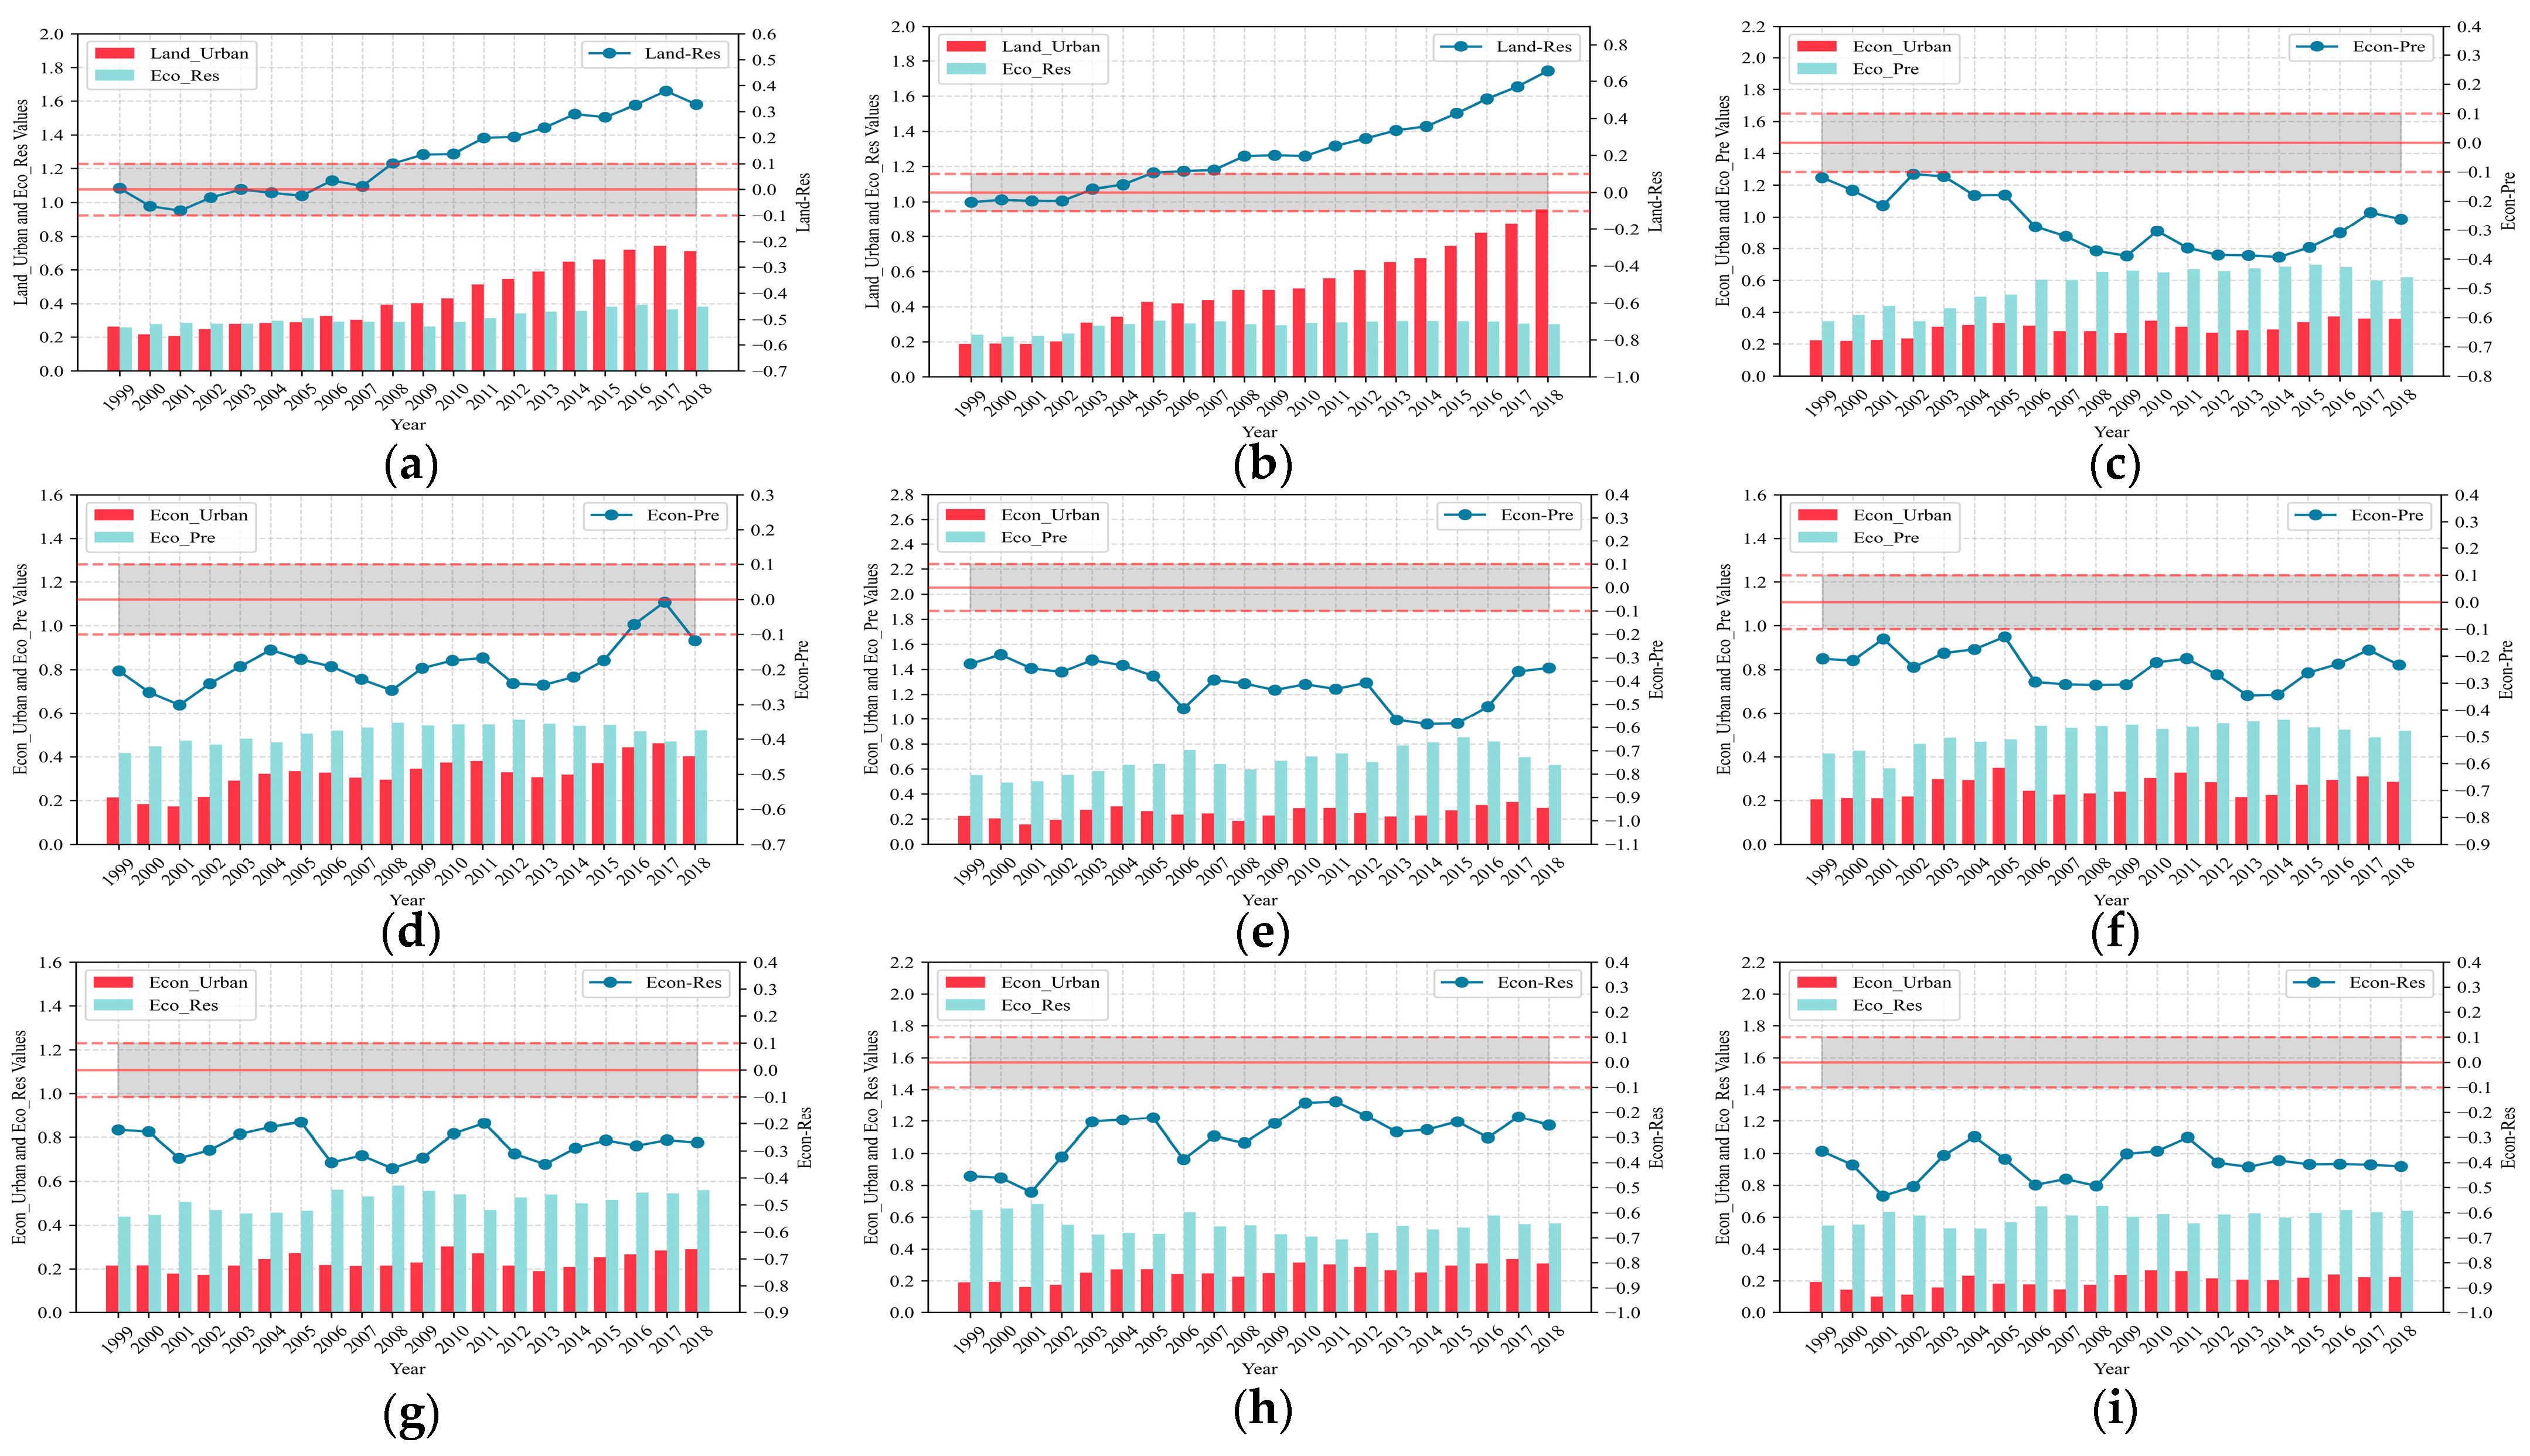
4.2.1. Urbanization Development

As illustrated in Figure 6, the urbanization level of the PRD urban agglomeration showed an overall upward trend. However, significant disparities existed in the speed and level of development among various cities, leading to a distinct spatial differentiation pattern. The specific characteristics are as follows:
“Dual-core” leadership: Shenzhen and Guangzhou have consistently held leading positions, shaping the “dual-core” development pattern of the PRD urban agglomeration. As the provincial capital and a city of rich historical and cultural significance, Guangzhou has capitalized on its role as an administrative center and transportation hub to sustain high levels of urbanization throughout the study period. By 1999–2003, Guangzhou already exhibited relatively high urbanization levels, which further advanced to a high level by 2014–2018. The city’s strengths in trade, science, education, and culture, combined with its diversified industrial structure, have provided a strong foundation for sustained growth. Similarly, Shenzhen, one of China’s first special economic zones, reached a high level of urbanization as early as 1999–2003. Driven by innovation strategies and high-tech industrial clusters, Shenzhen experienced steady urban growth, ultimately reaching a high level of urbanization alongside Guangzhou in the 2014–2018 period. Shenzhen’s focus on high-tech and advanced manufacturing not only spurred its own development, but also played a key role in upgrading the region’s industrial base.
Gradient development: Dongguan and Foshan have experienced steady urbanization, progressing from moderate levels during the 1999–2003 period to relatively high levels between 2004 and 2008, showcasing their success in raising and stabilizing urbanization amid industrial transformation and upgrading. Dongguan has established itself as a global manufacturing hub and commercial center in the PRD, with key industries including electronic information, electrical machinery, textiles, furniture, toys, papermaking, food and beverages, and chemicals. Since the implementation of the “Empty the Cage, Let the Birds In” strategy in 2008 and the “Machines Replacing Humans” policy in 2014, Dongguan has advanced in high-end equipment and intelligent manufacturing, although these transitions have brought challenges in terms of economic growth, employment, and production costs. Foshan, a crucial node in the Pearl River–West River Economic Belt, the Guangzhou–Foshan–Zhaoqing Economic Circle, and the Guangzhou Metropolitan Area, has actively pursued the high-end, intelligent, and green upgrading of its industries, building on its traditional manufacturing strengths. Technological innovation and digital transformation have revitalized traditional industries such as home appliances, ceramics, and furniture. Zhuhai, one of China’s special economic zones, though smaller than Shenzhen, has maintained a relatively high level of urbanization due to its ecological advantages and the platform provided by the Hengqin Guangdong–Macao In-Depth Cooperation Zone. Alongside Guangzhou and Shenzhen, Zhuhai has long played a key role in the region’s “tripartite” structure. Zhuhai is also actively fostering high-tech industries such as next-generation information technology, striving to position itself as an innovation-driven city.
Late-developing cities catching up: Zhongshan, leveraging its manufacturing base and the development plan for the Western Pearl River Urban Belt, increased its urbanization level between 2004 and 2008, maintaining a relatively high level since. Through industrial diversification, Zhongshan has developed a balanced industrial structure, incorporating traditional industries such as food, lighting, and apparel, pillar industries including electronic information, home appliances, and biomedicine as well as emerging sectors like intelligent robotics, new energy, and optoelectronics. Huizhou, capitalizing on its strategic position as the “sub-center” of the Shenzhen metropolitan area and the development of the Daya Bay Economic and Technological Development Zone, has also actively promoted and sustained urbanization, reaching a relatively high level by 2014. Huizhou’s transition toward a green economy—focusing on green petrochemicals, modern agriculture, and food—has established it as one of the emerging innovation hubs in the PRD. Overall, the eastern bank of the Pearl River has developed more rapidly, forming an innovation corridor centered around Shenzhen, with a notable agglomeration of high-tech industries. Meanwhile, the western bank has developed at a slower pace, but with the opening of the Hong Kong–Zhuhai–Macao Bridge, the Shenzhen–Zhongshan Corridor, and the advancement of the Greater Bay Area initiative, the region is accelerating the development of emerging industries.
Lagging peripheral cities: As a peripheral city in the PRD, Zhaoqing has experienced a rise in its urbanization level from low to moderate, but it continues to lag behind other cities, highlighting the persistence of the core-periphery structure. Nonetheless, Zhaoqing is actively fostering emerging industries such as new energy vehicles, with the aim of integrating into the Greater Bay Area’s industrial chain. Similarly, Jiangmen, a key city on the western bank of the Pearl River, has elevated its urbanization level from moderate to relatively high and has maintained this progress. The city is leveraging its strong manufacturing base to drive the upgrading of traditional industries toward high-end manufacturing while also promoting the development of green agriculture and the food industry to enhance its competitiveness.
Overall, the spatial pattern of urbanization in the PRD urban agglomeration follows a “core-semi-periphery-periphery” structure, with Shenzhen and Guangzhou at the center, gradually radiating outward. While the development gap between cities has narrowed, considerable spatial disparities remain, highlighting the continued imbalance in regional development.

4.2.2. Eco-Environment Development

As illustrated in Figure 7, the overall development of the ecological environment in the PRD urban agglomeration showed a clear improvement trend. However, significant differences between cities have resulted in a unique spatial pattern that stands in stark contrast to the urbanization trend:
Ecological advantages of peripheral cities: Zhaoqing has steadily improved its ecological environment, progressing from a moderate level during the 1999–2003 period to a consistently high-quality state. As a peripheral city in the PRD, Zhaoqing has leveraged its rich ecological resources, which cover 44.9% of its land area and are dominated by mountainous, hilly, and forest ecosystems. Coupled with proactive ecological initiatives including the establishment of several national and provincial nature reserves, these efforts have driven continuous enhancements in environmental quality, positioning Zhaoqing as a model for regional ecological development. Similarly, Jiangmen and Huizhou have maintained consistently high standards in their ecological environments. Huizhou, with 25.3% of its land area comprising mountainous and forest ecosystems, plays a vital role in water conservation and biodiversity protection. Jiangmen also hosts numerous national and local forest parks and nature reserves. Between 2004 and 2013, both cities implemented a series of ecological protection measures aimed at improving the water quality in river basins and safeguarding urban mountain areas, effectively sustaining their high ecological standards and demonstrating considerable environmental resilience.
Ecological transformation of core cities: Guangzhou and Shenzhen, as core cities in the region, have demonstrated steady improvements in their ecological environment as well as Zhongshan. Beginning at a poor level during the 1999–2003 period, these cities advanced to a moderate level between 2004 and 2008 and further improved to a high-quality level by 2014–2018. This reflects Guangzhou’s ability to address the environmental pressures resulting from population growth and land expansion during rapid urbanization while simultaneously enhancing environmental governance and ecological construction. For example, during the early 21st century, as the PRD region experienced rapid economic growth, Guangzhou’s built-up area expanded from 284.6 km² to 607.9 km²—an increase of 113.59%—while green coverage in the built-up area rose from 56.29 km² to 218.71 km². Shenzhen and Zhongshan have followed relatively stable ecological trajectories. Both cities saw slight declines in environmental quality during the 2004–2008 period, followed by gradual recovery, maintaining moderate levels overall and effectively balancing economic growth with environmental protection. Despite Guangzhou’s advantage in administrative size, Shenzhen faced significant environmental challenges between 2009 and 2018, with industrial gas emissions rising from 1740.67 to 3322.77 billion cubic m and solid waste, primarily construction debris, reaching extremely high levels (over 80 million cubic m annually). However, the city’s disposal capacity remained insufficient, leading to a heavy reliance on external waste disposal. Similarly, Zhongshan, which shares a third-tier administrative structure with Dongguan, has long faced challenges in wastewater management, with a gap of nearly 1000 km in its sewage pipeline network and sewage collection rates in most towns and districts remaining below 50%.
Ecological challenges of industrial cities: As key industrial bases and special economic zone cities in the PRD, Foshan and Zhuhai have followed somewhat different ecological development paths, but both have shown gradual improvement. In the early period (1999–2008), Foshan’s industrial layout was scattered, following the extensive development model of “Smoke from Every Chimney, Fire in Every Village”. This gave rise to the “One Town, One Product” industrial structure that drove the growth of “Foshan manufacturing”. However, its environmental infrastructure was underdeveloped. For instance, in 2002, Foshan had only one household waste treatment plant and one sewage treatment plant, with a daily capacity of just 1350 tons of waste and a centralized sewage treatment rate of only 20.17%, which placed considerable strain on the environment. In the following years (2009–2018), Foshan improved and maintained a moderate level of ecological health, largely due to efforts in industrial upgrading and environmental governance. Initiatives such as the “Three Olds” renovation project launched in 2008 and the “Empty the Cage, Let the Birds In” policy helped revitalize unused land, optimize industrial space, and promote ecological restoration. Zhuhai, meanwhile, saw a decline to poor ecological conditions during 2004–2008 but has generally maintained a moderate state since. This decline can be attributed to the rapid pace of urbanization and industrialization, which led to increased resource consumption. Between 2004 and 2010, Zhuhai’s domestic water supply fell from 99.75 million cubic m to 76.69 million cubic m, and the green space ratio in built-up areas slightly decreased from 42.88% to 39.89%. However, thanks to the foresight of its “Eco-City” planning and its emphasis on green and high-tech industries, Zhuhai has ultimately managed to strike a balance between urban development and ecological protection.
Ecological dilemmas of industrial hub: As the first manufacturing hub in the PRD to adopt the “Three Processing and One Compensation” model, Dongguan remained at a poor ecological level for much of its early development, with significant improvements only occurring between 2014 and 2018, raising it to a moderate level. During the early period (1999–2003), Dongguan experienced rapid industrial growth, characterized by a high concentration of labor-intensive industries, which placed immense pressure on the environment. By 2007, the city’s household waste treatment rate was only 29.24%, and before 2008, the centralized sewage treatment rate was below 20%. Additionally, the per capita green space in parks remained under 18 square m until 2014. The marked improvement in environmental quality after 2014 can be attributed to the elimination of high-pollution, high-energy consumption industries, the promotion of high-tech industries, and the enhancement of environmental infrastructure including sewage and waste treatment facilities. The city has also undertaken ecological restoration projects such as river remediation and greening initiatives.

4.2.3. Discussion of the Types of Coupling and Coordination Analysis

As illustrated in Figure 8 and Figure 9 and Table 4, the typological analysis of the coupling coordination degree between urbanization and the ecological environment across the nine cities of the PRD revealed both regional development dynamics and spatial disparities. A deeper comparison of the internal subsystems not only reflects the urbanization process, but also highlights each city’s performance in managing ecological pressure and protection efforts.
Under the prevailing conditions of high population urbanization and ecological pressure, Guangzhou emerged as the sole regional hub that has successfully achieved the synchronized development of urbanization and the ecological environment, advancing from moderate to high coordination. Throughout its rapid urbanization process, the ecological pressure exerted by Guangzhou (−0.163) remained relatively low compared to the average (−0.251). Additionally, Guangzhou demonstrated a balanced performance across various dimensions, with an average discrepancy among subsystems of −0.500 compared to the overall mean of −1.882. This underscores its leading position in coordinated development. However, in terms of land urbanization, the consumption of ecological resources resulting from Guangzhou’s land expansion (a discrepancy of 0.122 relative to the overall mean of −0.08) and the associated ecological pressure (a discrepancy of 0.150 relative to the overall mean of −0.275) were both greater and more pronounced than those observed in other cities.
Shenzhen, Zhuhai, Dongguan, Foshan, and Zhongshan have transitioned from a “urbanization lagging” model to a moderately coordinated “U&E-synchronized” development model, demonstrating their increasing focus on ecological and environmental issues amid rapid urbanization. The development of high-tech industries in Shenzhen, the establishment of an ecological city in Zhuhai, the industrial transformation and upgrading in Dongguan, the advancement of intelligent manufacturing in Foshan, and Zhongshan’s strategies for industrial diversification and innovation-driven development are all key factors driving this transformation. However, overall, the indicators of ecological pressure generally remained higher than those of economic urbanization (−0.251), particularly in Zhuhai (−0.415), which does not benefit from regional scale advantages, and also in Dongguan (−0.272) and Zhongshan (−0.240). Concurrently, ecological protection efforts in Zhuhai (−0.576) and Zhongshan (−0.580) have been strengthened simultaneously. Notably, Shenzhen faces challenges similar to Guangzhou regarding land urbanization, with land expansion (0.21) resulting in a significant consumption of ecological resources.
Huizhou, Jiangmen, and Zhaoqing maintain a moderately coordinated level of development while continuing to follow a “urbanization lagging” model. As key ecological functional zones and major agricultural production areas within Guangdong Province and the nation, these three cities leverage their abundant natural resources (−0.292; −0.276; −0.408) to excel in ecological protection (−0.518; −0.525; −0.362). Huizhou’s forestry and eco-tourism initiatives, Jiangmen’s green agriculture and advanced manufacturing developments, and Zhaoqing’s new energy vehicle sector are all concrete examples of promoting urbanization on the foundation of ecological and environmental protection.
The analysis of the coupling and coordination between urbanization and the ecological environment in the PRD urban agglomeration revealed several key trends and characteristics:
Improved overall coordination: The findings highlighted a generally positive trend in the coordinated development of urbanization and the ecological environment across the nine cities, particularly in core and industrial cities. Notably, Guangzhou has made a significant leap from moderate to high levels of coordination, positioning itself as a leader in the region’s development trajectory.
Regional disparities and comparative advantages: The contrast between Guangzhou’s high coordination and the “urbanization lagging” observed in cities like Huizhou, Jiangmen, and Zhaoqing underscores the uneven development within the region. These spatial disparities reflect the varying stages of development and strategic roles of each city. Cities have adopted differentiated growth paths tailored to their unique conditions, with core cities and peripheral areas leveraging distinct comparative advantages. Core cities like Guangzhou and Shenzhen prioritize innovation-driven growth and industrial upgrading, while cities like Huizhou, Jiangmen, and Zhaoqing capitalize on their ecological assets to pursue an “eco-city” development model.
Shared challenges of population and ecological pressure: Despite differences in development strategies, all cities face the common challenge of balancing economic growth with ecological pressures. In many cases, the ecological stress indicators exceeded the levels of economic urbanization, signaling significant potential for transitioning urbanization toward more intensive, innovative, and environmentally sustainable models.
Enhanced ecological awareness: The shift from “urbanization lagging” to “U&E-synchronized” development, especially in cities such as Shenzhen, Zhuhai, Dongguan, Foshan, and Zhongshan, reflects a growing recognition of ecological issues in urban development, with a particular focus on environmental protection. Cities like Zhuhai and Zhongshan, despite facing considerable ecological pressures, are actively enhancing their ecological protection measures, demonstrating their commitment to continuously adjusting and optimizing their development strategies.
Land-use efficiency challenges: In core cities like Guangzhou and Shenzhen, urban land use places substantial demands on ecological resources, underscoring the critical importance of improving land-use efficiency and managing urban expansion.
In summary, the development of the nine cities in the PRD exhibits a trend of increasing coordination, diversification of development models, and heightened ecological awareness. However, challenges remain, particularly in balancing economic development with ecological protection and fostering coordinated regional development. This complex developmental landscape not only reflects the unique experiences of the PRD in the urbanization process, but also offers valuable empirical insights for understanding the coordination between urbanization and the ecological environment in rapidly developing regions.

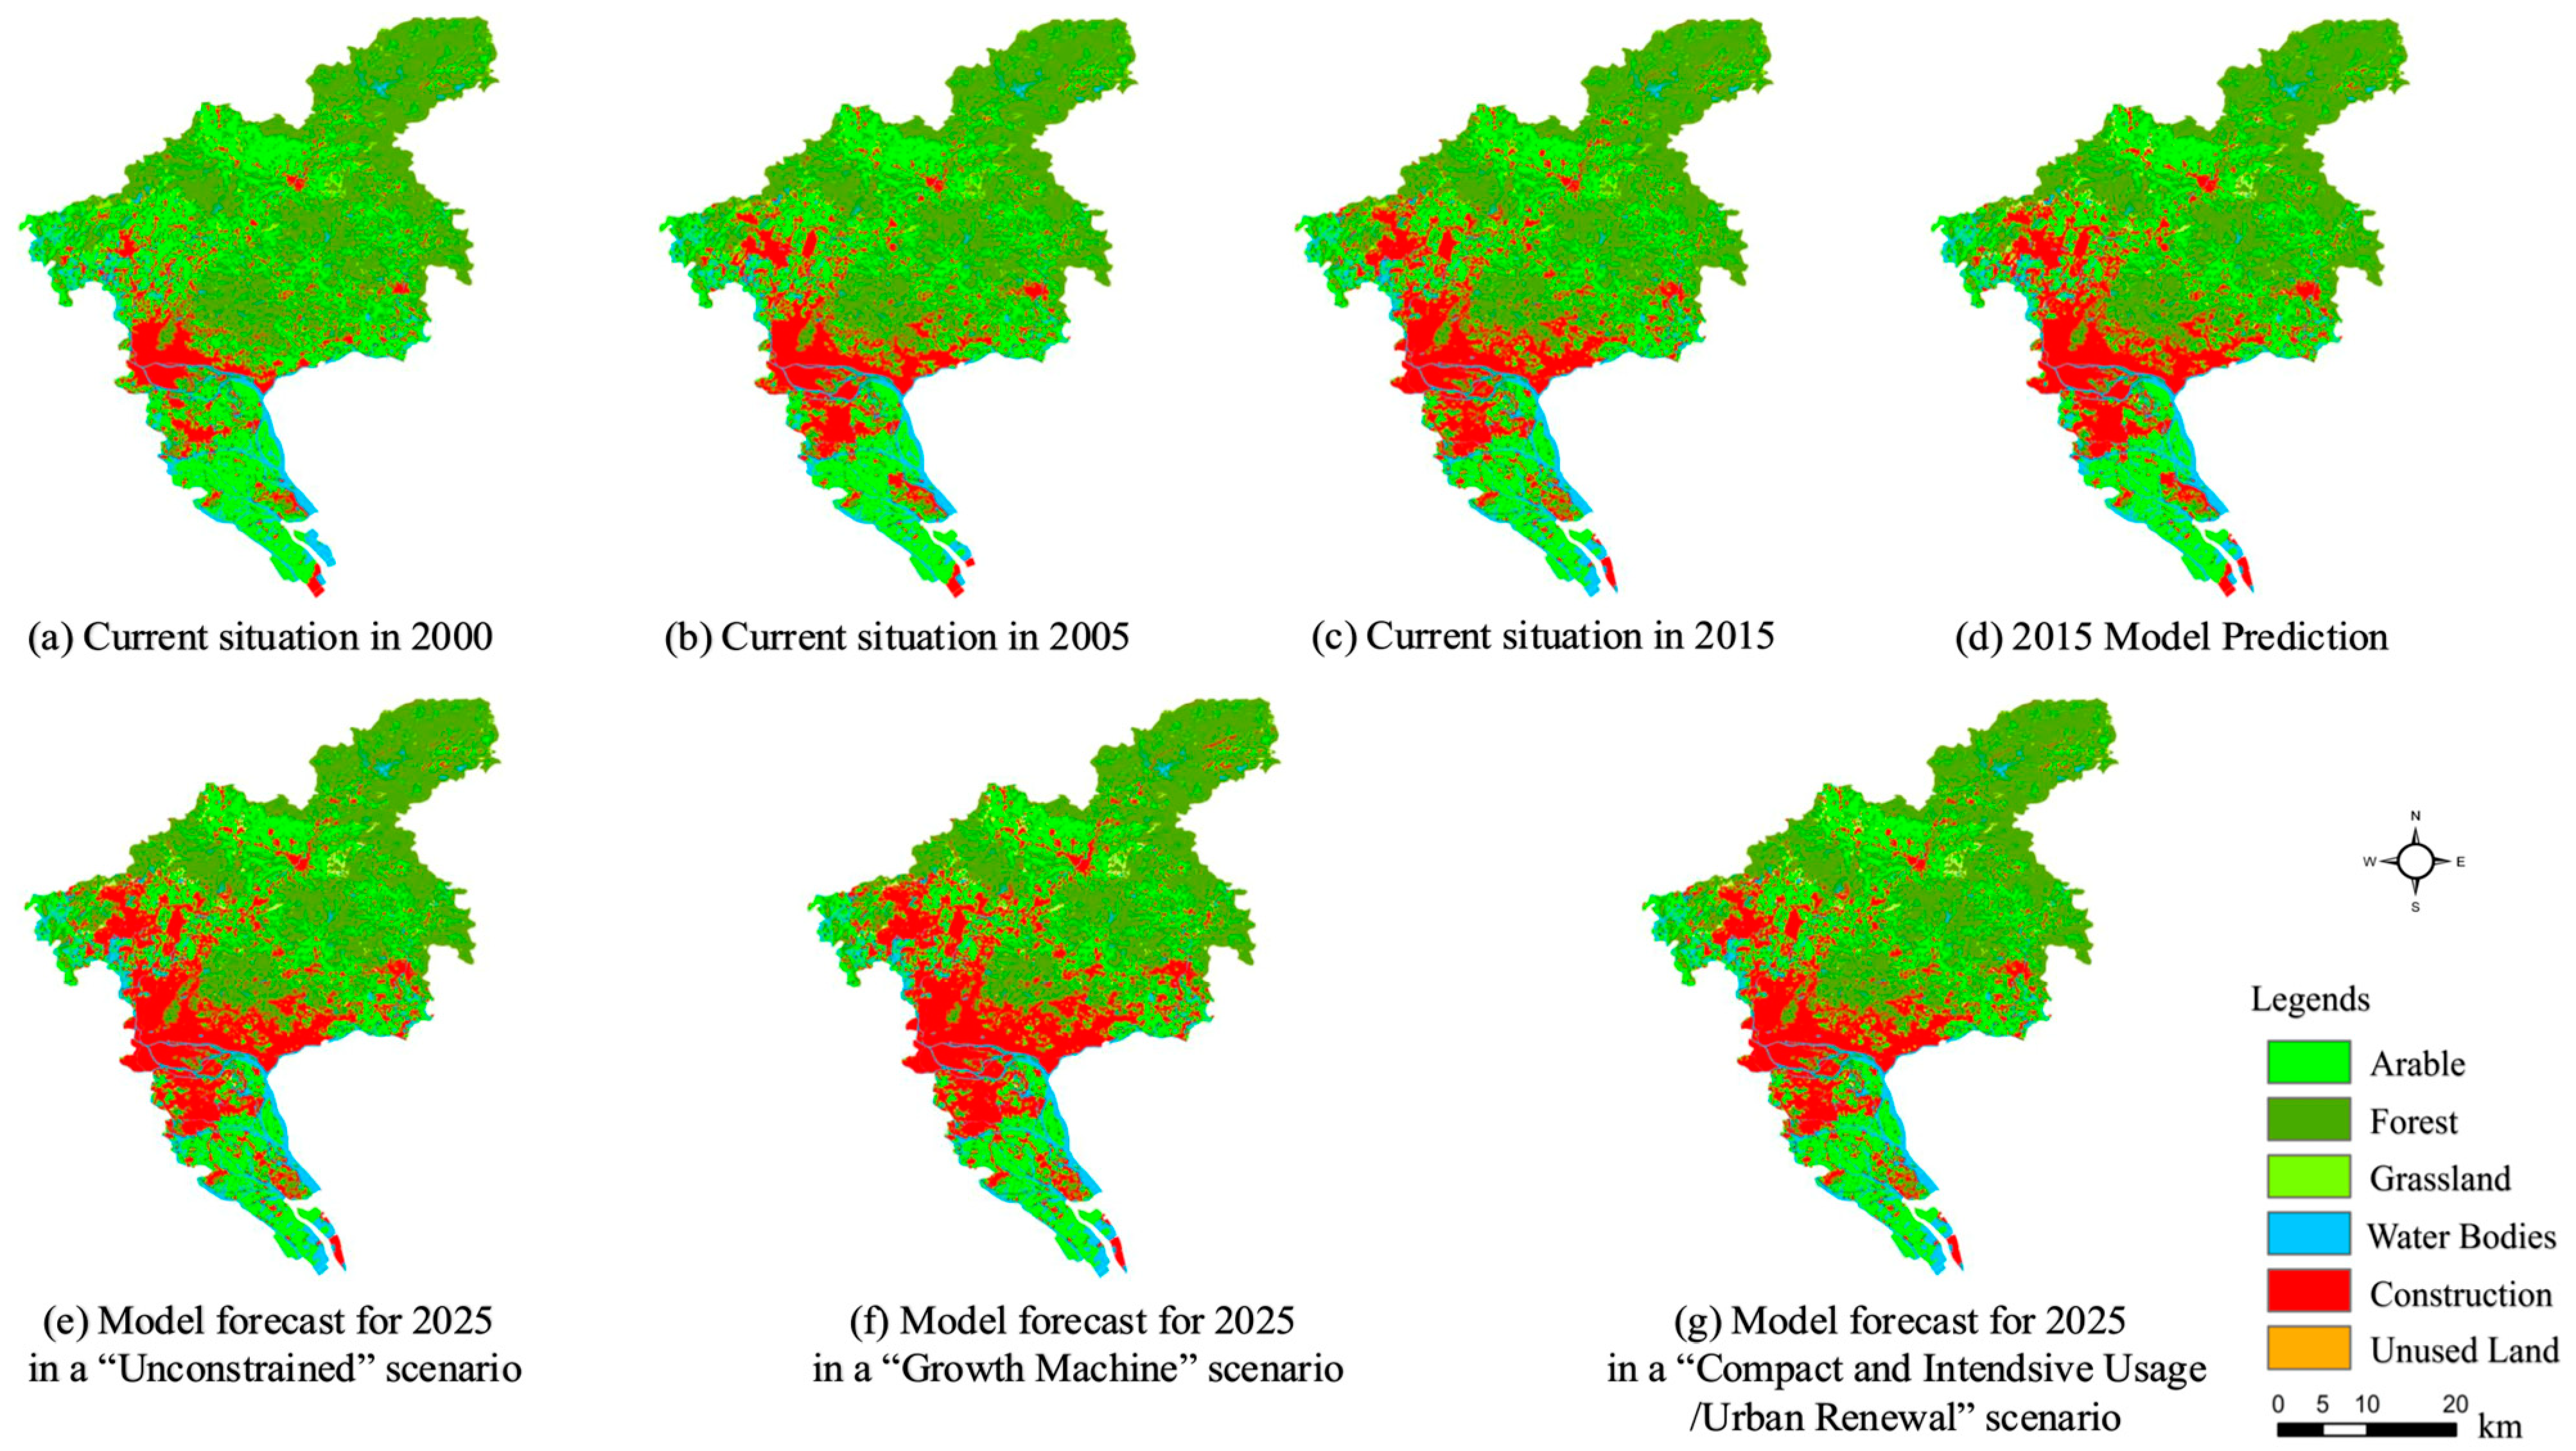
4.3. Simulation of the Suitability of Urban Construction Land Expansion in Guangzhou Under Multiple Policy Scenarios

After analyzing the spatiotemporal trends and characteristics of urbanization and eco-environment coupling in the PRD, this study turned its focus to Guangzhou. As the region’s core city, a driving force of the PRD, even the Guangdong–Hong Kong–Macao Greater Bay Area (GBA), and a key node in China’s national strategy to elevate its urban profile and global competitiveness, Guangzhou plays a central role. However, despite a significant progress in urbanization, the city continues to grapple with serious land-use challenges.
The first phase of the study revealed that Guangzhou’s urban land expansion resulted in greater ecological resource consumption and pressure compared to other cities. This issue underscores the common dilemma faced by megacities and large cities during spatial expansion, positioning Guangzhou as an ideal case for examining the balance between urban spatial development and ecological protection. To better understand and predict the dynamics of urban construction land expansion in Guangzhou and to provide scientific support for decision making on sustainable urban spatial reproduction, the study used the FLUS model to simulate land-use changes under three policy scenarios: “unconstrained”, “growth machine”, and “compact and intensive usage/urban renewal”. The research explored the possible boundaries for incremental expansion in the suitability of urban construction land in Guangzhou.

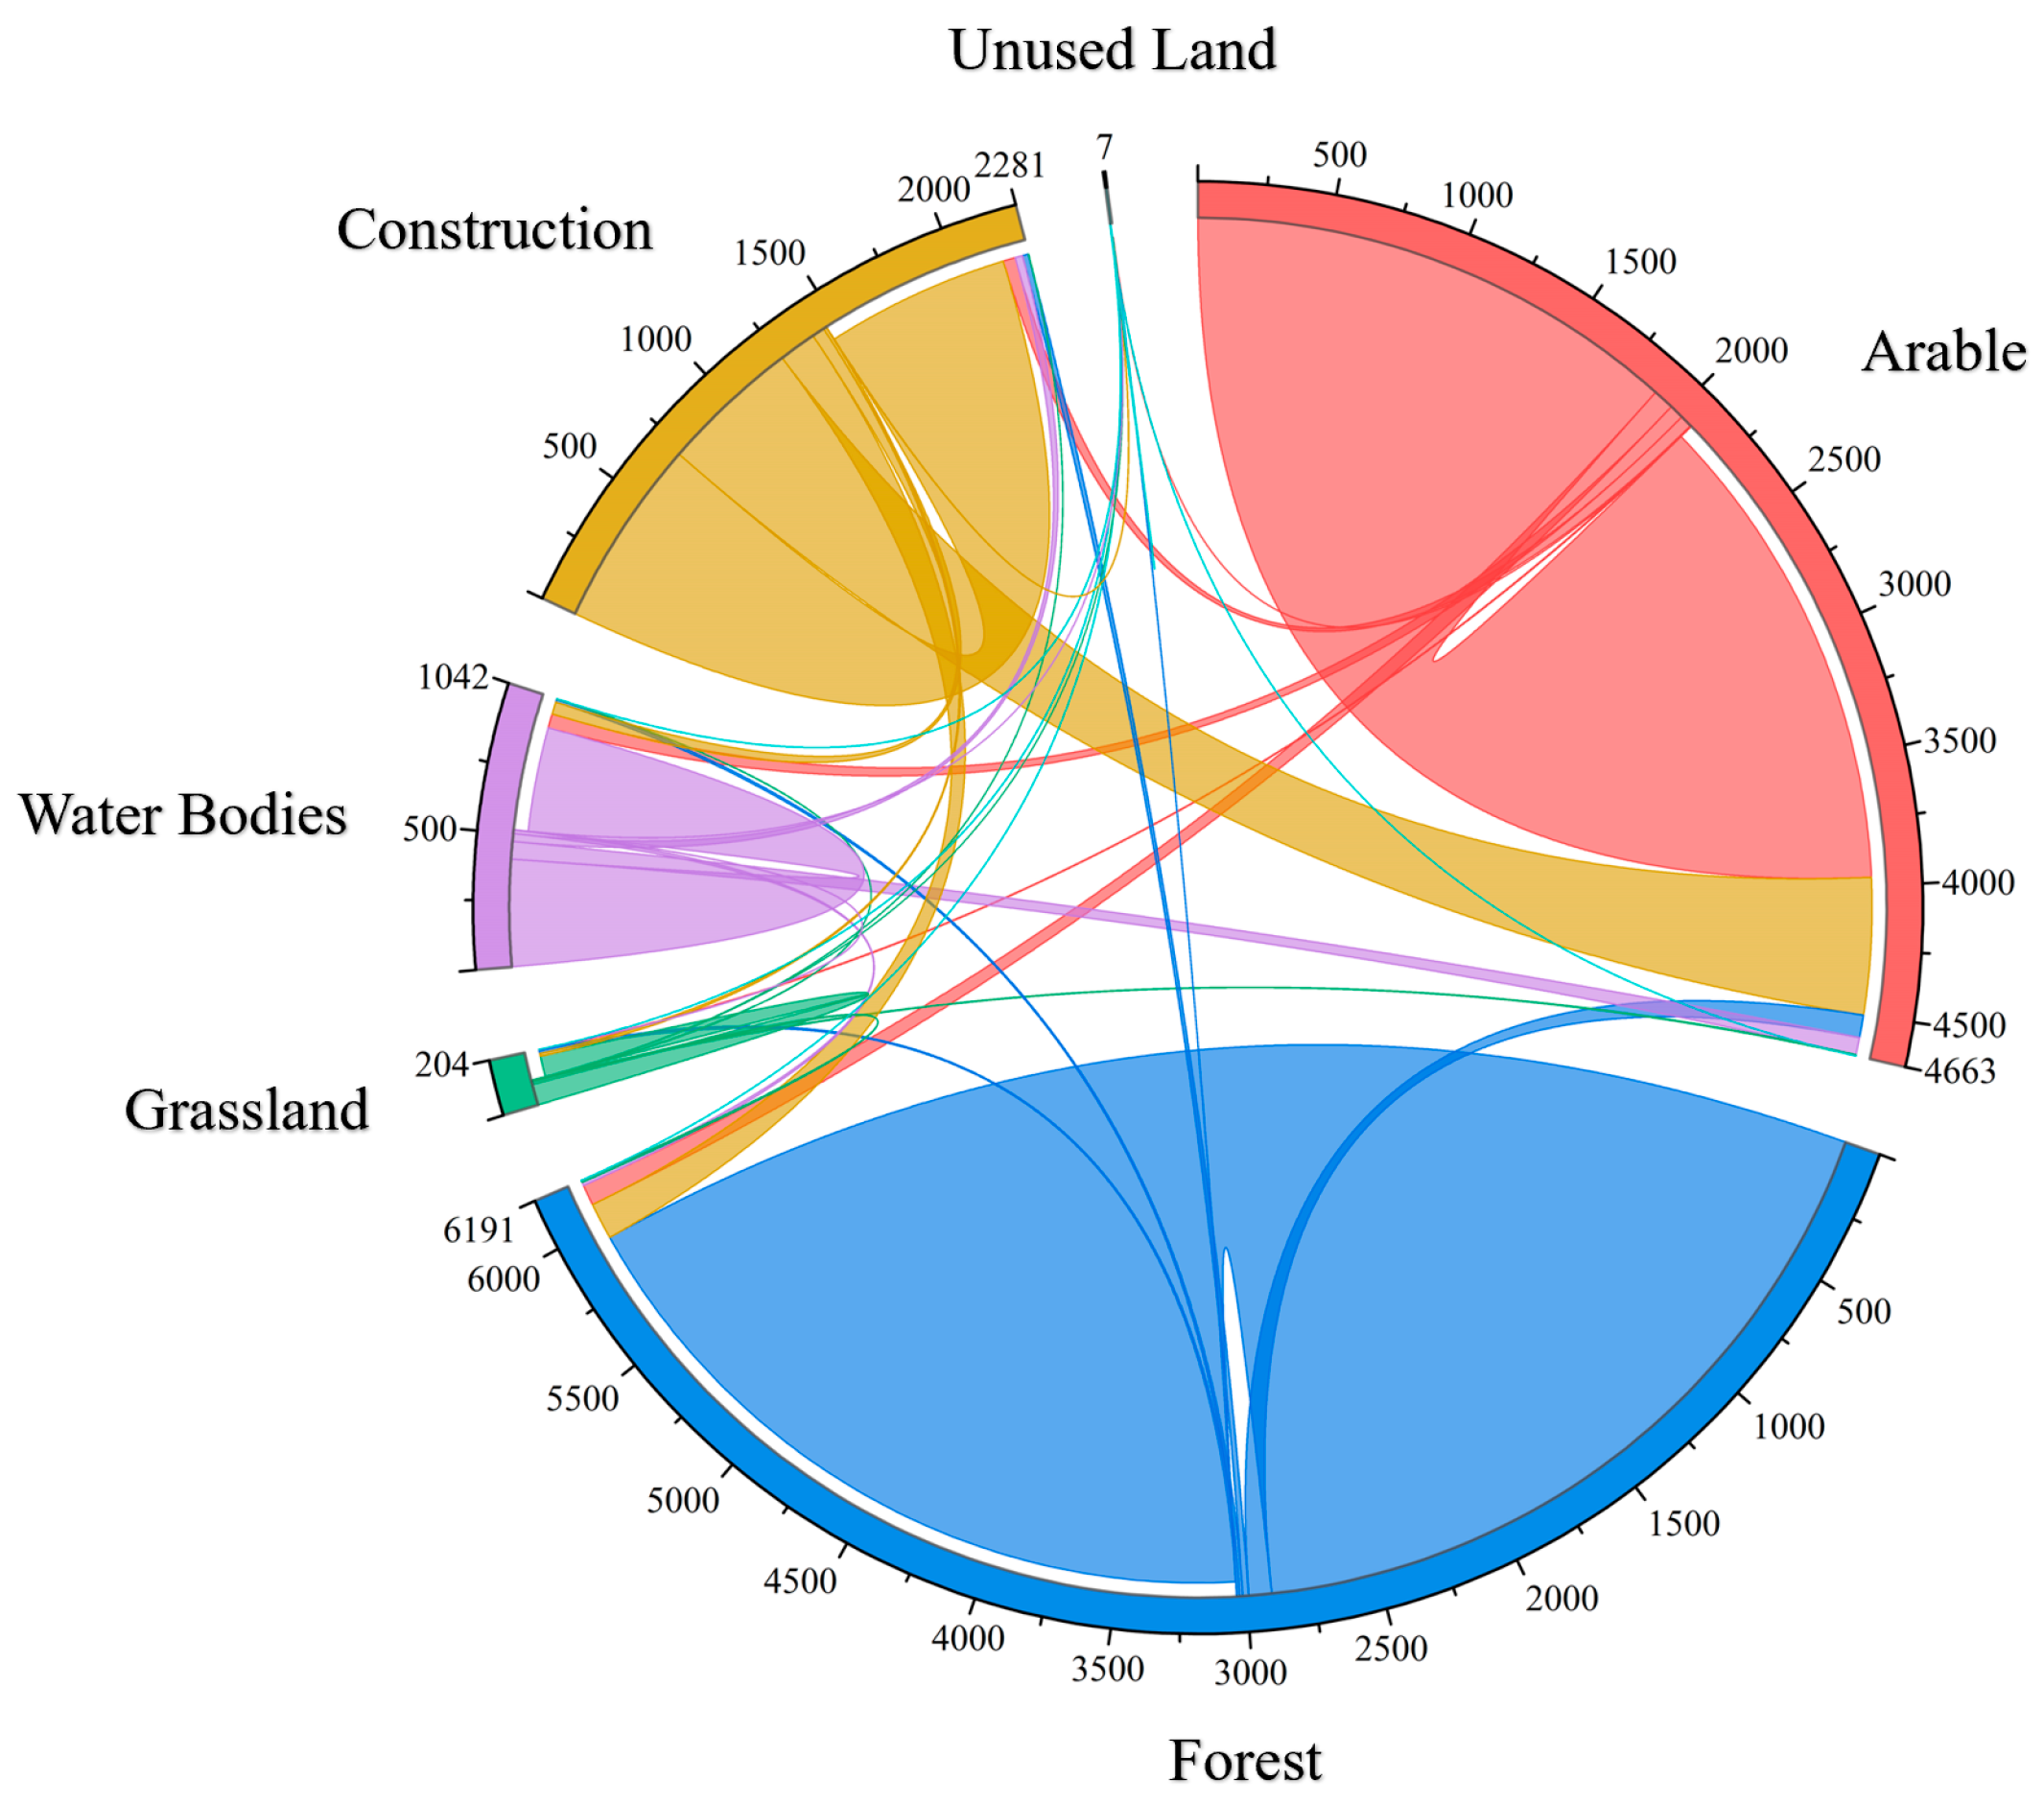
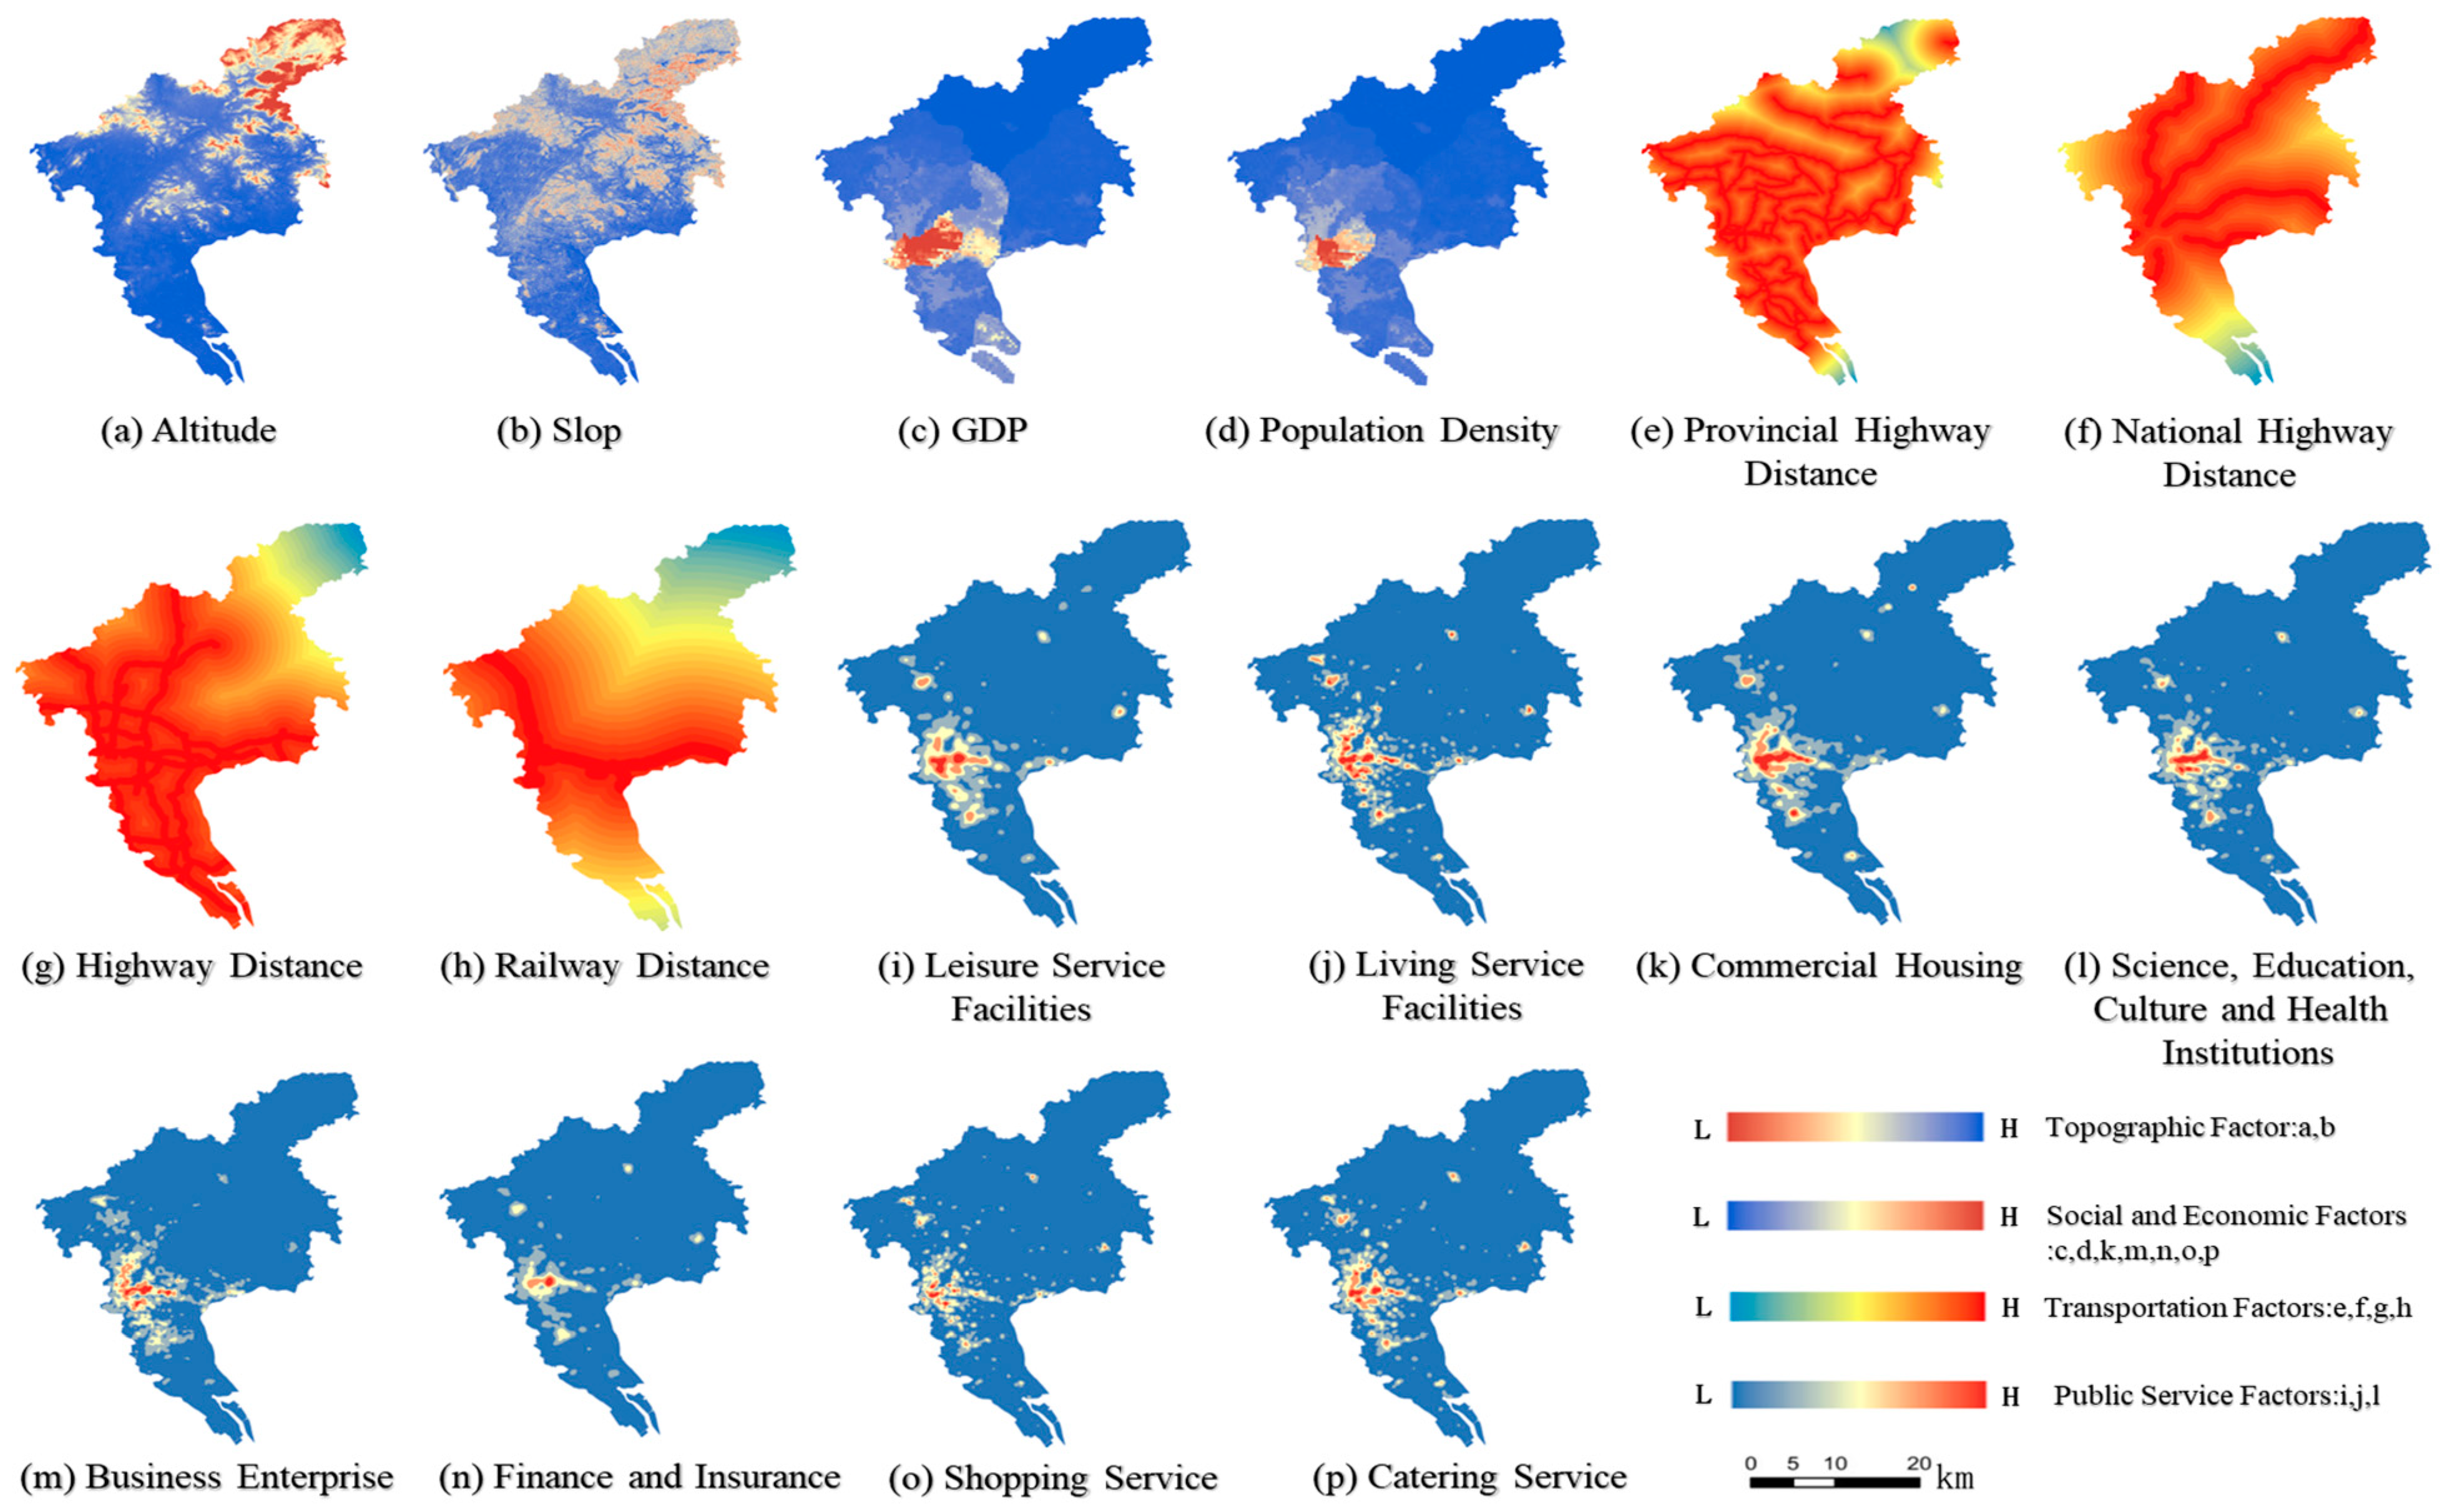
4.3.1. Basic Information on Land-Use Types and Identification of Land Driving Factors

The study extracted land-use data for Guangzhou from 2000 and 2018, calculating the land-use transfer matrix, dynamic change rate of land-use types, and the comprehensive land-use index. The results are presented in Figure 10 and Table 5. It is evident that the overall area of urban construction land in Guangzhou has continued to expand, indicating that the city remained in a growth phase between 2000 and 2018. Over the past 20 years, approximately 533.64 km2 of cultivated land, 143.21 km2 of forest land, 11.10 km2 of grassland, and 47.92 km2 of water bodies have been converted into construction land. The construction land area has experienced the highest and most significant rate of change, with a positive growth of 4.38%.
To further identify the key factors influencing the conversion of non-construction land to construction land, a binary Logit regression model was applied, as shown in Table 6.
logit p i = log p i 1 p i = α 1 + β 2 GDP + β 3 POP + β 4   Central
+ β 5 EUGS + β 6 EUTL + β 7 DEM + β 8 SLOP
The results show that the GDP density had a significant positive impact on the expansion of urban construction land. For every RMB 10,000 increase in GDP per square km, the odds of conversion to construction land increased by 1.02 times, or by 2.15%. In contrast, population density had a significant negative effect (0.955, p < 0.01), indicating that in areas with higher population concentrations, the proportion of developed land is already high, leaving limited room for further conversion. This resulted in a 4.48% reduction in the odds of conversion. Similarly, the distance to district centers (0.944, p < 0.01), highways (0.981, p < 0.01), and metro stations (0.0931, p < 0.01) had a significant negative effect, suggesting that the closer the proximity, the higher the likelihood of conversion. This aligns with the general understanding that cities expand outward along transportation routes. Moreover, elevation and slope also showed significant negative effects, as areas with higher elevation and steeper slopes are typically less suitable for urban development.
Beginning with a historical scenario, land-use changes for 2015 were simulated using Guangzhou’s 2005 land-use data, along with the four major categories and 16 driving factors identified through the logistic regression model, as shown in Figure 11. The simulation results were compared with the actual 2015 land-use data to validate and refine the model, which was then used to simulate and analyze policy scenarios for land use in 2025. In this process, the neighborhood weight of each land-use type was calculated as the ratio of the total area of change from 2000 to 2018 for the increase and decrease in each type of land use. The final values are shown in Table 7. The three policy scenarios of “unconstrained”, “growth machine”, and “compact and intensive usage/urban renewal” were simulated by setting the three land conversion constraint matrices, as shown in Table 8. Using the Markov model, the land-use data of Guangzhou in 2005 was employed as the initial year to calculate the land-use transition probabilities in the study area over the 10-year period from 2005 to 2015. As previously noted, the rapid expansion of urban land in Guangzhou during this period fueled positive expectations for the real estate market. In response, the local government implemented a series of regulatory policies. The Markov model is not well-suited for long-term predictions of future land-use quantities; therefore, to ensure data accuracy, this study predicted the land-use structure of Guangzhou for the year 2025.
Unconstrained: This scenario simulates a natural setting without policy intervention, where all land types (e.g., arable (A), forest (F), grassland (G), etc.) can freely convert to construction land (C) or revert back to natural land. This conversion process reflects the natural dynamics of land use, without the imposition of policy-driven constraints. As a baseline scenario, we did not change the land-use transition probabilities.
Growth machine: In this scenario, the strong emphasis on economic development allows all land types to be converted into construction land (C) to accommodate urban expansion and economic growth. However, once designated as construction land, it cannot be reverted to other land types. This one-way conversion reflects a policy focus on economic growth, prioritizing urban expansion and development at the expense of land restoration or conservation. Taking into account the economic orientation of the land growth paradigm, the transition probability matrix in the baseline scenario was adjusted by increasing the likelihood of other land-use types converting to construction land by a factor of 1.3. The adjusted transition probability matrix was then normalized.
Compact and intensive usage/urban renewal: This scenario emphasizes the efficient use of land by minimizing new land development and promoting the redevelopment and reuse of existing urban land. The conversion of natural resources, such as arable (A), forest (F), and grassland (G), is strictly limited, reflecting a strong commitment to ecological protection. This approach aims to reduce the expansion into undeveloped land, focusing instead on urban renewal and enhancing land-use efficiency to support economic growth, in line with policy goals of resource conservation and environmental protection. Given that urban renewal focuses on redeveloping and transforming existing urban land, the probability of self-conversion for construction land in the transition probability matrix of the baseline scenario was adjusted to 1 and normalized accordingly.
It is important to note that Guangzhou has implemented specific policies to ensure the maintenance of the basic water surface area and to enhance water management and protection. As part of this effort, a special provision has been made to prohibit the conversion of existing water bodies (W) into other land-use types. This measure aims to preserve the essential functions of water bodies in flood control, drainage, water supply, irrigation, navigation, and ecological balance. Additionally, it safeguards the city’s water bodies as key urban landscapes and historical features within designated zones.

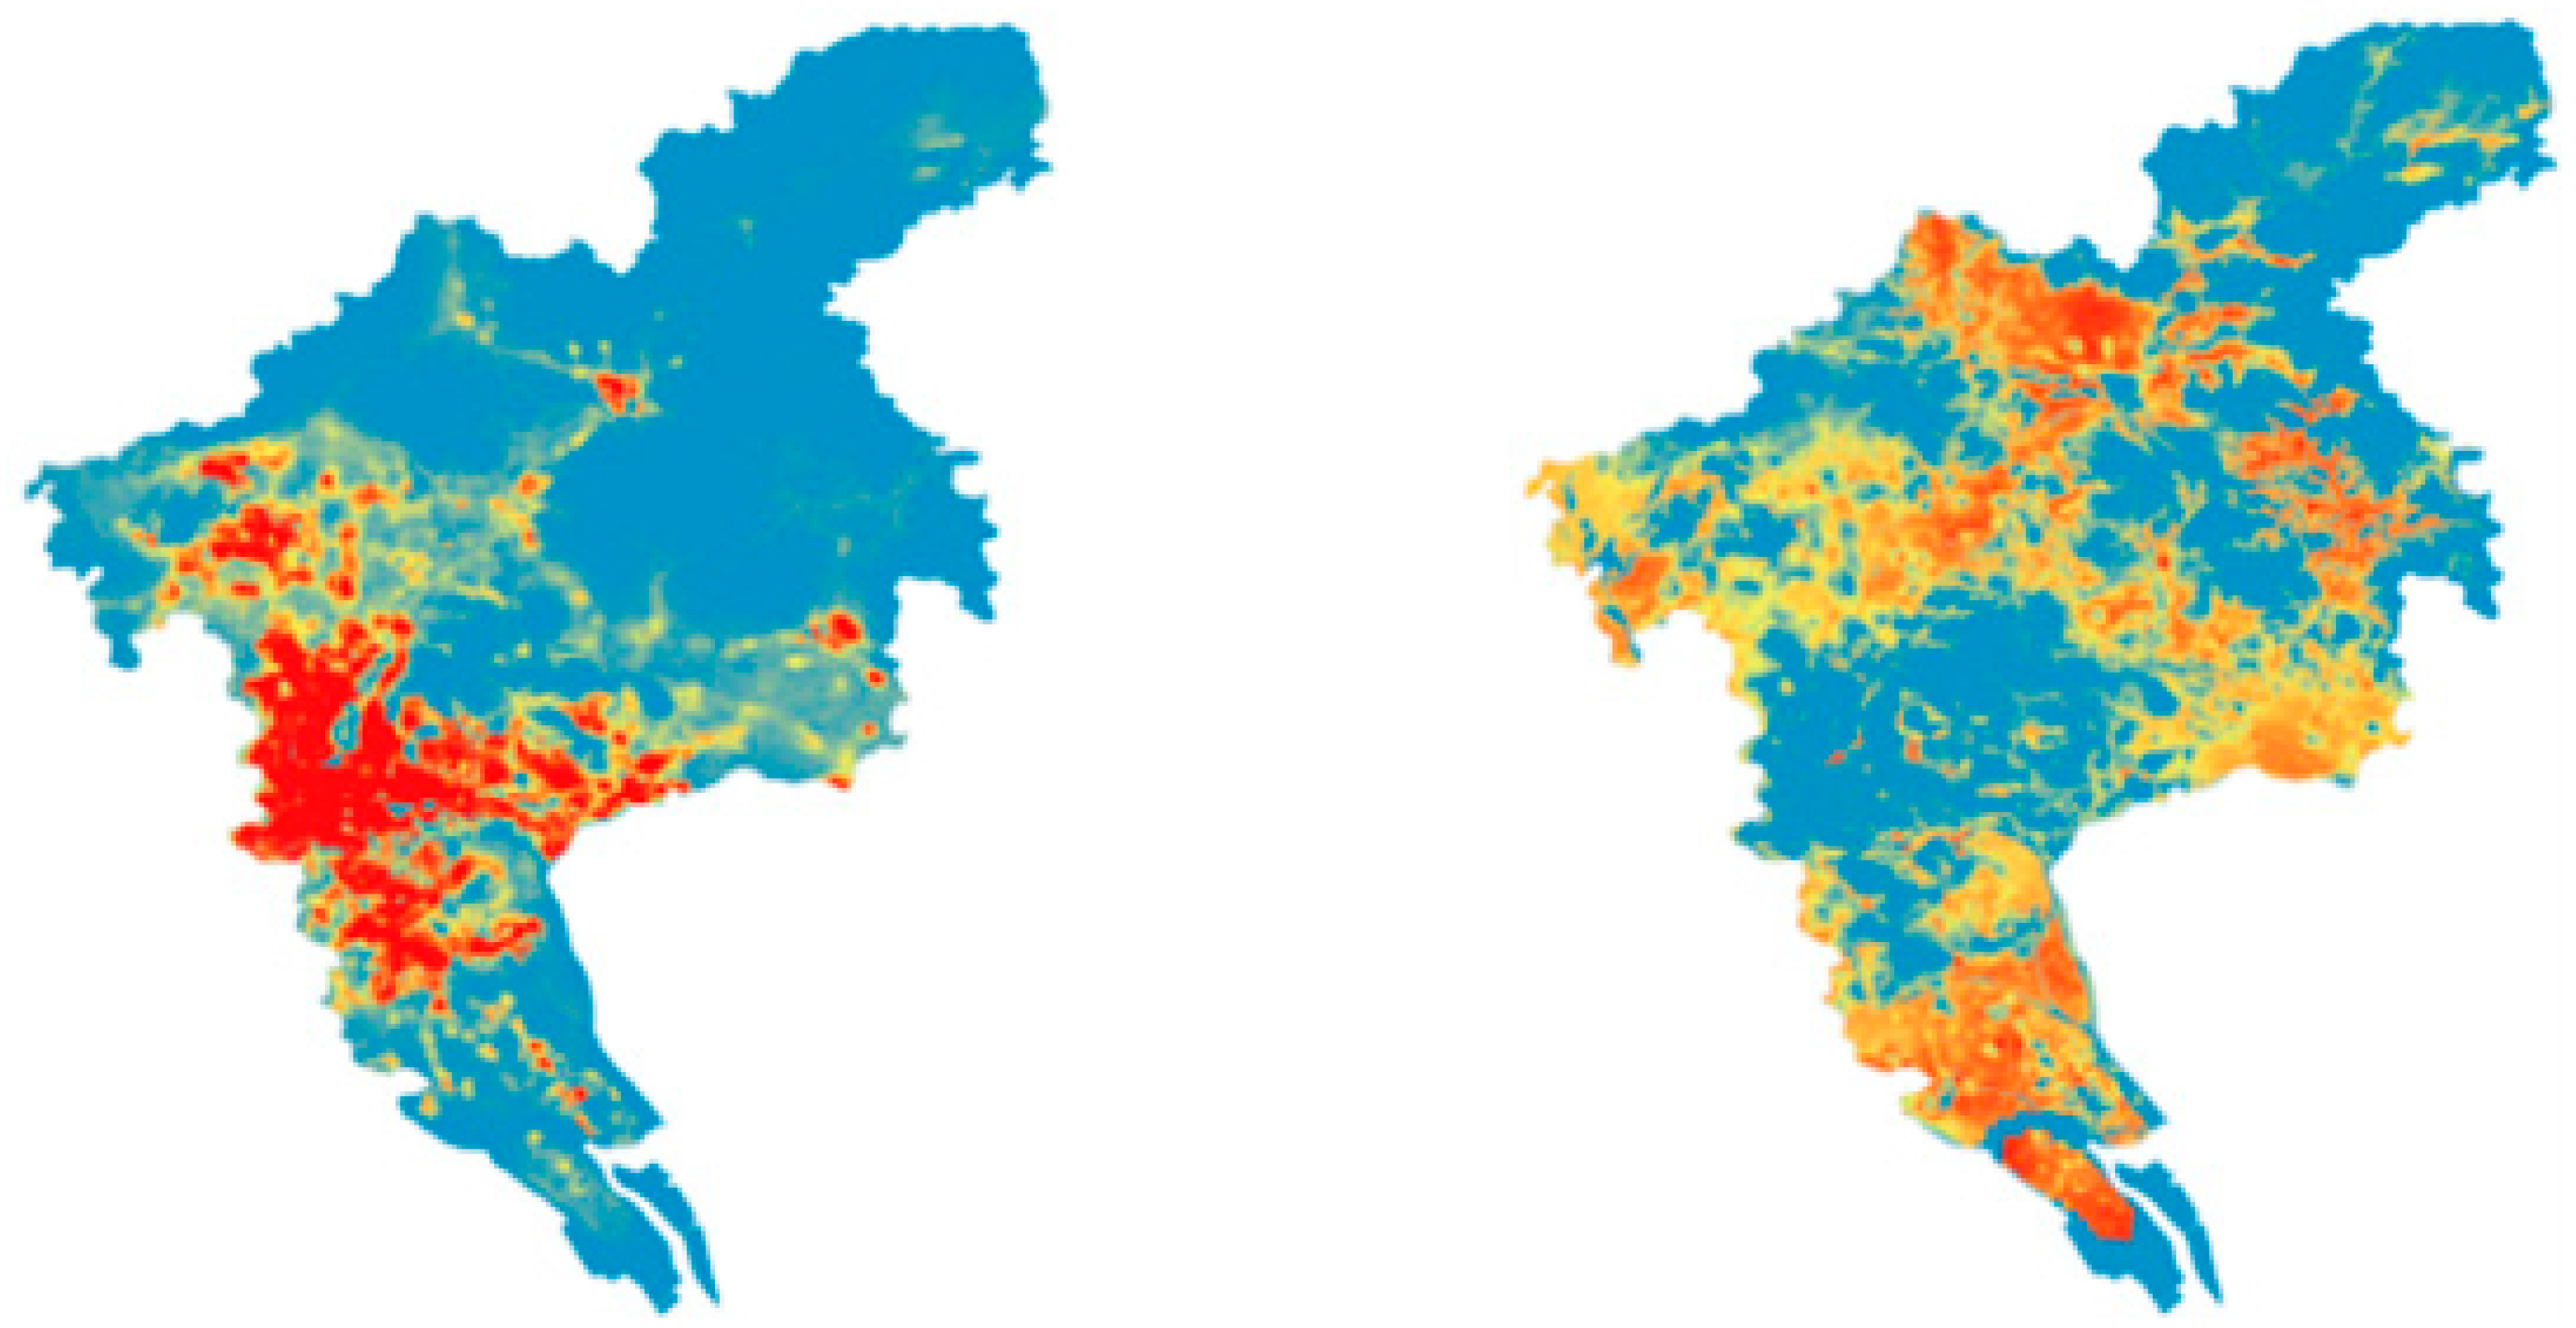
4.3.2. Estimation of Probability of Construction Land, Model Precision Validation and Sprawl Simulation

To estimate the land-use probability of occurrence, this study used Guangzhou’s 2015 land-use data. After normalizing the driving factors, 20% of the raster data pixels were extracted as training samples using random sampling. Based on empirical evidence, 12 hidden layers were added to the neural network. The ANN model was then applied to compute the suitability probability for each land-use type represented by the pixels. As shown in Figure 12, each color band represents a specific land-use type, with lighter shades indicating higher suitability and darker shades indicating lower suitability. As illustrated in the left panel, darker red areas denote higher suitability for urban development and construction.
Model precision validation was carried out using the 2005 land-use status data of Guangzhou as the initial data. The number of iterations was set to 200, with the model stopping early if the target was reached. In the self-adaptive inertia and competition CA model, the neighborhood value is an odd number, with the default size set to 3, corresponding to a 3 × 3 Moore neighborhood. The acceleration factor was adjusted to 0.4 due to the large simulation area, which caused the model to run slowly. This adjustment helps speed up the rate of land-use change. As shown in Table 9, the Kappa value of the experimental model for this study was 0.839, which is greater than 0.75, so the simulation accuracy of this model is high and can be used for prediction.
The Markov model was employed to predict the land-use structure in Guangzhou for 2025. As previously noted, the transition probabilities in the baseline scenario were adjusted, utilizing the 2018 land-use data as the initial spatial layout. The three constraint matrices were applied with the same parameter settings used in the CA model for precision validation to simulate the spatial distribution of land use in Guangzhou for 2025. The final result is displayed as Figure 13 and Figure 14.
In the FLUS simulation with an accuracy of 84%, significant land-use changes in Guangzhou by 2025 were primarily seen in arable (A), forest (F), and construction (C) land. A comparison of the increase in these three major land-use types between 2018 and 2025 under the “growth machine” and “compact and intensive usage/urban renewal” policy scenarios shows that if the government adopts the land-saving and intensive-use approach, approximately 476.84 km² of construction land, 110.71 km² of cultivated land, and 180 km² of forest land could be preserved. As for construction land, according to the statistics from the Guangzhou municipal government, the total built-up area in 2021 was 1366.02 km². Based on the simulation, if the “growth machine” policy is followed, an additional 608.12 km² of suitable land would be available for development. In contrast, if the “urban renewal” policy is implemented, only 131.28 km² would remain, saving around 476.84 km² of land. Together with the previous simulation results, this indicates that China’s urban renewal policies can effectively promote land-saving and intensive use, revitalizing existing urban spaces.

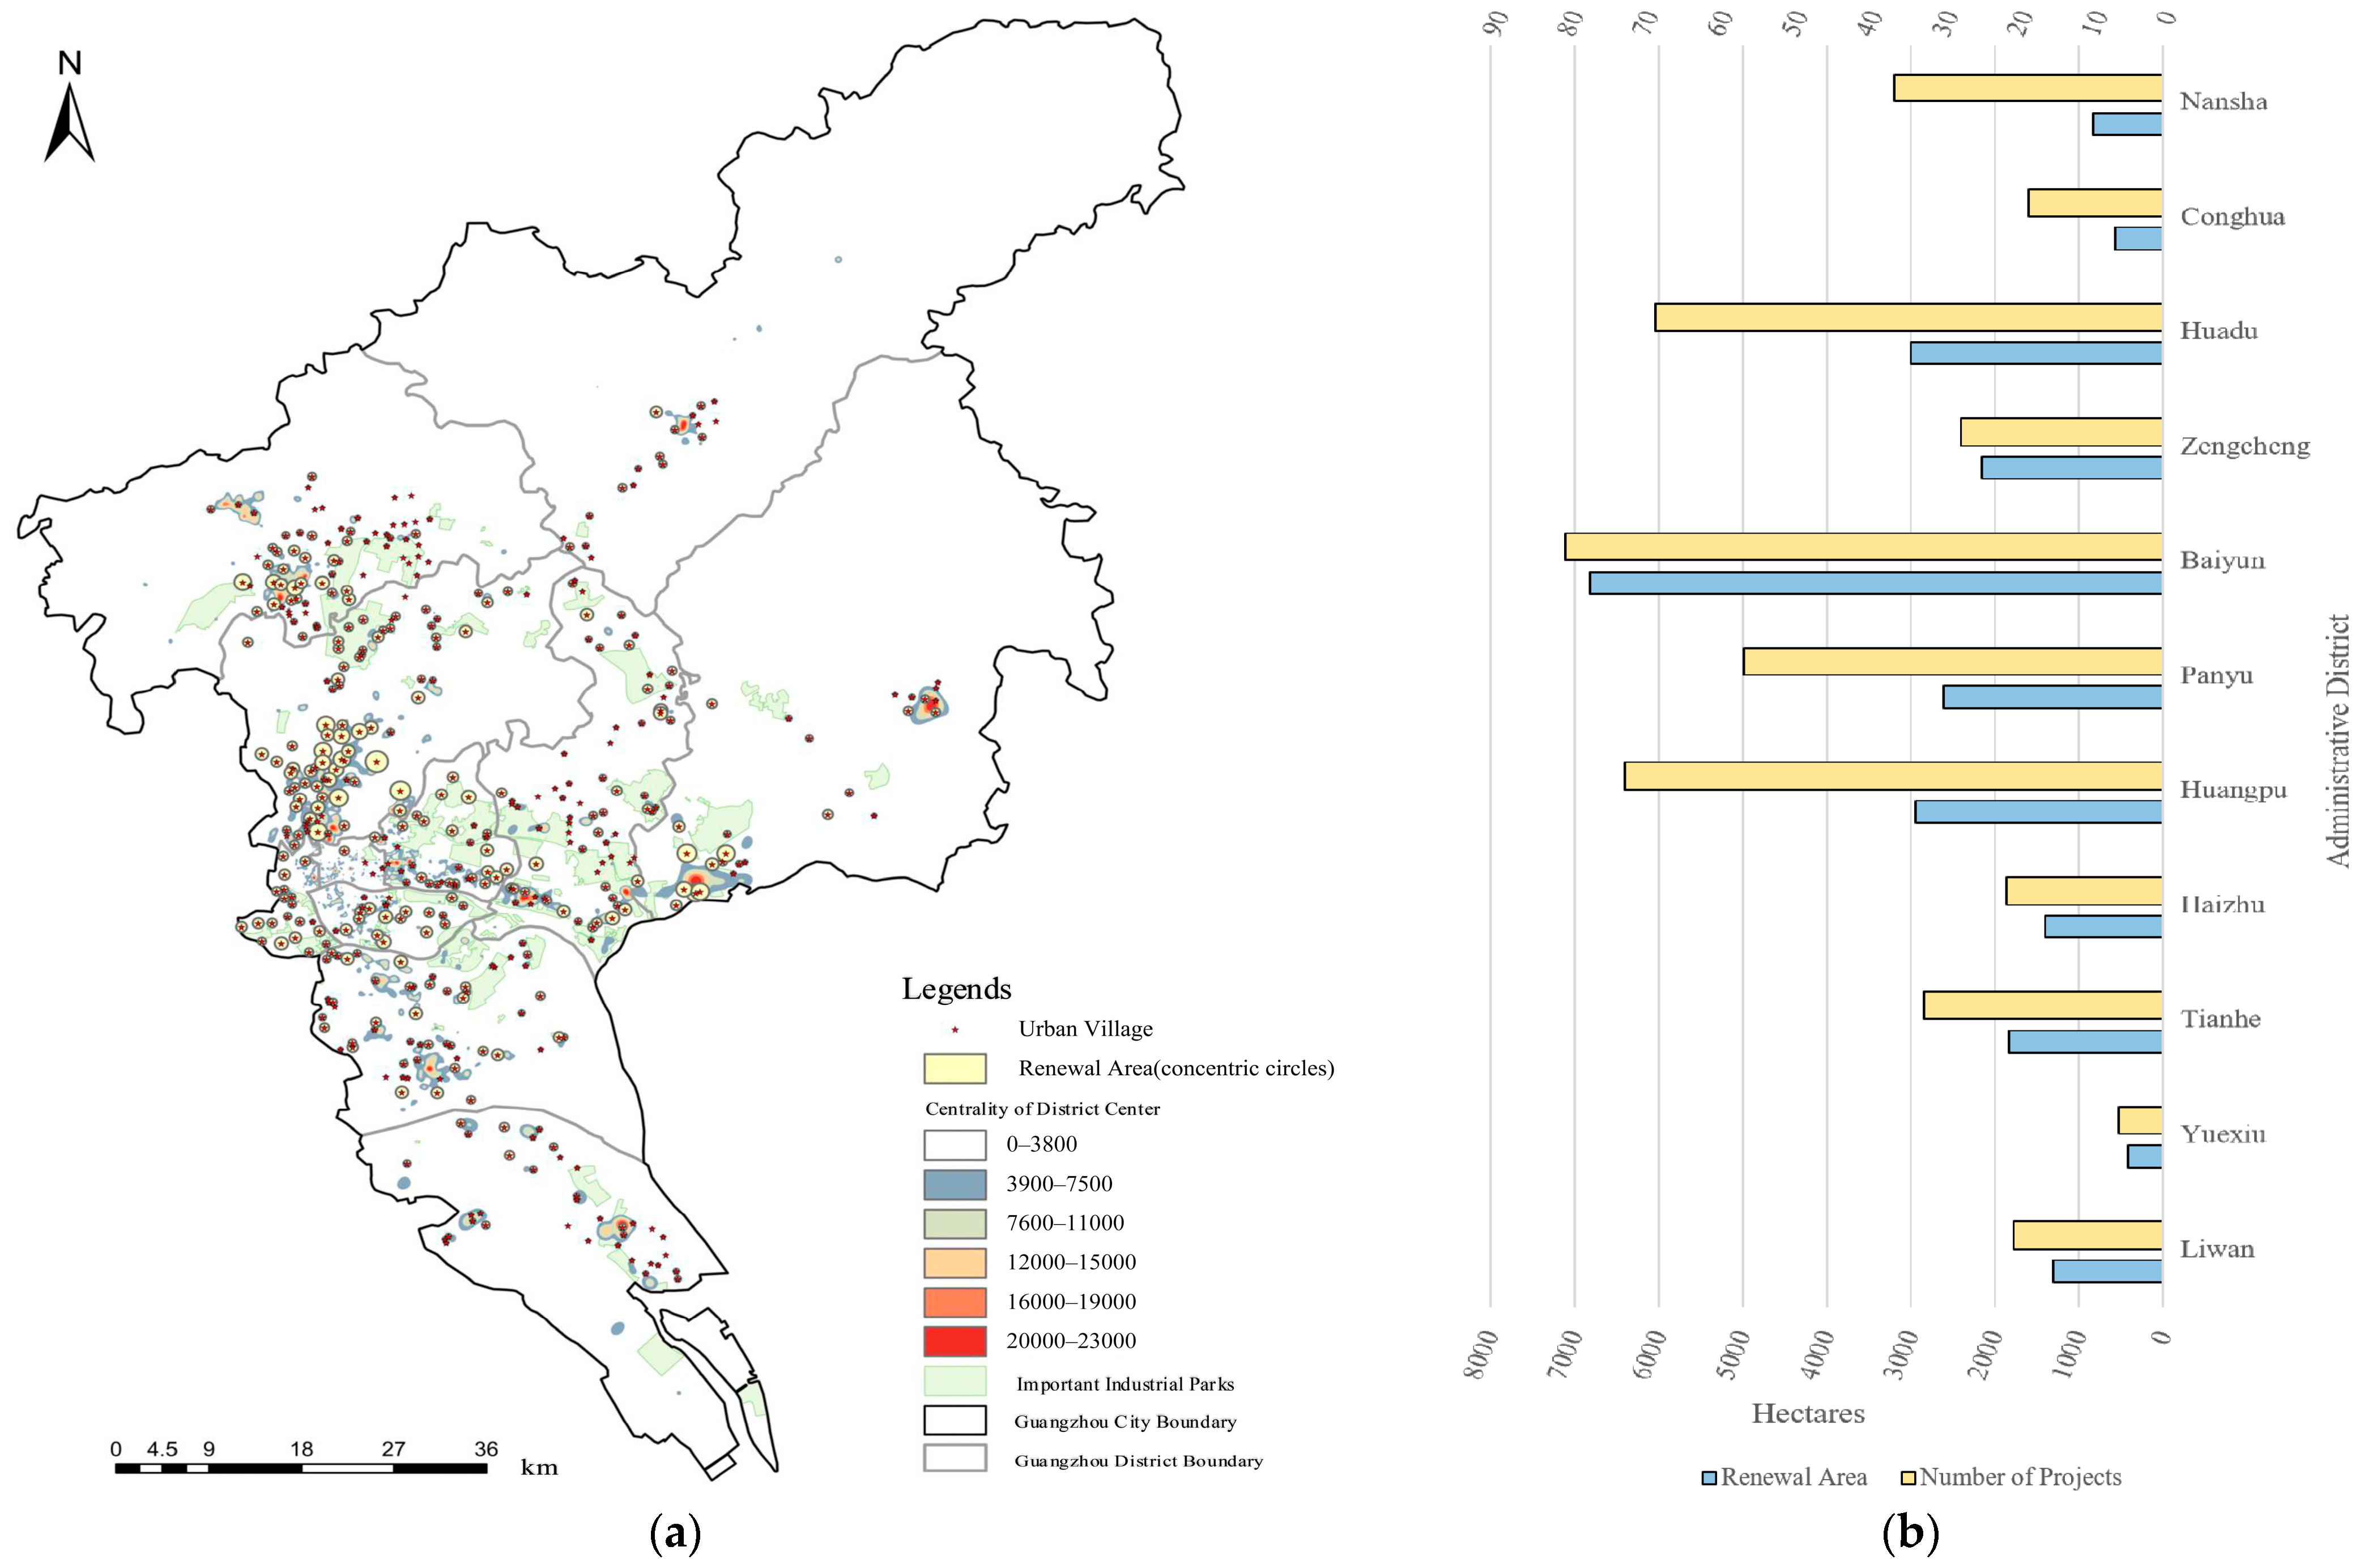
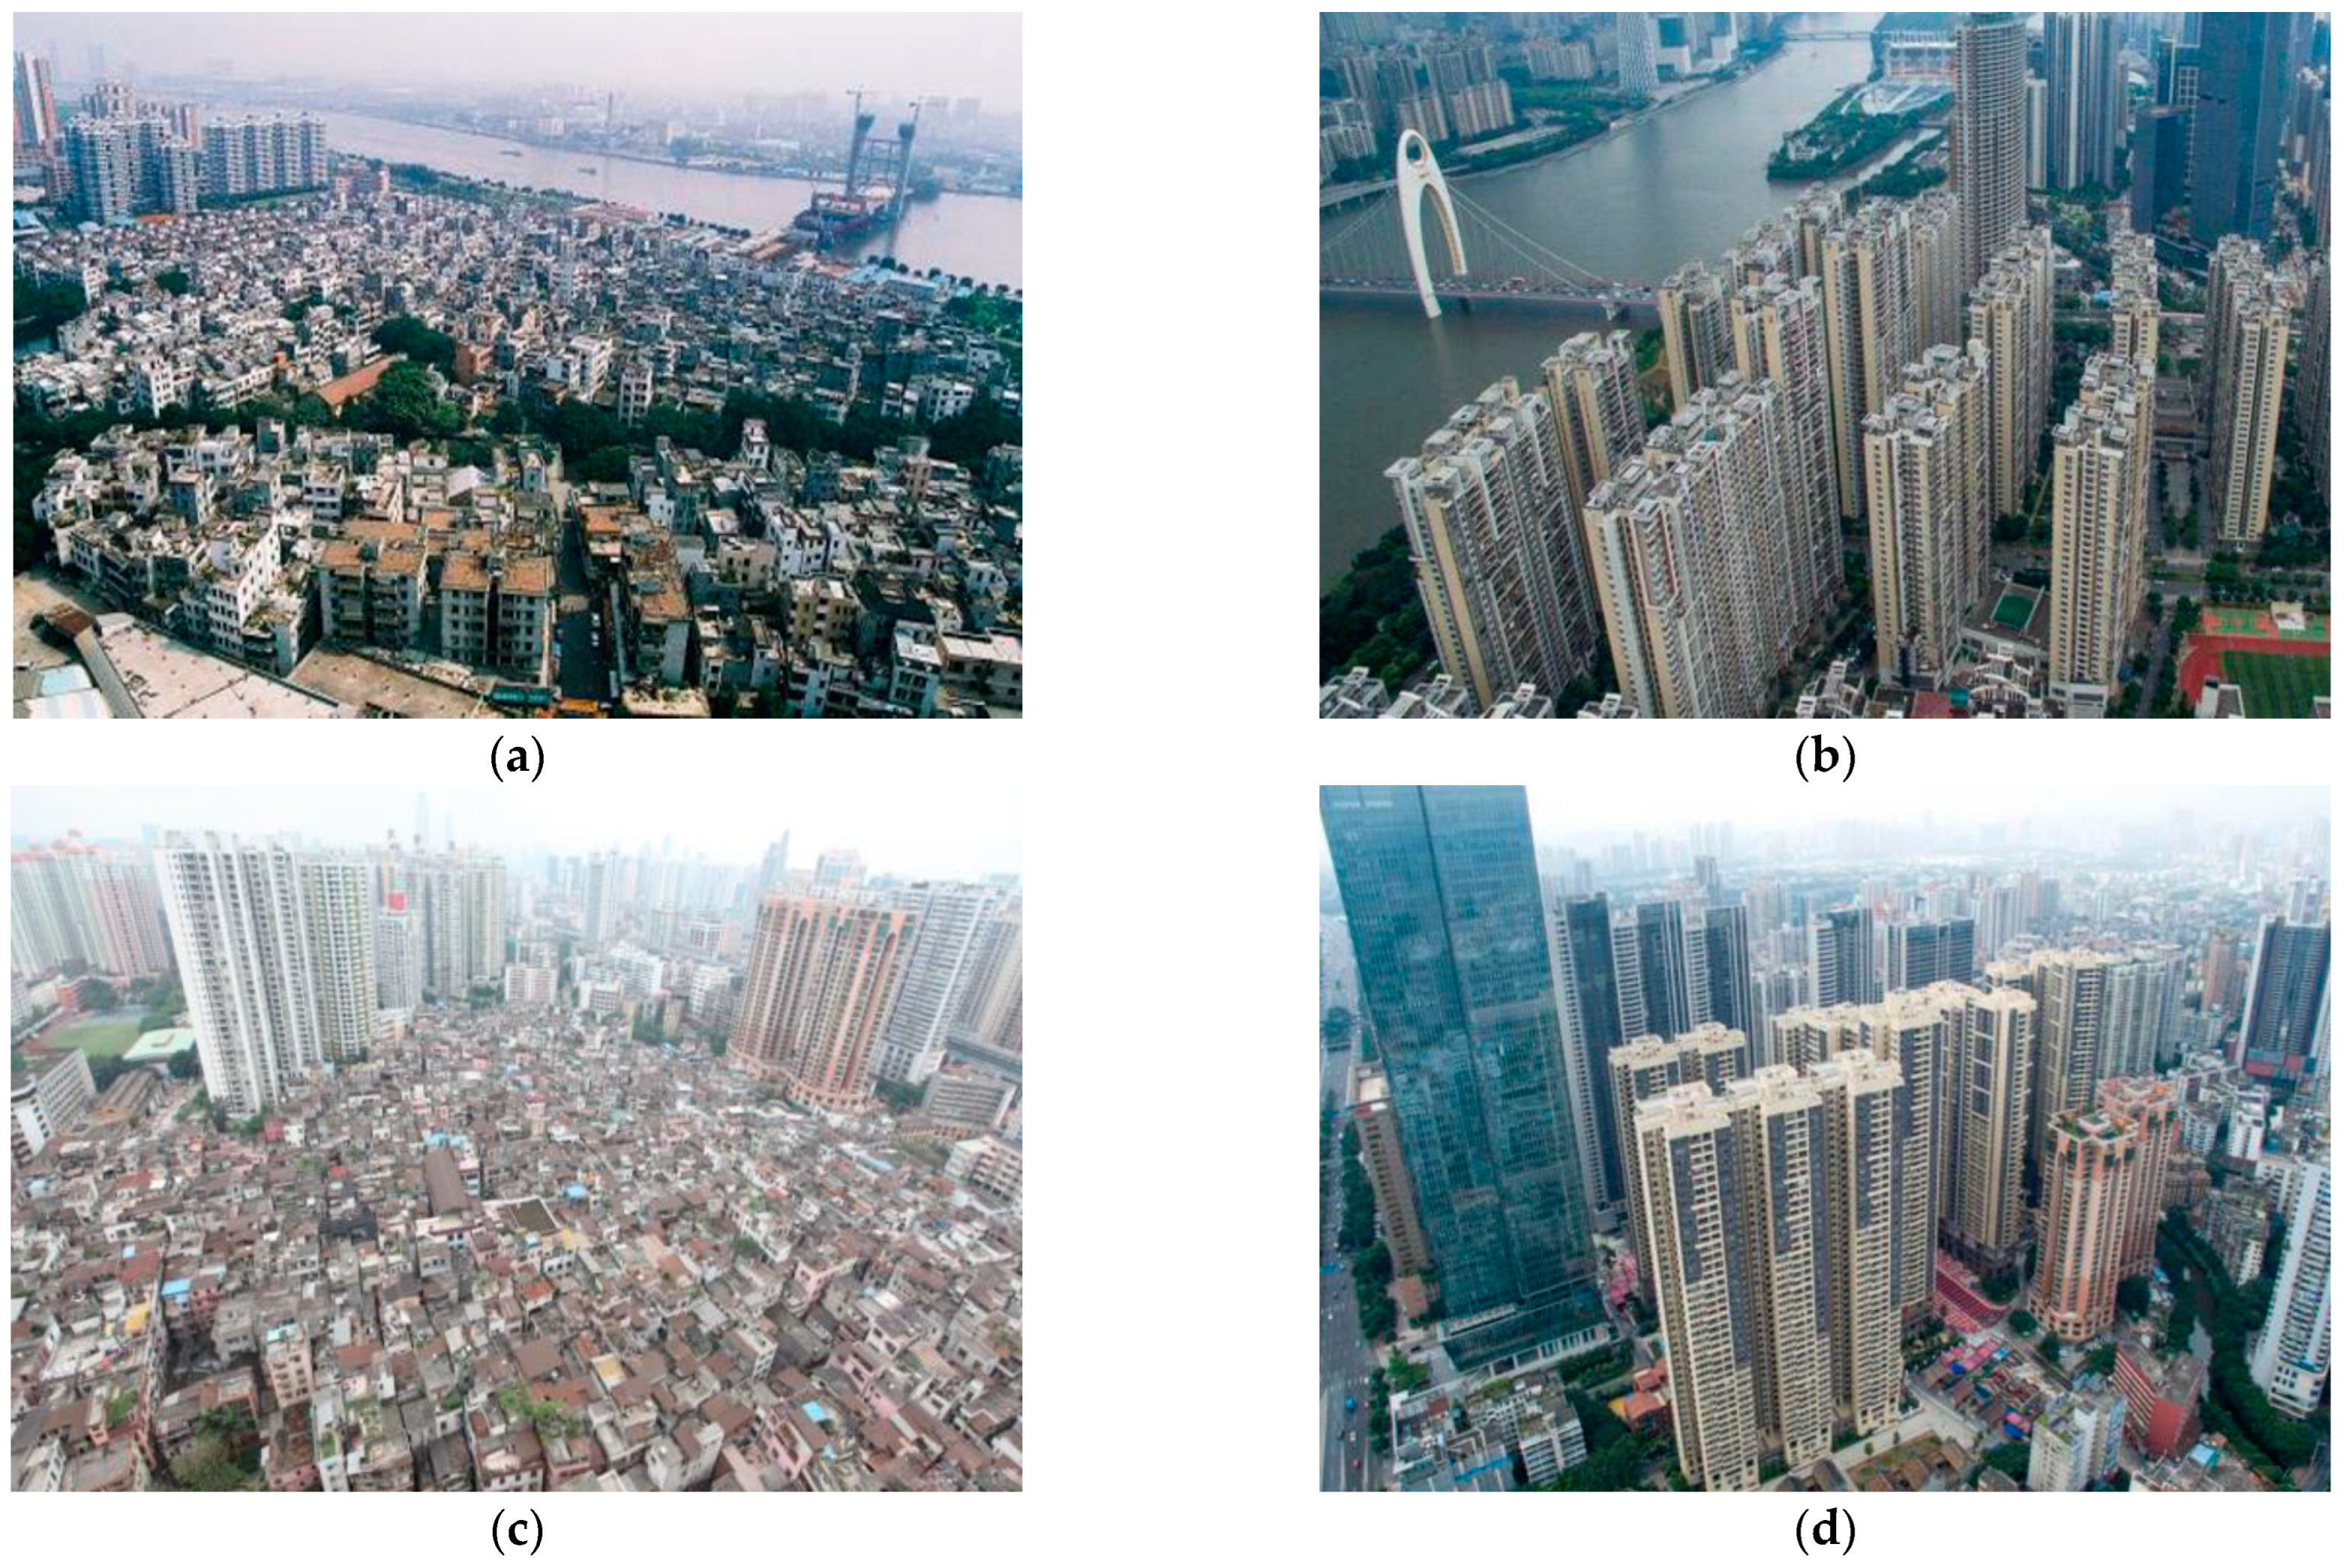
4.3.3. Urban Renewal: Guangzhou’s Key Strategy for Reconciling Urbanization with the Eco-Environment

As the only province in China to maintain the highest GDP for 35 consecutive years, Guangdong has achieved remarkable economic success while gradually uncovering conflicts between land supply and demand, along with historical land-use issues. Within this context, Guangzhou and Shenzhen stand out as prominent cities in China’s first tier of urbanization. In 2008, the 11th session of the 13th Standing Committee of the Guangzhou Municipal People’s Congress highlighted that the increase in construction land in Guangzhou is extremely limited and that there is a shortage of land reserve resources. According to the revised main control indicators of the “Guangdong Province Land Use Master Plan (2006–2020)”, the construction land in Guangzhou was projected to reach 1714 km² by 2020. However, by 2007, 1600.38 km² had already been utilized, leaving only about 114 km² available for development over the next 13 years. Confronted with resource and planning constraints as well as population and development pressures, Guangdong has recognized and actively harnessed the significant potential of its urban stock. In 2008, the former Ministry of Land and Resources of China and the Guangdong provincial government initiated a collaborative effort to establish the province as a pilot for land-saving and intensive use. Since then, Guangdong has led the nation in implementing the “Three Olds” transformation pilot program.
Since the end of the 20th century and the beginning of the 21st century, the Guangzhou municipal government had already issued guiding documents addressing each of the “Three Olds”6. As early as 2006, the Guangzhou municipal government adjusted its urban development strategy by proposing a “medium adjustment” based on the original “Eight Character Guideline”. In 2000, the ”Overall Strategic Concept Plan for Urban Construction in Guangzhou” outlined the spatial layout of Guangzhou as “Expanding Southward, Optimizing Northward, Advancing Eastward, and Connecting Westward”. Urban renewal was reaffirmed as a key priority for government policy, focusing on optimizing, enhancing, strengthening, and revitalizing urban development.
As of 2024, urban renewal in Guangzhou, known as the “Three Olds” transformation, has been underway for nearly 30 years. During this time, the proportion of existing land within Guangzhou’s urban land supply structure has steadily increased. As illustrated in Figure 15 and Figure 16, along with Table 10 and Table 11, the FLUS simulation result of 476.84 square km of construction land was found to be within a reasonable range when compared to the actual data. As Guangzhou’s land-use pattern gradually transitions from a primarily incremental model to a stage that combines both incremental and stock utilization, taking the renovation of urban villages, which accounts for the largest proportion of redevelopment area, as an example, urban renewal has not only effectively improved the urban ecological environment and enhanced living conditions through systematic renovation projects such as green space construction and river remediation, but has also made substantial progress in promoting industrial transformation, strengthening the protection of historical and cultural heritage, providing affordable housing, and improving key urban functional platforms and major infrastructure construction.

5. Discussion and Conclusions

5.1. Discussions

5.1.1. Comparison with Previous Studies

Urbanization-induced changes have attracted widespread attention [47]. Numerous studies have focused on various aspects of urban development issues including the long-term changes in urbanization [48], biodiversity change patterns [49], and the evolution of megaregions [50]. In comparison with the findings of other researchers, it is evident that China’s rapid urbanization shares similarities with the urbanization trends seen in many developing countries, particularly concerning the challenges of balancing economic growth with ecological sustainability.
In 1978, China’s urbanization rate stood at 17.92%, surpassing 50% (51.7%) by 2011 and reaching 63.89% by 2020. Although this still lags behind the urbanization rates of over 80% observed in developed countries, the nation has managed to develop an urban population exceeding 900 million within just forty years. This is consistent with the findings from other researchers who have highlighted the accelerated urbanization process in emerging economies, which often results in significant human–environment conflicts [10,51]. In particular, there are prominent conflicts over the use of land resources, which have given rise to ecological and environmental problems. Different development scenarios have different impacts on land-use conflicts [52]. Land-centered urbanization has created economic and social benefits but also poses challenges such as a loss of arable land, “ghost cities”, and the urban heat island effect [53].

5.1.2. Urban Renewal as a Strategic Response

As China transitions into the “Second Half” of its urbanization process, the growth rate has become more stable and gradual. The “accelerated urbanization” model from the “First Half” successfully addressed the accumulation crisis stemming from surplus production in heavy industry following the reform and bridged the gap in industrialization and urbanization necessary for integration into the global market. However, this rapid increase in urbanization has also led to a series of human–land conflicts. Similar challenges are observed in other rapidly urbanizing countries, such as Brazil, Russia, India and South Africa, inducing problems, such as air pollution, traffic congestion, habitat destruction, and loss of arable land, threatening sustainable urbanization [54].
Urbanization challenges are fundamentally the driving forces behind the national push for urban renewal in China [55]. As illustrated in Figure 17, urban renewal, now recognized as a national strategy, encompasses four key policy implications, which are strategically aligned with sustainable urban development goals:
Addressing insufficient production space: This involves tackling economic imbalances in urbanization and national controls over new urban construction [56,57].
Compensating for Discrepancies in Living Space: This aspect focuses on the encroachment of production space onto living space, leading to deficiencies in urban functionality, mismatches in basic spatial structures, and shortcomings in meeting the essential living and development needs of urban residents. It also addresses failures in protecting and preserving urban cultural heritage and context [58,59,60].
Filling ecological space shortfalls: This response targets the inadequacies in essential infrastructure, particularly engineering services such as energy supply, water drainage, environmental sanitation, and disaster prevention facilities. These shortcomings contribute to pollution and the degradation of urban living and ecological environments [61,62].
Narrowing the urban–rural spatial gap: This involves addressing the institutional barriers created by the dual structure of “urban–rural and urban villages”, facilitating the free flow and equitable exchange of urban and rural resources, and promoting integrated development within metropolitan areas [63,64].
Releasing remaining reform space: This objective aims to deepen reforms in land and household registration systems, innovate urban governance models, improve housing system reforms, optimize industrial policies, create innovative investment and financing mechanisms, and advance the digital transformation of cities [64].

5.1.3. Empirical Evidence and Policy Implications

Our quantitative analysis and field investigations of the PRD revealed that the transition toward urban renewal, focusing on stock redevelopment, demonstrates significant potential for land-use optimization. This shift toward intensive development proves crucial in balancing urbanization demands with environmental constraints. Based on these empirical findings, several key policy recommendations have emerged:
  • Prioritizing urban renewal over expansion in core cities, as evidenced by our analysis of land-use efficiency and ecological pressure patterns;
  • Implementing differentiated development strategies for core and peripheral cities, reflecting the distinct challenges and opportunities identified in our spatial analysis;
  • Strengthening ecological protection mechanisms in rapidly developing areas, particularly in response to the observed ecological resource pressures in core cities;
  • Promoting intensive land use through policy incentives, supported by our FLUS model simulation results, showing the benefits of compact development;
  • Enhancing coordination mechanisms between urbanization and ecological protection, addressing the moderate coordination levels revealed in our coupling analysis.

5.1.4. Research Contributions, Limitations, and Future Directions

The unique contribution of this study lies in providing valuable insights into sustainable urban development for rapidly urbanizing regions, particularly in developing countries and areas experiencing regional developmental imbalances. Specifically, it offers a comprehensive diagnostic framework that helps identify critical urban–ecological imbalances and guides targeted interventions. This framework can support sustainable urban planning and policy-making, enabling balanced growth by promoting efficient land use, reducing ecological stress, and addressing disparities between core and peripheral cities as well as providing practical strategies for enhancing urban resilience and ecological sustainability.
However, several limitations should be noted. Our analysis period ended in 2018 due to data quality concerns, the FLUS model operated under certain assumptions that may not fully capture urban development complexity, and findings from the PRD region may have limited generalizability to areas with different developmental contexts. Future research could extend the temporal scope as post-pandemic data becomes available, conduct comparative studies across different urban agglomerations, and develop more sophisticated modeling approaches incorporating social and cultural factors to better understand the urbanization–ecology dynamics. These efforts would further enhance our understanding of sustainable urban development pathways in rapidly urbanizing regions globally.

5.2. Conclusions

This study advances the understanding of city health assessment by investigating the complex relationship between rapid urbanization and ecological sustainability in China’s urban agglomerations, with a specific focus on the Pearl River Delta (PRD) region. Through a data-driven, multi-scalar analytical framework, we revealed several critical findings regarding the city health conditions:
  • The diagnosis of the PRD urban agglomeration’s overall health status showed improved but still moderate coordination between urbanization and ecological systems. This finding highlights the ongoing challenges in balancing urban development with environmental sustainability.
  • Our health assessment revealed significant spatial disparities in city health conditions across the region. Core cities like Guangzhou and Shenzhen, despite their advanced urbanization level, are exhibiting sub-health conditions manifested through intensified ecological pressures and inefficient land use. In contrast, peripheral cities maintain better ecological conditions but show symptoms of underdevelopment, indicating an imbalanced city system requiring differentiated treatment approaches.
  • Urban renewal has emerged as a promising therapeutic strategy for treating city diseases and improving city health, particularly in core cities where land resources are increasingly constrained. This approach has demonstrated effectiveness in optimizing land-use efficiency, alleviating ecological pressure and promoting the recovery of city vitality through systematic renovation projects.
These findings contribute to both the theoretical framework of city health assessment and the practical management of urban–ecological relationships in rapidly urbanizing regions. The study provides a comprehensive diagnostic methodology and treatment recommendations for enhancing city health globally, particularly in regions experiencing similar development challenges.

Author Contributions

Conceptualization, X.P.; methodology, X.P., K.Z.; software, K.Z.; validation, X.P., K.Z.; formal analysis, X.P.; investigation, X.P.; resources, X.P.; data curation, X.P.; writing—original draft preparation, X.P., L.L., R.Y.; writing—review and editing, X.P., L.L., R.Y.; visualization, X.P., R.Y.; supervision, X.T.; project administration, X.P., L.L., R.Y.; funding acquisition, X.P., L.L. All authors have read and agreed to the published version of the manuscript.

Funding

This research was funded by the Philosophy and Social Science Planning Youth Project of Guangdong Province (Grant No. GD24YGL06): “Research on the Whole Process of China’s Urban Renewal Policy Innovation”.

Data Availability Statement

The original contributions presented in the study are included in the article, further inquiries can be directed to the corresponding author.

Conflicts of Interest
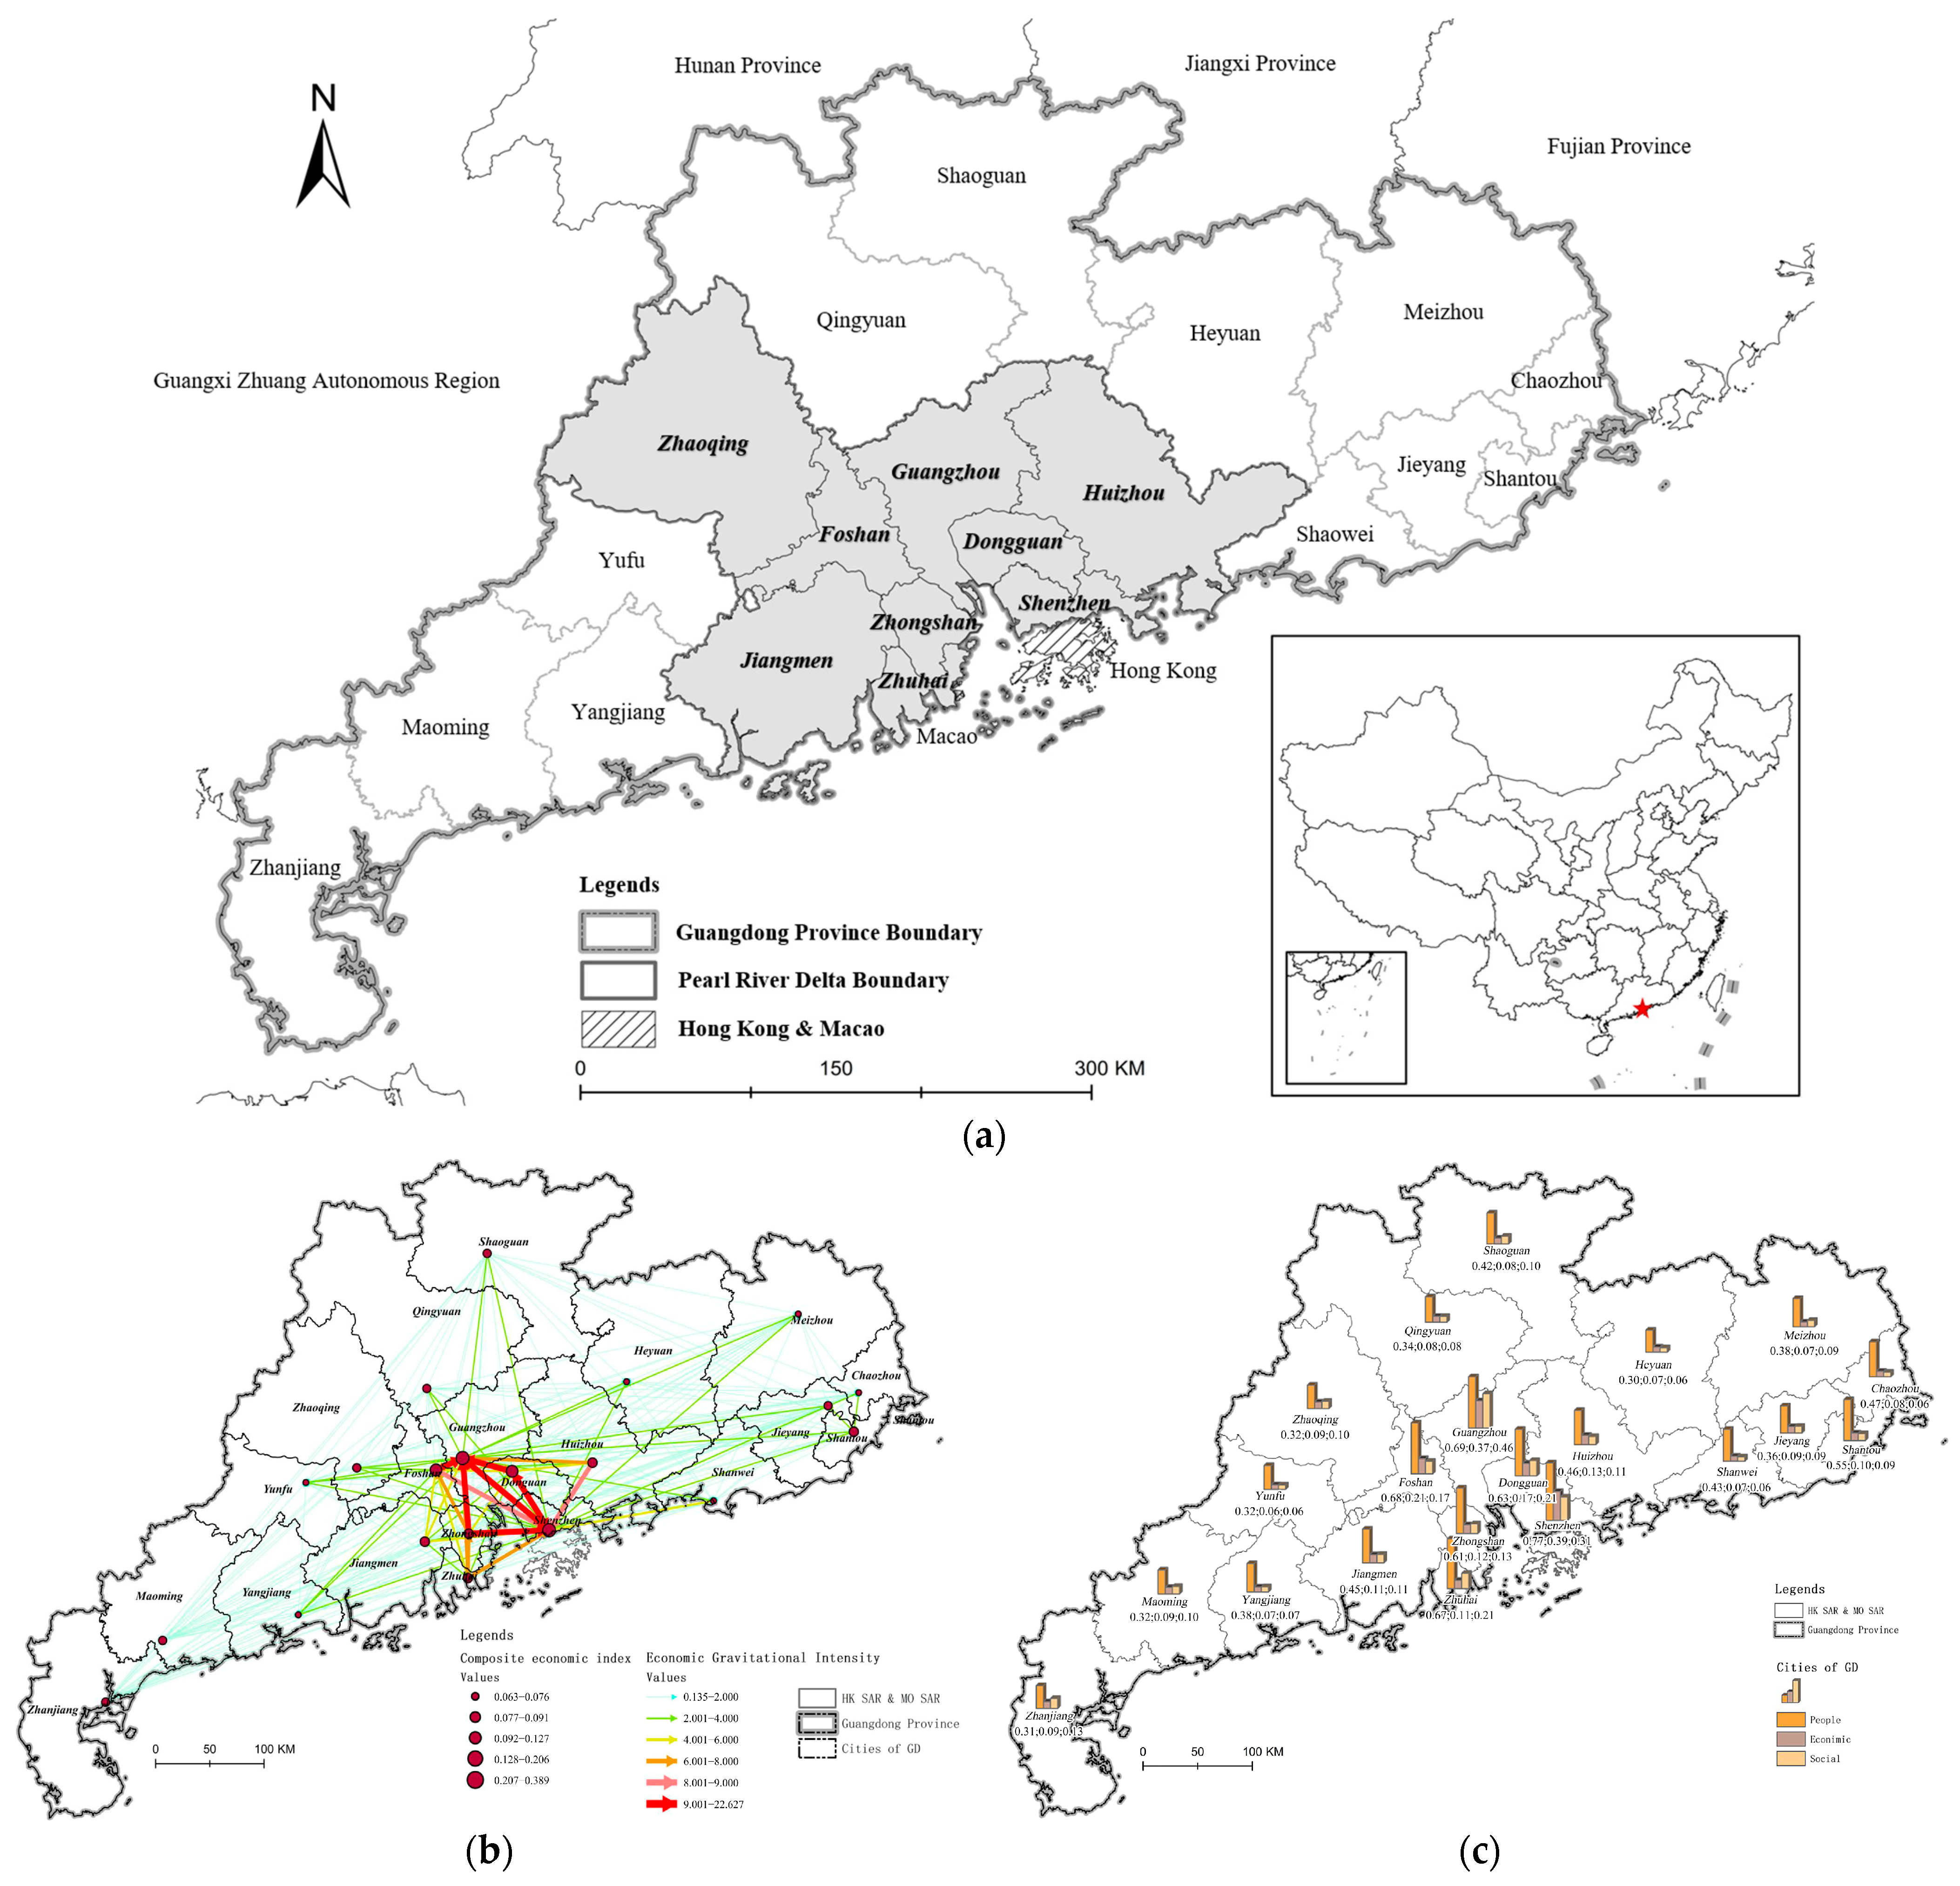
Author Kao Zhang was employed by the company Zhejiang Hanyu Design Co. Ltd. The remaining authors declare that the research was conducted in the absence of any commercial or financial relationships that could be construed as a potential conflict of interest.

Notes

1
The evidence used here to explain the rationale for selecting cities in the Pearl River Delta as the research object—Guangdong’s geoeconomic development—employed the same methodological framework and data as our main empirical analysis in Section 3 and Section 4. An improved gravitational model is shown in the formula: R i j = k i j P i E i P j E j D i j 2 , where k i j = E i E i + E j . In these equations, P i and P j represent the population urbanization development indices of cities i and j, E i and E j represent the economic urbanization development indices of cities i and j, D i j represents the time cost between cities i and j measured by the shortest driving distance in the transportation network, k i j is the relative economic coefficient between cities i and j. By presenting these results early in the paper, we provide empirically-grounded evidence for our study area selection while maintaining methodological consistency throughout the research.
2
Due to concerns regarding the accuracy of data during the COVID-19 pandemic, 2018 was specifically selected as the endpoint of the study period.
3
Resource and Environment Science and Data Center, Chinese Academy of Sciences: https://www.resdc.cn/Default.aspx (accessed on 10 October 2022). Amap Open Platform: https://lbs.amap.com/ (accessed on 10 October 2022).
4
“4 Trillion Investment Plan”: https://www.gov.cn/ztzl/kdnx/content_1180079.htm (accessed on 9 June 2023).
5
k = p 0 p e 1 p e , where in this formula, k denotes the Kappa consistency coefficient; p 0 refers to the overall accuracy when comparing the predicted results with the actual outcomes; and p e represents the probability of agreement occurring by chance, also referred to as random consistency.
6
1999, “Implementation Plan for the Reconstruction of Dangerous Houses in Guangzhou”was introduced; 2002, “Several Opinions on the Reform of Urban Villages” was issued. 2008, “Opinions on Promoting the ‘Retreat from Secondary Industries and Advancing to Tertiary Industries’ in the Urban Area” was published.
7
8

References

  1. Brenner, N. Globalisation as reterritorialisation: The re-scaling of urban governance in the European union. Urban Stud. 1999, 36, 431–451. [Google Scholar] [CrossRef]
  2. Scott, A.J. Globalization and the rise of city-regions. Eur. Plan. Stud. 2001, 9, 813–826. [Google Scholar] [CrossRef]
  3. Fontan, J.M.; Hamel, P.; Morin, R.; Shragge, E. Community Organizations and Local Governance in a Metropolitan Region. Urban Aff. Rev. 2009, 44, 832–857. [Google Scholar] [CrossRef]
  4. MacLeod, G. New regionalism reconsidered: Globalization and the remaking of political economic space. Int. J. Urban Reg. Res. 2001, 25, 804–829. [Google Scholar] [CrossRef]
  5. Wu, F. China’s Emergent City-Region Governance: A New Form of State Spatial Selectivity through State-orchestrated Rescaling. Int. J. Urban Reg. Res. 2016, 40, 1134–1151. [Google Scholar] [CrossRef]
  6. Chen, J.; Li, X.; Geng, Y.; Liu, X.; Li, G. Mechanism analysis and empirical research on urbanization and carbon emissions in China: Based on the perspective of economic development, population transfer, and urban expansion. J. Nat. Resour. 2024, 39, 1399–1417. [Google Scholar] [CrossRef]
  7. Fang, W.; An, H.Z.; Li, H.J.; Gao, X.Y.; Sun, X.Q.; Zhong, W.Q. Accessing on the sustainability of urban ecological-economic systems by means of a coupled emergy and system dynamics model: A case study of Beijing. Energy Policy 2017, 100, 326–337. [Google Scholar] [CrossRef]
  8. Hu, J.J.; Huang, Y.; Du, J. The Impact of Urban Development Intensity on Ecological Carrying Capacity: A Case Study of Ecologically Fragile Areas. Int. J. Environ. Res. Public Health 2021, 18, 7094. [Google Scholar] [CrossRef]
  9. Zhou, G.; Qin, S. China’s Environmental Governance: Institutional Innovation Leading Practical Innovation—An Investigation Centeredon Environmental Protection Target Responsibility System. Adm. Trib. 2024, 31, 47–57. [Google Scholar]
  10. Sun, J.; Wang, J.; Wang, T.; Zhang, T. Urbanization, economic growth, and environmental pollution: Partial differential analysis based on the spatial Durbin model. Manag. Environ. Qual. Int. J. 2018, 30, 483–494. [Google Scholar] [CrossRef]
  11. Song, R.; Hu, Y.C.; Li, M.Q. Chinese Pattern of Urban Development Quality Assessment: A Perspective Based on National Territory Spatial Planning Initiatives. Land 2021, 10, 773. [Google Scholar] [CrossRef]
  12. Tao, Y.; Li, F.; Crittenden, J.; Lu, Z.; Ou, W.; Song, Y. Measuring urban environmental sustainability performance in China: A multi-scale comparison among different cities, urban clusters, and geographic regions. Cities 2019, 94, 200–210. [Google Scholar] [CrossRef]
  13. Wei, Y.G.; Huang, C.; Lam, P.T.I.; Sha, Y.; Feng, Y. Using Urban-Carrying Capacity as a Benchmark for Sustainable Urban Development: An Empirical Study of Beijing. Sustainability 2015, 7, 3244–3268. [Google Scholar] [CrossRef]
  14. Jiao, L.D.; Shen, L.Y.; Shuai, C.Y.; He, B. A Novel Approach for Assessing the Performance of Sustainable Urbanization Based on Structural Equation Modeling: A China Case Study. Sustainability 2016, 8, 910. [Google Scholar] [CrossRef]
  15. Cui, X.G.; Fang, C.L.; Liu, H.M.; Liu, X.F. Assessing sustainability of urbanization by a coordinated development index for an Urbanization-Resources-Environment complex system: A case study of Jing-Jin-Ji region, China. Ecol. Indic. 2019, 96, 383–391. [Google Scholar] [CrossRef]
  16. Jiang, X.; Xi, X.; Han, Z.; Chen, Z. Construction of Physical Examination Evaluation Method System in Urban Old Community from the Perspective of Fine Governance. Urban Dev. Res. 2024, 31, 7–15. [Google Scholar]
  17. Ding, S.; Wang, J.; Zhang, C.; Yi, C.; Wang, H. Construction of Urban Physical Examination Indicator System and Indicator Selectio: A Case Study of Guangzhou. Urban Dev. Stud. 2024, 31, 1–8. [Google Scholar]
  18. Li, B.J.; Chen, D.X.; Wu, S.H.; Zhou, S.L.; Wang, T.; Chen, H. Spatio-temporal assessment of urbanization impacts on ecosystem services: Case study of Nanjing City, China. Ecol. Indic. 2016, 71, 416–427. [Google Scholar] [CrossRef]
  19. Zhou, D.Y.; Tian, Y.Y.; Jiang, G.H. Spatio-temporal investigation of the interactive relationship between urbanization and ecosystem services: Case study of the Jingjinji urban agglomeration, China. Ecol. Indic. 2018, 95, 152–164. [Google Scholar] [CrossRef]
  20. Tan, R.H.; Liu, Y.L.; Liu, Y.F.; He, Q.S.; Ming, L.C.; Tang, S.H. Urban growth and its determinants across the Wuhan urban agglomeration, central China. Habitat Int. 2014, 44, 268–281. [Google Scholar] [CrossRef]
  21. Xin, R.H.; Skov-Petersen, H.; Zeng, J.; Zhou, J.H.; Li, K.; Hu, J.Q.; Liu, X.; Kong, J.W.; Wang, Q.W. Identifying key areas of imbalanced supply and demand of ecosystem services at the urban agglomeration scale: A case study of the Fujian Delta in China. Sci. Total Environ. 2021, 791, 148173. [Google Scholar] [CrossRef] [PubMed]
  22. Zhang, W.Z.; Cao, J.; He, J.; Chen, L. City Health Examination in China: A Methodology and Empirical Study. Chin. Geogr. Sci. 2021, 31, 951–965. [Google Scholar] [CrossRef]
  23. Qian, X.; Chen, M.; Zhao, F.; Ling, H. An assessment framework of global smart cities for sustainable development in a post-pandemic era. Cities 2024, 150, 104990. [Google Scholar] [CrossRef]
  24. Oppio, A.; Bottero, M.; Arcidiacono, A. Assessing urban quality: A proposal for a MCDA evaluation framework. Ann. Oper. Res. 2022, 312, 1427–1444. [Google Scholar] [CrossRef]
  25. Murakami, S.; Kawakubo, S.; Asami, Y.; Ikaga, T.; Yamaguchi, N.; Kaburagi, S. Development of a comprehensive city assessment tool: CASBEE-City. Build. Res. Inf. 2011, 39, 195–210. [Google Scholar] [CrossRef]
  26. Li, Q.; Liu, L.; Guo, Z.; Vijayakumar, P.; Taghizadeh-Hesary, F.; Yu, K. Smart assessment and forecasting framework for healthy development index in urban cities. Cities 2022, 131, 103971. [Google Scholar] [CrossRef]
  27. Altamirano-Avila, A.; Martínez, M. Urban sustainability assessment of five Latin American cities by using SDEWES index. J. Clean. Prod. 2021, 287, 125495. [Google Scholar] [CrossRef]
  28. Sun, J.; Zhai, N.; Mu, H.; Miao, J.; Li, W.; Li, M. Assessment of urban resilience and subsystem coupling coordination in the Beijing-Tianjin-Hebei urban agglomeration. Sustain. Cities Soc. 2024, 100, 105058. [Google Scholar] [CrossRef]
  29. Dong, L.; Longwu, L.; Zhenbo, W.; Liangkan, C.; Faming, Z. Exploration of coupling effects in the Economy–Society–Environment system in urban areas: Case study of the Yangtze River Delta Urban Agglomeration. Ecol. Indic. 2021, 128, 107858. [Google Scholar] [CrossRef]
  30. Zhang, X.; Fan, H.; Liu, F.; Lv, T.; Sun, L.; Li, Z.; Shang, W.; Xu, G. Coupling coordination between the ecological environment and urbanization in the middle reaches of the Yangtze River urban agglomeration. Urban Clim. 2023, 52, 101698. [Google Scholar] [CrossRef]
  31. Liu, Y.Q.; Xu, J.P.; Luo, H.W. An Integrated Approach to Modelling the Economy-Society-Ecology System in Urbanization Process. Sustainability 2014, 6, 1946–1972. [Google Scholar] [CrossRef]
  32. Zeng, P.; Wei, X.; Duan, Z. Coupling and coordination analysis in urban agglomerations of China: Urbanization and ecological security perspectives. J. Clean. Prod. 2022, 365, 132730. [Google Scholar] [CrossRef]
  33. Hu, Y.C.; Liu, Y.; Yan, Z.Y. Research Regarding the Coupling and Coordination Relationship between New Urbanization and Ecosystem Services in Nanchang. Sustainability 2022, 14, 15041. [Google Scholar] [CrossRef]
  34. Liu, N.; Liu, C.; Xia, Y.; Da, B. Examining the coordination between urbanization and eco-environment using coupling and spatial analyses: A case study in China. Ecol. Indic. 2018, 93, 1163–1175. [Google Scholar] [CrossRef]
  35. Tian, Y.y.; Zhou, D.y.; Jiang, G.h. Conflict or Coordination? Multiscale assessment of the spatio-temporal coupling relationship between urbanization and ecosystem services: The case of the Jingjinji Region, China. Ecol. Indic. 2020, 117, 106543. [Google Scholar] [CrossRef]
  36. Wang, J.; Wang, S.; Li, S.; Feng, K. Coupling analysis of urbanization and energy-environment efficiency: Evidence from Guangdong province. Appl. Energy 2019, 254, 113650. [Google Scholar] [CrossRef]
  37. Liu, J.; Tian, Y.; Huang, K.; Yi, T. Spatial-temporal differentiation of the coupling coordinated development of regional energy-economy-ecology system: A case study of the Yangtze River Economic Belt. Ecol. Indic. 2021, 124, 107394. [Google Scholar] [CrossRef]
  38. Han, X.; Fu, L.; Lv, C.; Peng, J. Measurement and spatio-temporal heterogeneity analysis of the coupling coordinated development among the digital economy, technological innovation and ecological environment. Ecol. Indic. 2023, 151, 110325. [Google Scholar] [CrossRef]
  39. Liang, X.; Liu, X.; Li, D.; Zhao, H.; Chen, G. Urban growth simulation by incorporating planning policies into a CA-based future land-use simulation model. Int. J. Geogr. Inf. Sci. 2018, 32, 2294–2316. [Google Scholar] [CrossRef]
  40. Liu, X.P.; Liang, X.; Li, X.; Xu, X.C.; Ou, J.P.; Chen, Y.M.; Li, S.Y.; Wang, S.J.; Pei, F.S. A future land use simulation model (FLUS) for simulating multiple land use scenarios by coupling human and natural effects. Landsc. Urban Plan. 2017, 168, 94–116. [Google Scholar] [CrossRef]
  41. Li, X.; Chen, G.Z.; Liu, X.P.; Liang, X.; Wang, S.J.; Chen, Y.M.; Pei, F.S.; Xu, X.C. A New Global Land-Use and Land-Cover Change Product at a 1-km Resolution for 2010 to 2100 Based on Human-Environment Interactions. Ann. Assoc. Am. Geogr. 2017, 107, 1040–1059. [Google Scholar] [CrossRef]
  42. Wu, X.X.; Liu, X.P.; Liang, X.; Chen, G.L. “FLUS-UGB duoqingjing moni de zhujiang sanjiaozhou chengshi zengzhang bianjie huading” FLUS-UGB 多情景模拟的珠江三角洲城市增长边界划定 [Multi-scenarios Simulation of Urban Growth Boundaries in Pearl River Delta Based on FLUS-UGB]. J. Geo-Inf. Sci. 地球信息科学学报 2018, 20, 532–542. [Google Scholar]
  43. Zhao, L.F.; Liu, X.P.; Liu, P.H.; Chen, G.Z.; He, J. “Jiyu dili fenqu yu FLUS moxing de chengshi kuozhang moni yu yujing” 基于地理分区与 FLUS 模型的城市扩张模拟与预警 [Urban expansion simulation and early warning based on geospatial partition and FLUS model]. J. Geo-Inf. Sci. 地球信息科学学报 2020, 22, 517–530. [Google Scholar]
  44. Wang, Z.Y.; Zhang, K.; Ding, Z.P.; Wu, S.Y.; Huang, C.H. “Naru dongtai shuju de gaijin FLUS moxing zai chengshi zengzhang bianjie huading zhong de yingyong” 纳入动态数据的改进FLUS模型在城市增长边界划定中的应用 [Delineation of Urban Growth Boundary based on Improved FLUS Model Considering Dynamic Data]. J. Geo-Inf. Sci. 地球信息科学学报 2020, 22, 2326–2337. [Google Scholar]
  45. Meng, C.; Lu, X.h.; Peng, M.j.; Pan, C.l. “Jiyu Markov-C 5.0 de CA chengshi yongdi buju moni yuce fangfa” 基于 Markov-C 5.0 的 CA 城市用地布局模拟预测方法 [A land layout simulation model based on CA and Markov-C 5.0 classification]. China Land Sci. 中国土地科学 2015, 29, 82–88. [Google Scholar]
  46. Zhu, S.H.; Sun, Y.J.; Shu, B.R.; Wang, S.L.; Liang, X. “Guihua zhengce yingxiang xia quyu shengtai yongdi yanbian moni yanjiu —Yi Nanjing shi Lishui qu weili” 规划政策影响下区域生态用地演变模拟研究—以南京市溧水区为例 [Simulation on the evolution of regional ecological land by incorporating planning policies: A case study of Lishui District, Nanjing city]. Geogr. Geo-Inf. Sci. 地理与地理信息科学 2019, 35, 83–90. [Google Scholar]
  47. Huang, S.; Yu, L.; Cai, D.; Zhu, J.; Liu, Z.; Zhang, Z.; Nie, Y.; Fraedrich, K. Driving mechanisms of urbanization: Evidence from geographical, climatic, social-economic and nighttime light data. Ecol. Indic. 2023, 148, 110046. [Google Scholar] [CrossRef]
  48. Yu, M.; Guo, S.; Guan, Y.; Cai, D.; Zhang, C.; Fraedrich, K.; Liao, Z.; Zhang, X.; Tian, Z. Spatiotemporal Heterogeneity Analysis of Yangtze River Delta Urban Agglomeration: Evidence from Nighttime Light Data (2001–2019). Remote Sens. 2021, 13, 1235. [Google Scholar] [CrossRef]
  49. Cai, D.; Fraedrich, K.; Guan, Y.; Guo, S.; Zhang, C.; Carvalho, L.M.V.; Zhu, X. Causality of Biodiversity Loss: Climate, Vegetation, and Urbanization in China and America. Sensors 2019, 19, 4499. [Google Scholar] [CrossRef]
  50. Zhang, X.; Guo, S.; Guan, Y.; Cai, D.; Zhang, C.; Fraedrich, K.; Xiao, H.; Tian, Z. Urbanization and Spillover Effect for Three Megaregions in China: Evidence from DMSP/OLS Nighttime Lights. Remote Sens. 2018, 10, 1888. [Google Scholar] [CrossRef]
  51. Baklanov, A.; Grimmond, C.S.B.; Carlson, D.; Terblanche, D.; Tang, X.; Bouchet, V.; Lee, B.; Langendijk, G.; Kolli, R.K.; Hovsepyan, A. From urban meteorology, climate and environment research to integrated city services. Urban Clim. 2018, 23, 330–341. [Google Scholar] [CrossRef]
  52. Zhang, M.; Liu, X.J.; Yan, D. Land Use Conflicts Assessment in Xiamen, China under Multiple Scenarios. Land 2023, 12, 424. [Google Scholar] [CrossRef]
  53. Chen, M.X.; Liu, W.D.; Lu, D.D. Challenges and the way forward in China’s new-type urbanization. Land Use Policy 2016, 55, 334–339. [Google Scholar] [CrossRef]
  54. Shen, L.Y.; Shuai, C.Y.; Jiao, L.D.; Tan, Y.T.; Song, X.N. Dynamic sustainability performance during urbanization process between BRICS countries. Habitat Int. 2017, 60, 19–33. [Google Scholar] [CrossRef]
  55. Yi, Z.Y.; Liu, G.W.; Lang, W.; Shrestha, A.; Martek, I. Strategic Approaches to Sustainable Urban Renewal in Developing Countries: A Case Study of Shenzhen, China. Sustainability 2017, 9, 1460. [Google Scholar] [CrossRef]
  56. Zheng, H.W.; Shen, G.Q.; Wang, H.; Hong, J.K. Simulating land use change in urban renewal areas: A case study in Hong Kong. Habitat Int. 2015, 46, 23–34. [Google Scholar] [CrossRef]
  57. Rahman, M.M.; Szabo, G. Multi-objective urban land use optimization using spatial data: A systematic review. Sustain. Cities Soc. 2021, 74, 103214. [Google Scholar] [CrossRef]
  58. Chen, Y.; Ren, X.; Xu, X.; Wang, R.; Xu, Y. Evaluation of Living Environment Quality in Urban Residential Areas under the Concept of Urban Renewal—A Case Study of Binjiang District, Hangzhou, China. Sustainability 2023, 15, 14104. [Google Scholar] [CrossRef]
  59. Lak, A.; Gheitasi, M.; Timothy, D. Urban regeneration through heritage tourism: Cultural policies and strategic management. J. Tour. Cult. Change 2019, 18, 386–403. [Google Scholar] [CrossRef]
  60. Yildiz, S.; Kivrak, S.; Gültekin, A.B.; Arslan, G. Built environment design—Social sustainability relation in urban renewal. Sustain. Cities Soc. 2020, 60, 102173. [Google Scholar] [CrossRef]
  61. Lin, S.-H.; Huang, X.; Fu, G.; Chen, J.-T.; Zhao, X.; Li, J.-H.; Tzeng, G.-H. Evaluating the sustainability of urban renewal projects based on a model of hybrid multiple-attribute decision-making. Land Use Policy 2021, 108, 105570. [Google Scholar] [CrossRef]
  62. Yildiz, S.; Kivrak, S.; Arslan, G. Factors affecting environmental sustainability of urban renewal projects. Civ. Eng. Environ. Syst. 2017, 34, 264–277. [Google Scholar] [CrossRef]
  63. Amusan, L.M.; Akanya, C.N.; Adeyemo, K.A.; Ayo, C.K.; Owolabi, J.D.; Mohammed, D.B. Renewal and Upgrading System For A Sustainable Urban-Rural Housing System Development: Panacea To Accommodation, Employment And Healthcare Issues. IOP Conf. Ser. Earth Environ. Sci. 2019, 331, 012027. [Google Scholar] [CrossRef]
  64. Wang, B.; Tian, L.; Yao, Z. Institutional uncertainty, fragmented urbanization and spatial lock-in of the peri-urban area of China: A case of industrial land redevelopment in Panyu. Land Use Policy 2018, 72, 241–249. [Google Scholar] [CrossRef]
Figure 1. Technical route for health assessment within a continuous research path from urban agglomerations to individual cities. Note: For a detailed description of the variables in Steps 1, 2, and 3 in the schematic diagram, see the implementation process explained in Section 3.4, Implementation of Processing. For example, Z λ i j in Step 1 represents the non-dimensionalization process, followed by normalization ( P λ i j ), then the entropy weight method ( E j , D j , W j ), and finally the calculation of the comprehensive evaluation index ( C λ i ). Similarly, C, T, and D in Step 2 represent the calculation of the coupling degree, coordination degree, and coupling coordination degree, respectively, while Step 3 represents the key neighborhood influence ( Ω p , k t ), inertia coefficient ( Inertial k t ), and total land use probability ( T P p , k t ) in running the FLUS model.
Land 14 00046 g001
Figure 2. (a) Geographical location of the nine cities in the PRD. (b) Geo-economic network of Guangdong. (c) The level of urbanization of the population, economy, and society in Guangdong1.
Land 14 00046 g002
Figure 3. Trends of comprehensive levels of urbanization in the urban agglomeration of the PRD.
Land 14 00046 g003
Figure 4. Trends of comprehensive levels of eco-environment in the urban agglomeration of the PRD.
Land 14 00046 g004
Figure 5. Trends of comprehensive levels of coupling coordination between urbanization and eco-environment in the urban agglomeration of the PRD.
Land 14 00046 g005
Figure 6. Spatial evolution of urbanization system level in the urban agglomeration of the PRD.
Land 14 00046 g006
Figure 7. Spatial evolution of the eco-environment system level in the urban agglomeration of the PRD.
Land 14 00046 g007
Figure 8. Spatial evolution of coupling coordination between urbanization and eco-environment in the urban agglomeration of the PRD.
Land 14 00046 g008
Figure 9. Typical example of coupling and coordination from within the system between urbanization and eco-environment in the urban agglomeration of the PRD. (a) Guangzhou; (b) Shenzhen; (c) Dongguan; (d) Foshan; (e) Zhuhai; (f) Zhongshan; (g) Jiangmen; (h) Huizhou; (i) Zhaoqing. Note: In each subplot, the shaded area (referring to the interval from -1 to 1 on the right vertical axis) identifies the range where the difference between the comprehensive development levels of indicators within the urbanization and eco-environmental subsystems is considered coordinated. A value exceeding 1 indicates over-development of the minuend indicator compared to the subtrahend indicator, while a value below -1 indicates the opposite - both situations represent uncoordinated states.
Land 14 00046 g009
Figure 10. Land-use transfer matrix of Guangzhou (2000–2018).
Land 14 00046 g010
Figure 11. Driving factors of urban land-use change in Guangzhou.
Land 14 00046 g011
Figure 12. Construction land-use probability of occurrence in Guangzhou.Note: The left subplot represents the suitability probability for construction land, and the right subplot represents the suitability probability for non-construction land, with darker warm colors indicating higher suitability.
Land 14 00046 g012
Figure 13. Comparison of the current land-use status and the simulation results of multiple policy scenarios in Guangzhou from 2000 to 2025.
Land 14 00046 g013
Figure 14. Comparison of the simulation results of multiple policy scenarios in Guangzhou in 2025.
Land 14 00046 g014
Figure 15. (a) Distribution of urban village renovation projects in Guangzhou. (b) Area of urban village renovation and number of projects in Guangzhou’s 11 districts.
Land 14 00046 g015
Figure 16. A typical case of a fully renovated urban village in Guangzhou. (a) Liede Village before renewal; (b) Liede Village after renewal; (c) Yangji Village before renewal; (d) Yangji Village after renewal; (e) Pazhou Village before renewal; (f) Pazhou Village after renewal.
Land 14 00046 g016aLand 14 00046 g016b
Figure 17. Urban renewal as a paradigm for sustainable development.
Land 14 00046 g017
Table 1. Assessment framework for the coupled coordination between urbanization and the ecological environment.
System LayerDomain LevelCriterion LayerWeightSpecific IndicatorsAttributeWeight
Urbanization and
Eco-Environment
Coupling Coordination
Urbanization
Subsystem
Population Urbanization0.227Population urbanization rate/%+0.239
Proportion of employment in the secondary industry/%+0.228
Proportion of employment in the tertiary industry/%+0.241
Population density (people/km²)+0.292
Economic Urbanization0.248Regional GDP (ten thousand yuan)+0.181
Regional GDP growth rate/%+0.160
Total fixed asset investment (ten thousand yuan)+0.114
Proportion of secondary industry value added in GDP/%+0.110
Proportion of tertiary industry value added in GDP/%+0.119
Local general public budget revenue (ten thousand yuan)+0.117
Total factor productivity+0.198
Land Urbanization0.222Proportion of built-up area in total municipal area/%+0.254
Land transfer area (hectares)-0.273
Real estate development investment (ten thousand yuan)+0.310
Real estate value added (hundred million yuan)+0.162
Social Urbanization0.303Total retail sales of consumer goods (ten thousand yuan)+0.125
Per capita disposable income of urban residents (yuan)+0.079
Registered urban unemployed persons (people)-0.074
Participants in basic pension insurance (ten thousand people)+0.115
Participants in medical insurance (ten thousand people)+0.112
Number of hospital beds per ten thousand people
(beds/ten thousand people)
+0.072
Number of physicians per ten thousand people
(physicians/ten thousand people)
+0.126
Number of high school teachers per ten thousand people
(teachers/ten thousand people)
+0.130
Highway passenger traffic (ten thousand person-times)+0.085
Engel’s coefficient-0.081
Eco-Environment
Subsystem
Eco-
Pressure
0.316Natural population growth rate/%-0.147
Per capita daily water consumption (L)-0.149
Industrial wastewater discharged per ten thousand yuan of GDP (tons/ten thousand yuan)-0.151
Industrial waste gas emissions per ten thousand yuan of GDP (billion cubic m/ten thousand yuan)-0.147
Road length per ten thousand people
(km/ten thousand people)
+0.202
Road area per ten thousand people
(ten thousand square m/ten thousand people)
+0.205
Eco-
Resource
0.364Green coverage rate in built-up areas/%+0.154
Forest coverage rate/%+0.220
Park green space area per ten thousand people
(hectares/ten thousand people)
+0.218
Cultivated land area per ten thousand people
(hectares/ten thousand people)
+0.183
Water resources per ten thousand people
(ten thousand cubic m)
+0.225
Eco-
Protection
0.321Comprehensive utilization rate of industrial solid waste/%+0.326
Harmless treatment rate of domestic garbage/%+0.320
Sewage treatment rate/%+0.355
Table 2. Space-driven data structure and processing.
Data TypeData SubtypeData Usage and Process
Social and Economic Factors
(Raster Data)
GDP density (2015)Used as a socio-economic development driving factor to calculate suitability probability.
Population density (2015)
Location and Aggregation Factors (Vector Data)Points of interest (2015)Used as a location driving factor to calculate suitability probability; Calculated using the ArcGIS “Kernel Density” module.
Topographic Factors
(Vector Data; DEM)
Elevation (2015)Used as a natural driving factor to calculate suitability probability; Calculated using the ArcGIS “Feature”, “Extract by Attributes”, and “Slope” modules.
Slope (2015)
Rivers and Water Bodies
(2015)
Restricts the conversion of other land-use types.
Transportation Accessibility Factors (Vector Data)City’s roads of various
levels (2015)
Used as a transportation driving factor to calculate the suitability probability; calculated using the ArcGIS “Euclidean Distance” module.
Land Use Data (Raster Data)Urban land-use type
(2000, 2010, 2015, 2018)
Extracted land-use type information to provide the FLUS model input and validate the simulation accuracy; calculate the dynamic change rates of land-use types; calculate the comprehensive land use degree index.
Note: The above geographic information data values were extracted for use in the binary logistic regression model to identify the effective types of driving factors that influence the transition of land-use types from non-construction land to construction land.
Table 3. Coupling coordination types and characteristics of urbanization and eco-environment.
Coupling Coordination ValueCategorySubcategory
Comparison
Subsystem
Characteristic
Coordinated
0 < D   0.2 ImbalanceSevere imbalance
(I)
U 1     U 2 >  0.1Urbanization lagging
U 1     U 2  0.1Synchronous development
U 2     U 1 >  0.1Eco-environment lagging
0.2 < D   0.4 Slight imbalance (II) U 1     U 2 >  0.1Urbanization lagging
U 1 U 2  0.1Synchronous development
U 2   U 1 >  0.1Eco-environment Lagging
0.4 < D   0.6 Transitional developmentBasic coordination
(III)
U 1     U 2 >  0.1Urbanization lagging
U 1     U 2  0.1Synchronous development
U 2     U 1 >  0.1Eco-environment Lagging
0.6 < D   0.8 Coordinated developmentModerate coordination
(IV)
U 1     U 2 >  0.1Urbanization lagging
U 1   U 2  0.1Synchronous development
U 2   U 1 >  0.1Eco-environment Lagging
0.8 < D   0.1 High coordination
(V)
U 1   U 2 >  0.1Urbanization lagging
U 1   U 2  0.1Synchronous development
U 2     U 1 >  0.1Eco-environment Lagging
Table 4. Types of coupling and coordination between urbanization and eco-environment in the urban agglomeration of the PRD.
City1999–20032004–20082009–20132014–2018
GuangzhouⅣ·U&E_SynLand 14 00046 i001Ⅴ·U&E_Syn
ShenzhenⅣ·Urb_LagⅣ·U&E_SynLand 14 00046 i002
ZhuhaiⅣ·Urb_LagⅣ·U&E_SynLand 14 00046 i003
DongguanⅣ·Urb_LagⅣ·U&E_SynLand 14 00046 i004
FoshanⅣ·Urb_LagⅣ·U&E_SynLand 14 00046 i005
ZhongshanⅣ·Urb_LagLand 14 00046 i006Ⅳ·U&E_SynLand 14 00046 i007
HuizhouⅣ·Urb_LagLand 14 00046 i008
JiangmenⅣ·Urb_LagLand 14 00046 i009
ZhaoqingⅣ·Urb_LagLand 14 00046 i010
Table 5. Dynamic Change Rate of Land-Use Types and Comprehensive Utilization Index of Guangzhou (2000–2018).
Year20002018Graded IndexDegree of Change %
Land-Use Types Areas/km2Ratios
/%
Comprehensive Utilization IndexAreas/km2Ratios
/%
Comprehensive Utilization Index
Arable2585.2235.921.082079.4428.820.863−1.09
Forest3152.6752.581.053041.2950.751.012−0.20
Grassland107.4396.96−0.54
Water bodies524.17523.00−0.01
Construction822.4611.430.461471.5120.400.8244.38
Unused land4.950.070.002.090.030.001−3.22
Note:1—land unused; 2—land self-reuse; 3—land artificial reuse; 4—land non-reuse.
Table 6. Identification of drivers of land-use change in Guangzhou 2000–2018. based on logistic modeling.
SystemVariablesModel 1Model 2Model 3Model 4
Y_Landuse
Social and Economic LevelX_GDP−1.72%(0.983) ***
(−45.03)
0.53%(1.005) ***
(14.99)
0.50%(1.005) ***
(13.99)
2.15%(1.022) ***
(57.80)
X_Pop14.94%(1.149) ***
(211.87)
0.93%(1.009) ***
(13.89)
−1.59%(0.984) ***
(−23.16)
−4.48%(0.955) ***
(−63.68)
Transportation accessibilitiesX_Central −12.03%(0.879) ***
(−533.61)
−4.93%(0.951) ***
(−170.92)
−5.64%(0.944) ***
(−201.55)
X_EUGS −2.96%(0.970) ***
(−207.26)
−1.93%(0.981) ***
(−134.09)
X_EUTL −10.72%(0.893) ***
(−279.70)
−6.87%(0.931) ***
(−177.60)
Topographic conditionsX_DEM −66.08%(0.339) ***
(−194.93)
X_Slop −11.99%(0.977) ***
(−67.97)
Constant−2.347 ***
(−1614.15)
−0.817 ***
(−303.45)
−0.464 ***
(−154.74)
−0.128 ***
(−38.02)
Observations6,770,0316,770,0316,770,0316,770,031
Pseudo R20.02870.12440.17170.2018
*** p < 0.01, ** p < 0.05, * p < 0.1
Note: The odds ratios and Z-values for the regression of conversions from other land-use types to construction land are reported in parentheses.
Table 7. Neighborhood weight of urban land-use types.
Land Use TypesArableForestGrasslandWater BodiesConstructionUnused Land
Neighborhood weight0.3950.0870.0080.0010.5070.002
Table 8. Land conversion constraint matrix under three policy scenarios.
UnconstrainedGrowth MachineUrban Renewal
Land 14 00046 i011Land 14 00046 i012Land 14 00046 i013
Table 9. FLUS model precision validation.
ArableForestGrasslandWater BodiesConstructionUnused Land
FLUS simulation results 20152102.09763040.09192.385534.04831425.8422.4147
Actual land use results for 20152102.09763040.09192.385534.04831442.42.088
Accuracy100%100%100%100%98.85%86.47%
Unit: km2; Kappa: 0.8389035.
Table 10. Guangzhou City “Three Olds” renovation plot mapping and database construction data.
YearAll TypesUrban VillageOld FactoryOld City or Town
2016589320/54%208/35%61/11%
2024347163/47%130/37%54/16%
Note: Unit: km2. The ratios represent the proportion of the three old areas to the total renovation area. In 2024, there were 1987 industrial clusters in villages and towns, covering a total area of about 98 square km; 510 specialized wholesale markets, covering a total area of about 10 square km; and 110 logistics parks covering more than 5000 square m, covering a total area of about 9.6 square km7,8.
Table 11. Ongoing cases of urban village reconstruction in Guangzhou.
Urban VillageDistrict
and Town/Jiedao
Renewal PlanPolicy
Stage
Start TimeProject ProgressImplementerRenewal
Area/Hectares
DengfengYuexiu and
Dengfeng Jiedao
3-Year Plan22009 40%Pearl River Enterprises67
KengkouLiwan and
Chongkou Jiedao
5-Year Plan42020 40%Pearl River Enterprises
and Agile
57
LiedeTianhe and
Liede Jiedao
First Practical Application22008 100%KWG
R&F
Sun Hung Kai
33.6
ShitouPanyu and
Nancun Town
10-Year Plan42019 30%Agile68
BaijiangZengcheng and
Xintang Town
10-Year Plan32017 60%ZhuKuan189
DatangNansha and
Huangge Town
5-Year Plan32018 50%Times China25
HecangConghua and
Jiangpu Jiedao
3-Year Plan32017 50%Times China39
WuhuaHuadu and
Xinhua Jiedao
10-Year Plan42020 5%///118
WulonggangBaiyun and
Zhongluotan Town
5-Year Plan32018 30%///83
Fenghe
(Kangle; Lujiang)
Haizhu and
Fengyang Jiedao
3-Year Plan22011 50%Hopson106
Wenchong
(West of
Shihua Road)
Huangpu and
Wenchong Jiedao
3-Year Plan22010 85%Vanke39
Note: Date source for when the first author of this study visited the records of the transformation of Guangzhou’s urban villages from 2018 to 2022. Wuhua: No preliminary work has started; Wulonggang: The Baiyun District policy is to start investment promotion only after the plan has been approved and the data have been made public.
Disclaimer/Publisher’s Note: The statements, opinions and data contained in all publications are solely those of the individual author(s) and contributor(s) and not of MDPI and/or the editor(s). MDPI and/or the editor(s) disclaim responsibility for any injury to people or property resulting from any ideas, methods, instructions or products referred to in the content.

