
Monitoring of Land Subsidence and Analysis of Impact Factors in the Tianshan North Slope Urban Agglomeration


Abstract
1. Introduction
2. Materials and Methods
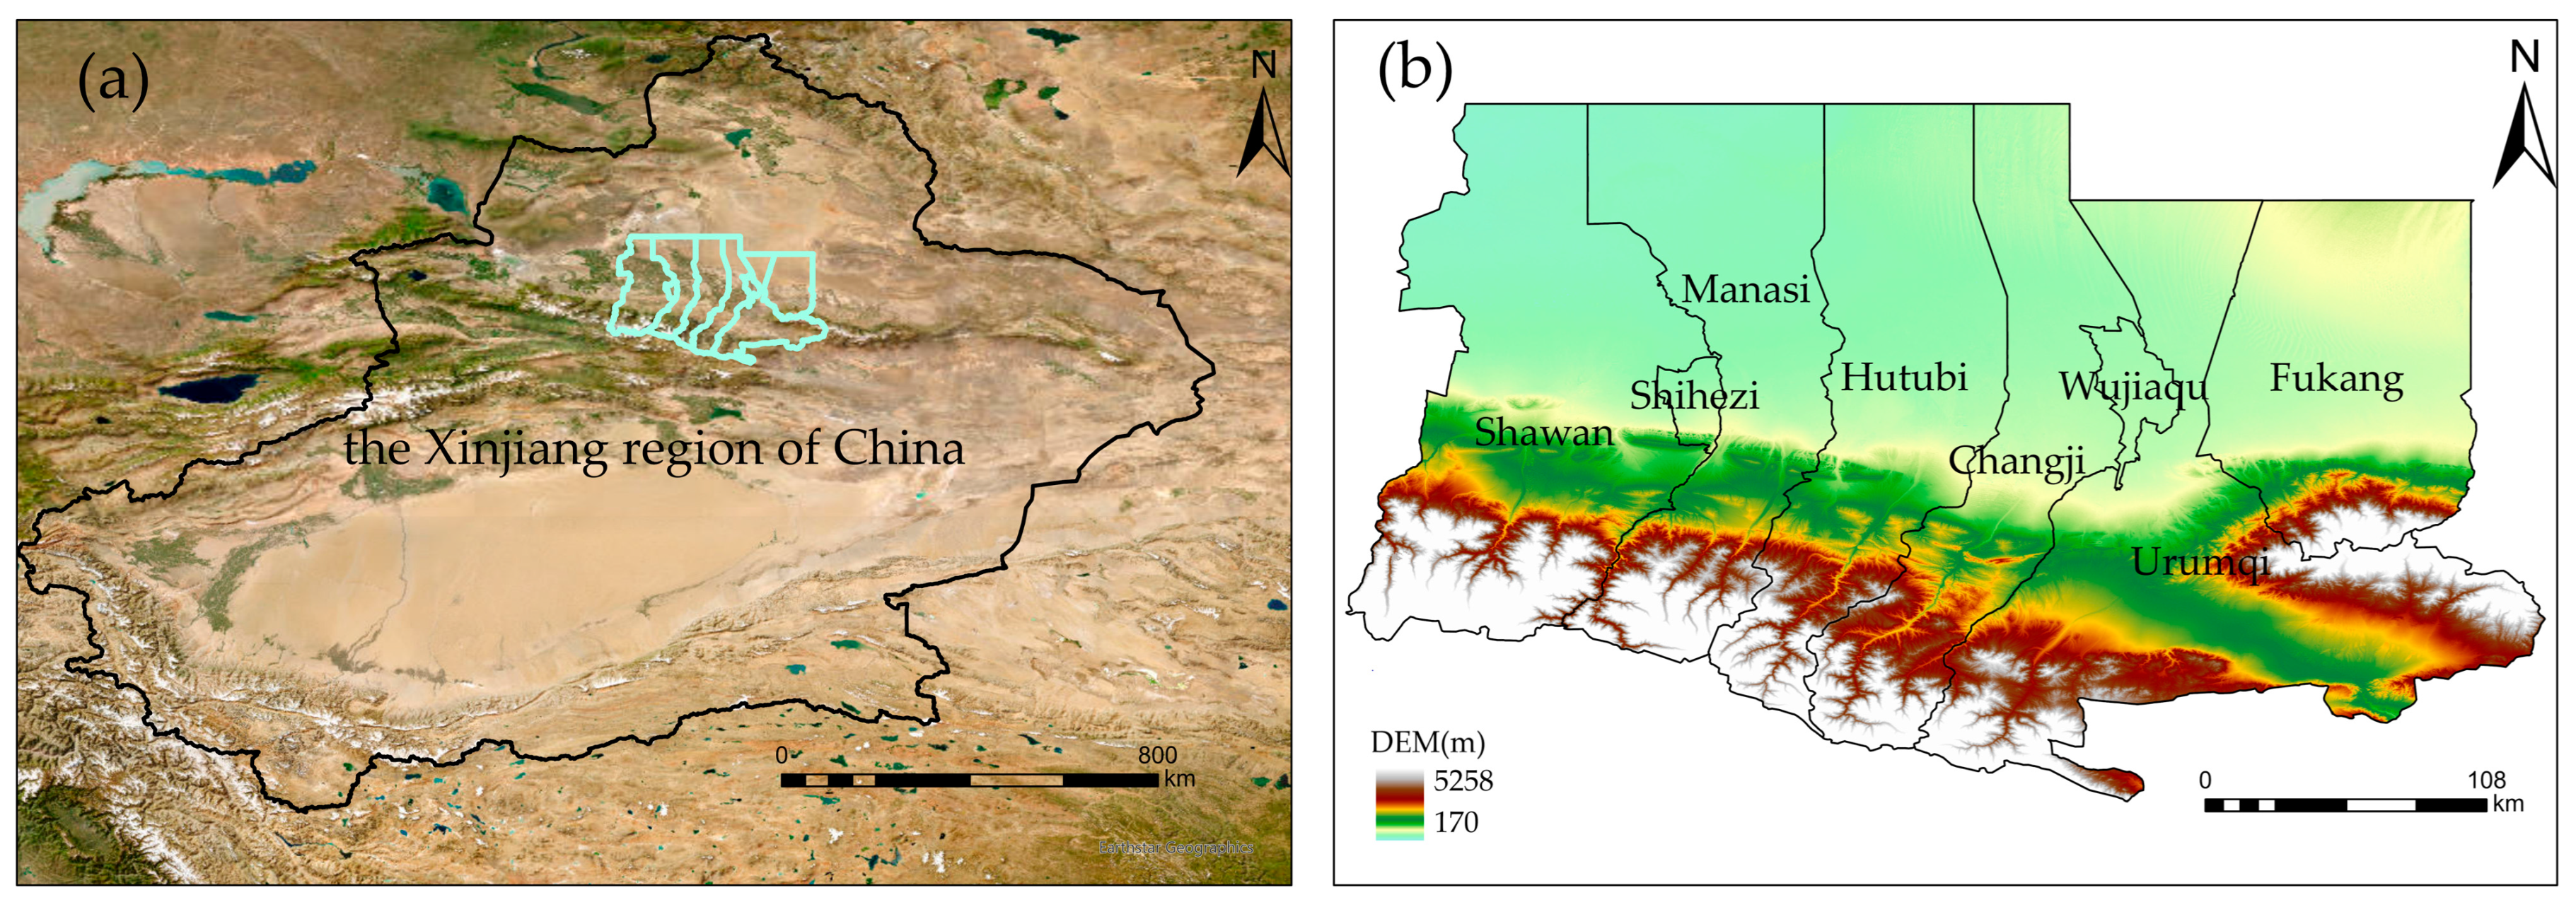
2.1. Study Area
2.2. Data
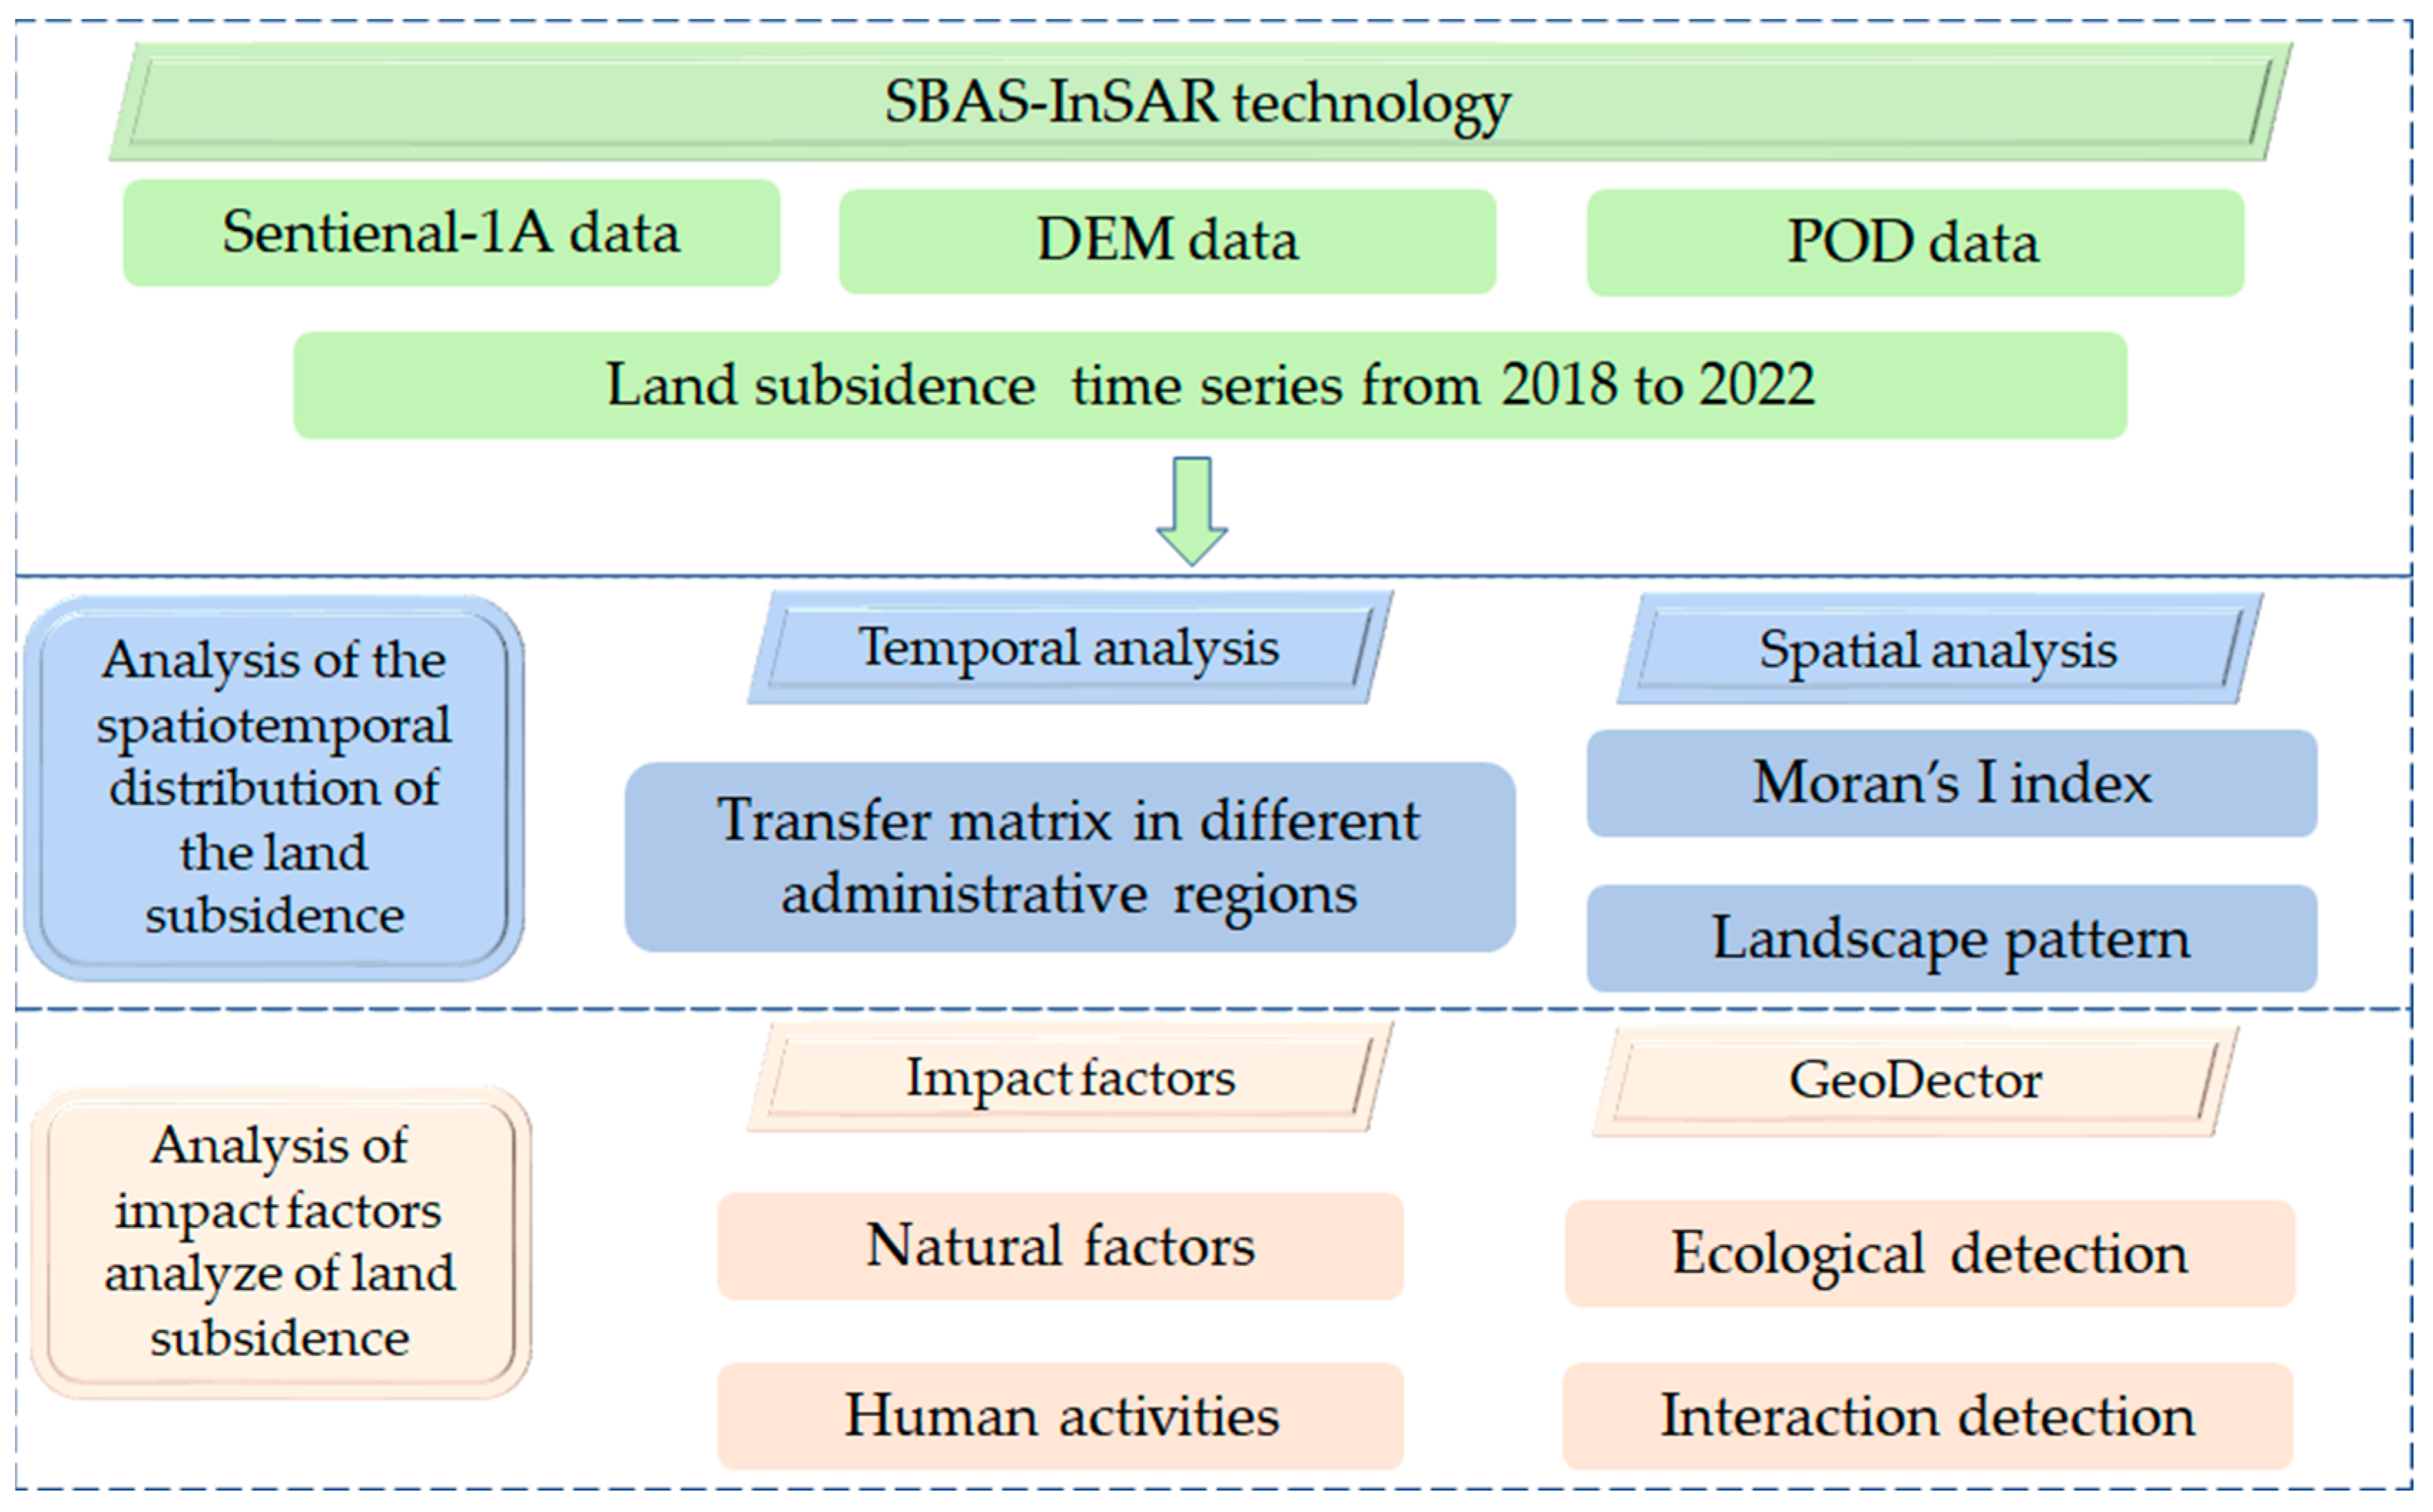
2.3. Method
2.3.1. InSAR Process
2.3.2. Transfer Matrix
2.3.3. Spatial Autocorrelation Analysis
2.3.4. Landscape Pattern Analysis
2.3.5. GeoDector
3. Results
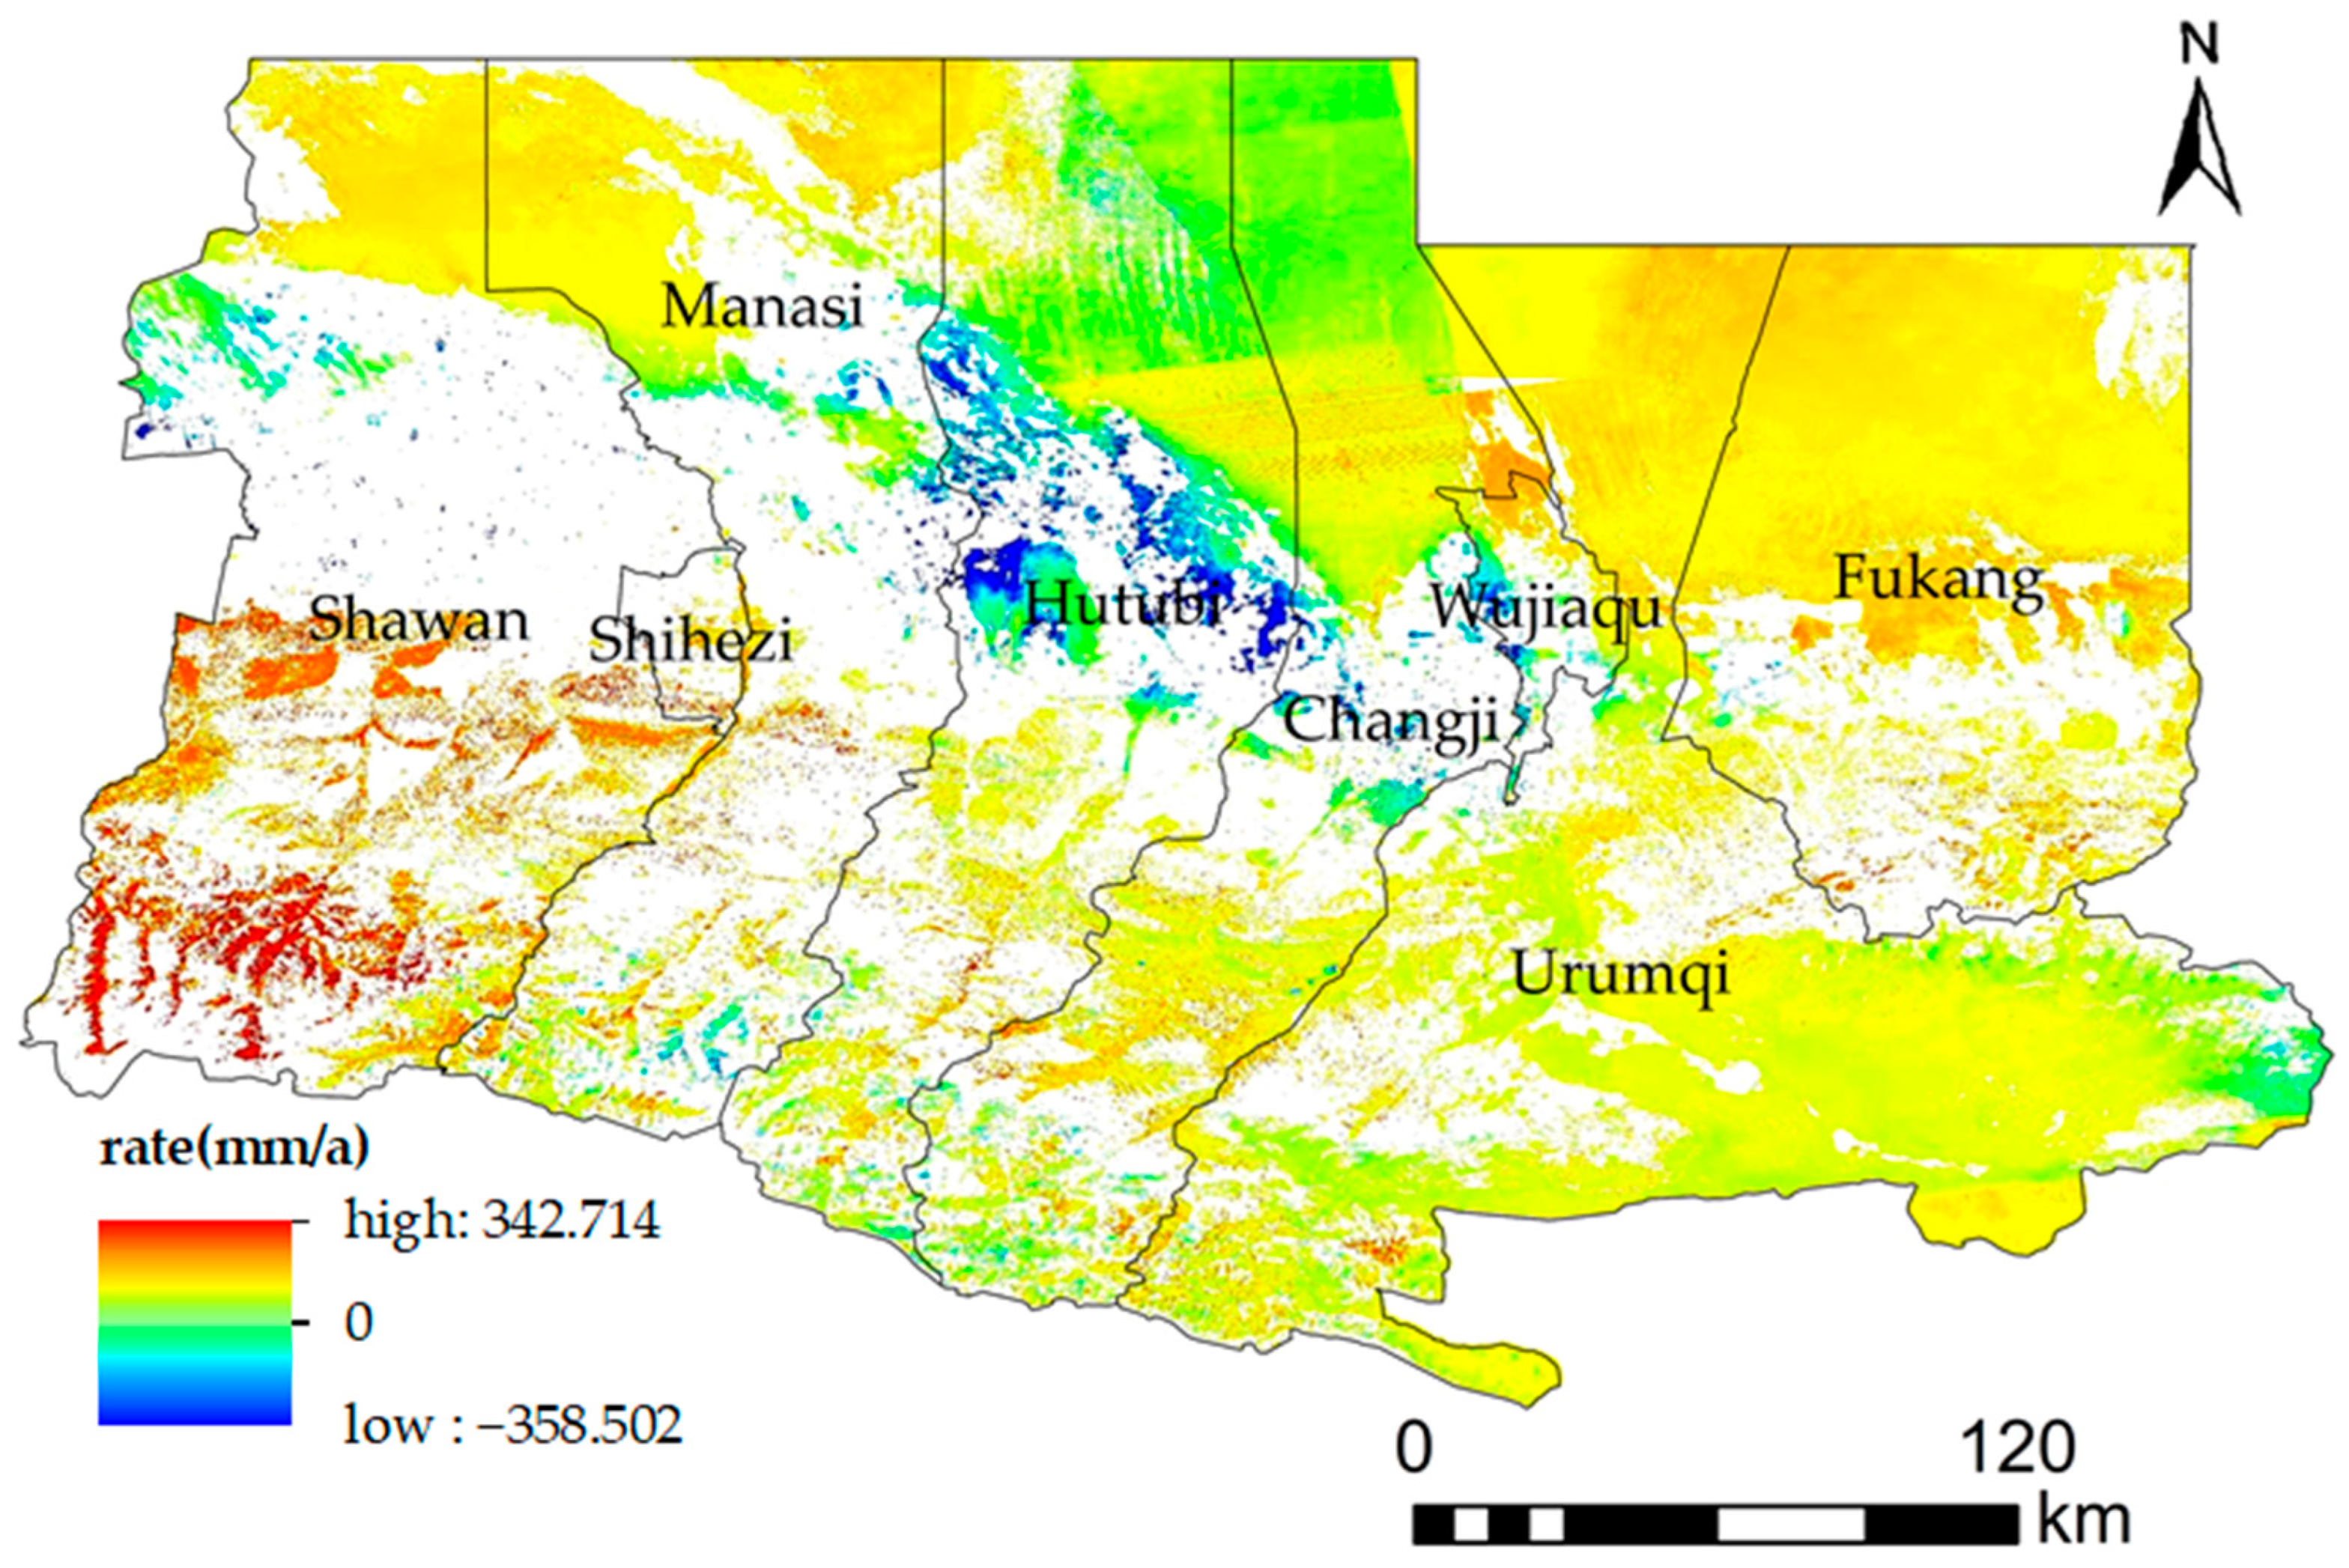
3.1. Inversion Results of Land Subsidence Based on SBAS-InSAR
3.2. Analysis of Spatiotemporal Distribution Characteristics
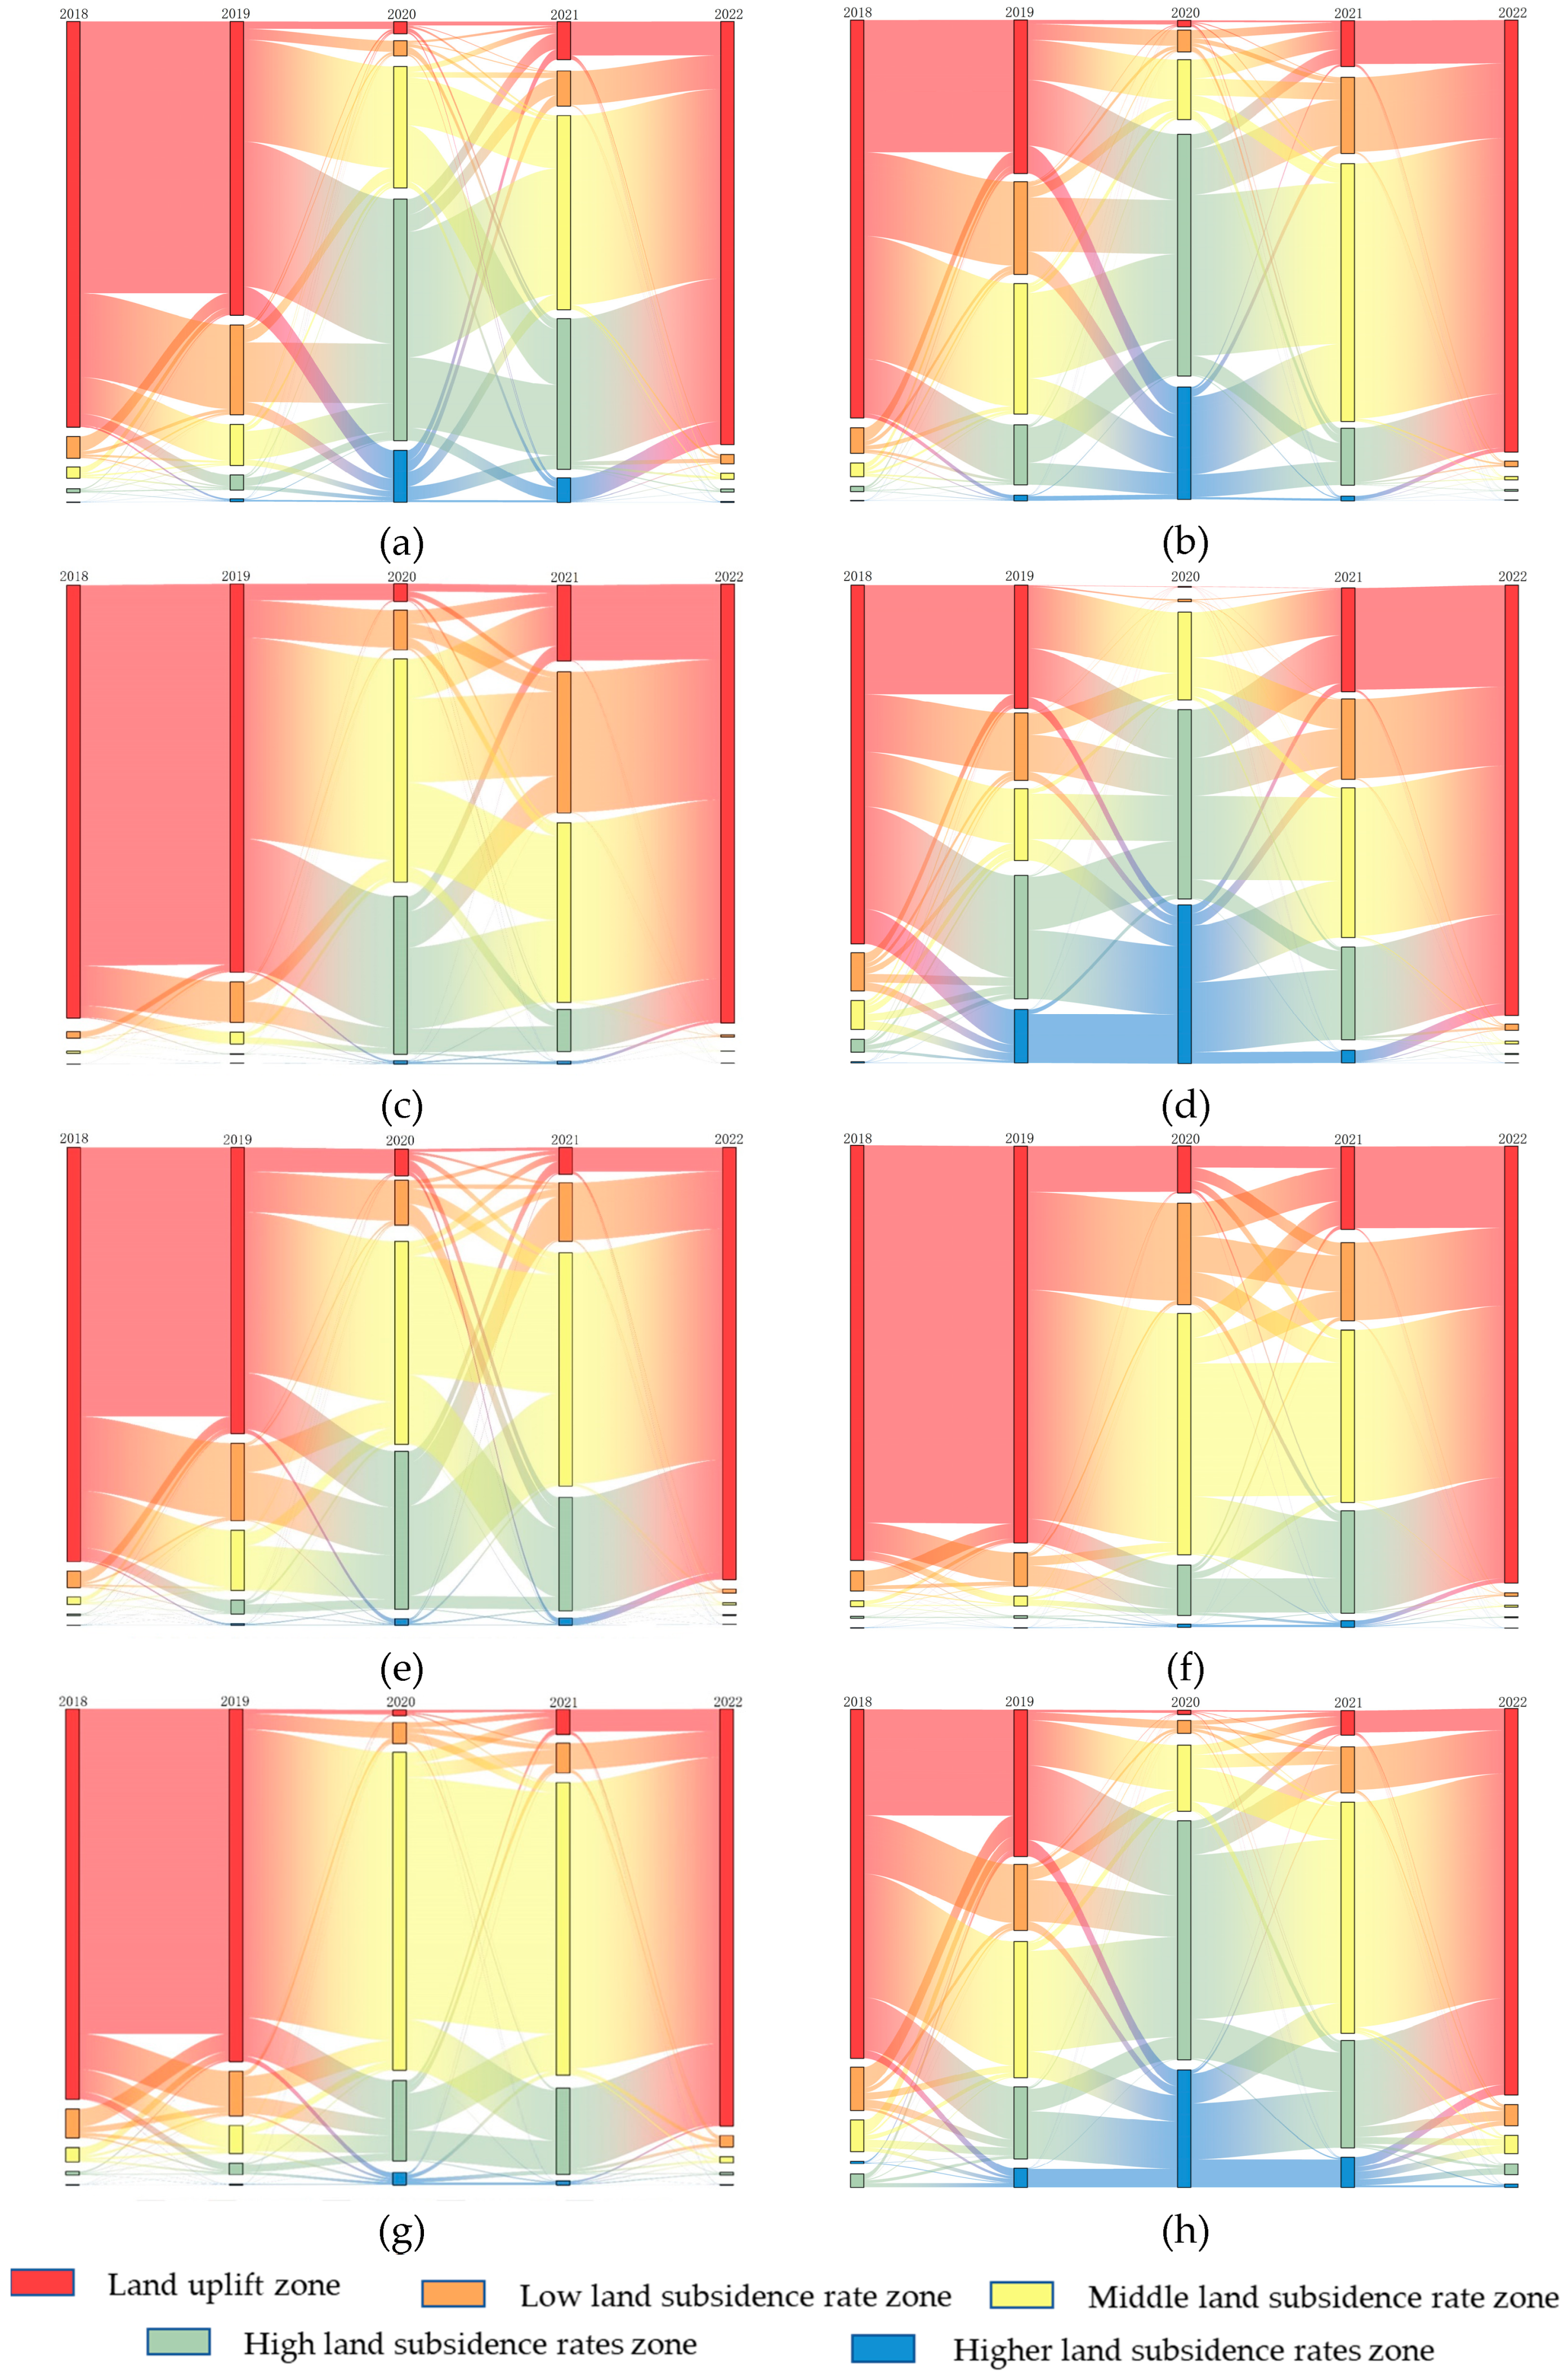
3.2.1. Transfer Matrix of Land Subsidence Rate
3.2.2. Spatial Autocorrelation Analysis of Land Subsidence Rate
3.2.3. Landscape Pattern Analysis of Land Subsidence Rate
3.3. Analysis of Impact Factors
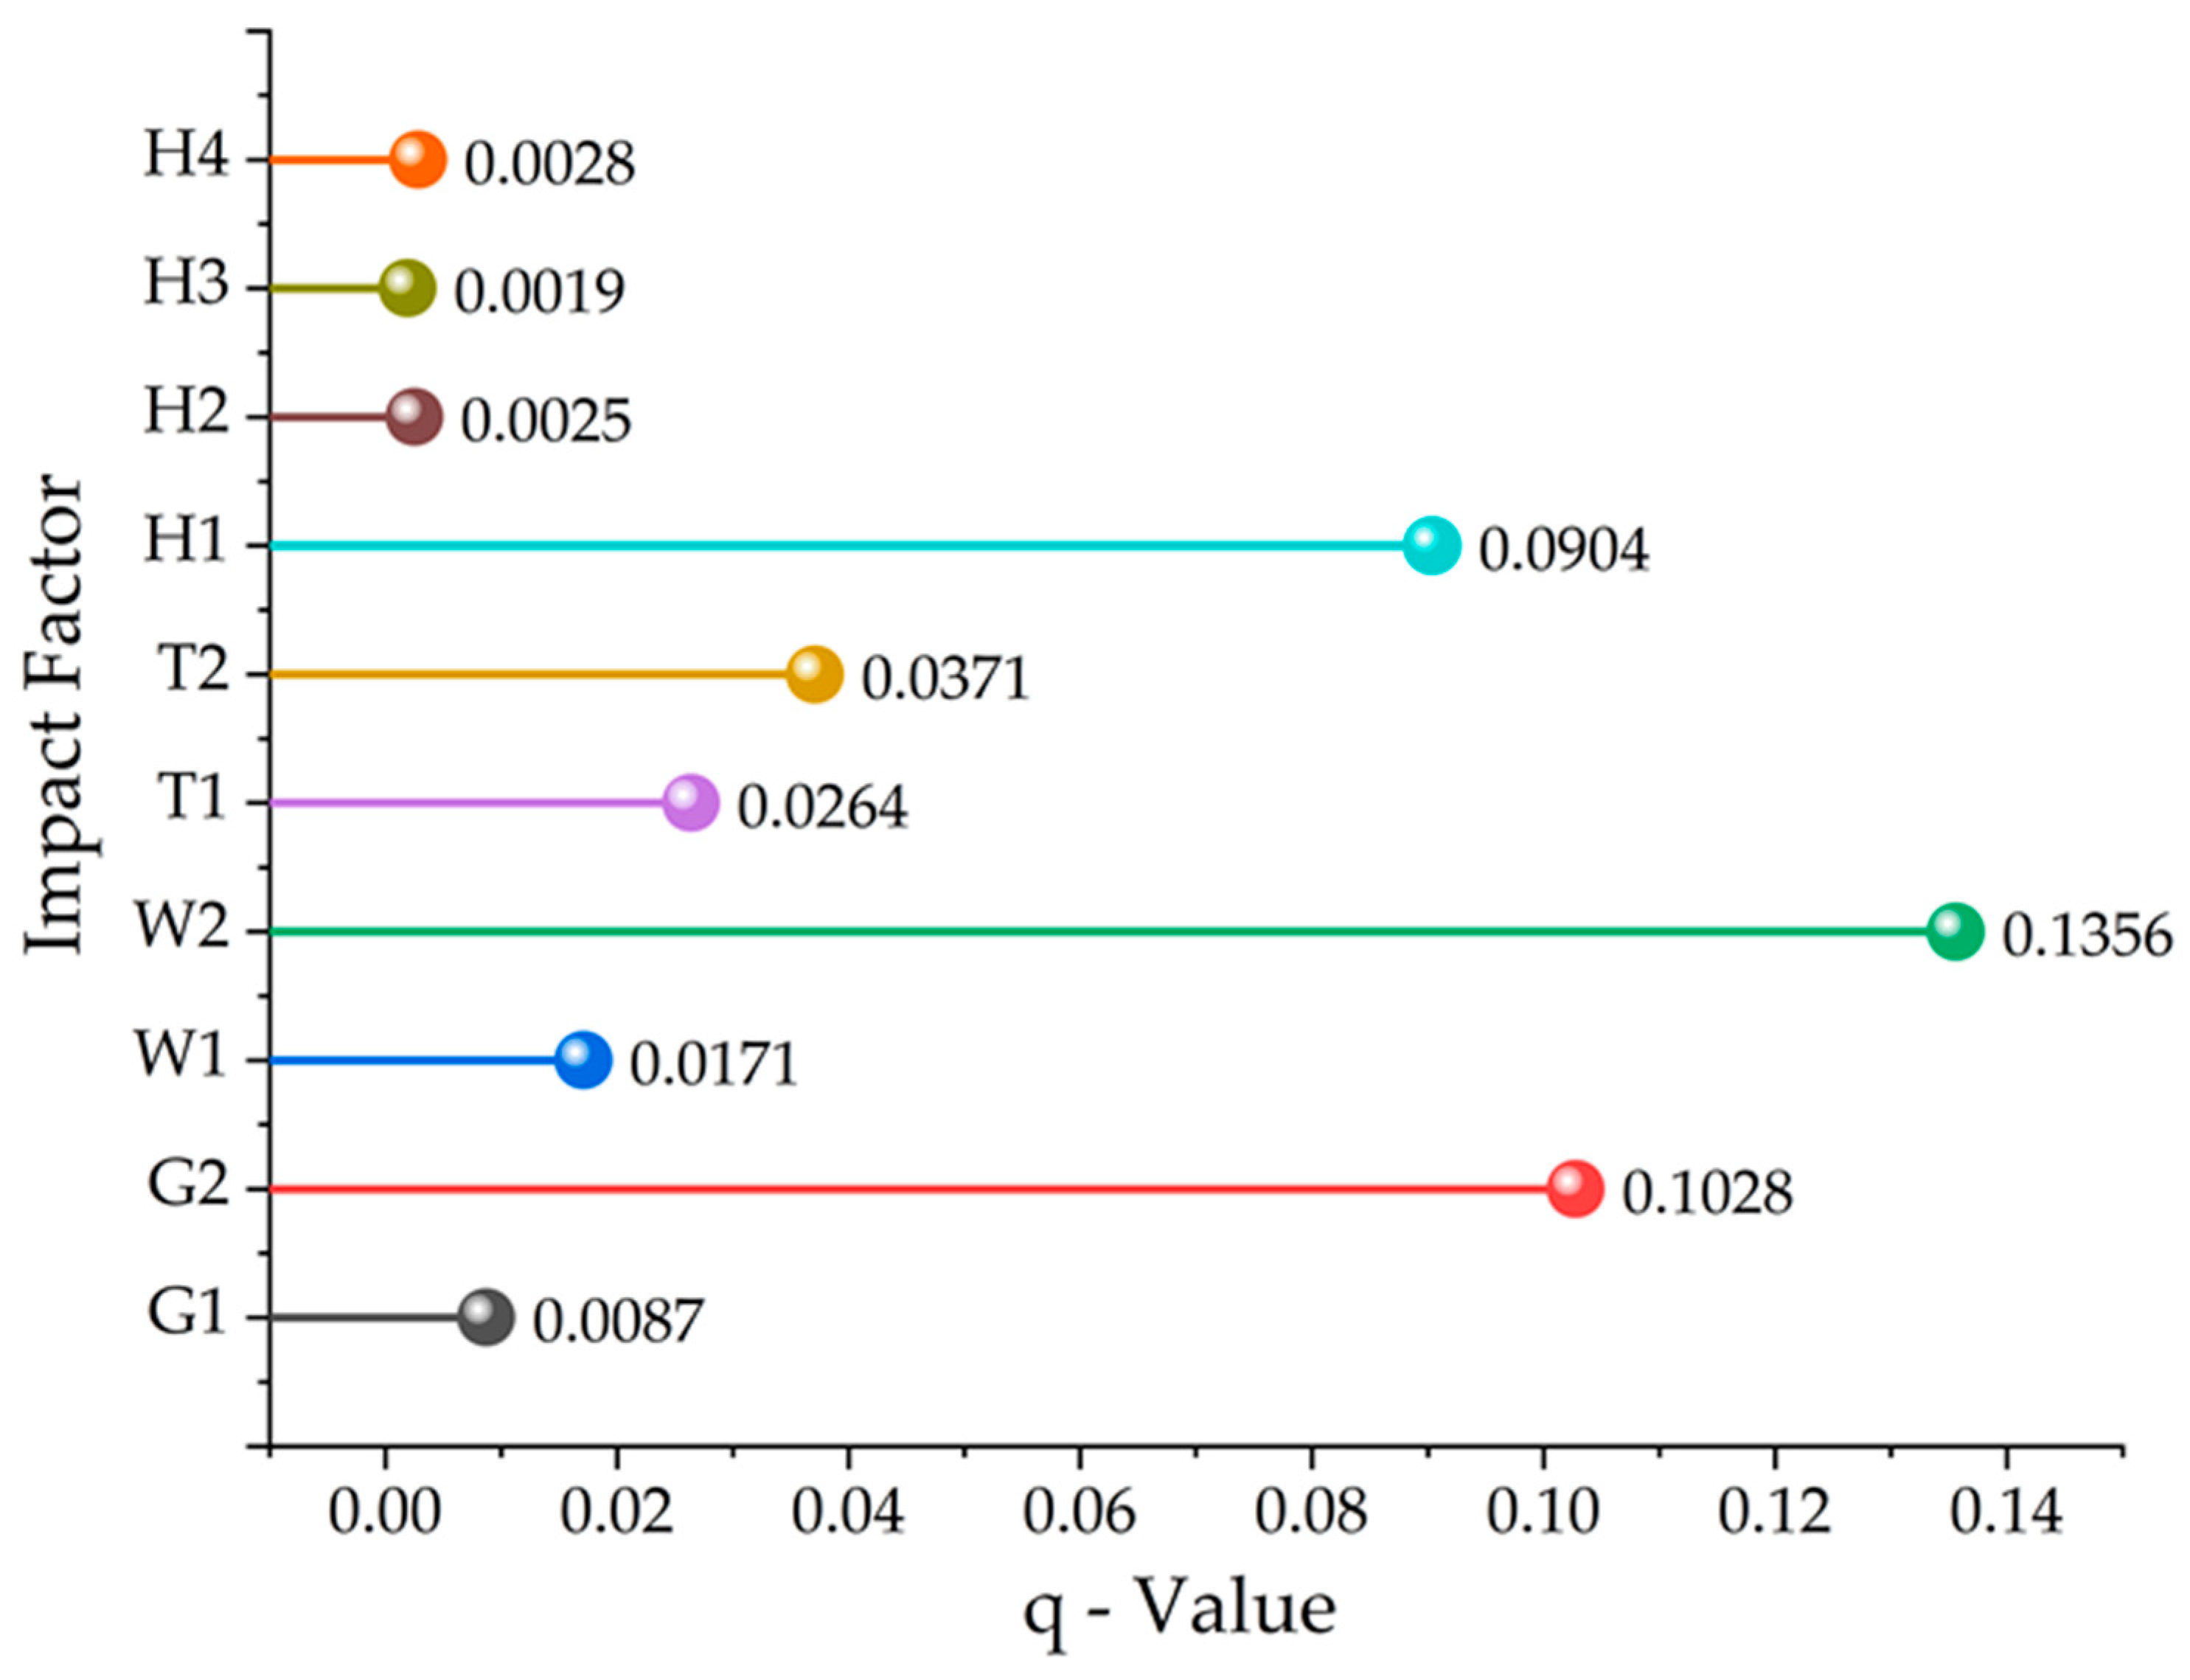
3.3.1. Contribution of Impact Factors to Land Subsidence
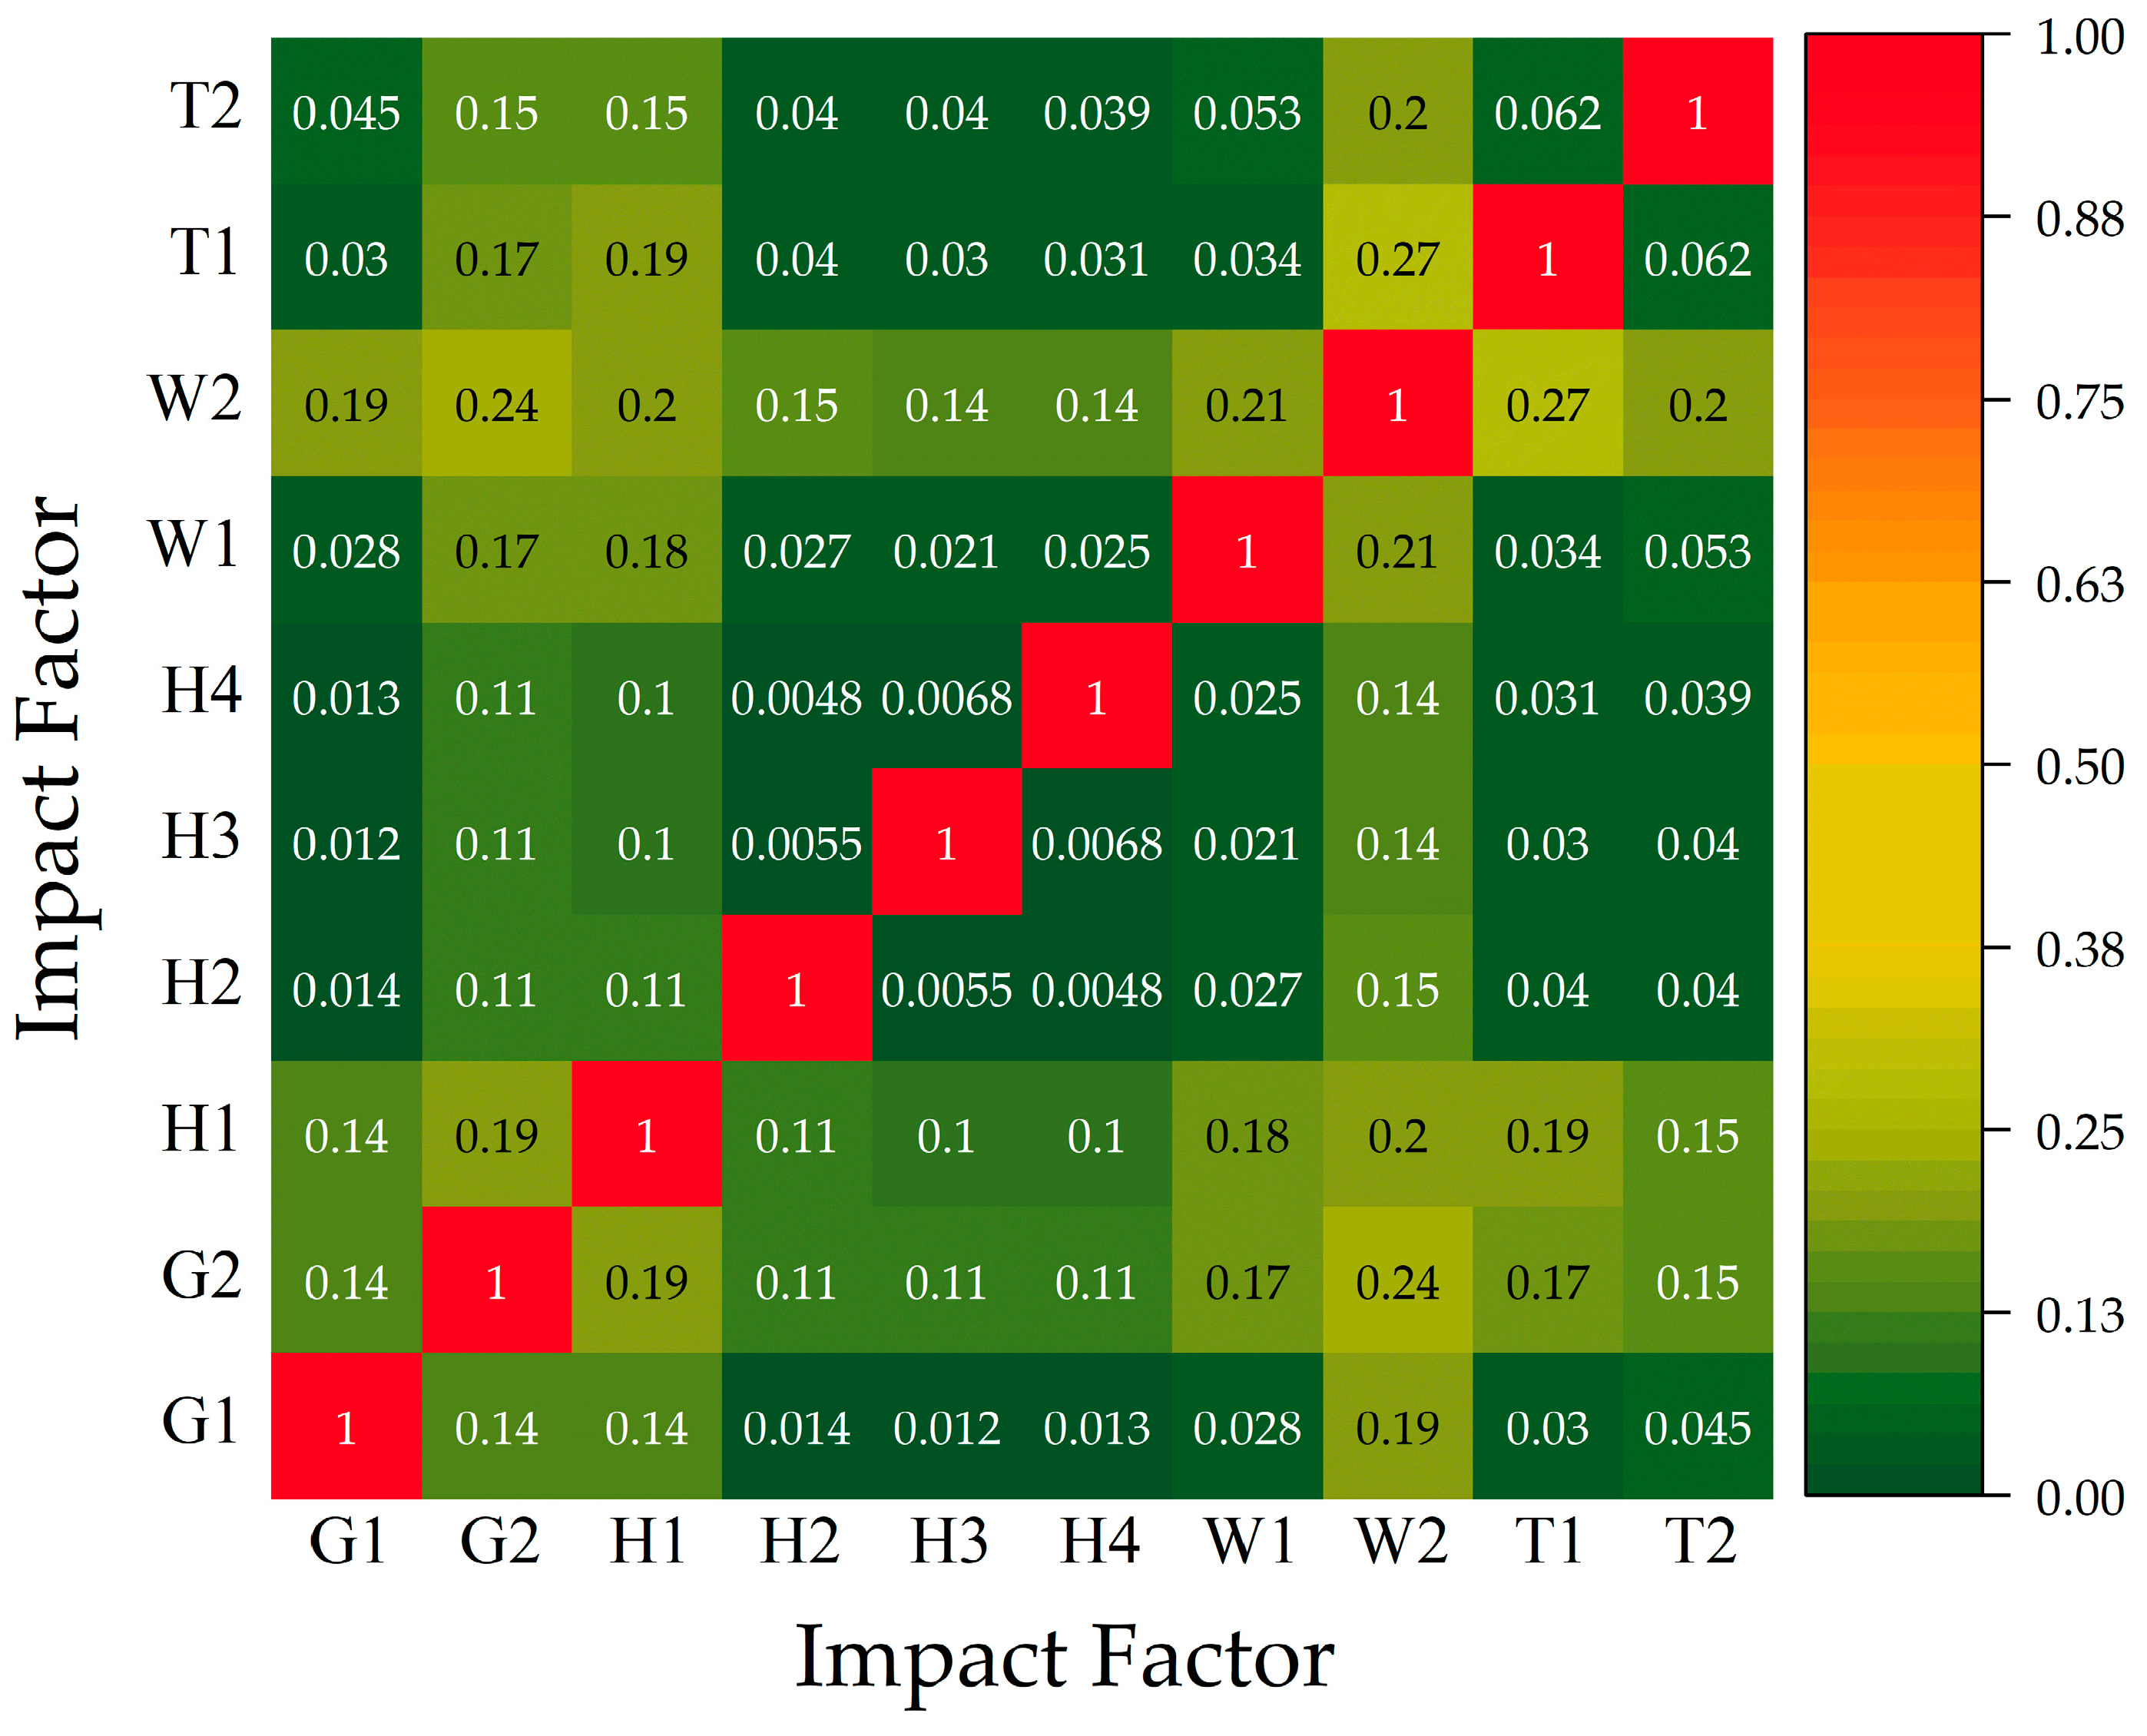
3.3.2. Ecological Detection and Factor Interaction Detection
4. Discussion
5. Conclusions
- (1)
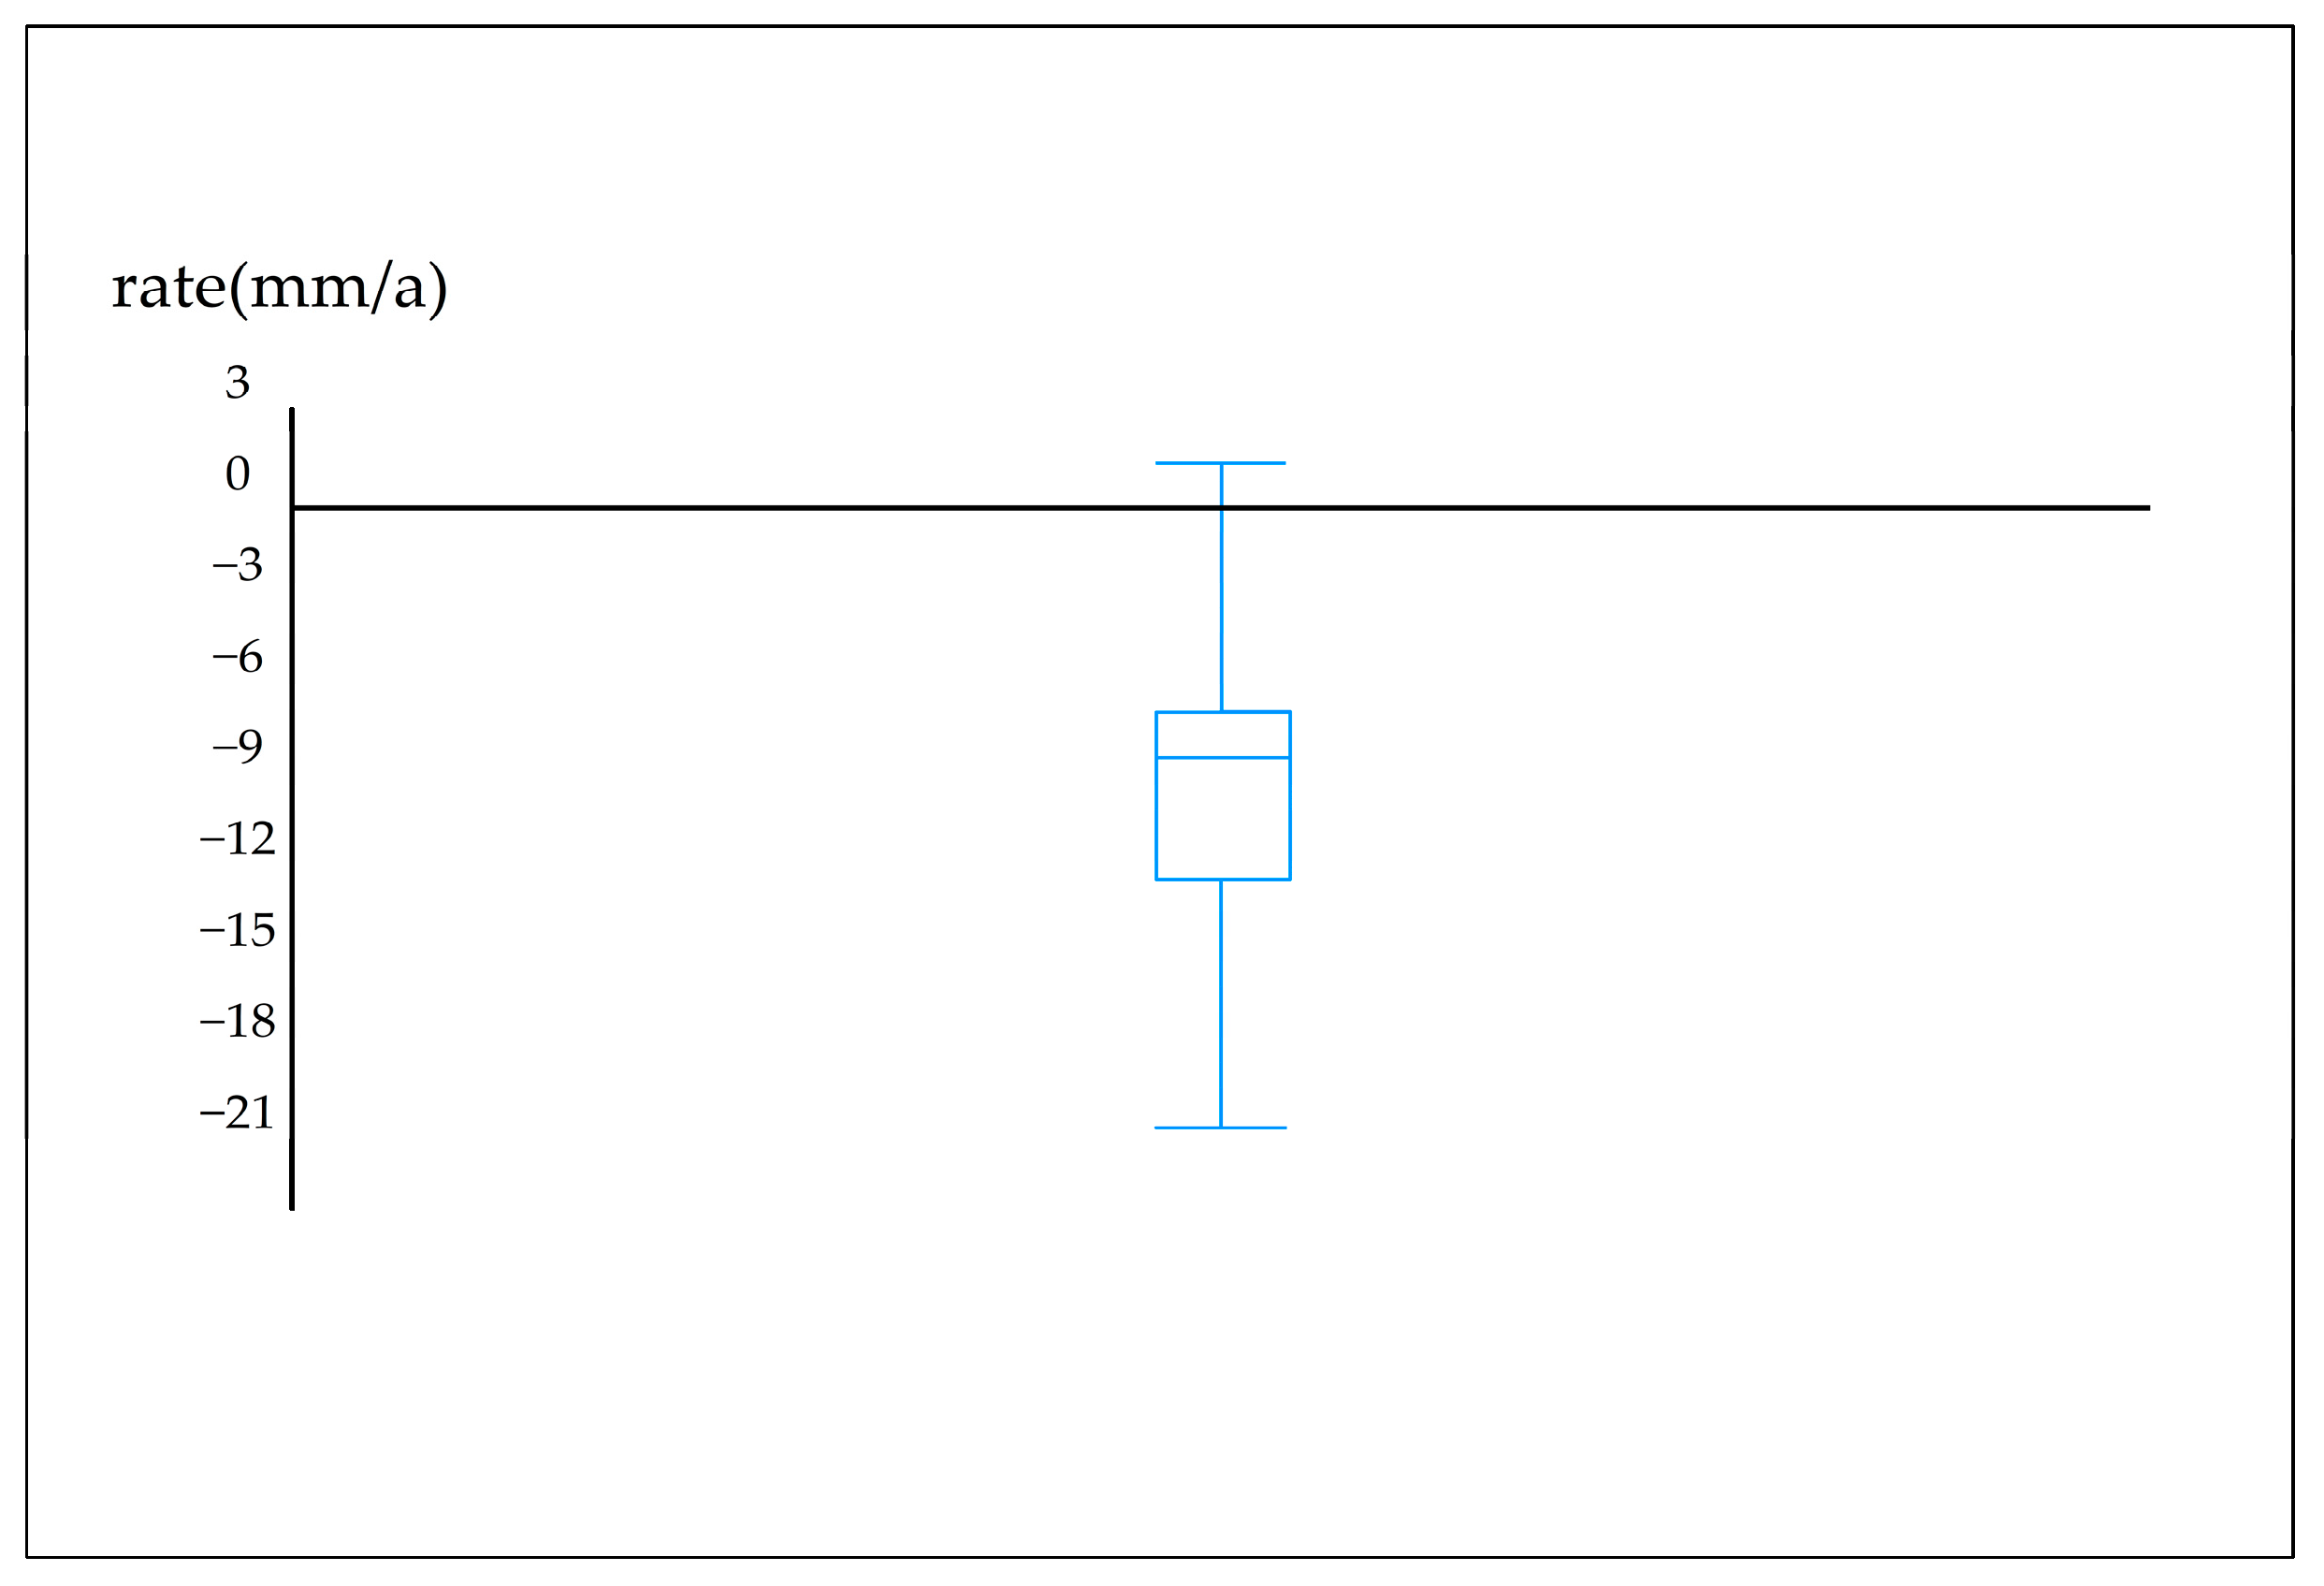
- The study used SBAS InSAR technology to obtain land subsidence information within TSNSUA from 2018 to 20222. The average land subsidence rate of TSNSUA is mainly distributed between −30 and 10 mm/a, and the maximum subsidence rate can reach −358 mm/a. Settlement mainly occurs in Hutubi County and Manas County.
- (2)
- The spatiotemporal distribution characteristics of land subsidence in TSNSUA from 2018 to 2022 were studied. The results indicate that in terms of spatial characteristics, the rate of land subsidence in the study area shows a clear spatial clustering distribution and exhibits positive spatial correlation, which is related to the formation of subsidence funnels in the subsiding areas. The pattern of land subsidence is primarily characterized by low subsidence rates and areas of uplift. Regarding temporal characteristics, during the monitoring period, each administrative district within the study area experienced varying degrees of subsidence and uplift.
- (3)
- The study used GeoDector software to quantitatively analyze the impact factors of land subsidence in TSNSUA and explored the impact mechanism of land subsidence in the study area. The quantitative results indicate that the hydrological environment is the primary factor influencing land subsidence, with a strong explanatory power and significant interactions with other factors. This is closely related to the arid and semi-arid climate conditions in the TSNSUA region, as well as the scarcity of groundwater resources.
Author Contributions
Funding
Data Availability Statement
Conflicts of Interest
References
- Ao, Z.; Hu, X.; Tao, S.; Hu, X.; Wang, G.; Li, M.; Wang, F.; Hu, L.; Liang, X.; Xiao, J.; et al. A national-scale assessment of land subsidence in China’s major cities. Science 2024, 384, 301–306. [Google Scholar] [CrossRef]
- Ouyang, L.; Zhao, Z.; Zhou, D.; Cao, J.; Qin, J.; Cao, Y.; He, Y. Study on the Relationship between Groundwater and Land Subsidence in Bangladesh Combining GRACE and InSAR. Remote Sens. 2024, 16, 3715. [Google Scholar] [CrossRef]
- Bagheri-Gavkosh, M.; Hosseini, S.M.; Ataie-Ashtiani, B.; Sohani, Y.; Ebrahimian, H.; Morovat, F.; Ashrafi, S. Land subsidence: A global challenge. Sci. Total Environ. 2021, 778, 146193. [Google Scholar] [CrossRef]
- Zhang, G.; Xu, Z.; Chen, Z.; Wang, S.; Liu, Y.; Gong, X. Analyzing surface deformation throughout China’s territory using multi-temporal InSAR processing of Sentinel-1 radar data. Remote Sens. Environ. 2024, 305, 114105. [Google Scholar] [CrossRef]
- Wei, Y.; Liu, X.; Zhao, C.; Tomás, R.; Jiang, Z. Observation of Surface Displacement Associated with Rapid Urbanization and Land Creation in Lanzhou, Loess Plateau of China with Sentinel-1 SAR Imagery. Remote Sens. 2021, 13, 3472. [Google Scholar] [CrossRef]
- Sun, L.; Wang, X.; Wang, S.; Sun, W.; Wang, J.; Di, H. Experimental study on soil deformation caused by overexploitation of groundwater. Water Environ. Res. 2024, 96, e11111. [Google Scholar] [CrossRef]
- Zhao, C.; Zhang, Q.; Yang, C.; Zhang, J.; Zhu, W.; Qu, F.; Liu, Y. Different scale land subsidence and ground fissure monitoring with multiple InSAR techniques over Fenwei basin, China. Proc. Int. Assoc. Hydrol. Sci. 2015, 372, 305–309. [Google Scholar] [CrossRef]
- Jiang, Y.; Wang, J.; Yuan, X.; Wang, R. Analysis of the geomorphology and environmental geological problems of Huzhou on the Yangtze River delta. Acta Geol. Sin. Engl. Ed. 2004, 78, 808–812. [Google Scholar]
- Zhang, Y.; Liu, Y.; Jin, M.; Jing, Y.; Liu, Y.; Liu, Y.; Sun, W.; Wei, J.; Chen, Y. Monitoring Land Subsidence in Wuhan City (China) using the SBAS-InSAR Method with Radarsat-2 Imagery Data. Sensors 2019, 19, 743. [Google Scholar] [CrossRef]
- Li, D.; Li, B.; Zhang, Y.; Fan, C.; Xu, H.; Hou, X. Spatial and temporal characteristics analysis for land subsidence in Shanghai coastal reclamation area using PS-InSAR method. Front. Mar. Sci. 2022, 9, 1000523. [Google Scholar] [CrossRef]
- Zhang, Z.; Hu, C.; Wu, Z.; Zhang, Z.; Yang, S.; Yang, W. Monitoring and analysis of ground subsidence in Shanghai based on PS-InSAR and SBAS-InSAR technologies. Sci. Rep. 2023, 13, 8031. [Google Scholar] [CrossRef]
- Massonnet, D.; Rossi, M.; Carmona, C.; Adragna, F.; Peltzer, G.; Feigl, K.; Rabaute, T. The Displacement Field of the Landers Earthquake Mapped by Radar Interferometry. Nature 1993, 364, 138–142. [Google Scholar] [CrossRef]
- Berardino, P.; Fornaro, G.; Lanari, R.; Sansosti, E. A new algorithm for surface deformation monitoring based on small baseline differential SAR interferograms. IEEE Trans. Geosci. Remote Sens. 2002, 40, 2375–2383. [Google Scholar] [CrossRef]
- Ibrahim, H.B.; Salah, M.; Zarzoura, F.; El-Mewafi, M. Differential synthetic aperture radar (SAR) interferometry for detection land subsidence in Derna City, Libya. J. Appl. Geodesy 2024, 18, 433–448. [Google Scholar] [CrossRef]
- Wang, H.; Qi, Y.; Zhang, J.; Zhang, J.; Yang, R.; Guo, J.; Luo, D.; Wu, J.; Zhou, S. Influence of Open-Pit Coal Mining on Ground Surface Deformation of Permafrost in the Muli Region in the Qinghai-Tibet Plateau, China. Remote Sens. 2022, 14, 2352. [Google Scholar] [CrossRef]
- Xue, Y.-A.; Zou, Y.-F.; Li, H.-Y.; Zhang, W.-Z. Regional subsidence monitoring and prediction along high-speed railways based on PS-InSAR and LSTM. Sci. Rep. 2024, 14, 24622. [Google Scholar] [CrossRef] [PubMed]
- Hu, C.; Zhang, S.B.; Xu, S.Z.; Xu, B. Distributed Landsilde Mornitoring by Wireless Sensor Nodes. Adv. Mater. Res. 2012, 594–597, 1069–1073. [Google Scholar] [CrossRef]
- Devaraj, S.; Yarrakula, K.; Martha, T.R.; Murugesan, G.P.; Vaka, D.S.; Surampudi, S.; Wadhwa, A.; Loganathan, P.; Budamala, V. Time series SAR interferometry approach for landslide identification in mountainous areas of Western Ghats, India. J. Earth Syst. Sci. 2022, 131, 133. [Google Scholar] [CrossRef]
- Teixeira, A.C.; Bakon, M.; Perissin, D.; Sousa, J.J. InSAR Analysis of Partially Coherent Targets in a Subsidence Deformation: A Case Study of Maceió. Remote Sens. 2024, 16, 3806. [Google Scholar] [CrossRef]
- Vaka, D.S.; Rao, Y.S.; Bhattacharya, A. Time series analysis of the pre-seismic and post-seismic surface deformation of the 2017 Iran–Iraq earthquake derived from Sentinel-1 InSAR data. J. Earth Syst. Sci. 2023, 132, 64. [Google Scholar] [CrossRef]
- He, Y.; Qian, Z.; Chen, B.; Yang, W.; Hao, P. Surface Deformation of Xiamen, China Measured by Time-Series InSAR. Sensors 2024, 24, 5329. [Google Scholar] [CrossRef]
- Zhang, P.; Qian, X.; Guo, S.; Wang, B.; Xia, J.; Zheng, X. A New Method for Continuous Track Monitoring in Regions of Differential Land Subsidence Rate Using the Integration of PS-InSAR and SBAS-InSAR. Remote Sens. 2023, 15, 3298. [Google Scholar] [CrossRef]
- Yang, Z.F.; Li, Z.W.; Zhu, J.J.; Preusse, A.; Yi, H.W.; Wang, Y.J.; Papst, M. An Extension of the InSAR-Based Probability Integral Method and Its Application for Predicting 3-D Mining-Induced Displacements Under Different Extraction Conditions. IEEE Trans. Geosci. Remote Sens. 2017, 55, 3835–3845. [Google Scholar] [CrossRef]
- Hu, J.; Li, Z.; Ding, X.; Zhu, J.; Zhang, L.; Sun, Q. Resolving three-dimensional surface displacements from InSAR measurements: A review. Earth-Science Rev. 2014, 133, 1–17. [Google Scholar] [CrossRef]
- Ahmed, G.; Zan, M.; Helili, P.; Kasimu, A. Responses of Vegetation Phenology to Urbanisation and Natural Factors along an Urban-Rural Gradient: A Case Study of an Urban Agglomeration on the Northern Slope of the Tianshan Mountains. Land 2023, 12, 1108. [Google Scholar] [CrossRef]
- Zhang, J.; Kou, P.; Tao, Y.; Jin, Z.; Huang, Y.; Cui, J.; Liang, W.; Liu, R. Urban ground subsidence monitoring and prediction using time-series InSAR and machine learning approaches: A case study of Tianjin, China. Environ. Earth Sci. 2024, 83, 473. [Google Scholar] [CrossRef]
- Wen, Q.; Zhao, X.; Zhang, Z.; Wang, C.; Zeng, T.; Zhang, M. Spatial structures of Chinese Urban Agglomerations in the ”Silk Road Economic Belt”. In Proceedings of the 2018 Fifth International Workshop on Earth Observation and Remote Sensing Applications (Eorsa), Xi’an, China, 18–20 June 2018; pp. 356–360. [Google Scholar]
- Lee, J.; Yin, X.; Zhu, H. Spatial Optimization of Land Use Allocation Based on the Trade-off of Carbon Mitigation and Economic Benefits: A Study in Tianshan North Slope Urban Agglomeration. Land 2024, 13, 892. [Google Scholar] [CrossRef]
- Zhao, Y.; Kasimu, A.; Gao, P.; Liang, H. Spatiotemporal Changes in The Urban Landscape Pattern and Driving Forces of LUCC Characteristics in The Urban Agglomeration on The Northern Slope of The Tianshan Mountains from 1995 to 2018. Land 2022, 11, 1745. [Google Scholar] [CrossRef]
- Guo, J.; Hu, J.; Li, B.; Zhou, L.; Wang, W. Land subsidence in Tianjin for 2015 to 2016 revealed by the analysis of Sentinel-1A with SBAS-InSAR. J. Appl. Remote Sens. 2017, 11, 026024. [Google Scholar] [CrossRef]
- Ashraf, T.; Yin, F.; Liu, L.; Zhang, Q. Land Subsidence Detection Using SBAS- and Stacking-InSAR with Zonal Statistics and Topographic Correlations in Lakhra Coal Mines, Pakistan. Remote Sens. 2024, 16, 3815. [Google Scholar] [CrossRef]
- Guo, H.; Martínez-Graña, A.M. Susceptibility of Landslide Debris Flow in Yanghe Township Based on Multi-Source Remote Sensing Information Extraction Technology (Sichuan, China). Land 2024, 13, 206. [Google Scholar] [CrossRef]
- Yan, L.; Xiong, Q.; Li, D.; Cheon, E.; She, X.; Yang, S. InSAR-Driven Dynamic Landslide Hazard Mapping in Highly Vegetated Area. Remote Sens. 2024, 16, 3229. [Google Scholar] [CrossRef]
- Wang, Z.; Liu, Y.; Zhang, Y.; Liu, Y.; Wang, B.; Zhang, G. Spatially Varying Relationships between Land Subsidence and Urbanization: A Case Study in Wuhan, China. Remote Sens. 2022, 14, 291. [Google Scholar] [CrossRef]
- Marcińczak, S.; Iglesias-Pascual, R.; Kopeć, D.; Wróbel, K.; Mooses, V. Landscapes of thermal inequality: Exploring patterns of climate justice across multiple spatial scales in Spain. Landsc. Urban Plan. 2024, 254, 105255. [Google Scholar] [CrossRef]
- Wang, J.; Xu, C. Geodetector: Principle and prospective. Acta Geogr. Sin. 2017, 72, 116–134. [Google Scholar]
- Wang, R.; Wang, M.; Zhang, Z.; Hu, T.; Xing, J.; He, Z.; Liu, X. Geographical Detection of Urban Thermal Environment Based on the Local Climate Zones: A Case Study in Wuhan, China. Remote Sens. 2022, 14, 1067. [Google Scholar] [CrossRef]
- Wu, K.; Su, W.; Ye, S.; Li, W.; Cao, Y.; Jia, Z. Analysis on the geographical pattern and driving force of traditional villages based on GIS and Geodetector: A case study of Guizhou, China. Sci. Rep. 2023, 13, 20659. [Google Scholar] [CrossRef]
- Duan, Y.; Gao, Y.G.; Zhang, Y.; Li, H.; Li, Z.; Zhou, Z.; Tian, G.; Lei, Y. “The 20 July 2021 Major Flood Event” in Greater Zhengzhou, China: A Case Study of Flooding Severity and Landscape Characteristics. Land 2022, 11, 1921. [Google Scholar] [CrossRef]
- Ouyang, Y.; Feng, T.; Feng, H.; Wang, X.; Zhang, H.; Zhou, X. Deformation Monitoring and Potential Risk Detection of In-Construction Dams Utilizing SBAS-InSAR Technology—A Case Study on the Datengxia Water Conservancy Hub. Water 2024, 16, 1025. [Google Scholar] [CrossRef]
- Ren, K.; Li, R.; Yao, X.; Zhao, X.; Ma, L.; Yao, C.; Jiang, S.; Gu, Z.; Zhou, Z. Monitoring Yanwan deep-seated toppling deformation with the impact of water-level fluctuation by SAR observations. Landslides 2024, 21, 1243–1254. [Google Scholar] [CrossRef]
- Jasechko, S.; Seybold, H.; Perrone, D.; Fan, Y.; Shamsudduha, M.; Taylor, R.G.; Fallatah, O.; Kirchner, J.W. Rapid groundwater decline and some cases of recovery in aquifers globally. Nature 2024, 625, 715–721. [Google Scholar] [CrossRef] [PubMed]
- Zhang, N.; Liu, X.; Zhang, Y.; Gu, H.; Yan, B.; Jia, Q.; Gao, X. Investigating the Mechanism of Land Subsidence Due to Water Network Integration at the Guangzhou Longgui Salt Mine and Its Impact on Adjacent Subway. Water 2024, 16, 1723. [Google Scholar] [CrossRef]
- Zhao, X.; Chen, B.; Gong, H.; Zhou, C.; Li, X.; Lei, K.; Ke, Y. Land subsidence along the Beijing-Tianjin Intercity Railway during the period of the South-to-North Water Diversion Project. Int. J. Remote Sens. 2020, 41, 4447–4469. [Google Scholar] [CrossRef]
- Zhang, Y.; Jiang, Z.; Cheng, X. Differential sar interferometry for mining subsidence detection in rugged terrain. In Proceedings of the IGARSS 2011—2011 IEEE International Geoscience and Remote Sensing Symposium, Vancouver, BC, Canada, 24–29 July 2011; pp. 2204–2207. [Google Scholar]
- Zhang, J.-Z.; Huang, H.-J.; Bi, H.-B. Land subsidence in the modern Yellow River Delta based on InSAR time series analysis. Nat. Hazards 2015, 75, 2385–2397. [Google Scholar] [CrossRef]
- Chen, Z.; Li, Z.; Xu, L.; Zhou, X.; Zhang, X.; Wang, F.; Luo, Y. Gaseous and Particulate Pollution in the Wu-Chang-Shi Urban Agglomeration on the Northern Slope of Tianshan Mountains from 2017 to 2021. Atmosphere 2023, 14, 91. [Google Scholar] [CrossRef]
- Qin, M.; Yang, J.; Bai, Y.; Bai, Y. The subsidence–distance relationship for land subsidence induced by groundwater abstraction. Hydrogeol. J. 2024, 32, 1–13. [Google Scholar] [CrossRef]
- Hu, L.; Du, Y.; Xu, Y.; Wang, Z.; Wang, C. New Zircon U-Pb Age of Late Devonian Tuff in Guangxi, South China and the Significance for the Paleo-Tethys Branch Ocean. Acta Geol. Sin. Engl. Ed. 2018, 92, 402–403. [Google Scholar] [CrossRef]
- Du, Z.; Feng, L.; Wang, H.; Dong, Y.; Luo, D.; Zhang, X.; Liu, H.; Zhang, M. Identification of Ground Deformation Patterns in Coal Mining Areas via Rapid Topographical Analysis. Land 2023, 12, 1221. [Google Scholar] [CrossRef]
- Tan, H.; Yu, X.; Zhu, M.; Guo, Z.; Chen, H. Deformation Monitoring and Spatiotemporal Evolution of Mining Area with Unmanned Aerial Vehicle and D-InSAR Technology. Mob. Inf. Syst. 2022, 2022, 8075611. [Google Scholar] [CrossRef]
- Tang, W.; Ng, A.H.-M.; Wang, H.; Kuang, J.; Du, Z. Surface Subsidence Characteristics and Causes Analysis in Ningbo Plain by Sentinel-1A TS-InSAR. Remote Sens. 2024, 16, 2438. [Google Scholar] [CrossRef]


| Number of Orbital | Imaging Mode | Band | Resolution/m | Revisit Period /d | Polarization Mode | Selection Period /d |
|---|---|---|---|---|---|---|
| 2 (Descend/Ascent) | IW | C | 5 × 20 | 12 | VV | 90 |
| Natural Factors/Human Activities | Characterization Factors | Impact Factors | Abbreviation |
|---|---|---|---|
| Natural factors | Geological background | Geological lithology | G1 |
| Clay content | G2 | ||
| Hydrological environment | Precipitation | W1 | |
| Potential evapotranspiration | W2 | ||
| Topographic features | Elevation | T1 | |
| Slope | T2 | ||
| Human activities | Urban development | Population density | H1 |
| Road network density | H2 | ||
| Ground load | Building density | H3 | |
| Nighttime lighting | H4 |
| Number | Location | Description | Field Verification |
|---|---|---|---|
| 1 | Urumqi County | Land subsidence caused by excessive extraction of groundwater | 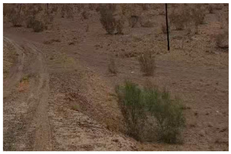 |
| 2 | Hutubi County | Land subsidence caused by coal mining |  |
| 3 | Shawan County | Land subsidence caused by human activities such as quarrying | 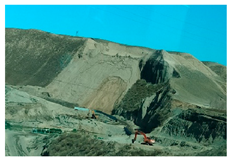 |
| 4 | Fukang County | Land subsidence caused by common soil erosion in the desert |  |
| Number | Subsidence Level | Subsidence Rate (mm/a) |
|---|---|---|
| 1 | Higher land subsidence rate zone | ≤−100 |
| 2 | High land subsidence rate zone | −100~−50 |
| 3 | Middle land subsidence rate zone | −50~−20 |
| 4 | Low land subsidence rate zone | −20~0 |
| 5 | Land uplift zone | >0 |
| Subsidence Level | PD | AI | PFD | MFD |
|---|---|---|---|---|
| Higher land subsidence rate zone | 1.5006 | 24.6988 | 1.7190 | 0.0324 |
| High land subsidence rate zone | 5.8553 | 42.5601 | 1.5467 | 0.2913 |
| Middle land subsidence rate zone | 18.684 | 33.0502 | 1.6140 | 0.4531 |
| Low land subsidence rate zone | 41.664 | 71.5806 | 1.6082 | 17.383 |
| Land uplift zone | 44.400 | 54.5081 | 1.5990 | 6.6998 |
| Impact Factor | G1 | G2 | H1 | H2 | H3 | H4 | W1 | W2 | T1 | T2 |
|---|---|---|---|---|---|---|---|---|---|---|
| G1 | ||||||||||
| G2 | Y (NE) | |||||||||
| H1 | Y (NE) | N (NE) | ||||||||
| H2 | N (NE) | Y (NE) | Y (NE) | |||||||
| H3 | N (NE) | Y (NE) | Y (NE) | N (NE) | ||||||
| H4 | N (NE) | Y (NE) | Y (NE) | N (BE) | N (NE) | |||||
| W1 | N (NE) | Y (NE) | Y (NE) | N (NE) | Y (NE) | N (NE) | ||||
| W2 | Y (NE) | Y (NE) | Y (BE) | Y (NE) | Y (NE) | Y (NE) | Y (NE) | |||
| T1 | Y (BE) | Y (NE) | Y (NE) | Y (NE) | Y (NE) | Y (NE) | N (BE) | Y (NE) | ||
| T2 | Y (BE) | Y (NE) | Y (NE) | Y (NE) | Y (NE) | Y (BE) | Y (BE) | Y (NE) | N (BE) |
Disclaimer/Publisher’s Note: The statements, opinions and data contained in all publications are solely those of the individual author(s) and contributor(s) and not of MDPI and/or the editor(s). MDPI and/or the editor(s) disclaim responsibility for any injury to people or property resulting from any ideas, methods, instructions or products referred to in the content. |
© 2025 by the authors. Licensee MDPI, Basel, Switzerland. This article is an open access article distributed under the terms and conditions of the Creative Commons Attribution (CC BY) license (https://creativecommons.org/licenses/by/4.0/).
Share and Cite
Yi, X.; Wang, L.; Ci, H.; Wang, R.; Yang, H.; Yan, Z. Monitoring of Land Subsidence and Analysis of Impact Factors in the Tianshan North Slope Urban Agglomeration. Land 2025, 14, 202. https://doi.org/10.3390/land14010202
Yi X, Wang L, Ci H, Wang R, Yang H, Yan Z. Monitoring of Land Subsidence and Analysis of Impact Factors in the Tianshan North Slope Urban Agglomeration. Land. 2025; 14(1):202. https://doi.org/10.3390/land14010202
Chicago/Turabian StyleYi, Xiaoqiang, Lang Wang, Hui Ci, Ran Wang, Hui Yang, and Zhaojin Yan. 2025. "Monitoring of Land Subsidence and Analysis of Impact Factors in the Tianshan North Slope Urban Agglomeration" Land 14, no. 1: 202. https://doi.org/10.3390/land14010202
APA StyleYi, X., Wang, L., Ci, H., Wang, R., Yang, H., & Yan, Z. (2025). Monitoring of Land Subsidence and Analysis of Impact Factors in the Tianshan North Slope Urban Agglomeration. Land, 14(1), 202. https://doi.org/10.3390/land14010202