
Analysis of Vegetation Restoration Potential and Its Influencing Factors on the Loess Plateau: Based on the Potential Realization Model and Spatial Dubin Model


Abstract
1. Introduction
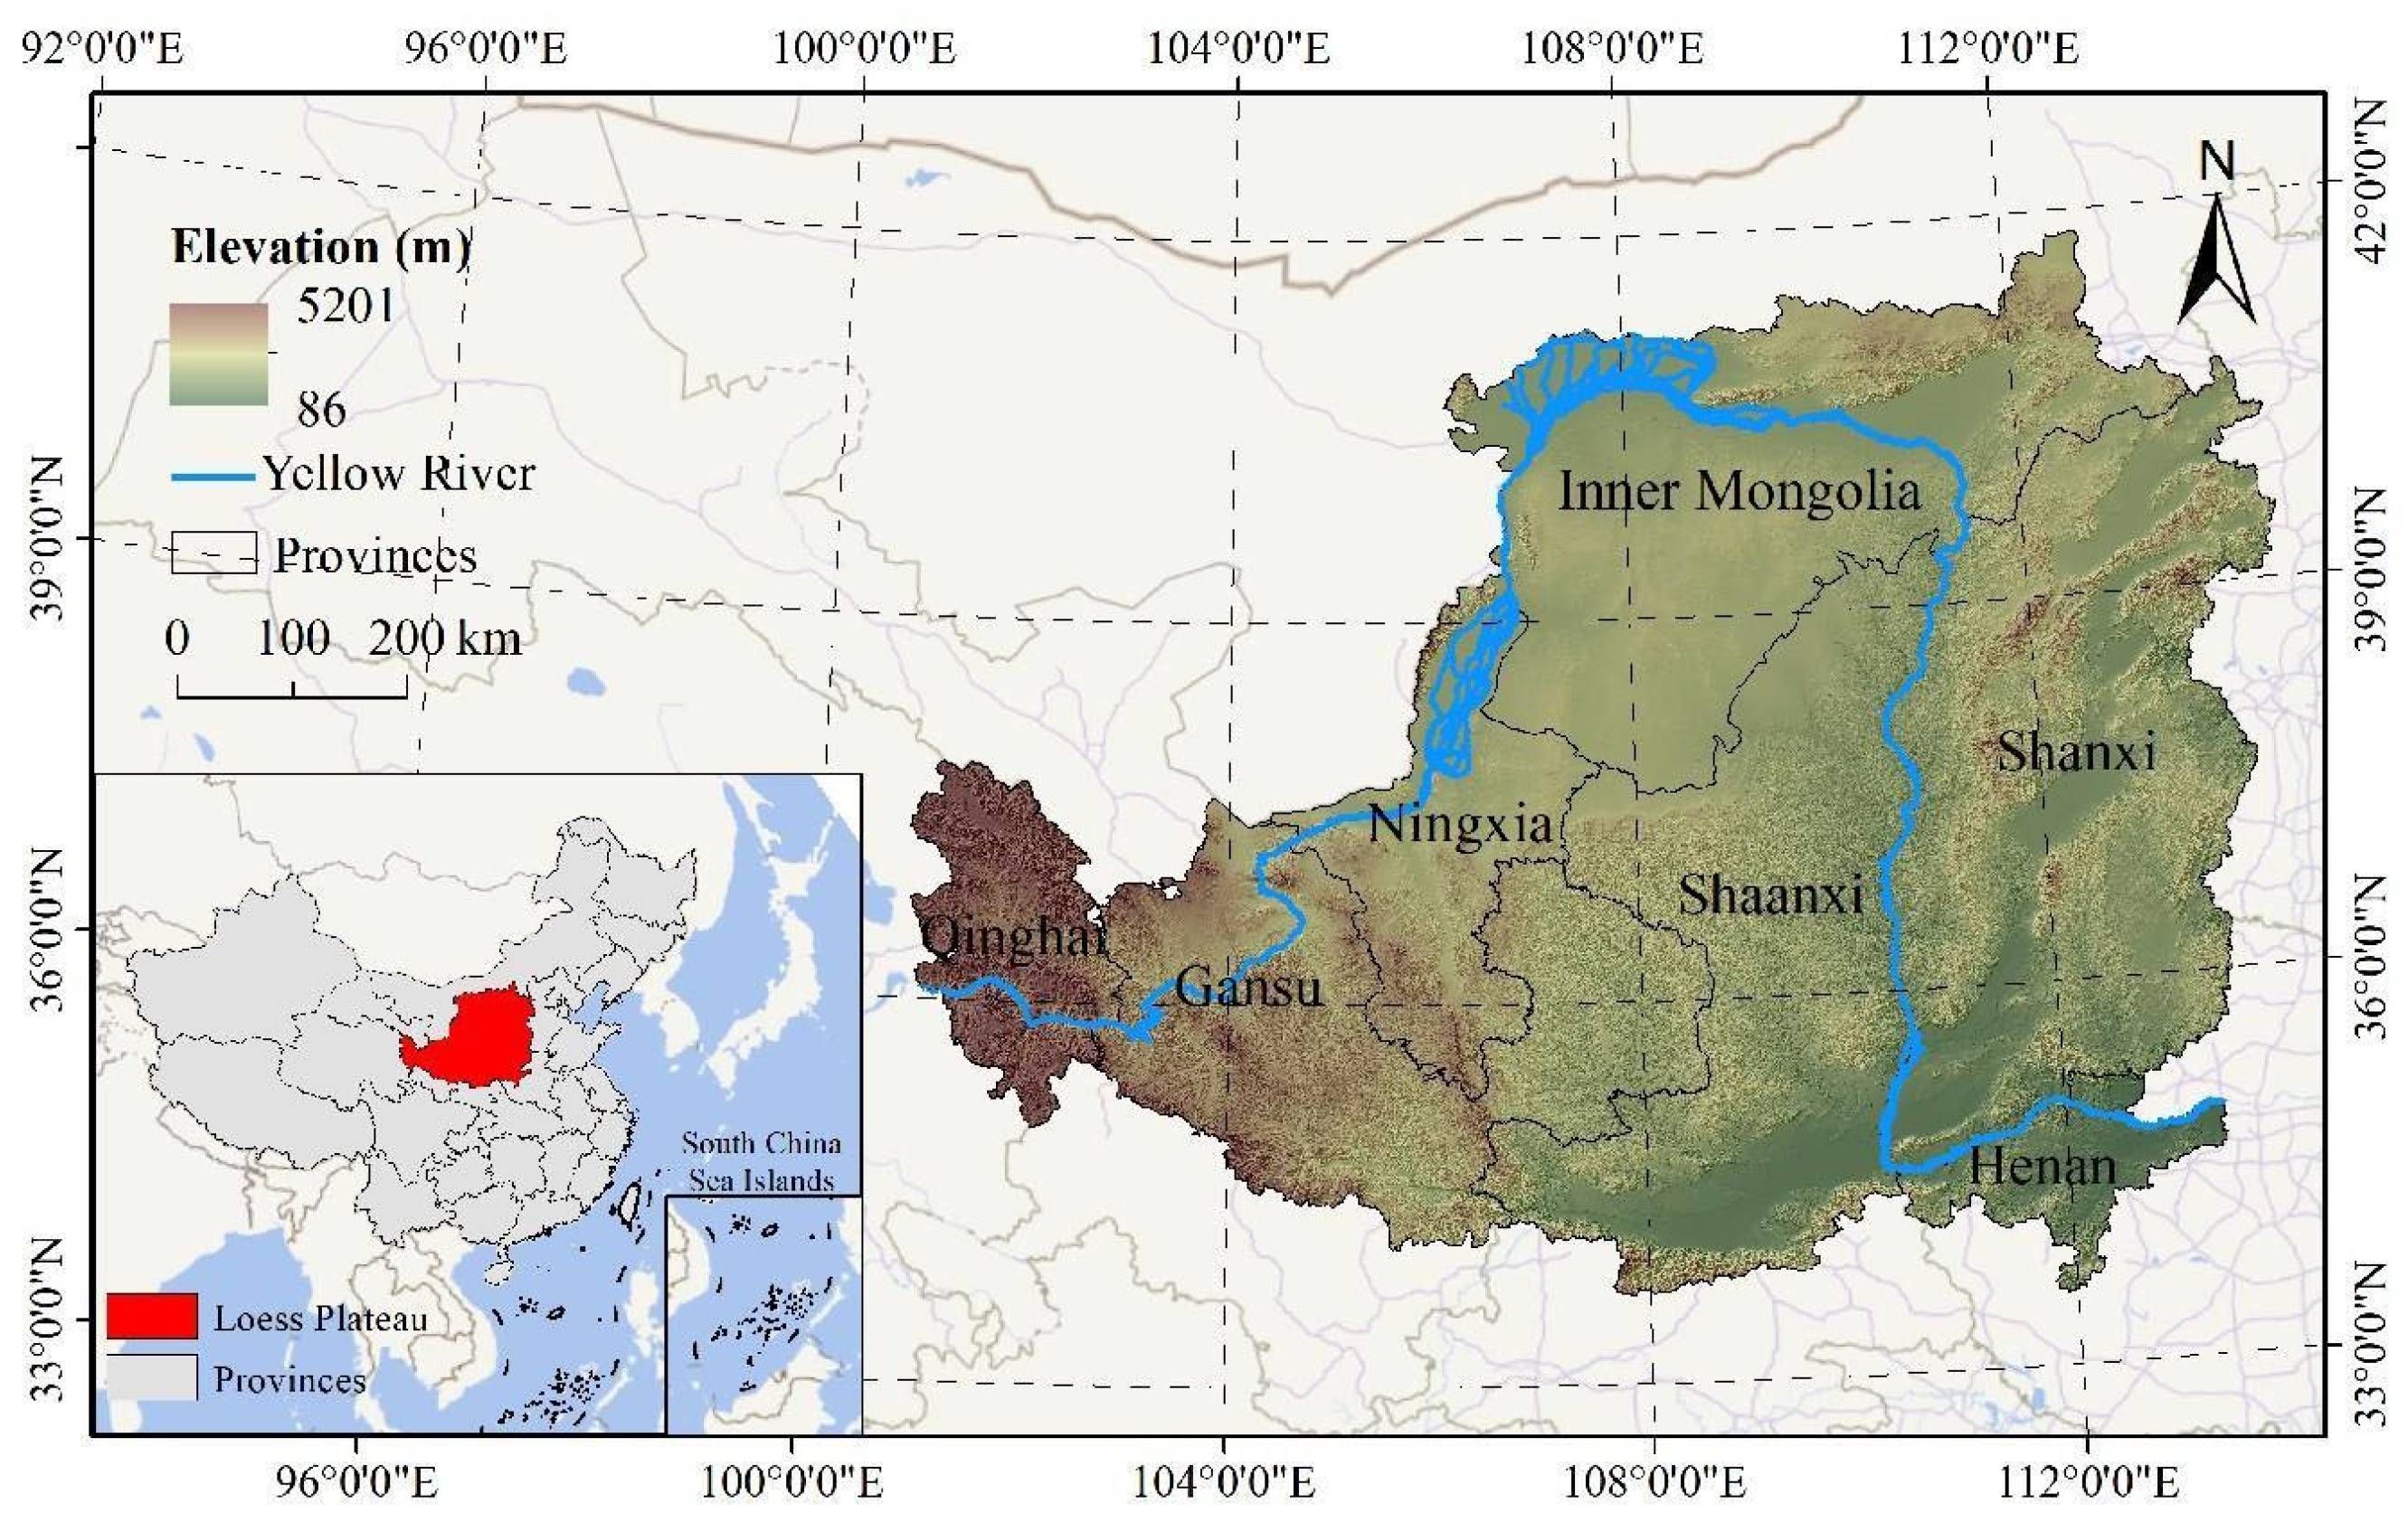
2. Study Area
3. Data and Methods
3.1. Data Sources
3.1.1. Elevation and Soil Data
3.1.2. Meteorological Data
3.1.3. Socioeconomic Data
3.1.4. Vegetation Coverage Data
3.2. Methods
3.2.1. Local Sliding Window-Based Similar Habitat Potential Model
3.2.2. Potential Realization Degree Model
3.2.3. Spatial Econometric Model
4. Results and Analysis
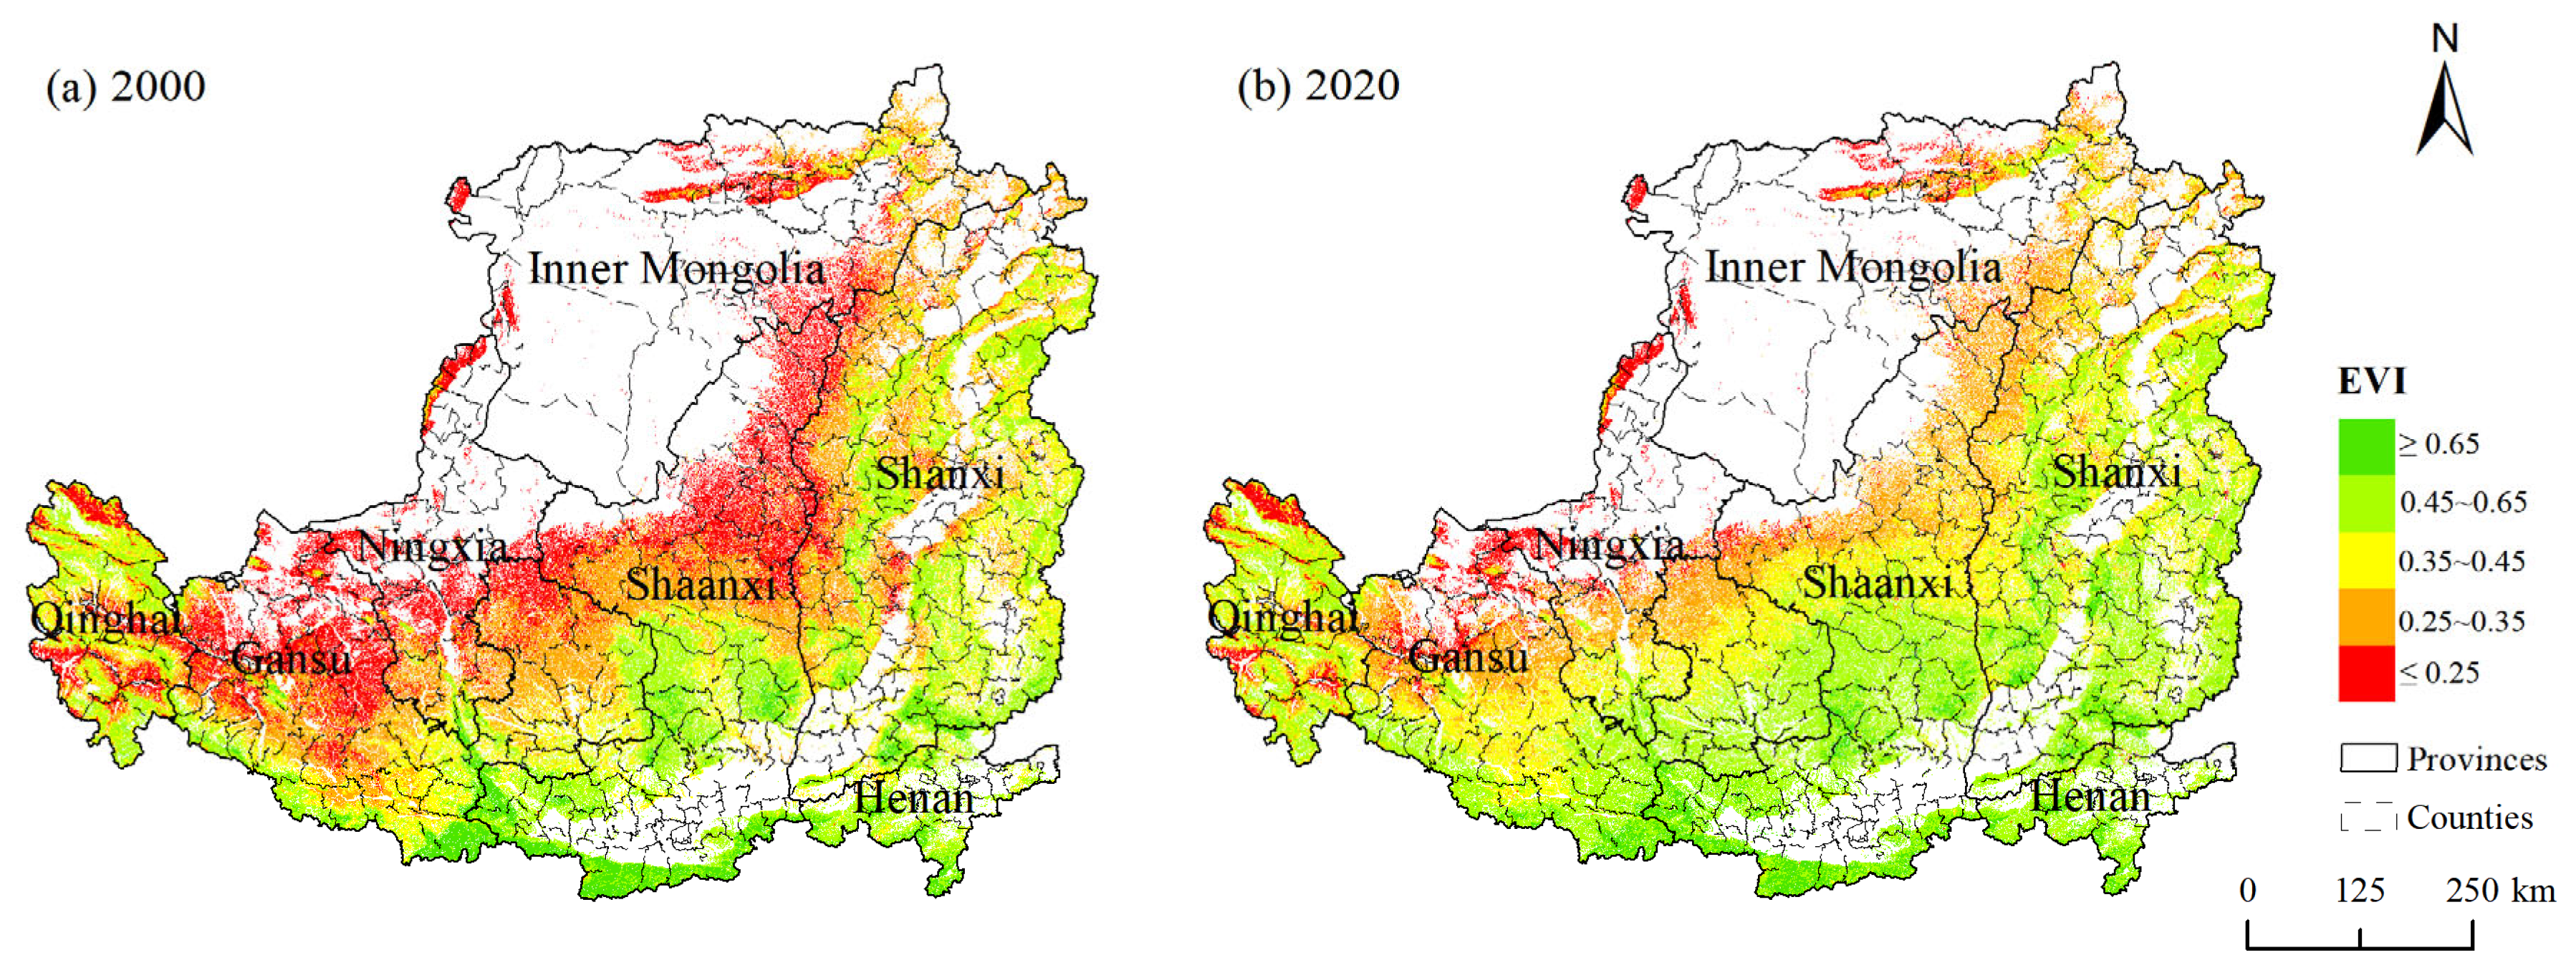
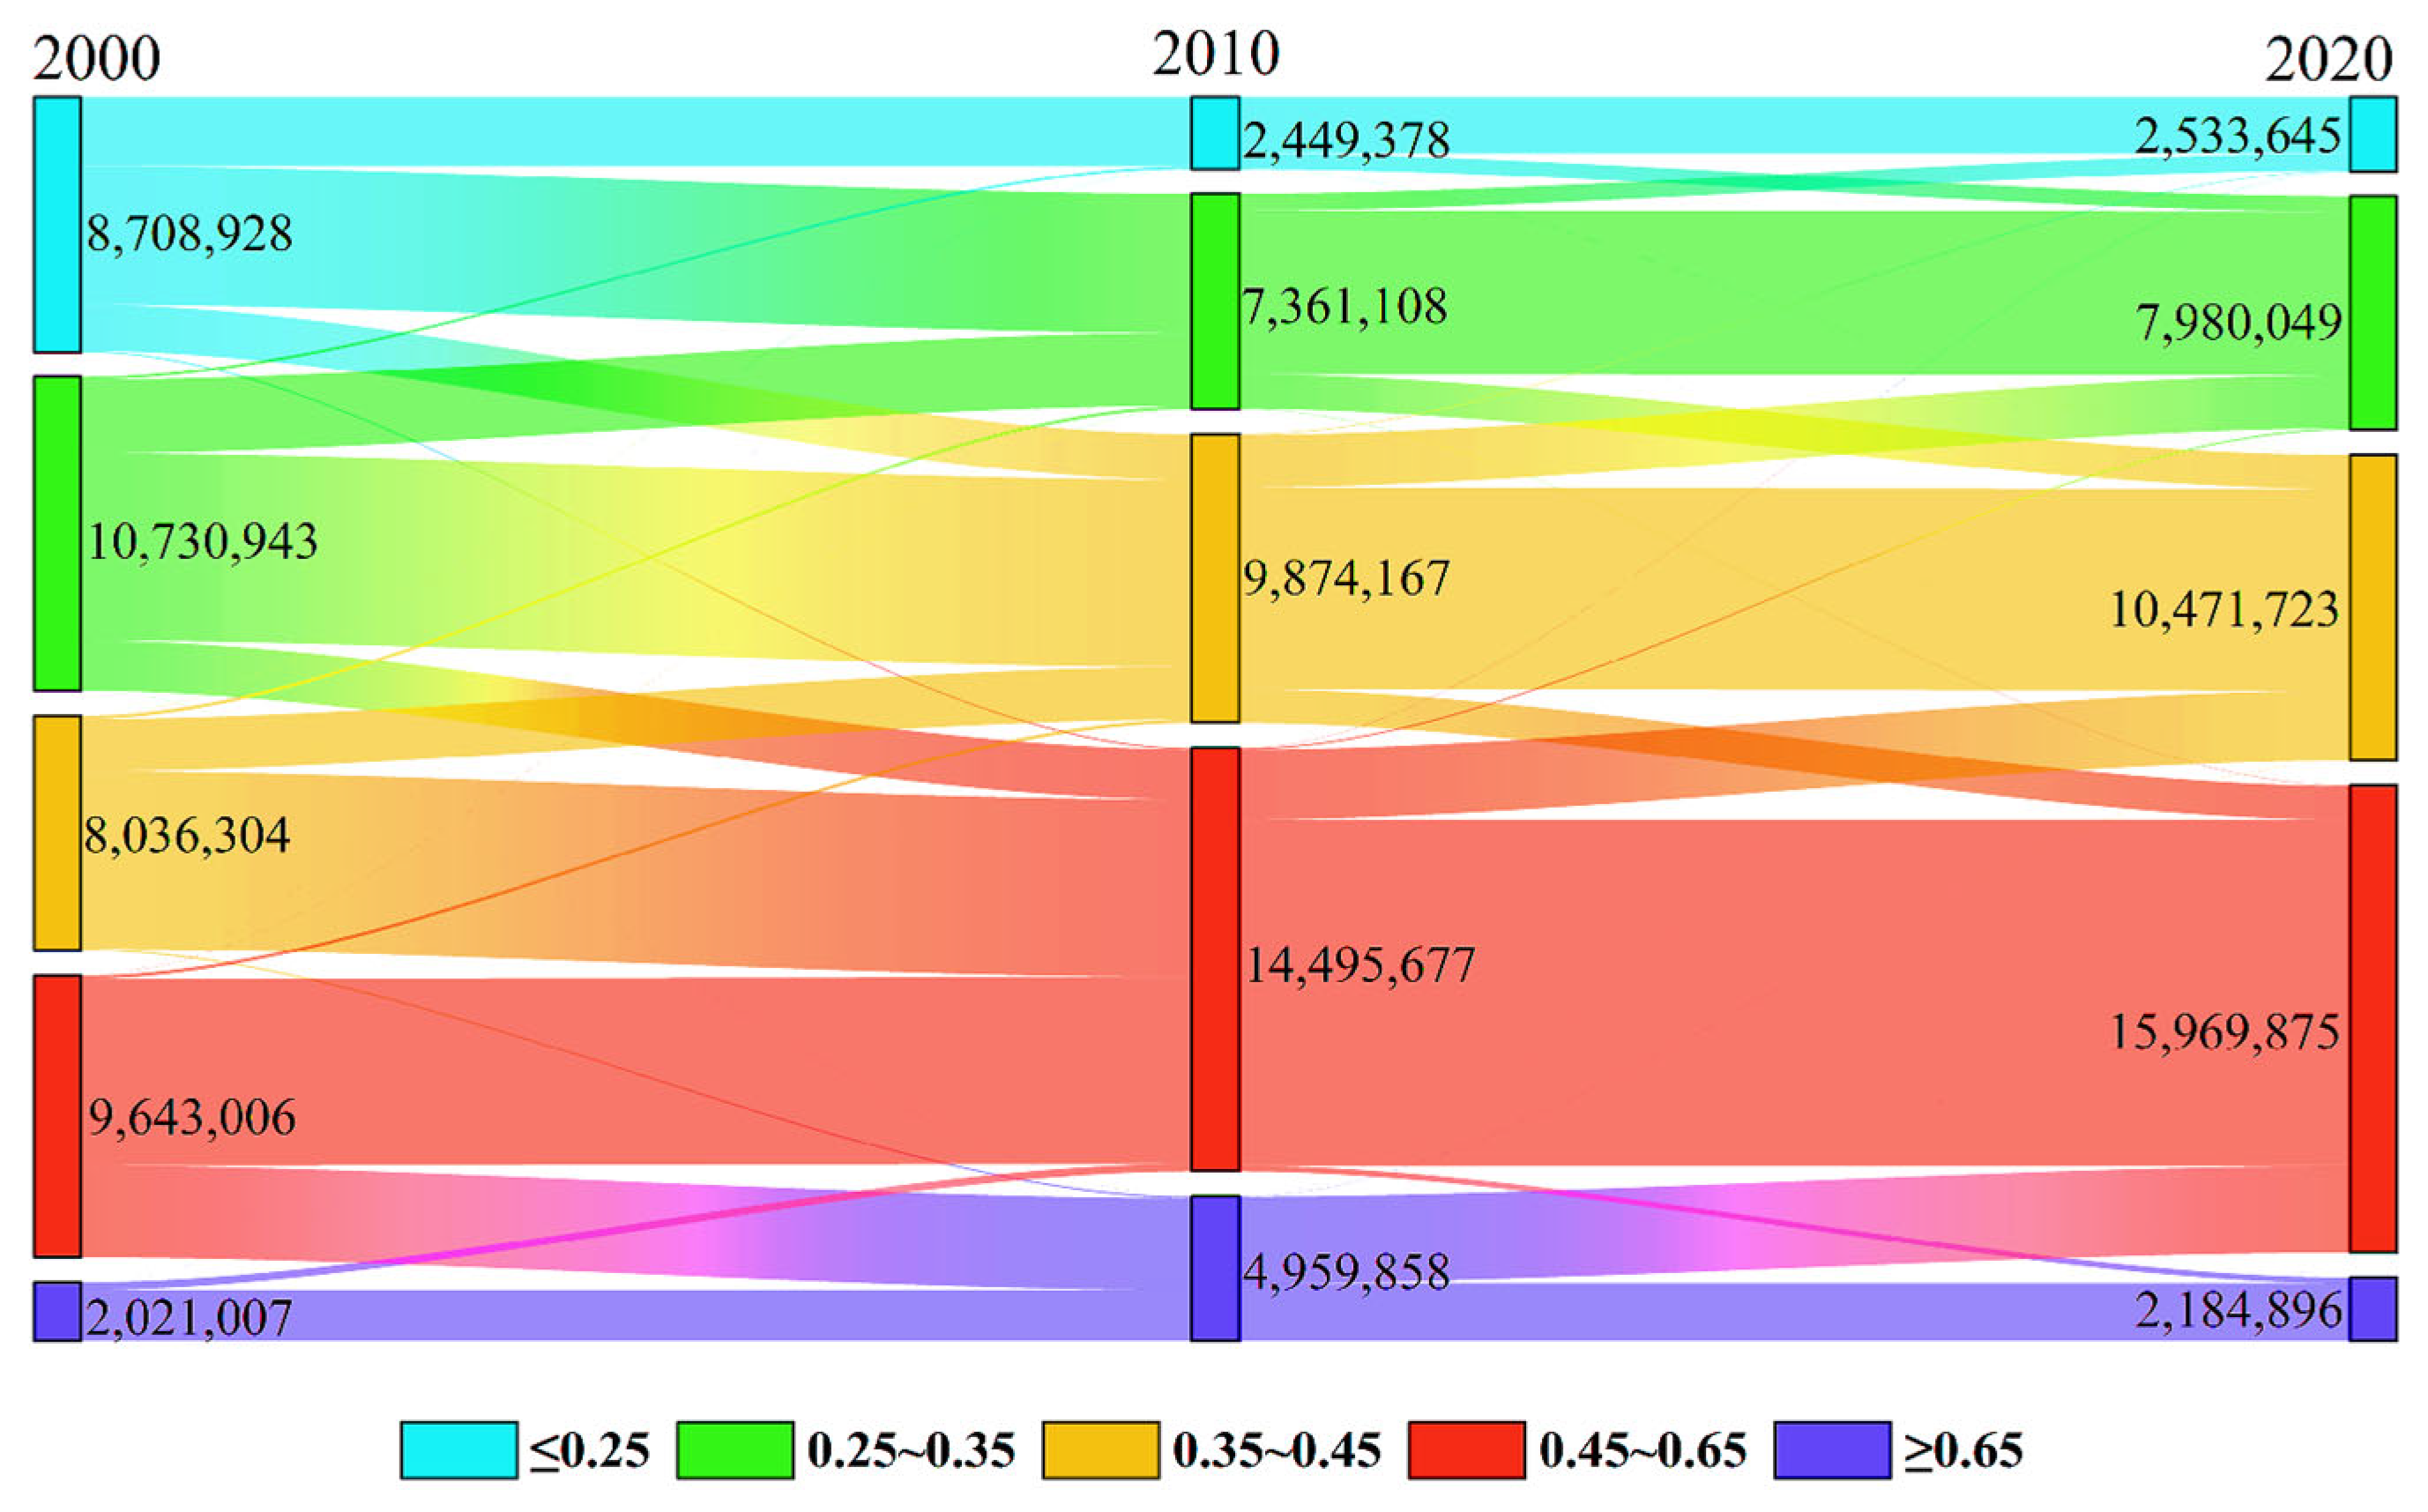
4.1. Spatiotemporal Changes in Vegetation Coverage
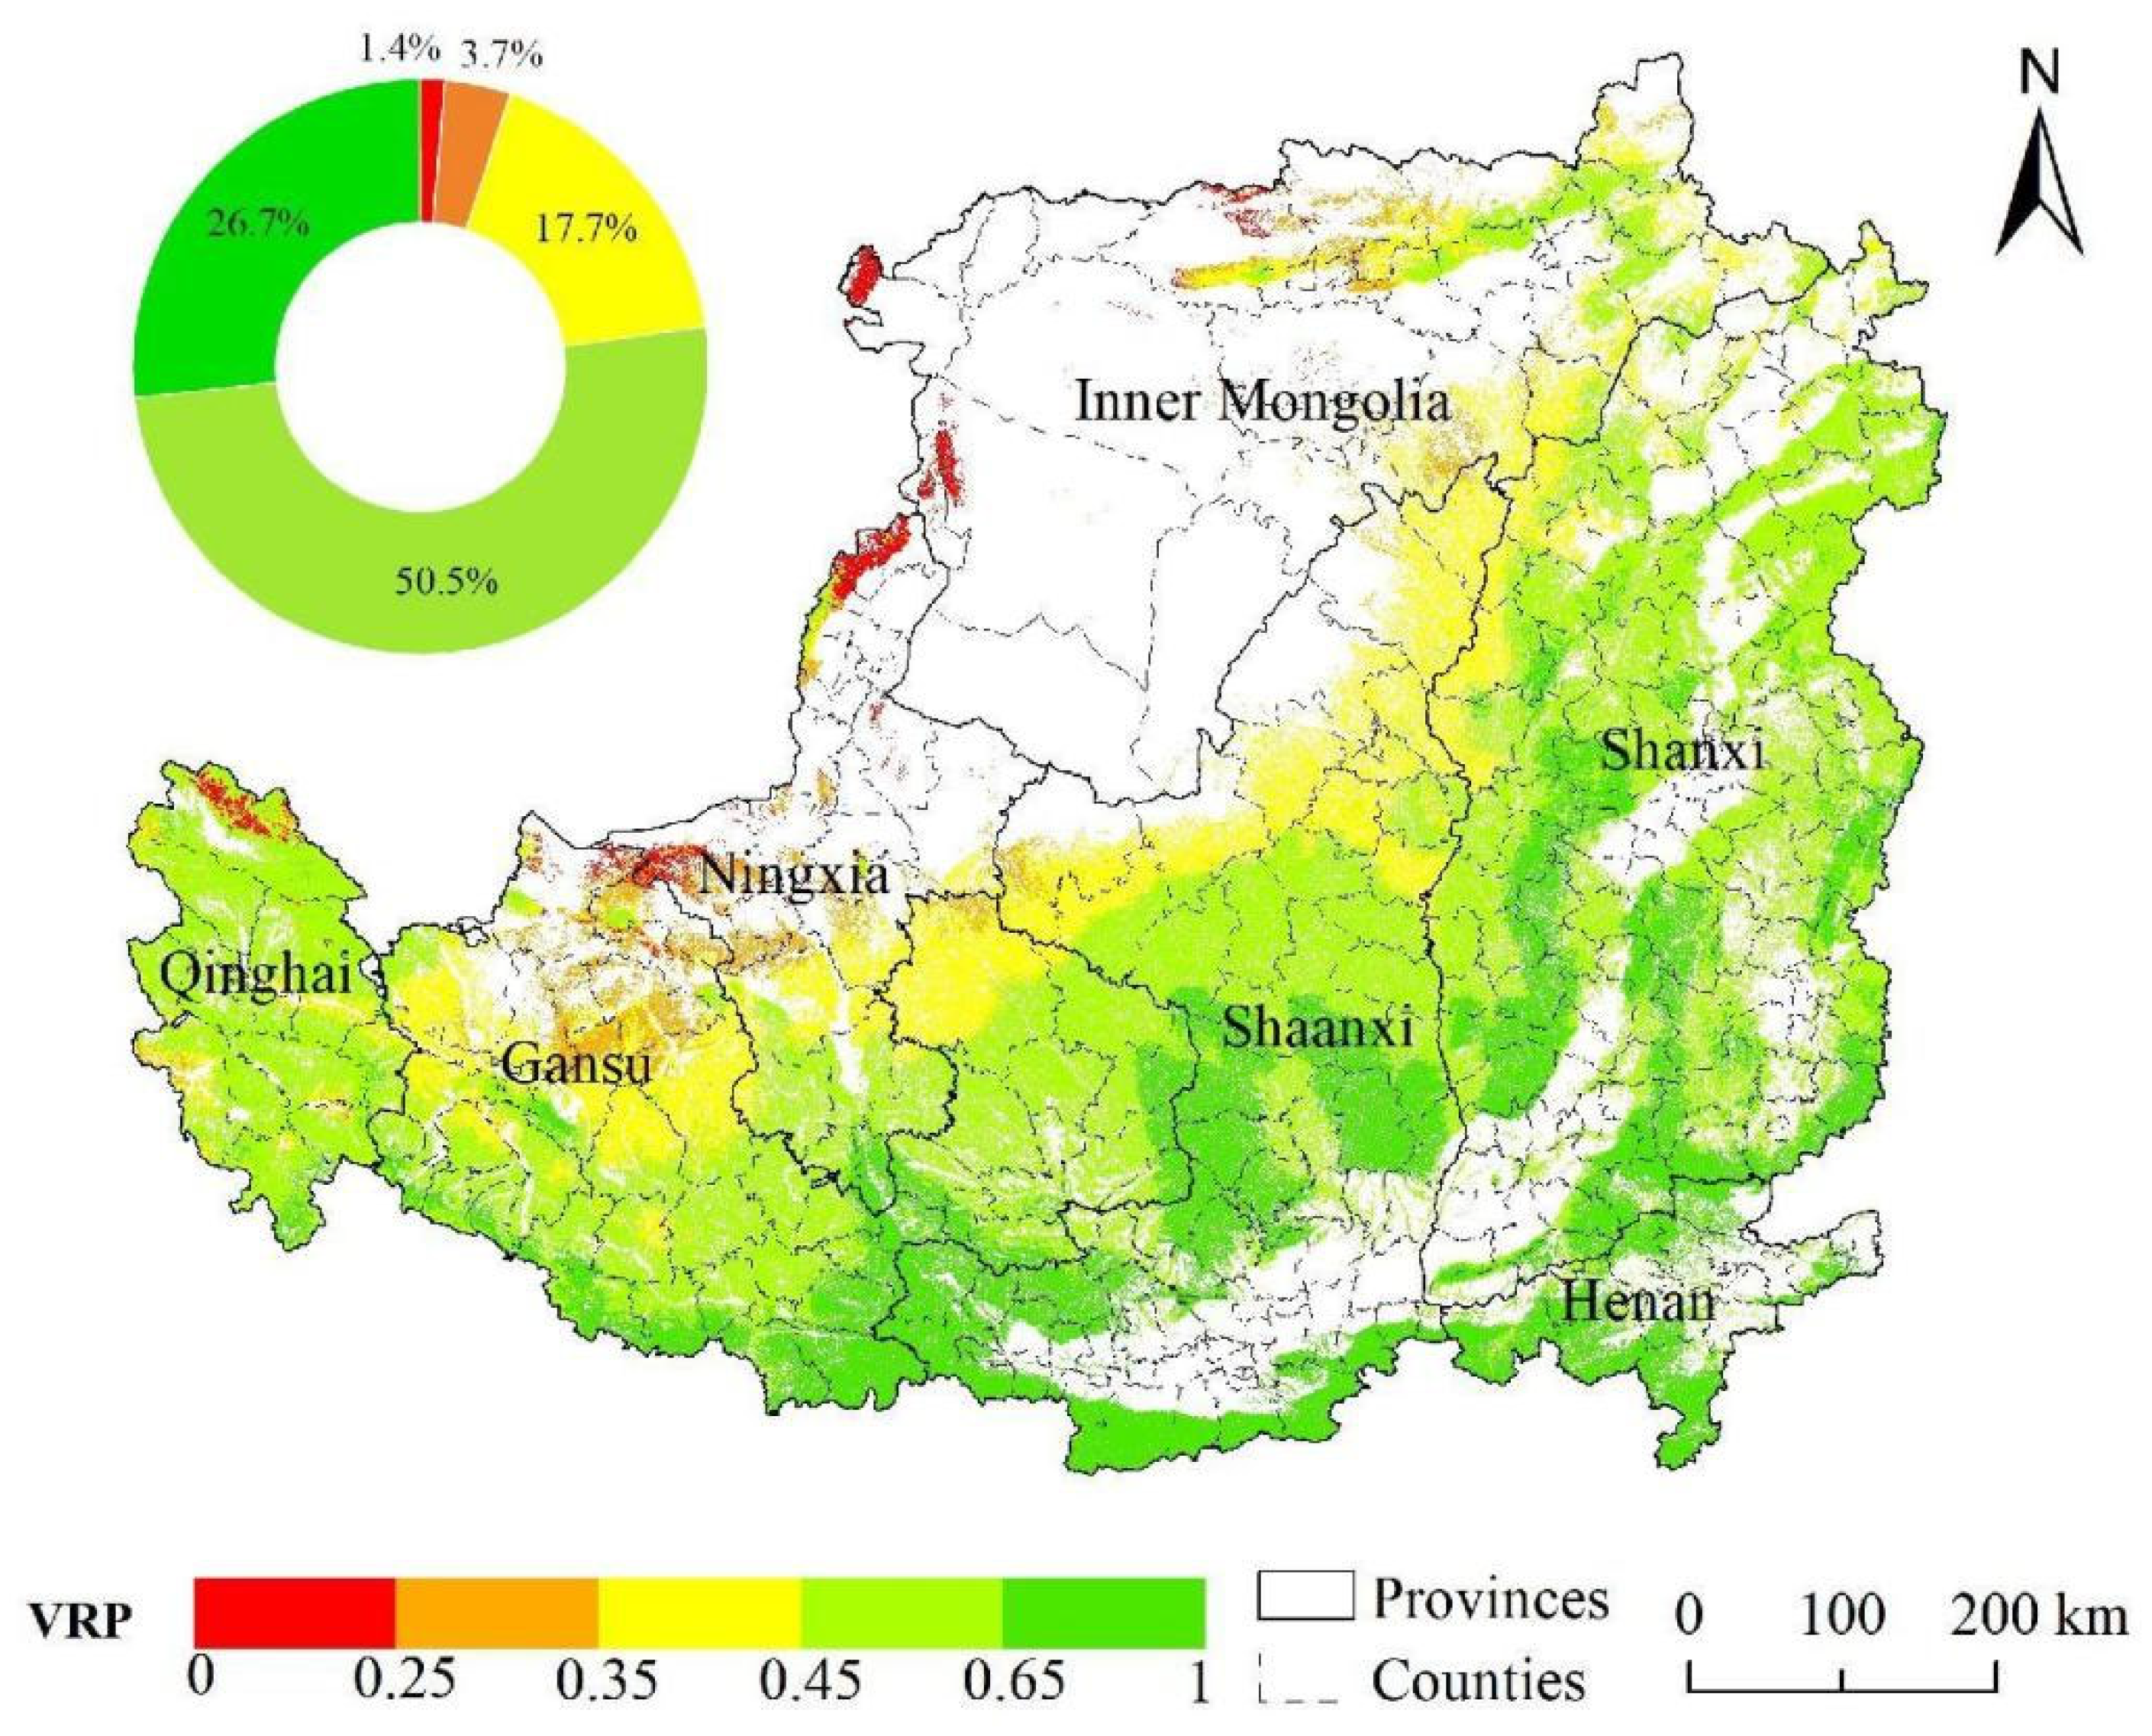
4.2. Vegetation Restoration Potential Based on Similar Habitat Units
4.3. Assessment of Vegetation Restoration Potential Realization Degree
4.4. Analysis of Vegetation Restoration Potential Influencing Factors and Spatial Spillover Effect
4.4.1. Analysis of Influencing Factors
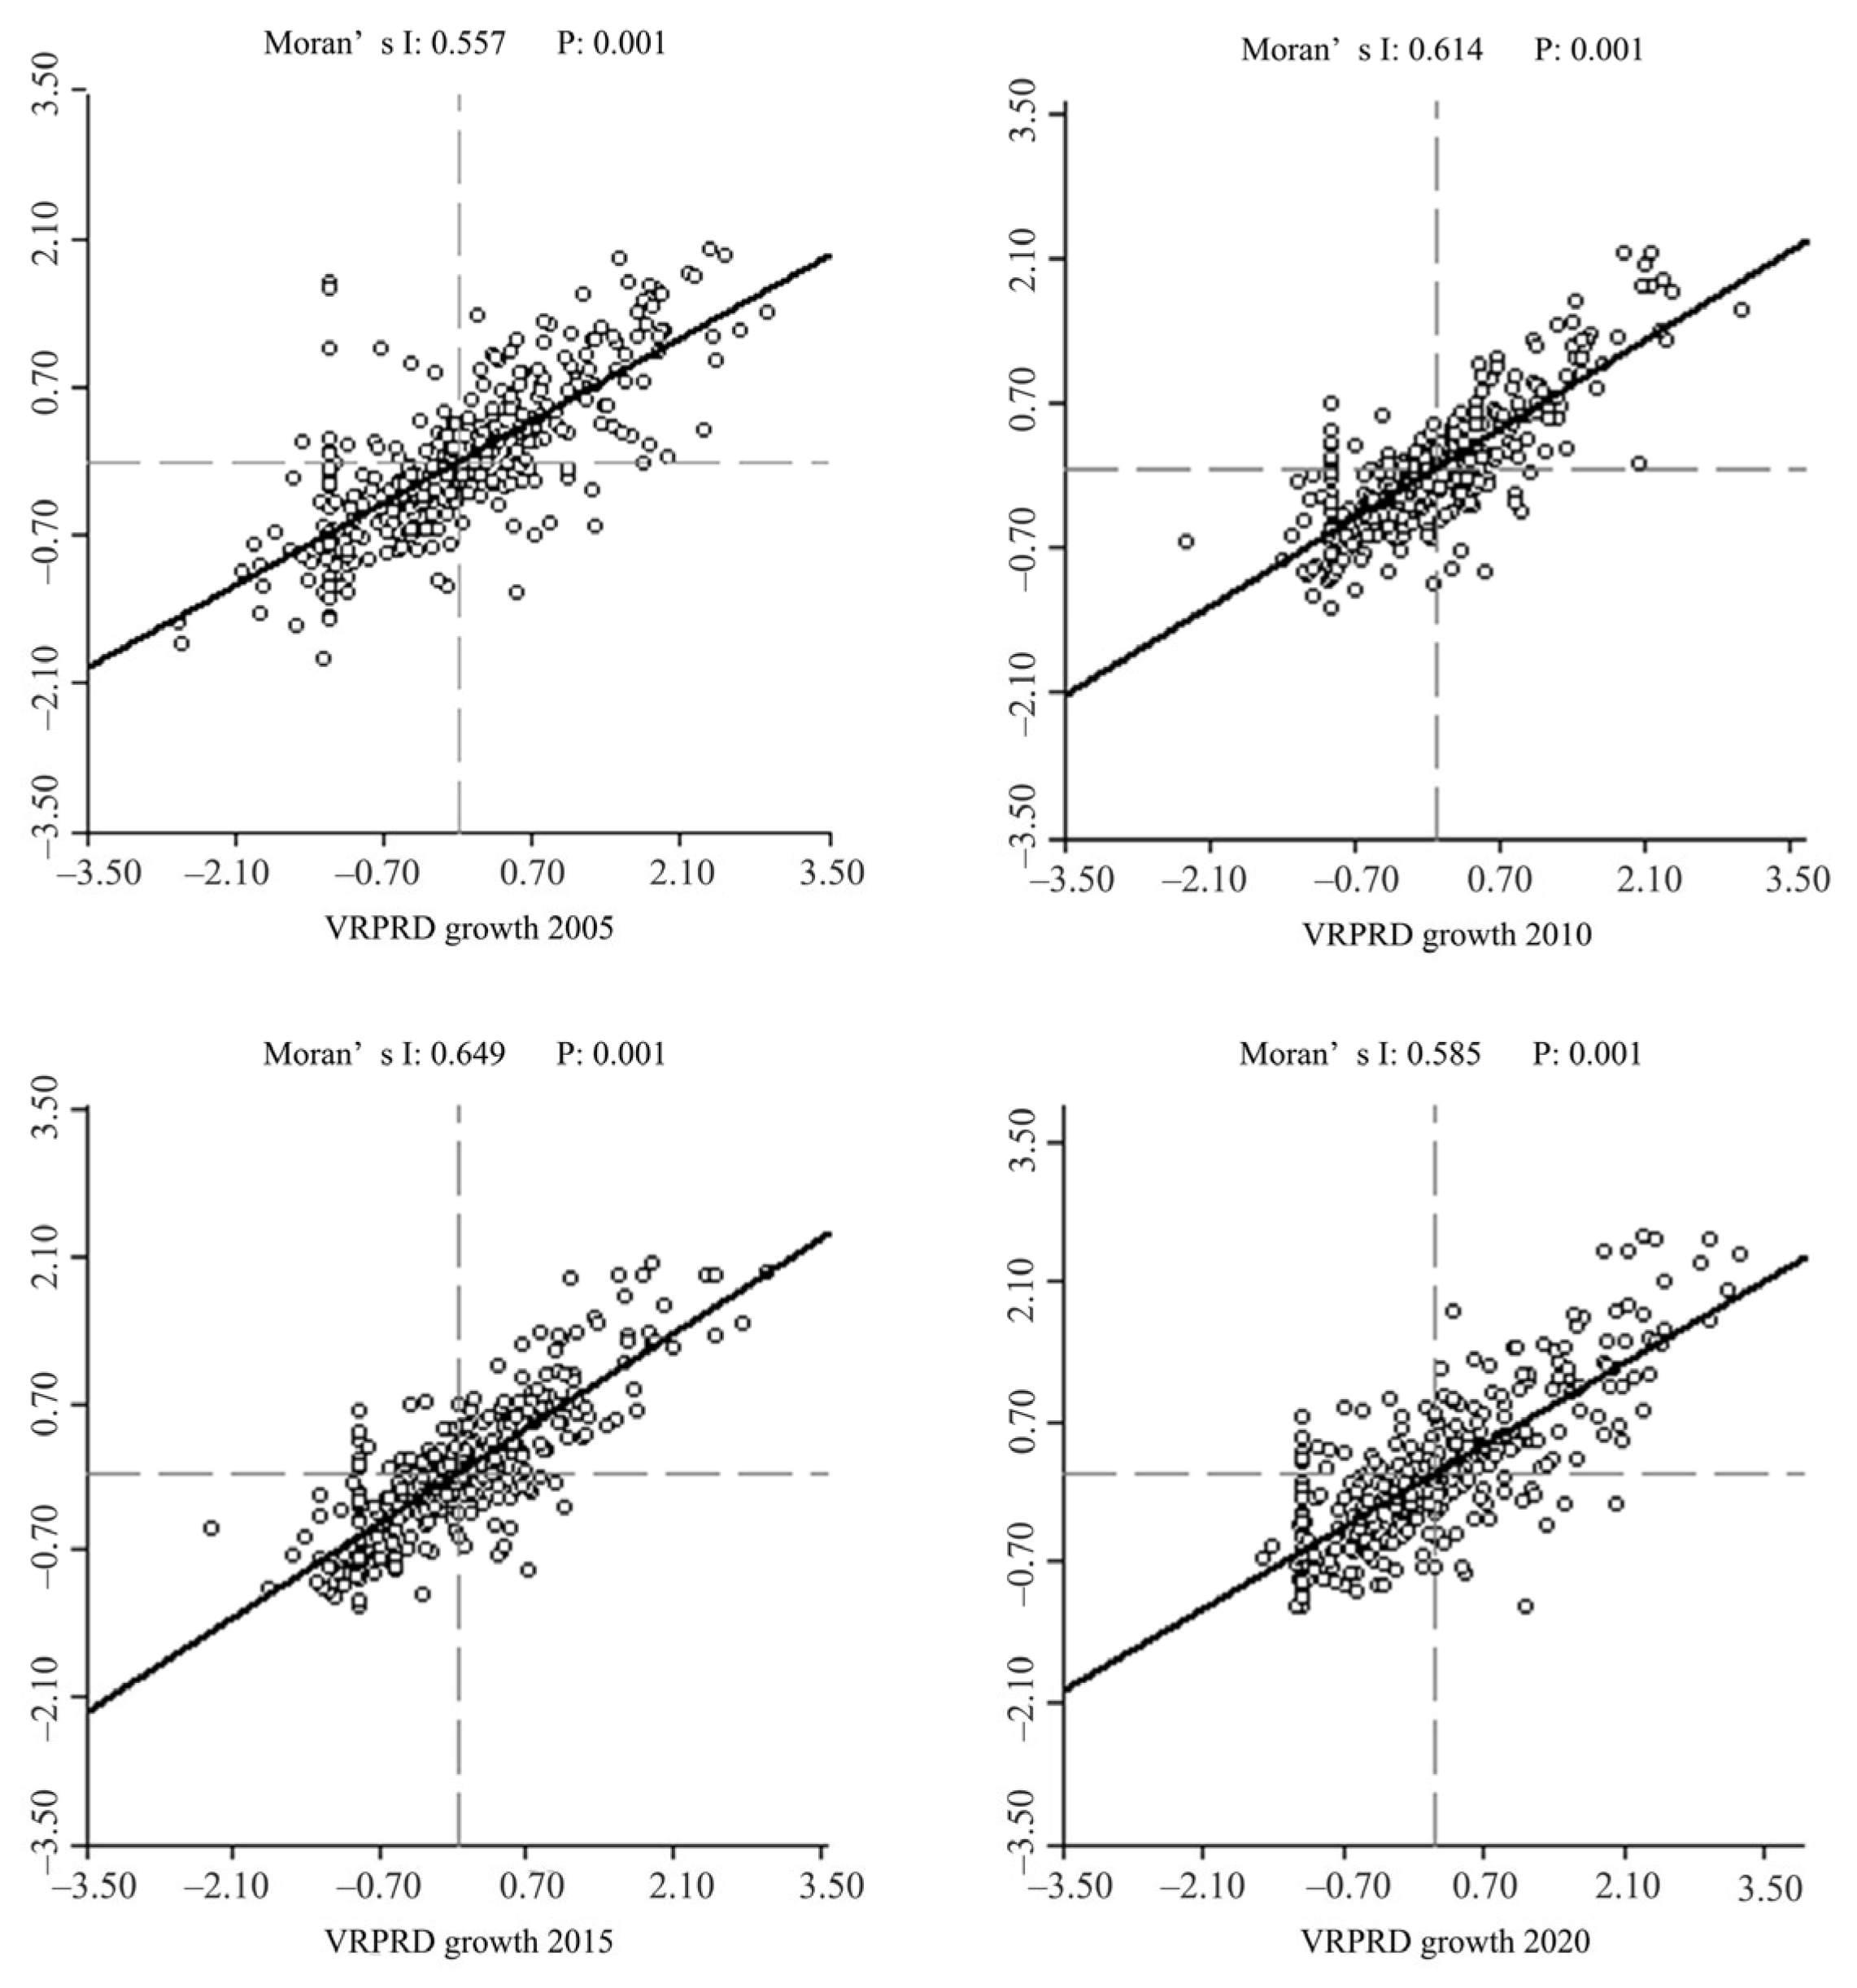
4.4.2. Exploration of Spatial Autocorrelation
4.4.3. Model Selection for Spatial Econometric
4.4.4. Results Analysis of the Spatial Dubin Model
5. Discussion
5.1. Evaluation of the Grain for Green Program’s Effects on the Loess Plateau
5.2. Spatial Dependence of Vegetation Restoration Effect
5.3. Policy Recommendations
5.4. Limitations and Prospects
6. Conclusions
Author Contributions
Funding
Data Availability Statement
Acknowledgments
Conflicts of Interest
References
- Marques, A.; Martins, I.S.; Kastner, T.; Plutzar, C.; Theurl, M.C.; Eisenmenger, N.; Huijbregts, M.A.J.; Wood, R.; Stadler, K.; Bruckner, M.; et al. Increasing impacts of land use on biodiversity and carbon sequestration driven by population and economic growth. Nat. Ecol. Evol. 2019, 3, 628–637. [Google Scholar] [CrossRef]
- Zhang, M.; Tan, S.; Liang, J.; Zhang, C.; Chen, E. Predicting the impacts of urban development on urban thermal environment using machine learning algorithms in Nanjing, China. J. Environ. Manag. 2024, 356, 120560. [Google Scholar] [CrossRef] [PubMed]
- Lyu, R.; Zhang, J.; Xu, M.; Li, J. Impacts of urbanization on ecosystem services and their temporal relations: A case study in Northern Ningxia, China. Land Use Policy 2018, 77, 163–173. [Google Scholar] [CrossRef]
- Zhang, M.; Tan, S.; Zhang, C.; Han, S.; Zou, S.; Chen, E. Assessing the impact of fractional vegetation cover on urban thermal environment: A case study of Hangzhou, China. Sustain. Cities Soc. 2023, 96, 104663. [Google Scholar] [CrossRef]
- He, J.; Shi, X.; Fu, Y.; Yuan, Y. Evaluation and simulation of the impact of land use change on ecosystem services trade-offs in ecological restoration areas, China. Land Use Policy 2022, 99, 105020. [Google Scholar] [CrossRef]
- Cao, Y.; Xie, Z.; Woodgate, W.; Ma, X.; Cleverly, J.; Pang, Y.; Qin, F.; Huete, A. Ecohydrological decoupling of water storage and vegetation attributed to China’s large-scale ecological restoration programs. J. Hydrol. 2022, 615, 128651. [Google Scholar] [CrossRef]
- Liu, T.; Zhang, S.; Tang, J.; Li, T. Comparison and analysis of agricultural and forest land changes in typical agricultural regions of northern mid-latitudes. Chin. Geogr. Sci. 2013, 23, 163–172. [Google Scholar] [CrossRef]
- Zhou, D.; Zhao, S.; Zhu, C. The Grain for Green Project induced land cover change in the Loess Plateau: A case study with Ansai County, Shanxi Province, China. Ecol. Indic. 2012, 23, 88–94. [Google Scholar] [CrossRef]
- Xu, X.; Zhang, D. Comparing the long-term effects of artificial and natural vegetation restoration strategies: A case-study of Wuqi and its adjacent counties in northern China. Land Degrad. Dev. 2021, 32, 3930–3945. [Google Scholar] [CrossRef]
- Feng, L.; Guo, M.; Wang, W.; Shi, Q.; Guo, W.; Lou, Y.; Zhu, Y.; Yang, H.; Xu, Y. Evaluation of the effects of long-term natural and artificial restoration on vegetation characteristics, soil properties and their coupling coordinations. Sci. Total Environ. 2023, 884, 163828. [Google Scholar] [CrossRef] [PubMed]
- Bennett, A.F.; Holland, G.J.; Haslem, A.; Stewart, A.; Radford, J.Q.; Clarke, R.H. Restoration promotes recovery of woodland birds in agricultural environments: A comparison of ‘revegetation’ and ‘remnant’ landscapes. J. Appl. Ecol. 2022, 59, 1334–1346. [Google Scholar] [CrossRef]
- Ramos, R.G.; Scarabello, M.; Soterroni, A.C.; Andrade, P.R.; Simões, R.; Ruivo, H.M.; Kraxner, F.; Ramos, F.M. Current policies are insufficient to protect or restore Brazil’s cost-effective conservation priority zones. Environ. Res. Lett. 2013, 18, 065006. [Google Scholar] [CrossRef]
- Mohseni, N.; Hosseinzadeh, S.R.; Sepehr, A.; Golzarian, M.R.; Shabani, F. Variations in spatial patterns of soil-vegetation properties and the emergence of multiple resilience thresholds within different debris flow fan positions. Geomorphology 2017, 290, 365–375. [Google Scholar] [CrossRef]
- Almalki, R.; Khaki, M.; Saco, P.M.; Rodriguez, J.F. Monitoring and Mapping Vegetation Cover Changes in Arid and Semi-Arid Areas Using Remote Sensing Technology: A Review. Remote Sens. 2022, 14, 5143. [Google Scholar] [CrossRef]
- Lawley, V.; Lewis, M.; Clarke, K.; Ostendorf, B. Site-based and remote sensing methods for monitoring indicators of vegetation condition: An Australian review. Ecol. Indic. 2016, 60, 1273–1283. [Google Scholar] [CrossRef]
- Yin, H.; Pflugmacher, D.; Li, A.; Li, Z.; Hostert, P. Land use and land cover change in Inner Mongolia—Understanding the effects of China’s re-vegetation programs. Remote Sens. Environ. 2018, 204, 918–930. [Google Scholar] [CrossRef]
- Chen, R.; Yin, G.; Liu, G.; Li, J.; Verger, A. Evaluation and Normalization of Topographic Effects on Vegetation Indices. Remote Sens. 2020, 12, 2290. [Google Scholar] [CrossRef]
- Qiu, B.; Zeng, C.; Tang, Z.; Chen, C. Characterizing spatiotemporal non-stationarity in vegetation dynamics in China using MODIS EVI dataset. Env. Monit Assess. 2013, 185, 9019–9035. [Google Scholar] [CrossRef] [PubMed]
- Gensheimer, J.; Turner, A.J.; Köhler, P.; Frankenberg, C.; Chen, J. A convolutional neural network for spatial downscaling of satellite-based solar-induced chlorophyll fluorescence (SIFnet). Biogeosciences 2022, 19, 1777–1793. [Google Scholar] [CrossRef]
- Wang, X.; Biederman, J.A.; Knowles, J.F.; Scott, R.L.; Turner, A.J.; Dannenberg, M.P.; Köhler, P.; Frankenberg, C.; Litvak, M.E.; Flerchinger, G.N.; et al. Satellite solar-induced chlorophyll fluorescence and near-infrared reflectance capture complementary aspects of dryland vegetation productivity dynamics. Remote Sens. Environ. 2022, 270, 112858. [Google Scholar] [CrossRef]
- Liu, Y.; Zhang, R.; Huang, Z.; Cheng, Z.; López-Vicente, M.; Ma, X.; Wu, G. Solar photovoltaic panels significantly promote vegetation recovery by modifying the soil surface microhabitats in an arid sandy ecosystem. Land Degrad. Dev. 2019, 30, 2177–2186. [Google Scholar] [CrossRef]
- Yu, Y.; Zhao, W.; Martinez-Murillo, J.F.; Pereira, P. Loess Plateau: From degradation to restoration. Sci. Total Environ. 2022, 738, 140206. [Google Scholar] [CrossRef]
- Li, W.; Wang, W.; Chen, J.; Zhang, Z. Assessing effects of the Returning Farmland to Forest Program on vegetation cover changes at multiple spatial scales: The case of northwest Yunnan, China. J. Environ. Manag. 2022, 304, 114303. [Google Scholar] [CrossRef] [PubMed]
- Miyasaka, T.; Okuro, T.; Miyamori, E.; Zhao, X.; Takeuchi, K. Effects of different restoration measures and sand dune topography on short- and long-term vegetation restoration in northeast China. J. Arid Environ. 2014, 111, 1–6. [Google Scholar] [CrossRef]
- Chen, L.; Zhang, H.; Zhang, X.; Liu, P.; Zhang, W.; Ma, X. Vegetation changes in coal mining areas: Naturally or anthropogenically Driven? CATENA 2022, 208, 105712. [Google Scholar] [CrossRef]
- Tobler, W.R. A computer movie simulating urban growth in the Detroit region. Econ. Geogr. 1970, 46, 234–240. [Google Scholar] [CrossRef]
- Zhu, A.; Lu, G.; Liu, J.; Qin, C.; Zhou, C. Spatial prediction based on Third Law of Geography. Ann. GIS 2018, 24, 225–240. [Google Scholar] [CrossRef]
- Xu, X.; Zhang, D.; Zhang, Y.; Yao, S.; Zhang, J. Evaluating the vegetation restoration potential achievement of ecological projects: A case study of Yan’an, China. Land Use Policy 2020, 90, 104293. [Google Scholar] [CrossRef]
- Xiu, L.; Yan, C.; Li, X.; Qian, D.; Feng, K. Monitoring the response of vegetation dynamics to ecological engineering in the Mu Us Sandy Land of China from 1982 to 2014. Environ. Monit. Assess. 2018, 190, 543. [Google Scholar] [CrossRef] [PubMed]
- Zhang, D.; Ren, N.; Hou, X. An improved logistic regression model based on a spatially weighted technique (ILRBSWT v1.0) and its application to mineral prospectivity mapping. Geosci. Model Dev. 2018, 11, 2525–2539. [Google Scholar] [CrossRef]
- Zhu, Y.; Jia, X.; Qiao, J.; Shao, M. What is the mass of loess in the Loess Plateau of China? Sci. Bull. 2019, 64, 534–539. [Google Scholar] [CrossRef] [PubMed]
- Liu, Z.; Shao, M.; Wang, Y. Effect of environmental factors on regional soil organic carbon stocks across the Loess Plateau region, China. Agric. Ecosyst. Environ. 2011, 142, 184–194. [Google Scholar] [CrossRef]
- Cheng, Q.; Wu, X.Q.; Wei, L.F. 30-year Average Monthly/1-km Climate Variable Dataset of China (1951–1980, 1981–2010). J. Glob. Change Data Discov. 2022, 6, 533–544. [Google Scholar]
- Bi, X.; Wang, H.; Zhou, R. The Influence of Landscape Features on Road Development in a Loess Region, China. Environ. Manag. 2011, 48, 774–780. [Google Scholar] [CrossRef] [PubMed]
- Yang, J.; Huang, X. The 30 m annual land cover dataset and its dynamics in China from 1990 to 2019. Earth Syst. Sci. Data 2021, 13, 3907–3925. [Google Scholar] [CrossRef]
- Bisson, M.; Fornaciai, A.; Coli, A.; Mazzarini, F.; Pareschi, M.T. The Vegetation Resilience After Fire (VRAF) index: Development, implementation and an illustration from central Italy. Int. J. Appl. Earth Obs. Geoinf. 2008, 10, 312–329. [Google Scholar] [CrossRef]
- He, D.; Yi, G.; Zhang, T.; Miao, J.; Li, J.; Bie, X. Temporal and Spatial Characteristics of EVI and Its Response to Climatic Factors in Recent 16 years Based on Grey Relational Analysis in Inner Mongolia Autonomous Region, China. Remote Sens. 2018, 10, 961. [Google Scholar] [CrossRef]
- Qu, S.; Wang, L.; Lin, A.; Yu, D.; Yuan, M.; Li, C. Distinguishing the impacts of climate change and anthropogenic factors on vegetation dynamics in the Yangtze River Basin, China. Ecol. Indic. 2020, 108, 105724. [Google Scholar] [CrossRef]
- Anselin, L. Spatial Econometrics: Methods and Models. Econ. Geogr. 1989, 65, 160–162. [Google Scholar]
- Hao, Y.; Liu, Y.M. The influential factors of urban PM2.5 concentrations in China: A spatial econometric analysis. J. Clean. Prod. 2016, 112, 1443–1453. [Google Scholar] [CrossRef]
- Zhang, D.; Jia, Q.; Xu, X.; Yao, S.; Chen, H.; Hou, X. Contribution of ecological policies to vegetation restoration: A case study from Wuqi County in Shaanxi Province, China. Land Use Policy 2018, 73, 400–411. [Google Scholar] [CrossRef]
- Cao, Z.; Li, Y.; Liu, Y.; Chen, Y.; Wang, Y. When and where did the Loess Plateau turn “green”? Analysis of the tendency and breakpoints of the normalized difference vegetation index. Land Degrad. Dev. 2018, 29, 162–175. [Google Scholar] [CrossRef]
- Wang, Z.; Fu, B.; Wu, X.; Wang, S.; Li, Y.; Feng, Y.; Zhang, L.; Hu, Y.; Cheng, L.; Li, B. Distinguishing Trajectories and Drivers of Vegetated Ecosystems in China’s Loess Plateau. Earth’s Future 2024, 12, e2023EF003769. [Google Scholar] [CrossRef]
- Yuan, Z.; Xu, J.J.; Chen, J.; Wang, Y.Q.; Yin, J. EVI Indicated Spatial-Temporal Variations in Vegetation and Their Responses to Climatic and Anthropogenic Factors in the Chinese Mainland Since 2000s. J. Environ. Inform. 2022, 40, 157–175. [Google Scholar] [CrossRef]
- Deng, Y.; Jia, L.; Guo, Y.; Li, H.; Yao, S.; Chu, L.; Lu, W.; Hou, M.; Mo, B.; Wang, Y.; et al. Evaluation of the ecological effects of ecological restoration programs: A case study of the sloping land conversion program on the Loess Plateau, China. Int. J. Environ. Res. Public Health 2022, 19, 7841. [Google Scholar] [CrossRef]
- Deng, Y.; Luo, J.; Wang, Y.; Jiao, C.; Yi, X.; Su, X.; Li, H.; Yao, S. Eco-efficiency evaluation of Sloping Land Conversion Program and its spatial and temporal evolution: Evidence from 314 counties in the Loess Plateau of China. Forests 2023, 14, 681. [Google Scholar] [CrossRef]
- Chen, H.; Shao, L.; Zhao, M.; Zhang, X.; Zhang, D. Grassland conservation programs, vegetation rehabilitation and spatial dependency in Inner Mongolia, China. Land Use Policy 2017, 64, 429–439. [Google Scholar] [CrossRef]
- He, J. Governing forest restoration: Local case studies of sloping land conversion program in Southwest China. For. Policy Econ. 2014, 46, 30–38. [Google Scholar] [CrossRef]
- Wang, Y.; Li, F.; Wang, J.; Cao, H.; Li, M. The social-ecological benefits of grain for green program based on coupled coordination network: Taking the China’s Loess Plateau as an example. Land Use Policy 2024, 143, 107211. [Google Scholar] [CrossRef]
- Wang, S.; Wei, G.; Gao, M.; Fan, Y. Investigating the mechanism of urbanization on the net primary productivity of vegetation in the Yangtze River Economic Belt: A comprehensive analysis from global and local effects. Front. Ecol. Evol. 2023, 11, 1231487. [Google Scholar] [CrossRef]
- Qin, J.; Liu, C.; Ai, N.; Zhou, Y.; Tuo, X.; Nan, Z.; Shi, J.; Yuan, C. Community Characteristics and Niche Analysis of Soil Animals in Returning Farmland to Forest Areas on the Loess Plateau. Land 2022, 11, 1958. [Google Scholar] [CrossRef]
- Chen, H.; Fleskens, L.; Moolenaar, S.W.; Ritsema, C.J.; Wang, F. Stakeholders’ Perceptions towards Land Restoration and Its Impacts on Ecosystem Services: A Case Study in the Chinese Loess Plateau. Land 2022, 11, 2076. [Google Scholar] [CrossRef]
- Zhang, Z.; Lu, W.X.; Zhao, Y.; Song, W.B. Development tendency analysis and evaluation of the water ecological carrying capacity in the Siping area of Jilin Province in China based on system dynamics and analytic hierarchy process. Ecol. Model. 2014, 275, 9–21. [Google Scholar] [CrossRef]
- Deng, Y.; Cai, W.; Hou, M.; Zhang, X.; Xu, S.; Yao, N.; Guo, Y.; Li, H.; Yao, S. How Eco-Efficiency Is the Forestry Ecological Restoration Program? The Case of the Sloping Land Conversion Program in the Loess Plateau, China. Land 2022, 11, 712. [Google Scholar] [CrossRef]


| Variable Type | Variable | EVI Growth Rate | VRPRD Growth Rate |
|---|---|---|---|
| Meteorological variables | Temp | 0.160 *** | 0.080 *** |
| Prec | −0.026 | 0.035 | |
| Sunp | 0.062 ** | 0.060 *** | |
| Socioeconomic variables | R&D | −0.022 ** | −0.020 *** |
| Intensity | 0.139 *** | 0.183 *** |
| Variable | SDM VRPRD Growth | SEM VRPRD Growth | SLM VRPRD Growth |
|---|---|---|---|
| Intensity | 0.160 *** | 0.166 *** | 0.164 *** |
| R&D | −0.001 | 0.003 | −0.001 |
| Temp | 0.183 *** | 0.169 *** | 0.055 *** |
| Prec | −0.161 *** | −0.114 *** | −0.018 |
| Sunp | 0.057 ** | 0.050 ** | 0.050 *** |
| W × Intensity | −0.105 *** | ||
| W × R&D | −0.017 ** | ||
| W × Temp | −0.194 *** | ||
| W × Prec | 0.180 *** | ||
| W × Sunp | −0.054 | ||
| rho | 0.809 *** | 0.824 *** | 0.805 *** |
| sigma2 | 0.006 *** | 0.006 *** | 0.006 *** |
| N | 341 | 341 | 341 |
| Variable | Direct Effect | Indirect Effect | Total Effect |
|---|---|---|---|
| Intensity | 0.376 *** | −0.607 *** | −0.231 |
| R&D | −0.035 ** | −0.180 *** | −0.215 *** |
| Temp | −0.187 ** | 0.265 ** | 0.078 |
| Prec | 1.205 *** | −0.182 | 1.023 *** |
| Sunp | 0.670 *** | −0.487 *** | 0.182 ** |
Disclaimer/Publisher’s Note: The statements, opinions and data contained in all publications are solely those of the individual author(s) and contributor(s) and not of MDPI and/or the editor(s). MDPI and/or the editor(s) disclaim responsibility for any injury to people or property resulting from any ideas, methods, instructions or products referred to in the content. |
© 2025 by the authors. Licensee MDPI, Basel, Switzerland. This article is an open access article distributed under the terms and conditions of the Creative Commons Attribution (CC BY) license (https://creativecommons.org/licenses/by/4.0/).
Share and Cite
Wang, C.; Han, L.; He, Y.; Zhang, Y.; Zhang, M. Analysis of Vegetation Restoration Potential and Its Influencing Factors on the Loess Plateau: Based on the Potential Realization Model and Spatial Dubin Model. Land 2025, 14, 138. https://doi.org/10.3390/land14010138
Wang C, Han L, He Y, Zhang Y, Zhang M. Analysis of Vegetation Restoration Potential and Its Influencing Factors on the Loess Plateau: Based on the Potential Realization Model and Spatial Dubin Model. Land. 2025; 14(1):138. https://doi.org/10.3390/land14010138
Chicago/Turabian StyleWang, Chao, Lili Han, Youjun He, Yu Zhang, and Maomao Zhang. 2025. "Analysis of Vegetation Restoration Potential and Its Influencing Factors on the Loess Plateau: Based on the Potential Realization Model and Spatial Dubin Model" Land 14, no. 1: 138. https://doi.org/10.3390/land14010138
APA StyleWang, C., Han, L., He, Y., Zhang, Y., & Zhang, M. (2025). Analysis of Vegetation Restoration Potential and Its Influencing Factors on the Loess Plateau: Based on the Potential Realization Model and Spatial Dubin Model. Land, 14(1), 138. https://doi.org/10.3390/land14010138