Abstract
Forests are the largest carbon sinks in the world. They play a crucial role in mitigating climate change through carbon storage. Assessing carbon storage in forests is essential for policy formulation, management planning, and as a strategy to reduce the impacts of global warming. The aims of this research were to explore plant diversity, assess tree biomass, and evaluate carbon storage and carbon credits in urban forestry areas under the Thailand Voluntary Emission Reduction Program (T-VER). The study was conducted in the forested area of Rajamangala University of Technology Isan, Surin Campus, Thailand, and encompassed 60.96 ha. The methodology involved the creation of 10 temporary sample plots, each measuring 40 × 40 m. We then surveyed the species types and measured tree diameter at breast height (DBH) and the total height. Biomass was calculated using allometric equations and the stored carbon was quantified. In this study, we identified 85 species of plants. The analysis of tree biomass averaged 23,1781.25 kg/ha or 231.81 ton/ha. The carbon storage was estimated to be 108.94 tC/ha. When aggregating the data for the entire project, the total carbon storage amounted to 6851.55, with an equivalent carbon sequestration capacity of 25,122 tCO2e in the base year (baseline). We calculated that the carbon storage capacity could increase to 28,741.00 tCO2e with proper maintenance of the urban forest area over a 10-year period, equivalent to a carbon sequestration capacity of 3619 tCO2e. This would result in a carbon credit value equivalent to USD 90,475.
1. Introduction
The critical issues of global warming and climate change—primarily because of greenhouse gases (particularly carbon dioxide) resulting from human activities—have recently garnered attention from all sectors [1,2,3,4]. The World Meteorological Organization (WMO) has published documents confirming the statistical data on climate change. These data, which span from 1993 to the present, reveal the significant changes that serve as primary indicators of climatology and natural laws. There have been increases in temperatures both on land and in the sea as well as rising sea levels, higher acidity in the oceans, melting glaciers and sea ice, and shifts in precipitation patterns [5,6]. These changes have resulted in a greater frequency of severe natural disasters, such as floods, droughts, and wildfires, which affect human populations, social development, economic progress, migration and displacement, food security, and terrestrial and marine ecosystems [7].
Thailand was ranked 19th in the world for greenhouse gas emissions in 2023, accounting for 0.88% of global emissions. The energy sector alone contributed 69.06%. This placed Thailand ninth in terms of the long-term risk of influencing global climate change [8]. It is inevitable that Thailand will face severe global warming challenges. Maintaining forest resources is one strategy used to reduce atmospheric carbon dioxide because carbon is captured in the form of cellulose through the process of photosynthesis [9]. The absorbed carbon dioxide becomes part of the plant’s biomass as trees grow, both above and below the ground [10,11,12]. This process transforms carbon dioxide into simple sugars that form organic compounds such as cellulose, hemicellulose, and lignin; these then become major components of the wood [13]. If forests are preserved and not destroyed for timber, the carbon remains sequestered in the living trees. This ensures that the carbon is retained within the tree tissues over extended periods [14]. Forests help to maintain an environmental balance and are vital when addressing environmental issues. They are particularly effective at carbon sequestration, which may help to combat global warming [15,16].
In response to the impacts of carbon dioxide, several countries that are major emitters of greenhouse gases have convened to address the issue by valuing environmental damage in terms of financial compensation. This compensation is known as carbon credits [17,18]. Carbon credits represent the amount of greenhouse gases that are reduced or sequestered by various international and domestic greenhouse-gas-reduction mechanisms and are measured in tons of carbon dioxide equivalent (tCO2eq). These credits can be traded or sold and are used to report reduced emissions or to offset emissions from organizations, individuals, service activities, or manufacturing processes. These activities must be certified by an authoritative body according to recognized regulations or internationally comparable methodologies to ensure validity [19,20]. This role is facilitated in Thailand by the Thailand Greenhouse Gas Management Organization (TGO), which promotes the management of greenhouse gases in the country [21].
The TGO developed the Thailand Voluntary Emission Reduction Program (T-VER) in 2014 as a voluntary mechanism to encourage a reduction in greenhouse gas emissions within Thailand. Project developers can use the carbon credits generated from T-VER projects to engage in trading or selling. These credits can then be used by purchasers to offset their greenhouse gas emissions from organizations, products, individuals, or events or to report on corporate greenhouse-gas-reduction efforts, including in annual reports [22]. After participating in COP26, Thailand announced—together with the international community—that it would achieve carbon neutrality by 2050 and net zero emissions by 2065. The T-VER method will help Thailand to achieve these intentions.
Urban forestry is the management of urban trees using systematic planning and the integration of various scientific disciplines that consider fundamental characteristics, such as social factors and the quality of life of urban residents. Management extends to areas with individual trees, clusters of trees, or trees within densely populated zones, including streets, public parks, and intersections [23]. Urban forestry management considers the multiple benefits of trees [24]. The role of urban forestry differs between developed and developing countries. In industrialized nations, urban forestry focuses on improving the environmental quality and aesthetic benefits. In less-developed countries, it addresses basic needs, such as providing a primary energy source from the wood [25].
Urban trees have the potential to offer diverse benefits (including environmental quality enhancements) and act as productive elements. Urban forestry is increasingly valued because of the additional benefits provided by trees. These benefits include the development of recreational areas, the control of air pollution levels, such as PM10 and PM2.5 emissions, and absorbing greenhouse gases from the atmosphere [26]. Current research on the significant potential of carbon sequestration by public parks and street trees in mitigating climate change in Thailand’s capital city is scarce. Furthermore, there is a notable absence of studies that explore the economic implications of climate change mitigation, especially in urban communities located in remote provinces away from metropolitan areas [27,28]. The aims of this research were to explore plant diversity, assess tree biomass, and evaluate carbon storage and carbon credits in urban forestry areas. Our case study used the forested area of Rajamangala University of Technology Isan, Surin Campus. We aimed to determine how the trees in the study area could help to reduce global warming through carbon capture and sequestration. We promoted tree planting to increase carbon storage for the sustainability of an ecological balance. We also considered the implementation of the carbon credit project of the Thailand Voluntary Emission Reduction Program (T-VER).
2. Materials and Methods
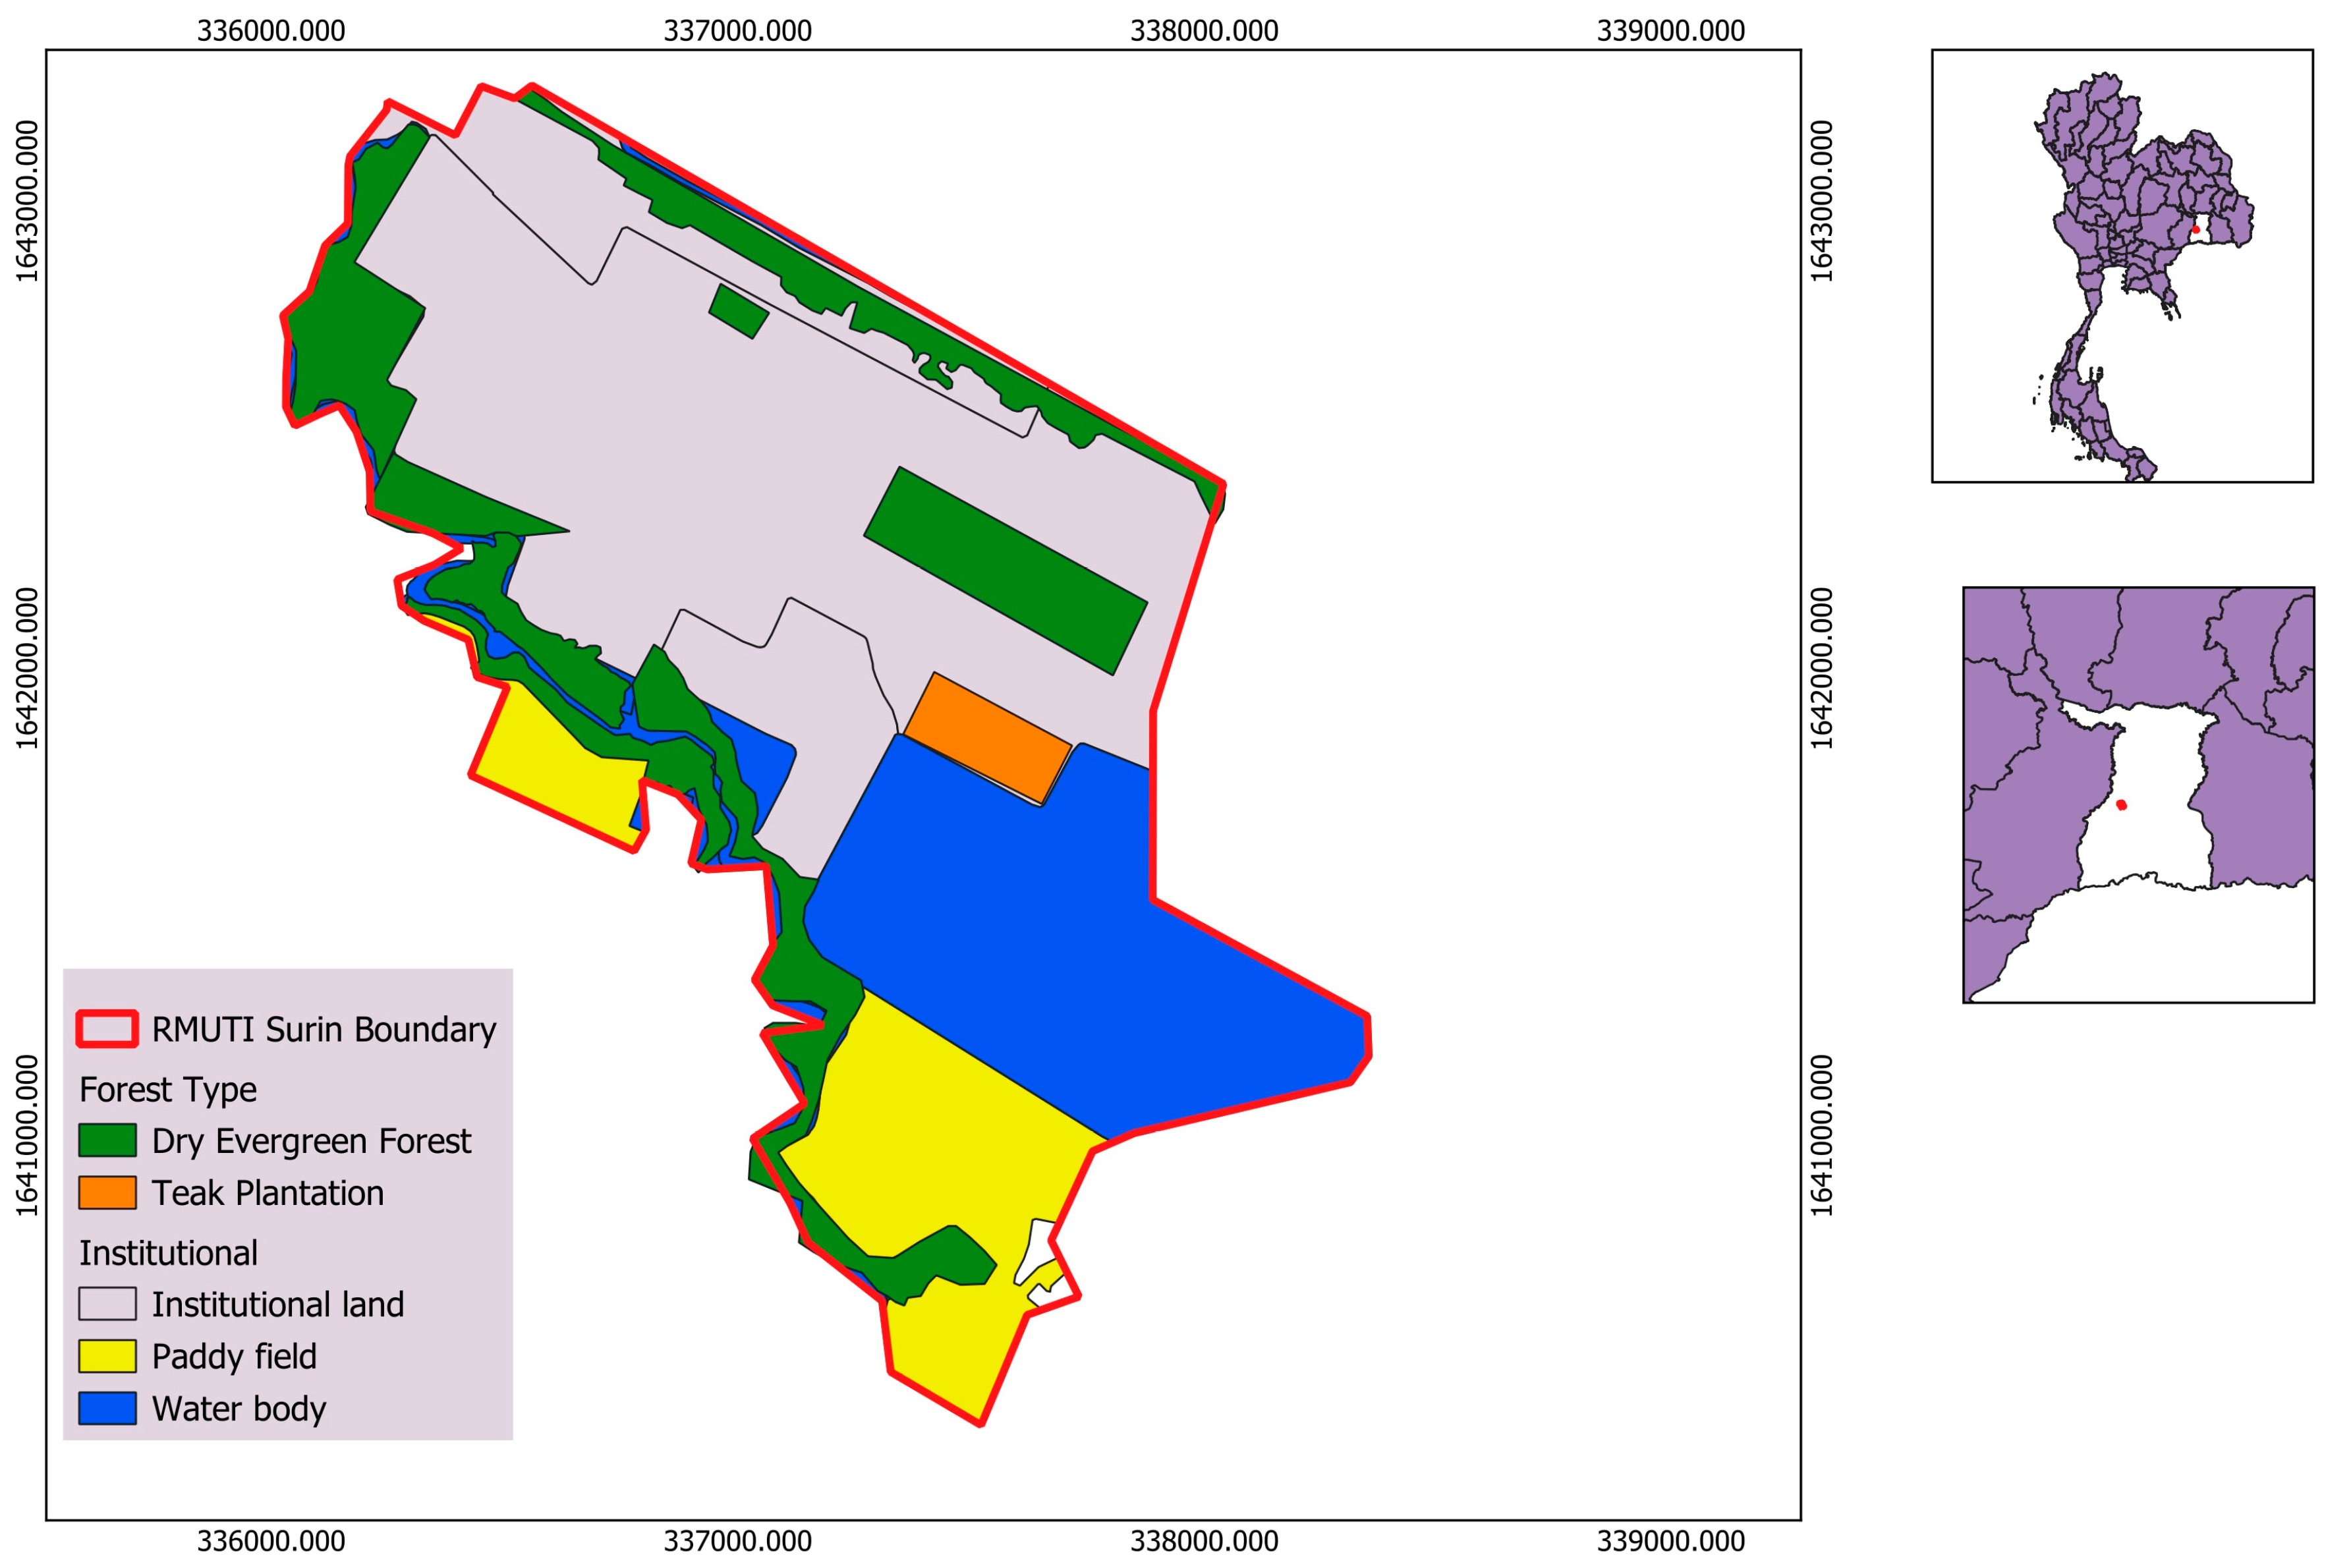
2.1. Research Area
The urban forestry area used in this study was located at Rajamangala University of Technology Isan, Surin Campus, Surin Province, Thailand (Figure 1). It comprised 60.96 ha. The physical characteristics of the area consist of lowland terrain, with an annual average temperature of 27.3 °C. The average minimum temperature is 22.8 °C, while the average maximum temperature reaches 32.9 °C. Additionally, the area receives an annual average rainfall of 1436.5 mm. It is worth noting that the Air Quality Index (AQI) of the area shows a favorable air quality standard, or no air pollution.
Figure 1.
Maps of forest type and location of Rajamangala University of Technology Isan, Surin Campus, Surin Province, Thailand.
The urban forest area at Rajamangala University of Technology Isan, Surin Campus, is one of the few forested areas within an urban setting. It has been preserved to promote a reliance on non-timber forest products and to maintain an environmental balance. The forest composition at the time of our study included 55.84 ha of dry evergreen forest and 5.12 ha of supplementary planted forests, including teak.
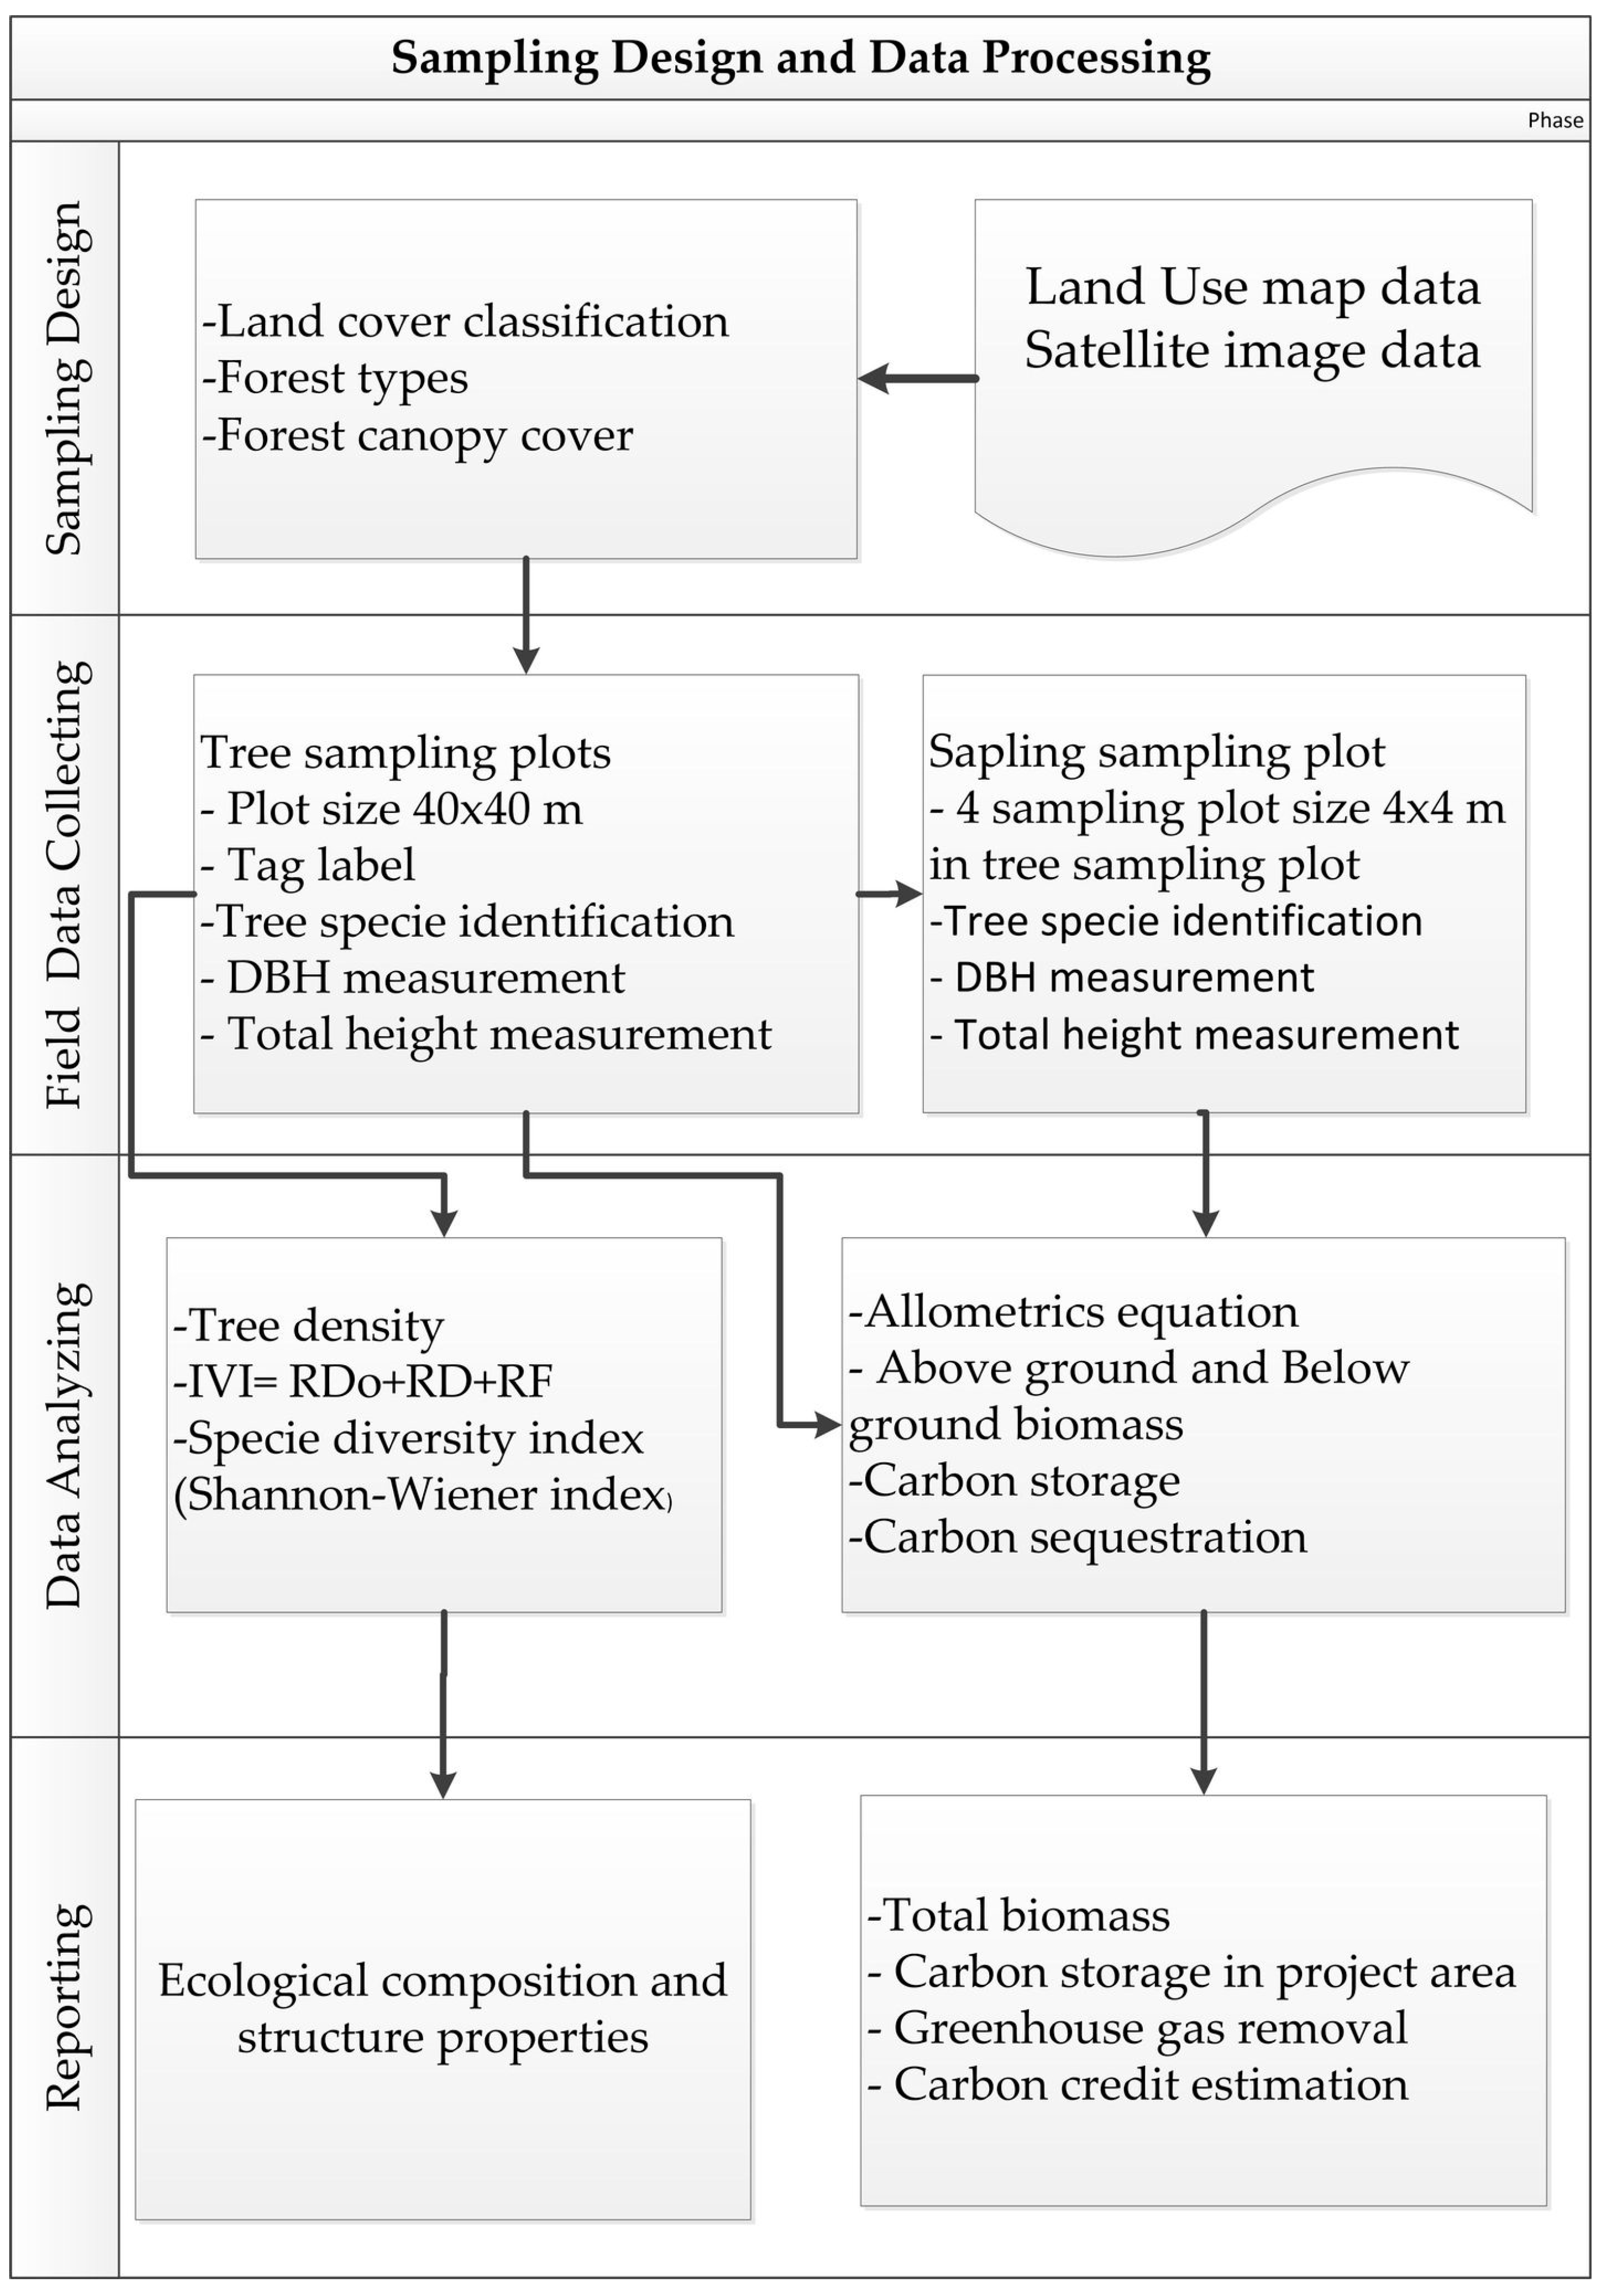
2.2. Data Collection and Analysis
The methodology employed for assessing plant diversity, biomass quantity, and carbon storage in this study is outlined (Figure 2) as follows:
Figure 2.
Flowchart of the study.
2.2.1. Forest Boundary Delineation and Stratification
The boundaries of the forest project area and its stratification were established through the integration of land use maps and semi-real-time imagery from Sentinel-2 satellites. Important forest attributes, including species distribution, forest type, and density of forest cover, were considered in this process. In the baseline year of 2023, a thorough survey of the entire forest boundary was performed, with the relevant geographic coordinates documented to guarantee accurate identification of the boundaries.
2.2.2. Plot Sampling Design and Layout
The sampling design employed in this research consisted of selecting nested square plots, which were deemed appropriate for the dense forest environment. The preference for square plots was influenced by the difficult terrain, as noted in earlier studies [29]. The dimensions of the plots varied based on the specific characteristics of the area, with 40 × 40 m plots being standard for typical forest regions, community forests, forest gardens, and agroforestry systems. The arrangement and quantity of sample plots were established in accordance with the guidelines set forth by the Thailand Greenhouse Gas Management Organization (TGO) [30]. These guidelines encompass techniques such as random sampling, stratified random sampling, and the A/R Methodology Tool, which assists in determining the necessary number of sample plots for measurements related to A/R CDM project activities. In this study, forest stratification was conducted, leading to the creation of ten permanent sample plots distributed among various stratification groups, thereby facilitating thorough data collection and biomass evaluation.
In the established permanent sample plots, the data collection process concentrated on assessing the diameter at breast height (DBH) and the total height of trees. DBH measurements were taken at a height of 1.3 m above the ground for all trees exhibiting a DBH exceeding 4.5 cm, utilizing a diameter tape for accuracy. The heights of the trees were recorded with the aid of a Nikon Forest ProII device. Each tree within the designated plot was distinctly marked and tagged to ensure that no tree was inadvertently lost or counted more than once, with the measurement process commencing from the northern boundary and advancing inward. Species identification and classification were performed for every tree, and only those trees with a basal area exceeding 50% within the plot limits were incorporated into the inventory. For saplings with diameters greater than 1 cm but less than 5 cm and a height of 1.3 m above ground level, measurements were carried out within nested sub-plots measuring 10 × 10 m and 4 × 4 m, respectively. These sub-plots were specifically structured to enhance the precision of sapling data collection, thereby contributing to the comprehensive evaluation of forest biomass and carbon storage.
2.2.3. Plant Diversity Survey
The species numbers and tree counts were recorded from the ten temporary sample plots and analyzed using the following methods.
The importance value index (IVI) [31] is derived from the measurements of density (D), dominance (Do), and frequency (F). The relationships between these values can be further analyzed using the relative density (RD), relative dominance (RDo), and relative frequency (RF). The calculation formulas are presented in Equations (1)–(7).
Relative density (RD)
Density (D)
Relative frequency (RF)
Frequency (F)
Relative dominance (RDo)
Dominance (Do)
The species diversity, as ascertained by the Shannon–Wiener diversity index [32], and the evenness index, as ascertained by Pielou’s evenness index [33], were calculated using the formulas presented in Equations (8) and (9).
where H′ is the Shannon diversity index, Pi is the fraction of the entire population composed of species I, and S is the number of species encountered.
where H′ is the Shannon diversity index and S is the total number of unique species.
2.2.4. Analysis of Biomass and Carbon Storage
We used suitable allometric equations to evaluate the above-ground biomass, below-ground biomass, and carbon storage of the trees, as recommended in the Thailand Voluntary Emission Reduction Program Reference Manual: Forestry and Agriculture Sector developed by the TGO [29]. The urban forest area in this study was classified into deciduous forests and enhanced plantation forests, including a teak forest. Consequently, three types of allometric equations recommended by the TGO [30] were used. The allometry of Tsutsmi [34] was used for the dry evergreen forest, as presented in Equation (10). The allometry of Viriyabuncha [35] was used for the enhanced plantation forests, as presented in Equation (11). The allometry of Visaratana [36] was used for the saplings, as presented in Equation (12). The root/shoot ratio for all tree types was 0.27, the carbon fraction (CF) was 0.47, and the ratio of carbon dioxide to carbon was 44/12 or 3.66 [30].
where D is the diameter at breast height (cm); H is the total tree height (m); and WS, Wb, and are the dry weights of the stem, branches, and leaves, respectively, of a tree (kg).
2.3. Calculation of the Value from Carbon Credit Trading
The current value of the carbon credits was computed as the market price of the carbon credits multiplied by the amount of carbon stored in each sample plot. This was used to calculate the value of carbon credit trading. The carbon credit value from each plot was then aggregated to obtain the total carbon credit value for all sample plots. The total carbon credit value for urban forests was equal to the total carbon credit value of all sample plots multiplied by the total area of the urban forest. This was based on the market price from the global carbon credit market as of 2023, which was USD/tC 25 [37].
3. Results and Discussion
3.1. Plant Species Diversity
A total of 85 plant species belonging to 39 families were identified from the survey of the 10 permanent sample plots. The 10 most frequently encountered species were (1) Tectona grandis Linn.f., (2) Streblus asper Lour, (3) Microcos tomentosa Smith, (4) Dipterocarpus alatus Roxb, (5) Melodorum fruticosum Lour, (6) Dialium cochinchinense Pierre, (7) Dipterocarpus obtusifolius Teijsm.ex Miq., (8) Anisoptera costata Korth, (9) Shorea roxburghii G.Don, and (10) Parinari anamensis Hance. The details of these tree species are presented in Appendix A. In the quantitative structure of the trees (Table 1), the species with the highest relative density (RD) were Streblus asper Lour, Tectona grandis Linn.f., and Microcos tomentosa Smith, with values of 11.508%, 10.894%, and 7.877%, respectively, and an average density of 263 trees per hectare. The species with the highest relative frequency (RF) was Microcos tomentosa Smith, with an RF value of 3.433%. This was followed by Shorea roxburghii G.Don, Dalbergia velutina Benth., Parinari anamensis Hance, Lagerstroemia floribunda Jack, Syzygium cinereum (Kurz) Chantar. & J. Parn., Dalbergia cochinchinensis Pierre, and Diospyros oblonga Wall. ex G.Don, each with an RF value of 2.575%, and Streblus asper Lour, Anisoptera costata Korth, Melodorum fruticosum Lour, Dipterocarpus obtusifolius Teijsm.ex Miq., Peltophorum dasyrachis (Miq.) Kurz, Diospyros castanea Fletcher, Dipterocarpus intricatus Dyer, Irvingia malayana Oliv. ex A. Benn., Wrightia arborea (Dennst.) Mabb, and Sindora siamensis Teijsm. ex Miq, each with an RF value of 2.146%.
Table 1.
Biomass assessment of a teak forest.
The species with the three highest relative dominance (RDo) values were Tectona grandis Linn.f., with an RDo value of 16.255%; Anisoptera costata Korth, with an RDo value of 8.830%; and Streblus asper Lour, with an RDo value of 6.457%. The species with the highest importance value index (IVI) values were Tectona grandis Linn.f., Streblus asper Lour, and Anisoptera costata Korth, with IVI values of 28.098, 19.864, and 17.209, respectively, as shown in Appendix B. An analysis of the species diversity using the Shannon–Wiener index revealed a value of 2.281, with an evenness index value of 0.687.
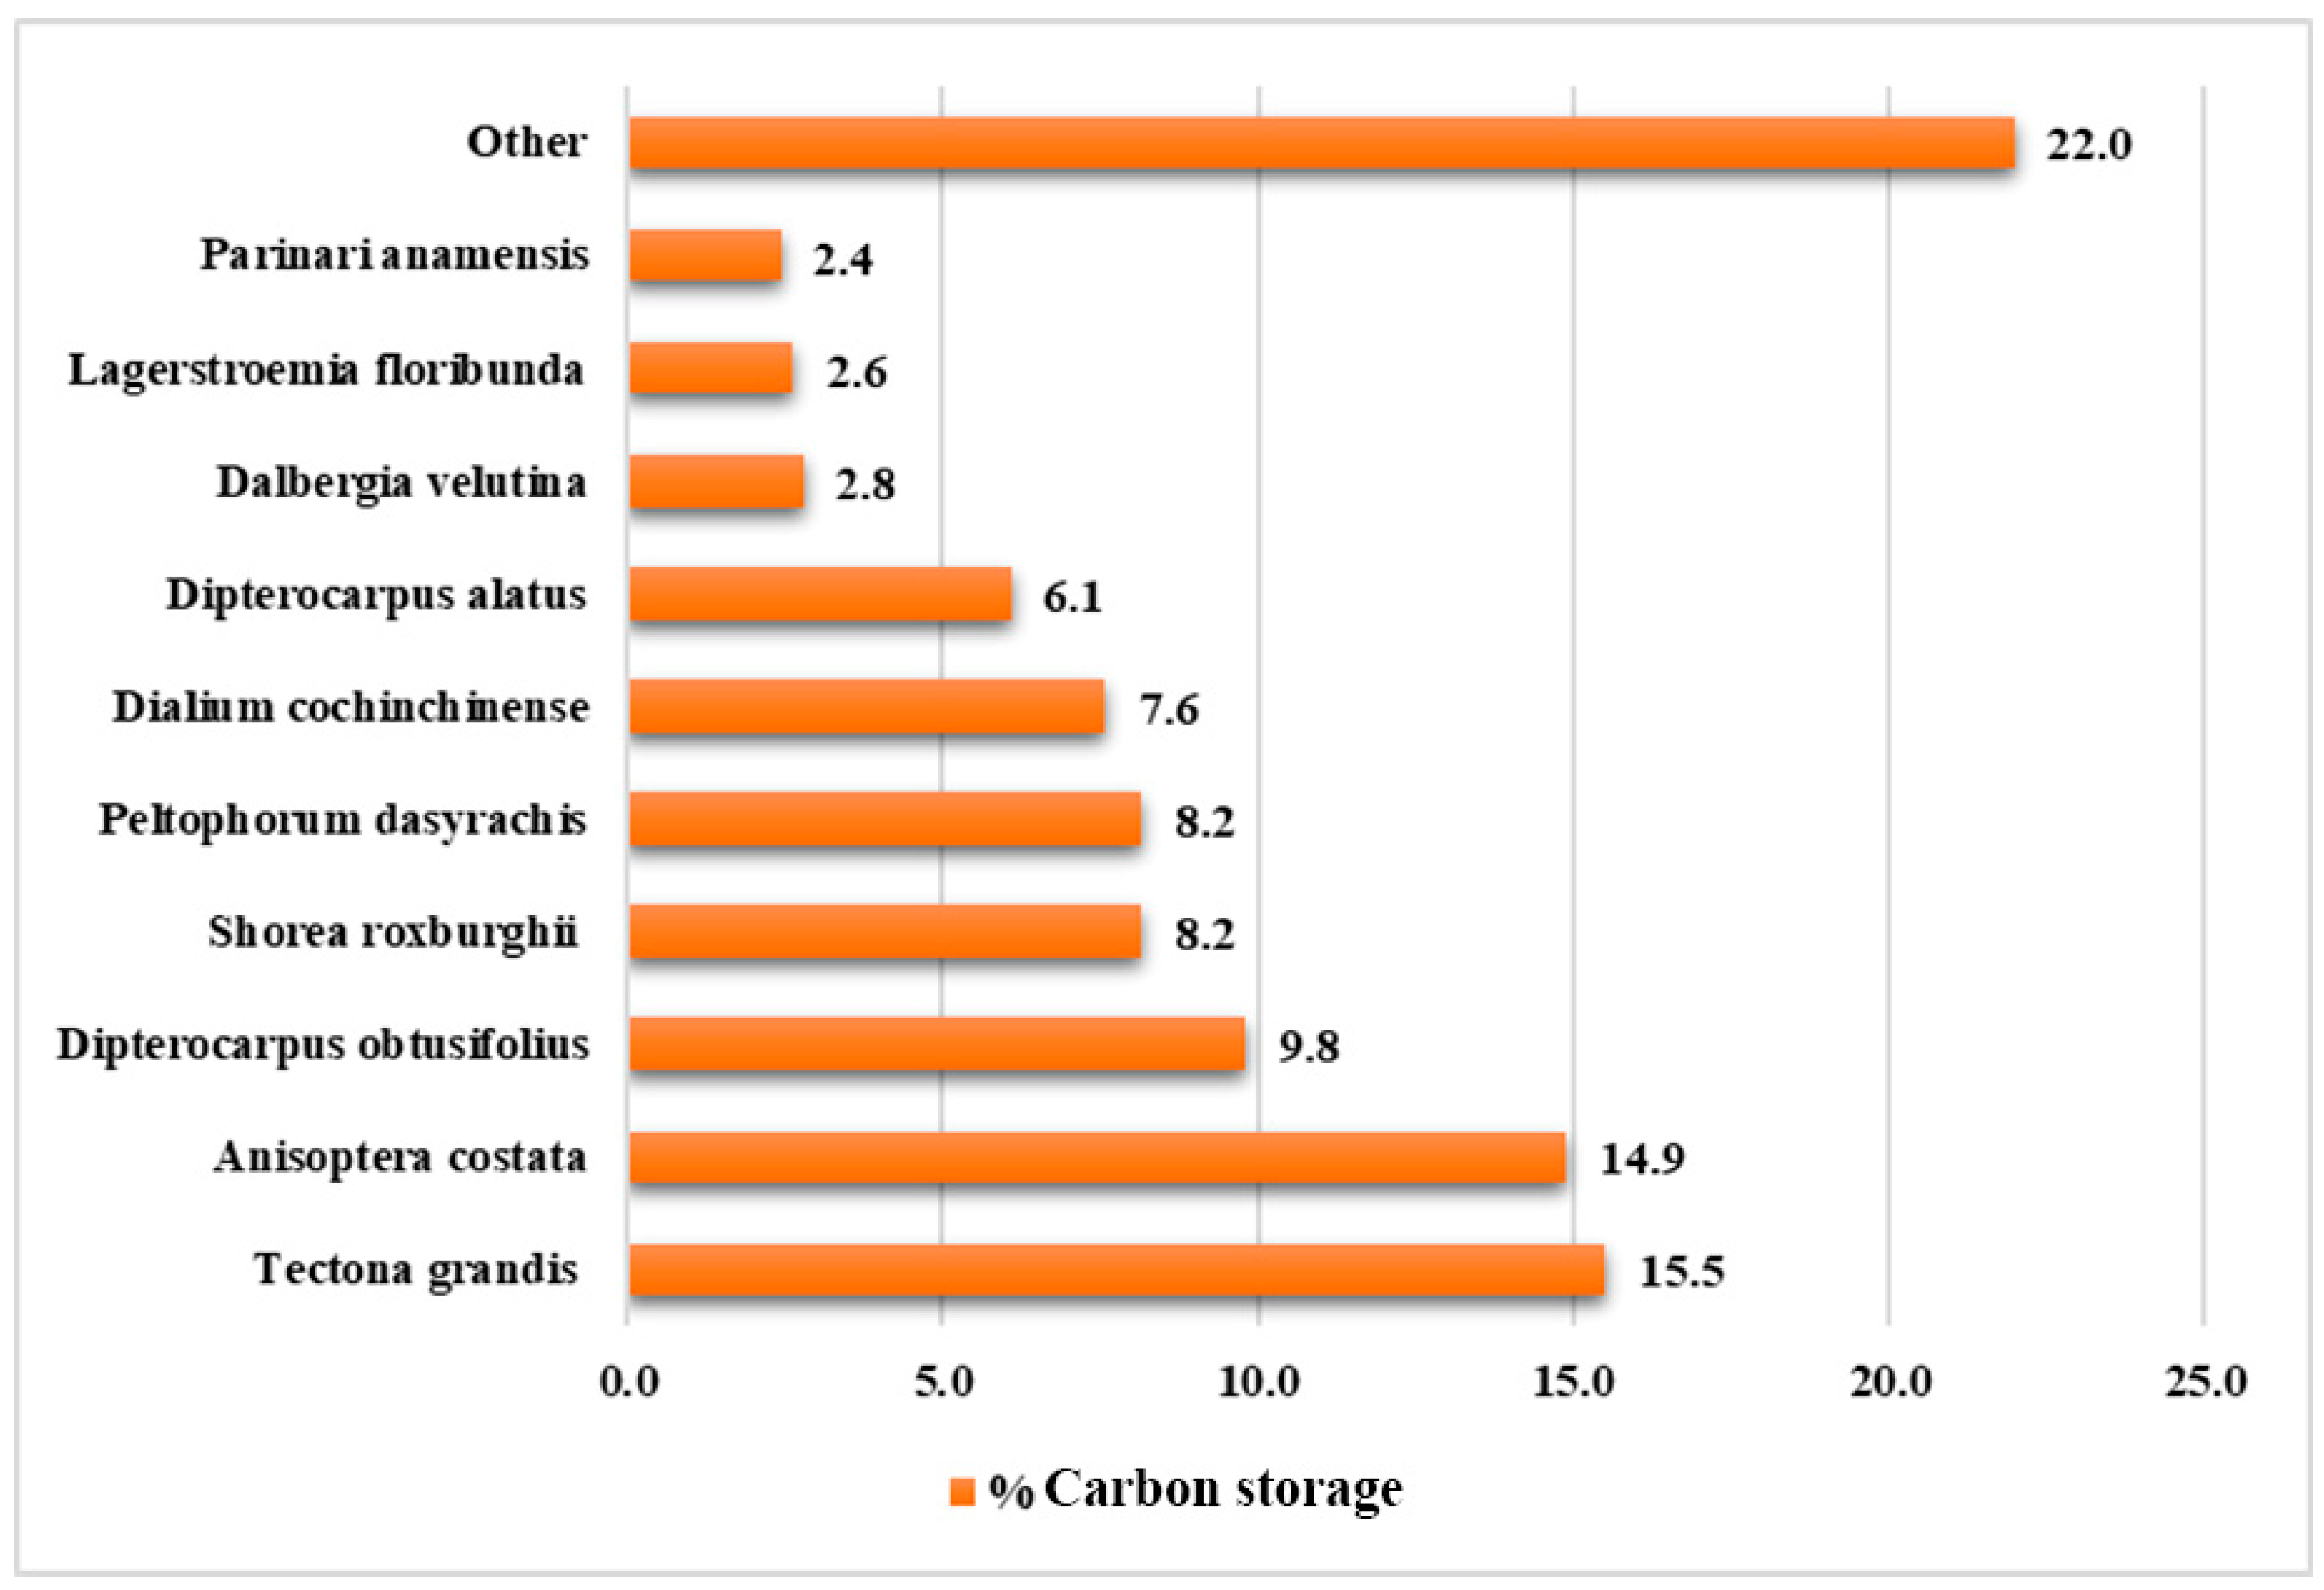
3.2. Biomass Quantity and Carbon Storage Studies
The top ten tree species with the highest potential, as ascertained from the percentage of carbon sequestration in the study area, were Tectona grandis Linn.f., Anisoptera costata Korth, Dipterocarpus obtusifolius Teijsm.ex Miq., Shorea roxburghii G.Don, Peltophorum dasyrachis (Miq.) Kurz, Dalbergia cochinchinensis Pierre, Dipterocarpus alatus Roxb, Dalbergia velutina Benth., Lagerstroemia floribunda Jack, and Parinari anamensis Hance, respectively (Figure 3).
Figure 3.
Percentages of carbon storage of the top ten and other species within the sampling area.
From the field surveys of the tree species in the ten temporary 40 × 40 m sample plots, the biomass assessment of the teak forest (Table 1) indicated that the average tree biomass was 149,225.44 kg/ha. The teak forest covered an area of 5.12 ha and the total tree biomass for this forest area amounted to 764,033.92 kg. When this biomass was used to calculate the carbon storage, we observed that the average carbon storage for the teak forest was 70,135.94 kg/ha. The total carbon storage for all trees in the forest area amounted to 359,096.03 kg. The distribution of the biomass and carbon storage was predominantly in the stems, followed by the roots, branches, and leaves, accounting for 59.44%, 18.81%, 18.60%, and 3.14%, respectively.
From the biomass assessment of the dry evergreen forest (Table 2), the average tree biomass was observed to be 221,771.44 kg/ha. The deciduous forest covered an area of 55.84 ha and the total tree biomass for this forest area amounted to 12,942,937.22 kg. When this biomass was used to calculate the carbon storage, we observed that the average carbon storage for the deciduous forest was 104,232.56 kg/ha. The total carbon storage for all trees in the forest area amounted to 5,820,347.03 kg. The distribution of the biomass and carbon storage was predominantly in the stems, followed by the branches, roots, and leaves, accounting for 63.76%, 20.30%, 14.32%, and 1.62%, respectively.
Table 2.
Biomass assessment of a dry evergreen forest.
From the sapling biomass and carbon storage evaluation of the teak forest (Table 3), the average biomass of the saplings was observed to be 659.50 kg/ha over an area of 5.12 ha, resulting in a total sapling biomass of 2076.64 kg. The carbon storage for these teak saplings averaged 310.00 kg/ha, totaling 1587.20 kg for the entire area. The biomass and carbon storage primarily accumulated in the stems (33.75%), followed by the branches (44.03%), roots (16.57%), and leaves (5.65%).
Table 3.
Sapling biomass and carbon storage evaluation of a teak forest.
From the sapling biomass and carbon storage evaluation of the dry evergreen forest (Table 4), the average biomass of the saplings was 279.25 kg per ha, over an area of 60.96 ha, resulting in a total sapling biomass of 33,179.43 kg. The carbon storage for these deciduous forest saplings averaged 44.68 kg per rai, totaling 15,594.34 kg for the entire area. The biomass and carbon storage primarily accumulated in the stems (42.39%), followed by the branches (29.15%), roots (21.25%), and leaves (7.21%). A carbon storage analysis of urban forestry was undertaken, based on a case study of the urban forest area within Rajamangala University of Technology Isan, Surin Campus. This area comprised 55.84 ha of deciduous forests and 5.12 ha of enhanced plantation forests, totaling 60.96 ha. We observed that the living biomass of trees and saplings stored approximately 6,851,550 kg of carbon, equivalent to 6851.55 metric tons (tC). This translated into an estimated carbon dioxide absorption capacity of approximately 25,122,350 kg CO2e, or 25,122.35 metric tons (tCO2e).
Table 4.
Sapling biomass and carbon storage evaluation of a dry evergreen forest.
3.3. Calculation of the Value from Carbon Credit Trading
Based on an assessment of the carbon storage value derived from the carbon credit trading prices, the urban forestry area had an estimated carbon storage capacity of 6851.55 tC and an equivalent carbon sequestration capacity of 25,122 tCO2e in the base year (baseline). With the proper maintenance of the urban forest area over a 10-year period, we estimated that the carbon storage capacity could increase to 28,741.00 tCO2e, equivalent to a carbon sequestration capacity of 3619 tCO2e. This would result in a carbon credit value equivalent to USD 90,475.
4. Discussion
Urban forests have emerged as critical components in mitigating global climate change, primarily through their role as carbon sinks. These forests absorb carbon dioxide (CO2) emissions produced by various activities, including those in the industrial and agricultural sectors, as well as from land use and land cover changes. The importance of carbon sequestration in urban forests has garnered significant attention from researchers and policymakers worldwide. This study discusses the vital role of urban forests in carbon storage and sequestration and explores the associated economic and ecological aspects. The findings of this research provide valuable insights into the vegetation composition and carbon storage distribution at Rajamangala University of Technology Isan, Surin Campus. A rigorous examination of quantitative parameters for trees revealed variations in total density, relative density, relative frequency, relative dominance, and provided an Importance Value Index. Assessments of carbon storage across the investigated forest sites identified the top ten species of ecological importance and potential contributions to carbon storage, including Tectona grandis Linn.f., Anisoptera costata Korth, Dipterocarpus obtusifolius Teijsm.ex Miq., Shorea roxburghii G.Don, Peltophorum dasyrachis (Miq.) Kurz, Dalbergia cochinchinensis Pierre, Dipterocarpus alatus Roxb, Dalbergia velutina Benth., Lagerstroemia floribunda Jack, and Parinari anamensis Hance.
These native species highlight the ecological significance of the urban forests in this area. The comparison to other research from four parks in the Bangkok Metropolitan (the definition includes the Bangkok region as well as the five adjacent provinces: Nakhon Pathom, Pathum Thani, Nonthaburi, Samut Prakan, and Samut Sakhon) along its main and sub-main streets, revealed 10 major tree species, including Polyalthia longifolia (Benth) Hook. f., Pterocarpus indicus Willd., Tabebuia rosea (Bertol.) DC., Peltophorum pterocarpum (DC.) Backer ex K. Heyne, Millingtonia hortensis L.f., Streblus asper Lour., Sesbania grandiflora (L.) Desv., Mimusops elengi L., Lagerstroemia speciosa (L.) Pers., and Albizia saman (Jacq.) Merr. On the main and smaller streets, species included Pterocarpus indicus Willd., Tabebuia rosea (Bertol.) DC., Cassia fistula L. Swietenia macrophylla King., Lagerstroemia speciosa (L.) Pers. Mimusops elengi L., and Polyalthia longifolia (Benth) Hook. f. These tree species having high carbon sequestration potential were selected to grow in urban areas where some are dominated by exotic species [27]. To maximize the benefits provided by urban forests, it is essential to recognize the need for diverse species composition. A diverse range of species promotes ecosystem resilience and supports biodiversity conservation, ensuring that urban forests can continue to provide critical ecosystem services even in the face of environmental changes. Large-stature species with dense wood are particularly effective at storing carbon, and some species may exhibit more favorable lifetime carbon capture-to-emissions ratios. Ensuring the maintenance of tree canopy in perpetuity is crucial for sustaining carbon storage within urban forests. The amount of carbon annually sequestered is increased with healthier trees and larger-diameter trees [38].
In addition, Nowak et al. [38] recommended that understanding the structure, composition, species diversity, biomass, and carbon potential of urban forests is crucial for developing effective climate change mitigation strategies. Forest structure refers to a range of physical characteristics, including the variety of tree species, the number of trees, tree density, overall tree health, leaf area, biomass, and species diversity. These structural elements significantly influence the forest’s functions, which encompass a wide range of environmental and ecosystem services, such as air pollution removal and temperature regulation. The economic valuation of these functions, known as forest values, represents the monetary worth of the benefits provided by the forest. Proactive management of urban forestry assets is key to increasing local resilience to climate change and creating more sustainable and appealing living environments. Urban forests contribute to climate change mitigation by capturing and storing atmospheric carbon dioxide through photosynthesis, whether the trees are evergreen or deciduous [39]. Locosselli et al. [40] noted that in urban environments, climate significantly affects tree growth, with temperature exerting a beneficial influence, whereas elevated air pollution levels in large cities may hinder tree growth. Such constraints could diminish the ecosystem services provided by trees, particularly when they are employed as instruments for mitigating or adapting to environmental changes. The value assessment of the urban forests at Rajamangala University of Technology Isan, Surin Campus, which store approximately 25,122 tCO2e, assumes that they are projected to capture an additional 3619 tCO2e over the next ten years. The economic value of this carbon sequestration is significant, amounting to over USD 90,475 over ten years. Urban forest managers can support greenhouse gas (GHG) emission reduction efforts by allocating resources to trees that are more effective at mitigating emissions. By strategically managing urban forests, municipalities can enhance their carbon sequestration capabilities, realize significant economic and environmental benefits, and foster resilient and sustainable urban environments in the face of ongoing climate change.
5. Conclusions
Forests play a pivotal role in global climate regulation in three ways: (1) enhancing the absorption of carbon dioxide from the atmosphere, helping to stabilize global temperatures, (2) increasing the release of water vapor into the atmosphere and enhancing humidity, and (3) aiding ground cover as protection against sunlight, which helps reduce global warming. The aim of this study was to explore the diversity of plant species, assess the tree biomass, and evaluate the carbon storage and carbon credits of urban forestry areas located at Rajamangala University of Technology Isan Surin Campus. The methods used in this research involved surveying and assessing the tree biomass, carbon storage, and carbon credits of urban forestry areas under the Thailand Voluntary Emission Reduction Program. The findings of this research will be used to create a Project Design Document (PDD) for registering urban forestry carbon credits with the TGO. This research identified 85 different tree species belonging to 39 families, with the most species found in the Fabaceae family, including 14 species such as Acacia auriculaeformis A. Cunn. ex Benth., Acacia comosa Gangep., Albizia lebbeck Benth, Albizia lebbeckoides (DC.) Benth., Butea superba Roxb., Dalbergia cochinchinensis Pierre, Dalbergia nigrescens Kurz., Dalbergia velutina Benth., Dialium cochinchinense Pierre, Leucaena leucocephala (Lam.) de Wit, Peltophorum dasyrachis (Miq.) Kurz, Sindora siamensis Teijsm. ex Miq, and Xylia xylocarpa (Roxb.) Taub. After participating in COP26, Thailand announced together with the international community that it would achieve carbon neutrality in 2050 and net zero emissions by 2065. The T-VER method will help push Thailand towards achieving these intentions.
Author Contributions
Conceptualization, Y.U. and T.L.; methodology, Y.U., T.L. and S.S.; validation, C.B., T.R., W.S. and S.N.; formal analysis, Y.U., T.L., S.S., C.B. and T.R.; resources, W.S. and S.N.; data curation, Y.U., T.L., S.S., C.B., T.R., W.S. and S.N.; funding acquisition, Y.U. and T.L.; writing—review and editing, T.L. and Y.U.; project administration, T.L. All authors have read and agreed to the published version of the manuscript.
Funding
This research project was financially supported by the National Research Council of Thailand (NRCT), funding number: N51E660035.
Data Availability Statement
The original contributions presented in the study are included in the article, further inquiries can be directed to the corresponding author.
Acknowledgments
We wish to express our gratitude to Rajamangala University of Technology Isan, Surin Campus for granting us permission to use the campus forest areas for the purpose of this research.
Conflicts of Interest
The authors declare no conflicts of interest.
Appendix A. Plant Species Diversity
| Family Name | Scientific Name | Number of Trees | Mean Density (Tree·ha−1) |
| Anacardiaceae | Buchanania lanzan Spreng | 8 | 0.128 |
| Gluta usitata (Wall.) Ding Hou. | 5 | 0.080 | |
| Lannea coromandelica (Houtt.) Merr. | 2 | 0.032 | |
| Mangifera caloneura Kurz | 4 | 0.064 | |
| Semecarpus albescens Kurz | 3 | 0.048 | |
| Annonaceae | Hubera cerasoides (Roxb.) Chaowasku | 1 | 0.016 |
| Melodorum fruticosum Lour | 132 | 2.112 | |
| Polyalthia viridis Craib | 1 | 0.016 | |
| Uvaria rufa Blume | 6 | 0.096 | |
| Xylopia vielana Pierre. | 4 | 0.064 | |
| Antalaceae | Scleropyrum pentandrum (Dennst.) Mabb. | 5 | 0.080 |
| Apocynaceae | Willughbeia edulis Roxb. | 45 | 0.720 |
| Wrightia arborea (Dennst.) Mabb | 12 | 0.192 | |
| Burseraceae | Canarium subulatum Guillaumin | 2 | 0.032 |
| Calophyllaceae | Mammea siamensis (T. Anderson) Kosterm | 4 | 0.064 |
| Cannabaceae | Trema orientalis (L.) Blume | 1 | 0.016 |
| Celastraceae | Celastrus paniculatus Willd | 1 | 0.016 |
| Chrysobalanaceae | Parinari anamensis Hance | 41 | 0.656 |
| Clusiaceae | Garcinia cowa Roxb. ex Choisy | 44 | 0.704 |
| Dilleniaceae | Dillenia ovata Wall. ex Hook. f.& Thomson | 1 | 0.016 |
| Dipterocarpaceae | Anisoptera costata Korth | 116 | 1.856 |
| Dipterocarpus alatus Roxb | 88 | 1.408 | |
| Dipterocarpus intricatus Dyer | 9 | 0.144 | |
| Dipterocarpus obtusifolius Teijsm.ex Miq. | 46 | 0.736 | |
| Shorea roxburghii G.Don | 64 | 1.024 | |
| Ebenaceae | Diospyros castanea Fletcher | 20 | 0.320 |
| Diospyros ferrea (Willd.) Bakh. | 1 | 0.016 | |
| Diospyros filipendula Pierre ex Lecomte | 8 | 0.128 | |
| Diospyros oblonga Wall. ex G.Don. | 10 | 0.160 | |
| Diospyros rhodocalyx Kurz | 2 | 0.032 | |
| Elaeocarpaceae | Elaeocarpus sphaericus (Gaertn.) K.Schum. | 7 | 0.112 |
| Euphorbiaceae | Baccaurea ramiflora Lour. | 1 | 0.016 |
| Aporosa villosa (Wall. ex Lindl.) Bail | 5 | 0.080 | |
| Mallotus thorelii Gagnep. | 3 | 0.048 | |
| Suregada multiflorum (A.Juss.) Baill | 14 | 0.224 | |
| Fabaceae | Acacia auriculaeformis A. Cunn. ex Benth. | 25 | 0.400 |
| Acacia comosa Gangep. | 21 | 0.336 | |
| Albizia lebbeck Benth | 1 | 0.016 | |
| Albizia lebbeckoides (DC.) Benth. | 2 | 0.032 | |
| Butea superba Roxb. | 2 | 0.032 | |
| Dalbergia cochinchinensis Pierre | 18 | 0.288 | |
| Dalbergia nigrescens Kurz. | 12 | 0.192 | |
| Dalbergia velutina Benth. | 109 | 1.744 | |
| Dialium cochinchinense Pierre | 42 | 0.672 | |
| Leucaena leucocephala (Lam.) de Wit | 1 | 0.016 | |
| Peltophorum dasyrachis (Miq.) Kurz | 31 | 0.496 | |
| Pterocarpus macrocarpus Kurz | 4 | 0.064 | |
| Sindora siamensis Teijsm. ex Miq | 9 | 0.144 | |
| Xylia xylocarpa (Roxb.) Taub. | 12 | 0.192 | |
| Fagaceae | Lithocarpus sp. | 20 | 0.320 |
| Flacourtiaceae | Casearia grewiifolia Vent | 4 | 0.064 |
| Hypericaceae | Cratoxylum prunifolium Dyer | 11 | 0.176 |
| Irvingiaceae | Irvingia malayana Oliv. ex A. Benn. | 15 | 0.240 |
| Labiatae | Hymenopyramis parvifolia Moldenke | 6 | 0.096 |
| Vitex pinnata L. | 1 | 0.016 | |
| Lamiaceae | Tectona grandis Linn.f. | 194 | 3.104 |
| Lauraceae | Litsea glutinosa (Lour.) C.B.Robinson | 2 | 0.032 |
| Lecythidaceae | Barringtonia acutangula (L.) Gaertn. | 1 | 0.016 |
| Loganiaceae | Fagraea fragrans Roxb | 7 | 0.112 |
| Lythraceae | Lagerstroemia floribunda Jack | 25 | 0.400 |
| Lagerstroemia speciosa (L.) Pers | 1 | 0.016 | |
| Malvaceae | Bombax anceps Pierre | 2 | 0.032 |
| Melastomataceae | Memecylon edule Roxb. | 7 | 0.112 |
| Memecylon ovatum Smith | 11 | 0.176 | |
| Meliaceae | Azadirachta indica A. Juss. | 5 | 0.080 |
| Moraceae | Streblus asper Lour | 206 | 3.296 |
| Myrtaceae | Eucalyptus globulus Labill. | 4 | 0.064 |
| Syzygium cinereum (Kurz) Chantar. & J. Parn. | 31 | 0.496 | |
| Tristaniopsis burmanica (Griff.) Peter G.Wilson & J.T.Waterh | 5 | 0.080 | |
| Ochnaceae | Gomphia serrata (Gaertn.) Kanis | 1 | 0.016 |
| Phyllanthaceae | Phyllanthus angkorensis Beille | 9 | 0.144 |
| Rhamnaceae | Ziziphus oenopolia (L.) Mill. | 2 | 0.032 |
| Zizyphus cambodiana Pierre | 1 | 0.016 | |
| Rhizophoraceae | Carallia brachiata (Lour.) Merr | 10 | 0.160 |
| Rubiaceae | Ixora ebarbata Craib | 6 | 0.096 |
| Mitragyna hirsuta Havil | 2 | 0.032 | |
| Oxyceros horridus Lour | 14 | 0.224 | |
| Salicaceae | Salix tetrasperma Roxb. | 1 | 0.016 |
| Sapindacea | Filicium decipiens (Wight & Arn.) Thwaites & Hook | 10 | 0.160 |
| Sladeniaceae | Sladenia celastrifolia Kurz | 4 | 0.064 |
| Theaceae | Schima wallichii (DC.) Korth. | 14 | 0.224 |
| Tiliaceae | Microcos tomentosa Smith | 141 | 2.256 |
| Total | 1778 | 28.448 |
Appendix B. The Quantitative Structure of Trees
| Scientific Name | RD | RDo | RF | IVI |
|---|---|---|---|---|
| Tectona grandis Linn.f. | 10.894 | 16.255 | 0.949 | 28.098 |
| Streblus asper Lour | 11.508 | 6.457 | 1.899 | 19.864 |
| Anisoptera costata Korth | 6.480 | 8.830 | 1.899 | 17.209 |
| Microcos tomentosa Smith | 7.877 | 5.671 | 2.848 | 16.396 |
| Melodorum fruticosum Lour | 7.374 | 3.620 | 1.899 | 12.893 |
| Shorea roxburghii G.Don | 3.575 | 6.125 | 2.215 | 11.915 |
| Dalbergia velutina Benth. | 6.089 | 3.469 | 2.215 | 11.774 |
| Dipterocarpus alatus Roxb | 4.916 | 5.665 | 0.949 | 11.531 |
| Dipterocarpus obtusifolius Teijsm.ex Miq. | 2.570 | 5.846 | 1.899 | 10.314 |
| Dialium cochinchinense Pierre | 2.346 | 4.593 | 1.582 | 8.522 |
| Peltophorum dasyrachis (Miq.) Kurz | 1.732 | 3.832 | 1.899 | 7.462 |
| Parinari anamensis Hance | 2.291 | 2.387 | 2.215 | 6.893 |
| Lagerstroemia floribunda Jack | 1.397 | 1.970 | 2.215 | 5.581 |
| Syzygium cinereum (Kurz) Chantar. & J. Parn. | 1.732 | 1.453 | 2.215 | 5.400 |
| Garcinia cowa Roxb. ex Choisy | 2.458 | 1.568 | 1.266 | 5.292 |
| Willughbeia edulis Roxb. | 2.514 | 1.328 | 1.266 | 5.108 |
| Dalbergia cochinchinensis Pierre | 1.006 | 0.838 | 2.215 | 4.059 |
| Lithocarpus sp. | 1.117 | 1.069 | 1.582 | 3.769 |
| Diospyros castanea Fletcher | 1.117 | 0.499 | 1.899 | 3.515 |
| Acacia auriculaeformis A. Cunn. ex Benth. | 1.397 | 1.377 | 0.633 | 3.407 |
| Dipterocarpus intricatus Dyer | 0.503 | 1.000 | 1.899 | 3.401 |
| Irvingia malayana Oliv. ex A. Benn. | 0.838 | 0.497 | 1.899 | 3.234 |
| Wrightia arborea (Dennst.) Mabb | 0.670 | 0.636 | 1.899 | 3.205 |
| Diospyros oblonga Wall. ex G.Don. | 0.559 | 0.330 | 2.215 | 3.103 |
| Sindora siamensis Teijsm. ex Miq | 0.503 | 0.581 | 1.899 | 2.982 |
| Dalbergia nigrescens Kurz. | 0.670 | 0.727 | 1.582 | 2.980 |
| Acacia comosa Gangep. | 1.173 | 0.827 | 0.949 | 2.950 |
| Carallia brachiata (Lour.) Merr | 0.559 | 0.610 | 1.582 | 2.751 |
| Cratoxylum prunifolium Dyer | 0.615 | 0.457 | 1.582 | 2.654 |
| Suregada multiflorum (A.Juss.) Baill | 0.782 | 0.588 | 1.266 | 2.636 |
| Buchanania lanzan Spreng | 0.447 | 0.495 | 1.582 | 2.524 |
| Oxyceros horridus Lour | 0.782 | 0.351 | 1.266 | 2.399 |
| Xylia xylocarpa (Roxb.) Taub. | 0.670 | 0.453 | 1.266 | 2.389 |
| Gluta usitata (Wall.) Ding Hou. | 0.279 | 0.670 | 1.266 | 2.216 |
| Elaeocarpus sphaericus (Gaertn.) K.Schum. | 0.391 | 0.504 | 1.266 | 2.161 |
| Schima wallichii (DC.) Korth. | 0.782 | 0.410 | 0.949 | 2.142 |
| Filicium decipiens (Wight & Arn.)Thwaites & Hook | 0.559 | 0.444 | 0.949 | 1.952 |
| Memecylon ovatum Smith | 0.615 | 0.371 | 0.949 | 1.935 |
| Diospyros filipendula Pierre ex Lecomte | 0.447 | 0.205 | 1.266 | 1.917 |
| Ixora ebarbata Craib | 0.335 | 0.242 | 1.266 | 1.843 |
| Fagraea fragrans Roxb | 0.391 | 0.499 | 0.949 | 1.839 |
| Memecylon edule Roxb. | 0.391 | 0.165 | 1.266 | 1.822 |
| Mangifera caloneura Kurz | 0.223 | 0.563 | 0.949 | 1.736 |
| Xylopia vielana Pierre. | 0.223 | 0.205 | 1.266 | 1.694 |
| Aporosa villosa (Wall. ex Lindl.) Bail | 0.279 | 0.135 | 1.266 | 1.680 |
| Calophyllum saigonense. Pierre. | 0.223 | 0.143 | 1.266 | 1.632 |
| Phyllanthus angkorensis Beille | 0.503 | 0.360 | 0.633 | 1.496 |
| Pterocarpus macrocarpus Kurz | 0.223 | 0.321 | 0.949 | 1.494 |
| Azadirachta indica A. Juss. | 0.279 | 0.242 | 0.949 | 1.471 |
| Uvaria rufa Blume | 0.335 | 0.152 | 0.949 | 1.436 |
| Bombax anceps Pierre | 0.112 | 0.283 | 0.949 | 1.344 |
| Sladenia celastrifolia Kurz | 0.223 | 0.139 | 0.949 | 1.312 |
| Mammea siamensis (T. Anderson) Kosterm | 0.223 | 0.111 | 0.949 | 1.284 |
| Semecarpus albescens Kurz | 0.168 | 0.154 | 0.949 | 1.271 |
| Hymenopyramis parvifolia Moldenke | 0.335 | 0.299 | 0.633 | 1.267 |
| Casearia grewiifolia Vent | 0.223 | 0.093 | 0.949 | 1.266 |
| Mitragyna hirsuta Havil | 0.112 | 0.148 | 0.949 | 1.209 |
| Mallotus thorelii Gagnep. | 0.168 | 0.091 | 0.949 | 1.208 |
| Tristaniopsis burmanica (Griff.) Peter G.Wilson & J.T.Waterh | 0.279 | 0.239 | 0.633 | 1.151 |
| Dillenia ovata Wall. ex Hook. f.& Thomson | 0.112 | 0.078 | 0.949 | 1.139 |
| Diospyros rhodocalyx Kurz | 0.112 | 0.074 | 0.949 | 1.136 |
| Eucalyptus globulus Labill. | 0.223 | 0.237 | 0.633 | 1.094 |
| Scleropyrum pentandrum (Dennst.) Mabb. | 0.279 | 0.157 | 0.633 | 1.069 |
| Albizia lebbeck Benth | 0.056 | 0.354 | 0.633 | 1.042 |
| Albizia lebbeckoides (DC.) Benth. | 0.112 | 0.244 | 0.633 | 0.988 |
| Canarium subulatum Guillaumin | 0.112 | 0.153 | 0.633 | 0.897 |
| Ardisia helferiana Kurz. | 0.168 | 0.092 | 0.633 | 0.893 |
| Cansjera rheedii J.F. Gmelin | 0.168 | 0.083 | 0.633 | 0.884 |
| Lannea coromandelica (Houtt.) Merr. | 0.112 | 0.129 | 0.633 | 0.873 |
| Litsea glutinosa (Lour.) C.B.Robinson | 0.112 | 0.122 | 0.633 | 0.867 |
| Ziziphus oenopolia (L.) Mill. | 0.112 | 0.059 | 0.633 | 0.804 |
| Butea superba Roxb. | 0.112 | 0.049 | 0.633 | 0.794 |
| Salix tetrasperma Roxb. | 0.056 | 0.083 | 0.633 | 0.772 |
| Polyalthia viridis Craib | 0.056 | 0.074 | 0.633 | 0.763 |
| Trema orientalis (L.) Blume | 0.056 | 0.061 | 0.633 | 0.749 |
| Leucaena leucocephala (Lam.) de Wit | 0.056 | 0.054 | 0.633 | 0.743 |
| Vitex pinnata L. | 0.056 | 0.052 | 0.633 | 0.741 |
| Celastrus paniculatus Willd | 0.056 | 0.047 | 0.633 | 0.735 |
| Zizyphus cambodiana Pierre | 0.056 | 0.040 | 0.633 | 0.729 |
| Barringtonia acutangula (L.) Gaertn. | 0.056 | 0.037 | 0.633 | 0.725 |
| Hubera cerasoides (Roxb.) Chaowasku | 0.056 | 0.035 | 0.633 | 0.724 |
| Lagerstroemia speciosa (L.) Pers | 0.056 | 0.025 | 0.633 | 0.714 |
| Diospyros ferrea (Willd.) Bakh. | 0.056 | 0.024 | 0.633 | 0.713 |
| Baccaurea ramiflora Lour. | 0.056 | 0.023 | 0.633 | 0.712 |
| Gomphia serrata (Gaertn.) Kanis | 0.056 | 0.020 | 0.633 | 0.709 |
References
- Li, J.; Sun, Z.; Zhou, J.; Sow, Y.; Cui, X.; Chen, H.; Shen, Q. The Impact of the Digital Economy on Carbon Emissions from Cultivated Land Use. Land 2023, 12, 665. [Google Scholar] [CrossRef]
- Prudil, J.; Pospíšilová, L.; Dryšlová, T.; Barančíková, G.; Smutný, V.; Sedlák, L.; Ryant, P.; Hlavinka, P.; Trnka, M.; Halas, J.; et al. Assessment of carbon sequestration as affected by different management practices using the RothC model. Plant Soil Environ. 2023, 69, 532–544. [Google Scholar] [CrossRef]
- Dagiliūtė, R.; Kazanavičiūtė, V. Impact of Land-Use Changes on Climate Change Mitigation Goals: The Case of Lithuania. Land 2024, 13, 131. [Google Scholar] [CrossRef]
- Zhang, R.X.; Qu, Z.Y.; Yang, W.; Wang, L.P.; Zhang, D.L.; Liu, L.; Li, J.J.; Zhang, Z.M. Biochar addition enhances annual carbon stocks and ecosystem carbon sink intensity in saline soils of the Hetao Irrigation District, Inner Mongolia. Plant Soil Environ. 2024, 70, 263–275. [Google Scholar] [CrossRef]
- Gabric, A.J. The Climate Change Crisis: A Review of Its Causes and Possible Responses. Atmosphere 2023, 14, 1081. [Google Scholar] [CrossRef]
- Uttaruk, Y.; Khoa, P.V.; Laosuwan, T. A guideline for greenhouse gas emission reduction and carbon sequestration in forest sector based on Thailand Voluntary Emission Reduction Programme. Sains Malays. 2024, 53, 477–486. [Google Scholar] [CrossRef]
- Tokeeree, Y.; Jarat, C.; Novacek, D.; Saraphi, N. Carbon storage in biomass of perennial plants at ban sangtawan community forest, Surin province. PSRU J. Sci. Technol. 2020, 5, 23–36. [Google Scholar]
- Citizenthaipbs. Carbon Neutrality. Available online: https://thecitizen.plus/node/86607 (accessed on 2 May 2024).
- IPST. Photosynthesis. Available online: https://www.ipst.ac.th/learning/21712/20220310-photosynthesis.html (accessed on 5 May 2024).
- Jin, Y.; Liu, C.; Qian, S.S.; Luo, Y.; Zhou, R.; Tang, J.; Bao, W. Large-scale patterns of understory biomass and its allocation across China’s forests. Sci. Total Environ. 2022, 804, 150169. [Google Scholar] [CrossRef]
- Wang, L.; Li, L.; Chen, X.; Tian, X.; Wang, X.; Luo, G. Biomass allocation patterns across China’s terrestrial biomes. PLoS ONE 2014, 9, e93566. [Google Scholar] [CrossRef]
- Temwut, S.; Chaitieng, T. Biomass and carbon stock of trees in the plant genetic conservation and returning of wild animals project in kalasin university (namon area). J. Res. Unit Sci. Technol. Environ. Learn. 2024, 12, 150–159. [Google Scholar]
- Timilsina, N.; Staudhammer, L.C.; Escobedo, J.; Escobedo, F.J.; Lawrence, A. Tree biomass, wood waste yield, and carbon storage changes in an urban forest. Landsc. Urban Plan. 2014, 127, 18–27. [Google Scholar] [CrossRef]
- Thongmee, T.; Som-ard, J.; Jitsukka, W. Evaluation of above-ground carbon sequestration of forest in mahasarakham university using remote sensing data. J. Sci. Technol. Mahasarakham Univ. 2019, 38, 586–597. [Google Scholar]
- Uttaruk, Y.; Laosuwan, T. Development of prototype project for carbon storage and greenhouse gas emission reduction from Thailand’s agricultural sector. Sains Malays. 2019, 48, 2083–2092. [Google Scholar] [CrossRef]
- Laosuwan, T.; Uttaruk, Y.; Sangpradid, S.; Butthep, C.; Leammanee, S. The Carbon Sequestration Potential of Silky Oak (Grevillea robusta A.Cunn. ex R.Br.), a High-Value Economic Wood in Thailand. Forests 2023, 14, 1824. [Google Scholar] [CrossRef]
- Carboncredits. The Ultimate Guide to Understanding Carbon Credits. 2020. Available online: https://carboncredits.com/the-ultimate-guide-to-understanding-carbon-credits/ (accessed on 11 January 2024).
- Laosuwan, T.; Uttaruk, Y.; Rotjanakusol, T. Atmospheric Environment Monitoring in Thailand via Satellite Remote Sensing: A Case Study of Carbon Dioxide. Pol. J. Environ. Stud. 2023, 32, 3645–3651. [Google Scholar] [CrossRef] [PubMed]
- TGO. The Concept of the Carbon Offsetting. Available online: https://thaicarbonlabel.tgo.or.th/index.php?lang=EN&mod=WTI5dVkyVndkRjl2Wm1aelpYUjBhVzVu (accessed on 20 February 2024).
- TGO. Carbon Credit Mechanism. Available online: https://www.thailand-energy-academy.org/assets/upload/coursedocument/file/01%20Carbon%20Credit%20Mechanism.pdf (accessed on 21 February 2024).
- TGO. Thailand Greenhouse Gas Management Organization (Public Organization). Available online: https://www.tgo.or.th/2023/index.php/th/ (accessed on 22 February 2024).
- TGO. What Is T-VER? Available online: https://ghgreduction.tgo.or.th/en/what-is-t-ver/what-is-t-ver.html (accessed on 22 February 2024).
- Adegun, O.B. When green is grievous: Downsides of human-nature interactions in informal urban settlements. J. Urban. 2018, 11, 329–346. [Google Scholar] [CrossRef]
- FAO. Urban Forests: Aglobal Perspective. Available online: https://openknowledge.fao.org/server/api/core/bitstreams/c27b6b7f-52fc-4706-a485-c53df42dd6d2/content (accessed on 25 February 2024).
- Chishaleshale, M.; Shackleton, C.M.; Gambiza, J.; Gumbo, D. The prevalence of planning and management frameworks for trees and green spaces in urban areas of South Africa. Urban For. Urban Green. 2015, 14, 817–825. [Google Scholar] [CrossRef]
- Zhang, B.; Xie, Z.; She, X.; Gao, J. Quantifying the Potential Contribution of Urban Forest to PM2.5 Removal in the City of Shanghai, China. Atmosphere 2021, 12, 1171. [Google Scholar] [CrossRef]
- Fujimoto, M.; Puangchit, L.; Sugawara, F.; Sripraram, D.; Jiamjeerakul, W.; Kato, H. Carbon Sequestration Estimation of Urban Trees in Parks and Streets of Bangkok Metropolitan, Thailand. Thai J. For. 2016, 35, 30–41. [Google Scholar]
- Singkran, N. Carbon sink capacity of public parks and carbon sequestration efficiency improvements in a dense urban landscape. Environ. Monit. Assess. 2022, 194, 750. [Google Scholar] [CrossRef]
- TGO. Thailand Voluntary Emission Reduction Program Reference Manual: Forestry and Agriculture Sector. Available online: http://conference.tgo.or.th/download/TGO_InfoCenter/Section9/Book/TVER_ForestryArgiculture.pdf (accessed on 22 February 2024).
- TGO. T-VER-S-TOOL-01-01. Available online: https://tver.tgo.or.th/database/public/tools/1?lang=en (accessed on 28 February 2024).
- Whittaker, R.H. Communities and Ecosystems; Macmillan, Collier Macmillan Ltd.: London, UK, 1970. [Google Scholar]
- Shannon, C.E.; Weaver, W.W. The Mathematical Theory of Communication; University of Illinois Press: Urbana, IL, USA, 1949. [Google Scholar]
- Pielou, E.C. Ecological Diversity; Wiley: New York, NY, USA, 1975. [Google Scholar]
- Tsutsumi, T.; Yoda, K.; Sahunalu, P.; Dhanmanonda, P.; Prachaiyo, B. Forest: Felling, Burning and Regeneration. In Shifting Cultivation. An Experiment at Nam Phrom, Thailand and Its Implications for Upland Farming in the Monsoon Tropics; Kyuma, K., Pairintra, C., Eds.; Kyoto University, Faculty of Agriculture: Tokyo, Japan, 1983. [Google Scholar]
- Viriyabuncha, C.; Peawsa-ad, K. Assessment of the Potentiality of Re-Afforestation Activities in Climate Change Mitigation, Annual Report April, 2001–March, 2002; Forest Research Office, Royal Forest Department: Bangkok, Thailand, 2002. [Google Scholar]
- Visaratana, T.; Chernkhuntod, C. Floristic composition and aboveground trees biomass in dry evergreen forest. In Proceedings of the Forestry and Climate Change: Forests and Climate Change, Bangkok, Thailand, 16–17 August 2004. [Google Scholar]
- SCB. Economic Intelligence Center: Key Challenges in Thailand’s Carbon Credit Market. Available online: https://www.scbeic.com/en/detail/file/product/8952/gl13e47v9s/SCB-EIC_Future-Perspective_Carbon-credit_EN_20230420.pdf (accessed on 8 March 2024).
- Nowak, D.J.; Hoehn, R.E., III; Crane, D.E.; Stevens, J.C.; Walton, J.T. Assessing Urban Forest Effects and Values, Washington, D.C.‘s’ Urban Forest; Resour. Bull. NRS-1; Department of Agriculture, Forest Service, Northern Research Station: Newtown Square, PA, USA, 2006. [Google Scholar]
- USDA. Urban Forests and Climate Change. Available online: https://www.fs.usda.gov/ccrc/topics/urban-forests (accessed on 1 June 2024).
- Locosselli, G.M.; Camargo, E.P.; Moreira, T.C.L.; Todesco, E.; Andrade, M.F.; André, C.D.S.; André, P.A.; Singer, M.J.; Ferreira, L.S.; Saldiva, P.H.N.; et al. The role of air pollution and climate on the growth of urban trees. Sci. Total Environ. 2019, 666, 652–661. [Google Scholar] [CrossRef]
Disclaimer/Publisher’s Note: The statements, opinions and data contained in all publications are solely those of the individual author(s) and contributor(s) and not of MDPI and/or the editor(s). MDPI and/or the editor(s) disclaim responsibility for any injury to people or property resulting from any ideas, methods, instructions or products referred to in the content. |
© 2024 by the authors. Licensee MDPI, Basel, Switzerland. This article is an open access article distributed under the terms and conditions of the Creative Commons Attribution (CC BY) license (https://creativecommons.org/licenses/by/4.0/).