Article

Measurement and Spatio–Temporal Pattern Evolution of Urban–Rural Integration Development in the Chengdu-Chongqing Economic Circle

1
School of Geographical Sciences, Southwest University, Chongqing 400715, China
2
Institute of Innovation & Entrepreneurship, Hanhong College, Southwest University, Chongqing 400715, China
3
Research Center for New Land-Sea Corridor and Regional Development, Southwest University, Chongqing 400715, China
*
Author to whom correspondence should be addressed.
Land 2024, 13(7), 942; https://doi.org/10.3390/land13070942
Submission received: 31 May 2024 / Revised: 19 June 2024 / Accepted: 25 June 2024 / Published: 28 June 2024
(This article belongs to the Section Urban Contexts and Urban-Rural Interactions)

Abstract

:
This paper focuses on the level of urban–rural integration development and its spatio–temporal evolution patterns in the Chengdu-Chongqing Economic Circle. It constructs an evaluation indicator system encompassing five dimensions: population, economy, society, ecology, and space. By comprehensively using statistical data and multi-source spatio–temporal data and employing methods such as the entropy method, ESDA, obstacle degree model, and various statistical techniques, the study measures and analyzes the level of urban–rural integration development at three time points: 2010, 2015, and 2020. The findings are as follows: (1) The overall level of urban–rural integration is low, predominantly at low to lower-middle levels, with a clear core-periphery spatial pattern where central urban areas such as Chengdu’s central seven districts and Chongqing’s central urban districts are high-value cores, whereas peripheral and central regional areas are less integrated. (2) From 2010 to 2020, there was a steady increase in integration levels, transitioning from a single-core to a more dynamic point-axis structure with emerging regional growth poles. However, this transition was accompanied by reduced inequality of urban–rural integration within each city, while disparities among central urban areas within its cities gradually increased. (3) The analysis of obstacles across dimensions indicates that spatial integration faces the most significant barriers, mainly due to geographical conditions and development constraints in southwestern mountainous counties. In contrast, barriers to economic and social integration, though initially lower, have gradually increased, highlighting imbalances between economic growth and social service provision. Overall, this study not only provides a systematic measurement and analytical framework for the integration and development of urban and rural areas in the Chengdu-Chongqing Economic Circle but also offers theoretical and empirical support for global research and practice on urban–rural integration. Additionally, it proposes targeted policy recommendations.

1. Introduction

Urban–rural integration is a universal trend in the development of urban–rural relationships worldwide, serving as an essential pathway to creating a coordinated and sustainable human society. With the rapid urbanization of developing countries, urban–rural relationships have once again become a focal point for regional sustainable development. Urban–rural integrated development has emerged as a crucial strategy for many countries globally to address urban–rural disparities and promote balanced regional development. Particularly in developing countries, the effective flow of resources, capital, and information between urban and rural areas is vital for comprehensive economic and social development. The imbalance in urban–rural development and the lack of coordination in regional development constitute core challenges in China’s modernization process [1]. This requires a thorough analysis of the intrinsic logic of urban–rural relationships and the exploration of new strategies for regional urban–rural integrated development.
In 2007, Chongqing and Chengdu were the first cities in China to be designated as pilot areas for comprehensive urban–rural integrated reform, fostering the innovation of urban–rural integration systems and unified operation mechanisms. This provided a practical foundation for exploring comprehensive development strategies and regional benchmarks for China’s modernization. Therefore, analyzing the spatial-temporal differentiation patterns and laws of urban–rural integration in the Chengdu-Chongqing Economic Circle holds significant research value for establishing new international models for coordinated urban–rural development.
The urbanization process began relatively early worldwide, prompting continuous reflection and reconstruction of urban–rural integrated development during industrialization and urbanization. Early studies on urban–rural integration primarily employed qualitative analysis to explore its theoretical foundations and implementation strategies. Theoretically, Thomas More proposed the ideal of urban–rural integration in “Utopia” [2], Howard’s garden city design concept of urban–rural integration [3], and Marx and Engels’ discussion of urban–rural integration as the final stage of urban–rural relationship development [4], all of which provide important perspectives for understanding the development of urban–rural relationships. However, in empirical research, the achievements of developed countries have been relatively limited, mainly analyzing the roles of the natural environment [5] and commuting links [6] in urban–rural integrated development through statistical data. In recent years, developing countries, which started urbanization relatively late, have actively explored empirical changes in urban–rural relationships and sought standard paths for urban–rural integrated development during their rapid urbanization process. Theories like Arthur Lewis’s dual-sector economic model [7], Michael Lipton’s urban bias theory [8], and Terry McGee’s Desakota model [9] have increasingly enhanced our comprehension of urban–rural complexities in developing nations. Particularly in China, research has thoroughly examined the theoretical mechanisms of urban–rural integration [10], assessed integration levels, and analyzed prevailing patterns. Systems theory highlights the synergy, complementarity, and integration between urban and rural areas [11,12,13], whereas composite theory concentrates on their multidimensional integration, covering economic, ecological, social, elemental, industrial, and residential aspects [14,15,16]. Research primarily focuses on macro-scale subjects like nations [17], economic zones [16,18,19], provinces [13,15,20], and prefecture-level cities [21], with hotspots in developed areas like the Capital Region [18,22], the Yangtze River Delta [23,24], and Jiangsu Province [25]. In the field of urban–rural integration, the measurement of integration levels has shifted from qualitative to quantitative analysis [26,27,28,29]. Additionally, the use of multi-source spatio–temporal data in urban–rural integration research at the municipal and county levels is gradually expanding [24]. While significant progress has been made in measuring levels, analyzing spatio–temporal patterns, and providing a quantitative basis for urban–rural integration pathways, there are still deficiencies. One issue is that current evaluation systems excessively depend on the traditional urban–rural dual structure’ concept, lacking comprehensive indicators for the interactive integration of urban and rural areas. Another issue is that research relies on traditional socio-economic data, which faces problems like inconsistent measures, varying statistical subjects, and data gaps, complicating the accurate depiction of spatial dynamics. However, emerging multi-source spatio–temporal big data can provide a more immediate and comprehensive perspective. Additionally, current research mainly focuses on the macro level, with limited work on county-level subjects. Hotspots are primarily in economically developed eastern areas, despite inadequate analysis of the spatio–temporal patterns and evolutionary characteristics of urban–rural integration in regions like the Chengdu-Chongqing Economic Circle. Consequently, this study targets the Chengdu-Chongqing Economic Circle, using counties as the basic units. It integrates concepts of urban–rural integration to develop an evaluation system using both statistical and multi-source spatio–temporal big data. Through exploring the spatiotemporal distribution and evolution characteristics of urban–rural integration in the Chengdu-Chongqing economic circle, this research provides a reference for regional urban–rural integration development.

2. Theoretical Framework

2.1. Scientific Connotation of Urban–Rural Integration Theory

The report of the 20th National Congress of the Communist Party of China emphasizes that Chinese-style modernization is modernization with a large population scale, modernization where all people prosper together, modernization where material civilization and spiritual civilization are coordinated, and modernization where people and nature coexist harmoniously. Chinese-style modernization endows urban–rural integration development at the county level with new connotations and missions [1]. It must unswervingly promote people-centered new urbanization, prioritize agricultural and rural development, achieve urban–rural integration, and facilitate the free flow of urban–rural elements. Urban–rural development issues originate from the movement of population between cities and the countryside [11]. Addressing urban problems to achieve urban–rural integration requires focusing on human development needs. Regional spatial infrastructure provides basic conditions for population agglomeration, leading to economic development pursuits, social public service demands, and living environment requirements, ultimately creating regional spatial structures. People-centered urban–rural integration focuses not only on economic growth but also on social justice, ecological sustainability, and spatial optimization. People-centricity requires rational guidance of population flow, promoting the bidirectional flow of various urban–rural elements, steadily advancing basic public service coverage, continuously improving population quality, and promoting comprehensive human development and social fairness, allowing urban and rural residents to share the fruits of modernization construction.
Therefore, the definition of urban–rural integrated development is based on the coupled coordination of urban and rural systems [11], with a core focus on human development. This involves the free flow of resources and elements between urban and rural systems [30], promoting the complementary and coordinated development of these elements. It further advances the integrated and coordinated development of production, living, and ecological spaces between urban and rural areas, ultimately achieving comprehensive human development and harmonious coexistence between humans and nature [31].
Urban and rural areas form an organic whole, and urban–rural development is not a mutually exclusive relationship. Urban–rural integration represents a sustainable development state of interactive integration, bidirectional flow, and balanced distribution of elements within urban–rural systems. The interactive and symbiotic nature of urban–rural systems embodies the core development philosophy of “people-centered and human-land harmony”, balancing equity and efficiency, facilitating the free bidirectional flow of population, industries, capital, technology, and other elements, seeking people’s welfare, and achieving human-land harmonious coexistence. Urban–rural interactions depend largely on population as the core element flowing across the urban–rural interface, enabling economic, social, ecological, and spatial transformations to meet human development needs and achieve comprehensive development. Therefore, urban–rural integration development should aim to achieve comprehensive integration development from the perspective of interactive coordination between urban and rural subsystems, enabling the free flow of population, shared economic development, equal social services, livable ecological environments, and orderly spatial layouts between urban and rural areas (Figure 1) [21].

2.2. Indicators System Construction

Based on the concept of equalization and existing quantitative research on urban–rural relations, this study adheres to the principles of data representativeness, objectivity, and accessibility. The selection and evaluation of indicators are carried out in accordance with the actual development of urban–rural integration in the Chengdu-Chongqing Economic Circle. In the process of determining specific indicators, in order to select a diverse range of indicators for a comprehensive and scientific reflection, this study refers to the research of Zhou et al. [32]. It is based on a search of core journal keywords in the China National Knowledge Infrastructure (CNKI) in May 2023. From a total of 686 journal articles, 59 core journal articles related to the evaluation indicator system of urban–rural integration development were selected. The most representative indicators were determined using frequency analysis and expert consultation methods (Table 1).
Referring to the high-frequency indicators in Table 1, to ensure the objectivity and accuracy of the evaluation results, a comprehensive evaluation index system is constructed for the Chengdu-Chongqing Economic Circle by integrating principles of holism and systems theory. This aims to achieve urban–rural symbiosis and integration. Under the goal of urban–rural integrated development, the evaluation indicators are constructed across five dimensions: economy, population, ecology, society, and space [21]. The specific calculation methods for representative indicators that characterize the integrated development status of each dimension are shown in Table 2. Among these, higher values of positive indicators are more beneficial for urban–rural integration, while the opposite is true for negative indicators.
In terms of population development, the proportion of non-agricultural employment reflects the basic employment structure of urban and rural populations, while the urbanization rate reveals changes in urban–rural structures and shifts in residents’ living patterns. Additionally, the population migration rate indicates the degree of population mobility between urban and rural areas. Regarding economic development, per capita GDP reflects the overall balance of economic development between urban and rural areas. The proportion of non-agricultural output indicates the optimization and diversification of the overall economic structure. Moreover, urban and rural residents per capita income ratio measures the fairness of income distribution and the improvement in living standards. In terms of social services, focusing on the hot topics of urban and rural residents, the study measures urban and rural medical resource ratios, urban and rural educational resource ratios, and urban and rural living service ratios. These indicators aim to assess the distribution of public service resources and pursue social justice and balanced development. For ecological environmental quality, the annual average PM2.5 concentration is used as an environmental monitoring indicator to assess the ecological environment of the region. Energy consumption per unit of GDP measures environmental pollution and resource consumption in the context of development, comprehensively reflecting the health and sustainability of urban and rural ecosystems. Regarding spatial layout orderliness, urban and rural transportation accessibility are analyzed to evaluate the development of transportation infrastructure and time-use efficiency. The night light index density assesses the coordination and rationality of spatial layout, revealing the degree of integration in spatial planning and development. The evaluation of urban–rural integration aims to quantify the level of urban and rural development, promote balanced development, and ultimately achieve the goal of urban–rural interaction and symbiosis.

3. Materials and Methods

3.1. Study Area

The Chengdu-Chongqing Economic Circle is an economic system formed by the dual-core development of Chengdu and Chongqing, covering surrounding areas. It is located in the upper reaches of the Yangtze River, in the Sichuan Basin, occupying a strategic core position in China’s western region. The area, in tandem with being the starting point of the New International Land-Sea Trade Corridor, has unique advantages in connecting Southwest and Northwest China, East Asia, Southeast Asia, and South Asia. The Chengdu-Chongqing Economic Circle has become the region with the highest development level and potential in western China, and it is an important part of implementing the “Belt and Road” and the Yangtze River Economic Belt.
The Chengdu-Chongqing Economic Circle encompasses the central urban districts of Chongqing and a total of 27 districts (counties), including Wanzhou and Qianjiang, as well as parts of Kaizhou District and Yunyang County. In Sichuan Province, it includes Chengdu City, Mianyang City (excluding Pingwu and Beichuan counties), Dazhou City (excluding Wanyuan), and Ya’an City (excluding Tianquan and Baoxing counties), totaling 15 cities and collectively comprising 142 county-level administrative units. The total area of the economic circle is 185,000 square kilometers. In 2022, the permanent population was 98.745 million, and the regional GDP reached 7.8 trillion yuan, accounting for 1.9%, 7.0%, and 6.4% of the national totals, respectively. Considering that some developed urban districts have an urbanization rate of 100%, to enhance the comparability of regional research, the central seven districts of Chengdu City, the central urban district of Chongqing City, and other contiguous urban areas of each city (Table 3) are merged for study. Given that Pengshui and Shizhu counties contain only a very small area within this scope and present measurement challenges, they have been excluded from the study. Consequently, the study area comprises 116 county-level units (Figure 2).

3.2. Data Sources

Considering limitations in data acquisition, the research period is set for ten years, specifically utilizing data from 2010, 2015, and 2020 in five-year cycles. The data are predominantly categorized into three types. The first type, socio-economic data, is sourced from the China Urban Statistical Yearbook, regional social statistics bulletins, and census data. The energy consumption per unit of GDP refers to Chen Jiandong’s energy efficiency studies [35]. To maintain the completeness of the statistical data, missing data for specific years are interpolated linearly. The second type of data consists of vector data; vector data for Chongqing is obtained from Chongqing’s Planning and Natural Resources Bureau, while Sichuan’s vector data are downloaded from BigMap and then verified against the administrative boundaries of Chongqing. Additionally, the study incorporates point-of-interest (POI) data, road network data, and DMSP-OLS big data for a multifaceted exploration (Table 4).

3.3. Data Processing and Research Methods

Considering the difficulty of clear boundary delineation between urban and rural areas within counties and the measurement of urban area changes over long time series, 30-m remote sensing data from Yang Jie et al. [36] is used to classify impervious surfaces as urban areas, with the rest as rural areas. The accessibility of urban–rural traffic is calculated using grid cost calculations, considering obstacles such as mountains, rivers, and terrain undulations, and 15-min living circles are used to measure urban–rural traffic accessibility.
In order to eliminate the effect of magnitude, the indicators are standardized for positive and negative polarity, respectively, according to their positive and negative properties (Table 2). Considering the extensive temporal and spatial scope of the indicators and to minimize subjective bias in evaluation, the study used the objective entropy weighting method. To facilitate comparisons across different years and ensure consistency in the weights of indicators over time, thereby enhancing the temporal comparability of the measurements, an improved entropy method incorporating a temporal variable was used for the calculations. This method produced the indicator weights (Table 2) and computed the comprehensive scores for each county. Drawing on related research [21], scores were processed using the standard deviation method. This approach uses the mean as a baseline and the standard deviation as a scale to categorize the urban–rural integration development over three years into four levels: low level (below the mean − 0.5 standard deviation), medium level (mean ± 0.5 standard deviation), medium-high level (mean + (0.5~1.5 standard deviation)), and high level (above the mean + 1.5 standard deviation).
To depict the spatio–temporal dynamic distribution pattern of urban–rural integration development, ESDA is used for spatial autocorrelation testing [18]. Spatial autocorrelation analysis measures the spatial aggregation and hot spot characteristics of urban–rural integration development in the Chengdu-Chongqing Economic Circle, using the global Moran’s I index to measure the spatial aggregation degree of urban–rural integration levels and the Getis-Ord G* index to explore the local spatial dependence and heterogeneity of urban–rural integration levels.
Based on this, the main barriers affecting the overall level of urban–rural integration development in the Chengdu-Chongqing Economic Circle are analyzed and diagnosed, enabling targeted discussion of the pathologies of regional urban–rural integration development and the proposal of tailored policy recommendations. The specific methods are as follows:
Three fundamental variables are introduced: Factor Contribution   F i , Indicator Deviation O j , Indicator Obstacle U i , and Dimensional Obstacle. The Factor Contribution F i represents the contribution of a single indicator to the overall objective, which in this context is the urban–rural integration development in the Chengdu-Chongqing area. The Indicator Deviation I i is the discrepancy between the actual value of each indicator and its optimal target value. The specific calculation formula is = F i = R i · W i (where R i is the dimensional weight, and W i is the indicator weight), and I i = 1 − X ij , where X ij represents the standardized value of the indicator, obtained through range standardization. The size of the Dimensional Obstacle can represent the degree of impact of each dimension on the urban–rural integration development in the Chengdu-Chongqing area. The calculation formulas are as follows:
Indicator Obstacle:
O j = I i · F i i = 1 m I i · F i
Dimensional Obstacle:
U i = O ij O j
In the formula, O ij represents the indicator obstacle within each dimension.

4. Results

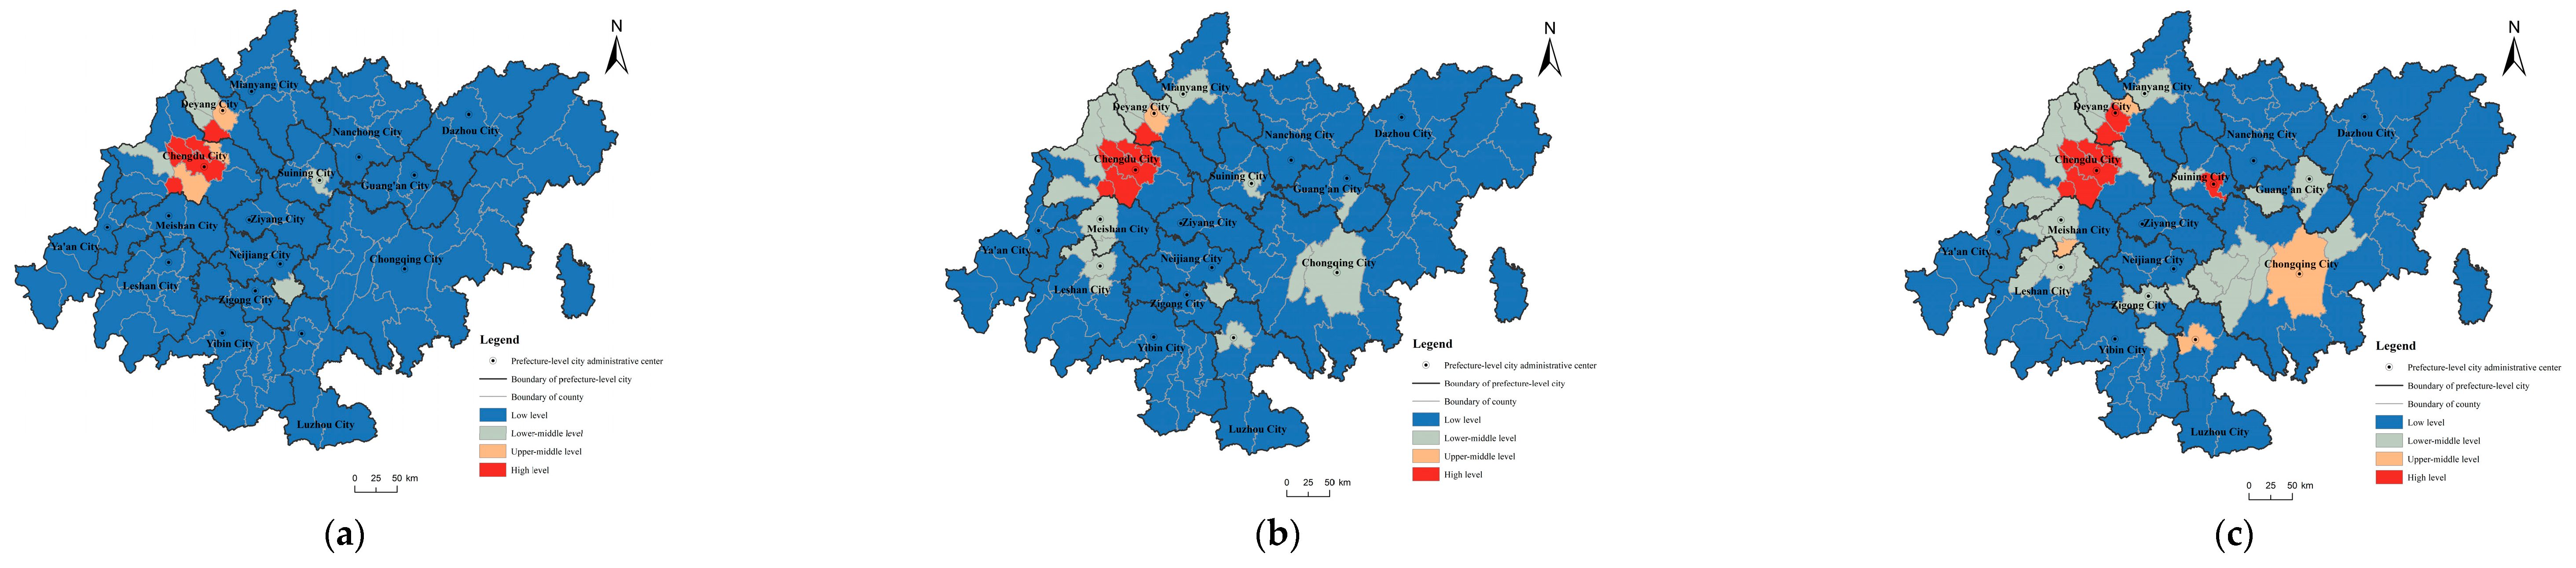
4.1. Current Characteristics of Urban–Rural Integration in the Chengdu-Chongqing Economic Circle

(1) The overall level of urban–rural integration is generally low, with significant disparities.
In 2020, the overall level of urban–rural integration development in the Chengdu-Chongqing Economic Circle lagged behind, with most counties at low to lower-middle levels. This distribution trend was notably concentrated (Figure 3). Among the 116 county units in that year, only 11 met the high-level integration standard, and only 42 counties exceeded the average level of 0.304. Particularly, Gulin County in Leshan City, Mabian Yi Autonomous County, and Xuyong County in Luzhou City remained at low levels of urban–rural integration. In contrast, Chengdu’s central urban areas and surrounding counties demonstrated outstanding performance in urban–rural integration development. Xinjin District, Wenjiang District, and Xindu District, as leading counties in development, each achieved integration levels exceeding 0.7. This reflects a significant disparity in development between low-level and high-level counties.
(2) The spatial layout shows a clear core-periphery structure.
Spatially, the urban–rural integration development in the Chengdu-Chongqing Economic Circle exhibits a core-periphery pattern centered on the central districts of Chengdu and Chongqing. These two core areas and their surroundings generally show high development levels. Moreover, the central seven districts of Chengdu exhibit a higher degree of polarization compared with the central urban districts of Chongqing, forming a high-value aggregation area (Figure 4).
In the secondary core structure, the central urban areas of each city are the core within the city area, with prominent regional advantages, and surrounding districts and counties are peripheral areas. “Central urban areas” are the most mature and highest-level regions for urban–rural integration development, mainly concentrated in the core areas of the Chengdu-Chongqing region. These central urban areas have obvious advantages in economic development, population agglomeration, public services, etc., and are key forces driving urban–rural integration development in the entire economic circle. Conversely, peripheral areas distant from central cities lag in development, representing different levels and stages of urban–rural integration development. These regions geographically surround or connect central urban areas, forming a gradient distribution of urban–rural integration development. The integration level of these regions gradually decreases with increasing distance from the central urban areas. However, the central urban areas of Dazhou City and Ziyang City show relatively low development levels compared with other central urban areas, with similar integration levels to other districts and counties within the city area, resulting in smaller differences in urban–rural integration development levels throughout Dazhou City and Ziyang City. Overall, the spatial pattern of urban–rural integration development in the Chengdu-Chongqing Economic Circle presents an unbalanced pattern led by central urban areas.
(3) The integration development levels of peripheral and central regions’ counties are lower.
The spatial distribution of urban–rural integration development levels in the Chengdu-Chongqing Economic Circle also shows lagging development in central regions and southern and northern peripheral regions. The central region of Ziyang City is limited by its insufficient economic activity and low urban–rural industrial level, coupled with the siphon effect of Chengdu and Chongqing, resulting in relatively weak urban–rural integration development. The peripheral counties in the southern (Ya’an, Leshan, Yibin, and Luzhou) and northern (Nanchong, Dazhou, and Chongqing) regions, being edge zones of the Chengdu-Chongqing Economic Circle, are located near the Yunnan-Guizhou Plateau and the Qinba Mountains, with large terrain undulations, poor transportation conditions, and relatively difficult communication with central regions. These factors collectively highlight agricultural and rural issues in these regions, affecting the overall level of urban–rural integration.

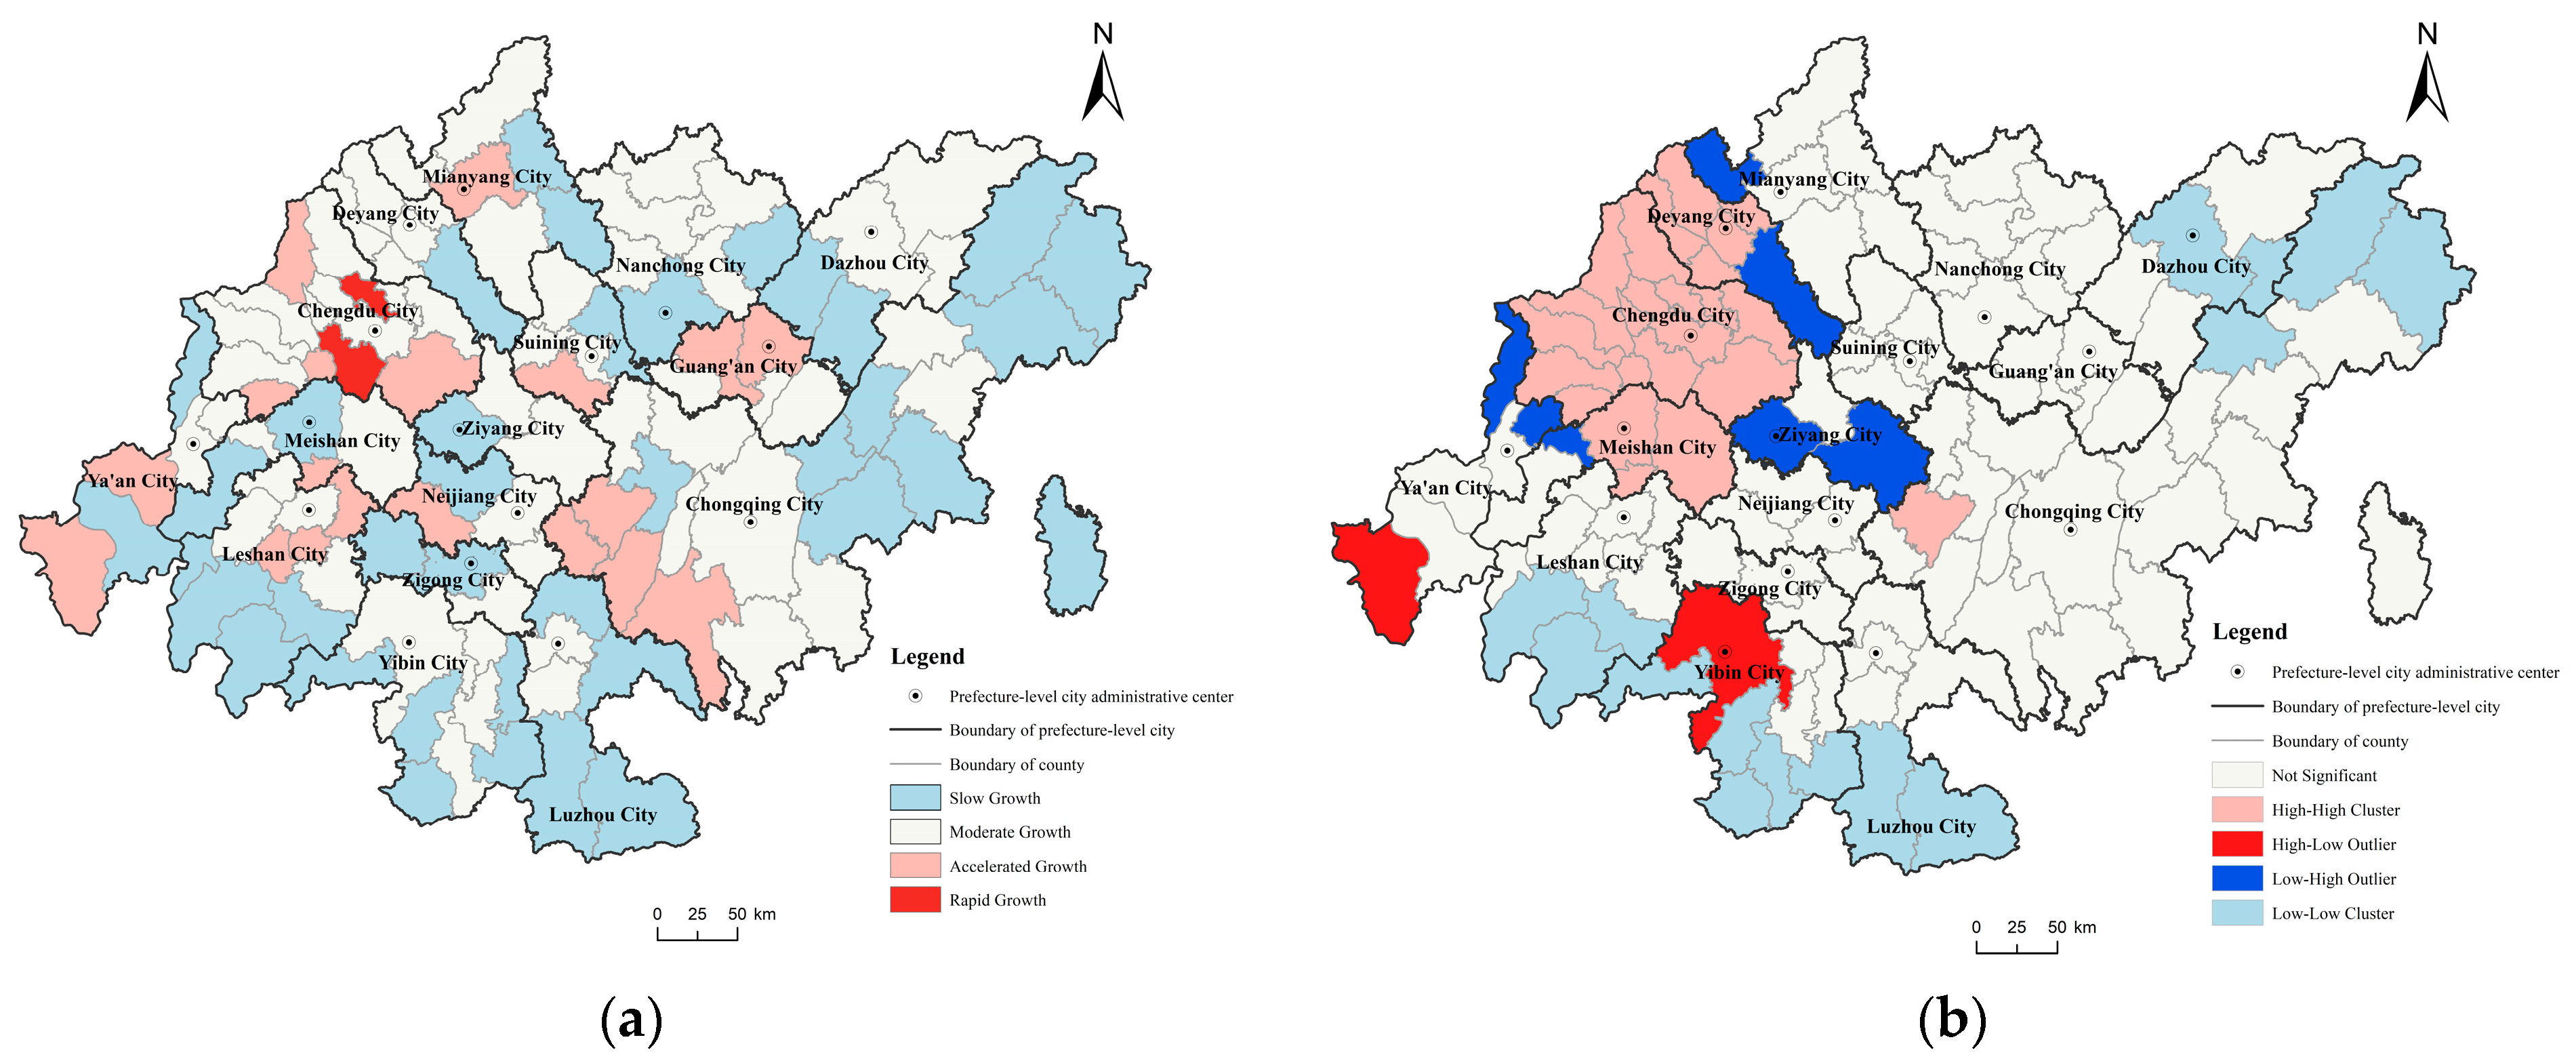
4.2. Spatio–Temporal Evolution Patterns of the Chengdu-Chongqing Economic Circle

(1) The level of urban–rural integration within the region increases over time.
From 2010 to 2020, the urban–rural integration development level of counties within the Chengdu-Chongqing Economic Circle increased over time, with rapid growth in only Shuangliu District (4.2) and Xindu District (3.4), 19 counties with relatively fast growth, nearly half of the counties at a moderate growth rate, and 38 counties with slow growth rates (Table 5).
(2) Regional growth poles appear in Chengdu, Deyang, and Meishan cities.
Benefiting from convenient transportation, active economies, and strong policy support, Chengdu, Deyang, and Meishan have large concentrated areas of high integration development speed, becoming regional growth poles. These high-value areas are accompanied by low-value surrounding zones, and the central region and peripheral counties show slower growth in urban–rural integration development, exhibiting strong clustering (Figure 5).
(3) The spatial layout evolves from a single-core structure to a point-axis structure.
In 2010, the overall urban–rural integration development in the region showed a single-core structure centered on Chengdu (Figure 6a), with extreme differences in urban–rural integration and significant polarization. Chengdu’s natural endowment advantages, flat terrain, and relatively smooth transportation make it a high-value hotspot center. Only a few central urban areas, including Chongqing’s central urban area, had better development levels. In 2015, areas of upper-middle and high-level integration in Chengdu continued to expand, with significant development observed in the central urban areas of each city (Figure 6b). By 2020, the Chengdu-Chongqing Economic Circle exhibited significant regional differences in urban–rural integration levels, forming a spatial diffusion pattern with Chengdu’s central seven districts and Chongqing’s central urban districts as dual cores (Figure 6c). On this basis, the integration of the Chengdu-Mianyang-Leshan development axis and the Western Chongqing region development axis became the main focus, with low to lower-middle levels becoming the majority. Urban–rural integration development has mitigated polarization but still shows spatial imbalance. The two main development axes rely on convenient intercity transportation infrastructure, promoting the free flow of resources and high integration between urban and rural areas, achieving regional interaction and mutual benefit. Notably, the spatial integration of the Western Chongqing region and Sichuan’s southern areas is gradually aggregating, with the two main development axes converging, providing strong momentum for the integrated urban–rural development of the Chengdu-Chongqing area.
(4) Urban–rural integration inequality within cities decreases, but differences between central urban areas increase.
To evaluate disparities in urban–rural integration across various prefecture-level cities and ensure inter-regional equality, the Theil index [18] is utilized to assess both equality and variability within each city. As urban–rural integration progresses, the Theil index for most cities shows a significant downward trend, indicating enhanced integration levels and reduced inequality. Specifically, Dazhou City consistently displays the lowest Theil index; however, its urban–rural integration level remains low, sustaining a low-level equilibrium throughout the region. Zigong City initially experienced a notable increase followed by a minor decrease in its Theil index, indicative of a widening urban–rural gap within its counties. Additionally, variations in the Theil index among cities are increasingly becoming uniform, progressively narrowing inter-city disparities. This pattern highlights the substantial effects of urban–rural integration development across diverse cities and their districts and counties.
As the socioeconomic and population concentration centers within the city region, central urban areas possess relatively well-developed infrastructure for urban–rural interactions and robust urban development momentum. This facilitates the transformation of central urban areas from agricultural and rural settings to urban environments, while also improving the infrastructure for the flow of urban and rural elements. In the long term, as the core growth poles within the city region, the speed and efficiency of urban–rural integrated development in central urban areas should, under normal circumstances, be significantly higher than in other counties, thereby playing a growth pole role and promoting balanced development in other counties. However, in the Chengdu-Chongqing Economic Circle, the range and standard deviation of urban–rural integration levels among the central urban areas of different prefecture-level cities are on the rise (Figure 7), indicating an expanding disparity among these central urban areas. Additionally, many central urban areas are developing at a slower pace (Table 4), lagging behind the development of several counties. This suggests that the driving force behind county development within each city region is not the diffusion effect of the central urban areas. Instead, the region’s targeted poverty alleviation and support for underdeveloped areas have significantly contributed to achieving internal balance and reducing internal disparities. This phenomenon demonstrates a close connection between the spatio–temporal evolution of urban–rural integrated development and China’s series of regional development policies [38].

4.3. Dimensional Barrier Analysis and Diagnosis

From an overall perspective, between 2010 and 2020, the degree of obstacles to high-quality development in the Chengdu-Chongqing Economic Circle varied significantly across different dimensions. The impact characteristics consistently followed the order of “spatial integration > population integration > social integration > economic integration > ecological development.” (Table 6) The barrier level of spatial integration was always significantly higher than that of other dimensions, remaining elevated amidst fluctuations. This indicates that spatial factors greatly influence the composite scores, often constraining the comprehensive urban–rural development level of a county. Conversely, with accelerated multi-scale ecological governance improvements, the ecological dimension had the lowest and consistently decreasing barrier level.
The barrier levels of the population, economic, and social dimensions are similar, each around 12%. However, the barrier levels in the economic and social aspects show an increasing trend. This is particularly noteworthy, as widening economic development disparities make it increasingly difficult to achieve equitable provision of social services across different counties.
Geographic factors, particularly topographical elements, have significant value in the development of urban–rural integration within a region [33]. In terms of spatial integration, both the initial levels and the extent of increase are generally low, with slow development progress across the board. Spatial polarization was prominent, with significant differences in the spatial distribution of transportation and economic activities across counties. This is partly related to the specific geographical environment of the southwestern mountainous region. The Chengdu Plain, with its flat and open terrain, serves as the economic activity center of the entire region. Intensive development of intercity transportation along the Chengdu-Mianyang-Leshan axis has led to strong spatial agglomeration of factors along this axis, with substantial advantages in accessibility, facilitating high levels of urban–rural spatial integration spreading from Chengdu to the north and south.
Additionally, Chongqing’s central urban districts, as another core of the Chengdu-Chongqing Economic Circle, have a lower level of spatial integration compared with Chengdu. The mountainous terrain presents significant obstacles, resulting in relatively lower transportation accessibility, reaching only an upper-middle level in 2020 (Figure 8). Therefore, its capacity to drive surrounding counties is limited.

5. Conclusions and Discussion

5.1. Discussion

Within major metropolitan areas in China, urban–rural integrated development exhibits significant spatial differentiation characteristics. In the Yangtze River Delta urban agglomeration, which is the economic core of China, regions with high levels of urban–rural integration are mainly concentrated in the central areas of the urban agglomeration, while the development levels on the northern and southern sides are relatively lower [39]. The overall economic development level in the Yangtze River Delta urban agglomeration is high, with smaller internal development disparities, making it difficult to compare directly with the highly uneven development levels within the Chengdu-Chongqing Economic Circle. In contrast, the Capital Metropolitan Area, centered on Beijing, is surrounded by relatively impoverished and underdeveloped areas, showing a development situation similar to the Chengdu-Chongqing region. Like the Capital Metropolitan Area, the Chengdu-Chongqing region’s urban–rural integration also exhibits a distinct multi-level “core-periphery” structure [18,22]: the regional center versus the entire region, and central urban areas versus surrounding counties within each prefecture-level city. This structure is particularly evident at the municipal and county levels. Central urban areas, such as the central seven districts of Chengdu and the central urban areas of Chongqing, have high levels of urban–rural integration, while surrounding counties show varying development levels, forming a clear development gradient. Notably different is the fact that, due to its plain terrain, urban–rural integration development in the Capital region presents a concentric structure based on the attenuation of the influence of Beijing’s urban core. In contrast, the urban–rural integration development level in the Chengdu-Chongqing Economic Circle in the southwestern mountainous region shows a point-axis structure, where the development of transportation infrastructure plays a crucial role. The Chengdu-Mianyang-Leshan axis, centered on the central seven districts of Chengdu, and the western Chongqing axis, centered on Chongqing’s central urban area, both exhibit bidirectional development. However, the central and peripheral areas constrained by transportation development lag behind, with limited element flow to the central regions, affecting the overall level of urban–rural integration.
A comprehensive approach is vital for effective policy formulation [40]. In future development, policies should be tailored to the characteristics and needs of different regions to promote more significant results in urban–rural integration. The Chengdu-Chongqing Economic Circle must adhere to multi-center coordinated leadership, particularly by expanding the radiating effects of the central seven districts of Chengdu and the central urban areas of Chongqing. These areas should serve as models and leaders in urban–rural integration pilot zones, optimizing the flow of urban–rural elements and promoting regional integrated development. Central urban areas should also strengthen the construction of new urbanization, optimize the integration process of the agricultural migrant population, enhance the quality of urban–rural integration, and lead the surrounding counties in joint progress. Additionally, it is essential to strengthen transportation infrastructure construction, improve road and public transport networks, and achieve effective regional connections and resource sharing between counties, county cities, and core-periphery areas. This will promote overall urban–rural integration development in the Chengdu-Chongqing region. Finally, the government must strengthen its role in the spatial distribution balance, increase resource allocation to peripheral areas, ensure the development rights of underdeveloped areas, and build a coordinated, integrated, and balanced regional urban–rural development pattern to achieve comprehensive and sustainable development.

5.2. Conclusions

This study integrates statistical data with multi-source spatio–temporal data, founded on the scientific connotations of urban–rural integration. A multidimensional evaluation indicator system is constructed, covering economic, population, social, ecological, and spatial dimensions. Utilizing this system, the study systematically assesses and analyzes the level of urban–rural integration development and its spatio–temporal patterns within the Chengdu-Chongqing Economic Circle at three temporal markers—2010, 2015, and 2020. It further elaborates on the impediments to urban–rural integration development across different dimensions, with the results indicating:
(1) Current characteristics suggest that the overall level of urban–rural integration in the Chengdu-Chongqing Economic Circle is relatively low, primarily concentrated at low to lower-middle levels. The spatial pattern of integration demonstrates a distinct core-periphery structure. The highest levels of urban–rural integration are observed in the central urban areas of city regions, particularly prominent in the central seven districts of Chengdu and the central urban districts of Chongqing, while the peripheral and central regional counties exhibit lower levels of integration development.
(2) The analysis from 2010 to 2020 reveals a steady overall growth in the level of urban–rural integration in the region, with Chengdu, Deyang, and Meishan emerging as regional growth poles. Over time, the development structure of urban–rural integration has evolved from a single-core structure centered around Chengdu’s central seven districts to a more dynamic point-axis structure centered on the central areas of Chengdu and Chongqing, extending along the Chengdu-Mianyang-Leshan and Western Chongqing regions. Throughout this process, the inequality of urban–rural integration within each city area has decreased, but the disparities between central urban districts have progressively increased.
(3) Among the different dimensions, obstacles in the spatial integration dimension continue to lead, highlighting how geographical conditions and comprehensive development in the counties of the southwestern mountainous region significantly constrain the development of urban–rural integration. In contrast, although barriers in the economic and social integration dimensions are relatively lower, they display an upward trend over time, reflecting the imbalance between economic growth and the provision of social services and their negative impact on urban–rural integration.
In conclusion, this study not only provides a systematic measurement and analytical framework for the urban–rural integrated development of the Chengdu-Chongqing Economic Circle but also offers significant theoretical and empirical support for global research and practice on urban–rural integration. Finally, it presents policy recommendations based on regional analysis, offering insights for coordinated regional development and contributing to the achievement of global sustainable development goals.

Author Contributions

Conceptualization, H.Z. and H.L.; Writing—Original Draft Preparation, H.L. and G.L.; Writing—Review and Editing, H.Z. and K.L. All authors have read and agreed to the published version of the manuscript.

Funding

Project of the National Natural Science Foundation of China (42071209); Major Project of Chengdu-Chongqing Economic Zone Construction of the Chongqing Federation of Social Science (2023ZDSC01); Project S202310635101, supported by the Chongqing Municipal Training Program of Innovation and Entrepreneurship for Undergraduates.

Data Availability Statement

Data are contained within the article.

Acknowledgments

We thank all the anonymous reviewers for their insightful comments on the early version of this manuscript.

Conflicts of Interest

The authors declare no conflicts of interest.

References

  1. Hualou, L.; Xu, Y.; Zheng, Y.; Chen, K. Development of urban-rural integration in county areas under Chinese-style modernization. Econ. Geogr. 2023, 43, 12–19. [Google Scholar] [CrossRef]
  2. Skinner, Q. Thomas More’s Utopia and the Virtue of True Nobility. In Visions of Politics, 2nd ed.; Cambridge University Press: Cambridge, UK, 2002; Volume 2, pp. 213–244. [Google Scholar]
  3. Blanco Pastor, A.; Canniffe, E.; Rosa Jiménez, C.J. Learning from Letchworth and Welwyn Garden City: Garden cities’ policies for the development of existing settlements in the contemporary world. Land Use Policy 2023, 132, 106759. [Google Scholar] [CrossRef]
  4. Li, Y.H.; Yan, J.Y.; Wu, W.H.; Liu, Y. The process of rural transformation in the world and prospects of sustainable development. Prog. Geogr. 2018, 37, 627–635. [Google Scholar]
  5. Olson, J.L.; Munroe, D.K. Natural amenities and rural development in new urban-rural spaces. Reg. Sci. Policy Pract. 2012, 4, 355–371. [Google Scholar] [CrossRef]
  6. Partridge, M.D.; Ali, K.; Olfert, M.R. Rural-to-Urban Commuting: Three Degrees of Integration. Growth Change 2010, 41, 303–335. [Google Scholar] [CrossRef]
  7. Lewis, W.A. Economic Development with Unlimited Supply of Labor. Manchester Sch. Econ. Soc. Stud. 1954, 22, 139–191. [Google Scholar] [CrossRef]
  8. Lipton, M. Why Poor People Stay Poor: Urban Bias in World Development, 3rd ed.; Harvard University Press: Cambridge, MA, USA, 1977; pp. 154–196. [Google Scholar]
  9. McGee, T.G. New Regions of Emerging Rural-Urban Mix in Asia: Implications for National and Regional Policy. In Proceedings of the Emerging Urban-Regional Linkages: Challenge for Industrialization, Employment and Regional Development, Bangkok, Thailand, 16–19 August 1989. [Google Scholar]
  10. Zhu, J.; Zhu, M.; Xiao, Y. Urbanization for rural development: Spatial paradigm shifts toward inclusive urban-rural integrated development in China. J. Rural Stud. 2019, 71, 94–103. [Google Scholar] [CrossRef]
  11. Chuanglin, F. Theoretical analysis of the mechanisms and evolutionary laws of urban-rural integration development. Acta Geogr. Sin. 2022, 77, 759–776. [Google Scholar]
  12. Yansui, L. Urban-rural integration and rural revitalization in the new era of China. Acta Geogr. Sin. 2018, 73, 637–650. [Google Scholar]
  13. Zhan, L.; Wang, S.; Xie, S.; Zhang, Q.; Qu, Y. Spatial path to achieve urban-rural integration development—Analytical framework for coupling the linkage and coordination of urban-rural system functions. Habitat Int. 2023, 142, 102953. [Google Scholar] [CrossRef]
  14. He, R. Urban-rural integration and rural revitalization: Theoretical discussion, mechanism interpretation, and implementation pathways. Geogr. Res. 2018, 37, 2127–2140. [Google Scholar]
  15. Liu, M.; Li, Q.; Bai, Y.; Fang, C. A novel framework to evaluate urban-rural coordinated development: A case study in Shanxi Province, China. Habitat Int. 2024, 144, 103013. [Google Scholar] [CrossRef]
  16. Yang, X.; Feng, Z.; Chen, Y.; Xu, X. A comparative analysis of the levels and drivers of regional coordinated development in the Yangtze River Economic Belt and Yellow River Basin, China. Heliyon 2024, 10, e26513. [Google Scholar] [CrossRef] [PubMed]
  17. Zeng, Q.; Chen, X. Identification of urban-rural integration types in China—An unsupervised machine learning approach. China Agric. Econ. Rev. 2023, 15, 400–415. [Google Scholar] [CrossRef]
  18. Zhang, H.; He, R.; Li, L.; Li, G. Spatio-temporal differentiation of urban-rural integration levels and rural revitalization pathways in the capital region. J. Nat. Res. 2021, 36, 2652–2671. [Google Scholar]
  19. Zhang, X.; Qiu, F.; Zhu, C. Evolution of urban-rural integration development levels from a spatio-temporal interaction perspective in the Huaihai Economic Zone. J. Nat. Res. 2020, 35, 1867–1880. [Google Scholar]
  20. Chen, K.; Long, H.; Liao, L.; Tu, S.; Li, T. Land use transitions and urban-rural integrated development: Theoretical framework and China’s evidence. Land Use Policy 2020, 92, 104465. [Google Scholar] [CrossRef]
  21. Zheng, Y.; Long, H. Measurement and evaluation of urban-rural integration development and its spatio-temporal pattern in China. Acta Geogr. Sin. 2023, 78, 1869–1887. [Google Scholar]
  22. Zhang, H.; He, R.; Li, G.; Wang, J. Spatio-temporal evolution and influencing factors of the urban-rural integration system’s coupling coordination in the metropolitan area: A case study of the capital region. Econ. Geogr. 2020, 40, 56–67. [Google Scholar] [CrossRef]
  23. Ma, Z.; Song, W.; Wang, J.; Chen, Y.; Xiong, Y. Levels, evolution, and influencing factors of urban-rural integration development in the Yangtze River Delta region. J. Nat. Res. 2022, 37, 1467–1480. [Google Scholar]
  24. Shi, J.; Duan, K.; Wu, G.; Li, J.; Xu, K. Efficiency of urban-rural integrated development under carbon emission constraints in the Yangtze River Delta region. Econ. Geogr. 2021, 41, 57–67. [Google Scholar] [CrossRef]
  25. Li, X.; Kuang, X.; Ma, X.; Li, C. Are there interactions between the urban and rural construction land use transition? Evidence from Jiangsu province in China. Habitat Int. 2024, 148, 103092. [Google Scholar] [CrossRef]
  26. Yang, Y.; Bao, W.; Wang, Y.; Liu, Y. Measurement of urban-rural integration level and its spatial differentiation in China in the new century. Habitat Int. 2021, 117, 102420. [Google Scholar] [CrossRef]
  27. Wang, Y.; Liu, H.; Chen, X.; Song, Y. Evolutionary characteristics and regional classification of urban-rural system coupling: A case study of the three provinces in Northeast China. Geogr. Sci. 2020, 40, 1150–1159. [Google Scholar] [CrossRef]
  28. Wang, Y.; Liu, Y.; Yan, B.; Li, Y. Characteristics and influencing factors of the coordinated urban-rural development pattern in China. Geogr. Sci. 2016, 36, 20–28. [Google Scholar] [CrossRef]
  29. Huang, Y. Patterns and influencing factors of coordinated urban-rural development in the three provinces of Northeast China. Geogr. Sci. 2019, 39, 1302–1311. [Google Scholar] [CrossRef]
  30. He, R.; Yang, H.; Zhang, H.; Yuan, C. Urban-rural integration development paths from the perspective of “urban-rural convection”. J. Desert Res. 2022, 42, 32–40. [Google Scholar]
  31. Xu, C.; Li, J. The scientific connotation and realization paths of urban-rural integrated development: Reflections based on Marxist urban-rural relationship theory. Economist 2019, 01, 96–103. [Google Scholar] [CrossRef]
  32. Zhou, D.; Qi, J.; Zhong, W. A comprehensive review of urban-rural integration evaluation research: Content identification, theoretical cognition, and system reconstruction. J. Nat. Res. 2021, 36, 2634–2651. [Google Scholar]
  33. Pan, W.; Wang, J.; Li, Y.; Chen, S.; Lu, Z. Spatial pattern of urban-rural integration in China and the impact of geography. Geogr. Sustain. 2023, 4, 404–413. [Google Scholar] [CrossRef]
  34. Wu, Y.; Li, H. Spatial evolution and measurement of inner connectivity in urban-rural integration areas of metropolises: Based on nighttime light data from Wuhan. Prog. Geogr. Sci. 2020, 39, 13–23. [Google Scholar] [CrossRef]
  35. Chen, J.; Liu, J.; Qi, J.; Gao, M.; Cheng, S.; Li, K.; Xu, C. City- and county-level spatio-temporal energy consumption and efficiency datasets for China from 1997 to 2017. Sci. Data 2022, 9, 101. [Google Scholar] [CrossRef] [PubMed]
  36. Chen, C.; LeGates, R.; Zhao, M.; Fang, C. The changing rural-urban divide in China’s megacities. Cities 2018, 81, 81–90. [Google Scholar] [CrossRef]
  37. Yang, J.; Huang, X. The 30 m annual land cover datasets and its dynamics in China from 1985 to 2022. Earth Syst. Sci. Data 2023, 13, 3907–3925. [Google Scholar] [CrossRef]
  38. Wu, Y.; Shi, K.; Chen, Z.; Liu, S.; Chang, Z. An Improved Time-Series DMSP-OLS-like Data (1992–2022) in China by Integrating DMSP-OLS and SNPP-VIIRS, V4; Harvard Dataverse: Cambridge, MA, USA, 2021. [Google Scholar] [CrossRef]
  39. Tang, D.; Mao, M.; Shi, J.; Hua, W. The Spatio-Temporal Analysis of Urban-Rural Coordinated Development and Its Driving Forces in Yangtze River Delta. Land 2021, 10, 495. [Google Scholar] [CrossRef]
  40. Baffoe, G.; Zhou, X.; Moinuddin, M.; Somanje, A.N.; Kuriyama, A.; Mohan, G.; Saito, O.; Takeuchi, K. Urban–rural linkages: Effective solutions for achieving sustainable development in Ghana from an SDG interlinkage perspective. Sustain. Sci. 2021, 16, 1341–1362. [Google Scholar] [CrossRef]
Figure 1. Logical mechanism of urban–rural integration development.
Land 13 00942 g001
Figure 2. Chengdu-Chongqing economic circle study area.
Land 13 00942 g002
Figure 3. Score distribution structure in 2020.
Land 13 00942 g003
Figure 4. Urban–rural integration development levels in 2020: (a) 2020 comprehensive scores; (b) hot spot analysis.
Land 13 00942 g004
Figure 5. Spatio–temporal distribution of urban–rural integration development speed from 2010 to 2020: (a) development speed distribution map; (b) high-low cluster distribution map.
Land 13 00942 g005
Figure 6. Spatio–temporal patterns of urban–rural integration development from 2010 to 2020: (a) 2010 comprehensive scores; (b) 2015 comprehensive scores; (c) 2020 comprehensive scores.
Land 13 00942 g006
Figure 7. Differences in urban–rural integration development levels in different city areas: (a) changes in the index of each prefecture-level city; (b) differences in urban–rural integration development levels in city centers.
Land 13 00942 g007
Figure 8. Spatio–temporal patterns of urban–rural integration development in the spatial dimension: (a) 2010; (b) 2015; (c) 2020.
Land 13 00942 g008
Table 1. Frequency statistics of core journal evaluation indicators for urban–rural integration in China.
IndicatorFrequency (Times)IndicatorFrequency (Times)
Per capita disposable income of urban and rural residents44Number of medical/healthcare beds per thousand people17
Per capita GDP30Ratio of non-agricultural output value16
Per capita consumption expenditure of urban and rural residents29Urban medical insurance coverage rate16
Engel’s coefficient of urban and rural residents25Proportion of Non-Agricultural Employees11
Level of agricultural mechanization24Urban and rural education funding expenditure ratio11
Urbanization rate21Ratio of secondary and tertiary industry employees10
Road network density20Agricultural labor productivity9
Forest coverage rate19Pension insurance coverage9
Urban and rural household garbage harmless treatment rate19Energy consumption reduction index8
Table 2. Evaluation indicators for urban–rural integration development.
Goal LevelCriteria LevelIndicator LevelIndicator Calculation Method
or Explanation
PropertiesWeightReferences
URIDPopulationProportion of Non-Agricultural EmploymentNon-agricultural employees/
total employees
Positive4.25%[19,20,23]
Urbanization RatePermanent urban population ratePositive5.55%[11,12,20,23]
Population Migration Rate(Permanent urban household population/household population)Positive4.66%[21]
EconomyUrban–rural Economic Development RatioPer capita GDPPositive10.84%[15,18,20,21]
Proportion of Non-agricultural OutputPrimary industry value added/secondary and tertiary industry value addedNegative0.86%[19,23]
Urban and Rural Residents Per Capita Income RatioPer capita annual disposable income of urban
households/per capita annual net income of rural
households
Negative0.91%[15,20,21,22]
SocietyUrban and Rural Medical Resources RatioBeds of medical institution per
10,000 population
Negative7.2%[9,11,18]
Urban and Rural Educational Resources RatioNumber of primary and secondary school teachers per 10,000 studentsNegative3.49%[18]
Urban and Rural Living Services RatioDensity of urban living services points/density of rural living services pointsNegative0.5%
EcologyUrban and Rural Ecological Environment Annual average concentration
of PM2.5
Negative0.04%[11,12,18,21]
Energy-saving and Emission Reduction CoefficientUnit GDP energy consumptionNegative0.65%
SpaceUrban and Rural Transportation AccessibilityRoad network density ratioNegative26.51%[33]
Night Light Index Density RatioNight light index densityPositive28.94%[34]
(URID: Urban–rural Integration Development).
Table 3. Counties included in each city.
City LevelCentral City AreaDistrict/County Range
Chongqing City
(Municipality)
Yuzhong District, Dadukou District, Jiangbei District, Shapingba District, Jiulongpo District, Nanan District, Banan District, Yubei DistrictWanzhou District, Qianjiang District, Hechuan District, Kaizhou District, Yunyang County, etc., 22 districts and counties
Chengdu City
(Sub-provincial City)
Jinjiang District, Qingyang District, Jinniu District, Wuhou District, Chenghua District, Pidu District, Longquanyi DistrictWenjiang District, Shuangliu District, Dujiangyan City, Jintang County, etc., 16 districts and counties (including county-levelcities)
Zigong CityZiliujing District, Gongjing District,
Daan District, Yantan District
Rong County, Fushun County
Luzhou CityJiangyang District, Longmatan DistrictNaxi District, Lu County, Hejiang County, Xuyong County, Gulin County
Deyang CityJingyang DistrictLuojiang District, Guanghan City, Shifang City, Mianzhu City, Zhongjiang County
Mianyang CityFucheng District, Youxian DistrictAnzhou District, Santai County, Yanting County, Zitong County, Jiangyou City
Suining CityChuanshan DistrictAnju District, Pengxi County, Shehong City, Daying County
Neijiang CityShizhong District, Dongxing DistrictWeiyuan County, Zizhong County, Longchang City
Ya’an CityYucheng DistrictMingshan District, Yingjing County, Hanyuan County, Shimian County, Lushan County
Nanchong CityShunqing District, Gaoping District, Jialing DistrictNanbu County, Yingshan County, Peng’an County, Yilong County, Xichong County, Langzhong City
Leshan CityShizhong DistrictShawan District, Wutongqiao District, Ebian Yi Autonomous County, Emeishan City, etc.,10 districts and counties (including county-level cities)
Meishan CityDongpo District, Pengshan DistrictRenshou County, Hongya County, Danling County, Qingshen County
Yibin CityXuzhou District, Cuiping DistrictNanxi District, Pingshan County etc., 8 districts and counties
Guang’an CityGuang’an District, Qianfeng DistrictYuechi County, Wusheng County, Oishui County, Huayng City
Dazhou CityTongchuan District, Dachuan DistrictXuanhan County, Kaijiang County, Dazhu County, Quxian County
Ziyang CityYanjiang DistrictLezhi County, Anyue County
Table 4. Multi-source spatio–temporal data sources.
Data NameData TypeData Source
Living Service PointsPOI DataGaode POI
30 m Land CoverRemote Sensing DataThe 30 m Annual Land Cover Dataset [36]
Urban–rural Road NetworkVector DataOpen Street Map
Night Light Index DensityRemote Sensing DataDMSP-OLS-like Data Set [37]
Table 5. Growth levels from 2010 to 2020.
Growth SpeedGrowth MultipleCounties
Rapid Growth>3Shuangliu District, Xindu District
Accelerated Growth2–3Pujiang County, Xinjin District, Weiyuan County, Dazu District, Jiangjin District, Asbestos County, Mianyang City Central District, Yuechi County, Rongchang District, Guang’an City Central District, Jingyan County, Anju District, Wutongqiao District, Shawan District, Jianyang City, Dujiangyan City, Qingshen County, Xingjing County, Yongchuan District
Moderate Growth1–2Longchang City, Wenjiang District, Naxi District, Deyang City Central District, Bishan District, Qionglai City, Leshan City Central District, Suining City Central District, Luzhou City Central District, Wusheng County, Jintang County, Jiejiang County, Fushun County, Xichong County, Pengzhou City, Hechuan District, Chongzhou City, Dayi County, Daying County, Huaying City, Guanghan City, Santai County, Neijiang City District, Nanfang County, Danling County, Neushui County, Mianzhu City, Shehong City, Kaijiang County, Liangping District, Zhong County, Peng’an County, Xuanhan County, Nanxi District, Yibin Center District(s) Urban Area, Ya’an Center District(s) Urban Area, Changning County, Langzhong City, Luojiang District, Shifang City, Gandan County, Chengdu Center District(s) Seven Districts, Mingshan District, Tongnan District, Yilong County, Qijiang District, Gongxian County, Anzhou District, Nanchuan District, Renshou County, Chongqing Center District(s) Urban Area, Qingbaijiang District, Anyue County, Lezhi County, Jiangyou City, Emeishan City, Dazhou Center District(s)
Slow Growth0–1Hejiang County, Tongliang District, Lushan County, Changshou District, Hongya County, Qianjiang District, Muchuan County, Zhongjiang County, Jiang’an County, Zigong City Central District, Zizhong County, Fengdu County, Dazhu County, Nanchong City Central District, Ziyang City Central District, Quxian County, Jinkouhe District, Ebian Yizuzizhixian, Yingxian County, Rong County, Pingshan County, Pengxi County, Kaiju District, Fuling District, Gao County, Gyunlian County, Wanzhou District, Mabian Yizuzizhixian, Yanting County, Hanyuan County, Dianjiang County, Meishan Center District(s), Zitong County, Yunyang County, Lu County, Xingwen County, Xuyong County, Gulin County
Table 6. Dimensional obstacle degrees in the Chengdu-Chongqing Economic Circle (%).
PopulationEconomySocietyEcologySpace
201013.6610.0310.234.1861.90
201513.2711.5011.563.3560.32
202012.3111.1011.783.2061.61
Disclaimer/Publisher’s Note: The statements, opinions and data contained in all publications are solely those of the individual author(s) and contributor(s) and not of MDPI and/or the editor(s). MDPI and/or the editor(s) disclaim responsibility for any injury to people or property resulting from any ideas, methods, instructions or products referred to in the content.

